Feb. 22, 2009 Whitney Barazoto, J.D. Little Hoover Commission … · 925 L. Street, Suite 805...
56
Yang & Yamazaki Environment & Energy ( Y2E2) Building, 473 Via Ortega, Suite 239, Stanford University, CA 94305-4020 Phone: +1(650)723-6486 Fax: +1(650)725-6014 Web: http://crgp.stanford.edu Feb. 22, 2009 Whitney Barazoto, J.D. Project Manager Little Hoover Commission 925 L. Street, Suite 805 Sacramento, CA 95814 Re: Written Testimony of Ryan Orr, Stanford University To the Little Hoover Commission: I am honored to provide testimony to the Little Hoover Commission as it examines the major issues facing California’s infrastructure sectors and potential improvements to the processes of project identification, selection, funding, financing, and procurement. In October 2007 we hosted a workshop at Stanford University titled Renewing California’s Infrastructure: Finding a Way Forward. The Workshop involved representatives from Caltrans, Governor’s Office, Treasurer’s Office, Partnerships BC, Infrastructure Ontario, regional transportation authorities, labor unions, business groups, and relevant sectors of industry, with a particular emphasis on maximizing the diversity of viewpoints at the table. Following the workshop, I prepared a paper to summarize key points, expand and elaborate ideas, and add information developed through follow-on research. The paper is enclosed under this cover letter. Unfortunately the paper was never finished, and is still unedited. My testimony will summarize the workshop and the paper. I will address three main points: • California’s overreliance on a single-delivery model and need to add other options; • California’s deteriorating environment for infrastructure and root cause factors; • California’s lack of rational project identification and selection processes; Thank you for giving me the opportunity to testify before the Commission. Yours Truly, Ryan J. Orr, Ph.D Executive Director
-
Upload
truongkhanh -
Category
Documents
-
view
214 -
download
0
Transcript of Feb. 22, 2009 Whitney Barazoto, J.D. Little Hoover Commission … · 925 L. Street, Suite 805...
Yang & Yamazaki Environment & Energy ( Y2E2) Building, 473 Via Ortega, Suite 239, Stanford University, CA 94305-4020
Phone: +1(650)723-6486 Fax: +1(650)725-6014 Web: http://crgp.stanford.edu
Feb. 22, 2009 Whitney Barazoto, J.D. Project Manager Little Hoover Commission 925 L. Street, Suite 805 Sacramento, CA 95814 Re: Written Testimony of Ryan Orr, Stanford University To the Little Hoover Commission: I am honored to provide testimony to the Little Hoover Commission as it examines the major issues facing California’s infrastructure sectors and potential improvements to the processes of project identification, selection, funding, financing, and procurement. In October 2007 we hosted a workshop at Stanford University titled Renewing California’s Infrastructure: Finding a Way Forward. The Workshop involved representatives from Caltrans, Governor’s Office, Treasurer’s Office, Partnerships BC, Infrastructure Ontario, regional transportation authorities, labor unions, business groups, and relevant sectors of industry, with a particular emphasis on maximizing the diversity of viewpoints at the table. Following the workshop, I prepared a paper to summarize key points, expand and elaborate ideas, and add information developed through follow-on research. The paper is enclosed under this cover letter. Unfortunately the paper was never finished, and is still unedited. My testimony will summarize the workshop and the paper. I will address three main points:
• California’s overreliance on a single-delivery model and need to add other options;
• California’s deteriorating environment for infrastructure and root cause factors; • California’s lack of rational project identification and selection processes;
Thank you for giving me the opportunity to testify before the Commission. Yours Truly,
Ryan J. Orr, Ph.D Executive Director

| Collaboratory for Research on Global Projects
Expanding California’s Options for Delivering Infrastructure
Ryan J. Orr Gregory Keever
Unpublished Working Paper
January 2, 2007

DRAFT #8. FOR DISCUSSION PURPOSES ONLY. FEEDBACK INCORPORATED FROM CALTRANS,
GOVERNOR’S OFFICE, TREASURER’S OFFICE, KPMG, etc. DO NOT CITE OR DISTRIBUTE.
2
The Collaboratory for Research on Global Projects at Stanford University is a multidisciplinary center that supports research, education and industry outreach to improve the sustainability of large infrastructure investment projects that involve participants from multiple institutional backgrounds. Its studies have examined public-private partnerships, infrastructure investment funds, stakeholder mapping and engagement strategies, comparative forms of project governance, and social, political, and institutional risk management.
The Collaboratory, established in September 2002, also supports a global network of scholars and practitioners—based on five continents—with expertise in a broad range of academic disciplines and in the power, transportation, water, telecommunications and natural resource sectors.
Collaboratory for Research on Global Projects Yang & Yamazaki Energy & Environment (Y2E2) Bldg
473 Via Ortega, Suite 242 Stanford, CA 94305-4020
http://crgp.stanford.edu

DRAFT #8. FOR DISCUSSION PURPOSES ONLY. FEEDBACK INCORPORATED FROM CALTRANS,
GOVERNOR’S OFFICE, TREASURER’S OFFICE, KPMG, etc. DO NOT CITE OR DISTRIBUTE.
3
About the Authors
Ryan J. Orr is executive director at the Collaboratory for Research on Global Projects and
teaches Global Project Finance to engineering, law school and MBA students. He also serves on the
editorial review board of the Journal of Structured Finance, Public Works Management and Policy, and the
Journal of International Business Studies. Dr. Orr has recently been involved in strategic planning for a
new city in northern India, policy formation for a state-wide program of infrastructure renewal in
California, and portfolio construction for a $500 million globally diversified infrastructure fund of
funds. Dr. Orr holds a PhD in Engineering from Stanford University and was advised by Nobel
Laureate, Economics, Douglass North.
Gregory Keever is a California admitted attorney in private practice. He has experience in
private revenue bonds, foreign infrastructure planning with governmental participation in managed
economies, and extensive corporate and joint venture experience, including joint ventures between
foreign governmental agencies and private firms. Mr. Keever advises senior executive management
and project owners on optimal management structures, advisor configurations, asset deployments,
and capital structures. He holds an Ll.M (taxation) from George Washington University, a J.D.
from the University of Virginia Law School, and a B.A. from the University of North Carolina at
Chapel Hill. He has served on the Collaboratory’s Executive Committee since 2002.

DRAFT #8. FOR DISCUSSION PURPOSES ONLY. FEEDBACK INCORPORATED FROM CALTRANS,
GOVERNOR’S OFFICE, TREASURER’S OFFICE, KPMG, etc. DO NOT CITE OR DISTRIBUTE.
4
Executive Summary California’s system for delivering and funding infrastructure has supported the development of one of the world’s most advanced infrastructure systems. Nonetheless, this system faces new pressures in the 21st century and may limit future development of the State, its residents, and their businesses. The Golden State has the technology, expertise, and, some say, money to provide superb infrastructure. How is the system limited? And how can the State maintain its global leadership in infrastructure?
This paper examines these questions using information on California’s infrastructure development, government processes for delivering and financing it, participants in the decisionmaking, and sources of funding. Comparisons with experiences elsewhere are provided. The distinction between funding systems and procurement systems is examined along with their impact on infrastructure costs and financing availability. Potential solutions are offered to expand options for funding and delivery of California’s infrastructure with more private sector involvement in one or both areas.
Here infrastructure is defined as “any physical asset used to provide public services or other benefits for a number of years, including roads, bridges, tunnels, airports and airway facilities, mass transportation systems, water resources projects, wastewater treatment and related facilities, hospitals, resource recovery facilities, public buildings, communication facilities, railroads, and assisted housing.” An often overlooked aspect of infrastructure, even of the most well constructed type, is that it is a consumable asset: it wears out with use and needs replacement. Broadly speaking, California residents and businesses pay for both the construction and maintenance costs of infrastructure. Payments are made in a variety of ways. Infrastructure involving public utilities, such as water and power, are typically paid through user fees that support municipal bonds or other financing (including corporate financing, where services are delivered by the private sector) to build, provide, and maintain services. These user fees can be correlated closely with use, measured (using meters), and priced based on usage (and billed monthly). Roads, tunnels, and bridges are typically paid for through general income taxes (if paid from the State’s general obligation fund), gasoline taxes, sales taxes (State and local), user fees (tolls), federal subsidies, and truck weight fees. Although roads may appear to be free in the eyes of the general public of California, there is in fact a tangled web of payments that provide funding. Imposing user fees (tolls) for maintenance on existing roads strikes many users as unfair: the dual costs of construction and thereafter maintenance have theoretically already been calculated into the funding web, and adding a user fee after the fact seems like a double payment. Imposing user fees on new infrastructure is also complicated, given existing transportation taxes and a widely held view that roads should be free of tolls. Hospital and education follow still different patterns of funding and expectations of funding, as do courthouses and public buildings.
Who approves infrastructure projects in California, and who participates in the process? Major projects, typically involving statewide or regional planning, are approved by the Legislature. State agencies, such as Caltrans, generally execute the procurement of such projects, though multiple agencies and local governments can be involved in large projects such as ports, airports, freeways, and other forms of intermodal transportation; high-speed rail would also fall into this category. Participants in decisionmaking vary, but include local government agencies (such as local transit authorities, state agencies (such as Caltrans), regional councils (such as the Bay Area Council), nongovernmental

DRAFT #8. FOR DISCUSSION PURPOSES ONLY. FEEDBACK INCORPORATED FROM CALTRANS,
GOVERNOR’S OFFICE, TREASURER’S OFFICE, KPMG, etc. DO NOT CITE OR DISTRIBUTE.
5
organizations (NGOs) (such as environmental and neighborhood groups), infrastructure operators and funds, labor groups, the Treasurer’s Office, the Governor’s office, and taxpayers and users. Of these the Professional Engineers in California Government, a union, is considered the most influential with certain members of the Legislature.
On October 26, 2007, an executive workshop titled “California Infrastructure: A Way Forward” was held at the Collaboratory for Research on Global Projects at Stanford University. Attendees included Stanford faculty and representatives of industry, NGOs, the Treasurer’s office, the Governor’s office, selected State agencies, Canadian government agencies, and multilateral financial institutions that have dealt with similar issues.
The workshop identified trends, issues, and possible solutions with respect to California’s system of infrastructure delivery. This paper draws on the workshop, expands and elaborates some of the ideas expressed by participants, and adds information and ideas developed after and as a result of the workshop. Neither the workshop nor this paper examined certain subjects, such as sale of existing infrastructure assets to the private sector. This paper focuses on providing new infrastructure projects in California and developing methods consistent with global best practices to fund and deliver them.
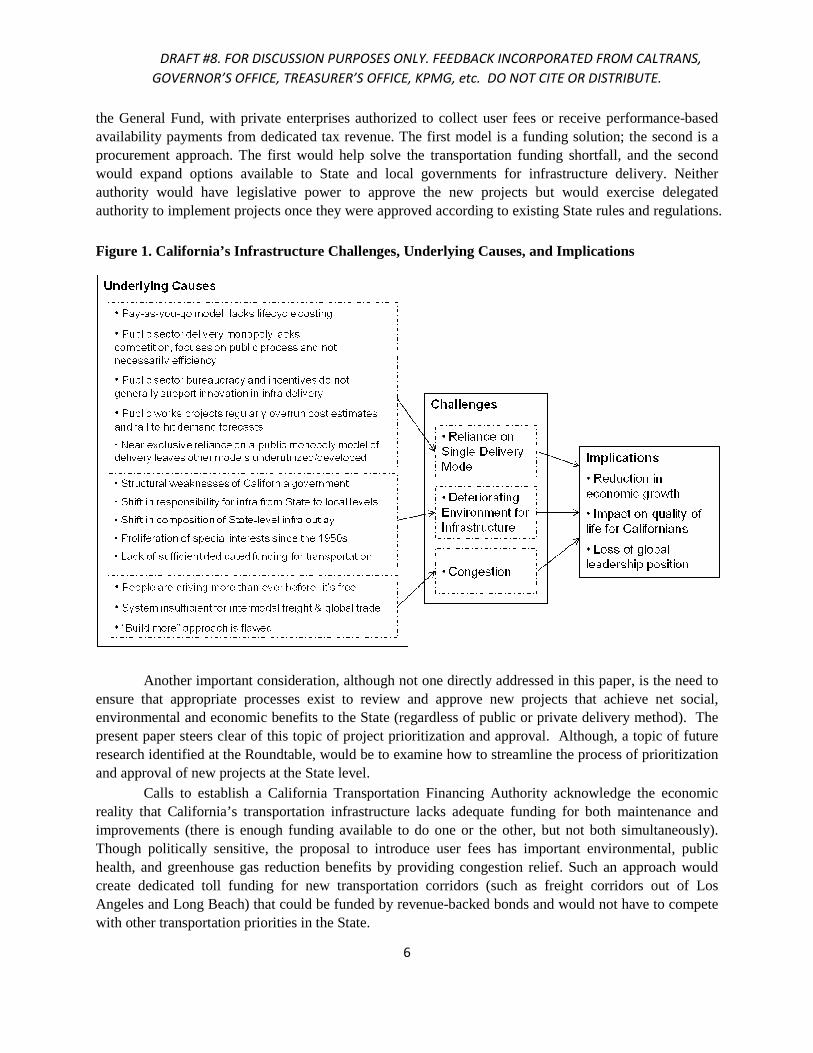
The paper identifies the following situation in California’s infrastructure system. The State’s infrastructure predicament is the result of a limited delivery system, a deteriorating environment for infrastructure investment in recent decades, and, with respect to roads, heavy congestion. California has a design-bid-build procurement model with segmented design, financing, construction, and operations; a “pay-as-you-go” funding method that separates initial capital costs and maintenance costs and does not consider lifecycle costs; a lack of competitive pressures in certain sectors; and, like many public works departments worldwide a highly variable track record in meeting budget and demand forecasts. Factors that contribute to the deteriorating environment for infrastructure include structurally diffuse government processes for infrastructure approval (leading to weak decision capacity in the view of some), a 50-year shift from State to local budgetary responsibility for investment in some sectors (leading to uncoordinated investment), special interest influences in the approval process, and, in the transportation sector lack of a single sufficient dedicated funding source. Congestion is become a terrible problem: people are driving more than ever before, road systems were never designed for intermodal freight, and the “build more” approach to solving the congestion problem has proved an insufficient remedy. Together these problems threaten economic growth, quality of life, and the State’s global leadership position (Figure 1).
In arriving at these conclusions, this paper examines patterns of infrastructure funding and procurement in the United States from inception to the present, patterns in other countries, the California budget since 1950, published articles and commentary specific to California, international studies on private sector participation in infrastructure (including experiences in Asia and Europe), and comments and views articulated by senior government officials in California.
The paper identifies two possible solutions to California’s problem of providing new infrastructure, both of which emanated from the October workshop. The first would be to create an independent authority that would implement user fees on transportation projects to support demand pricing and congestion relief—the so-called California Transportation Financing Authority backed by the Treasurer’s office. The State government would collect tolls and use them to support revenue-backed bonds for new transportation infrastructure. The second approach would be to create an independent authority to evaluate and approve private participation in infrastructure design, financing, construction, and operations, referred to as the Private Participation Authority and backed by the Governor’s office. Projects implemented under this authority could be funded by user fees, tax increases, or reallocations of
DRAFT #8. FOR DISCUSSION PURPOSES ONLY. FEEDBACK INCORPORATED FROM CALTRANS,
GOVERNOR’S OFFICE, TREASURER’S OFFICE, KPMG, etc. DO NOT CITE OR DISTRIBUTE.
6
the General Fund, with private enterprises authorized to collect user fees or receive performance-based availability payments from dedicated tax revenue. The first model is a funding solution; the second is a procurement approach. The first would help solve the transportation funding shortfall, and the second would expand options available to State and local governments for infrastructure delivery. Neither authority would have legislative power to approve the new projects but would exercise delegated authority to implement projects once they were approved according to existing State rules and regulations.
Figure 1. California’s Infrastructure Challenges, Underlying Causes, and Implications
Another important consideration, although not one directly addressed in this paper, is the need to ensure that appropriate processes exist to review and approve new projects that achieve net social, environmental and economic benefits to the State (regardless of public or private delivery method). The present paper steers clear of this topic of project prioritization and approval. Although, a topic of future research identified at the Roundtable, would be to examine how to streamline the process of prioritization and approval of new projects at the State level.
Calls to establish a California Transportation Financing Authority acknowledge the economic reality that California’s transportation infrastructure lacks adequate funding for both maintenance and improvements (there is enough funding available to do one or the other, but not both simultaneously). Though politically sensitive, the proposal to introduce user fees has important environmental, public health, and greenhouse gas reduction benefits by providing congestion relief. Such an approach would create dedicated toll funding for new transportation corridors (such as freight corridors out of Los Angeles and Long Beach) that could be funded by revenue-backed bonds and would not have to compete with other transportation priorities in the State.

DRAFT #8. FOR DISCUSSION PURPOSES ONLY. FEEDBACK INCORPORATED FROM CALTRANS,
GOVERNOR’S OFFICE, TREASURER’S OFFICE, KPMG, etc. DO NOT CITE OR DISTRIBUTE.
7
Ideas to implement a Private Participation Authority draw from other Anglo countries such as Canada, Ireland, and the United Kingdom where public-private partnerships have brought good results. For example, in the U.K. under the Private Finance Initiative Program public-private partnerships have resulted in infrastructure being delivered an average of 17% less costly—and often faster and better—than when delivered by the public sector using the conventional design-bid-build model. The U.K. approach has survived countless political battles, scandals, and audit committee reviews; the 17% savings has delivered significant cost-savings to U.K. taxpayers; and more than a dozen other countries have adopted this model now rapidly becoming global best practice.
The implementation of these two new authorities are among the best available solutions—technically, financially, economically, environmentally, socially, and maybe even politically—to promptly address California’s need for new infrastructure and expand options for procurement, without undertaking a complete system-wide reform of infrastructure delivery and funding in the State.

DRAFT #8. FOR DISCUSSION PURPOSES ONLY. FEEDBACK INCORPORATED FROM CALTRANS,
GOVERNOR’S OFFICE, TREASURER’S OFFICE, KPMG, etc. DO NOT CITE OR DISTRIBUTE.
8
Introduction
California’s infrastructure is woefully inadequate to meet the needs and challenges of the 21st century.1 Consider a quick tour of the State. A visit to Long Beach exposes a congested port and road and railway networks, undermining trade and generating health and environmental concerns due to diesel emissions.2 Stopovers in Monterey and Half Moon Bay reveal a coastal infrastructure in danger of being displaced by rising sea levels.3 San Francisco’s 900 miles of water pipes and sewers, many of them 100–150 years old, are leaking and would not fare well in a major earthquake; Oakland, Burlingame, and other Bay Area cities have similar problems. In Northern California the San Joaquin lowlands are sinking, and new levees are badly needed.4 Consider too that:
• 28% of California’s bridges are structurally deficient or functionally obsolete.
• 44 dams have been deemed deficient by the State;
• Leaky pipes cause the State to lose 222 million gallons of drinking water a day.
• 71% of California’s major roads are in poor or mediocre condition.
• 60% of California’s major urban roads are congested.5 Government officials in Sacramento face a totally different kind of infrastructure bottleneck: four
of nine elevators are out of service in a major government office building.6 For all of the above, options to address the problems exist. So, why are they not being implemented? Why is the system of funding and procurement that supports California’s infrastructure failing to keep up? How can the system be expanded to give the State more options to address the new challenges it confronts in the 21st Century?
At the outset, it is useful to define the term infrastructure. Notions vary and may connote national defense projects, vast software systems, or public works projects undertaken to stimulate local employment. For the purposes of this paper, infrastructure is “any physical asset used to provide public services or other benefits for a number of years, including roads, bridges, tunnels, airports and airway facilities, mass transportation systems, water resources projects, wastewater treatment and related facilities, hospitals, resource recovery facilities, public buildings, communication facilities, railroads, and assisted housing.”7 This definition is intended to be neutral and to focus on the physical aspect of infrastructure and its capital nature (longevity)—and not to imbed notions of philosophical purpose, such as economic catalysts or national defense.
Recognizing California’s infrastructure problem, Stanford University’s Collaboratory for Research on Global Projects hosted an Executive Workshop on October 26, 2007, with selected representatives from government, industry, and academia.8 The paper is not a summary of the workshop or a consensus of the views presented there, but it does draw on the atmosphere of productive dialogue inspired by the workshop and further research on questions raised during that dialogue.
This paper reviews inadequacies of the State’s infrastructure system and evaluates the implications. It is an attempt to identify, describe, and organize the problems being grappled with and to offer propose solutions that are feasible given the multiple and often conflicting objectives associated with the state’s infrastructure system.
This paper does not address privatization of existing (brownfield) infrastructure9; it focuses on delivery and maintenance of new (greenfield) infrastructure. The paper is intended to make two main contributions: synthesizing proven ideas from published works into an actionable strategy for California, and disentangling methods for funding infrastructure (such as user fee–backed proposals for public

DRAFT #8. FOR DISCUSSION PURPOSES ONLY. FEEDBACK INCORPORATED FROM CALTRANS,
GOVERNOR’S OFFICE, TREASURER’S OFFICE, KPMG, etc. DO NOT CITE OR DISTRIBUTE.
9
finance) from methods of engaging the private sector in delivering it (such as procurement of integrated design, build, finance, and operation services).
Before discussing the problems facing California’s infrastructure, it should be emphasized that the conventional design-bid-build, public finance model of infrastructure delivery has been enormously effective for California over a period of decades, leading to the development of one of the world’s most advanced stocks of infrastructure. This paper offers suggestions for making the conventional model even more robust, by proposing additional options that would supplement—not supplant—the infrastructure delivery options already available to the State. This paper does not propose reforming the current system, but rather expanding options for use in situations where they are appropriate and add value.
California’s Level of Investment in Infrastructure Is California investing sufficiently in its infrastructure? A guideline published by the Organization for Economic Cooperation and Development (OECD) suggests that developed nations invest 3.5% of gross domestic product (GDP) a year in infrastructure through 2020, including 0.3% in roads, 0.1% in rails, 0.85% in telecoms, 0.25% in electricity distribution, 1% in electricity generation, and 1% in water. 10 Several Asian countries, including India and China, are now targeting infrastructure investment programs in these six areas equivalent to 6.5% of GDP as a policy to stimulate economic growth.
In California, with a 2006 per capita gross State product of $38,956, the OECD guideline of 3.5% translates to about $1360 per capita in infrastructure outlay. Although it is alluring to try to compare California’s infrastructure outlay to the OECD guideline, unfortunately, it is difficult and potentially misleading to do so. For example, the structure of the economies within California and other OECD countries differ substantially in terms of economic growth rates, geographical and climatological factors, urbanization, demographics, the division of spending between public and private parties, and indirect capital subsidies through tax policies.11
With this as a strong caveat, available data for California suggest that in 2007 approximately $220 per capita at the State level and $960 per capita at the local level for a total of $1180 per capita was invested in capital outlay. For those eager to compare this number to the OECD guideline, be sure to recognize that it excludes funding deployed by private industry in rail, telecoms and regulated utilities, for which aggregate data are not easily attainable. Also, consider that it includes at least $420 per capita in outlays that are not included in the OECD definition, namely school construction, higher education, and community and resource development. Rather than arguing for overinvestment or underinvestment based on aggregate comparisons, as many pro-infrastructure analysts do, we take a different view. We believe that when there are critical gaps or deficiencies in infrastructure maintenance then they should be resolved; when there are opportunities to build new projects that add net economic, environmental and social value to society then they should be approved and constructed; and when there are new technologies or processes invented that could improve the entire system of infrastructure in the State then they should be internalized and deployed. Inherent within this view is the recognition that a “bridge to nowhere” or a program of routine-but-unnecessary maintenance is a wasteful investment.
California’s Infrastructure Challenges

DRAFT #8. FOR DISCUSSION PURPOSES ONLY. FEEDBACK INCORPORATED FROM CALTRANS,
GOVERNOR’S OFFICE, TREASURER’S OFFICE, KPMG, etc. DO NOT CITE OR DISTRIBUTE.
10
In this section of the paper, we perform three analysis tasks: we consider the strengths and deficiencies of California’s infrastructure delivery model and discuss how it can be expanded so that it is on par with global best practice, we examine why the environment for infrastructure in the State appears to be deteriorating, and we situate the congestion problem as one of the greatest sources of social, environmental, and economic drag within the State and discuss how it can be tackled. In the final section of the paper we discuss expanded options for infrastructure funding and delivery with an eye towards addressing the challenges through the establishment of the California Transportation Financing Authority and the Private Participation Authority.
Reliance on a Single Delivery Model
The use of public agencies to undertake and oversee infrastructure delivery has been the globally dominant model for a century. But today, in leading economies such as Canada, Ireland, and the United Kingdom, infrastructure services are delivered not only by traditional public works departments but increasingly by sophisticated and specialized private sector providers. Over the past two decades Australia, Chile, France, Japan, and Spain have also adopted innovative private-sector delivery methods to complement traditional public works models. Should California’s model be expanded in the same way? What is the global best practice when it comes to utilizing public-private partnerships?
Today, best practice outside the United States typically includes a combination of lifecycle costing (say, to avoid buying a building with cheap roofing only to have to repair the roof five years later at greater expense than doing it right in the first place), a regulatory environment that ensures competition in procurement and also protection of the user and public interest (monopolies—public or private—stifle innovation and efficiency), mechanisms for both design-build (DB), design-build-finance-maintain-operate (DBFMO), and other hybrid public-private forms of procurement (to encourage innovation and efficiency), possibilities for layered or baklava financing involving both public-financed and private-financed sources of capital (so that risks of large projects can be shared, with nongovernmental equity partners taking riskier financial positions), performance-based payments (providing incentives to ensure that projects are designed, built, financed and operated to achieve whatever goals are deemed important by the State and taxpayers—say, to reduce traffic congestion), and an approval process for new projects that strikes a sustainable balance between the triple bottom line imperatives of social equity, environmental preservation, and economic return (which is an area where California is already a leader, but more could be done to streamline the process so that is less sequential).
The current design-bid-build system of infrastructure procurement as implemented in California, despite having served the State well for many years, lacks several of these more recently developed elements now common in other countries, and the system is therefore limited in the flexibility and options that it provides State agencies and local governments. This is certainly not to say the model is outmoded. But reliance on a single model has its limitation—described below—and enabling additional options could bring advantages for some purposes.
Design-bid-build, pay-as-you-go model
First, California’s current system puts heavy emphasis on minimizing upfront construction costs and less emphasis on creating value and efficiency over a project’s lifecycle. Today contractors win jobs based on low bids, make profits by doing the minimum required under the specification set forth in the contract, and exit after construction is complete: they are not financially responsible for maintenance. To ensure

DRAFT #8. FOR DISCUSSION PURPOSES ONLY. FEEDBACK INCORPORATED FROM CALTRANS,
GOVERNOR’S OFFICE, TREASURER’S OFFICE, KPMG, etc. DO NOT CITE OR DISTRIBUTE.
11
that the contractor does not cut corners and to keep maintenance costs low, the government agency requires that the contractor adhere to detailed specifications. The primary problem with this approach is that, although there may be innovative ways to construct a project that might reduce maintenance costs down the road, the government agency that sets the specifications may not be aware of all of them. The current process does not necessarily incentivize either the government agency or the contractor to look for innovative designs, materials, and technologies to minimize “cradle-to-grave” costs and maximize benefits to users over the lifecycle. Moreover the contractor’s construction phase incentives are not fully aligned with the long-term needs of users or the State.
Moreover, the State does not generally apply lifecycle costing to the overall funding equation: later repairs and upgrades are generally funded on a pay-as-you-go basis from a separate maintenance budget, if they are funded at all (and often they are not). The alternative to this would be to require a separate reserve account for maintenance and rehabilitation of each infrastructure asset (or at the portfolio level); but, absent a new revenue stream, requiring such a reserve to be set aside today would result in even less money available for new capital investments. This aspect of the State infrastructure procurement and funding system has produced a large backlog of deferred capital maintenance liabilities for State assets such as roadways, dams, and water distribution systems.
To give credit where due, productive efforts have been made at Caltrans to build lifecycle costs into design requirements by setting specifications for durability (say, for asphalt).12 Caltrans contends that the lack of life-cycle costing is more a function of the inadequacy and lack of reliability of traditional sources of transportation funding (discussed further below), and not a limitation of the traditional delivery model.13
One solution would be to require the State to perform lifecycle costing when it selects bidders for new infrastructure; certainly this addition would be possible within the scope of the existing delivery model. But true value in this costing would likely require contractors to have operations experience and input if not influence over facility designs—which they do not have. Alternatively, a single service provider could design, build, and operate a facility for a set time period. This approach could inform and motivate the provider to include a realistic financing and maintenance budget in the initial capital budget and make tradeoffs between first costs, financing costs, and maintenance costs to optimize the overall combination. Just as important, this approach would eliminate risks associated with unfunded maintenance liabilities from the State budget, because the service provider would assume responsibility for this risk contractually. However, this approach would only work if a reliable revenue stream were dedicated to the specific project and could not be redirected for other purposes.
Public quasi-monopoly faces little if any competition Second, California’s system creates a quasi-public monopoly on infrastructure in some sectors. Economic studies show that typically when competition is introduced in an industry, innovation and efficiency increase, whether the industry is publicly or privately owned.14 An example comes from a study of the productivity of Canadian railroads after World War II—once competition was introduced, there was no evidence that the performance of Canadian National Railroad (government-owned) was inferior to that of Canadian Pacific Railroad (privately owned).15 The authors of the railroad study conclude that “any tendency toward inefficiency resulting from public ownership was overcome by the benefits of competition.” Yet, defying best practice, California’s transportation sector (among others) is still dominated by public entities that have the equivalent of monopoly power.
In a recent interview, an elected official in Ontario, Canada asked the following: “What would you rather have, an unregulated public sector monopoly or a regulated private sector provider that has to compete with other private sector providers and with the public sector?” He then explained that in Ontario bringing in the private sector for 10–15% of the province’s infrastructure projects had generated several

DRAFT #8. FOR DISCUSSION PURPOSES ONLY. FEEDBACK INCORPORATED FROM CALTRANS,
GOVERNOR’S OFFICE, TREASURER’S OFFICE, KPMG, etc. DO NOT CITE OR DISTRIBUTE.
12
key improvements simply due to the increase in competition. The public sector monopoly was weakened, the public sector was forced to become more efficient to match the new private competitors, and an extra layer of regulatory oversight was added—the public sector was now monitoring the private sector as opposed to the traditional system where the public sector was watching over itself. The U.K. has also found over a 15 year time period since it instituted the PFI initiative that about 15% private sector participation through the DBFMO model is about the right amount in the overall national portfolio.16
In California, private sector participation is already common in several sectors. For example, the government allows private firms to deliver health and human services, pension fund management, and government office tenancies in commercial buildings. But most infrastructure sectors are treated differently.
To be fair, California law today permits transportation projects to be designed by the private sector, and all major construction projects are already competitively bid. But the bigger issue is that the design, construction, and operational elements of a project continue to be addressed separately, which can limit opportunity to develop a synergy that could improve the life cycle benefits. This effect is compounded by funding issues that we discuss in the next section.
Integrated DBFMO procurement would not supplant the existing design-bid-build model, but authorizing a share of the infrastructure portfolio appropriate for this model—to be procured and operated as public-private partnerships—could produce benefits as derived in other countries, at the very least by introducing benchmark competition, where the performance of the public sector could be compared with selected works in the private sector. The State would still have to clearly enumerate its performance requirements and provide appropriate oversight during the life of the project. A State agency that vetted local proposals to determine those appropriate for procurement by the public-private partnership mode, would ensure consistency, standardization and best practice. Current public sector model constrains delivery options for large, complex, innovative projects Third, California’s current delivery system does not inherently encourage and therefore results in a general absence of innovative infrastructure initiatives. Europe has taken the lead in large-scale urban renewal: London is now revitalizing 670 acres of its downtown core. Asia is busy installing next generation high-speed rail networks—in Beijing, Shanghai, Taipei, Tokyo, Seoul, and Kuala Lumpur. And cities in the Middle East are climbing skyward with creative new buildings and infrastructure.
A common thread across the projects in Asia, Europe, and the Middle East is their combination of design-build and DBFMO procurements. These methods transfer risks of delays and construction cost overruns from governments—and ultimately taxpayers—to private developers and open up a diversity of thinking on how to execute projects creatively. One reason that California is challenged to deliver large, exciting, innovative projects on par with the recent developments in Asia, Europe, and the Middle East is its lack of enabling legislation to support these modern procurement methods as options alongside the traditional public sector delivery model.
State and local government systems within the U.S. are designed to move slowly, to ensure that all stakeholder voices are heard in the approval of new initiatives, and to provide consistent, transparent, and reliable implementation. This system works well for the delivery of small, routine projects with standard designs. Naturally, however, the system confronts challenges with larger, non-routine engineering and construction projects that invoke considerable stakeholder opposition even after the approval stage is supposedly complete and in the implementation stage when designs are non-standard and high levels of coordination and innovation are required.
DRAFT #8. FOR DISCUSSION PURPOSES ONLY. FEEDBACK INCORPORATED FROM CALTRANS,
GOVERNOR’S OFFICE, TREASURER’S OFFICE, KPMG, etc. DO NOT CITE OR DISTRIBUTE.
13
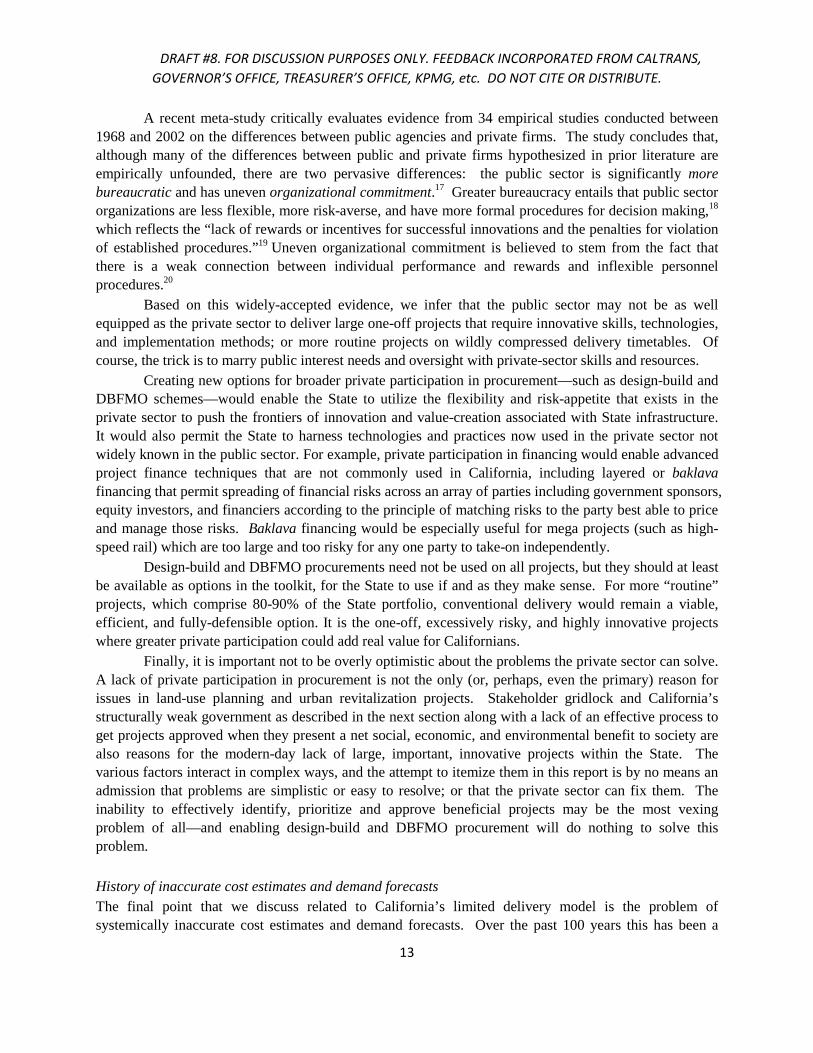
A recent meta-study critically evaluates evidence from 34 empirical studies conducted between 1968 and 2002 on the differences between public agencies and private firms. The study concludes that, although many of the differences between public and private firms hypothesized in prior literature are empirically unfounded, there are two pervasive differences: the public sector is significantly more bureaucratic and has uneven organizational commitment.17 Greater bureaucracy entails that public sector organizations are less flexible, more risk-averse, and have more formal procedures for decision making,18 which reflects the “lack of rewards or incentives for successful innovations and the penalties for violation of established procedures.”19 Uneven organizational commitment is believed to stem from the fact that there is a weak connection between individual performance and rewards and inflexible personnel procedures.20
Based on this widely-accepted evidence, we infer that the public sector may not be as well equipped as the private sector to deliver large one-off projects that require innovative skills, technologies, and implementation methods; or more routine projects on wildly compressed delivery timetables. Of course, the trick is to marry public interest needs and oversight with private-sector skills and resources.
Creating new options for broader private participation in procurement—such as design-build and DBFMO schemes—would enable the State to utilize the flexibility and risk-appetite that exists in the private sector to push the frontiers of innovation and value-creation associated with State infrastructure. It would also permit the State to harness technologies and practices now used in the private sector not widely known in the public sector. For example, private participation in financing would enable advanced project finance techniques that are not commonly used in California, including layered or baklava financing that permit spreading of financial risks across an array of parties including government sponsors, equity investors, and financiers according to the principle of matching risks to the party best able to price and manage those risks. Baklava financing would be especially useful for mega projects (such as high-speed rail) which are too large and too risky for any one party to take-on independently.
Design-build and DBFMO procurements need not be used on all projects, but they should at least be available as options in the toolkit, for the State to use if and as they make sense. For more “routine” projects, which comprise 80-90% of the State portfolio, conventional delivery would remain a viable, efficient, and fully-defensible option. It is the one-off, excessively risky, and highly innovative projects where greater private participation could add real value for Californians.
Finally, it is important not to be overly optimistic about the problems the private sector can solve. A lack of private participation in procurement is not the only (or, perhaps, even the primary) reason for issues in land-use planning and urban revitalization projects. Stakeholder gridlock and California’s structurally weak government as described in the next section along with a lack of an effective process to get projects approved when they present a net social, economic, and environmental benefit to society are also reasons for the modern-day lack of large, important, innovative projects within the State. The various factors interact in complex ways, and the attempt to itemize them in this report is by no means an admission that problems are simplistic or easy to resolve; or that the private sector can fix them. The inability to effectively identify, prioritize and approve beneficial projects may be the most vexing problem of all—and enabling design-build and DBFMO procurement will do nothing to solve this problem.
History of inaccurate cost estimates and demand forecasts The final point that we discuss related to California’s limited delivery model is the problem of systemically inaccurate cost estimates and demand forecasts. Over the past 100 years this has been a

DRAFT #8. FOR DISCUSSION PURPOSES ONLY. FEEDBACK INCORPORATED FROM CALTRANS,
GOVERNOR’S OFFICE, TREASURER’S OFFICE, KPMG, etc. DO NOT CITE OR DISTRIBUTE.
14
well-studied and conspicuous problem for the design-bid-build model. Projects routinely overrun budgets and fail to meet demand forecasts due to a misalignment between who pays for public works and who benefits when projects proceed.21 Public officials are thought to use optimistic forecasts as a way to get projects approved, and taxpayers and their children pay the costs of these unrealized forecasts for decades afterward.22 This misalignment has become institutionalized, destroying public confidence in the system. A recent, highly respected analysis of more than 210 large projects in 14 nations—including in California— over a 100-year period shows that inflated cost-benefit analyses are not unique to California, but a global phenomenon.23 Optimism is desirable in many instances, but without an effective feedback loop where the consequences of undue optimism are returned to the optimists the system lacks the ability to self-correct.
One avenue to mitigate these shortcomings is to include private equity sponsors with or alongside government sponsors through public-private partnerships. When private sponsors participate, they must put their own equity at risk (and not taxpayer dollars) and they do not enjoy the cushion of being able to raise taxes or re-allocate General Fund revenues should a given project come in over budget. Private equity investors are incentivized towards brutal honesty—about what a project is going to cost and what revenues it can generate—and also to carefully monitor and optimize project operational performance over its lifecycle. Therefore, their inclusion can bring into balance the incentives noted above and reduce the likelihood of overly optimistic forecasts that have contributed to many prominent public works failures of the 20th century. All other things being equal, if the performance advantages of involving private equity investors outweigh the higher weighted average cost of capital that results from their involvement, then they may bring a net positive benefit to the table. Of course, this trade-off must be weighed carefully, especially in the U.S. context where tax-exempt financing makes public infrastructure finance relatively cheaper than in other countries.
The foregoing does not mean that all public-private partnerships are always going to perform or outperform; indeed there are public works projects with good financial outcomes and public-private partnerships with bad financial outcomes (such as the Eurotunnel). But on the average, projects with private sector equity invested are expected to produce smaller variance between estimates and actuals (for cost budget, schedule, and revenue); and when they do miss forecasts, they are expected to be rapidly reevaluated, redesigned and renegotiated in order to make the best out of difficult circumstances, as opposed to limping along with increasing tax apportionments like the Boston “big dig”. California missed pre–World War II era of private franchise model U.S. governments, state and federal, have used two infrastructure delivery models from the inception of the nation until about the 1930s—the public works model and the private franchise model. (This short section on historical perspective is summarized from a longer report published by Stanford University and KPMG.24) The Erie Canal, Illinois and Michigan Canal, and Cumberland Road are examples early in the 20th Century of the public works model being applied to deliver infrastructure where the government entity directly financed and operated the project instead of ceding these responsibilities to the private sector. Zane’s Post Road, the Keokuk Power Plant and Dam, and the New York City Subway represent early examples of the private franchise model of infrastructure delivery, where the government entity “pulled” the projects from the private sector by offering land grants or selling franchises or concessions.
After U.S. independence, the country was largely underdeveloped and state and federal governments had limited financial resources and weak credit; generally there was no income tax. The dual use of the public works and private franchise models achieved at least two purposes: it allowed scarce
DRAFT #8. FOR DISCUSSION PURPOSES ONLY. FEEDBACK INCORPORATED FROM CALTRANS,
GOVERNOR’S OFFICE, TREASURER’S OFFICE, KPMG, etc. DO NOT CITE OR DISTRIBUTE.
15
government resources to be extended to more projects (a strategy of leveraging assets) and it gave governments flexibility in hedging political issues where only government action would suffice. In managing this dual system to support infrastructure expansion and economic growth, governments tended to push projects using the public works model and pull projects using the private franchise model. Public works included trade-oriented projects such as navigable river improvements, harbors, and public buildings. Private projects involved canals, railroads, electricity plants, and other user fee–based improvements. Use of this dual system ceased during 1929–45 and shortly thereafter.25
The Brooks Act of 1972 mandated that the design-bid-build delivery system be used for all federal construction and related projects, provided competitive selection processes for designers, and statutorily separated the design process from construction. Collectively, statutes enacted between 1947 and 1972 established the highly segmented design-bid-build delivery system as the only one for federal projects, established bidding procedures, and by default made public financing the predominant funding strategy.
States were affected by these federal policies. They were required to follow the federal procurement rules in order to receive federal funds for roads under the 1956 Interstate Highway Act and for wastewater improvements under the Environmental Protection Agency’s Construction Grants Program. Since then, some states, such as Virginia, facing a need for new infrastructure and limited financial resources, have enacted statutes that re-enable the private franchise model to obtain new infrastructure. This state activity was encouraged by the federal government, as in Executive Order 12803:
…in order to allow the private sector to provide for infrastructure modernization and expansion, State and local authorities should have greater freedom to privatize infrastructure assets…User fees are generally more efficient than general taxes as a means to support infrastructure assets. The West Coast of the United States generally developed later than the East Coast. Although
California experienced many periods of significant growth in its early years, much of its infrastructure was built in the second half of the 20th century—when most U.S. infrastructure projects were being implemented using the design-bid-build system. Thus the dual system of public works and private franchise was not widely prevalent, ever. Accordingly, most infrastructure in California was funded by a combination of state and federal funds, with state funds raised largely through bond issuances, some underwritten by dedicated revenue streams. As a result, California now faces the risk of relying on a single approach to delivering infrastructure, without other viable alternatives that have been shown to be effective in other parts of the world, for specific (and not all) purposes.
In the late 1980s California experimented on an extremely limited basis with the private franchise model of delivery and financing, issuing legislation that authorized four projects: two in Northern California and two in Southern California. Both of the Southern California projects have been completed—the most recent being State Route 125, which opened in November 2007. Depending on the constituency to which one speaks, the projects were considered to be successes or failures. The authors of this report believe that objective reviews of the two Southern projects (SR 91 and SR 125) are necessary for the State to assimilate lessons learned. The value of public-private partnerships in the United States must stand up to the empirical evidence.
Deteriorating Environment for Infrastructure

DRAFT #8. FOR DISCUSSION PURPOSES ONLY. FEEDBACK INCORPORATED FROM CALTRANS,
GOVERNOR’S OFFICE, TREASURER’S OFFICE, KPMG, etc. DO NOT CITE OR DISTRIBUTE.
16
In this section we discuss key changes that have occurred in California with respect to the delivery of infrastructure since the 1950s and we isolate several variables that may now be contributing to a deteriorating environment for infrastructure. There have been major changes in the environment for infrastructure in California over past half-century. Figure 2 shows that from 1950–2007—a period when the State’s population grew 250% to reach about 35 million—real per capita State operations expenditures grew 260%, and real per capita State-provided local assistance grew 630%. Yet State real per capita capital outlays for infrastructure and other capital projects plummeted by some 85% in just 10 years between 1970 and 1980 (Figure 3). Before this sharp decline, California had generally increased its investment over a 20-year period to develop one of the finest collections of roadways, electricity grids, and water distribution systems in the Western world.26 After the decline, capital outlays stabilized between 1985 and 1997 at about $95 per capita, bouncing between a low of $65 and a high of $125. Since 1997 real per capita outlays have started to perk up, at least in absolute terms.
Over the past half century, the source of funding for State level capital outlays has also changed. Figure 2 indicates that the use of general funds, federal funds and special funds has declined, while the use of bonded funds has climbed.
Pro-infrastructure lobbyists in California have often (inaccurately) used the data depicted in Figure 2 to argue for a need to increase infrastructure spending on the basis that State-level capital outlays have fallen well below the 57-year historical average of $158 per capita. However, analysts who make this argument miss the crucial fact that capital outlays at local levels have increased dramatically over this period, largely offsetting the State level decline. To appreciate the present environment for infrastructure in California, it is necessary to understand how responsibilities at State and local levels have shifted. Figure 2. State Capital Outlays, Real Per Capita Figures, 1950–2007
Source: Authors’ calculations, data from annual California State Budget.
Figure 3. State and Local Capital Outlays, Real Per Capita Figures, 1957-2007
DRAFT #8. FOR DISCUSSION PURPOSES ONLY. FEEDBACK INCORPORATED FROM CALTRANS,
GOVERNOR’S OFFICE, TREASURER’S OFFICE, KPMG, etc. DO NOT CITE OR DISTRIBUTE.
17
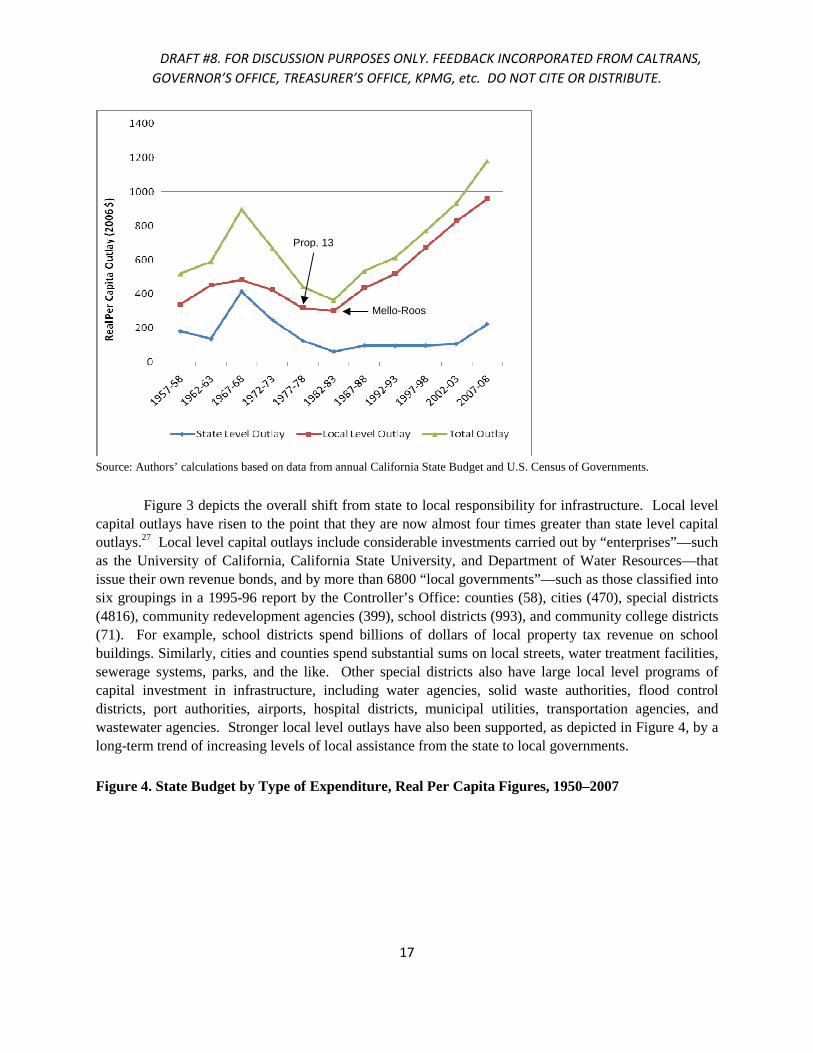
Source: Authors’ calculations based on data from annual California State Budget and U.S. Census of Governments.
Figure 3 depicts the overall shift from state to local responsibility for infrastructure. Local level
capital outlays have risen to the point that they are now almost four times greater than state level capital outlays.27 Local level capital outlays include considerable investments carried out by “enterprises”—such as the University of California, California State University, and Department of Water Resources—that issue their own revenue bonds, and by more than 6800 “local governments”—such as those classified into six groupings in a 1995-96 report by the Controller’s Office: counties (58), cities (470), special districts (4816), community redevelopment agencies (399), school districts (993), and community college districts (71). For example, school districts spend billions of dollars of local property tax revenue on school buildings. Similarly, cities and counties spend substantial sums on local streets, water treatment facilities, sewerage systems, parks, and the like. Other special districts also have large local level programs of capital investment in infrastructure, including water agencies, solid waste authorities, flood control districts, port authorities, airports, hospital districts, municipal utilities, transportation agencies, and wastewater agencies. Stronger local level outlays have also been supported, as depicted in Figure 4, by a long-term trend of increasing levels of local assistance from the state to local governments. Figure 4. State Budget by Type of Expenditure, Real Per Capita Figures, 1950–2007
Prop. 13
Mello-Roos enacted

DRAFT #8. FOR DISCUSSION PURPOSES ONLY. FEEDBACK INCORPORATED FROM CALTRANS,
GOVERNOR’S OFFICE, TREASURER’S OFFICE, KPMG, etc. DO NOT CITE OR DISTRIBUTE.
18
Source: Authors’ calculations; data from annual California State Budget.
One factor that has influenced the shift from State to local level financing of infrastructure is the
ballot initiative and the passage of Proposition 13. The ballot initiative—along with the referendum and recall—were approved in the State of California in 1911. Overwhelming support of the measure reflected pent up frustration amongst the public that corrupt and powerful special interests were dominating state politics. In particular, the public was concerned with the far-reaching influence of the Southern Pacific Railroad, often called “The Octopus,” which was said to control almost everything in the state including the courts, the legislature, and the press. The ballot initiative was designed as a mechanism to remedy gross failings of the legislature, to permit citizens to alter the constitution and pass statutes directly. From 1912-1978 voters passed 46 initiatives. Then the next 20 years voters passed another 46 initiatives and the ballot initiative went from being a mere safety valve to becoming a dominant mode of policymaking in Sacramento.
Proposition 13, passed in 1978, had the effect of nearly bankrupting many local governments when property taxes were capped at 1%, and, perhaps, most importantly, transferred control of allocation of resulting property tax revenues to the State Legislature.28 After Proposition 13, the ability of many local towns and cities to fund expansion of their own public facilities and services was severely reduced.29 As a consequence, local authorities who were facing difficulties in raising funds for infrastructure were pressured to develop innovative new ways of financing and raising money at the local level. Such examples include the Mello-Roos financing method, enacted in 1982; the Marks-Roos Bond Pooling Act enacted in 1985; and adoption of the sales tax at local levels to fund transportation infrastructure, starting in the mid-1980s. These three examples are discussed in greater detail below.
Mello-Roos enabled the creation of “community facilities districts”, typically several hundred acres in size, for the purpose of financing infrastructure; landowners within a district were required to pay a special tax of which revenues were used by the district to back the sale of tax-exempt bonds to finance infrastructure. Infrastructure was defined to include elements that would benefit “multiple subdivisions”, such as major streets, landscaping, street lights, sidewalks, drainage, sewers, water systems, libraries, and school parks. This reflected a much broader definition of infrastructure than had traditionally been the

DRAFT #8. FOR DISCUSSION PURPOSES ONLY. FEEDBACK INCORPORATED FROM CALTRANS,
GOVERNOR’S OFFICE, TREASURER’S OFFICE, KPMG, etc. DO NOT CITE OR DISTRIBUTE.
19
case under tax assessment districts, which were authorized to finance only limited onsite subdivision improvements (i.e. minor streets, minor drainage, water extensions and sewers). Kathleen Brown, former State Treasurer, describes the rationale for the creation of Mello-Roos as follows: 30
For many years during California's post World War II population boom, the federal and state governments subsidized the construction of [infrastructure] facilities, particularly those which produced a statewide or regional benefit. At the local level, the increased service demands caused by population growth often overwhelmed existing governmental structures, leading to the establishment of new governmental entities. From a fiscal perspective, these demands for service translated into upward pressures on local property tax rates. The constitutional restrictions on taxation imposed by Proposition 13, coupled with declining levels of federal assistance, required local governments to devise new strategies for financing capital projects. With fewer subsidies available, local governments became adept at identifying previously obscure revenue sources which were not restricted by Proposition 13… [This] led to the enactment of legislation, the Mello-Roos Community Facilities Act of 1982, which established a more flexible funding source for local governments.
The Marks-Roos enactment followed in 1985, enabling local officials to pool their bonds to
reduce overhead costs and create market power in issuing bonds; a precondition to the issuance of Marks-Roos bonds is that local authorities enter into what is called a Joint Powers Authority (JPA). JPA’s are also used to pool planning, service, and regulatory functions at a regional level. The combination of Marks-Roos financing and JPA governance structures has become a powerful tool for locally-led public capital improvements in California and are used widely. According to the State Controller’s office there were just 205 JPAs within the state in 1974-75 but there were more than 650 by 1995-96.31
Another significant change, following the budgetary pressures on local governments in the post-Proposition 13 era, was authorization by the legislature in the mid-1980s of the sales taxes for transportation projects in individual counties. This change occurred at a time when locals were frustrated that the state was not providing adequate funds for local roads.32 According to Crabbe, Hiatt, Poliwka, and Wachs:33
Since [the mid 1980s], residents of 18 counties--representing 80% of the state’s population--have voted to raise their sales taxes for limited periods to pay for county and city ground transportation improvements. Since their inception these taxes have been the fastest growing source of revenue for transportation in California and have become a major tool with which local civic and political leaders bypass obstacles in the state’s system of transportation finance and decision-making. For purposes of comparison, of the $45.3 billion of local bond issuance in California in 2005, a
total of $8.3 billion was issued as Marks-Roos financings and $2.5 billion was issued under the Mello-Roos mechanism. Likewise, $3.1 billion was raised through optional local sales taxes for transportation. These mechanisms now account for more than 25% of money raised at local levels and illustrate how local officials have been able to tap new financing methods for infrastructure.
Another change since Proposition 13 has been the increased role of the State in financing schools. Before Proposition 13, school districts built their own schools funded predominantly by the property tax. Afterwards, the State became much more involved in funding schools as local governments were struggling. In 1988 Proposition 98 was passed and the State was legislatively mandated to provide even more assistance to schools and educational programming, effectively limiting funds available for other purposes. Since Proposition 98 the state’s share of total funding for K-12 schools and community colleges has risen to more than 70% as several additional school-related initiatives have also been approved (Proposition 1A, 47, 55 and 1D). More than $35 billion in bonds have been issued since 199834,

DRAFT #8. FOR DISCUSSION PURPOSES ONLY. FEEDBACK INCORPORATED FROM CALTRANS,
GOVERNOR’S OFFICE, TREASURER’S OFFICE, KPMG, etc. DO NOT CITE OR DISTRIBUTE.
20
and raising funds for new school construction was the dominant use of State general obligation bonds in 2007.
Overall, Proposition 13, Proposition 98, and novel financing mechanisms such as Mello-Roos at local levels have led to a wholesale shift in relative responsibilities of State and local governments in funding different kinds of infrastructure: schools are now largely funded at the State level, community infrastructure locally, and increasingly, transportation infrastructure locally. Thus, while the relative share of the State budget responsibility for community and resource projects has plummeted over the decades since Pat Brown, the State’s responsibility for school financing has soared. This role reversal is depicted in Figure 5 and Figure 6. Figure 5 compares the relative composition of State capital outlay at three points in time: in 1965-66 at the peak of the Pat Brown era, in 1984-85 after Proposition13 was enacted, and in 2002-03 after Proposition 98 and subsequent education relation propositions were enacted. Figure 6 makes a similar comparison, but shows not just state capital outlay but a combination of state and local capital outlay. Note the dramatic increase in the proportion of K-12 education outlay and the relative reduction in transport outlay at the state level.
Figure 5. State Capital Outlay, Composition of Expenditure, Real Per Capita (2003$)
Figure 6. State and Local Capital Outlay, Composition of Expenditure, Real Per Capita (2003$)

DRAFT #8. FOR DISCUSSION PURPOSES ONLY. FEEDBACK INCORPORATED FROM CALTRANS,
GOVERNOR’S OFFICE, TREASURER’S OFFICE, KPMG, etc. DO NOT CITE OR DISTRIBUTE.
21
The fact that California may face a deteriorating environment for infrastructure is not yet widely
acknowledged. However, over the years a number of interacting factors appear to have diminished the likelihood of important infrastructure projects being evaluated, ranked and approved for development. A lack of capital for financing is not necessarily the critical impediment. Nor are other single variable explanations sufficient to explain why the renewal of much of the State’s key levee, water, power, transport, and other critical infrastructure—which is known to be deficient—has been neglected. The deteriorating environment for infrastructure has many drivers; its complexity is akin to the lack of confidence in the business environment of a developing country. In the case of a developing country, interactions between economic, technical, socio-cultural and political variables are difficult to decipher and diagnosis of the root cause is not always conclusive. Shift in aggregate responsibility for infrastructure from State to local levels in all but education sector The devolution of authority for capital outlay to local levels is a trend that has occurred in most states in America over the past twenty five years, but it is even more pronounced in California due to the effects of Proposition 13 (except for education funding, which has become more centralized).35 There are several important implications of this shift. First of all, there has been a sizeable transfer of power and decision-making authority away from the State government and down to local governments and special districts. From the perspective of citizens at the local level, this devolution of authority has positive implications. It brings government closer to the people, and it gives citizens more influence over the kinds and amounts of public services that they need and want.36
Despite its benefits, the devolution of authority for infrastructure to local levels contributes to a deteriorating environment for State-level infrastructure in two primary ways. First, there is a lack of State-level coordination in the identification, ranking and prioritization of new infrastructure projects. The State does not have a capital planning mechanism to assess trade-offs between competing investment alternatives across departments, geographical regions and infrastructure sectors. Local level governments who now control 80% of infrastructure dollars are not in a position to take a “helicopter view” and to consider the needs of other jurisdictions where greater needs may exist. Inefficiencies are created when there is a fragmentation of policy and finance across too many local authorities. (For example, there are more than 25 transportation authorities in the Bay area.)
Secondarily, when the bulk of infrastructure dollars are spent at local levels, it is difficult to implement projects that cut-across multiple local jurisdictions. This means that physically dispersed, high-priority projects may get over-looked in favor of smaller, mono-jurisdictional projects that locals can finance themselves. Traditional infrastructural systems administered at the state level—such as the highway system, wholesale water system, and levee systems—fit in the category of projects that both cut across and serve multiple local jurisdictions and as such they must be managed at the state level. Without a State level arbiter of some sort, conflicts over the construction of roadways and the rationing of scarce water resources across cities and counties is next to impossible. Thus, as locals have taken-on greater responsibility for overall infrastructure outlay, these sectors that are not amenable to local level management have been neglected. Together, these two effects of devolution are thought to contribute to an environment of uncoordinated investment that in many ways may have effects that are analogous to underinvestment.
An independent entity tasked with identifying projects of state-wide importance and ranking them—a function even one step before a full-blown capital budgeting function—could create real value for the state by helping to focus limited available state funding on projects serving the greatest need and that for many years may have been systematically ignored.

DRAFT #8. FOR DISCUSSION PURPOSES ONLY. FEEDBACK INCORPORATED FROM CALTRANS,
GOVERNOR’S OFFICE, TREASURER’S OFFICE, KPMG, etc. DO NOT CITE OR DISTRIBUTE.
22
California’s government suffers structural weaknesses that influence infrastructure. Reinforcing the factors that add up to what might be called a deteriorating environment, is the fact that executive is fragmented and it is inherently difficult to move forward with decision making for large capital projects. Noll and Cain, in their book Constitutional Reform in California, have identified several so-called “structural weaknesses” in the design of California’s system of government—i.e. the ballot initiative, term limits in the legislature, and a fragmented executive37. These structural weaknesses are also thought to contribute to the problem of uncoordinated investment in State infrastructure.
The ballot initiative is perhaps the most important factor because as deployed in some cases it causes legislative gridlock. Ballot initiatives that carve out portions of the budget for specific uses make everything a zero-sum game; more infrastructure means less healthcare or education unless one can override a past ballot measure with another ballot measure. But this is not easy, as legislative initiatives typically require a 2/3 vote in the legislature. Such ballot initiatives are a way for the electorate to directly reorganize the legislatures spending priorities.
Term limits shorten the time that individual legislators are permitted to remain in office, which in turn affects the institutional horizon of the legislature. Term limits bias legislators against long-term capital investments and in favor of programs with a shorter-term payoff and thus more immediate political benefits.38
The California State government consists of a fractured executive branch with independently elected Treasurer, Controller, Governor, Lieutenant Governor, Secretary of State and Insurance Commissioner. The effect of a highly dispersed power structure is that it difficult to achieve success in infrastructure projects requiring strong and decisive leadership and decision making. The effort needed to pull together and coordinate the many and dispersed decision nodes in California’s government (the elected officials, Legislature, the Senate, the Governor, the Treasurer, powerful interest groups, the political parties, and so on) is nearly unattainable and it has become more difficult over the past 30 years with growth in size and diversity of California’s population, explosion in number and heterogeneity of special interests, and the increasing diversity of the legislature.39 The political implication of these changes is that the executive is pulled in more directions and the Legislature is more prone to divided opinion than ever before. It is much easier for politicians and legislators to serve narrow but powerful constituencies who pay for their political campaigns and ensure their political success than to stick their necks out to address the larger, longer-term issues facing the State.
In the overall analysis, the problems of California’s structurally weak government as they contribute to infrastructure underinvestment are not simple or straightforward to resolve. New thinking and new approaches are needed in order to overcome these structural weaknesses and to get more value-adding infrastructure built. However, such problems arise largely as a result of the design and operation of the State government. To the extent that changes are needed which involve constitutional reform, as recommended by Noll and Cain, discussion of such changes are well beyond the scope of this paper. Proposition 98 and de-emphasis of “traditional” infrastructure sectors Although direct democracy through the ballot initiative has many benefits—such as controlling the power and corruption of special interests—one negative effect has been the effectual carving up of the state budget into constitutionally mandated expenditures that leave little flexibility for state leadership to revise budgetary priorities year-over-year.40 Ballot initiatives that earmark, obligate or restrict general fund

DRAFT #8. FOR DISCUSSION PURPOSES ONLY. FEEDBACK INCORPORATED FROM CALTRANS,
GOVERNOR’S OFFICE, TREASURER’S OFFICE, KPMG, etc. DO NOT CITE OR DISTRIBUTE.
23
revenues are difficult to repeal. By far the most constraining, Proposition 98, allocates 40% of the general fund to K-12 education and community colleges and subsequent propositions have raised this even higher.
As the state has been directed by its citizens to put more emphasis on education, traditional infrastructural systems built-up under earlier decades—water, highway, levee, and electricity systems—have been deemphasized. The inflexibility of the budget has made it difficult for state officials to respond to changing infrastructure priorities; eventually unanticipated shocks such as levee failures and electricity brownouts will force decisionmakers into action, but reactionary measures are regarded as inefficient and irresponsible relative to proactive measures. Proposition 98 and other propositions that have restricted budgetary flexibility have reinforced the deteriorating environment for maintenance of traditional infrastructure by limiting flexibility in the state budget. Baby boomer retirement and further de-emphasis likely As the baby boom generation retires, the tax base in the U.S. economy is expected to shrink and at the same time governments at all levels are going to be required to remedy unfunded health care and pension entitlements. This fiscal demand will put new pressures on the public purse. A recent analysis in the Wall Street Journal concluded that Social Security and health care benefits could consume 25% of federal income tax revenues by the midpoint of the boomer retirement years in 2030—and 50% by 2040.41 It is expected that governments will scramble to meet these shortfalls, further constricting future budgets and putting an additional squeeze on infrastructure spending. Infrastructure is already “third-fiddle” to education and healthcare spending in California, and the degree of de-emphasis is only expected to get worse as healthcare and pension pressures mount. Proliferation of special interest groups since the 1950s Special interest groups enhance fairness but also complicate project approvals and implementation.
Since 1950 the number of U.S. special interest groups has proliferated exponentially.42 These include business and occupational groups, organized labor, trade associations, corporate lobbyists, public interest groups, environmental groups, nongovernmental organizations (NGOs), political action committees, and institutional interests that engage in political activity with support from churches, think tanks, private foundations, hospitals, colleges, universities, charities, and even foreign countries. Figure 7 shows the growth of transnational nongovernmental advocacy organizations, one smallish constellation within the larger universe of special interests.43
Research indicates that the “advocacy explosion” of the 1960s and 1970s was mainly due to high levels of entrepreneurial activity, low group startup costs, rapid social change, and the prevalence of patronage.44 In 1978 Hugh Heclo a well-regarded expert on public affairs, noted that tight government entities of the 1950s and 1960s had been replaced by nebulous and permeable issue networks that “comprise a large number of participants with quite variable degrees of mutual commitment or of dependence on others in their environment.”45 Madison in Federalist No. 10, his 1787 treatise on safeguarding the union against domestic faction and insurrection, argued that special interests tend to multiply by no more complicated a mechanism than population growth. In his own words: “The smaller the society, the fewer probably will be the distinct parties and interests composing it.”46 Heterogeneity in interest groups also increases with globalization and the mixing of diverse religions, cultures and languages.
The interest group explosion of the past half-century has its upsides and downsides. Pluralists would argue that competition among competing interest groups is a good thing.47 By pitting ambition

DRAFT #8. FOR DISCUSSION PURPOSES ONLY. FEEDBACK INCORPORATED FROM CALTRANS,
GOVERNOR’S OFFICE, TREASURER’S OFFICE, KPMG, etc. DO NOT CITE OR DISTRIBUTE.
24
against ambition and greed against greed, competition reduces the likelihood that any one faction will be able to force their will on the others. A downside, predicted decades ago by the late economist Mancur Olson, is that interest groups would eventually grow in number until they cause their host society to slip into economic demise.48 The real challenge of special interest groups in infrastructure projects is not their existence, their viewpoints, or their participation; it is the lack of organized participation. Due process requires notice and an opportunity to be heard; transparency requires a known process with decision points and criteria established in advance. It is not clear that the present system of involving special interest groups meets neither of these standards when viewed from the perspective of all participants.
In the approval and delivery of infrastructure, interest groups both (i) tend to ensure completeness of viewpoints (some might say enhance fairness) and (ii) complicate the process (some point to the great variation in the quality of information and commitment between interest groups). Groups not ordinarily attuned to infrastructure tend to come out of the woodwork when a major project affects their neighborhood. Environmental NGOs and local residential groups are well-known for blocking or forcing redesign of projects. In fact, one of the causes of the rise of interest groups, other than business and labor, is the concern for the social effects of projects, especially dams and highways. It is also thought that competition between interest groups reduces the likelihood of “pork barrel” spending to favored constituencies, which is a problem that dates back to the 19th century in the U.S. and other developed country democracies.
The challenge for government decision makers lies in vetting and reconciling the information haze—i.e. the 1000s of reports, articles, and online documents produced in the wake of a major project and containing information and misinformation, oftentimes intentionally promulgated by different interest groups with different goals and interests. Sorting and making sense of voluminous stocks of information can be tedious and time-consuming; especially when such information is contradictory and varies in terms of quality and factual accuracy. In short, many interest groups act as watchdogs; however there is considerable difference in quality, commitment, and sophistication between groups and delays are considerable when due process is lacking.
It is important to distinguish between the approval and implementation stages of new capital projects, for purposes of discussing interest group involvement. Getting a small project (such as a city park or a bicycle pathway) approved in a city like Palo Alto or Riverside can easily attract 20 or more interest groups. Getting a large project (such as a high-speed rail system or shipping port in a peri-urban environment) approved would mean confronting hundreds if not thousands of special interests of every conceivable size and predilection. A logjam of special interests complicates approval processes. The likelihood of a successful approval for large capital investment projects becomes even slimmer due to what Stanford social scientist Jim March calls the “garbage can decision process”—the situation whereby various interests roaming the political landscape glom onto a major issue (such as high-speed rail) due to its sheer size and visibility and use it as a front to fight a variety of other political battles.49 Major capital projects become “garbage cans” for interest groups of all types. This phenomenon in the United States today is unprecedented in human history and has been under-researched; accordingly, solutions are poorly understood. Unfortunately, no clear consensus has emerged that the current system requires reform, although many lament the inability of project sponsors to get approvals necessary to implement value-generating projects.
A centrally controlled “project approvals agency” with appropriate administrative process would ensure projects getting built, but would inevitably face the same criticisms once leveled at Robert Moses “the great builder of New York City”, who was accused by Robert Caro in an exhaustive 1,246 page

DRAFT #8. FOR DISCUSSION PURPOSES ONLY. FEEDBACK INCORPORATED FROM CALTRANS,
GOVERNOR’S OFFICE, TREASURER’S OFFICE, KPMG, etc. DO NOT CITE OR DISTRIBUTE.
25
analysis of his life work of being a steam-roller of interest groups and of working outside the democratic process.50 In his famous 3,500 word rebuttal, Robert Moses defended himself and is remembered as saying, “I raise my stein to the builder who can remove ghettos without moving people as I hail the chef who can make omelets without breaking eggs.” Politicians are now reevaluating the lifework and legacy of Robert Moses. In 2006, the year he was elected governor, Eliott Spitzer said in a speech to the Regional Plan Association, that if a biography of Moses was written today it might be called At Least He Got It Built. Figure 7. The Growth of Transnational Nongovernmental Advocacy Organizations51
Source: S. Khagram, Dams and Development, 2004.
Once new capital projects have been approved according to due processes, implementation is still
oftentimes impeded by interest groups who come onto the scene well after planning and physical construction have begun. This can create panic and disarray. Interest groups should not be shut-out, but they should also not be permitted to disrupt the applecart after the period of public review has ended and millions of dollars of taxpayer dollars have been spent. There are rules in society about not running into a crowded theatre and screaming ‘fire,’ and in the same way, we may also decide it necessary as a society with greater public goals to institute rules about interest groups not injecting themselves into the development process after projects were approved according to inclusive processes. In order for democratic government to function appropriate “process” is necessary for all participants.
Thus, the State should clearly distinguish between the approval stage (where democratic process and political debate are necessary and valuable, but may need streamlining and tightening) and the implementation stage (where further democratic debate about approval or probity of the project becomes counterproductive). Certainly if project implementation materially deviates from the approved project, interest groups as well as others play an important role in speaking out and should be heard. In order to streamline approvals, it might be helpful to institute a formal process of putting a project out for public comment (perhaps through a website), allowing stakeholders to air comments, grievances, and objections

DRAFT #8. FOR DISCUSSION PURPOSES ONLY. FEEDBACK INCORPORATED FROM CALTRANS,
GOVERNOR’S OFFICE, TREASURER’S OFFICE, KPMG, etc. DO NOT CITE OR DISTRIBUTE.
26
over a defined period, performing a “triple-bottom line” assessment of the project to assess economic, environmental and social-equity tradeoffs, and then having a “go/no go” vote (perhaps by web-based referendum). Possibilities abound for creation of web-based voting tools to enable “direct democracy” and “real-time referendum” in odd-shaped jurisdictions (say, a barbell-shaped jurisdiction around the high-speed rail corridor) directly impacted by major project proposals, to ensure that all voices are heard and to enable quick, low-cost and efficient “go/no-go” decision making. In the implementation stage, legislation that would prohibit stakeholders from causing delays unless they resorted to an official appeal in the courts on appropriate grounds, such as fraud or other fundamental error, could also be advisable to avoid the upending of a project by groups that sat on the sidelines during the approval process. Lack of sufficient dedicated funding for transportation Before discussing the funding deficit in the context of the transportation sector in California, it is important to introduce the subtle but important distinction between the concepts of funding and financing. The term financing is used to describe large blocks of capital furnished by bond investors, lenders, and/or equity providers to pay for construction (or periodic maintenance) costs of infrastructure assets and that are amortized over time. In contrast funding describes the underlying stream of payments allocated to repay the financing provided by initial bond investors, lenders, and/or equity providers usually in recurring increments, typically monthly or quarterly, over the life of the financing arrangement, which extends typically from 5-15 years.
The lion’s share of financing for California’s infrastructure is raised through the sale of two kinds of bond issues. General obligation bonds are paid from the General Fund, the main fund for supporting state government programs such as environmental services, education, healthcare, and corrections. The primary sources of revenue for the General Fund are personal income taxes, the statewide sales tax, and bank and corporate taxes. Although issuing general obligation bonds is a very secure type of financing, there is a capacity problem: the state cannot issue too many of them or it must reduce spending on other things that voters value in order to repay the bonds. In 2006 voters approved $43 billion in general obligation bonds for transportation, water, and a variety of other infrastructure projects—a big first step in Governor Schwarzenegger’s strategic growth plan for the state’s economy.52
Revenue bonds make up the second major category of bond issue. If a state or local government has social license—i.e. broad-based support of the general public—to charge user fees, revenue bonds can be issued against those revenue streams and so not cause a reduction in spending for other programs supported by the General Fund. Of the $323 billion in bonds issued in the U.S. municipal bond market in the first nine months of 2007, two-thirds were revenue bonds backed by user fees.53 California has a long tradition of charging user fees to pay for infrastructure services. User fees for appropriate projects are strong credits; California often uses such fees to finance water systems, wastewater and solid waste systems, airports, ports, toll roads, electric utilities, and a host of other things—with the notable exception of roads (except in a few scenarios where toll-roads have been implemented).
Most Californians agree that users should pay for water, but not everyone agrees that direct user fees should be charged for roads. The lack of user fee based funding for roads and other transportation links creates problems. Because most roads are not tolled, they cannot be financed by revenue bonds and the general fund is capacity constrained. For 20 years California has been trying to solve its transportation funding crisis by drawing on a hodgepodge of direct and indirect funding streams. Sources of funds include Federal and state fuel excise tax, sales taxes on gasoline and diesel fuel, and sales taxes collected pursuant to local measures (many counties have voted for higher sales taxes). The state has also

DRAFT #8. FOR DISCUSSION PURPOSES ONLY. FEEDBACK INCORPORATED FROM CALTRANS,
GOVERNOR’S OFFICE, TREASURER’S OFFICE, KPMG, etc. DO NOT CITE OR DISTRIBUTE.
27
financed transportation with general obligation bonds pursuant to Propositions 108, 116, 1B, and for seismic retrofit, but this has not been a regular general purpose funding source. Limited revenue bonding has occurred against future federal gas tax allocations (GARVEE bonds).54 Despite cobbling together a medley of funding sources, valued at $24,622 billion dollars in 2007-08 (see Figure 8), the staggering needs for road maintenance and rehabilitation are still not fully covered. In the 2008 Ten Year State Highway Operations and Protection Program, Caltrans identified $55 billion in system rehabilitation needs over the next ten years, but only about $25 billion in available funding—a shortfall of $3 billion a year! It is also suspected that the hodge podge based funding system is associated with higher administration costs than would be the case if funding followed a simpler format.
Figure 8. Hodgepodge of Transportation Funding Sources, 2007-08, (Dollars in Millions)
Source: Authors’ calculations based on data from Department of Finance, Office of the Governor
When roads are financed with general obligation bonds, they have had to compete with other
General Fund priorities such as health care and education. When the first wave of infrastructure was built in California (and most Western countries), the government did not have these other non-infrastructure social spending responsibilities that it carries now. Today it would be untenable to cut education and health care spending in order to keep water bills below costs and highways free of user fees. At one time the gas tax was largely sufficient as a funding source, but its buying power has plummeted over the past decade, and it hasn’t been raised since 1993 when it went from 14.1 cents a gallon to the current 18.4 cents.55 Adjusted for inflation, that makes the current tax equivalent to just 12.4 cents a gallon in 1993 dollars. Proponents of increasing the gas tax point to the fact that Belgium, France, Germany, Italy, Netherlands, and United Kingdom have instituted gas taxes that are on average ten times higher than they are in America!56 But the U.S. Department of Transportation has been actively opposed.
Total = $24,622

DRAFT #8. FOR DISCUSSION PURPOSES ONLY. FEEDBACK INCORPORATED FROM CALTRANS,
GOVERNOR’S OFFICE, TREASURER’S OFFICE, KPMG, etc. DO NOT CITE OR DISTRIBUTE.
28
“A substantial increase in the nation’s gas tax is ill-advised,” wrote Secretary of Transportation Mary Peters in a Washington Post editorial last summer, “Of far greater promise than traditional gas taxes is direct pricing of road uses similar to how people pay for other utilities.”57
As the gas tax has fallen, another major trend facing California infrastructure is that construction costs have climbed dramatically. Over the past decade construction inflation has far outstripped general consumer price inflation. Between January 1997 and September 2007 the cost of highway and street construction jumped 59% due to steep rises in the prices of inputs. Steel costs rose 57%, concrete 58%, and crude oil 280%, while general consumer price inflation increased just 31%.58 This means that for the state to deliver the same level of service as just five years ago, it would need to increase its capital outlays for infrastructure aggressively just to keep up with the insidious inflation in commodity prices. Or, the other option is to intentionally let service levels decline. The standard economic response to an increase in cost of an economic input is to buy less of it, relative to other inputs.
At the national level, a political contest looms as the 2009 date approaches when the Highway Trust Fund will spend its last penny. In California and across the nation, even though users feel like they have paid the price for transportation from multiple pockets, not enough revenue is being generated to pay both for needed deferred road maintenance and new construction. Financing is not the problem, it is funding that is in short supply and new sources of funding are needed to prevent further maintenance backlogs and congestion problems and to expand transportation capacity.
Direct user fees have been implemented on nine state bridges to pay for construction costs; tolls are still in place on seven to cover operation and maintenance costs.59 In the case of the Bay Area, voters authorized the use of bridge tolls to help finance non-tolled capacity on other roadways in the region and ongoing maintenance and operational costs. However, tolling is not yet widely authorized or accepted.
Overall, limited success has come from efforts to secure uncertain revenue streams from a variety of sources and to contain the capital costs of new roads. Moreover, State and local taxes are inadequate to add new capacity and maintain what already exists. Thus a new source of revenue is essential to meet the State’s transportation needs. One option might be an increase in the use of direct user fees, which is a proposal that we discuss later on in greater length.
Congestion Traffic congestion clogs the arteries of California’s economy. According to the Texas Transportation Institute, Los Angeles is the nation’s most traffic-congested city, and San Francisco and San Diego also sit near the top of the list. 60 And the problem is getting worse. The Texas Transportation Institute’s database indicates that over the past two decades congestion has jumped 150% in Los Angeles, 160% in San Francisco, and almost 600% in San Diego. During this period the costs of congestion in the State have risen 180%, reaching nearly $17 billion in 2005 (Figure 9)—including 910 million hours of delays and 630 million gallons of excess fuel wasted. At the national level, the Texas Transportation Institute estimates that aggregate congestion costs across 437 major U.S. urban areas reached $78 billion in 2005. That means that California, with just 12% of the U.S. population, accounted for more than 21% of U.S. congestion costs in 2005.
As congestion worsens, trips take longer and congestion spreads across more hours of the day, affects weekend and rural travel, slows personal trips and freight shipments, and makes travel times universally unreliable. The negative impact on the State’s competitiveness is profound. Congestion costs U.S. commuters an average of 20 cents per urban-peak vehicle mile. But based on Highway Capacity

DRAFT #8. FOR DISCUSSION PURPOSES ONLY. FEEDBACK INCORPORATED FROM CALTRANS,
GOVERNOR’S OFFICE, TREASURER’S OFFICE, KPMG, etc. DO NOT CITE OR DISTRIBUTE.
29
Manual speed-flow curves, marginal peak period congestion costs for urban freeways average 37 cents a mile when traffic flows at less than 40 miles an hour—as opposed to 6–9 cents a mile when traffic flows faster than 50 miles an hour.61
Moreover, measuring economic costs such as time delays and wasted fuel captures only a fraction of the true costs of traffic congestion. Congestion also has negative effects on air quality, public health, carbon emissions into the atmoshphere, property values, vehicle wear-and-tear, accident rates, driver stress, labor productivity, and law enforcement.62 These secondary effects, which are much more difficult to quantify and convert into a monetary equivalent, impact all aspects of economic, social, and civic life of Californians. Congestion is now so widespread that everyone is suffering—the rich, the poor, and the middle class alike.63 Figure 9. Costs of Congestion in Major Urban Areas in California, 1988–200564
Source: Authors’ calculations based on data from Texas Transportation Institute.
People are driving more than ever before The higher incidence of traffic jams in California is not just the result of State population growth outstripping construction of new roads. Figure 10 shows that between 1988 and 2005, while the population in six of the State’s major metropolitan areas grew 22%, new roadway capacity increased 23%. Yet these six areas exceeded mean U.S. growth rates both in delay per traveler and total delay.
Figure 10. Growth in Population and Supply of Roadways in Six California Metropolitan Areas65

DRAFT #8. FOR DISCUSSION PURPOSES ONLY. FEEDBACK INCORPORATED FROM CALTRANS,
GOVERNOR’S OFFICE, TREASURER’S OFFICE, KPMG, etc. DO NOT CITE OR DISTRIBUTE.
30
1988 2005 Change 1988 2005 Change 1988 2005 Change
LA 11.14 12.54 13% 4,665 5,870 26% 17,410 20,755 19% Slower Much Faster
San Francisco-Oakland 3.61 4.14 15% 2,175 2,475 14% 4,375 5,240 20% Faster Much Slower
San Diego 2.15 2.91 35% 1,600 1,965 23% 2,610 3,400 30% Much Faster Much Faster
Riverside-San Bernardino 1.06 1.80 71% 700 1,125 61% 1,900 2,670 41% Much Faster Much Faster
San Jose 1.37 1.68 22% 875 910 4% 2,090 2,500 20% Faster Much Faster
Sacramento 1.05 1.75 67% 650 785 21% 1,730 2,345 36% Average Faster
Total 20.38 24.81 22% 10,665 13,130 23% 30,115 36,910 23% Faster Faster
Population
(millions)
Freeway Supply
(lane miles)
Arterial Street Supply
(lane miles)
Growth in Delay
Per Traveler
Relative to U.S.
Mean
Growth in Total
Delay Relative
to U.S. Mean
Source: Authors’ calculations based on data from Texas Transportation Institute.
Research by the Surface Policy Transportation Project shows that the growth in congestion comes largely from an exponential increase in driving (measured in vehicle miles traveled), which cannot be explained by population growth or even the demographic shift to dual-income households. Instead, we must go to a multifaceted set of factors in order to explain this trend: lower-density residential and commercial development patterns that force people to drive more frequently over longer distances, a lack of affordable housing options that force painful hours-long commutes from suburban areas to city centers, an increase in the proportion of parents driving their children to school and then themselves to work (the “double rush hour”), incentives for local governments to promote inefficient highway strip developments in order to maximize sales tax and other revenues, and widespread cognitive-cultural perceptions among the general public that driving on freeways is free and appropriate, even at peak times.66
The many underlying causes of congestion require a sophisticated solution. According to the Surface Policy Transportation Project, “Other states have utilized a diversity of strategies including better real-time traveler information technologies, peak-hour congestion pricing, coordination of transportation and land use goals, telecommuting, staggered work hours, financial incentives promoting ridesharing and vanpooling, and better traffic incident management.” Of the many strategies, most economists and transportation planners agree that, although largely untested in the U.S., market-oriented demand-driven congestion pricing mechanisms offer the most promising tool in the toolkit—and perhaps the only serious one—for rapid, permanent congestion relief.67 Under typical congestion pricing arrangements, roadway users would pay fees that would fluctuate throughout the day, dissuading drivers from using roadways at peak times, just like they pay higher costs for power at times of peak demand. Congestion pricing is the most effective method for rationing scarce highway capacity. The “build more” approach is flawed The dominant logic of California’s transportation planners over the past half-century has been to increase the supply of capacity by constructing new roadways and adding new lanes: the “build more” approach. This approach is now considered to have severe limitations. As new roadways reduce time and out-of-pocket costs for drivers, they induce more traffic by satisfying pent up demand and fill up almost as quickly as they are constructed.68
The congestion problem cannot be solved solely by building more capacity. In fact, it is ineffective to keep adding expensive new capacity to the system until measures are implemented to increase the efficiency of existing capacity and to find an appropriate method for rationing the existing capacity. More sophisticated approaches—including potentially, peak congestion pricing and traffic

DRAFT #8. FOR DISCUSSION PURPOSES ONLY. FEEDBACK INCORPORATED FROM CALTRANS,
GOVERNOR’S OFFICE, TREASURER’S OFFICE, KPMG, etc. DO NOT CITE OR DISTRIBUTE.
31
management systems—that address the long-term underlying causes of congestion are badly needed. Recent advances in global positioning systems (GPS), Internet technology, digital mapping, wireless networking, and mobile computing are now enabling the development of “smarter” technical solutions that previously did not exist. While the 21st Century was about building a physical system with concrete and steel, the 21st Century will need to be about converting this system into a “smart system” using advanced information technology. All the technological elements are in place, and the global transportation industry is on the cusp of major revolution; government provided incentives could meaningfully accelerate the process of innovation and commercialization of new technologies for congestion relief. In California, one obstacle to considering and deploying congestion pricing, for example, is not technological; it is that local and regional transportation authorities are not legally authorized to impose direct user fees. System never designed for influx of intermodal freight and global trade69 When construction began in the 1950s, the National System of Interstate and Defense Highways envisioned opening the nation to passenger cars, interstate commerce, and military vehicles through design and construction standards allowing for greatest uniformity, safety and reliability from coast to coast and border to border. But the overwhelmingly dominant vehicle of choice for commercial cargo was still railroads. Over time as the system expanded towards completion, there was a natural shift towards trucking as both an alternative and complement to the railroads. In the past 20 years, with the rise of low-cost Asian manufacturing, the globalization of the U.S. economy, the rise in truck traffic using the “free” roadway system, and the evolution of intermodal transport technologies, California’s freeways have become overwhelmed with a volume of heavy transport trucks that the designers of the Interstates could never have thought to predict or address.
John Wachs, director of the RAND Supply Chain Policy Center, has noted that “[n]early everything we use and consume comes to us from somewhere else—whether from across town, across the country, or across the world. The prices and availability of all these items depend on how quickly, efficiently, safely and cheaply businesses can move them through the supply chain that connects fields and factories to stores and communities around the world.” Globalization exerts massive pressure on all nodes of the global supply chain—ports, storage yards, cross-docks, freeways, railways, and airports.
Intermodal container traffic through California’s two largest ports, at Los Angeles and Long Beach, increased an average of 1,000% between 1980 and 2004 (Figure 11).70 By 2020, traffic at these two ports is projected to more than double from 15 million to more than 36 million twenty-foot equivalent units (TEUs).71 When congested freight networks cross through already congested metropolitan areas, the effect is a “congestion double-whammy”. In fall 2004, congestion at the Los Angeles and Long Beach ports led to the unplanned diversion of more than 100 container ships to other ports, caused a dire backlog in inland traffic, and dislocated financial arrangements in a supposedly reliable system of trans-shipment.72 Figure 11. Growth in Shipping Volumes at West Coast Ports, 1980–2004
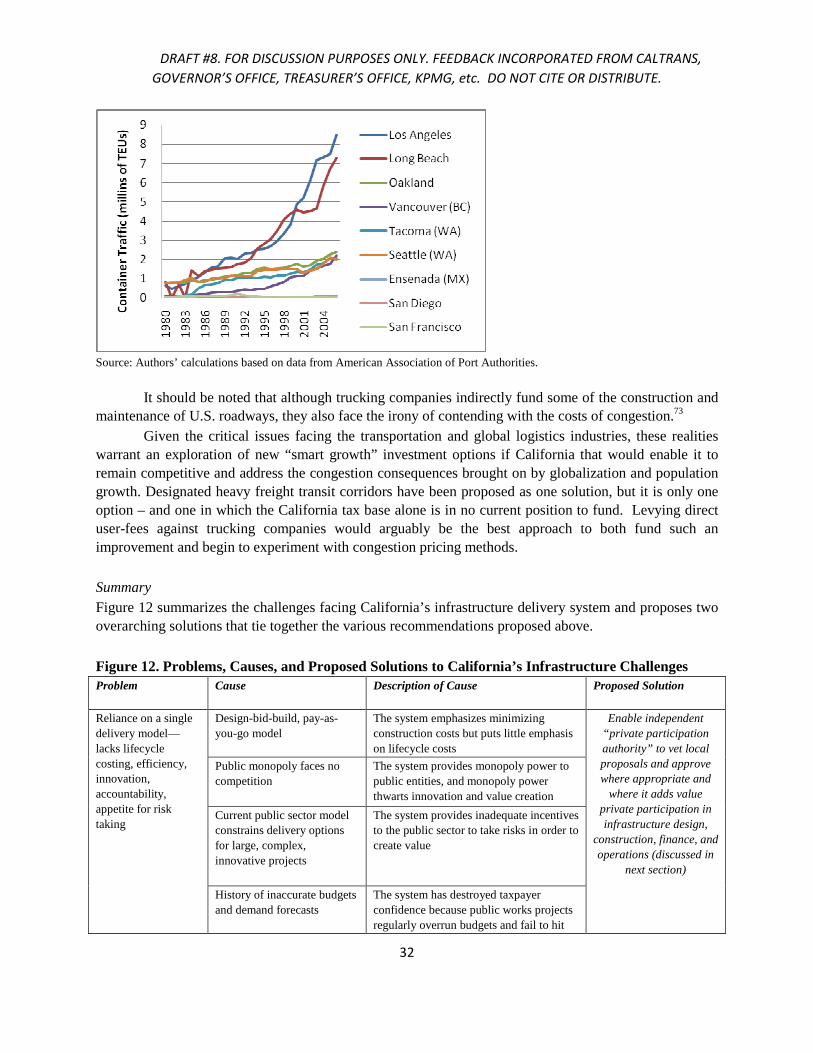
DRAFT #8. FOR DISCUSSION PURPOSES ONLY. FEEDBACK INCORPORATED FROM CALTRANS,
GOVERNOR’S OFFICE, TREASURER’S OFFICE, KPMG, etc. DO NOT CITE OR DISTRIBUTE.
32
Source: Authors’ calculations based on data from American Association of Port Authorities.
It should be noted that although trucking companies indirectly fund some of the construction and maintenance of U.S. roadways, they also face the irony of contending with the costs of congestion.73
Given the critical issues facing the transportation and global logistics industries, these realities warrant an exploration of new “smart growth” investment options if California that would enable it to remain competitive and address the congestion consequences brought on by globalization and population growth. Designated heavy freight transit corridors have been proposed as one solution, but it is only one option – and one in which the California tax base alone is in no current position to fund. Levying direct user-fees against trucking companies would arguably be the best approach to both fund such an improvement and begin to experiment with congestion pricing methods. Summary Figure 12 summarizes the challenges facing California’s infrastructure delivery system and proposes two overarching solutions that tie together the various recommendations proposed above.
Figure 12. Problems, Causes, and Proposed Solutions to California’s Infrastructure Challenges Problem Cause Description of Cause Proposed Solution
Design-bid-build, pay-as-you-go model
The system emphasizes minimizing construction costs but puts little emphasis on lifecycle costs
Public monopoly faces no competition
The system provides monopoly power to public entities, and monopoly power thwarts innovation and value creation
Current public sector model constrains delivery options for large, complex, innovative projects
The system provides inadequate incentives to the public sector to take risks in order to create value
Reliance on a single delivery model—lacks lifecycle costing, efficiency, innovation, accountability, appetite for risk taking
History of inaccurate budgets and demand forecasts
The system has destroyed taxpayer confidence because public works projects regularly overrun budgets and fail to hit
Enable independent “private participation authority” to vet local proposals and approve where appropriate and
where it adds value private participation in infrastructure design,
construction, finance, and operations (discussed in
next section)

DRAFT #8. FOR DISCUSSION PURPOSES ONLY. FEEDBACK INCORPORATED FROM CALTRANS,
GOVERNOR’S OFFICE, TREASURER’S OFFICE, KPMG, etc. DO NOT CITE OR DISTRIBUTE.
33
demand forecasts
California missed pre–World War II era of private franchise model
The system evolved in the second half of the 20th century, long after the “dual” public works/private franchise model had ceased to be prevalent in other U.S. states
Certain proposition have deemphasized flexibility in capital outlays
The lion’s share of the State budget is now “locked-in” to health care and education—only a small share goes to other outlays
Special interest groups enhance but also complicate project approvals and implementation
Efforts to get major capital outlays approved by the Legislature have become gridlocked by myriad interest groups and due process is lacking
California’s government suffers structural weaknesses that influence infrastructure
The ballot initiative, term limits, and a fractured executive make difficult the approval of large, complex, capital-intensive projects
A difficult problem; no solutions offered in the
present paper.74
Deteriorating environment for infrastructure—30 years of neglect has led to decrepit State infrastructure
Funding dedicated for transportation infrastructure is insufficient
The State’s transport infrastructure is funded from a variety of sources, but these sources lack sufficiency and consistency
People are driving more than ever before
New road construction is keeping up with population growth, but changes in urban growth and lifestyles mean more cars on the road and more vehicle miles travelled
The “build more” approach is flawed
Widely held myth that “building more roads” will solve the problem
Congestion—has negative effects on air quality, public health, global warming, property values, economic growth, quality of life, driver stress, and so on
System never designed for influx of intermodal freight and global trade
Due to many factors, roadways have become clogged with heavy transport trucks; the volume and size of trucks was not foreseen when the system was designed and contributes to congestion
Enable transportation financing authority to vet
local proposals and approve—on a selective
basis—charging user fees so that designated revenues will be available to fund
transportation and so that congestion pricing and traffic management
systems can be implemented (discussed
in next section)
Source: Authors’ analysis.
Implications of California’s Infrastructure Problem s California’s infrastructure problems—left unaddressed—will have serious repercussions for the State and its citizens—now and in the future—for competitiveness and economic growth, living standards, and loss of global influence and leadership.
Slower Economic Growth Infrastructure’s contributions to growth in both per capita and broader measures of GDP have been documented in numerous national, regional, and global studies.75 For example, a World Bank study found that annual investments of 1% of GDP in infrastructure are needed to support 1% growth in GDP.76

DRAFT #8. FOR DISCUSSION PURPOSES ONLY. FEEDBACK INCORPORATED FROM CALTRANS,
GOVERNOR’S OFFICE, TREASURER’S OFFICE, KPMG, etc. DO NOT CITE OR DISTRIBUTE.
34
While infrastructure is necessary to generate sustained increases in economic growth, rates of infrastructure-driven growth differ greatly over time and across countries.77 Moreover, infrastructure is insufficient in and of itself for growth to occur—other human, social, economic, resource, and institutional endowments need be present in catalyzing proportions. 78 And knowledge spillovers, circular-and-cumulative causation, and agglomeration effects can cause nonlinearity in endogenous growth patterns, making the influence of infrastructure on growth difficult to decipher.79 Accordingly, infrastructure is not something that should be purchased by a State in unlimited quantities—some countries have probably “overprovided” beyond the growth-maximizing level.80 For example, Japan has built up a comprehensive system of railroads, but now that its population is declining and the system is aging it is not clear that how to fund mounting maintenance costs.
What is clear from the research is that when infrastructure becomes a bottleneck or limiting factor—as is the case with California’s congestion—further investment can unleash unusually attractive returns.81 In many cases, “it is more important to improve the quality of the existing infrastructure than to engage in further investment.”82 World Bank research has documented that after periods of sustained neglect—as in some sectors in California at the State level over the past three decades—new infrastructure investment can yield extraordinary returns relative to investments in other types of capital assets.83 California is currently living on a 30-year-old collection of infrastructure, and obvious problems like road and port congestion, power blackouts, and leaky pipes are creating a drag on the State’s economic output. Economic side effects will only worsen if the neglect continues.
Reduced Quality of Life At the household level, definitions and indicators of quality of life often include measures of access to basic infrastructure services such as water supply, sanitation, transportation, and electricity. Moreover, a strong link exists between access to infrastructure and family income.84 Infrastructure affects almost every aspect of the daily lives of Californians—and if infrastructure regresses, so will the quality of life for many, if not most, citizens of the State.
Loss of Global Leadership Position A further implication of California’s eroding infrastructure is that the State risks losing its position of leadership in the global economy. California is the world’s eighth largest economy, making it larger than most independent nations. In the race between states and nations to attract foreign direct investment, infrastructure has critical importance. More than ever before, capital is going to economies with two important features—large economic size and attractive business environment, which together account for 75% of the variance in global foreign direct investment flows.85 If California can go beyond mere investing in fixing potholes to developing an advanced 21st “smart” infrastructure system unrivaled in Western economies, it could attract a disproportionate share of global capital and achieve amazing returns.
On the flipside, if California slides out of the 10 most attractive global business environments, it could lose hundreds of billions of dollars in new investment flows. Indeed, the 10 economies that topped the business environment rankings published by The Economist magazine in 2007 attracted more than half of all global capital flows. Thus the pressure of globalization adds a high-stakes dimension to this game not present in the 1970s or 1980s.

DRAFT #8. FOR DISCUSSION PURPOSES ONLY. FEEDBACK INCORPORATED FROM CALTRANS,
GOVERNOR’S OFFICE, TREASURER’S OFFICE, KPMG, etc. DO NOT CITE OR DISTRIBUTE.
35
In making facility location decisions companies pay particular attention to the quality and availability of infrastructure. To the extent that companies relocate to states with better infrastructure their economic benefit to California is lost for the duration.
California has an opportunity to become the gateway of Asian trade and investment in North America, as Asia’s share of the global economy is expected to grow 30–40% over the next 20 years.86 But this privileged position as a portal in the global supply chain is by no means secure.87 In recent months Chinese leaders have raised serious concerns about California’s commitment to infrastructure investment, and Chinese planners are said to be actively exploring alternate transportation hubs in Mexico, Canada, and Washington state.88 If these shifts occur, they would involve long-term infrastructure arrangements and new patterns of trade that would take a generation to reverse.
Solutions to California’s Infrastructure Problems For the past 25 years—a period during which California’s economy and population have nearly doubled—the rate of infrastructure investment at the State level has been well below the 50-year average. Few people would disagree that now is the time for a major initiative to renew California’s infrastructure. But proposals on exactly what to do or how to do it are less obvious. This section offers two modest proposals. Based on the previous discussion in this paper and the workshop held at Stanford University in October 2007, two proposals emerged to expand the menu of options available to the State for delivering and funding needed infrastructure.
The first proposal, related solely to transportation infrastructure, contemplates creating an independent transportation financing authority to vet local proposals and authorize local and regional transportation authorities to implement user fees that could eventually form the basis of congestion pricing and traffic management systems (the “user fee proposal”). Projects implemented under this proposal would be funded by user fees (collected by the State) that would support the issuance of State revenue bonds.
The second, broader but complementary, proposal would create an independent infrastructure authority to vet local proposals and approve private participation in infrastructure design, financing, construction, and operations, perhaps up to some maximum percentage of the State portfolio (the “private participation proposal”) and would not be limited to transportation. Projects implemented under this approach could be funded by user fees, tax increases, or reallocations of the General Fund, with private enterprises authorized to collect user fees or receive availability payments from the government out of tax revenue after achieving performance goals—a system pioneered under the Private Finance Initiative in the United Kingdom (availability payments have also been dubbed PFI payments or PFI credits). The United Kingdom’s experience with its Private Finance Initiative has been that the costs of design, construction, financing, and operations of a project over its full cradle-to-grave lifecycle are on average 17% lower than with conventional public finance and operation.89 But 17% savings is certainly not the limit of what can be achieved with private participation; it is just the average. Indeed, many of the U.K. projects have achieved more than 40% savings, and others have received less than 0% or been more costly and should thus have been delivered by conventional methods. Thus the 17% figure could be even higher if the government could do a better job of selecting projects for which private participation would add real value, and avoid those where it did not.

DRAFT #8. FOR DISCUSSION PURPOSES ONLY. FEEDBACK INCORPORATED FROM CALTRANS,
GOVERNOR’S OFFICE, TREASURER’S OFFICE, KPMG, etc. DO NOT CITE OR DISTRIBUTE.
36
These proposals seek not only an increase in California’s stock of infrastructure, but also to increase the efficiency of how the existing stock is used, and to modernize the delivery system so that the State has more options for delivering new infrastructure.
Figure 13. The Two Proposals: (1) From Taxes to Tolling and (2) From Public to Private Provision
Source: Authors’ analysis.
The two proposals are summarized in Figure 13. As with any two-by-two matrix, the figure is somewhat of an oversimplification in that it does not fully present all options under the private participation proposal. Still, the figure shows how the user fee and private participation proposals relate to one another conceptually and introduces terminology to describe the options available to the State. The bottom left cell of the figure shows the conventional system of infrastructure delivery in California: public entities finance and operate infrastructure using tax revenues collected by the State. The top left cell depicts the user fee proposal: under this option public authorities would be established to collect tolls that repay revenue-backed bonds. The bottom right cell captures the private participation proposal: private operators would be paid out of tax revenues according to a contractually agreed pricing system between the private party and the State—commonly called a “shadow-toll,” “availability payment,” or PFI-credit scheme—but the private operator would not be authorized to charge user fees. The top right cell shows the case where both proposals are enabled, creating the possibility of concessions with private financing and operations paid for by user fees collected by the operator.
While a toolkit with all four delivery approaches depicted in Figure 13 should eventually be available as options to State public officials to implement as it makes sense, it is important to note that the user fee proposal and private participation proposal are distinct and can be implemented one without the other, one following the other, or both at the same time. This distinction is important, because many well-intentioned infrastructure finance experts conflate these two proposals as if they were the same, and use the broad-brush term public-private partnership carelessly to describe both. For example, the editor of a transportation newsletter risked this error when he made the following remark: “Instead of relying on

DRAFT #8. FOR DISCUSSION PURPOSES ONLY. FEEDBACK INCORPORATED FROM CALTRANS,
GOVERNOR’S OFFICE, TREASURER’S OFFICE, KPMG, etc. DO NOT CITE OR DISTRIBUTE.
37
periodic increases in gas taxes, our scenario calls for a gradual transition to a more entrepreneurial, market-oriented system, in which direct user fees in the form of tolls, variable (congestion) pricing, long-term operating concessions, and private equity capital are allowed to play a major role in funding and managing new transportation infrastructure.” By mashing all of these envisioned end-states into the same statement, the editor risks blurring a sharp divide between the user fee proposal (which is a revenue concept) and the private participation proposal (which is a procurement mode). This blurring impedes discussion, because it fails to recognize that the politics of gaining public and legislative support varies tremendously across the two proposals.
Political realities in California may make it impossible to enable both proposals at once. For example, it is may be easier to get the user fee proposal approved by the Legislature, because it can be supported by a diverse array of special interests that recognize the escalating importance of mitigating deleterious effects of congestion—environmental NGOs on pollution issues; climate change experts on global warming issues; asthmatics, the elderly, insurance companies, and the medical community on air quality issues; industrialists on lack of predictability for business; landowners on land valuation issues; and those who commute and struggle with congestion on issues of quality of life. Meanwhile, the success of the private participation proposal will require a different approach and probably strong support from State executive offices in order to succeed. Thus it is analytically advantageous to disentangle the two proposals and to identify the benefits associated with each (discussed in the next section).
Finally, recall the disclaimer noted above. The matrix in Figure 13 does not represent all aspects of the private participation proposal; it only represents private involvement in finance and operations. A more complete way to consider the possibilities for value-added private participation is to break down the project delivery value chain into its major components: design (D), build (B), finance (F), maintain (M), and operate (O). The private participation proposal contemplates the ability to mix and match the D, B, F, M and O functions across the public and private sector into combinations that best suit the characteristics of a given project and the needs of the State. Possibilities include the following:
• Private sector D-B and public sector F-O. This combination is commonly called “design-build” and improves innovation and delivery time.
• Public sector D, private sector B, public sector F, and private sector O. This combination is similar to conventional design-bid-build with municipal finance, but brings in a private operator to increase efficiency and inject global best practice in the operations phase. In order for it to work, the operator must be at risk for lifecycle cost.
• Private sector D-B, public sector F, and private sector O. This combination is similar to design-build with municipal finance, but brings in a private operator as well. This combination may present very good value for California for certain projects because it takes advantage of rapid delivery and innovation in the D-B phase, it uses low-cost, tax-exempt municipal finance90, and it brings in global best practice and efficiency gains during operations.
Private Participation Authority

DRAFT #8. FOR DISCUSSION PURPOSES ONLY. FEEDBACK INCORPORATED FROM CALTRANS,
GOVERNOR’S OFFICE, TREASURER’S OFFICE, KPMG, etc. DO NOT CITE OR DISTRIBUTE.
38
The purpose of a proposed California Private Participation Authority (CPPA) would be to provide a coordinated approach to entering into alternative infrastructure delivery arrangements involving broader private sector participation in the D, B, F,M and O phases if and as they add value. The Authority would expand California’s limited delivery model, discussed earlier, by providing State agencies and local governments with greater flexibility and more options—an additional “arrow in the quiver,” so to speak.
In the context of this discussion, the terms private participation and alternative delivery are intended to by synonymous and refer to “all forms of cooperation between public and private entities that aim to ensure the design, construction, financing, rehabilitation, management and/or maintenance of infrastructure and/or the provision of infrastructure services.”91
The proposed authority would not function to approve new greenfield projects, and it would not have the ability to override existing State rules and procedures such as requirements for environmental impact assessments under the California Environmental Quality Act (CEQA).92 It would be a coordination and implementation agency.
For example, the authority might grant a local school district, after it already had the school board’s approval for a new public school, the ability to enter into a full-service lease and facility maintenance agreement if it offered better value. Or it might grant a regional body, after it already had approval for a mass transit line, the ability to enter into a privately or semi-privately delivered arrangement if it offered better value.
The Authority’s design would draw on the design of service agency models for reviewing and implementing private participation in infrastructure now common in British Columbia, France, Ireland, Ontario, the United Kingdom, and other countries and jurisdictions. Such agencies are often called “coordination agencies” (Box 1).93
Box 1 – Public-Private Partnership Coordination Agencies
Infrastructure Ontario and Partnerships British Columbia are examples of coordination agencies. Both are
government-owned corporate enterprises with mandates to provide advice and in some cases take overall responsibility for
reviewing, structuring, and delivering large, complex public infrastructure projects. The agencies are governed by boards of
directors drawn primarily from the private sector, with some from the public sector. The agencies have mandates to involve the
private sector in infrastructure delivery if and when it makes sense. Their clients are other government agencies with primary
responsibility for the infrastructure projects.
The coordination agencies provide transaction management services, consolidated expertise, and consistent
procedures, including centralized communications between industry and government on projects. They do not participate in
capital budgeting of the client agencies. Both agencies’ roles can vary in terms of participation in projects’ post-closing
activities. For example, Infrastructure Ontario plays an active role in the design and construction phase, while Partnership’s BC
role may vary from project-to-project. In each case client agencies play a very active role, if not managing the process
themselves.
These coordination agencies have handled many types of projects, including highways, bridges, rapid transit, health
care, sports centers, water treatment, and telecommunications. A major part of their efforts are devoted to the financial
structuring of transactions using private capital and private industry techniques; they have no authority to issue bonds. The
purpose of the agencies is to implement their governments’ commitment to ensuring a modern system of infrastructure

DRAFT #8. FOR DISCUSSION PURPOSES ONLY. FEEDBACK INCORPORATED FROM CALTRANS,
GOVERNOR’S OFFICE, TREASURER’S OFFICE, KPMG, etc. DO NOT CITE OR DISTRIBUTE.
39
delivery in order to provide appropriate infrastructure cheaper, better, and faster, and to cope with the many problems of the
public delivery model noted earlier.
If California is going to have private participation in infrastructure delivery—then a centralized authority would offer a number of benefits over the State continuing to do public-private partnerships on a one-off, ad hoc, uncoordinated basis. For example, a centralized authority could do the following:
• Expeditiously and effectively determine the best-value delivery model for the State.
• Go toe-to-toe with highly experienced and highly paid private sector counterparties in negotiating transactions on taxpayer-favorable terms (and thereby avoid the mistakes made on some earlier public-private deals and avoid the State getting “ripped-off” by experienced private providers).
• Design contracts to link payments (in shadow toll or availability deals) for infrastructure to service outcomes and performance of the assets over the phase(s) defined by contract (to ensure taxpayer value).
• Stay abreast of developments in the market (to ensure global best practice).
• Aggregate deal management and access economies of scale in transaction management
• Ensure consistent, standardized terms (to get better terms, drive down transaction costs and increase competition).
• Receive unsolicited proposals to implement or develop new projects (to tap private sector innovation).
• Help other State agencies identify which projects could benefit from alternative delivery models (to provide more options to line departments).
• Provide long-term institutional memory for assimilation of lessons learned into future project design (to avoid repeating mistakes).
• Create a “laboratory of innovation and global best practice” with the possibility that good ideas discovered by the Authority could be transferred into other State entities handling traditional infrastructure delivery (to ensure diffusion of lessons learned).
The Authority would review the merit of proposals against a set of criteria in order to determine the appropriateness of a given project for the alternative delivery track.
• Lifecycle costing—Is there opportunity to achieve savings over conventional delivery by involving private industry and by taking a more holistic, lifecycle perspective to capital budgeting for project D, B, F, M, and O functions?
• Maintenance reserve—Is the project sponsor having difficulty with deferred maintenance and in need of a “guaranteed” maintenance plan? Is it important to have a maintenance reserve in place from day one to cover ongoing rehabilitation and maintenance?94
• Competition and efficiency—Does the project sponsor have healthy competition in all of its design-build-finance-maintain-operate functions? Are there monopoly providers, public or private,

DRAFT #8. FOR DISCUSSION PURPOSES ONLY. FEEDBACK INCORPORATED FROM CALTRANS,
GOVERNOR’S OFFICE, TREASURER’S OFFICE, KPMG, etc. DO NOT CITE OR DISTRIBUTE.
40
in any of these functions? Could the project be used to set-up a horse-race between the public and private sectors to boost efficiency?
• Performance guarantees— Are there advantages to performance-based payment schemes that support guaranteed and accountable on-time, on-budget, on-specification delivery? Is the proposed project unusually sensitive to budget overruns, delays, or performance shortfalls that make traditional forms of procurement unattractive?
• Risk transfer—Are there benefits to public sector agencies being able to shed risks that they may not have the appetite or capacity to assume?
• Innovation—Is the project sector characterized by long-term lack of innovation, where output specifications and performance incentives could yield advances? Is the project exceptionally large, complex, or innovative, such that relative to typical projects handled by sponsor it is non-routine? Is it possible to use performance specifications to push the limits of what has been built before?95 Can the private sector add value in accelerating project schedules? Without the proposed private participation, would project delivery be deferred for an unacceptable time?
• Global best practice—Do large, specialized, global infrastructure firms exist in the project sector that are pushing the frontiers of management, technology, or financial modeling that could infuse the sponsoring agency with global best practice? (for example, with congestion pricing systems)
Because the Authority would involve private industry in complex, costly arrangements with government, transparency would be needed in the administration and execution of such projects. In this case, “transparency” means being able to fully understand how and when a decision or award would be made before the process begins. Selection of the format of the Authority would be important to promote public confidence and attract the best private providers.
The California Private Participation Authority would not be viewed as a source of low-cost financing. In the United States, private sector financing of projects is not always cost-efficient relative to public finance. Low-cost, tax-exempt financing is readily available through the U.S. municipal bond market, which provides a massive pool of capital—state and local governments sold more than $400 billion in bonds in 2007—with credit structures that the market understands and accepts. The benefit of municipal finance over project finance is that holders of municipal debt are exempt from paying income tax on the interest they earn and so are willing to accept lower interest returns than other taxpaying lenders. In today’s market this can save 125–150 basis points (1.25–1.50%). It can also reduce the cost of capital over the life of a project by 10–20%, depending on the market at the time of the issuance of the bonds. For this reason the CPPA should not be viewed as a source of low-cost financing. However, recent changes regarding TIFIA and Private Activity Bonds at the Federal level significantly reduce if not eliminate the muni-private finance differential by making new sources of low cost financing available to public-private partnership transactions.
There are a limited number of cases where private sector financing could provide a low-cost alternative or otherwise make sense in California, including, projects deemed unfinanceable by municipal markets because they are too risky (for example, high-speed rail), projects where tax benefits to private ownership outweigh the higher costs of private financing (as with solar projects, which in California are

DRAFT #8. FOR DISCUSSION PURPOSES ONLY. FEEDBACK INCORPORATED FROM CALTRANS,
GOVERNOR’S OFFICE, TREASURER’S OFFICE, KPMG, etc. DO NOT CITE OR DISTRIBUTE.
41
granted special tax benefits such as investment tax credits and accelerated depreciation), and projects for which private sector technology and techniques (including financing) are especially suited. But in general, a shortage of capital for financing is not a reason to use the CPPA, given the strength of the municipal bond market.
Although taxable private sector financing may be more costly than municipal financing, that is not in and of itself a reason to avoid private participation. What is important to the State is the “all in” or “net” cost of private delivery over the lifecycle. Slightly higher private financing costs in the F phase may be outweighed by lower component costs in the D, B, and O phases. For example, even if a private provider of a new school building has higher costs in the F phase over the municipal finance alternative, but is able to save money in the D, B and O phases, that provider’s “all in” cost may be lower. From the State’s standpoint all that matters is net value, not the provider’s component costs.
Several questions would need to be addressed during formation of the proposed Authority. First, the alternative delivery model encompasses many varied arrangements, from complex contracts to actual partnerships between public and private entities to deliver long-term services, capital-intensive assets requiring considerable maintenance, or in some cases both. Determining whether a proposed project would be appropriate for the alternative delivery model is a key decision. The processes and criteria for making this decision would need to be objective, transparent, and unbiased by parties that favor one model over the other.
Second, there would be overhead expenses in creating the California Private Participation Authority and bringing highly experienced legal, investment banking, and infrastructure experts into the hierarchy of government. Though it is easy to quantify the costs of such a decision, quantifying the benefits is less straightforward. How do the costs and benefits stack-up?
Finally, if the government is going to employ highly-skilled executives that can go “toe to toe” with their highly experienced and highly paid private sector counterparties, it is going to need to pay them at levels on par with private industry. Is it possible for the State government to establish private sector competitive compensation options without creating jealousy and upsetting other branches of the civil service?
A central tenant of the Authority’s mandate would be to take precautions to protect the public interest if it engaged in the auctioning of concessions. When concessions are auctioned, there is a temptation for the government to focus first on the price it will receive and second on the impact of its decision on users. This focus can result in inappropriate regulatory approaches which allow steep price increases at the expense of the user. The government must take great pains to ensure that its duty to protect users is not compromised by its desire to receive a high price.
Harold Demsetz at UC Berkeley has written about this problem and, based on lessons from the 1970s with the sale of licenses for cable television, concluded that the way to protect the public interest is what is now known as a “Demsetz auction.” Private providers bid on the level of user fee that they will charge and the provider with the low bid wins the auction.96
Still, low “user fee” bids are not always a sure-fire solution. Contracts can be broken, and renegotiations can lead to cost overruns for the State. Recent research literature analyzes the limitations of long-term, incomplete, contingent-claims contracts between government entities and private infrastructure
DRAFT #8. FOR DISCUSSION PURPOSES ONLY. FEEDBACK INCORPORATED FROM CALTRANS,
GOVERNOR’S OFFICE, TREASURER’S OFFICE, KPMG, etc. DO NOT CITE OR DISTRIBUTE.
42
providers.97 Despite the best efforts of attorneys to specify ex ante every imaginable contingency in contract language, inevitably events transpire and attitudes change such that the initial bargain is undermined.98 Renegotiation in these scenarios may well be the efficient solution. On the other hand, situations of “opportunistic” renegotiation and ex post “hold-up” should be carefully guarded against. Many private sector operators have a “win now, renegotiate later” mentality and careful contract design should be undertaken to guard against opportunistic renegotiations.
Transportation Financing Authority
The economic situation for funding new infrastructure in California is relatively straightforward: without additional revenue, there can be no new infrastructure. The additional revenue could come from one or more of the following sources: user fees, tax increases, re-allocations of the General Fund, Federal transfers, sales of existing infrastructure assets (privatization), or at some point in future, perhaps even auctions of carbon credits.99
The Transportation Financing Authority does not exist but was first conceived in the Treasurer’s 2007 Debt Affordability Report as a potential way forward. Its purpose would be to create a new dedicated revenue source for transportation. The report provides excellent background on methods—from the Treasurer’s viewpoint—for using State resources, including credit, to provide new infrastructure. As to the California Transportation Financing Authority, it says:
To address the need for innovative public transportation and transit financing options, the Treasurer believes the Legislature should create a California Transportation Financing Authority (CTFA) to permit the issuance of bonds to support publicly-owned and operated highways that may be backed by a variety of revenue sources, including tolls. The Treasurer believes there is a huge potential for ‘public-public partnerships’ (partnerships between different levels of government such as the State and a local transportation agency) to deliver essential projects without relying on the private sector for direct financing and operation.
The CFTA would be authorized to issue revenue bonds for State-owned highways, including those built through public-public partnership. Membership on the Authority would include, at a minimum, the Treasurer, the Director of Finance and the Director of Caltrans. The Treasurer would serve as agent for sale for the CTFA’s bonds. Over the next few months, the Treasurer intends to develop details for the CTFA and seek its creation from the Legislature.
The revenue streams that the Treasurer envisions seem largely to be tolls on new roads, though there is a possibility of select excise taxes (such as transportation or gas taxes). The question of whether tolls for roads are an appropriate application of public-private partnership is left open. Further details of

DRAFT #8. FOR DISCUSSION PURPOSES ONLY. FEEDBACK INCORPORATED FROM CALTRANS,
GOVERNOR’S OFFICE, TREASURER’S OFFICE, KPMG, etc. DO NOT CITE OR DISTRIBUTE.
43
the scope of the Authority will likely be defined in the Treasurer’s proposal being prepared for the Legislature over the next several months.
Going beyond what the Treasurer has described in the Debt Affordability Report, it is possible to conceptualize other aspects of the CFTA, described below, that could potentially augment what the Treasurer is planning to suggest. The proposal implies the authorization of tolling for transportation corridors. That power now resides solely with the Legislature and would need to be delegated to the CFTA. As an alternative, the Legislature could also authorize availability payments to the CFTA for projects administered by the Private Participation Authority.
The CFTA would not be authorized to approve the construction of new roads. This decision would follow existing State rules and regulations.
In terms of process, it could be envisioned that State and local transportation authorities submit proposals to the CFTA to request approvals to charge user fees and to employ user-fee backed finance. Proposals would include whatever items the CFTA required for complete submissions including but not limited to traffic studies, toll rate increase forecasts, and local government endorsements, etc. The merit of proposals would be determined against a range of screening:
• Financial Feasibility—Do the project revenue projections cover repayment of construction costs, operating expenditures, capital improvements, and bonds? Is the project cash positive?
• Presence of trucking companies and free riders—Is the road heavily trafficked by long-haul trucking companies that would value and pay for reliability in support of their “just in time” business models? Is the road being designed as a designated heavy freight corridor (say, out of Los Angeles, Long Beach, or Oakland)?
• Fairness of toll rates and increases—Is the proposed toll rate and schedule of increases consistent with other areas of the State and other similar facilities?
• Likelihood of solving congestion—Does the road have problems with or likely to have problems with congestion? Could demand pricing reduce high-levels of congestion, carbon emissions, air quality concerns, and public health problems? Could demand pricing improve efficiency by increasing overall throughput?
• Need for designated funding source—Do State budgetary constraints eliminate the possibility of building the road without user-fee backed finance?
• Presence of low-income neighborhoods—Does the road cut through low-income neighborhoods that would lose access to the network if tolled lanes were imposed? Do low-income groups have access to other public transport options? Could they be subsidized through technology?
• Unutilized state bond funding—Does the State have pre-authorized bond funding sitting unused that could be applied to the project?
• Technological best practice—Does the proposal draw on the best technological options, taking into account the full range of congestion pricing and traffic management systems and given the experiences of other localities within the State with various options?

DRAFT #8. FOR DISCUSSION PURPOSES ONLY. FEEDBACK INCORPORATED FROM CALTRANS,
GOVERNOR’S OFFICE, TREASURER’S OFFICE, KPMG, etc. DO NOT CITE OR DISTRIBUTE.
44
• Consistency of user experience—Are the proposed toll collection technologies and the physical locations of the toll collection booths going to create problems of discontinuity at the network level? (This will probably not be a concern over the first 10 years, but could eventually be problematic if a large share of roadways were to switch to tolling.)
• Feasibility of success—Based on a holistic set of quantitative and qualitative factors and conditions, is the likelihood that user-fee backed financing will be successful?
• Local support—Does local and regional support exist for the project package including concept, delivery method, user fees, and/or finance methods?
The last two criteria on the list are especially important because a string of early wins would be crucial to gain broad public support for the CFTA concept. Early failures could be detrimental.
There are several questions to be addressed during formation of the CFTA. First, how much deference should be given to the locality in the decision to approve user fees for projects submitted by a local government? Should the locality be required to undertake a countywide or citywide referendum to establish public acceptance? Second, what process does the locality use in soliciting and responding to stakeholder comments, grievances, and objections, and does this happen before or after the locality sends the proposal to the Authority for approval? Third, what criteria and process does the CFTA apply when deciding to approve or reject local proposals? Is the list of screening criteria noted above sufficient? Or are additional criteria also necessary? Finally, should the two criteria labeled “Technological best practice” and “Consistency of user experience” be on the list of screening criteria, or should they be considered at the time of project approval, long before the CFTA is involved? An argument for including them in the CFTA’s review is to ensure that tolling is done in a sensible way, according to best practice, and with the maximum likelihood of success (which could affect how the CFTA is viewed).
One of the strong benefits of implementing user fees is the possibility for demand pricing to help manage congestion and keep the transportation system operating at higher speeds. Tolls would rise and fall dynamically throughout the day with fluctuations in demand for the road. For example, at midnight when the road is not heavily used, it may very well be possible to make all lanes free. On the contrary, at 8am in morning rush-hour when traffic is at its worst, the toll may rise to $20 or higher. At 3pm, when traffic is relatively light, the toll might fall to $2. Toll structures could vary across lanes, so that there is always a “free” lane for low-income groups that value money over time and always an “open” lane for those who value time over money. Mixed speeds do present safety concerns, however. The advantage of congestion pricing is that it produces what economists have called a “double-dividend”—it both solves the congestion and environmental pollution problem (dividend #1) and in so doing allows the government to collect revenue that can be used to further upgrade the transportation system and potentially even fund other important State services (dividend #2).100
The social equity concern is one that the CFTA would need to monitor. Low-income groups able to afford a car but unable to afford a toll could be disadvantaged and shut out from the system. Social equity concerns could be especially worrisome in situations where proposed toll lanes cut through low-income neighborhoods and locals lack other transportation options. In these situations it may be possible to leave un-tolled lanes, to provide lower prices at different off-peak times of the day, or to subsidize low-income people directly using technology or expanded transit options. A governance approach to counter

DRAFT #8. FOR DISCUSSION PURPOSES ONLY. FEEDBACK INCORPORATED FROM CALTRANS,
GOVERNOR’S OFFICE, TREASURER’S OFFICE, KPMG, etc. DO NOT CITE OR DISTRIBUTE.
45
this concern would involve requiring local proposals to have embedded within them local political input that would eliminate the most potentially troubling situations; and the CFTA would be able to solicit expert advice when social equity concerns became apparent and to summarily reject proposals on that basis. 101 On the other side of the coin, it is not at all clear that congestion is beneficial to the poor. It can be argued that many of the poorest citizens cannot even afford a car. It can also be argued that congestion’s impact on gasoline consumption, housing prices, and reduced ability to access labor markets is regressive to all citizens of the State, including those at the lower-end of the income scale. Polling data confirm that low-income people like choices and reliability just like everyone else.102
Sequence of Implementation Creating two new State-level authorities is no small undertaking. Several approaches are possible; intentionally sequencing the approaches may be beneficial. This discussion is intended merely to be illustrative of options that exist, and is not meant to imply that one option is preferable to another.
The “big bang” approach
Proponents of the big bang approach would seek approval from the Legislature for both the CTFA and CPPA in the same policy proposal, potentially even bundling the two authorities into an integrated Agency with common support staff and cooperation between the Governor’s Office, Treasurer’s Office and other relevant agencies in implementation and operation, recognizing the synergies and expanded influence that they could have if they agreed to cooperate.
Once authorized, the operations of the two independent authorities could be phased in, perhaps as part of the enabling legislation. Phase-in could be accomplished by bundling together a list of project development initiatives already approved, to be submitted for either CTFA action or CPPA action, and thereafter letting State agency, local government, and private-sector sponsors submit whatever they wanted. The approach taken to establish the two authorities, and whether or not they would be bundled into an Agency, would, of course, affect how it was staffed in early years.
The “CTFA one local agency at a time” approach
If it were deemed unrealistic to obtain Legislature approval to establish the CTFA, it may be useful—given the magnitude of transportation infrastructure problems—to obtain authority for legislatively designated jurisdictions to charge user fees (Orange County, Riverside County, Santa Clara County, and so on). As additional jurisdictions joined the group of those given approval to charge user fees, it may make sense to create an informal steering committee of representatives of each of these local agencies to compare notes and share lessons. Once a substantial group of jurisdictions was approved to charge user fees, the arrangement could be institutionalized to include all jurisdictions in the State through an entity similar to the CTFA, with the ability to issue revenue-backed bonds.
The “informal stewardship approach to the CPPA”

DRAFT #8. FOR DISCUSSION PURPOSES ONLY. FEEDBACK INCORPORATED FROM CALTRANS,
GOVERNOR’S OFFICE, TREASURER’S OFFICE, KPMG, etc. DO NOT CITE OR DISTRIBUTE.
46
Proponents of this approach would address the concept of the CPPA incrementally. The thinking here would be not to create a big entity not knowing if it would be able to do anything. Instead, the approach would be to look strategically at agencies such as Caltrans, the Administrative Office of the Courts, and others that oversee specific kinds of facilities that members of the Legislature want to be able to deliver to their constituents—and that members of the Legislature realize, without private participation, they are not going to be able to deliver (such as solar power).
The notion would be to create an informal steering committee or a stewardship out of the Governor’s office. It would include advisers from the Governor’s office, Attorney General’s office, Department of General Services, Treasurer’s office, Caltrans, and Administrative Office of the Courts. The advisers would talk about what they were doing in their agencies in order to coordinate various agency actions without trying to standardize anything. One by one the agencies would take proposals to the Legislature for broader private engagement in project delivery.
The eventual goal would be for the committee to be able to—and indeed, required to—articulate overriding State goals based on its experience. If over time the steering committee were expanded and reached a critical mass that was worth making permanent, it could be institutionalized at that time. The steering committee could not only serve an informal function to achieve State goals in the short term, it could also form the basis of a more permanent CPPA type authority. This would likely be a two- to five-year approach to resolving currently critical problems.
The “CTFA this year, CPPA next year” approach
This approach would seek approval from the Legislature for just the CTFA function in 2008, taking the view that the CTFA function could be the better step to put forward initially, for two reasons. First, it could be more politically feasible given the broad coalition of stakeholders that would support it on the grounds of solving congestion in the transportation sector. Second, ongoing research at Stanford University shows that in many countries where widespread social objections to private participation in infrastructure have arisen (especially in the water and transportation sectors), the objections were ill-informed and were created not by private operation in and of itself (which was often the target of the opposition), but by the imposition of user fees or the raising of user fees above historical levels or before service improvements were implemented.
Public authorities in other jurisdictions have sometimes preferred to connect the user fee and private participation proposals because it allows them to “pass the buck” and have the private entities “do the dirty work” of informing the public of new or increased “tariffs” and of playing the role of “tariff collectors.” But passing the buck can create serious problems on many levels, including the political level. An example is the Cochabamba water project in Bolivia. Water was a governmental service not historically associated with user fees based on full cost recovery. A private concession to process and distribute water was granted, along with the authority to charge user fees. The government did not prepare the population for the change. The private sector was blamed. Increases in user fees led to protests, social uprisings, and other pressures on the national government that contributed to its weakening.
In other places that we have studied where the government undertook the onus to first raise rates to market levels, before bringing in the private sector, this concern has been largely eliminated.
DRAFT #8. FOR DISCUSSION PURPOSES ONLY. FEEDBACK INCORPORATED FROM CALTRANS,
GOVERNOR’S OFFICE, TREASURER’S OFFICE, KPMG, etc. DO NOT CITE OR DISTRIBUTE.
47
Accordingly, it may be politically beneficial for California to disconnect the CTFA and CPPA proposals in time and space, so that the public does not conflate these two steps and attribute new fees or fee increases to being caused by “greedy, corrupt, profit-seeking” private entities. The strategy would be to first institute user fees through the CTFA, and then—after an appropriate period of time has passed that the public becomes comfortable with the new system—introduce private entities through the CPPA to handle design, build, finance, and operate functions. It is possible to have user fees, without private entities, by creating public tolling authorities.
If the CTFA were activated first, it would be important for the Governor’s office to “begin with the end in mind,” and ensure that it was created in a way that could eventually be morphed into a broader mandate for infrastructure renewal in the State.
Short List of Project Sectors Although neither the CFTA nor the CPPA would be “approval agencies” and would not be able to approve new projects, it is worthwhile to discuss the kinds of projects where the State should be focusing its efforts in the 21st Century environment. If one looks at the global experience in the 1990s, the most popular areas of infrastructure investment (in order of priority) were energy, communications, water, sanitation, and transportation. If one reverts to the Pat Brown years in California, the focus was on education, water, and transportation. But what happened globally in the 1990s and what happened under Pat Brown do not necessarily reflect how the State should allocate its infrastructure investments going forward.
Capital asset formation needs to focus on the sectors with the greatest potential to maximize economic, environmental, and social returns and to alleviate bottlenecks. Looking to the future, opportunities and threats that will influence California’s infrastructure include continuing globalization, population growth, energy costs, resource depletion, earthquakes, trade with Asia, baby boomer retirement, and a shift toward a service-based economy.103 Based on these trends and based on the strengths and weaknesses of California’s existing infrastructure, there are several classes of infrastructure that seem to represent “low hanging fruit” for State level investment over the next 10–20 years. These options—and their rationales—are presented in Figure 14, and include intermodal freight corridors, wireless networking for Internet communications, smart roads that employ dynamic congestion pricing and ramp metering, critical earthquake-prone infrastructure, and solar energy. These items are listed in order of hypothesized value creation to the State; however, the ranking is intended as illustrative and further rigorous quantitative analysis and research would be necessary to crystallize the relative environmental, social, and economic costs and benefits of each option.
Figure 14. Short List of Project Sectors for California
Type Rationale
Intermodal freight corridors104 - Secure growing freight volumes from Asia through Los Angeles, Long Beach, and Oakland, then to other parts of the United States
- Avoid mixing passenger vehicles and heavy transport trucks and avoid
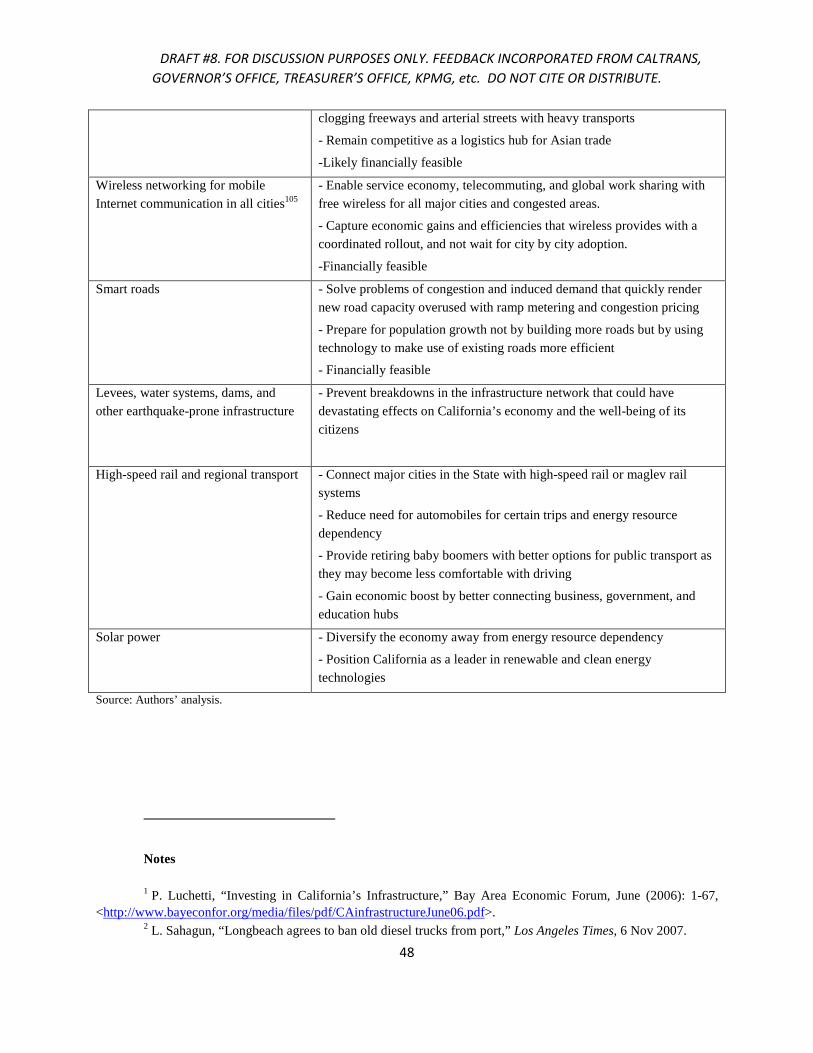
DRAFT #8. FOR DISCUSSION PURPOSES ONLY. FEEDBACK INCORPORATED FROM CALTRANS,
GOVERNOR’S OFFICE, TREASURER’S OFFICE, KPMG, etc. DO NOT CITE OR DISTRIBUTE.
48
clogging freeways and arterial streets with heavy transports
- Remain competitive as a logistics hub for Asian trade
-Likely financially feasible
Wireless networking for mobile Internet communication in all cities105
- Enable service economy, telecommuting, and global work sharing with free wireless for all major cities and congested areas.
- Capture economic gains and efficiencies that wireless provides with a coordinated rollout, and not wait for city by city adoption.
-Financially feasible
Smart roads - Solve problems of congestion and induced demand that quickly render new road capacity overused with ramp metering and congestion pricing
- Prepare for population growth not by building more roads but by using technology to make use of existing roads more efficient
- Financially feasible
Levees, water systems, dams, and other earthquake-prone infrastructure
- Prevent breakdowns in the infrastructure network that could have devastating effects on California’s economy and the well-being of its citizens
High-speed rail and regional transport - Connect major cities in the State with high-speed rail or maglev rail systems
- Reduce need for automobiles for certain trips and energy resource dependency
- Provide retiring baby boomers with better options for public transport as they may become less comfortable with driving
- Gain economic boost by better connecting business, government, and education hubs
Solar power - Diversify the economy away from energy resource dependency
- Position California as a leader in renewable and clean energy technologies
Source: Authors’ analysis.
Notes 1 P. Luchetti, “Investing in California’s Infrastructure,” Bay Area Economic Forum, June (2006): 1-67,
<http://www.bayeconfor.org/media/files/pdf/CAinfrastructureJune06.pdf>. 2 L. Sahagun, “Longbeach agrees to ban old diesel trucks from port,” Los Angeles Times, 6 Nov 2007.

DRAFT #8. FOR DISCUSSION PURPOSES ONLY. FEEDBACK INCORPORATED FROM CALTRANS,
GOVERNOR’S OFFICE, TREASURER’S OFFICE, KPMG, etc. DO NOT CITE OR DISTRIBUTE.
49
3 M. Caldwell and C. Segall, “No Day at the Beach: Sea Level Rise, Ecosystem Loss, and Public Access
Along the California Coast,” Ecology Law Quarterly, 34 (2007):533-578. 4 J. Lund et al. “Envisioning Futures for the Sacramento-San Joaquin Delta” Public Policy Institute of
California, February (2007): 1-324; URS Corp., “Delta Risk Management Strategy,” A Report prepared for The California Department of Water Resources, California Department of Fish and Game, and the U.S. Army Corps. of Engineers, June (2007): 1-50, <http://www.drms.water.ca.gov/Phase1Information/>.
5 American Society of Civil Engineers, California Infrastructure Report Card 2005.
6 Public comment by David Crane, Advisor to Governor Schwarzenegger, at the Silicon Valley Leadership Group conference on Public Private Partnerships, Oct. 17, 2007. Mr. Crane has observed that the four elevators have been out of commission for a period of months causing substantial delays in Sacramento.
7 Definition of infrastructure adapted from M. Garvin, “America’s Infrastructure Strategy,” Report by KPMG and Stanford University, (2007): 1-48.
8 Participation in the Workshop was by invitation only, with carefully selected representation from the California Governor’s Office, Treasurer’s Office, Caltrans, Partnerships BC, Infrastructure Ontario, regional transportation authorities, labor unions, business groups, and relevant sectors of industry, with a particular emphasis on maximizing the diversity of viewpoints at the table. Numbers were limited to a small and select few to encourage real discussion and debate. All comments made during the Workshop were not for attribution. The Workshop program is available on the Collaboratory’s website under the section “Events” sub-section “Roundtables”.
9 It is generally not thought to be prudent to sell-off State owned assets, except under situations of extreme
financial hardship or where the State in incapable of operating at the required efficiency and where all other avenues had been exhausted, which is not a situation that California faces or is likely to face in the near future. Selling or leasing existing assets to plug short-term budget deficits equates to “selling the family silver” and should be avoided.
10 OECD. “Infrastructure to 2030.” Organization for Economic Co-operation and Development, (2007): 1-510 (see pg. 29).
11 Roger Noll provided this long list of factors as to why it could potentially be dangerous to use the OECD
numbers as a benchmark against which to measure the suitability of California’s infrastructure investment. 12
Conversation with Caltrans Director, Will Kempton, Dec. 28, 2007. 13
Conversation with Caltrans CFO, Cindy McKim, Dec. 28, 2007. 14 J. Vickers and G. Yarrow, “Economic Perspectives on Privatization,” Journal of Economic Perspectives,
Spring (1991): 111-132. 15
D.W. Caves and L.R. Christensen, “The Relative Efficiency of Public and Private Firms in a Competitive Environment: The Case of Canadian Railroads” The Journal of Political Economy, 88/5 (1980): 958-976.
16 HM Treasury, PFI : Strengthening long-term partnerships (London, UK: HM Treasury, 2006),
< http://www.hm-treasury.gov.uk/media/7/F/bud06_pfi_618.pdf> 17
G. Boyne, “Public and Private Management: What’s the Difference?”, Journal of Management Studies, 39/1 (2002): 97-122.
18 B. Bozeman and G. Kingsley, “Risk Culture in Public and Private Organizations”, Public Administration
Review, 58 (1998): 109-118. 19
M. Fottler, “Is Management Really Generic?” Academy of Management Review, 6 (1981): 1-12. 20
For reviews, see: N. Baldwin, “Public versus Private Employees: Debunking Stereotypes”, Review of Public Personnel Administration, 11 (199): 1-27; and H. Rainey, C. Traut and B. Blunt, “Reward expectancies and other work-related attitudes in public and private organizations: a review and extension”, Review of Public Personnel Administration, 6 (1986): 50-72.

DRAFT #8. FOR DISCUSSION PURPOSES ONLY. FEEDBACK INCORPORATED FROM CALTRANS,
GOVERNOR’S OFFICE, TREASURER’S OFFICE, KPMG, etc. DO NOT CITE OR DISTRIBUTE.
50
21
B. Flyvbjerg, M. Holm and S.L. Buhl, “Cost underestimation in public works projects: Error or lie?” Journal of the American Planning Association, 68/3 (2002): 279-295.
22 B. Flyvbjerg, N. Bruzelius and W. Rothengatter, Megaprojects and risk: An anatomy of ambition.
(Cambridge, UK: Cambridge University Press, 2003). 23
B. Flyvbjerg, K. Mette, S. Holm, and S.L. Buhl, “How (In)Accurate are Demand Forecasts in Public Works Projects? “ Journal of the American Planning Association, 71/2 (2005): 131-146.
24 Garvin, op. cit. 25
During the depression and after World War II, a view of infrastructure developed in the federal government which treated projects as economic catalysts per se (by providing jobs and economic activity) and as components of national defense, all of which was to be orchestrated by the federal government. The implementation of this view led to a highly segmented, mandatory design-bid-build system (sometimes involving operation) in which the master developer project delivery system was not permitted and public financing was the only possible method of financing. In particular, in 1947 the federal government changed its procurement process for the armed services and all civilian agencies with legislation: the Armed Services Procurement Act of 1947 and shortly thereafter the Federal Property and Administrative Services Act of 1949. Prior thereto, the federal government permitted the engagement of separate design services for public buildings (thus recognizing the value of design services and separating them from a master developer) and required federal approval of design specifications for roads eligible for federal cost reimbursement. The 1947 legislation allowed flexibility in the procurement of design services but required prior publication of specifications and public invitations to bid for all supplies and services, including construction. The 1949 legislation replicated these procedures for civilian agencies. The collective effect was to encourage the design-bid-build delivery system of infrastructure for all federal projects, but not prohibit other approaches.
26 For a review of the history of Pat Brown’s legacy see Ethan Rarick, California Rising: The Life and Times of Pat Brown, (University of California Press, 2005).
27 Local level outlays are not captured in the State budget.
28 S. Golding et al., “Growth within Bounds: Planning California Governance for the 21st Century,”
(Report of the Commission on Local Governance for the 21st Century, 2000). <http://www.opr.ca.gov/planning/docs/79515.pdf>
29 A.O’Sullivan, T. Sexton and S. Sheffrin, “Property Taxes and Tax Revolts: The Legacy of Prop. 13,”
(Cambridge University Press, 1995). 30
K. Brown, “Mello-Roos Financing in California,” (Sacramento, CA: Califorina Debt Advisory Commission, 1991). < http://www.treasurer.ca.gov/cdiac/reports/M-Roos/financings.pdf>
31 Golding, op. cit., pg. 71
32 Conversation with Kathleen Brown, former State Treasurer, Feb. 27, 2008.
33 A. Crabbe, R. Hiatt, S. Poliwka, M. Wachs, “Local Transportation Sales Tax: California’s Experience in Transportation Finance,” Public Budgeting and Finance, Fall (2005): 91-121.
34 C. Eaton, “Q&A: OPSC’s Rob Cook Talk’s School Funding”, California Constructor, (Feb 2008): 10-11.
35 See 2005 Paper. PPIC 36 Stigler ref, from WB paper on Local Government 37 R. Noll and B. Cain, Constitutional Reform in California: Making State Government More Effective and
Responsive, (University of California Institute of Governmental Studies, 1995, pg. 28). 38 B. Cain, Adapting to Term Limits in California: Recent Experiences and New Directions, (Joint Project
on Term Limits sponsored by National Conference of State Legislatures, Council of State Governments, and State Legislative Leaders’ Foundation, 2004) <http://www.ncsl.org/jptl/casestudies/Californiav2.pdf>

DRAFT #8. FOR DISCUSSION PURPOSES ONLY. FEEDBACK INCORPORATED FROM CALTRANS,
GOVERNOR’S OFFICE, TREASURER’S OFFICE, KPMG, etc. DO NOT CITE OR DISTRIBUTE.
51
39
B. Cain, op. cit. 40
J. Ellwood, and M. Sprague, “Options for Reforming the California State Budget Process”, in R. Noll and B. Cain, Constitutional Reform in California: Making State Government More Effective and Responsive, (University of California Institute of Governmental Studies, 1995, pg. 28).
41 T.R. Saving, “Medicare Meltdown,” The Wall Street Journal, 9 May 2007, Page A17, <http://online.wsj.com/article/SB117867132495096646.html?mod=opinion&ojcontent=otep>.
42 C.S. Thomas, Research Guide to U.S. and International Interest Groups. (Westport, CT: Praeger & Greenwood, 2004).
43 S. Khagram, Dams & Development: Transnational Struggles for Water and Power, Ithaca: Cornell Press, 2004).
44 The research question, “What factors explain the (relatively) recent proliferation of public interest groups?” is addressed in, A. Nownes and G. Neely, Toward an Explanation for Public Interest Group Formation and Proliferation: “Seed Money, Disturbances, Entrepreneurship, and Patronage,” Policy Studies Journal, 24/1, (1996): 74-92.
45 H. Helco, “Issue Networks and the Executive Establishment,” in The New American Political System, ed. A. King (Washington D.C.: American Enterprise Institute, 1978, pg. 102).
46 J. Madison, “The Federalist No. 10: The Utility of the Union as a Safeguard against Domestic Faction and Insurrection,” The Daily Advertiser, 22 November 1787, < http://www.constitution.org/fed/federa10.htm>.
47 See, for example: R.A. Dahl, Who Governs? (New Haven: Yale University Press, 1961) and R.A. Dahl, Dilemmas of Pluralist Democracy: Autonomy vs. Control (New Haven: Yale University Press, 1982).
48 M. Olson, The Logic of Collective Action: Public Goods and the Theory of Groups, (Cambridge, Mass.: Harvard University Press, 1971).
49 M. Cohen, J. March, and J. Olsen, "A Garbage Can Model of Organizational Choice," Administrative Science Quarterly, 17/1 (March, 1972), 1-25.
50 For the 600,000 word critique see: R. Caro, The Power Broker, (New York, NY: Alfred Knopf Inc.,
1975) and for the 3,500 word rebuttal, see: R. Moses, “Comment on a New Yorker Profile and Biography”, Public Statement, 26 Aug 1974,
51 Khagram, op. cit. 52 Mendel, E. “Public Works Bonds Approved”, The San Diego Union-Tribune, November 8, 2006. See:
<http://www.signonsandiego.com/uniontrib/20061108/news_7n8props.html> 53 There are also bonds classified as revenue bonds that are backed by specific revenues, specific sales tax,
gas tax, and so on—California does not issue bonds backed by gas tax, but many other states do. 54 Based on conversation with Fred Klass, Director of Finance, Office of the Governor, Jan. 2, 2008. 55 Buechner, W., “History of the Gasoline Tax,” American Road and Transportation Builders Association,
(2008), <http://www.artba.org/economics_research/reports/gas_tax_history.htm>. 56 Miller, J., “Infrastructure 2008: A Competitive Advantage”, Ernst and Young and Urban Land Institute,
(2008), <http://www.marketwire.com/mw/release.do?id=849759>. 57 Peters, M. “The folly of higher gas taxes.” The Washington Post, (August, 2007), pg. A15. 58 U.S. Bureau of Labor Statistics, Producer Price Index for Highway and Street Construction. 59 See Bay Area Toll Authority website: "BATA administers, programs and allocates revenues from
all tolls levied on the seven state-owned toll bridges: Antioch, Benicia-Martinez, Carquinez, Dumbarton, Richmond-San Rafael, San Francisco-Oakland Bay and San Mateo-Hayward. As part of these activities, BATA funds the day-to-day operations, facilities maintenance, and administration of the bridges. BATA also funds the long-term capital improvement and rehabilitation of the bridges, including the projects mandated by Regional Measure 1 (RM 1) and the Toll Bridge Seismic Retrofit Program." <http://bata.mtc.ca.gov/about.htm>

DRAFT #8. FOR DISCUSSION PURPOSES ONLY. FEEDBACK INCORPORATED FROM CALTRANS,
GOVERNOR’S OFFICE, TREASURER’S OFFICE, KPMG, etc. DO NOT CITE OR DISTRIBUTE.
52
60 D. Schrank and T. Lomax, “Urban Mobility Study,” Texas Transportation Institute (2005),
<http://mobility.tamu.edu/ums>. 61 H. Levinson, “Freeway Congestion Pricing: Another Look,” TRR 1450, (1995): 8-12. 62 See generally Chapter 3 of “Transportation Cost and Benefit Analysis: Techniques, Estimates and
Implication,” Victoria Transport Policy Institute, (2006), <http://www.vtpi.org/tca/> 63 For guidelines on implementing congestion pricing, see: E. Deakin and G. Harvey, “The STEP Analysis
Package: Description and Application Examples,” Appendix B in USEPA, Technical Methods for Analyzing Pricing Measures to Reduce Transportation Emissions, USEPA Report #231-R-98-006, (1998), <www.epa.gov/clariton>; Also, T. Hau, “Economic Fundamentals of Road Pricing,” Working Paper, World Bank (1992), <www.worldbank.org>; Also, P. Goodwin, “The Economic Cost of Congestion when Road Capacity is Constrained: Lessons from Congestion Charging in London,” 16th International Symposium on Theory and Practice in Transport Economics, (2003), <www1.oecd.org/cem>.
64 Texas Transport Institute Database, <http://mobility.tamu.edu/>. 65 Texas Transport Institute Database, <http://mobility.tamu.edu/>. 66 J. Corless, “Beyond Gridlock: Meeting California’s Transportation Needs in the Twenty-First Century,”
The Surface Transportation Policy Project, (2000): 1-35; <http://www.transact.org/ca>. 67 See for example: D. King, M. Manville and D. Shoup, “The political calculus of congestion pricing,”
Transport Policy 14 (2007), 111-123; Also, B.D. Taylor, “Rethinking Traffic Congestion”, Access, Number 21, University of California Transportation Center Fall (2002), p. 8-16, <www.uctc.net>; Also, K.A. Small, C. Winston and C.A. Evans, “Road Work: A New Highway Pricing and Investment Policy.” The Brookings Institution, (1989); Also, A. Downs, “Stuck in Traffic: Coping with Peak-Hour Traffic Congestion,” The Brookings Institution, (1992).
68 Some studies have presented empirical evidence supporting the “induced demand” concept, eg. P. Parthasarathi , “Induced Demand: A Microscopic Perspective”, Urban Studies, 40/7 (2003) 1335-1351. Other studies do not find conclusive evidence, eg. P. Mokhtarian, F.J. Samaniego, R.H. Shumway, and N.H. Willits, “Revisiting the notion of induced traffic through a matched-pairs study”, Transportation, 29/2 (2002) 193-220. For a review of this concept, see; U.S. Federal Highway Admin, < http://www.fhwa.dot.gov/planning/itfaq.htm>.
69 U.S. DOT Strategic Plan, Fiscal Years 2006-2011, <http://www.dot.gov/stratplan2011/index.htm>. 70 American Association of Port Authorities, Port Industry Statistics, <http://www.aapa-
ports.org/Industry/content.cfm?ItemNumber=900&navItemNumber=551>. 71 TEU = 20 foot equivalent units; the standard unit of measurement in the global shipping industry. 72 B. Mongelluzzo, “LA–Long Beach Volume Overwhelms Inland Traffic,” The Journal of Commerce,
6 Dec 2004. 73 J.R. Njord, and M.D. Meyer, “Critical Issues in Transportation,” Transportation Research Board of the
National Academies, 20 Jan (2006), <http://onlinepubs.trb.org/onlinepubs/general/CriticalIssues06.pdf>. 74
Capital projects that offer net social, economic, and environmental benefits to society should be undertaken. If such projects are not being undertaken, then there is a failure within the system of government. Yet, streamlining the process of “project approvals” is not a simple matter and probably requires deeper governmental change and constitutional reform, which lies beyond the scope of the present analysis. Also refer to endnotes 45 and 83.
75 J. Antle, “Infrastructure and aggregate agricultural productivity: International evidence,” Economic Dev’t and Cultural Change 31, (1983); Also, C. Kessides, “The Contributions of Infrastructure to Economic Dev’t: A Review of Experience and Policy Implications,” World Bank Discussion Paper #213, (1993); See also, B. Sanchez-Robles, “Infrastructure investment and growth: Some empirical evidence.” Contemporary Economic Policy (1998) 16, 98-108.

DRAFT #8. FOR DISCUSSION PURPOSES ONLY. FEEDBACK INCORPORATED FROM CALTRANS,
GOVERNOR’S OFFICE, TREASURER’S OFFICE, KPMG, etc. DO NOT CITE OR DISTRIBUTE.
53
76 World Bank, World Development Report 1994: infrastructure for development. (New York: Oxford
University Press, 1994). 77 D. Canning and E. Bennathan, “The Social Rate of Return on Infrastructure Investments.” Part of a
World Bank research project “Infrastructure and Growth: A Multicountry Panel Study” (RPO 680-89), sponsored by the Public Economics Division of the Development Research Group and by the Transport, Water, and Urban Development Department (2005).
78 World Bank, World Development Report 1994: infrastructure for development. (New York: Oxford University Press, 1994, p. 17).
79 K. Button, “Infrastructure investment, endogenous growth and economic convergence. The Annals of Regional Science, 32 (1998): 145-162. Also P.M. Romer, “Increasing Returns and Long-Run Growth,” Journal of Political Economy, 1986, 94(5), 1002-37.
80 D. Canning and P. Pedroni, “The Effect of Infrastructure on Long Run Economic Growth,” Working paper, (2004).
81 Canning and Bennathan, op. cit. 82 P.R. Agénor, M.K. Nabli and T.M. Yousef, “Public Infrastructure and Private Investment in the Middle
East and North Africa,” World Bank Policy Research Working Paper No. 3661, July (2005). 83 Canning and Bennathan, op. cit. 84 K. Komives, D. Whittington and X. Wu, “Infrastructure Coverage and the Poor: A Global Perspective,”
World Bank Policy Research Working Paper No. 2551, (2001); Also, J.L. Guasch, Granting and Renegotiating Infrastructure Concessions: Doing it Right, (Washington, D.C.: The World Bank, 2004).
85 World Investment Prospects to 2011, co-written by Columbia Program on International Investment and the EIU, (2007) < http://www.cpii.columbia.edu/pubs/documents/WorldInvestmentProspectsto2011.pdf>, provides evidence that with globalization the handful of states with the best business environments attract a disproportionate share of the world’s capital. The report shows that in 2006, across a panel of 80+ countries, fewer than 10 countries attracted more than 50% of the FDI inflows and that two-thirds of the variation in FDI inflows across all countries was explained by two factors: the business environment score and the size of the market (pg. 60). The business environment score consists of an aggregation of more than 100 factors across 10 key areas (political environment, macroeconomic environment, market opportunities, policy towards private enterprise and competition, policy towards foreign investment, foreign trade and exchange controls, taxes, financing, labor market, and infrastructure). This leads us to the conclusion that California, being the world’s fifth largest market, has an opportunity to absorb an increasingly disproportionate share of the world’s FDI inflows, so long as it can continue to offer an attractive business environment, of which infrastructure could well be a gating factor.
86 The Asian Development Bank has estimated that with continued peace Asia’s share of global GDP could climb up to 40% by 2020-25. The IMF has estimated that the Asian share of the world economy could be as high as 45% by 2030. See also, P. Dicken, Global Shift, (London: Sage, 2007).
87 The Challenge of Mexico’s Ports, 2nd Annual Port Technologies Conference, Mario Cordero, July 31 (2007). <http://www.polb.com/civica/filebank/blobdload.asp?BlobID=4312>
88 One of the participants at the Stanford Workshop noted having sat-in on meetings in China in the past three months where “top 10” Chinese companies and government agencies expressed grave concerns about the present capacity and efficiency of California’s transportation infrastructure and suggested that Washington, Canada, and Mexico may offer more robust transportation nodes to support expected future volumes of Chinese exports.
89 UK Treasury Taskforce, “Value for Money Drivers in the Private Finance Initiative,” A Report by Arthur
Andersen and Enterprise LSE, (2000): 1-58 ; specifically, see pg. 51, which compares actual cost data from UK PPP projects versus net present cost of public sector comparator and reports mean estimated cost savings for a sample of 29 projects at 16.9% (with standard deviation of 14%). The high standard deviation is explained by a non-normal

DRAFT #8. FOR DISCUSSION PURPOSES ONLY. FEEDBACK INCORPORATED FROM CALTRANS,
GOVERNOR’S OFFICE, TREASURER’S OFFICE, KPMG, etc. DO NOT CITE OR DISTRIBUTE.
54
distribution with long right-side tail (three of 29 projects have 40%+ costs savings over the public sector comparator).
90 The TIFIA and PABs programs offered at the Federal level provide this advantage as well.
91 This definition follows closely from one published by the European Union of public-private partnerships, which is one of the few clearly articulated definitions of the PPP concept that we have come across.
92 The distinction between approving new projects and approving private sector participation in projects that already have necessary State permits, approvals and entitlements under existing legislation is subtle yet important. In order to approve new projects, it is necessary to make difficult trade-offs between the triple-bottom line imperatives of economic return, social equity and environmental preservation. These kinds of decisions require complex governance to avoid situations where one of the imperatives unjustly trumps the others; and they are complicated by interest groups and problems of weak government noted earlier in this paper. Furthermore, the governance arrangements for making these trade-offs in California have long been established, and although the process of getting new projects of State-level importance approved is slow, inefficient, and less than ideal (many would argue that the environmental imperative now trumps the economic imperative), the task of re-designing the governance of the approval of new projects would be hefty. For the purpose of enabling broader private participation in projects, it is not necessary to open this Pandora ‘s Box; it is not necessary to reform the existing State rules and regulations for the approval of new projects. If a process of reform were to be undertaken to streamline the process of prioritizing and approving new projects that represent net economic, social and environmental value to the State, it would necessarily involve discussions with a great many state (i.e. CTC, DWR, PWB, UC, CSU, State Allocation Board, OSHPD) and local governments (i.e. cities, counties, school districts) that have expertise in their respective areas (roads, water, etc.), who are in a favorable position to evaluate and plan new projects, and who would be effected by such reform.
93 For more information on PPP Coordination Agencies, see: “Public-Private Partnership Units: Lessons for
their Design and Use in Infrastructure,” (Washington, D.C.: PPIAF and World Bank, October, 2007, 1-96). 94
Maintenance reserves are not necessarily cost effective or appropriate in many cases. On an NPV basis they serve to increase project costs. The real issue here is to actually do the maintenance when needed.
95 For example, a performance specification that provided a private operator of a roadway with a monetary
bonus based on air quality, might over a 10 year period incentivize that operator to innovate and figure out how to install low-cost air-cleaners in the median. Innovation potential is unlimited with the right incentives in place to align the entrepreneurial spirit of the private sector with taxpayer goals and desires.
96 H. Demsetz, “Why Regulate Utilities?” Journal of Law and Economics, 11 (1968). 97 Guasch, op. cit. 98
R. Orr, “Living Agreements for a Risky World,” Harvard Business Review, April (2006). 99 A proposal worthy of further study involves allocating a percentage of revenues from sales of carbon
credits to general infrastructure renewal. California recently adopted a State policy that will return the State to 1990 in terms of permissible carbon emissions. If the State were to implement this program by auctioning carbon credits (auction is not the only scheme being discussed), the projected revenues could be 5% of GDP in coming years—a windfall that could go a long way toward rebuilding and expanding the State’s infrastructure. Furthermore, it is possible some projects could help reduce greenhouse emissions in the State and count toward State commitments to their reduction, allowing other projects to buy the credits generated if and when the State institutes a cap and trade system.
100 L. Goulder, “Environmental Taxation and the ‘Double Dividend’: A Reader’s Guide” (1994-10-01).
NBER Working Paper No. W4896. Available at SSRN, <http://ssrn.com/abstract=227957> 101 Recommendations based on discussions with U.S. Assistant Secretary of Transportation Tyler Duvall,
November 6, 2007.

DRAFT #8. FOR DISCUSSION PURPOSES ONLY. FEEDBACK INCORPORATED FROM CALTRANS,
GOVERNOR’S OFFICE, TREASURER’S OFFICE, KPMG, etc. DO NOT CITE OR DISTRIBUTE.
55
102 Generally, approval ratings of HOT lanes for low-income groups have been not very different than for
high income groups -- about 60-70% for, 25-30% opposed. For example, see the page 75 of 228 of the PDF version of San Diego Association of Government’s report available at, <http://fastrak.sandag.org/pdfs/concept_plan_vol2.pdf>.
103 D. Neumark, “California’s Economic Future and Infrastructure Challenges,” Occasional Paper Series of the Public Policy Institute of California, June (2005).
104 Further analysis would be necessary to determine whether an intermodal freight corridor would best be
designed as a roadway, a railway, or a combined corridor with both functions. 105
A State-wide roll-out of wireless technology comes with the danger of technological obsolescence given the pace of technological innovation in this sector. Further analysis would be necessary to weigh costs and benefits. Also, federal legislation would need to be studied closely; the FCC is presently contemplating the creation of four new national wireless carriers that would have network neutrality.