Features Exploring the ONSTAT Utility - Advanced … · Exploring the ONSTAT Utility Provided with...
23
Exploring the ONSTAT Utility Provided with Informix Dynamic Server is a set of powerful command- line utilities that enable the monitoring, tuning, and configuring of the database server. This article focuses on one of these utilities, ONSTAT, and presents ways to use this utility for server performance optimization. ONSTAT is the command-line utility which is most widely used. ONSTAT reads OnLines shared memory structures and provides much useful information about the state of a server. The utility does not place locks on the shared memory structure and uses very little overhead, so it can be used at any time. It is important to keep in mind that the information is current at the time the command is issued, and that data can change after issuing the command. More options are available for ONSTAT than for any other Informix utility. Many options are debugging parameters, which are not well-documented and easily understood by the average database administrator (DBA). ONSTAT also provides many useful options for managing the server. This article will focus on the more useful of these options. For a complete list of the syntax and options, refer to Table 1. In Informix Dynamic Server, the ONSTAT command has been greatly enhanced with a new set of monitoring and debugging options. These options begin with -g and are listed in Table 2. ONSTAT Introduction 87 Technical Features by Lester Knutsen
Transcript of Features Exploring the ONSTAT Utility - Advanced … · Exploring the ONSTAT Utility Provided with...
Exploring the ONSTAT Utility
Provided with Informix Dynamic Server is a set of powerful command-line utilities that enable the monitoring, tuning, and configuring of thedatabase server. This article focuses on one of these utilities, ONSTAT,and presents ways to use this utility for server performance optimization.
ONSTAT is the command-line utility which is most widely used. ONSTATreads OnLineÕs shared memory structures and provides much usefulinformation about the state of a server. The utility does not place lockson the shared memory structure and uses very little overhead, so it can be used at any time. It is important to keep in mind that the information iscurrent at the time the command is issued, and that data can change afterissuing the command.
More options are available for ONSTAT than for any other Informix utility.Many options are debugging parameters, which are not well-documentedand easily understood by the average database administrator (DBA).ONSTAT also provides many useful options for managing the server.This article will focus on the more useful of these options. For a completelist of the syntax and options, refer to Table 1. In Informix DynamicServer, the ONSTAT command has been greatly enhanced with a new setof monitoring and debugging options. These options begin with -g andare listed in Table 2.
ONSTAT
Introduction
87
Technical
Features
by Lester Knutsen

88
Exploring the ONSTAT Utility
Table 1: ONSTAT syntax and options.
onstat [ÐabcdfghklmpstuxzBCDFRX][ÐI][Ðr seconds][Ðo file][infile]
Print all informationPrint buffersPrint configuration filePrint DBspaces and chunksPrint dataskip statusNew Monitoring subcommands (default: all). See Figure 2 for all optionsInteractive modePrint locksPrint loggingPrint message logPrint profilePrint latchesPrint TBLspacesPrint user threadsPrint transactionsZero profile countsPrint all buffersPrint btree cleaner requestsPrint DBspaces and detailed chunk statsPrint page flushersPrint LRU queuesPrint entire list of sharers and waiters for buffersRepeat options every n seconds (default: 5)Put shared memory into specified file (default: onstat.out)Use infile to obtain shared memory informationDisplays OnLine mode
Ða�Ðb�Ðc�Ðd�Ðf�Ðg�Ði�Ðk�Ðl�Ðm�Ðp�Ðs�Ðt�Ðu�Ðx�Ðz�ÐB�ÐC�ÐD�ÐF�ÐR�ÐX�Ðr�Ðo�infile�Ð
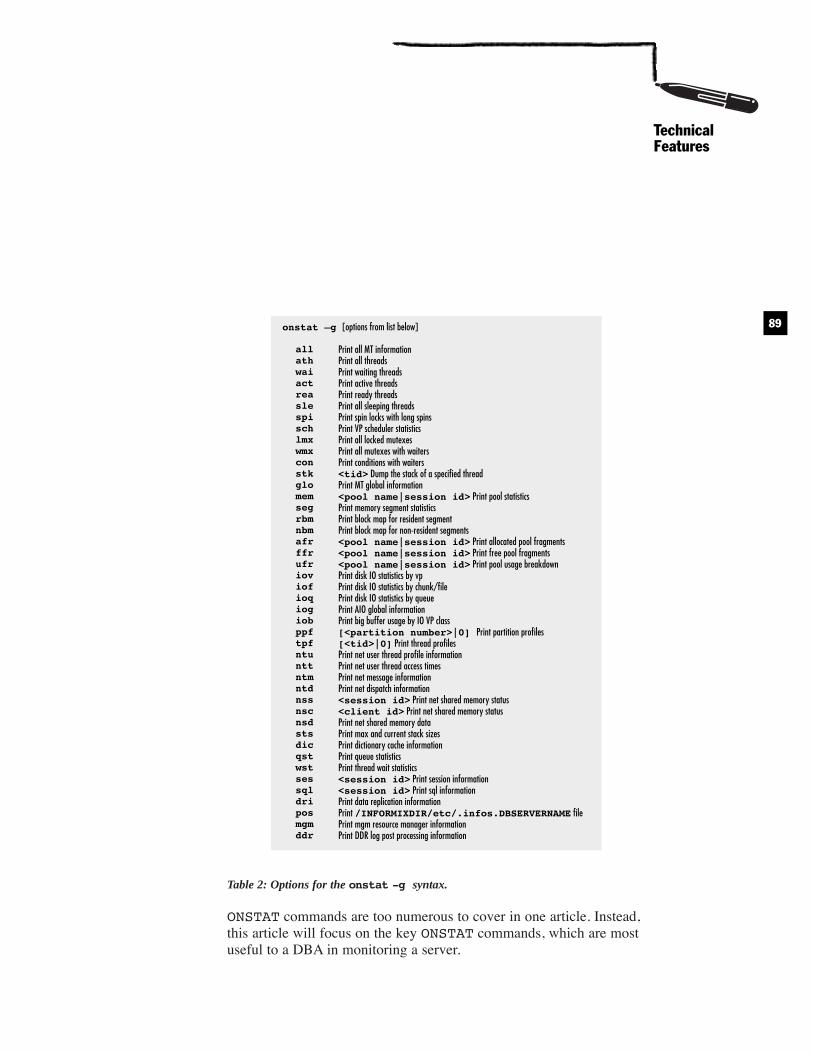
Table 2: Options for the onstat -g syntax.
ONSTAT commands are too numerous to cover in one article. Instead,this article will focus on the key ONSTAT commands, which are mostuseful to a DBA in monitoring a server.
onstat Ðg [options from list below]
Print all MT informationPrint all threadsPrint waiting threadsPrint active threadsPrint ready threadsPrint all sleeping threadsPrint spin locks with long spinsPrint VP scheduler statisticsPrint all locked mutexesPrint all mutexes with waitersPrint conditions with waiters<tid> Dump the stack of a specified threadPrint MT global information<pool name|session id> Print pool statisticsPrint memory segment statisticsPrint block map for resident segmentPrint block map for non-resident segments<pool name|session id> Print allocated pool fragments<pool name|session id> Print free pool fragments<pool name|session id> Print pool usage breakdownPrint disk IO statistics by vpPrint disk IO statistics by chunk/filePrint disk IO statistics by queuePrint AIO global informationPrint big buffer usage by IO VP class[<partition number>|0] Print partition profiles[<tid>|0] Print thread profilesPrint net user thread profile informationPrint net user thread access timesPrint net message informationPrint net dispatch information<session id> Print net shared memory status<client id> Print net shared memory statusPrint net shared memory dataPrint max and current stack sizesPrint dictionary cache informationPrint queue statisticsPrint thread wait statistics<session id> Print session information<session id> Print sql informationPrint data replication informationPrint /INFORMIXDIR/etc/.infos.DBSERVERNAME filePrint mgm resource manager informationPrint DDR log post processing information
all�ath�wai�act�rea�sle�spi�sch�lmx�wmx�con�stk�glo�mem�seg�rbm�nbm�afr�ffr�ufr�iov�iof�ioq�iog�iob�ppf�tpf�ntu�ntt�ntm�ntd�nss�nsc�nsd�sts�dic�qst�wst�ses�sql�dri�pos�mgm�ddr
89
TechnicalFeatures

90
Exploring the ONSTAT Utility
The onstat - command prints out a one-line message indicating thecurrent status of a server. Figure 1 provides a sample output:
Figure 1: The onstat - command provides current status.
The onstat - command displays the version number of InformixDynamic Server, the mode that the server is in, how long it has been upand running, and how much memory it is using. If the server was down, an error message may result which indicates that Òshared memory is notinitialized,Ó as in Figure 2.
Figure 2: Current status when the server is down.
lester@merlin >onstat -��shared memory not initialized for INFORMIXSERVER 'merlindb713'�lester@merlin >
lester@merlin >onstat -��INFORMIX-OnLine Version 7.23.UC1 -- On-Line --�Up 7 days 11:54:44 -- 10656 Kbytes
Current Status of the Server:onstat -

The -p option displays the basic I/O and performance profile of a system.Figure 3 provides a sample output. These statistics are current as of thelast time that the server was rebooted, or the time at which the statisticswere last reset with the onstat -z option.
Figure 3: The onstat -p command provides a server profile.
lester@merlin >onstat -p��INFORMIX-OnLine Version 7.23.UC1 -- On-Line -- Up 7 days 12:03:37 -- �10656 Kbytes��Profile�dskreads pagreads bufreads %cached dskwrits pagwrits bufwrits %cached�215537 2098656 5208789 95.86 178116 179527 2883605 93.82��isamtot open start read write rewrite delete commit rollbk�6955097 2172 2858 2312158 2305564 129 43 22238 0��ovlock ovuserthread ovbuff usercpu syscpu numckpts flushes�0 0 168 6625.92 722.70 35 4320��bufwaits lokwaits lockreqs deadlks dltouts ckpwaits compress seqscans�440 0 2331106 0 0 29 5 66��ixda-RA� idx-RA da-RA RA-pgsused lchwaits�836 0 16 833 36
Database Server Profile:onstat -p
91
TechnicalFeatures
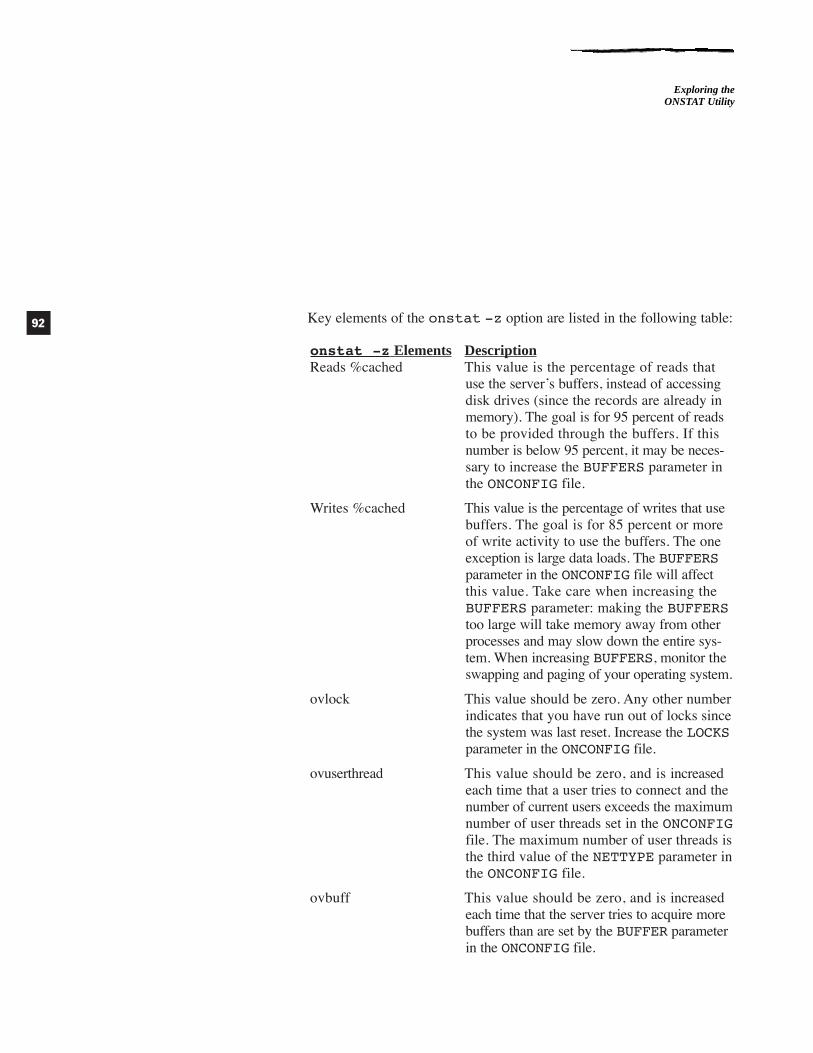
Key elements of the onstat -z option are listed in the following table:
onstat -z Elements DescriptionReads %cached This value is the percentage of reads that
use the serverÕs buffers, instead of accessingdisk drives (since the records are already inmemory). The goal is for 95 percent of readsto be provided through the buffers. If thisnumber is below 95 percent, it may be neces-sary to increase the BUFFERS parameter inthe ONCONFIG file.
Writes %cached This value is the percentage of writes that usebuffers. The goal is for 85 percent or more of write activity to use the buffers. The oneexception is large data loads. The BUFFERSparameter in the ONCONFIG file will affectthis value. Take care when increasing theBUFFERS parameter: making the BUFFERStoo large will take memory away from otherprocesses and may slow down the entire sys-tem. When increasing BUFFERS, monitor theswapping and paging of your operating system.
ovlock This value should be zero. Any other numberindicates that you have run out of locks sincethe system was last reset. Increase the LOCKSparameter in the ONCONFIG file.
ovuserthread This value should be zero, and is increasedeach time that a user tries to connect and thenumber of current users exceeds the maximumnumber of user threads set in the ONCONFIGfile. The maximum number of user threads isthe third value of the NETTYPE parameter inthe ONCONFIG file.
ovbuff This value should be zero, and is increasedeach time that the server tries to acquire morebuffers than are set by the BUFFER parameterin the ONCONFIG file.
92
Exploring the ONSTAT Utility

bufwaits This value should be zero, and indicates thenumber of times that a user thread has waitedfor a BUFFER.
lokwaits This value should be zero, and indicates thenumber of times that a user thread has waitedfor a LOCK.
deadlks This value should be zero, and indicates thenumber of times that a deadlock was detectedand prevented.
dltouts This value should be zero, and indicates thenumber of times that a distributed deadlockwas detected.
Table 3: Key elements of the onstat -z option.
The onstat -m option displays the last lines of the serverÕs messagelog, refer to Figure 4. This is the message file that contains all messagesabout the server, and is a key system component to monitor. Figure 4provides an example. Use this option to view the last 20 messages in the log file.
Figure 4: Using the onstat -m to display the message log file.
lester@merlin >onstat -m��INFORMIX-OnLine Version 7.23.UC1 -- On-Line -- Up 7 days 12:41:12 -- �10656 Kbytes��Message Log File: /u3 / informix7 / online1.log�21:05:15 Checkpoint Completed: duration was 8 seconds.�21:05:43 Checkpoint Completed: duration was 6 seconds.�21:10:58 Checkpoint Completed: duration was 7 seconds.�21:16:06 Checkpoint Completed: duration was 7 seconds.�21:21:13 Checkpoint Completed: duration was 7 seconds.�21:26:20 Checkpoint Completed: duration was 7 seconds.�21:31:28 Checkpoint Completed: duration was 7 seconds.�21:36:36 Checkpoint Completed: duration was 8 seconds.�21:41:43 Checkpoint Completed: duration was 7 seconds.�21:46:51 Checkpoint Completed: duration was 8 seconds.�21:52:00 Checkpoint Completed: duration was 9 seconds.�21:57:09 Checkpoint Completed: duration was 8 seconds.�22:00:42 Logical Log 20 Complete.�22:00:43 Process exited with return code 1: /bin/sh /bin/sh -c�/u3/informix7/lo�g_full.sh 2 23 "Logical Log 20 Complete." "Logical Log 20 Complete."�22:02:17 Checkpoint Completed: duration was 8 seconds.
Display MessageLog File: onstat -m
93
TechnicalFeatures

It may be helpful to keep the DBAÕs log file always on display in ascreen window. To do this, use the UNIX tail command with the -f option. This command continually reads the last lines of a file as the lines are appended. On my system, I run the following command tocontinually monitor this log:
tail -f $INFORMIXDIR/online.log
The ONSTAT option used to monitor user activity is -u. Figure 5 providesa sample of output from this command. The key field is sessid andidentifies the userÕs session ID, which the server uses to track the userinternally. This is the number used to kill a specific userÕs session. Formore information, refer to the onmode -z command.
Figure 5: The onstat -u option provides user status.
lester@merlin >onstat -u��INFORMIX-OnLine Version 7.23.UC1 -- On-Line -- Up 7 days 12:52:40 -- �10656 Kbytes��Userthreads�address flags sessid user tty wait tout locks nreads nwrites�a2d0018 ---P--D 1 informix - 0 0 0 84 250�a2d0458 ---P--F 0 informix - 0 0 0 0 177701�a2d0898 ---P--B 8 informix - 0 0 0 0 0�a2d1558 ---P--D 12 informix - 0 0 0 0 0�a2d2218 Y--P--- 264 lester 4 a35f190 0 1 35063 14836� 5 active, 128 total, 17 maximum concurrent
User Status:onstat -u
Note94
Exploring the ONSTAT Utility

The ÒflagsÓ column provides an indication of user activity. Followingare the critical flags, based on their position within the flag field:
Flags in position 1 DescriptionB Waiting on a bufferC Waiting on a checkpointG Waiting on a logical log buffer writeL Waiting on a lockS Waiting on a mutexT Waiting on a transactionY Waiting on a conditionX Waiting on a transaction rollback
Flags in position 2 Description* Transaction active during I/O error
Flags in position 3 DescriptionA Dbspace backup threadB Begin workP Prepared for commit workX TP/XA prepared for commit workC Committing workR Rolling back workH Heuristically rolling back work
Flags in position 4 DescriptionP Primary thread for a session
Flags in position 5 DescriptionR Reading callX Transaction is committing
Flags in position 6 DescriptionNone
Flags in position 7 DescriptionB B+Tree cleaner threadC Cleanup of terminated userD Daemon threadF Page flusher threadM ON-Monitor user thread
Table 4: Flags and their position within the flag field.
95
TechnicalFeatures

The -l option of ONSTAT displays the current status of the logical logs.Figure 6 provides a sample display. One problem with this display isthat it does not indicate which logs are ready for reuse. In versions 5.x of INFORMIX-OnLine, as soon as a log was backed up and had no opentransactions, it was marked as free with an ÒFÓ in the flags column. Inversions 7.x of Informix Dynamic Server, logs are not marked as free untiljust before their reuse. One way to use ONSTAT to indicate which logscan be reused is to use onstat -l with onstat -x to display allactive sessions.
Figure 6: Theonstat -l command indicates the logical logs’ status.
Physical Logging�Buffer bufused bufsize numpages numwrits pages/io�P-1 0 16 236 60 3.93� phybegin physize phypos phyused %used� 10003f 1000 967 0 0.00��Logical Logging�Buffer bufused bufsize numrecs numpages numwrits recs/pages pages/io�L-3 0 16 90303 1522 275 59.3 5.5��address number flags uniqid begin size used %used�a1ee3e4 1 U-B---- 13 100427 500 500 100.00�a1ee400 2 U-B---- 14 10061b 500 500 100.00�a1ee41c 3 U-B---- 15 10080f 500 500 100.00�a1ee438 4 U-B---- 16 100a03 500 500 100.00�a1ee454 5 U-B---- 17 100bf7 500 432 84.40�a1ee470 6 U-B---- 18 100deb 500 500 100.00�a1ee48c 7 U-B---- 19 100fdf 500 500 100.00�a1ee4a8 8 U-B---- 20 1011d3 500 500 100.00�a1ee4c4 9 U---C-L 21 1013c7 500 23 4.60�a1ee4e0 10 U-B---- 10 1015bb 500 500 100.00�a1ee4fc 11 U-B---- 11 1017af 500 500 100.00�a1ee518 12 U-B---- 12 1019a3 500 500 100.00
Logical Logs Status:onstat -l
96
Exploring the ONSTAT Utility

The flags column provides status information about each log, as follows:
Flag DescriptionA Newly added: must run an archive before use
B Backed up to tape or Ò/dev/nullÓ
C Current logical log file
F Free and available for use. You will rarely seethis flag, as logs are not marked as free untilthey are needed
L Last checkpoint is in this logical log
U Used logical log: it may be free if it is backedup and contains no active transactions
Table 5: Flags for onstat -l.
The onstat -x option displays all current transactions. The most usefulcolumn is Òlog begin.Ó This option can provide information about thelogical log in which a transaction is started, and the option can be usedwith the onstat -l command to determine which logs are free and forreuse. To find out which logical log has the earliest active transaction,locate the earliest logical log number in the Òlog beginÓ column. Anylogical logs that are backed up before the log with the earliest transac-tion will be automatically reused by the server.
Figure 7: The onstat -x option provides a status of transactions.
lester@merlin >onstat -x��INFORMIX-OnLine Version 7.23.UC1 -- On-Line -- Up 01:21:38 -- 10656 Kbytes��Transactions�address flags userthread locks log begin isolation retrys coordinator�a2f4018 A---- a2d0018 0 0 COMMIT 0�a2f413c A---- a2d0458 0 0 COMMIT 0�a2f4260 A---- a2d0898 0 0 COMMIT 0�a2f4384 A---- a2d1118 0 0 NOTRANS 0�a2f44a8 A---- a2d1558 0 0 COMMIT 0�a2f45cc A-B-- a2d1118 2 21 NOTRANS 0� 6 active, 128 total, 7 maximum concurrent
DisplayTransactions:onstat -x
97
TechnicalFeatures
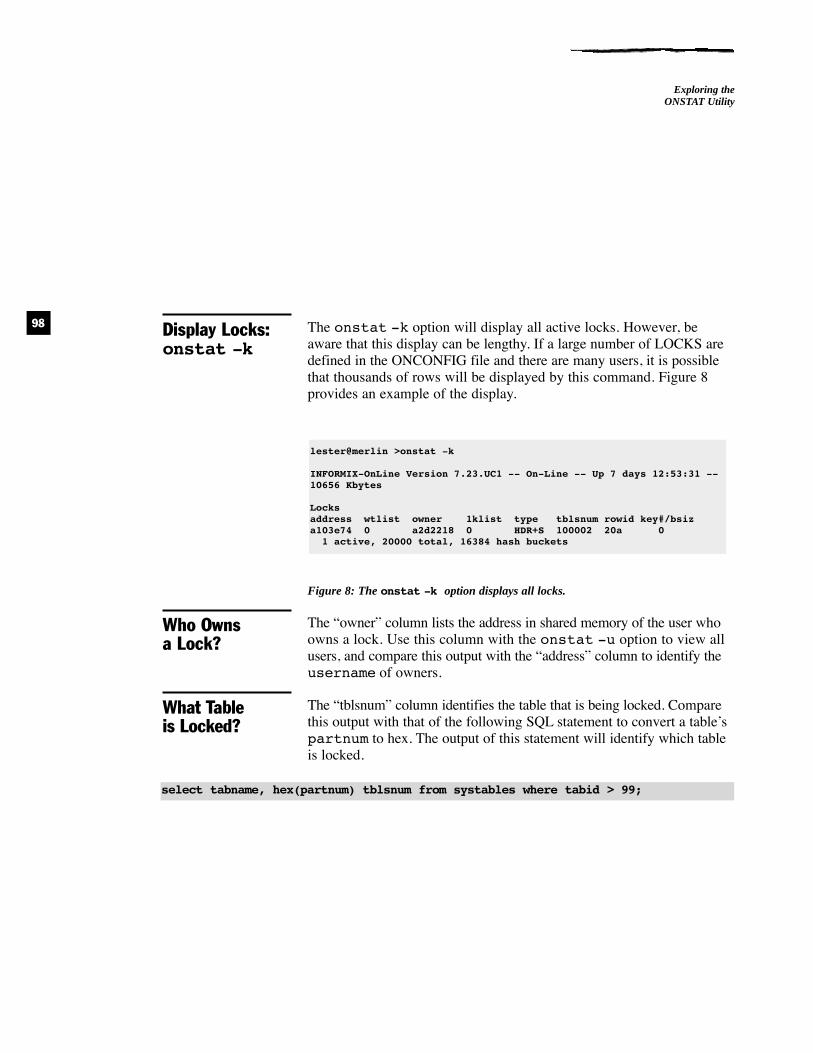
The onstat -k option will display all active locks. However, beaware that this display can be lengthy. If a large number of LOCKS aredefined in the ONCONFIG file and there are many users, it is possiblethat thousands of rows will be displayed by this command. Figure 8provides an example of the display.
Figure 8: The onstat -k option displays all locks.
The ÒownerÓ column lists the address in shared memory of the user whoowns a lock. Use this column with the onstat -u option to view allusers, and compare this output with the ÒaddressÓ column to identify theusername of owners.
The ÒtblsnumÓ column identifies the table that is being locked. Comparethis output with that of the following SQL statement to convert a tableÕspartnum to hex. The output of this statement will identify which tableis locked.
select tabname, hex(partnum) tblsnum from systables where tabid > 99;
What Table is Locked?
Who Owns a Lock?
lester@merlin >onstat -k��INFORMIX-OnLine Version 7.23.UC1 -- On-Line -- Up 7 days 12:53:31 -- �10656 Kbytes��Locks�address wtlist owner 1klist type tblsnum rowid key#/bsiz�a103e74 0 a2d2218 0 HDR+S 100002 20a 0� 1 active, 20000 total, 16384 hash buckets
Display Locks:onstat -k
98
Exploring the ONSTAT Utility

This SQL statement will also provide a list of tables and their associatedtblsnum to identify which table has a lock placed on it. Figure 9provides an example for identifying which table is locked.
Figure 9: Output to determine what table is locked.
The tblsnum 100002 indicates a database lock. Each user who opensa database will place a shared lock on the database.
1. Find a list of tblsnum��dbaccess database - <<EOF� select tabname, hex(partnum) tblsnum� from systables where tabid > 99;�EOF��database selected��tabname tblsnum�genjournal 0x0010009E�gjsum 0x0010009F��2. Find what is locked�onstat -k��INFORMIX-OnLine Version 7.23.UC1 -- On-Line -- Up 01:47:38 -- �10656 Kbytes��Locks�address wtlist owner 1klist type tblsnum rowid key#/bsiz�a103e44 0 a2d1118 a103de4 HDR+X 10009f 0 0� 3 active, 20000 total, 16384 hash buckets��3. Compare tblsnum from step 1 and step 2. This identifies the �table gjsum as the one that is locked.
99
TechnicalFeatures

Following is a list of the types of locks available and informationregarding the identification of locks:
Lock Type DescriptionDatabase Lock is placed on tablespace 1000002
Table Lock is placed on actual tablespace withrowid of 0
Page Lock is placed on tablespace withrowid ending in 00
Row Lock is placed on tablespace with actual rowid (not 00)
Byte Lock is placed on tablespace/pagewith size of bytes
Key Lock is placed on tablespace hex rowid(starting with f)
Table 6: Locks for onstat -k.
Following is a list of the lock flags in the ÒflagsÓ column of onstat -k:
Lock Flag DescriptionHDR Header
B Bytes lock
S Shared lock
X Exclusive
I Intent
U Update
IX Intent-exclusive
IS Intent-shared
SIX Shared, intent-exclusive
Table 7: Lock flags for onstat -k.
Lock-Type Flags
Types of Locks100
Exploring the ONSTAT Utility

The onstat -d command provides important information about thelayout of dbspaces and disk chunks, and the status of each chunk anddbspace. Print the output of this command and save it. If a restore mustbe performed, this output will be necessary. The output identifies eachdbspace and chunk needed to rebuild the system. Figure 10 contains anexample output.
Figure 10: The onstat -d output provides dbspaces and chunk status.
lester@merlin >onstat -d��INFORMIX-OnLine Version 7.23.UC1 -- On-Line -- Up 7 days 12:54:44 -- �10656 Kbytes��Dbspaces�address number flags fchunk nchunks flags owner name�a2ce100 1 1 1 1 N informix rootdbs�a2ce508 2 1 2 1 N informix dbspace1�a2ce578 3 1 3 1 N informix dbspace2�a2ce5e8 4 1 4 1 N informix dbspace3� 4 active, 2047 maximum��Chunks�address chk/dbs offset size free bpages flags pathname�a2ce170 1 1 0 250000 62047 PO- /u3/dev/rootdbs1�a2ce280 2 2 0 10000 9587 PO- /u3/dev/dbspace1�a2ce358 3 3 0 10000 9947 PO- /u3/dev/dbspace2�a2ce430 4 4 0 10000 9947 PO- /u3/dev/dbspace3� 4 active, 2047 maximum��
Dbspaces andChunks Status:onstat -d
101
TechnicalFeatures

The output of the onstat -d command also indicates how much freespace each chunk has, and the status of each chunk.
The ÒflagsÓ for Dbspaces are:
Position 1
M - Mirrored Dbspace
N - Not Mirrored Dbspace
Position 2
X - Newly mirrored
P - Physical recovery underway
L - Logical recovery underway
R - Recovery underway
Position 3
B - Blobspace
The ÒflagsÓ for Chunks are:
Position 1
P - Primary
M - Mirror
Position 2
O - On-line
D - Down
X - Newly mirrored
I - Inconsistent
Position 3
B - Blobspace
- - Dbspace
T - Temporary Dbspace
Table 8: Flags for onstat -d.
102
Exploring the ONSTAT Utility

The onstat -D option displays I/O by chunk. This option is very helpfulin performance tuning. The goal is to spread reads and writes evenlyacross all chunks. Figure 11 provides an example wherein one chunk isutilized for all I/O, and all other chunks are inactive. The I/O is not spreadout among chunks, which is not an effective use of disk space.
Figure 11: The onstat -D option displays the I/O utilization of dbspaces and chunks.
lester@merlin >onstat -D��INFORMIX-OnLine Version 7.23.UC1 -- On-Line -- Up 7 days 12:55:09 -- 10656 Kbytes��Dbspaces�address number flags fchunk nchunks flags owner name�a2ce100 1 1 1 1 N informix rootdbs�a2ce508 2 1 2 1 N informix dbspace1�a2ce578 3 1 3 1 N informix dbspace2�a2ce5e8 4 1 4 1 N informix dbspace3� 4 active, 2047 maximum��Chunks�address chk/dbs offset page Rd page Wr pathname�a2ce170 1 1 0 36563 179558 /u3/dev/rootdbs1�a2ce280 2 2 0 3 0 /u3/dev/dbspace1�a2ce358 3 3 0 2 0 /u3/dev/dbspace2�a2ce430 4 4 0 2 0 /u3/dev/dbspace3� 4 active, 2047 maximum��
Dbspaces andChunks I/O:onstat -D
103
TechnicalFeatures
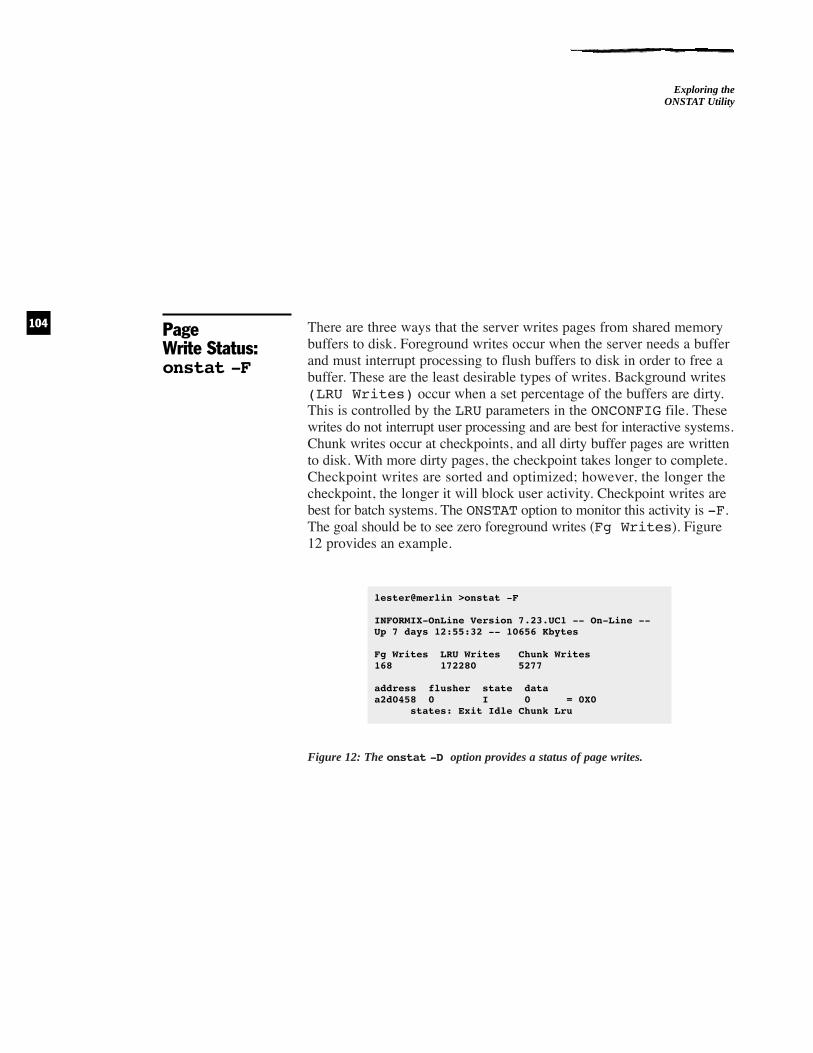
There are three ways that the server writes pages from shared memorybuffers to disk. Foreground writes occur when the server needs a bufferand must interrupt processing to flush buffers to disk in order to free abuffer. These are the least desirable types of writes. Background writes(LRU Writes) occur when a set percentage of the buffers are dirty.This is controlled by the LRU parameters in the ONCONFIG file. Thesewrites do not interrupt user processing and are best for interactive systems.Chunk writes occur at checkpoints, and all dirty buffer pages are writtento disk. With more dirty pages, the checkpoint takes longer to complete.Checkpoint writes are sorted and optimized; however, the longer thecheckpoint, the longer it will block user activity. Checkpoint writes arebest for batch systems. The ONSTAT option to monitor this activity is -F.The goal should be to see zero foreground writes (Fg Writes). Figure12 provides an example.
Figure 12: The onstat -D option provides a status of page writes.
lester@merlin >onstat -F��INFORMIX-OnLine Version 7.23.UC1 -- On-Line -- �Up 7 days 12:55:32 -- 10656 Kbytes��Fg Writes LRU Writes Chunk Writes�168 172280 5277��address flusher state data�a2d0458 0 I 0 = 0X0� states: Exit Idle Chunk Lru
Page Write Status:onstat -F
104
Exploring the ONSTAT Utility

The -g commands are a new subset of commands available beginningwith versions 7.x of Informix Dynamic Server. Table 2 displays a list ofthe -g commands. This section will discuss some of these -g commands.
The onstat -g ath option lists all active threads. Figure 13 provides an example.
Figure 13: The onstat -g ath command lists all active threads.
INFORMIX-OnLine Version 7.23.UC1 -- On-Line -- Up 7 days 12:56:09 -- �10656 Kbytes��Threads�tid tcb rstcb prty status vp-class name�2 a336b70 0 2 sleeping(Forever) 3lio lio vp 0�3 a336dd0 0 2 sleeping(Forever) 4pio pio vp 0�4 a337088 0 2 sleeping(Forever) 5aio aio vp 0�5 a337340 0 2 sleeping(Forever) 6msc msc vp 0�6 a337af8 0 2 sleeping(Forever) 7aio aio vp 1�7 a337e00 a2d0018 4 sleeping(secs: 1) 1cpu main_loop()�8 a34ab48 0 2 running 1cpu sm_poll�9 a34b770 0 2 running 8tli tlitcppoll�10 a34bce0 0 2 sleeping(Forever) 1cpu sm_listen�11 a3c4a28 0 2 sleeping(secs: 2) 1cpu sm_discon�12 a3c4e58 0 3 sleeping(Forever) 1cpu tlitcplst�13 a3d0680 a2d0458 2 sleeping(Forever) 1cpu flush_sub(0)�14 a3d0e40 a2d0898 2 sleeping(secs: 8) 1cpu btclean�30 a35ea58 a2d1558 4 sleeping(secs: 1) 1cpu onmode_mon�283 a39ef38 a2d2218 2 cond wait (sm_read) 1cpu sqlexec
List all Threads:onstat -g ath
New Monitoringand DebuggingCommands(Informix DynamicServer, versions7.x): onstat -g
105
TechnicalFeatures

The onstat -g sch option provides a means to identify whichoninit UNIX process corresponds to which server virtual processor(VP). When performing a ps -ef command in UNIX, it is possibleto see many oninit processes running. Each one performs a specifictask for the database server. Use the UNIX ÒpidÓ column from ps -efto correlate a process to the ÒpidÓ column from onstat -g sch. Figure14 provides an example output of this command.
Figure 14: The onstat -g sch command provides the status of virtual processors.
lester@merlin >onstat -g sch��INFORMIX-OnLine Version 7.23.UC1 -- On-Line -- �Up 7 days 12:56:46 -- 10656 Kbytes��VP Scheduler Statistics:��vp pid class semops busy waits spins/wait�1 230 cpu 21 0 0�2 231 adm 0 0 0�3 232 lio 277 0 0�4 233 pio 62 0 0�5 234 aio 144794 0 0�6 235 msc 756 0 0�7 236 aio 64028 0 0�8 237 tli 3 0 0
List VirtualProcessor Status:onstat -g sch
106
Exploring the ONSTAT Utility

This is the most interesting of the new options. This option can be usedto drill down and see the actual SQL statement that a user is executing.The example in Figure 15 provides a summary of all the SQL statementswhich are running. By using the session id, it is possible to see thedetails and actual SQL statements being run. Figure 16 provides an exam-ple of this detail.
Figure 15: The onstat -g sql command lists all SQL statements.
Figure 16: The onstat -g sid command provides an SQL statement for a specific user.
lester@merlin >onstat -g sql 264��INFORMIX-OnLine Version 7.23.UC1 -- On-Line -- �Up 7 days 12:51:10 -- 10656 Kbytes��VP Scheduler Statistics:��Sess SQL Current Iso Lock SQL ISAM F.E.�ID Stmt type Database Lvl Mode ERR ERR Vers�264 INSERT ffsdw NL Not Wait -264 0 7.23��Current SQL statement :� insert into gjsum select exp_org, exp_prog, bud_obj_code, job_num,� sum (exp_amount) from genjournal group by 1, 2, 3, 4��Last parsed SQL statement :� insert into gjsum select exp_org, exp_prog, bud_obj_code, job_num,� sum (exp_amount) from genjournal group by 1, 2, 3, 4
List SQLStatement for aSpecific User:onstat -g sqlsid
lester@merlin >onstat -g sql��INFORMIX-OnLine Version 7.23.UC1 -- On-Line -- �Up 7 days 12:52:02 -- 10656 Kbytes��Sess SQL Current Iso Lock SQL ISAM F.E.�ID Stmt type Database Lvl Mode ERR ERR Vers�264 INSERT ffsdw NL Not Wait -264 0 7.23
List SQLStatement Types:onstat -g sql
107
TechnicalFeatures

This option can be very useful in a couple of cases, such as when accessto the SQL code is not available and it is necessary to optimize thedatabase tables and indexes. By running this command repeatedly, it ispossible to see the SQL statements that are being processed. Then, bycollecting and examining the SQL, you can determine where to addindexes to improve the overall performance of the system.
A second use for this option is in debugging program transactions. I used this option to help a programer debug a program by runningonstat -g sql sid while the program was operating. Error conditionsand SQL errors that the programmer was not catching in the programwere available thusly.
The onstat -g ses option provides additional information about usersÕsessions, including how much memory each session uses. Figure 17provides an example. This option can also be used to display detailedinformation about a session.
Figure 17: The onstat -g ses command provides a list of users’ sessions.
lester@merlin >onstat -g ses��INFORMIX-OnLine Version 7.23.UC1 -- On-Line -- �Up 7 days 12:57:48 -- 10656 Kbytes��session #RAM total used�id user tty pid hostname threads memory memory�265 informix - 0 - 0 8192 4680�264 lester 4 4249 merlin 1 106496 97840�10 informix - 0 - 0 8192 4680�7 informix - 0 - 0 16384 13144�6 informix - 0 - 0 8192 4680�4 informix - 0 - 0 16384 13144�3 informix - 0 - 0 8192 4680�2 informix - 0 - 0 8192 4680
List UsersSessions: onstat -g ses
108
Exploring the ONSTAT Utility

To continually repeat an ONSTAT command, use the -r # of sec-onds option. This option is very useful when you need to monitor asituation. The following example displays the status of the logicallogs every ten seconds.
onstat -l -r 10
The server statistics are reset each time that the server is restarted. Toreset all statistics while the server is running (without shutting it down),use the following command:
onstat -z
The above command will clear all statistics for the ONSTAT and theSMI tables.
The ONSTAT utility provides a powerful toolkit for the DBA to carefor and monitor a database server. It is hoped that this article provides astarting point for the use of the ONSTAT utility.
Lester Knutsen is a database consultant and trainer, and is president ofAdvanced DataTools Corporation. Knutsen is also president of theWashington Area Informix User Group and was one of the foundingboard members of the International Informix Users Group.
Advanced DataTools can be contacted via phone at 703 256 0267; via the Web at www.advancedatatools.com; or via email [email protected].
About AdvancedDataTools
About the Author
Conclusion
Clear ONSTATShared MemoryStatistics: onstat -z
Repeat ONSTATCommands: -r
109
TechnicalFeatures