
Feast and Famine: The Situation and Prospects for the ... - Feast... · World Wool Market Chris...
21
Feast and Famine: The Situation and Prospects for the World Wool Market Chris Wilcox Poimena Analysis and Chairman, Market Intelligence Committee of IWTO American Wool Council February 2018
Transcript of Feast and Famine: The Situation and Prospects for the ... - Feast... · World Wool Market Chris...
Feast and Famine:
The Situation and Prospects for the
World Wool Market
Chris Wilcox
Poimena Analysis
and
Chairman, Market Intelligence Committee of IWTO
American Wool Council
February 2018

Topics
1. Recent price trends
2. Global production and supply
3. Demand conditions
4. Summary and prospects

Feast for Fine Merino Wool;
Famine for Broader Wool
0
200
400
600
800
1,000
1,200
1,400
1,600
1,800
2,000
2,200
Aus 18um
Sth Africa 21um
Aus 28um
USc/kgAustralia and South Africa
Source: AWEX, BWMB, NZ Wool Services
Prices to 25th January 2018
NZ Broad crossbred wool is 33-38 micron.
The UK wool price is the British Wool Marketing Board Indicator.
0
100
200
300
400
500
600
700
UK - Broad
NZ Broad Xbred
USc/kgNew Zealand and the UK
50
60
70
80
90
100
110
120
130
140
150
160
170
180
190
200
All Items Food
Metals Oil
Index: Jan 2016=100
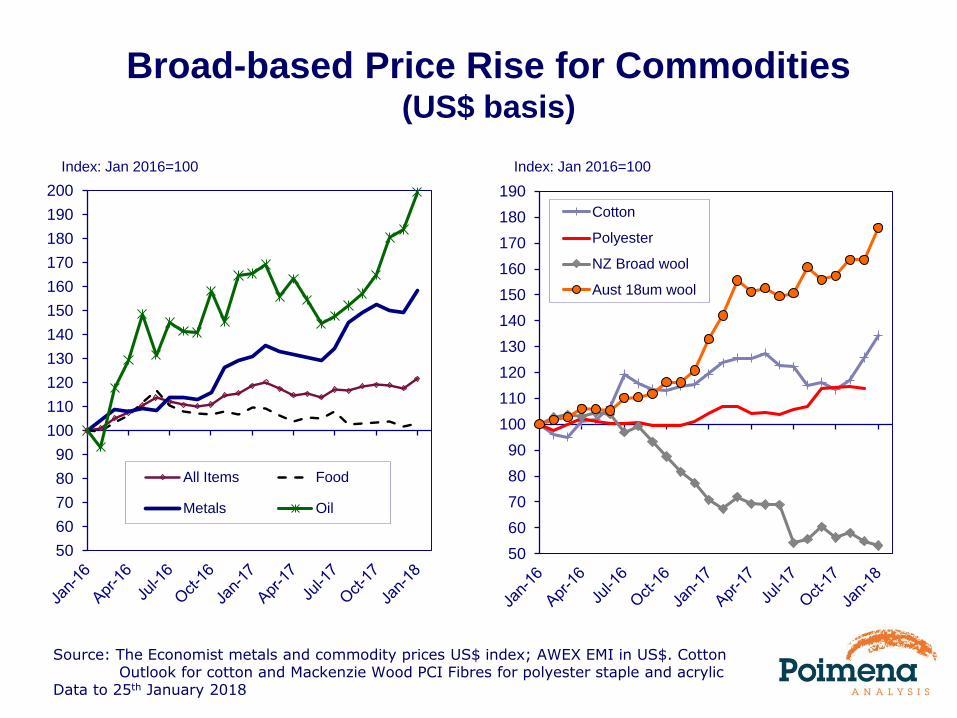
Broad-based Price Rise for Commodities(US$ basis)
Source: The Economist metals and commodity prices US$ index; AWEX EMI in US$. Cotton Outlook for cotton and Mackenzie Wood PCI Fibres for polyester staple and acrylic
Data to 25th January 2018
50
60
70
80
90
100
110
120
130
140
150
160
170
180
190
Cotton
Polyester
NZ Broad wool
Aust 18um wool
Index: Jan 2016=100

0
1
2
3
4
5
6
7
8
9
1018 micron
21 micron
Broad Xbred
Ratio
Fine Merino Wool Price Ratio at Highs;
Broad Wool Price Ratio at LowsUS$ terms
0
1
2
3
4
5
6
7
8
9
1018 micron
21 micron
Broad Xbred
Ratio Synthetics Cotton
Source: AWEX, Cotton Outlook, PCI Fibres, CIRFS, Woolmark, Poimena Analysis, Wool Services
International NZ
Data to January 2018
Note: For 18 micron and 21 micron wool it is Australian wool
For Broad Xbred it is New Zealand broad wool and the ratio is against acrylic fibre

0
200
400
600
800
1,000
1,200
1,400
1,600
1991 1993 1995 1997 1999 2001 2003 2005 2007 2009 2011 2013 2015 2017
US cents/kg
Source: AWEX – 2017/18 basis
Data to 25th January 2018
World Economic Events and Wool PricesAustralian Eastern Market Indicator
321 311
921
709
481
World economic
recovery, ‘dead-cat’
bounce post-RPS
706
World economic recovery,
cotton prices to records,
very strong A$
1508
trend
Asian Financial
Crisis
Global
Financial
Crisis
461
Stockpile sold,
supply squeeze
1400
Euro debt
crisis
918
Double-faced
woollen
fabric mania
1074
Commodity
prices rise –
superfine wool
prices up

Merino Wool Price Supercycles
DatePeak Price*
Price change - start
to peak*Weeks -
start to
peak
Comments
UScents Acents UScents Acents
February 1986
to May 19881203 1582
+743
(+162%)
+925
(+140%)111
Strong co-ordinated economic
growth, Soviet Union buying, China
begins, positive fashion styles
April 1993 to
March 1995707 949
+379
(+116%)
+496
(+107%)97
World economic recovery, post
Reserve Price Scheme collapse
“bounce”, China emerges
November 2001
to January 2003709 1211
+350
(+97%)
+501
(+71%)59
Last bale of the Australian wool
stockpile sold – kicks off price rise
May 2010 to
June 20111512 1434
+789
(+109%)
+564
(+65%)57
Global economic recovery after
GFC and cotton prices to 100+
year highs
April 2016 to
January 20181439 1818
+540
(+60%)
+586
(+48%)91
Solid economic growth in US & EU,
general commodity price rise.
Constrained Merino wool
production.
* Based on the Australian Eastern Market Indicator, 2017/18 basis

Total World Production Stable
But Broad Wool Production Rising
400
500
600
700
800
mkg clean
Apparel wool
Interior textiles wool
Source: IWTO, Country statistics, Poimena Analysis
Updated January 2018
2016 total production
1,140.5 mkg clean
2017 total production
1,147.9 mkg clean
Near 70 year lows
2018 total production
1,158.6 mkg clean
Stocks:Use ratio
~11%

Australia Dominates Global Merino Wool
Production% share
Source: AWTA, NZWTA, CapeWools, FLA, estimates by Poimena Analysis
Australia
South Africa
Argentina
Uruguay
New Zealand
USA
China CIS
SpainRest of world

Australian Wool Production Remains Near
Century Lows
0
200
400
600
800
1000
1200
19
01
19
06
19
11
19
16
19
21
19
26
19
31
19
36
19
41
19
46
19
51
19
56
19
61
19
66
19
71
19
76
19
81
19
86
19
91
19
96
20
01
20
06
20
11
20
16
mkg greasy
Source: Australian Bureau of Statistics, Australian Wool Production Forecasting Committee
Based on a season. 2018 = 2017/18
Forecast for 2017/18
345 mkg

Source: The US Conference Board, the European Commission and www.tradingeconomics.com
Data to December 2017
20
30
40
50
60
70
80
90
100
110
120
130
140
150
US
EU
Index
Jan 2008 = 100
60
70
80
90
100
110
120
130
140China
Japan
South Korea
Index
Jan 2008 = 100
Consumer Confidence Lifts in the Major Wool
Consuming Countries
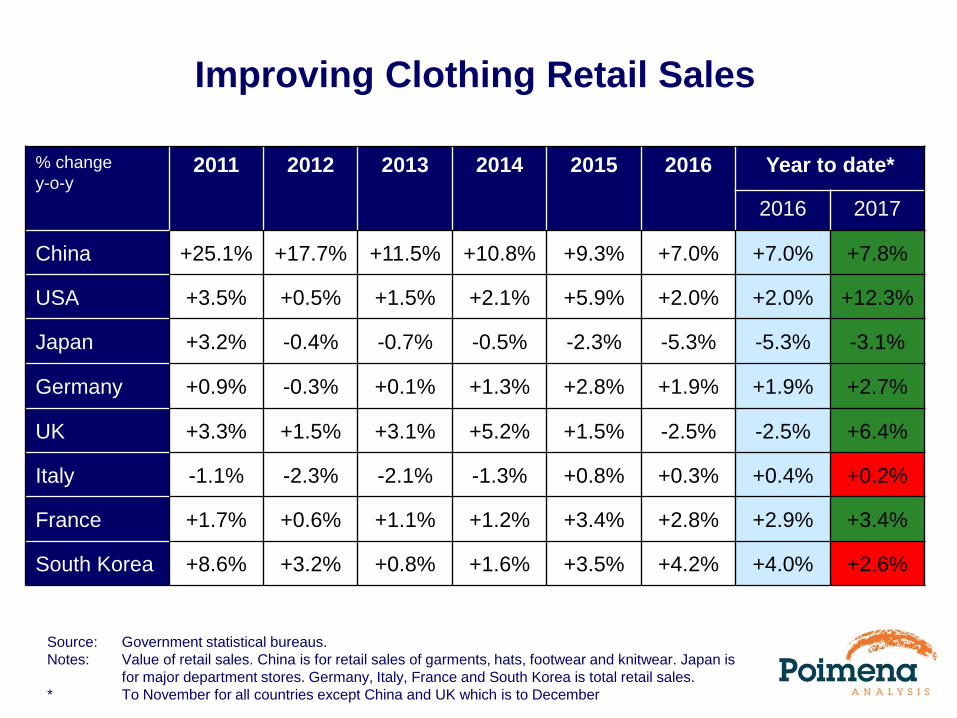
Improving Clothing Retail Sales
% change
y-o-y2011 2012 2013 2014 2015 2016 Year to date*
2016 2017
China +25.1% +17.7% +11.5% +10.8% +9.3% +7.0% +7.0% +7.8%
USA +3.5% +0.5% +1.5% +2.1% +5.9% +2.0% +2.0% +12.3%
Japan +3.2% -0.4% -0.7% -0.5% -2.3% -5.3% -5.3% -3.1%
Germany +0.9% -0.3% +0.1% +1.3% +2.8% +1.9% +1.9% +2.7%
UK +3.3% +1.5% +3.1% +5.2% +1.5% -2.5% -2.5% +6.4%
Italy -1.1% -2.3% -2.1% -1.3% +0.8% +0.3% +0.4% +0.2%
France +1.7% +0.6% +1.1% +1.2% +3.4% +2.8% +2.9% +3.4%
South Korea +8.6% +3.2% +0.8% +1.6% +3.5% +4.2% +4.0% +2.6%
Source: Government statistical bureaus.
Notes: Value of retail sales. China is for retail sales of garments, hats, footwear and knitwear. Japan is
for major department stores. Germany, Italy, France and South Korea is total retail sales.
* To November for all countries except China and UK which is to December

Improving Furnishings and Interior Textiles Retail Sales
% change y-o-y 2011 2012 2013 2014 2015 2016 Year to date*
2016 2017
China +32.8% +27.0% +21.0% +13.9% +16.1% +12.7% +12.7% +12.8%
USA +9.6% +4.7% +6.6% -1.2% +6.5% +4.1% +4.8% +7.4%
Japan -1.8% -1.8% -2.5% -1.8% -14.8% -19.2% -20.2% -8.4%
Germany +0.9% -0.3% +0.1% +1.3% +2.8% +1.9% +1.9% +2.7%
UK -22.1% +28.9% +14.5% -3.1% -29.3% -6.9% -6.9% +16.3%
Italy -1.1% -2.3% -2.1% -1.3% +0.8% +0.3% +0.4% +0.2%
France +1.7% +0.6% +1.1% +1.2% +3.4% +2.8% +2.9% +3.4%
South Korea +8.6% +3.2% +0.8% +1.6% +3.5% +4.2% +4.0% +2.6%
Source: Government statistical bureaus.
Notes: Value of retail sales. UK is for retail sales of floorcoverings. China is for furnishings. Japan is sales of
furnishings in department stores. US is personal consumption of carpets and other floor coverings
Germany, Italy, France and South Korea is total retail sales.
* To December for China and UK, to November for all other countries

Source: OTEXA. Data to November 2017
US Imports of Wool Products DropsValue (% year-on-year change of 12 mma)
-15%
-10%
-5%
0%
5%
10%
15%
20%
25%
Wool
Cotton
Synthetics
% change y-o-y Clothing
-20%
-15%
-10%
-5%
0%
5%
10%
15%
20%
25%
Wool
Cotton
Synthetics
% change y-o-yInterior textiles

China’s Exports of Most Wool Products Decline(Calendar Year to November - % change year on year)
-20%
-10%
0%
10%
20%
30%
40%
50%
60%
70%
% change y-o-y
2014 2015
2016 2017
Wool Product Exports
Source: China Customs and China Wool Textile Association; US Department of Commerce
Wool imports is for raw and semi-processed wool (including wool top)
-40%
-30%
-20%
-10%
0%
10%
20%
30%
40%
50%
60%
% change y-o-y
2014 2015
2016 2017
Raw and Semi-processed Imports

Wool Imports by Major Processing CountriesCalendar Year to November
0 25 50 75 100 125 150 175 200 225 250 275 300 325 350 375 400
China
India
Italy
Germany
Czech Republic
Other Europe
Other
mkg greasy equiv.
2017 2016 2015
2014 2013
-2%
-5%
+4%
-6%
-2%
+2%
-1%
Note: From the five major exporting countries (Australia, New Zealand, Argentina, Uruguay and
South Africa
Source: Australian Bureau of Statistics, FLA, SUL, Capewools, Beef + Lamb NZ

Wool Export Volumes by Major Exporters12 month rolling aggregate
-25%
-20%
-15%
-10%
-5%
0%
5%
10%
15%
20%
Australia
New Zealand
Total
% change y-o-y
Source: Australian Bureau of Statistics, FLA, SUL, Capewools, NZ Beef + Lamb
Data to November 2017
-40%
-20%
0%
20%
40%
60%
Argentina
South Africa
Uruguay
% change y-o-y

Summary of Drivers
Merino
1. Low production of finer wool
2. Virtually no stocks left
3. Increased raw wool demand, notably from
China
4. Higher economic growth leading to upturn in
commodity prices (including Merino wool)
5. High consumer confidence and higher
clothing retail sales growth
6. Increased use of Merino wool in active and
leisurewear?
BUT
1. High price relativity for Merino wool against
competing fibres
2. Lower imports of wool clothing by US
3. Are pipeline stocks growing?
Broad Wool
1. Increased production of broader wool
2. High stocks held in New Zealand
3. Raw wool demand from China fell in 2016/17
4. Substitution of broad wool by acrylic and
nylon?
5. Slowdown in use of broad wool in apparel
products in China?
6. Patchy retail sales for furnishings
7. Trade in wool carpets falls
BUT
1. Broad Crossbred wool price relativity at lows
2. High consumer confidence in key countries
3. New style knitting products using broad wool in
China

Prospects for 2018
➢ Merino wool prices at highs, but
could be near a cyclical peak
➢ Broad wool prices at the bottom?
➢ Longer term demand trends and
prospects positive for Merino wool
➢ Product development will be key
for broad wool
Will it be feast or famine?

Merino Wool Price Supercycles – the Downside
Date
Price change –
peak to low*Low Price* Weeks
– peak
to low
Comments
UScents Acents UScents Acents
May 1988 to
March 1991
-666
(-55%)
-1045
(-66%)418 537 111
Collapse of the Reserve Price
Scheme, Soviet Union falls apart,
Tiananmen Square
March 1995 to
May 1996
-232
(-33%)
-343
(-36%)475 606 97
Market adjusts to massive
stockpile in Australia after ‘dead-
cat’ bounce post-collapse of
Reserve Price Scheme
January 2003 to
December 2005
-229
(-32%)
-562
(-46%)480 649 59
Economic slowdown, excess
stocks in wool textile industry,
SARS outbreak in China triggers
price fall
June 2011 to
September 2012
-549
(-36%)
-501
(-35%)963 933 57
Global cotton prices drop as China
builds up massive cotton stockpile,
causing drop in all fibre prices.
Excess stocks in wool textile
industry
* Based on the Australian Eastern Market Indicator, 2017/18 basis

Thank You!