
Feasibility Study of the Arenal Volcano Wind Project - Worcester
218
Feasibility Study of the Arenal Volcano Wind Project An Interactive Qualifying Project Report submitted to the Faculty of WORCESTER POLYTECHNIC INSTITUTE in partial fulfillment of the requirements for the Degree of Bachelor of Science Submitted By Pragathi Balasubramanian Branislav Jovanovic James Kirk Project Center: San José, Costa Rica Term: B 2010 Sponsoring Agency: Empresa de Servicios Publicos de Heredia, S.A. Project Advisors: Prof. Jennifer Rudolph and Prof. Stanley Selkow
Transcript of Feasibility Study of the Arenal Volcano Wind Project - Worcester
Feasibility Study of the Arenal Volcano Wind Project
An Interactive Qualifying Project Report submitted to the Faculty of
WORCESTER POLYTECHNIC INSTITUTE
in partial fulfillment of the requirements for the Degree of Bachelor of Science
Submitted By
Pragathi Balasubramanian
Branislav Jovanovic
James Kirk
Project Center: San José, Costa Rica
Term: B 2010
Sponsoring Agency: Empresa de Servicios Publicos de Heredia, S.A.
Project Advisors: Prof. Jennifer Rudolph and Prof. Stanley Selkow
i
Abstract Empresa de Servicios Publicos de Heredia (ESPH) in Costa Rica wants to develop a wind
farm to complement hydropower generation. We explored the feasibility of building a wind farm
at a site in Guanacaste for ESPH by determining potential energy output, feasible turbine
placement, construction feasibility, financial feasibility and the social and environmental
impacts. We proposed a design with a twelve-megawatt wind farm with a payback period of five
years as the most cost-effective and efficient.

ii
Acknowledgements This project would not have been possible without the support of our advisors from
Worcester Polytechnic Institute and our liaisons from the Empresa de Servicios Publicos de
Heredia, S.A. Therefore, we wish to express our gratitude to our liaisons Sr. Luis Gámez
Hernández and Sr. Andrés Zúñiga Garita from Empresa de Servicios Publicos de Heredia, S.A.
for providing us with past feasibility studies, various data and tremendous assistance. Special
thanks also to Prof. Stanley Selkow and Prof. Jennifer Rudolph, for their guidance and
invaluable assistance. Thanks to Prof. Alexander Emanuel for providing us with literature related
to wind turbines and wind farming. We would like to thank Mr. Brandon Boyle for his assistance
in understanding import/export financing. Lastly, we would also like to convey thanks to Mr. Jay
Gallegos from Mesoamerica Energy for his assistance related to financing wind farms.
A truly special thanks to Dr. Ernst Hjalmar Waloddi Weibull, for making it all possible.
iii
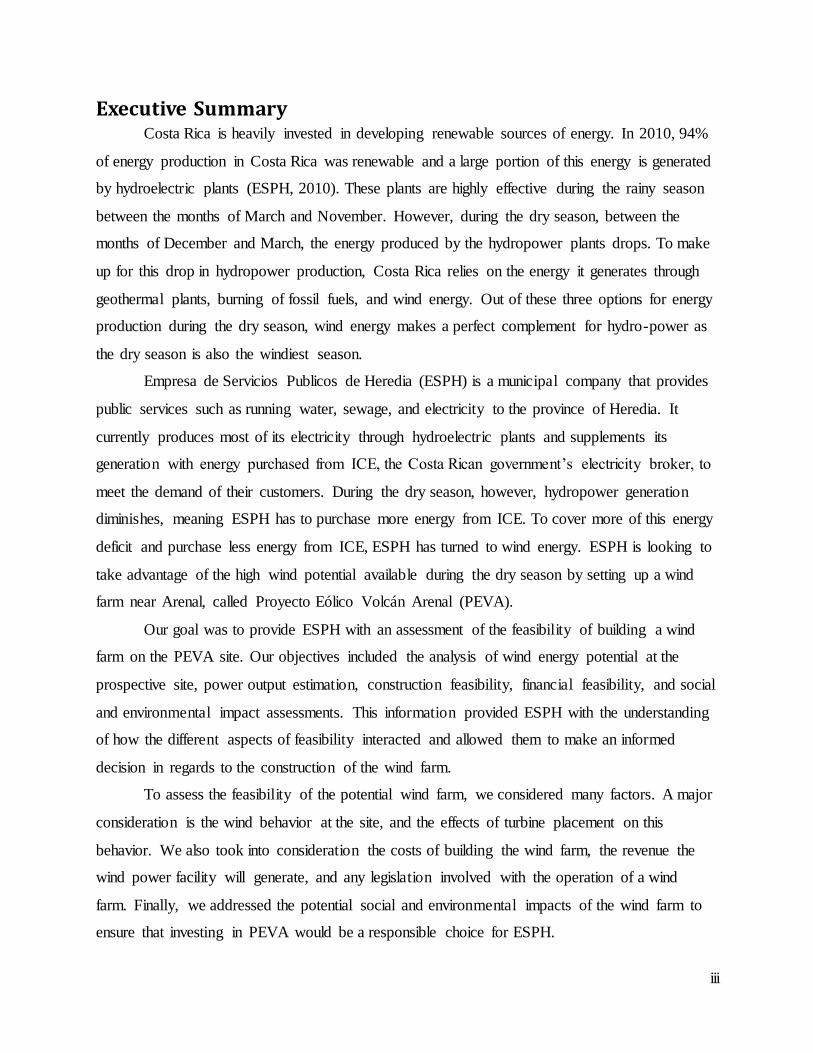
Executive Summary Costa Rica is heavily invested in developing renewable sources of energy. In 2010, 94%
of energy production in Costa Rica was renewable and a large portion of this energy is generated
by hydroelectric plants (ESPH, 2010). These plants are highly effective during the rainy season
between the months of March and November. However, during the dry season, between the
months of December and March, the energy produced by the hydropower plants drops. To make
up for this drop in hydropower production, Costa Rica relies on the energy it generates through
geothermal plants, burning of fossil fuels, and wind energy. Out of these three options for energy
production during the dry season, wind energy makes a perfect complement for hydro-power as
the dry season is also the windiest season.
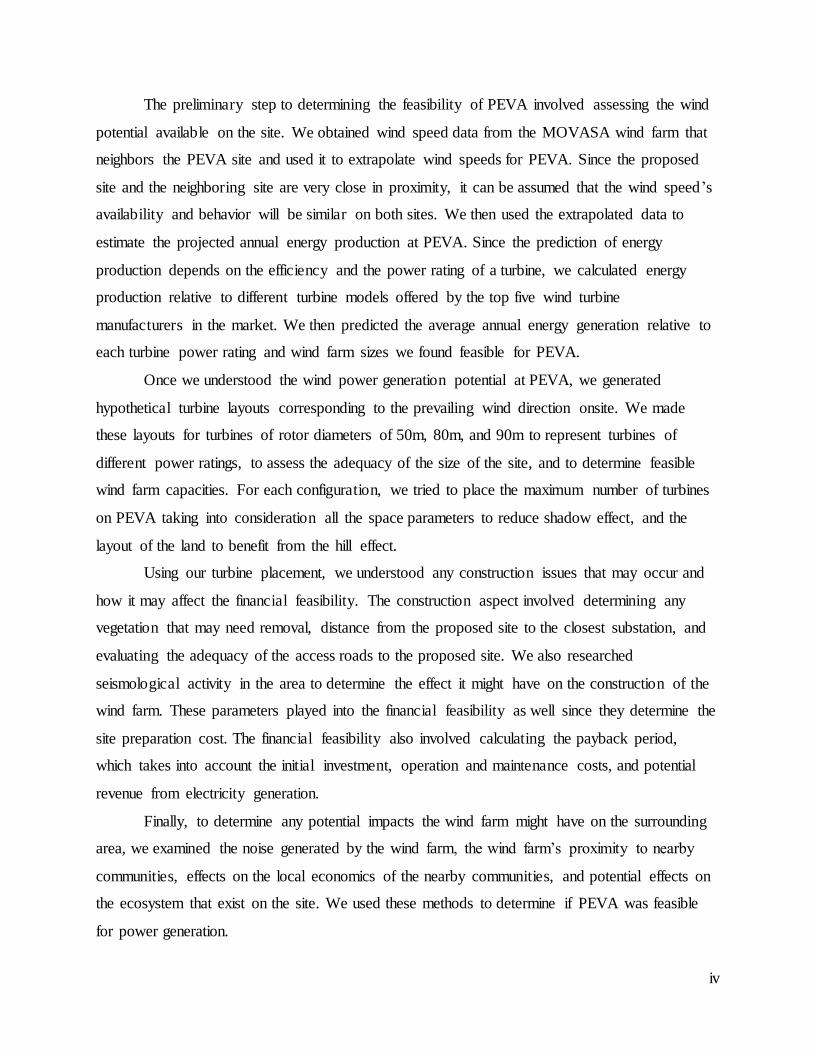
Empresa de Servicios Publicos de Heredia (ESPH) is a municipal company that provides
public services such as running water, sewage, and electricity to the province of Heredia. It
currently produces most of its electricity through hydroelectric plants and supplements its
generation with energy purchased from ICE, the Costa Rican government’s electricity broker, to
meet the demand of their customers. During the dry season, however, hydropower generation
diminishes, meaning ESPH has to purchase more energy from ICE. To cover more of this energy
deficit and purchase less energy from ICE, ESPH has turned to wind energy. ESPH is looking to
take advantage of the high wind potential available during the dry season by setting up a wind
farm near Arenal, called Proyecto Eólico Volcán Arenal (PEVA).
Our goal was to provide ESPH with an assessment of the feasibility of building a wind
farm on the PEVA site. Our objectives included the analysis of wind energy potential at the
prospective site, power output estimation, construction feasibility, financial feasibility, and social
and environmental impact assessments. This information provided ESPH with the understanding
of how the different aspects of feasibility interacted and allowed them to make an informed
decision in regards to the construction of the wind farm.
To assess the feasibility of the potential wind farm, we considered many factors. A major
consideration is the wind behavior at the site, and the effects of turbine placement on this
behavior. We also took into consideration the costs of building the wind farm, the revenue the
wind power facility will generate, and any legislation involved with the operation of a wind
farm. Finally, we addressed the potential social and environmental impacts of the wind farm to
ensure that investing in PEVA would be a responsible choice for ESPH.
iv
The preliminary step to determining the feasibility of PEVA involved assessing the wind
potential available on the site. We obtained wind speed data from the MOVASA wind farm that
neighbors the PEVA site and used it to extrapolate wind speeds for PEVA. Since the proposed
site and the neighboring site are very close in proximity, it can be assumed that the wind speed’s
availability and behavior will be similar on both sites. We then used the extrapolated data to
estimate the projected annual energy production at PEVA. Since the prediction of energy
production depends on the efficiency and the power rating of a turbine, we calculated energy
production relative to different turbine models offered by the top five wind turbine
manufacturers in the market. We then predicted the average annual energy generation relative to
each turbine power rating and wind farm sizes we found feasible for PEVA.
Once we understood the wind power generation potential at PEVA, we generated
hypothetical turbine layouts corresponding to the prevailing wind direction onsite. We made
these layouts for turbines of rotor diameters of 50m, 80m, and 90m to represent turbines of
different power ratings, to assess the adequacy of the size of the site, and to determine feasible
wind farm capacities. For each configuration, we tried to place the maximum number of turbines
on PEVA taking into consideration all the space parameters to reduce shadow effect, and the
layout of the land to benefit from the hill effect.
Using our turbine placement, we understood any construction issues that may occur and
how it may affect the financial feasibility. The construction aspect involved determining any
vegetation that may need removal, distance from the proposed site to the closest substation, and
evaluating the adequacy of the access roads to the proposed site. We also researched
seismological activity in the area to determine the effect it might have on the construction of the
wind farm. These parameters played into the financial feasibility as well since they determine the
site preparation cost. The financial feasibility also involved calculating the payback period,
which takes into account the initial investment, operation and maintenance costs, and potential
revenue from electricity generation.
Finally, to determine any potential impacts the wind farm might have on the surrounding
area, we examined the noise generated by the wind farm, the wind farm’s proximity to nearby
communities, effects on the local economics of the nearby communities, and potential effects on
the ecosystem that exist on the site. We used these methods to determine if PEVA was feasible
for power generation.
v
In our results, we first determined the optimal turbine ratings that ESPH should install on
PEVA corresponding to different wind farm capacities. We grouped the turbine models from the
top five wind turbine manufacturers by power rating to determine the projected annual power
generation relative to different power ratings. Our results demonstrate that the 1.5 MW turbines
manufactured by General Electric (GE) provide the maximum average power generation at wind
farm sizes of 10 MW, 15 MW, and 20 MW. Although 1.5 MW is the optimal, we still considered
turbine ratings of 800 kW, 1.8 MW, 2.0 MW, and 2.3 MW for further analysis since they had the
next highest power generation.
We determined the prevailing wind direction at PEVA to be from the northeast to the
south-west. We used this information to determine turbine placement strategies for the
previously mentioned turbine ratings. For turbines with a 50 meter rotor diameter, corresponding
to turbines with an 800 kW power rating, we believe that ESPH could place 12 turbines on the
site. For 80 meter rotor diameters, corresponding to 1.5 - 2.0MW turbines, we have found that
the site is large enough for eight turbines. For 90 meter rotor diameters, corresponding to the
largest 1.8 - 3.0MW turbines, we believe that the site can only accommodate six turbines. These
size constraints limit power production and make it difficult for ESPH to reach its 20MW
production goal for the site.
To facilitate the construction of the wind farm, there are a few issues ESPH would have
to address. There are currently patches of bushes and trees on the PEVA site that ESPH would
have to clear for construction access and for clear wind flow over the terrain. To aid ESPH with
this process, we generated a map of these elevated patches, which we believe should be removed.
Another factor contributing to the construction feasibility is the possibility of connecting PEVA
to a substation. The closest substation to PEVA is the Corobici substation, which is located 16
kilometers south-west of PEVA. The easiest way for ESPH to build high-voltage power lines to
this substation is to run them over public roads, avoiding the purchase of land. Finally, ESPH
should consider evaluating the roads that lead up to PEVA. Since MOVASA has used these
roads to transport their turbines with rotor diameters of 44m in the past, if ESPH were to
purchase turbines with larger rotor diameters the current road conditions may not be adequate. In
addition, all the turbines we have considered have a rotor diameter of 50m or higher, therefore
we recommend ESPH to evaluate and improve road conditions before purchasing turbines.
vi
We gathered the information for performing the financial analysis through ESPH and Jay
Gallegos, an expert in wind energy in Costa Rica. From our conversation with Mr. Gallegos, we
understood the initial cost of a wind farm to be $2.8 million/MW including turbine cost, legal
fees, consultancies, and land fees. This initial cost does not include the cost of laying
transmission lines, which is around $900,000 for PEVA. We performed a preliminary analysis to
determine the initial costs and revenues for wind farms of size 10MW, 15 MW, and 20MW. We
created cash flow tables for each turbine power rating from 800 kW to 3MW to determine the
revenue the wind farm would generate over 20 years, the average lifespan of a wind farm. For a
10 MW wind farm, the total revenue can range from $45 million to $85 million, for a 15 MW
wind farm, from $66 million to $111 million and for a 20 MW wind farm, from $83 million to
$159 million. In addition, the payback periods for ESPH’s independent investment ranged from
5 to 11 years. We determined that the wind farms with the lowest payback periods included those
with the 1.5 MW turbines by GE and the 1.8 MW turbine by Vestas. Based on the turbine
placement suggestions, we did a secondary financial analysis on wind farms with the feasible
number of turbines of each power rating that could fit on the wind farm. We determined that a 12
MW wind farm composed of 1.5 MW turbines and a 16 MW wind farm composed of 2.0 MW
turbines would provide the highest revenue for ESPH in the long run. However, the payback
period for the 16 MW wind farm is around 2 years more than that of the 12 MW wind farm even
though the revenue for both wind farms is about the same. Additionally, since the 16 MW wind
farm has a higher power rating it would require a higher initial cost than that of the 12 MW wind
farm. Therefore, we suggested the 12 MW wind farm composed of 1.5 MW turbines to be the
most efficient for the PEVA site.
The social and environmental feasibility of PEVA encompassed the effects it would have
on the local ecosystem and on nearby communities. We could not perform a comprehensive
study of the ecology and wild life on the proposed site due to time constraints. However, as
mentioned previously, we believe that the removal of patches of trees on the PEVA site would be
harmful to the local ecosystem. These trees could be home to many local species of animals,
including birds. However, the removal of these habitats could also lower the chances of bird
fatalities from turbine strikes, as there would be fewer birds flying near the turbines. In regards to
the noise produced by wind turbines, we ascertained that it would not be a nuisance as the closest
communities to PEVA are at least a kilometer away. Using the sound map calculator from the

vii
Danish Wind Industry Association we found that noise levels drop significantly outside the
boundaries of the wind farm. The noise level is around 45-49 dB, within 150 meters of the
boundary, around the noise level of conversational speech. Building a wind farm at PEVA would
also provide benefits to nearby communities. Wind farms have proven to be very beneficial to
the Tilarán area, both by providing landowners with extra income and jobs for residents. The
Tilarán area is very popular for wind farming and it is likely that many laborers in this area
would have skills pertaining to wind farm construction and maintenance. These workers, as well
as the community at large, would benefit from the jobs created by PEVA.
According to our observations and results, we believe that PEVA site is feasible for the
setup of a wind farm. The installation of a 10 – 15 MW wind farm would provide ESPH with the
optimal amount of production and revenue generation. As per our results on the data provided to
us, we suggested the installation of a 12 MW wind farm composed of 1.5 MW turbines that are
manufactured by GE. We determined that PEVA would be feasible for construction as long as
ESPH removes the patches of trees and bushes that lower power generation. The wind farm we
suggested has a five year payback, which we consider financially feasible. In terms of social and
environmental feasibility, we believe that any impact on the ecosystem at the PEVA site would
be minimal and the noise produced will not impact any nearby communities. In addition, PEVA
would provide job opportunities and a source of income for the nearby communities. While more
data would provide a more accurate understanding of PEVA, we believe that PEVA is a feasible
site for a wind farm.

viii
Authorship Pragathi Balasubramanian – Ms. Balasubramanian served as the primary researcher of wind farm
financing and policies regarding energy generation, and performed the financial analysis. She
also studied the environmental and social impacts of wind farming and applied this knowledge to
PEVA.
Branislav Jovanovic – Mr. Jovanovic served as the primary researcher of wind dynamics and
wind behavior relating to turbines. He performed the wind speed calculations and projections as
well as energy production estimates. Mr. Jovanovic also generated the hypothetical turbine
layouts used to asses feasibility.
James Kirk – Mr. Kirk served as the primary researcher of construction and transportation issues
and how they would affect the feasibility of PEVA. He served as the primary editor of our
written material and assisted Mr. Jovanovic in generating turbine layouts. Mr. Kirk also
interviewed Jay Gallegos for wind farm financing information.
All team members contributed equally to this project and to understanding the feasibility of
PEVA.
ix
Table of Contents Abstract .................................................................................................................................i
Acknowledgements .............................................................................................................. ii
Executive Summary ............................................................................................................ iii
Authorship......................................................................................................................... viii
Table of Contents ................................................................................................................ ix
List of Figures ................................................................................................................... xiii
List of Tables .................................................................................................................... xiv
Chapter 1 - Introduction ...................................................................................................... 1
Chapter 2 - Background ...................................................................................................... 3
2.1 Renewable Energy..................................................................................................... 4
2.2 History of Wind Power ............................................................................................. 6
2.3 Seasonal Weather Patterns in Costa Rica.................................................................. 8
2.4 Wind Characteristics and Data Collection .............................................................. 10
2.4.1 Data Collection ................................................................................................. 10
2.4.2 Effects Related to Major Wind Characteristics ................................................ 11
2.4.3 Wind Data Representations and Analysis......................................................... 13
2.5 Wind Behavior on a Wind Farm ............................................................................. 16
2.6 Wind Power Generation .......................................................................................... 18
2.6.1 Power Generation ............................................................................................. 18
2.6.2 Turbine Components and Energy Conversion.................................................. 19
2.6.3 Wind Turbine Selection .................................................................................... 19
2.7 Construction Feasibility and Financial Feasibility.................................................. 21
2.8 Wind turbines and Seismology ............................................................................... 24
2.9 Social and Environmental Impacts of Wind Farming ............................................. 25
2.9.1 Social Impacts................................................................................................... 25
2.9.2 Fossil Fuel Reduction ....................................................................................... 28
2.9.3 Impact on Ecosystem ........................................................................................ 29
2.9.4 Birds and Wind Farms ...................................................................................... 29
2.10 Government Regulations....................................................................................... 31
2.11 Summary ............................................................................................................... 32
Chapter 3 - Methodology .................................................................................................. 33
3.1 Collection and Analysis of Existing Data ............................................................... 33
3.2 Site Visit Check List ............................................................................................... 35
x
3.3 Turbine Selection and Placement ............................................................................ 36
3.4 Analysis of Construction Feasibility ....................................................................... 37
3.5 Wind Farm Financing and Payback Period............................................................. 38
3.6 Environmental and Social Feasibility ..................................................................... 40
3.7 Summary ................................................................................................................. 41
Chapter 4 – Results and Findings ..................................................................................... 42
4.1 Wind Power Potential and Turbine Selection Considerations ................................ 43
4.2 Construction Feasibility .......................................................................................... 51
4.3 Financial Feasibility ................................................................................................ 55
4.4 Social and Environmental Feasibility ..................................................................... 61
Chapter 5 - Conclusions and Recommendations .............................................................. 64
5.1 PEVA Feasibility..................................................................................................... 64
5.2 Recommendations ................................................................................................... 66
References ......................................................................................................................... 68
Glossary ............................................................................................................................ 75
Appendix A – Wind Power Derivation............................................................................. 76
Appendix B – Turbine Power Generation & Efficiency................................................... 78
Appendix C – MOVASA Recorded Monthly Mean Wind Speeds 1999 - 2007 .............. 79
Appendix D – MOVASA Mean Wind Speeds and PEVA Mean Wind Speeds............... 80
Appendix E –MOVASA Calculated versus Actual Production ....................................... 81
Appendix F – Turbines Required for different Wind Farm Sizes .................................... 82
Appendix G – All Turbines from Gamesa, Enercon, Vestas, GE, and Siemens .............. 83
Appendix H – Projected Annual Energy Production for a 10 MW Wind Farm ............... 85
H.1 Projected Annual Energy Production for Enercon Turbines.................................. 85
H.2 Projected Annual Energy Production for Other Turbines ...................................... 90
H.3 Projected Average Energy Production by Turbine Power Rating.......................... 94
Appendix I - Projected Annual Energy Production for a 15 MW Wind Farm ................. 95
I.1 Projected Annual Energy Production for Enercon Turbines ................................... 95
I.2 Projected Annual Energy Production for Other Turbines ........................................ 99
I.3 Projected Average Energy Production by Turbine Power Rating ......................... 103
Appendix J - Projected Annual Energy Production for a 20 MW Wind Farm ............... 104
J.1 Projected Annual Energy Production for Enercon Turbines ................................. 104
J.2 Projected Annual Energy Production for Other Turbines ..................................... 108
J.3 Projected Average Energy Production by Turbine Power Rating ......................... 112
xi
Appendix K – Projected Annual Power Generation by Wind Farm Size ....................... 113
Appendix L – Financial Analysis of 800 kW Turbines .................................................. 114
L.1 800 kW Turbines on a 10 MW Wind Farm .......................................................... 114
L.2 800 kW Turbines on a 15 MW Wind Farm .......................................................... 117
L.3 800 kW Turbines on a 20 MW Wind Farm .......................................................... 120
Appendix M – Financial Analysis of 900 kW Turbines ................................................. 123
M.1 900 kW Turbines on a 10 MW Wind Farm ......................................................... 123
M.2 900 kW Turbines on a 15 MW Wind Farm ......................................................... 125
M.3 900 kW Turbines on a 20 MW Wind Farm ......................................................... 129
Appendix N - Financial Analysis of 1.5 MW Turbines .................................................. 132
N.1 1.5 MW Turbines on a 10 MW Wind Farm ......................................................... 132
N.2 1.5 MW Turbines on a 15 MW Wind Farm ......................................................... 135
N.3 1.5 MW Turbines on a 20 MW Wind Farm ......................................................... 138
Appendix O - Financial Analysis of 1.8 MW Turbines .................................................. 141
O.1 1.8 MW Turbines on a 10 MW Wind Farm ......................................................... 141
O.2 1.8 MW Turbines on a 15 MW Wind Farm ......................................................... 144
O.3 1.8 MW Turbines on a 20 MW Wind Farm ......................................................... 147
Appendix P - Financial Analysis of 2.0 MW Turbines .................................................. 150
P.1 2.0 MW Turbines on a 10 MW Wind Farm.......................................................... 150
P.2 2.0 MW Turbines on a 15 MW Wind Farm.......................................................... 153
P.3 2.0 MW Turbines on a 20 MW Wind Farm.......................................................... 156
Appendix Q - Financial Analysis of 2.3 MW Turbines .................................................. 159
Q.1 2.3 MW Turbines on a 10 MW Wind Farm ......................................................... 159
Q.2 2.3 MW Turbines on a 15 MW Wind Farm ......................................................... 162
Q.3 2.3 MW Turbines on a 20 MW Wind Farm ......................................................... 165
Appendix R - Financial Analysis of 3.0 MW Turbines .................................................. 168
R.1 3.0 MW Turbines on a 10 MW Wind Farm ......................................................... 168
R.2 3.0 MW Turbines on a 15 MW Wind Farm ......................................................... 171
R.3 3.0 MW Turbines on a 20 MW Wind Farm ......................................................... 174
Appendix S – Summary of the Wind Farm Projected Revenue ..................................... 177
S.1 10 MW Wind Farm Projected Revenue ................................................................ 177
S.2 15 MW Wind Farm Projected Revenue ................................................................ 178
S.3 20 MW Wind Farm Projected Revenue ................................................................ 179
Appendix T - Analysis of Feasible 9.6 MW Wind Farm................................................ 180
xii
T.1 Projected Annual Energy Production ................................................................... 180
T.2 Projected Revenue ................................................................................................ 181
Appendix U - Analysis of Feasible 12 MW Wind Farm ................................................ 184
U.1 Projected Annual Energy Production ................................................................... 184
U.2 Projected Revenue ................................................................................................ 185
Appendix V - Analysis of Feasible 10.8 MW Wind Farm ............................................. 188
V.1 Projected Annual Energy Production ................................................................... 188
V.2 Projected Revenue ................................................................................................ 189
Appendix W - Analysis of Feasible 16 MW Wind Farm ............................................... 192
W.1 Projected Annual Energy Production .................................................................. 192
W.2 Projected Revenue ............................................................................................... 193
Appendix X - Analysis of Feasible 9.6 MW Wind Farm ............................................... 196
X.1 Projected Annual Energy Production ................................................................... 196
X.2 Projected Revenue ................................................................................................ 197
Appendix Y – Summary of Feasible Wind Farms .......................................................... 200
Appendix Z – Anatomy of a Wind Turbine .................................................................... 202
xiii
List of Figures Figure 2.1 Renewable Energy Investments in Emerging Economies (Peri, 2010) ............. 4
Figure 2.2 Relationship between wind speed and precipitation ......................................... 8
Figure 2.3 A tree experiencing flagging (Danish Wind Industry Association, 2003) ...... 11
Figure 2.4 Low Roughness Class (0-1) Illustration (WAsP) ............................................ 12
Figure 2.5 Moderate Roughness Class (2) Illustration (WAsP) ....................................... 12
Figure 2.6 High Roughness Class (3-4) Illustration (WAsP) ........................................... 13
Figure 2.7 Sample wind rose diagram made in MATLAB............................................... 14
Figure 2.8 Two functions representative of Weibull distributions
(Environment Canada, 2009) ........................................................................... 15
Figure 2.9 Suggested wind turbine spacing (Mathur & Wagner, 2009, p.14) .................. 16
Figure 2.10 Relationship between power output, rotor diameter, and wind speed
(Mathur & Wagner, 2009) ............................................................................. 18
Figure 2.11 Idealized power curve for a wind turbine (Environment Canada, 2009) ...... 20
Figure 2.12 Comparison of noise levels from different sources (AWEA) ....................... 27
Figure 4.1 The MOVASA site (left) and PEVA site (right) ............................................. 43
Figure 4.2 Graph of Average Annual Energy Generation by Wind Turbine Rating ........ 46
Figure 4.3 PEVA flagging tree (left) and compass in the direction of flagging (right) .... 47
Figure 4.4 Hypothetical configuration for 50 m diameter wind turbines ......................... 48
Figure 4.5 Hypothetical configuration for 80 m diameter wind turbines ......................... 49
Figure 4.6 Hypothetical configuration for 90 m diameter wind turbines ......................... 50
Figure 4.7 PEVA site map with bushes and trees outlined in green ................................. 51
Figure 4.8 Effect of bushes and trees on wind for 60 and 80 meters hub heights ............ 52
Figure 4.9 Map of PEVA with patches of trees to be cut in red ....................................... 53
Figure 4.10 10 MW Wind Farm Projected Revenue ........................................................ 59
Figure 4.11 Financial Comparison of Feasible Turbines and Wind Farm sizes ............... 60
Figure 4.12 Wildlife and vegetation at PEVA .................................................................. 61
Figure 4.13 Sound maps of hypothetical PEVA layouts of 80 meter(left) and
50 meter turbines(right) ................................................................................. 62
Figure 4.14 Street mural depicting a wind farm in Tilarán, Guanacaste .......................... 63

xiv
List of Tables Table 3.1 Financial Projection Variables .......................................................................... 39 Table 4.1 Models chosen for prediction of annual power generation on PEVA .............. 45
Table 4.2 Initial Cost of Wind Farms in Costa Rica ......................................................... 55 Table 4.3 Example of figures associated with the main variables of financial analysis ... 57
Table 4.4 Cost Analysis and Payback Period ................................................................... 58
1
Chapter 1 - Introduction
Costa Rica is heavily invested in developing renewable sources of energy. This is
especially evident since in 2007, Costa Rica committed to become a carbon neutral country by
2021 (Vargas, 2007). This effort by the Costa Rican government is motivated by studies
claiming that emissions of carbon dioxide are a key catalyst of climate change. In 2010, the
government advanced its renewable energy agenda when President Laura Chinchilla announced
her goal of making Costa Rica the first country that runs entirely on renewable sources of energy
(Verdin, 2010). Additionally, the people of Costa Rica are committed to preserving natural
resources since a main source of their income is from eco-tourism. Preservation of the
environment is a top priority in Costa Rica, for their economy and for their way of life.
In 2010, 94% of energy production in Costa Rica was renewable and a large portion of
this energy was generated by hydroelectric plants (ESPH, 2010). These plants are highly
effective during the rainy season between the months of March and November. During the dry
season between the months of December and March, however, the energy produced by the
hydropower plants drops. While hydropower may be less effective during the dry season, Costa
Rica still generates electricity through geothermal energy, fossil fuels, and wind energy. It is
difficult to expand geothermal energy production since most lands with high geothermal
potential are national parks. Many of these national parks are volcanoes, which tend to be
geothermal hot spots. As for energy generated through fossil fuels, it is not renewable and
therefore not in line with Costa Rica’s interests to expand. On the other hand, wind energy has
become a promising path for future energy production due to the high wind potential during the
dry season.
Denmark is a prime example of a country that is heavily committed in wind energy
production. In response to the 1973 oil crisis, Denmark turned to wind energy production and
now generates 19% of its energy from wind farms (Walsh, 2009). Currently, Costa Rica
produces less than one percent of its electricity through wind energy, however, it sees wind
power as another viable option for the expansion of renewable energy production. Modern wind
energy has many advantages in addition to being a renewable source of power generation. The
cost of producing wind energy has decreased by at least 80% over the last 20 years, meaning that
it has become more affordable to build wind turbines (D’Silva, 2010). In addition, wind is free
2
and readily available, another reason why it has become a very promising choice for renewable
energy expansion.
Empresa de Servicios Publicos de Heredia (ESPH) is a public utility company that
provides public services such as running water, sewage, and electricity to the Costa Rican
province of Heredia. ESPH currently produces 26 MW of Heredia’s 90 MW demand, and
purchases the remainder of Heredia’s energy from Instituto Costarricense de Electricidad (ICE),
the Costa Rican government’s energy institute. ESPH currently generates electricity through
three hydroelectric plants: Los Negros, Carrillos and Tacares. During the dry season, the energy
produced by the hydroelectric plants decreases, meaning ESPH has to purchase more energy
from ICE. ESPH would like to use wind energy to cover more of this energy deficit and,
therefore, purchase less energy from ICE. Wind energy is the ideal solution for ESPH as wind
farms are at their peak generation during the dry season, complementing hydroelectric power’s
strength in the rainy season.
Prior to this project, ESPH had been investigating building a wind farm dubbed Proyecto
Eólico Volcán Arenal, or PEVA. They established goals, studied other wind farms in Costa Rica,
and began investigating details about the projects such as financial information, grid connection,
access roads, and environmental impact. We used this information as a basis for further research
into the feasibility of building a wind farm at PEVA. To perform a full feasibility study, we must
prove that it is economically viable and responsible to build the wind farm. The various factors
of wind farm construction and operation were taken into account to ensure that the expenses of
the farm did not outweigh the benefits ESPH will gain without having to purchase as much
energy from ICE.
Our goal was to provide ESPH with an assessment of the feasibility of building a wind
farm on PEVA. Our objectives included the analysis of wind data at the prospective site, power
output estimation, construction feasibility, financial feasibility, and social and environmental
impact assessment for the site. These objectives were achieved by collecting information from
our sponsor, site visits, and wind energy experts in Costa Rica. Once we achieved these
objectives, we made recommendations for wind turbine selection, wind turbine placement on the
farm, and provided other information to ESPH for future use. This helped ESPH with the
understanding of how the different aspects of feasibility interacted and allowed ESPH to make an
informed decision in regards to the construction of the wind farms.
3
Chapter 2 - Background
In 2009 alone, $63 billion worth of wind turbines were installed and wind power capacity
increased by 31% worldwide (World Wind Energy Association, 2010). This is evidence of how
wind power generation has become a more attractive option for renewable energy in recent
years. Renewable energy is a main priority for Costa Rica, since it is a very environmentally
conscious country and is aware of its ample natural resources. Since wind power has become a
more accessible choice for renewable energy recently, Costa Rica has directed its attention
towards wind farms, and currently has about 123 MW of wind turbines installed. However, the
power production on these wind farms depends highly on local weather patterns as the wind
potential on these farms vary with each season. ESPH is looking to take advantage of the high
wind potential available during the dry season by setting up a wind farm in Tierras Morenas,
Guanacaste. When setting up a wind farm there are many aspects ESPH would have to take into
consideration. One such aspect is the wind behavior in the area the wind turbines will be placed,
and how it will be affected once a wind turbine is placed there. Other aspects involve the
capability for the site to produce energy, the revenue the wind power generation facility will
produce, available financing for building the wind farm, and any legislation involved with the
set-up of the wind farm. Finally, the potential social and environmental impacts of the wind farm
would also need to be addressed. This chapter will give a brief overview of how wind energy
could be a viable solution to part of growing renewable energy demand, the wind dynamics that
might be present at a wind power generation facility, and the ways to determine if a site is
feasible for wind power generation. Definitions for italicized terms can be found in the glossary.
4
2.1 Renewable Energy
Electrical energy is an important element in the daily lives of people living in developed
countries. As the human population grows, so does the demand for electricity. In many nations,
the primary sources of electricity have been the burning of fossil fuels and nuclear fission. Since
the 1970s, these sources of energy have faced growing opposition as the public has become more
aware of the side effects of using them. Oil crises, global warming, and nuclear waste have all
made policy makers and energy companies hesitant to invest in conventional generation to meet
growing demand. Instead, they rely on the rapidly developing field of renewable energy sources
to provide power cleanly and efficiently to their customers (Vogel, 2005).
The heightened interest in renewable sources of energy has led to massive proliferation of
renewable energy plants as well as great leaps in the technologies related to renewable energy
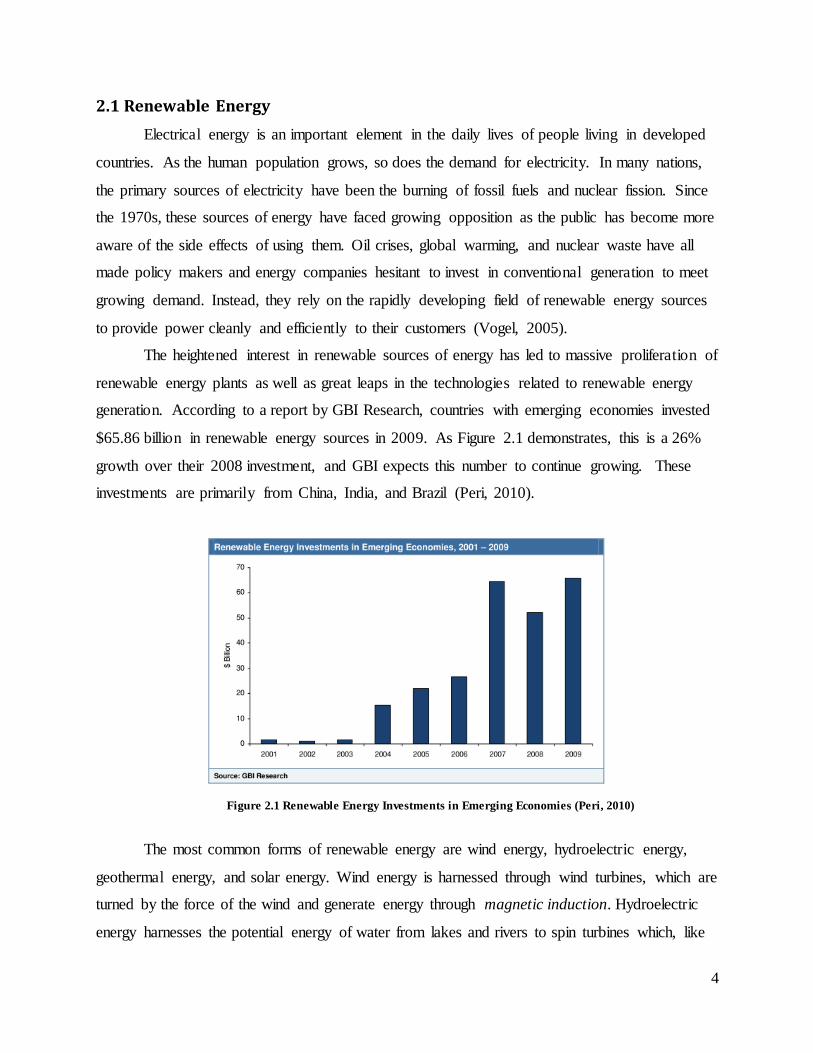
generation. According to a report by GBI Research, countries with emerging economies invested
$65.86 billion in renewable energy sources in 2009. As Figure 2.1 demonstrates, this is a 26%
growth over their 2008 investment, and GBI expects this number to continue growing. These
investments are primarily from China, India, and Brazil (Peri, 2010).
Figure 2.1 Renewable Energy Investments in Emerging Economies (Peri, 2010)
The most common forms of renewable energy are wind energy, hydroelectric energy,
geothermal energy, and solar energy. Wind energy is harnessed through wind turbines, which are
turned by the force of the wind and generate energy through magnetic induction. Hydroelectric
energy harnesses the potential energy of water from lakes and rivers to spin turbines which, like
5
wind turbines, generate electricity through magnetic induction. Geothermal electricity can be
generated through many different processes, but all methods involve harnessing the energy from
pressurized steam built up at the bottom of deep wells. Solar energy can either be harnessed
through the use of photovoltaic cells, which are often inefficient and expensive, or through using
mirrors to boil water and run the steam through a turbine. All of these forms of renewable
energy have advantages and disadvantages, which make them more or less suited to certain
situations (Lauber, 2005).
Costa Rica has a strong interest in developing renewable energy. In 2007, Costa Rica
declared its intent to be the world’s first carbon neutral country by 2021. Even before this
declaration, many renewable energy projects, such as the Arenal Dam, had already been
undertaken. Lake Arenal, the largest body of water in Costa Rica, is an artificial lake made to
provide a reservoir for the Arenal Dam, which alone generates 70% of the nation’s electricity
annually (Perez, 2006). Many other hydroelectric plants make up a large part of the remainder of
Costa Rica’s electricity generation, but creating new hydroelectric plants has been heavily
opposed by environmental groups as they are viewed as destructive to animal habitats.
Geothermal plants exist in Costa Rica, but expansion in this sector is difficult as many of the best
locations for geothermal plants fall in national parks and nature reserves, where development is
not legal. Solar energy is not widely used in Costa Rica as the weather is often cloudy and solar
energy is ineffective when the solar panels are not in direct sunlight. This leaves wind energy as
the renewable energy source with the greatest potential for expansion in Costa Rica.
6
2.2 History of Wind Power
The power of the wind has long been utilized as a source of mechanical power and since
the 1890s has become a source of electrical power as well. In the 1890s, the Danes developed
the first wind turbines meant to generate electricity. Between 1890 and 1980, electric generation
from wind was limited to small private turbines meant to provide power to people who would not
otherwise have access to electricity (Vogel, 2005). In 1980, the first commercial wind farm that
consisted of more than one turbine was built on Crotched Mountain in southern New Hampshire,
USA. This wind farm consisted of 20 turbines producing 30 kW each, a very small output by
today’s standards.
As a result of the increased interest in wind farming after the oil crises and growing
environmental awareness of the 1970s, the technology of wind farming has made considerable
advances. These advances have come as a result of incentives and tax credits given by
governments at all levels, especially in the United States and Europe (Vogel, 2005). Modern
wind turbines are computer controlled and built from cutting-edge materials, allowing them to be
bigger, more resilient, and more efficient. The technology has developed to the point that wind
energy today costs only 20% of what it did in 1980 (D’Silva, 2010).
Many countries have turned to wind energy as a means of diversifying their electricity
generation sources. Denmark is an excellent example of a country that has achieved enormous
progress in wind energy production. In the early 1970s, 90% of Denmark’s energy came from
imported petroleum. In 1973, an oil crisis hit Denmark. To decrease the price of energy, the
Danish government launched a program in which they covered 30% of investment costs and
guaranteed loans with fixed rates for companies that promoted wind energy, such as the turbine
manufacturer Vestas. Today, Danish companies control one third of the world’s wind turbine
market. Furthermore, Denmark has become the nation that is the most heavily invested in wind
power, producing 19% of its energy from wind farming (Walsh, 2009).
Like Denmark, Costa Rica’s pursuit for renewable energy has resulted in an increased
interest in wind farming. There are already 123 MW of wind turbines installed in Costa Rica and
they produced approximately 309 GWh of wind energy in 2009 (World Wind Energy
Association, 2009). It is likely that investment in wind energy will rise due to the successful
operation of these wind farms. Wind energy has become increasingly appealing in Costa Rica

7
thanks to the decreasing costs of construction, the high priority of renewable energy, and the way
that wind farming complements Costa Rica’s established hydropower infrastructure.
8
2.3 Seasonal Weather Patterns in Costa Rica
In Costa Rica, there are two main seasons, the rainy season and the dry season. The rainy
season in the Guanacaste province lasts from April to November and the dry season lasts from
December to March. The rainy season is marked by very high levels of precipitation, often over
ten inches per month, while in the dry season precipitation regularly falls as low as 1 inch per
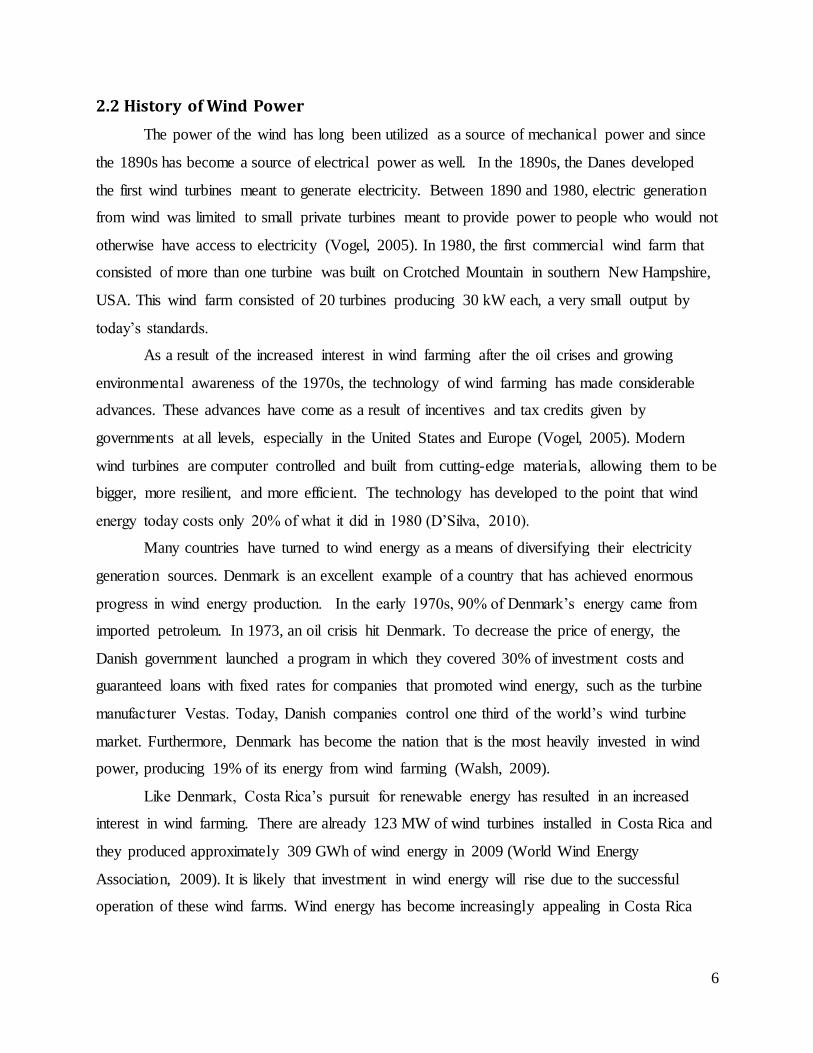
month. However, the national average wind speed moves as the inverse of precipitation. In the
dry season, wind speeds peak around 16 meters per second while, in the rainy season, wind
speeds can be as low as 6 meters per second. While these wind speeds would be higher on a
potential wind farm than the national averages, their relationship with the seasons would be the
same.
Figure 2.2 Relationship between wind speed and precipitation
As Figure 2.2 shows, this inverse relationship presents wind as a perfect seasonal complement to
water in terms of electricity generation.
These seasonal changes affect power generation in Costa Rica through the availability of
different renewable resources during each season. During the rainy season, Costa Rica’s
hydropower plants run at peak performance, while during the dry season the ability of
hydropower plants to meet demand can fall. On the other hand, wind farms can be operating at
their peak efficiency during the dry season. This means that wind farms and hydroelectric
generation complement each other perfectly as means of generating power year-round.
Diversifying the means of power generation is of tremendous importance to a country as
heavily dependent on a seasonally variable source of generation as Costa Rica. On April 19,

9
2007, at the end of the dry season, the entire country of Costa Rica experienced a blackout when
the hydroelectric dam at Lake Arenal failed to meet demand, leading to a critical failure of the
entire nation’s energy distribution system. During the days that followed, Costa Rica dealt with
rolling blackouts until the Arenal dam was able to meet demand again. By diversifying energy
sources, specifically by investing in wind farms, Costa Rican energy providers can avoid
compromising the energy grid in such a way in the future.
10
2.4 Wind Characteristics and Data Collection
To harness wind power to supplement hydroelectric power, wind characteristics must be
understood. The primary wind characteristics we are concerned with are wind speed and
direction, because they are the two main factors that determine power generation at a wind farm.
There are different ways to collect data pertaining to these two characteristics. In addition, these
two characteristics can vary depending on certain conditions such as shear effect and turbulence.
To determine the extent to which these factors affect the power generation, they must be
measured.
2.4.1 Data Collection
The two primary characteristics, wind speed and direction, must be measured and
represented to determine the wind potential of a site. The wind speed is a crucial factor to power
generation, as the energy contained in wind is proportional to the cube of wind speed in the
direction of the blade. However, even at high wind speeds, to capture significant amounts of
energy from wind there should also be a prevailing wind direction on a site. Once the prevailing
wind direction is determined, it will be used for proper turbine placement to ensure that turbine
arrangements are as efficient as possible.
In order to determine the predominant wind direction as well as the wind speeds at a
specific site, wind data collection must be performed. The most common way to perform these
measurements is to place anemometers and wind vanes on the top of met towers that are at or
near the same height as the proposed wind turbine’s hub. Towers should be uniformly distributed
across the site and wind data ideally should be collected for at least a year. Data gathered using
this method is usually considered highly detailed wind data.
Wind data can also be extrapolated from the wind data that has been collected from
neighboring wind farms, if such data exists and is available. However, this method of data
collection may lack the accuracy of on-site collection. A wind atlas can also be referenced for a
general understanding of potential wind speeds and potential power generated in different parts
of a country.
Simply by looking at nature we find another method of determining the predominant
wind direction. When trees are subjected to strong winds predominantly in one direction, it
causes a growth response called flagging where the tree grows in a certain direction. As shown

11
by the tree bending in Figure 2.3, local vegetation will adapt to the prevailing wind direction by
leaning in the direction the wind is blowing. Therefore, this can be very useful as an indicator of
the prevailing wind direction which is critical in understanding the orientation the wind turbine
layout of the site must have (Danish Wind Industry Association, 2003).
Figure 2.3 A tree experiencing flagging (Danish Wind Industry Association, 2003)
2.4.2 Effects Related to Major Wind Characteristics
An effect pertinent to wind speed is the phenomenon called the shear effect. It details how wind
speed is directly affected by altitude, where the closer the wind is to the ground, the slower it is.
The variation of wind speed is due to the frictional force caused by the roughness of the terrain,
which opposes the direction and motion of the wind and incites turbulence. This effect is
described by the wind shear equation:
In this equation, and are the average wind speeds at the heights and . is a shear
exponent and it is dependent on terrain roughness. Determining the roughness class of a
proposed site is crucial to the estimation of energy generation, since it directly affects wind
speed. The roughness of a terrain is classified by roughness classes expressed in numerical
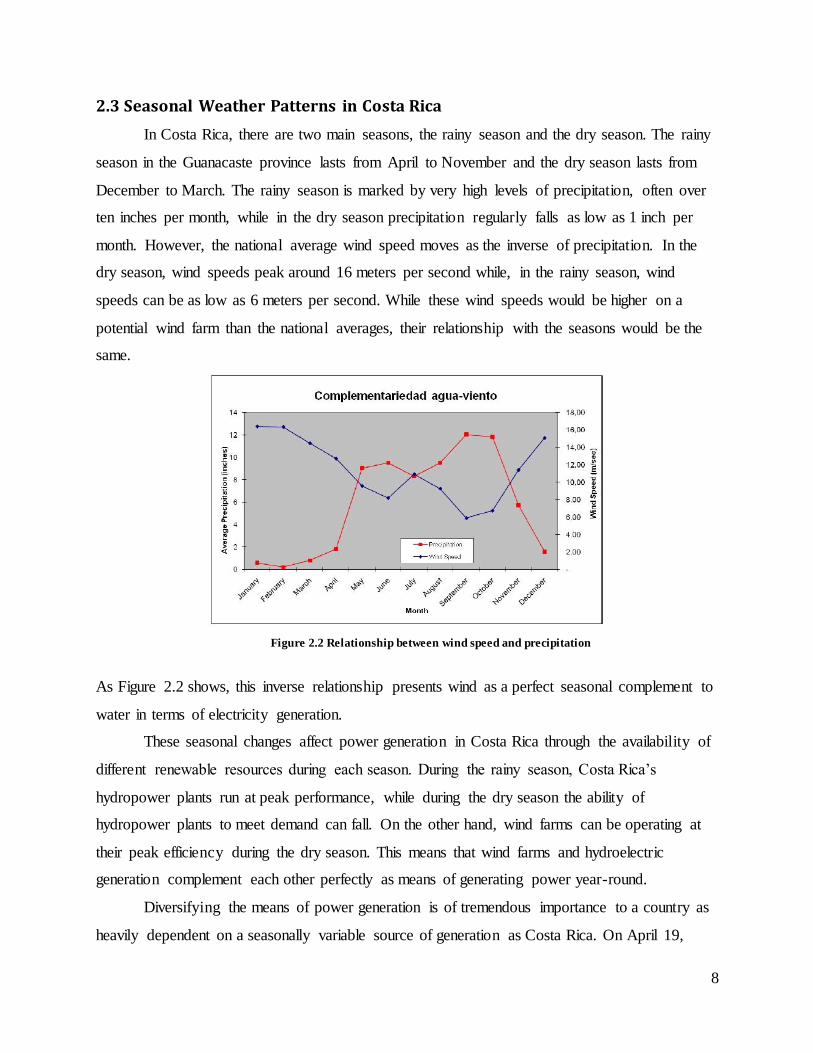
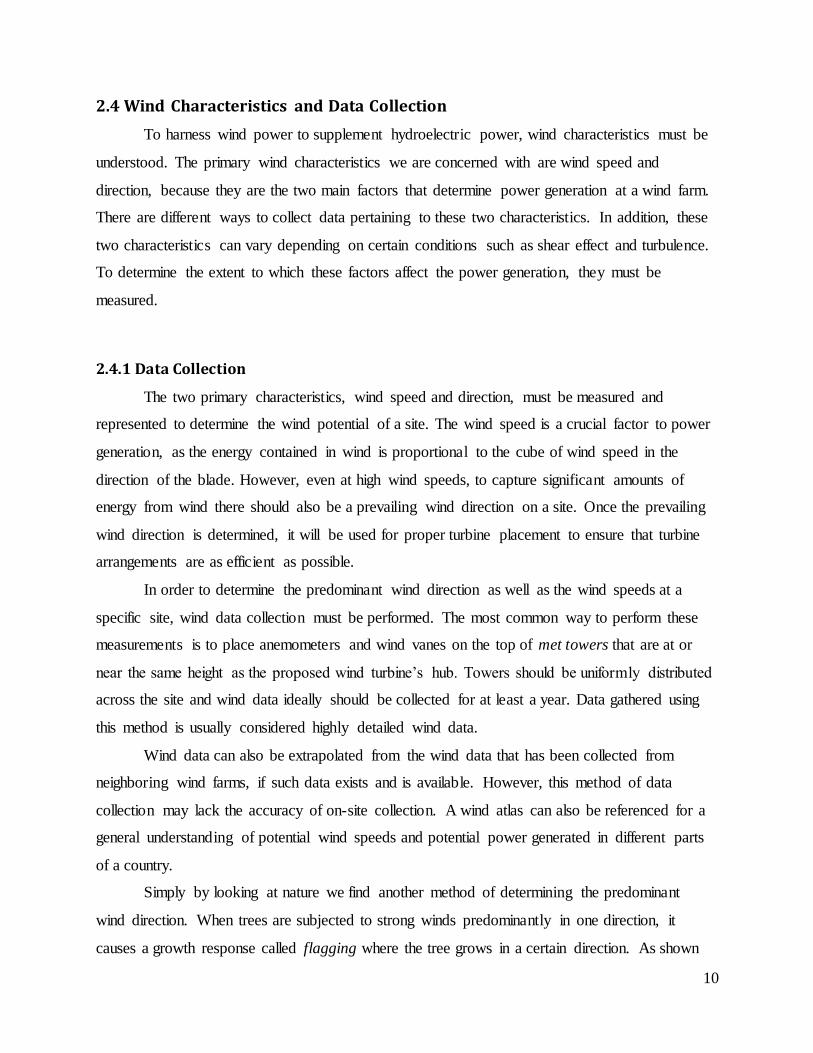
values on a scale of 0 to 4 (WAsP). Smooth surfaces such as water or an open area with few
wind breaks as illustrated in Figure 2.4, have low roughness, therefore they would be ranked
between 0 and 1 in terms of roughness class. Landscape with a moderate number of trees and a
few hills as shown in Figure 2.5, would be ranked at a roughness class of 2. If the landscape has
many trees and obstacles as shown in Figure 2.6, it would make the terrain very rough, making
the roughness class around 3 to 4. It would be very complex and inefficient to place a wind
turbine on a site with a roughness class of 3-4. One way to determine roughness class is by using
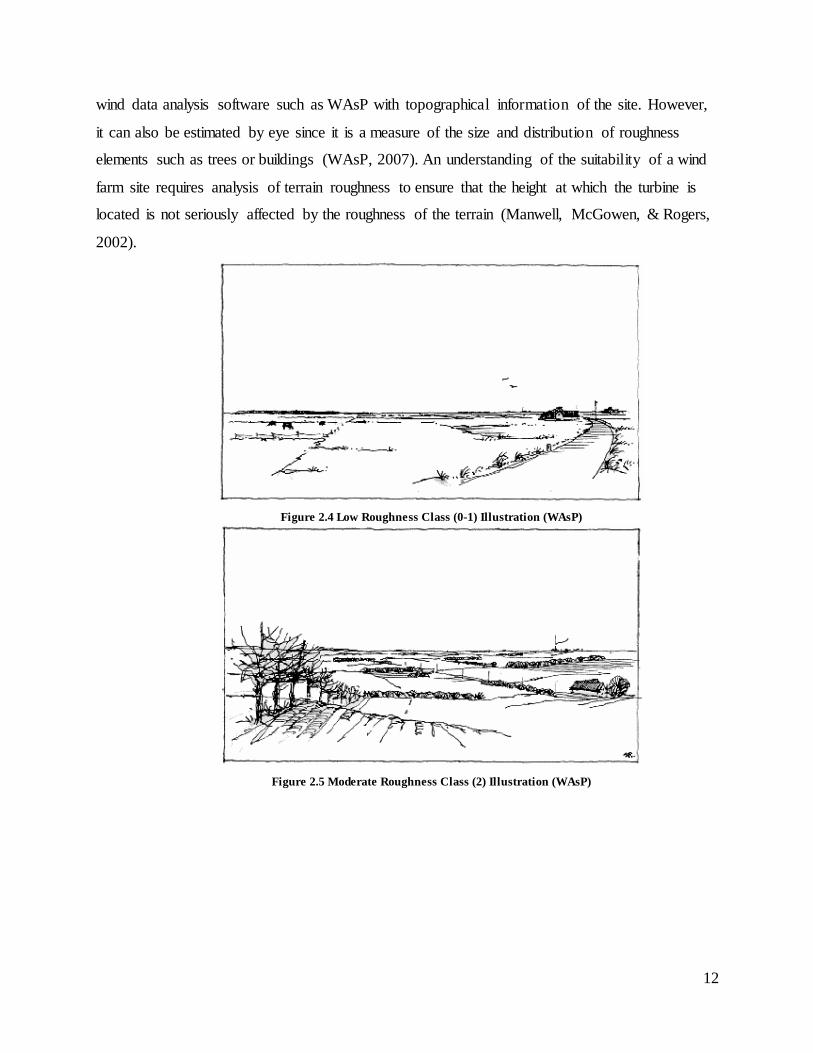
12
wind data analysis software such as WAsP with topographical information of the site. However,
it can also be estimated by eye since it is a measure of the size and distribution of roughness
elements such as trees or buildings (WAsP, 2007). An understanding of the suitability of a wind
farm site requires analysis of terrain roughness to ensure that the height at which the turbine is
located is not seriously affected by the roughness of the terrain (Manwell, McGowen, & Rogers,
2002).
Figure 2.4 Low Roughness Class (0-1) Illustration (WAsP)
Figure 2.5 Moderate Roughness Class (2) Illustration (WAsP)
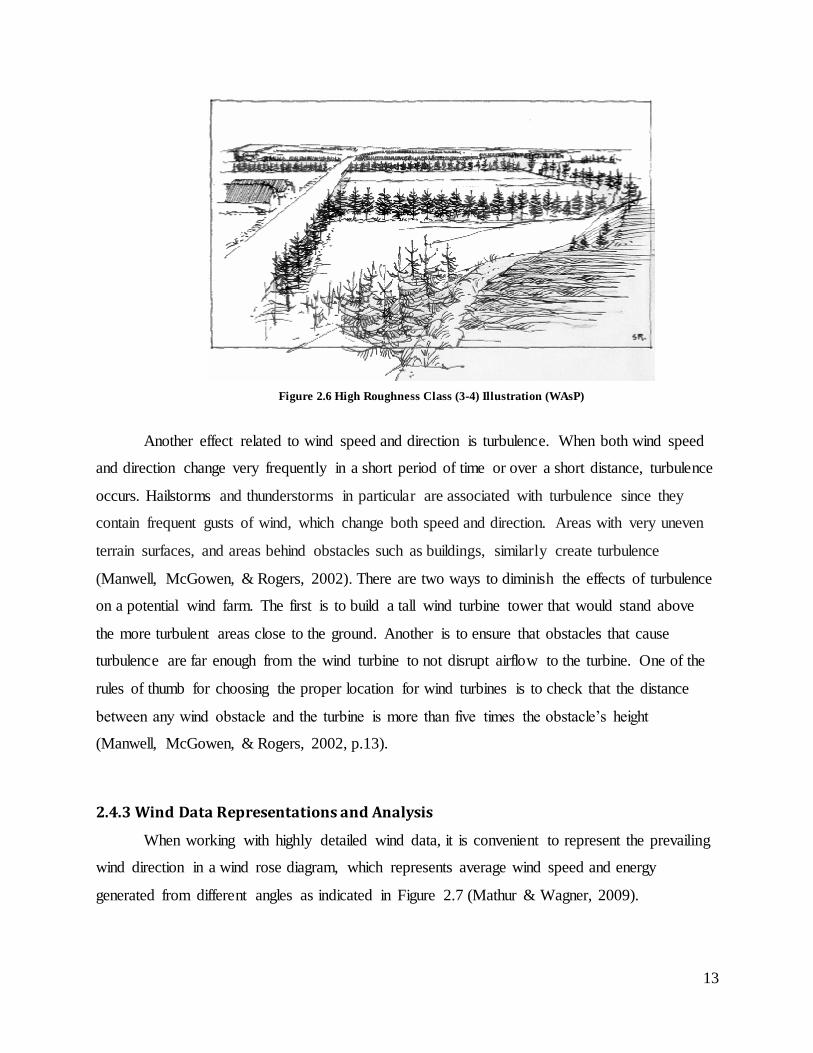
13
Figure 2.6 High Roughness Class (3-4) Illustration (WAsP)
Another effect related to wind speed and direction is turbulence. When both wind speed
and direction change very frequently in a short period of time or over a short distance, turbulence
occurs. Hailstorms and thunderstorms in particular are associated with turbulence since they
contain frequent gusts of wind, which change both speed and direction. Areas with very uneven
terrain surfaces, and areas behind obstacles such as buildings, similarly create turbulence
(Manwell, McGowen, & Rogers, 2002). There are two ways to diminish the effects of turbulence
on a potential wind farm. The first is to build a tall wind turbine tower that would stand above
the more turbulent areas close to the ground. Another is to ensure that obstacles that cause
turbulence are far enough from the wind turbine to not disrupt airflow to the turbine. One of the
rules of thumb for choosing the proper location for wind turbines is to check that the distance
between any wind obstacle and the turbine is more than five times the obstacle’s height
(Manwell, McGowen, & Rogers, 2002, p.13).
2.4.3 Wind Data Representations and Analysis
When working with highly detailed wind data, it is convenient to represent the prevailing
wind direction in a wind rose diagram, which represents average wind speed and energy
generated from different angles as indicated in Figure 2.7 (Mathur & Wagner, 2009).
14
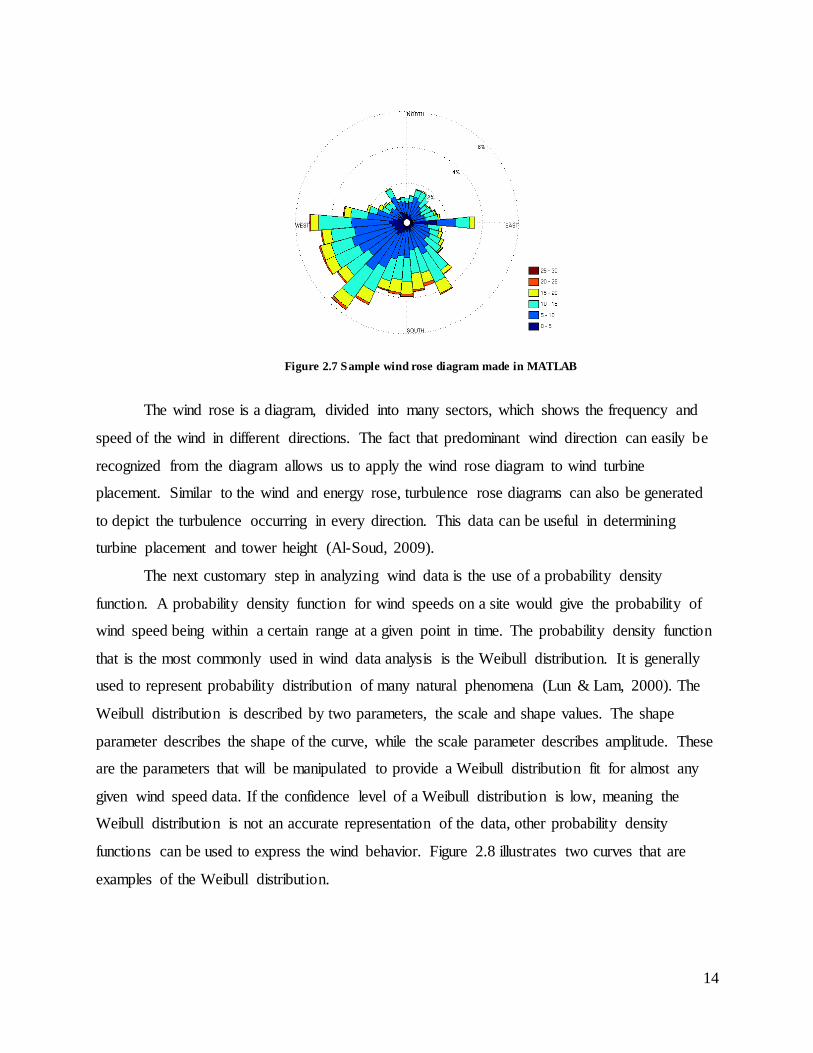
Figure 2.7 Sample wind rose diagram made in MATLAB
The wind rose is a diagram, divided into many sectors, which shows the frequency and
speed of the wind in different directions. The fact that predominant wind direction can easily be
recognized from the diagram allows us to apply the wind rose diagram to wind turbine
placement. Similar to the wind and energy rose, turbulence rose diagrams can also be generated
to depict the turbulence occurring in every direction. This data can be useful in determining
turbine placement and tower height (Al-Soud, 2009).
The next customary step in analyzing wind data is the use of a probability density
function. A probability density function for wind speeds on a site would give the probability of
wind speed being within a certain range at a given point in time. The probability density function
that is the most commonly used in wind data analysis is the Weibull distribution. It is generally
used to represent probability distribution of many natural phenomena (Lun & Lam, 2000). The
Weibull distribution is described by two parameters, the scale and shape values. The shape
parameter describes the shape of the curve, while the scale parameter describes amplitude. These
are the parameters that will be manipulated to provide a Weibull distribution fit for almost any
given wind speed data. If the confidence level of a Weibull distribution is low, meaning the
Weibull distribution is not an accurate representation of the data, other probability density
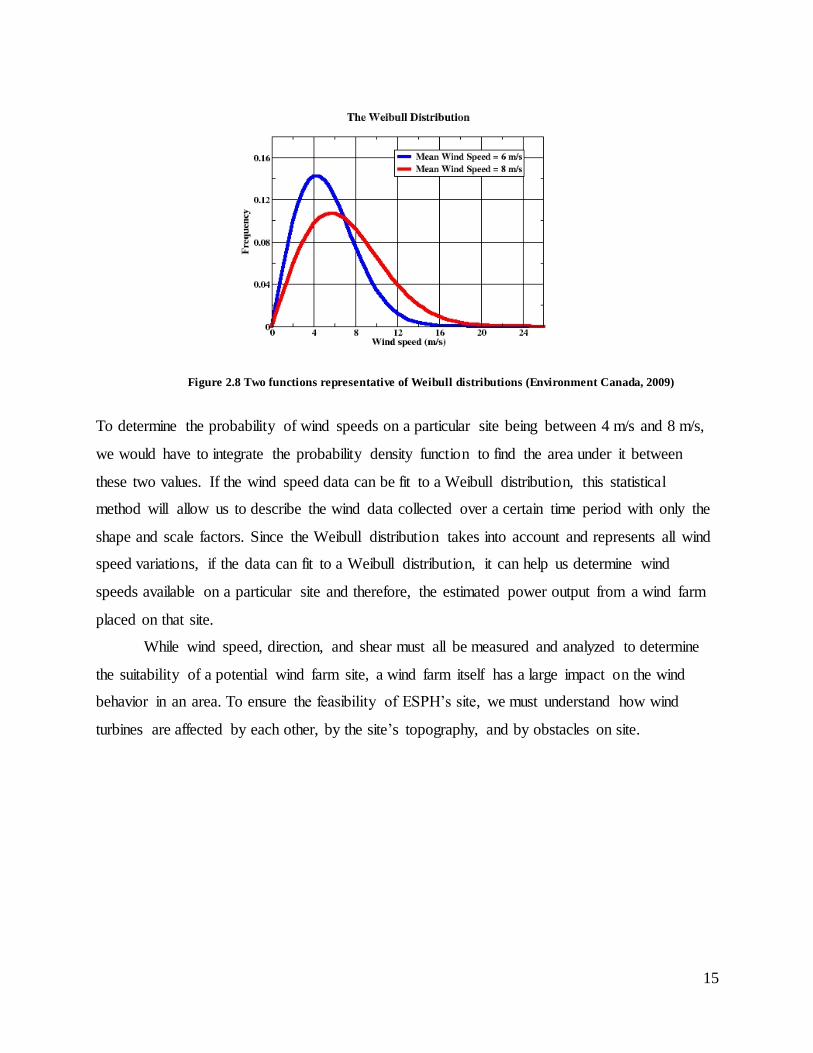
functions can be used to express the wind behavior. Figure 2.8 illustrates two curves that are
examples of the Weibull distribution.
15
Figure 2.8 Two functions representative of Weibull distributions (Environment Canada, 2009)
To determine the probability of wind speeds on a particular site being between 4 m/s and 8 m/s,
we would have to integrate the probability density function to find the area under it between
these two values. If the wind speed data can be fit to a Weibull distribution, this statistical
method will allow us to describe the wind data collected over a certain time period with only the
shape and scale factors. Since the Weibull distribution takes into account and represents all wind
speed variations, if the data can fit to a Weibull distribution, it can help us determine wind
speeds available on a particular site and therefore, the estimated power output from a wind farm
placed on that site.
While wind speed, direction, and shear must all be measured and analyzed to determine
the suitability of a potential wind farm site, a wind farm itself has a large impact on the wind
behavior in an area. To ensure the feasibility of ESPH’s site, we must understand how wind
turbines are affected by each other, by the site’s topography, and by obstacles on site.
16
2.5 Wind Behavior on a Wind Farm
Wind behavior can be affected by certain phenomena, which can influence the placement
of wind turbines. These effects must be taken into consideration to ensure that optimal power is
produced at the site.
A type of wind behavior that is common in wind farms is the shadow effect. When wind
encounters an obstacle, such as a turbine, there will be a decrease in wind speed immediately
behind the obstacle. A certain distance away from that obstacle, the wind speed will return to the
original speed. Therefore, if a second turbine were placed within the shadow of another turbine,
the second turbine would produce less electrical energy. It is also important to consider obstacles
other than wind turbines, and how they could affect power generation on a wind farm. When
choosing the locations for wind turbines on a wind farm, the shadow effect will play a significant
role. This effect must also be considered when evaluating the size of a wind farm, as the wind
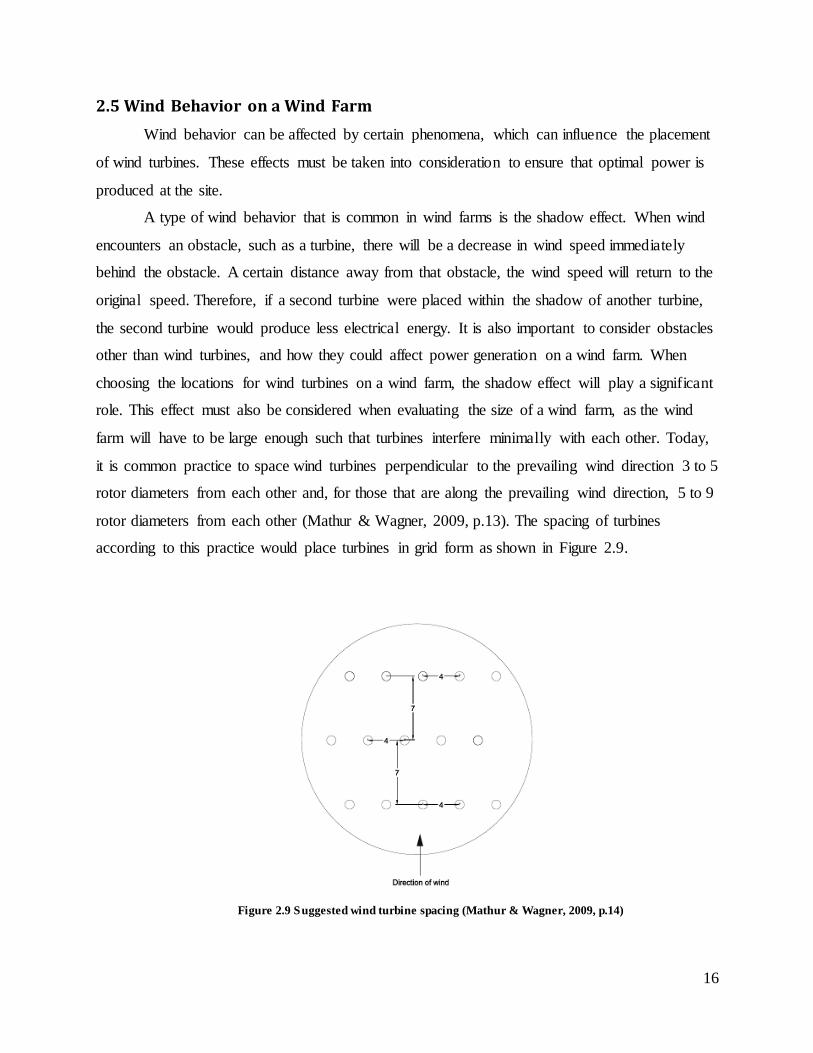
farm will have to be large enough such that turbines interfere minimally with each other. Today,
it is common practice to space wind turbines perpendicular to the prevailing wind direction 3 to 5
rotor diameters from each other and, for those that are along the prevailing wind direction, 5 to 9
rotor diameters from each other (Mathur & Wagner, 2009, p.13). The spacing of turbines
according to this practice would place turbines in grid form as shown in Figure 2.9.
Figure 2.9 Suggested wind turbine spacing (Mathur & Wagner, 2009, p.14)

17
Other wind effects pertinent to turbine placement are the tunnel effect and hill effect. An
example of the tunnel effect would be the change in wind flow through canyons. Wind speeds
are usually higher in tunnels, making tunnels attractive for wind turbines. However, if the sides
of the tunnel are uneven, they will cause turbulence, which is undesirable for wind turbines. The
hill effect describes the phenomena where the wind speed is higher on the top of hills. Placing a
wind turbine on hills or ridges overlooking the surrounding areas takes advantage of the hill
effect. In addition, there is less interference from any obstacles that might diminish the wind
speed (Mathur & Wagner, 2009). However, if the hill is too steep or has uneven terrain, there can
be a significant amount of turbulence, which may nullify the advantage of higher wind speed
(Danish Wind Industry Association, 2003).
These wind behaviors need to be taken into account for turbine placement and orientation
when planning a wind farm. Additionally, terrain characteristics associated with these wind
behaviors would allow us to assess if the proposed site would be appropriate for setting up a
wind farm. Analysis of the wind information based on wind characteristics and wind behavior
would aid in predicting the possible power generated by the wind turbines.
18
2.6 Wind Power Generation
Wind power generation is determined by the energy captured by the wind turbines.
Energy enters a wind turbine system through the rotor blades. The kinetic energy from the wind
is converted into the rotational kinetic energy of the blades, which is then converted to electrical
energy in the wind turbine.
2.6.1 Power Generation
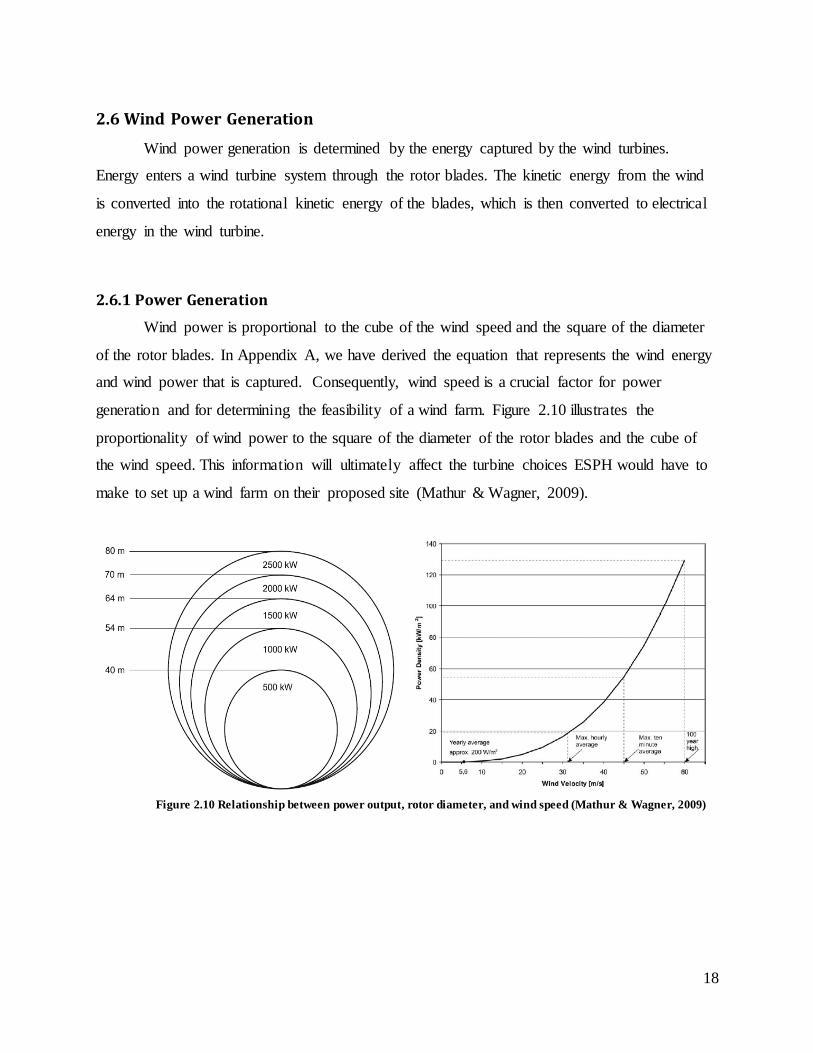
Wind power is proportional to the cube of the wind speed and the square of the diameter
of the rotor blades. In Appendix A, we have derived the equation that represents the wind energy
and wind power that is captured. Consequently, wind speed is a crucial factor for power
generation and for determining the feasibility of a wind farm. Figure 2.10 illustrates the
proportionality of wind power to the square of the diameter of the rotor blades and the cube of
the wind speed. This information will ultimately affect the turbine choices ESPH would have to
make to set up a wind farm on their proposed site (Mathur & Wagner, 2009).
Figure 2.10 Relationship between power output, rotor diameter, and wind speed (Mathur & Wagner, 2009)
19
2.6.2 Turbine Components and Energy Conversion
When considering power generation it is essential to understand the components that
make it possible. The main parts of a wind turbine system are the rotor blades, the gearbox, the
generator, the turbine tower and the control system. Each part is described in greater detail in
Appendix Z. The understanding of the wind turbine anatomy is necessary to build an efficient
wind farm and for an understanding of the types of wind turbines currently available in the
market.
A wind turbine will not be able to capture and convert all of the energy provided by the
wind. Theoretically, the maximum wind power that can be captured by the turbine is 59.25 % as
stated by Betz’s Law. There are more power losses in the gearbox and the generator, which
further limit the efficiency of the wind turbine. The equation for calculating wind power that
takes into consideration these power losses is shown and explained in Appendix B (Mathur &
Wagner, 2009).
2.6.3 Wind Turbine Selection
Currently there are wind turbines with power ratings ranging from 250 W to 7 MW on
the market (AWEA). ESPH is looking for PEVA to have a name-plate power rating between 10
MW and 20 MW. When comparing turbines, there are many parameters to take into
consideration to ensure that the selected turbine will produce the optimal amount of energy and
will be adequate for ESPH to meet their power generation goals.
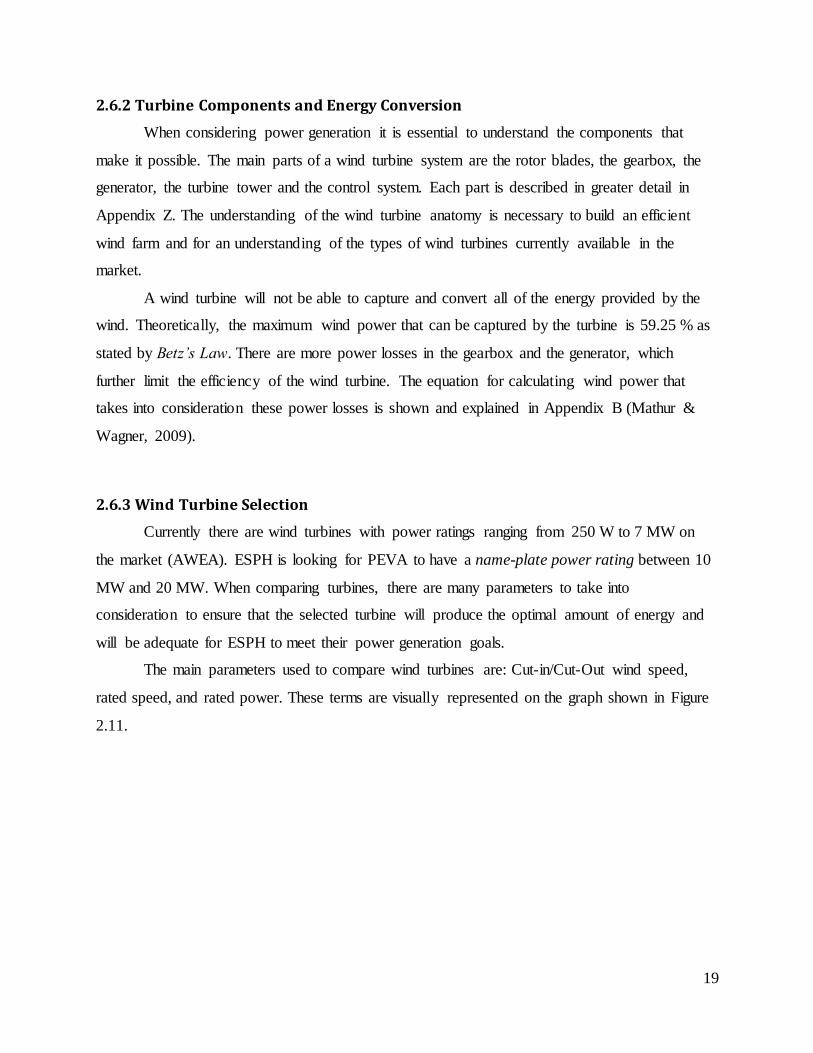
The main parameters used to compare wind turbines are: Cut-in/Cut-Out wind speed,
rated speed, and rated power. These terms are visually represented on the graph shown in Figure
2.11.
20
Figure 2.11 Idealized power curve for a wind turbine (Environment Canada, 2009)
Cut-In speed represents the lowest wind speed at which the wind turbine starts generating
electricity. Similarly, Cut-Out speed is the highest wind speed at which the wind turbine operates
before it is shut off to avoid any damage to the surroundings and the turbine itself. Rated speed is
the wind speed at which the turbine is producing the rated power, which represents the power
produced by a wind turbine when it is operating at optimal efficiency (Mathur & Wagner, 2009).
It is important to note that these parameters only make up a part of the information
necessary for the turbine selection process. As mentioned earlier, wind turbine components and
the wind speed available on site will also play into the selection process. For instance, a turbine
with a higher rated power may seem to be a good option since it will produce more power at
optimal efficiency. However, on a site with low wind speeds, a turbine with a higher rated power
may not produce as much energy as a lower rated turbine because the turbine with a low rated
capacity may be operating more efficiently at these low wind speeds (Danish Wind Industry
Association, 2003).
From this research, we conclude that the wind speed and the rotor diameter are vital
variables when analyzing the wind power produced by a wind turbine. Therefore performing
careful wind speed analysis is vital for the feasibility study. In addition, when the wind turbine
recommendations are made, it is necessary to take into consideration the wind speeds available
on site, the components of the turbine and the parameters for turbine comparison.
21
2.7 Construction Feasibility and Financial Feasibility
Construction and financial feasibility are also important factors to consider since they
determine if the construction of a wind farm and the power generation on the proposed site
would return a profit after a reasonable payback period. The construction feasibility can only be
determined as a consequence of the costs involved with the site preparation and turbine
installation of the wind farm. Therefore, to determine the construction and financial feasibility
the following factors must be examined: land conditions present on site, infrastructure necessary
to facilitate the construction of the turbines, initial cost of set up, cost of maintenance of the wind
farm, and the payback period for these costs.
The initial cost of setting up the wind farm includes the costs of the wind turbines,
transportation of the turbines, site preparation, and turbine installation. Some sources say that, in
general, the initial cost of a wind farm can be between $1,300 to $1,800 per kW of installed
power. However, other factors such as local labor costs and turbine specification might cause the
initial cost to lie outside this range. In addition, the taller the turbine tower, the more it will
increase the initial cost (Mathur & Wagner, 2009). The cost for transportation of the wind
turbines is usually included in the initial cost of the turbines. However, this cost may increase
depending on the road access available to the site. Even if the site were to be remote, the
transportation of a single wind turbine to the site generally should not exceed $15,000. However,
since many turbines are being transported from the manufacturer to the proposed site, the
transportation cost per turbine will be reduced dramatically (Danish Wind Industry Association,
2003).
The site preparation and installation phase of construction introduce many specific
factors, which contribute to the initial cost. These factors include preparing the grounds for set
up, laying roads for transport, and the connection to the electricity grid. Preparing the grounds
includes laying reinforced concrete foundations for the construction of the wind turbines and
laying access paths to the turbines on site. Once the grounds are prepared, the transportation of
the turbines must be considered in case the roads to the site are not suitable for turbine
transportation. Therefore laying roads to and on the site could also become a part of the initial
cost. Transmission lines are another necessary factor that contributes to the initial cost, as it is
required to transfer energy produced by the wind farm to a local power grid. Usually, electricity
produced by wind farms cannot be directly connected to the local power grid. In this case, the
22
wind farm might also have to purchase a transformer to convert the power from the turbines to a
voltage suitable for the electricity grid the wind farm is connected to. Although it is not a
necessity, the installation of a telephone connection on the wind farm may contribute to the
initial cost. The telephone connection provides a way to remotely control and have constant
surveillance over the turbines in the wind farm and is usually very cheap to install. These factors
contribute to the set-up of the infrastructure necessary to transport and construct the wind
turbines. The associated costs for this phase depends on local labor costs, soil conditions,
distance to the nearest access road, cost of transporting construction equipment to the site, and
the distance to the nearest electric grid connection. Taking these elements into consideration, we
must consider all of these aspects when determining the cost of establishing a wind farm: cost of
the wind turbines themselves, transportation of the wind turbines, site preparation and turbine
installation costs (Danish Wind Industry Association, 2003).
Most wind turbine manufacturers offer services to set up the wind farm. The exact cost
for these services would have to be negotiated between ESPH and the manufacturer. The
companies GE1, Vestas2, and Gamesa3 offer services to assist their customers with building a
wind farm. GE even gives its potential customers a general estimation of $2 million per MW of
wind turbines installed according to the AWEA (AWEA, 2009).
Another cost involved in feasibility is the operation and maintenance cost of the wind
farm. Studies show that maintenance costs are on average 1.5 – 2% of the original cost of the
turbine annually (Mathur & Wagner, 2009). This maintenance cost for the wind turbine will
increase depending on the age of the turbine. During the payback period calculations, the
maintenance cost would be factored in as $0.01/kWh to take in the consideration the cost
increase as the turbines age. It is also important to consider the insurance cost of the wind
turbines. As wind turbines wear out over time it is generally more efficient to replace parts of the
turbines rather than replacing the entire turbine. The cost of parts such as the rotor blades,
gearbox or the generator is about fifteen to twenty percent of the cost of a turbine. However,
these expenses would have to be considered in the future. They cannot be calculated accurately
1 http://www.gepower.com/prod_serv/serv_for/wind_turbines/en/index.htm
2 http://www.vestas.com/en/wind-power-plants/wind-project-planning.aspx#/vestas-univers
3 http://www.gamesacorp.com/en/products -and-services/wind-farms/

23
since circumstantial factors would come into play in terms of how quickly a wind turbine would
age (Mathur & Wagner, 2009).
Calculating the payback period of a wind farm is a process that takes into consideration
the following variables: initial cost, operation and maintenance cost, the price at which
electricity is sold, loan payback, and the power generation on the proposed site. A feasibility
study performed in Brazil contains an analysis on the relationships between the different aspects
of feasibility and the way they can affect the financial feasibility of the site. Through computer
simulation, the authors analyzed how different layouts of the wind farm affected the capacity
factor of the farm and, by extension, how the layouts affected the investment payback period of
the farm. They aimed to achieve a layout for turbine placement that maximized profit from the
farm (de Araujo Lima & Bezerra Filho, 2010). Therefore, the expected payback period can only
be calculated once all other feasibility evaluations pertinent to the wind farm have been
performed.
In summation, the construction and financial feasibility of a wind farm depends on site
preparation, turbine installation, price of turbines, transportation of turbines, the operation and
maintenance costs, and the payback period.
24
2.8 Wind turbines and Seismology
Costa Rica is a seismologically active country and, therefore, we must evaluate the
effects that seismology might have on wind turbines. The PEVA site is located near the Arenal
Volcano. Therefore, we examined seismological activities in that region and how they might
affect wind turbines. Even though Arenal Volcano is the most active volcano in Costa Rica,
results from seismological equipment installed there indicate that there are relatively low levels
of activity (10 to 15 microearthquakes per month) (ARENAL.NET, 2006). In addition, there are
many wind farms, hydroelectric power plants and geothermal power plants at the Arenal
Volcano that have operated there for decades. This seems to indicate that seismology is a
concern, but has not yet proven to be a threat.
To confirm this, we examined research that has been done on this topic. According to a
report called Seismic Forces for Wind Turbine Foundation: “The shake table testing program
found that there was significant amplification of the input seismic acceleration in the nacelle
during all shake table tests of the turbine (Ntambakw & Rogers, 2009, p.13).” Significant
amplification of the input seismic acceleration is definitely a subject of concern, but a method to
reduce this is given in a study performed by Guralp Systems. According to them, changing the
design of the turbine foundations so that they can take into account seismic coupling and
structural stability would make turbines generate vibrations of a lower magnitude (Guralp
Systems, 2006). If turbines generate smaller vibrations, that implies lower influence between
earth and a tower, and vice versa. Therefore, we can assume that this method would make
turbines more earthquake resistant. There are not many studies that have been done on
seismological effects on wind turbines. However, one currently being executed by University of
California, San Diego, will include simulated earthquakes and their influence on 24 meter wind
turbines and will hopefully answer many questions in this field (Lafee, 2010).
The research that we have done on seismology and it relation to wind turbines indicates
that this is a relatively new field of study; nonetheless, the methods of strengthening the
foundations of the towers should be discussed with the turbine manufacturers. In addition,
seismological activities in the vicinity of the Arenal Volcano have not affected other power
plants in recent decades and therefore should not be a great concern for PEVA wind farm.
25
2.9 Social and Environmental Impacts of Wind Farming
All technological developments such as wind farms, impact those involved both
voluntarily and involuntarily. Four major areas of concern are social impacts on the surrounding
area, the quantity of reduction in fossil fuel emissions, impact on the ecosystem during
construction, and effects on the fauna at the proposed site (Committee on Environmental Impacts
of Wind Energy Projects National Research Council, 2007).
2.9.1 Social Impacts
A wind farm developer needs to take into consideration the effects on any nearby
neighborhoods or communities caused by the installation of the wind farm. There are three main
parts to the social impacts on surrounding communities: aesthetics of the wind facility, noise
generated by the wind farm and the disturbance caused by the construction phase of the wind
farm.
Aesthetics
Although some people consider wind turbines to be beautiful, others may consider them
visually unpleasant (Committee on Environmental Impacts of Wind Energy Projects National
Research Council, 2007). This aesthetic impact is subjective and cannot be prevented or
adjusted. However, shadow flickering is an aesthetic impact that can be predicted and may be
prevented or explained to surrounding communities. Shadow flickering is an effect that occurs
due to the rotating blades. Depending on the time of the day and time of the year, the moving
shadow of the blade might prove to be an aesthetic nuisance (AWEA, 2009). This might affect
anyone living nearby who might fall under the shadow of the windmill. However, the position of
the shadow, duration of the flicker and when it will occur can be calculated. Therefore, if placing
the turbine in a particular spot causes its shadow to disturb any nearby communities excessively,
it might be better to avoid placing that turbine in that spot. However if the shadow flicker affects
any neighboring community for only a couple hours over a year, then the community can be
made aware of it before the construction of the wind farm, to ensure that they consent to it.
Shadow flicker is not a big problem in the United States because the sun’s angle is not very low
in the sky, causing the shadow of the turbine to stay short and close to the turbine. In Costa Rica,
the sun’s angle is even higher, further diminishing the reach of the shadow flicker. Any effect
26
experienced in the United States is usually for a very short period, usually a couple hours over a
year (AWEA, 2009). There are also methods to reduce the effects of shadow flicker after the
turbine has been constructed. Trees can be planted in the way of the shadow to reduce the degree
of light fluctuation. In addition, wind energy developers in the past have also considered shutting
down turbines during the period of the day when the shadow flicker occurs (McMahan, 2009).
Wind farm investors should discuss these aesthetic impacts in detail with surrounding
communities to confirm that they approve the implementation of the wind farm.
Noise
Another factor that nearby communities could consider as a nuisance would be the noise
created by the wind turbines. Noises from wind turbines can either be produced by the
interaction of the wind against the blade or the mechanical noise made by the components of the
wind turbine. The noise caused by the wind interacting with the blade is the noise that is most
often associated with the turbine. The mechanical noises produced by the components of a wind
turbine are usually cacophonous. However utility scale turbines, such as the ones that ESPH will
be using for their proposed site will be well insulated, therefore the mechanical noise will not be
heard outside the turbine (Alberts, 2006).
On average, a wind turbine generates noise that can be heard 40 meters away at 50-60dB,
which is around the noise level of conversational speech. Furthermore, an on-shore wind project
can produce around 35-45 dB at a range of 300 meters (Committee on Environmental Impacts of
Wind Energy Projects National Research Council, 2007). Figure 2.12 illustrates the comparison
of the noise caused by a wind turbine to other noises.
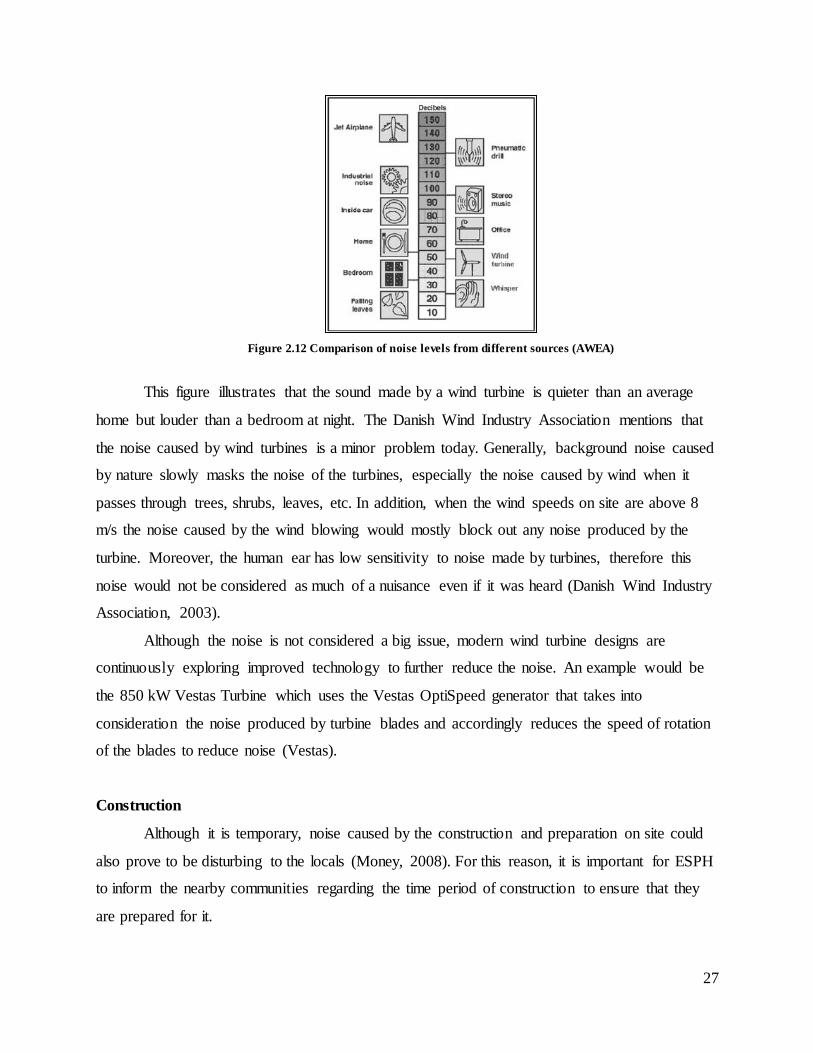
27
Figure 2.12 Comparison of noise levels from different sources (AWEA)
This figure illustrates that the sound made by a wind turbine is quieter than an average
home but louder than a bedroom at night. The Danish Wind Industry Association mentions that
the noise caused by wind turbines is a minor problem today. Generally, background noise caused
by nature slowly masks the noise of the turbines, especially the noise caused by wind when it
passes through trees, shrubs, leaves, etc. In addition, when the wind speeds on site are above 8
m/s the noise caused by the wind blowing would mostly block out any noise produced by the
turbine. Moreover, the human ear has low sensitivity to noise made by turbines, therefore this
noise would not be considered as much of a nuisance even if it was heard (Danish Wind Industry
Association, 2003).
Although the noise is not considered a big issue, modern wind turbine designs are
continuously exploring improved technology to further reduce the noise. An example would be
the 850 kW Vestas Turbine which uses the Vestas OptiSpeed generator that takes into
consideration the noise produced by turbine blades and accordingly reduces the speed of rotation
of the blades to reduce noise (Vestas).
Construction
Although it is temporary, noise caused by the construction and preparation on site could
also prove to be disturbing to the locals (Money, 2008). For this reason, it is important for ESPH
to inform the nearby communities regarding the time period of construction to ensure that they
are prepared for it.
28
Minor Social Impacts
There are also minor social impacts that could help the economies of neighboring
communities. A few of them include land owners leasing land for wind farm use and the
construction and maintenance jobs created for the wind farm. In the United States, wind farms
have usually been based on private lands and seldom are they purchased. Wind project
developers usually lease the land for the wind farm. If landowners for the proposed site live in
the nearby communities it would definitely help the local community’s economy. In terms of
employment, currently, there are around half a million people employed by the wind industry
worldwide (European Wind Energy Association, 2010). Therefore, installation of an additional
wind farm presents the local communities with great job opportunities for skilled labor.
In summary, wind farm developers must take into consideration the mentioned social
impacts when constructing a wind farm. Aesthetics, noise and construction are the main social
impacts associated with the setup of a wind farm. Minor social impacts such as the boosting of
local economy can be circulated among local communities as a way to gain financial and social
support for the construction of the wind farm.
2.9.2 Fossil Fuel Reduction
Implementation of a wind energy system for power generation would help replace power
produced by fossil fuels, which is known to release emissions harmful to the atmosphere. The
maximum capacity of the wind farm ESPH is looking to establish at PEVA is 20 MW. If it were
to operate at its maximum capacity all year round, it would have to operate at 20 MW output all
365 days of the year and all 24 hours of the day. Hence, we would have the following
calculation:
( )
However since wind farms are known to operate at 20 – 40 % of their maximum capacity
(Mathur & Wagner, 2009), we can expect the wind farm to produce about 3.5 × 10⁷ kWh to 7.0 ×
107 kWh. Since the annual electricity consumption in Costa Rica is about 8.0 × 10⁹ kWh, the
electricity produced by this wind farm would constitute to about 0.4 – 0.9% of the electricity
consumed in the country (CIA, 2009). Other factors such as the seasonal usage of the wind
29
turbines would further lower the production capacity of the wind farm. Therefore, the quantity of
energy produced by this plant would not reduce fossil fuel emissions in Costa Rica by a
significant amount.
2.9.3 Impact on Ecosystem
The construction period of the wind farm is bound to affect the environment since the
terrain is being adapted for the use of power generation. The ecosystem will be affected due to
the sudden increase of human activity in the area. In addition, site preparation could include
removal of vegetation, compaction of soil, soil erosion, and changes in the hydrologic features
on site. During construction, there will also be large machinery on site, which might displace
animals that live in that area and result in a loss of their habitat (Erickson et al., 2001). Currently
a wind energy project in Puerto Rico is not allowed to proceed for similar reasons. The site there
proposed for the wind farm is currently the habitat for the endangered Puerto Rican nightjars and
the endangered Puerto Rican crested toad. Habitat conservationists are protesting against the
project to conserve the habitats of the endangered species, which would be displaced or could go
extinct due to lack of an appropriate environment (Fry, 2010). Therefore, a careful study of the
species currently living in the area, and a more open approach to conserving them must be
considered.
2.9.4 Birds and Wind Farms
Since wind turbines are located at a high altitude, birds flying through the site have been
reported to be killed by them. There is currently not enough information to predict the number of
bird fatalities in Costa Rica, but there has been research conducted in the U.S. involving bird
fatalities and the reasons behind them. Studies done in the U.S. show that wind turbines cause
less than 1% of bird fatalities (AWEA, 2009). In 2003, an estimated 20,000 to 37,000 birds were
killed due to wind turbines, whereas estimated bird mortality comes close to a billion per year
(Committee on Environmental Impacts of Wind Energy Projects National Research Council,
2007).
A comprehensive case study was done on bird fatalities in the Alamont Pass Wind
Resource Area (APWRA), a wind farm in California. This study brought to attention the
ecosystem that adapted to the wind farm and its relationship to bird fatalities. The study found

30
that cattle tended to spend a large amount of time near the base of the wind turbine. As a
consequence, cow manure collects around the turbines. This manure fed grasshoppers, and this
caused an accumulation of grasshoppers around the bases of the wind turbines. These
grasshoppers are a common prey for the American kestrel and the burrowing owl. As evidence,
they found freshly killed red-tailed hawks to contain grasshoppers. Another reason for bird
fatalities at the APWRA may be because burrowing mammals also tend to live near wind
turbines. The way wind farms are constructed creates many artificial vertical and lateral edges in
the landscape. These edges are the preferred habitat for these mammals, which were a common
prey for raptors that live around the APWRA site. Therefore, it can be surmised that the reasons
for bird fatalities are not directly related to the turbine or the wind facility but rather the
ecosystem that builds on that facility (Thelander, 2004).
BioResource Consultants (BRC) also researched the APWRA site in 1998 and found a
set of characteristics of wind farms that caused bird fatalities. They realized that danger to birds
increased with tower height, and rotor diameter. In addition, turbines on steeper slopes were
more dangerous to raptors. They also found that rows of wind turbines were much safer and
caused fewer bird fatalities. The BRC also proposed ways to avoid bird fatalities. Wind farm
developers can allow vegetation to grow taller near the wind turbines to decrease the visibility of
grasshoppers and burrowing mammals. As a consequence this will decrease the chances of birds
flying near the turbine. If possible, preventing cattle from congregating under the wind turbine
would reduce the development of habitat for common bird prey living around the base of the
turbines. The developers could also construct benign physical structures to divert birds away
from turbines. The precautionary measures mentioned above are only a few of the many
measures mentioned in the study (Thelander, 2004).
The aforementioned social and environmental impacts take into consideration external
effects produced by the wind farm that could affect nearby communities, ecosystems and wild
life. Studying these would help ESPH decide if the benefits of the wind farm outweigh the
associated negative impacts.
31
2.10 Government Regulations
Wind farm developers must consider legislation to understand if the regulations placed on
the production and distribution of wind energy would affect the feasibility in any way. The
production of energy in Costa Rica is heavily regulated by the government. ICE, a governmental
organization in Costa Rica manages most of the energy production and distribution.
ESPH was established as a public utility company through Law 7789, which allows
ESPH to offer services of electricity distribution, purification and distribution of drinking water,
public lighting, and public sewage management system. Its jurisdiction is limited to the cantons
of Heredia, San Rafael, Flores, San Pablo, San Isidro, and Santa Lucía de Barva. ESPH decided
to invest in a wind farm due to extensive promotion of Law 2700 by ICE. Law 2700 allows for
private investment and autonomous generation of energy. The distribution of this energy that is
generated autonomously is facilitated by Law 8345, which allows for cooperatives between rural
electrification organizations and municipal public service companies for national development.
This will allow ESPH to connect the energy they produce autonomously through the wind farm
to the Sistema Nacional Interconectado (SNI) power grid.
The government-run organization Autoridad Reguladora de Servicios Públicos
(ARESEP) determines the price at which electricity is purchased by the public. The price for
electricity in 2010 is set at 69 colones/kWh or $0.13/kWh for the first 200 kWh and 119
colones/kWh or $0.23/kWh for every killowatt-hour after that. ARESEP also regulates the price
of the energy ESPH purchases from ICE. The purchase rates for ESPH are 0.089 $/kWh during
the peak periods, the 0.046 $/kWh during off-peak periods, and 0.035 $/kWh during the
nighttime. Therefore, the revenue ESPH will incur over time through electricity generation
depends on the rates ARESEP will set in the future, and hence determine the payback period of
the wind farm.
These regulations factor into the feasibility study in terms of calculating the payback
period and establishing the rules for ESPH’s capability of power generation and distribution.
32
2.11 Summary
The areas impacting the feasibility of a wind farm are quite diverse, requiring us to
understand and recognize their interrelation. In order to evaluate the feasibility of ESPH’s
prospective wind farm site, PEVA, we established the following criteria.
I. The proposed wind farm site must be large enough to accommodate the required number
of turbines without significant wind-damping interference between towers.
II. Suitable turbines must be readily available for purchase by the sponsor.
III. The wind farm’s average wind speeds must be sufficient to meet the power demands of
ESPH.
IV. The proposed wind farm must have an investment payback period deemed suitable by
ESPH.
V. Suitable financing must be available to pay for the execution phase of the wind farm
project.
VI. The proposed site must have suitable access roads to transport the components of the
turbines.
VII. The construction of high-voltage power lines from the wind farm to a local substation
must be viable.
VIII. The quality of the land must be suitable to support the construction of the turbines.
IX. The risk of damage to the wind farm from seismological activity must be deemed low
enough by ESPH.
X. The placement of the proposed wind farm must not cause discomfort, through noise or
other interference, to people living near the site.
XI. The construction and operation of the wind farm must comply with all applicable laws
and regulations and account for any taxes and tariffs.
33
Chapter 3 - Methodology ESPH needs a feasibility report to show the viability of PEVA. Energy generation, site
preparation, construction, financing options, and potential social and environmental impacts
determine viability. Through our analysis of these areas, we provided comprehensive feasibility
reports to ESPH for PEVA.
3.1 Collection and Analysis of Existing Data
To analyze wind conditions on PEVA, we used published data for monthly average wind
speeds from its neighboring wind farm, MOVASA. We did this to determine the wind behavior
on the site and to estimate energy generation. Since the two sites are adjacent, we could use the
data from MOVASA for analysis, as the wind potential will be similar on PEVA. However, we
had to take into consideration the different terrain roughness of PEVA and the different heights
at which the wind turbines at PEVA would operate. Using the wind speed data from MOVASA
and the wind speed calculator4, we determined estimates for average monthly wind speeds at
different heights based on the roughness level present at the PEVA site (Danish Wind Industry
Association, 2003). This calculator uses the wind shear equation to calculate the wind speed at
different heights and roughness levels based on just one value of wind speed at a certain height
and roughness level. For these calculations, the calculator assumes that there are no obstacles at
or above the specified hub height. In addition, we assumed that there is minimal turbulence
caused by the unevenness of the terrain. To determine PEVA’s and MOVASA’s roughness
classes we examined the topography of the terrain during our site visits. By photographing the
site during our visits, we compared the topography of the site to the roughness class examples
provided by WAsP. Since this examination was done by eye, it was only an estimation and
therefore had low accuracy.
To predict the average annual energy generation, we used the calculated estimates of
monthly mean wind speeds at PEVA. We calculated the mean wind speeds at heights of 50m,
60m, 70m, and 80m since the potential turbines set up in PEVA would be at a height of 50m –
80m. Therefore, the aforementioned heights would give height specific mean wind speeds, which
we could use for the calculation of energy generation depending on the potential turbines that
4 http://www.vindselskab.dk/en/tour/wres/calculat.htm
34
ESPH might install on the PEVA site. We then calculated power generation with respect to the
different models of wind turbines from GE, Vestas, Enercon, Gamesa, and Siemens.
To estimate the annual energy generated by a specific turbine, we consulted its power
curve, which is available on product catalogs from the websites of the manufacturers. The power
curve provides the value in kW of power generated by the turbine model at a certain wind speed
in meters per second. With the power curve, we obtained the projected energy generated by one
wind turbine at the average monthly wind speed.
Using this information, we were able to predict the total energy generated annually by a
wind farm composed of a particular turbine. We assumed that ESPH required between 10-20
MW of power generation from the PEVA site. Therefore, we multiplied the power produced by
one turbine over a year with the number of turbines that would be necessary to build wind farms
of 10 MW, 15 MW, and 20 MW capacities. We did this to obtain the value for average projected
annual energy generation at PEVA. We assumed that the turbines were never turned off and that
the wind speed was at the calculated average wind speed all month long. However, this would
represent values from an ideal scenario. To better approximate energy production, we calculated
the ratio between the ideal energy generated on the MOVASA wind farm to the actual energy
generated on MOVASA. We then used this ratio as the correction ratio for all the calculated
wind speeds at PEVA and derived a set of values that represented the corrected energy
generation. We expressed the calculated and the corrected values of predicted annual energy
generation in tables corresponding to each wind turbine make and model in Excel files.

35
3.2 Site Visit Check List
We created a site checklist to help us record the information we could only collect by
visiting PEVA. We used this information we collected to determine wind turbine placement and
potential construction issues. This checklist helped us note the terrain and the land use of PEVA.
The terrain and land use of the site gave us a general idea of the wind behavior prevalent on the
wind farm. Land use information was used to determine any potential construction issues ESPH
may face during the site preparation or construction phase of the wind farm (Boucher, Guerra,
and Watkins, 2010).
The checklist includes:
a. Size of the site
b. Trees affected by a wind sock effect
c. Approximate distance between features such as trees, large boulders, or shacks
(Pacing)
d. Proximity to neighbors and structures
e. Noise level of neighboring wind farms
f. Observed fauna on the site
g. Topography and hills
h. Land
i. Roadways and traffic characteristics
ii. Current uses of land
iii. Type and density of trees (if any)
iv. Vegetation
v. Soil conditions – check for recent mudslides
vi. Presence of bedrock
vii. Drainage patterns
36
3.3 Turbine Selection and Placement
Based on wind characteristics available on site and the terrain information we collected,
we needed to determine suitable wind turbine layouts for power generation.
To generate a layout, we first determined the wind turbines that would suit the wind
speeds available on site. We researched the top five wind turbine manufacturers GE, Vestas,
Enercon, Gamesa, and Siemens, to arrive at a set of turbines that ESPH could use. We listed the
wind turbines in a table with their corresponding manufacturer, model, cut in/cut out speed, rated
speed, and power rating. We considered the wind turbines with a power rating of up to 3 MW in
our list. We chose 3 MW as the upper limit as increasing the size of the turbines much more
makes turbine transportation, construction, and turbine layout considerably more challenging and
expensive even though it would mean fewer turbines on site. Additionally, there have not been
many turbines above this power rating that have been installed worldwide. Therefore, these
turbines have not been proven as reliable as other turbine ratings because they have not been
tested as widely. Turbines below 3 MW were adequate to reach ESPH’s 20 MW goal for PEVA.
In addition to suggesting suitable wind turbines, we generated hypothetical wind turbine
layouts for PEVA to determine that there existed a feasible turbine layout based on terrain and
topographic information. As mentioned previously, we obtained terrain information from the site
visits and we also obtained a topography map of the site from our sponsor. We took in to
consideration the obstacles present on the site and, using the wind shade calculator,5 we
determined the distance from these obstacles at which it is feasible to place a wind turbine with
minimal energy losses (Danish Wind Industry Association, 2003). Considering wind shadow
effects, turbulence, areas of the site, and number of wind turbines that should be implemented,
we found suitable wind turbine arrangements for the site. In addition, we took the hill and tunnel
effect into account to determine places with high wind potential and would, therefore, be more
efficient spots for wind turbines. We used the name-plate capacity of the hypothetical layouts to
generate financial projections for specific layouts.
5 http://www.vindselskab.dk/en/tour/wres/shelter/index.htm
37
3.4 Analysis of Construction Feasibility
To determine if construction on PEVA was feasible, we studied the access roads to the
site, the feasibility of running high voltage lines from the site to the connection points, and
current land conditions of the proposed site. We evaluated the route taken to PEVA during the
site visit to determine their ability to transport wind turbine parts without damaging them. Since
there is a neighboring wind farm to the proposed site, we used this as a basis for evaluating
turbine transportation. To ensure the feasibility of running high voltage lines, we collected
information on ESPH’s planned routes from the farm to the substation, the associated costs for
each connection, and any associated zoning laws. We also examined the vegetation on the site, to
determine the vegetation that would have to be cleared during construction. We did this by
measuring the location and height of the obstacles and determining if that could impede wind
flow or hinder turbine installation. We made these evaluations using maps and topographical
data provided by ESPH as well as observations noted during the site visit.
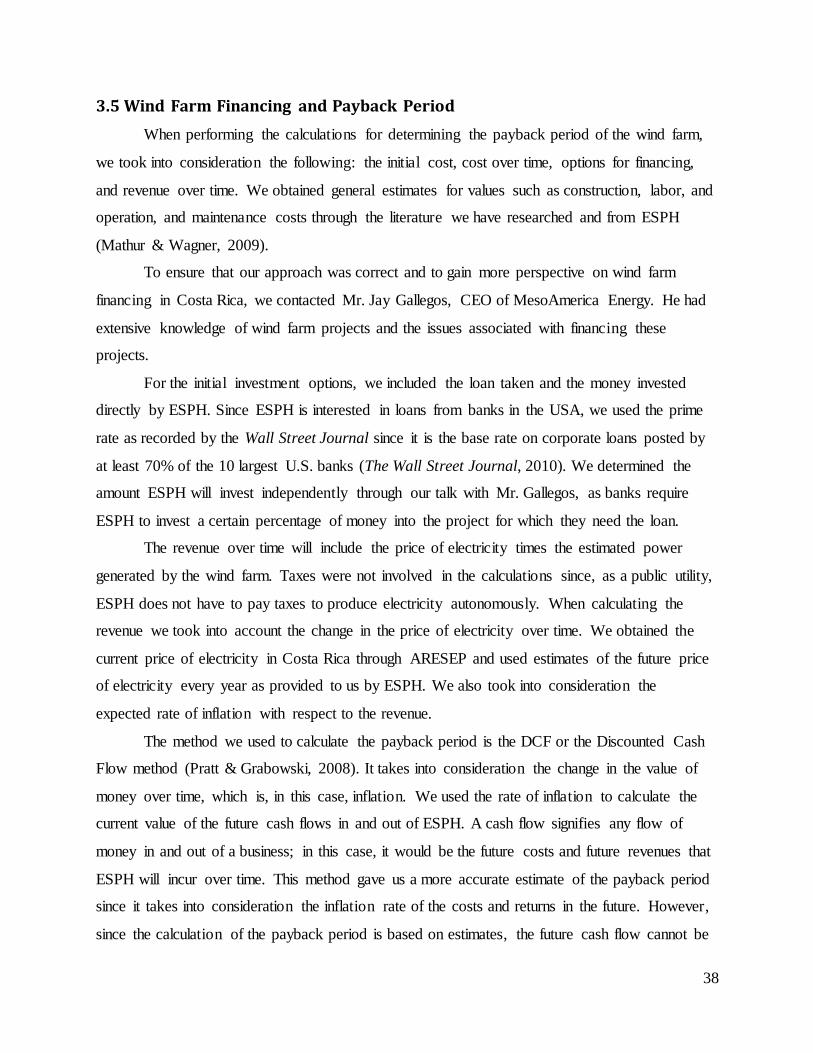
38
3.5 Wind Farm Financing and Payback Period
When performing the calculations for determining the payback period of the wind farm,
we took into consideration the following: the initial cost, cost over time, options for financing,
and revenue over time. We obtained general estimates for values such as construction, labor, and
operation, and maintenance costs through the literature we have researched and from ESPH
(Mathur & Wagner, 2009).
To ensure that our approach was correct and to gain more perspective on wind farm
financing in Costa Rica, we contacted Mr. Jay Gallegos, CEO of MesoAmerica Energy. He had
extensive knowledge of wind farm projects and the issues associated with financing these
projects.
For the initial investment options, we included the loan taken and the money invested
directly by ESPH. Since ESPH is interested in loans from banks in the USA, we used the prime
rate as recorded by the Wall Street Journal since it is the base rate on corporate loans posted by
at least 70% of the 10 largest U.S. banks (The Wall Street Journal, 2010). We determined the
amount ESPH will invest independently through our talk with Mr. Gallegos, as banks require
ESPH to invest a certain percentage of money into the project for which they need the loan.
The revenue over time will include the price of electricity times the estimated power
generated by the wind farm. Taxes were not involved in the calculations since, as a public utility,
ESPH does not have to pay taxes to produce electricity autonomously. When calculating the
revenue we took into account the change in the price of electricity over time. We obtained the
current price of electricity in Costa Rica through ARESEP and used estimates of the future price
of electricity every year as provided to us by ESPH. We also took into consideration the
expected rate of inflation with respect to the revenue.
The method we used to calculate the payback period is the DCF or the Discounted Cash
Flow method (Pratt & Grabowski, 2008). It takes into consideration the change in the value of
money over time, which is, in this case, inflation. We used the rate of inflation to calculate the
current value of the future cash flows in and out of ESPH. A cash flow signifies any flow of
money in and out of a business; in this case, it would be the future costs and future revenues that
ESPH will incur over time. This method gave us a more accurate estimate of the payback period
since it takes into consideration the inflation rate of the costs and returns in the future. However,
since the calculation of the payback period is based on estimates, the future cash flow cannot be
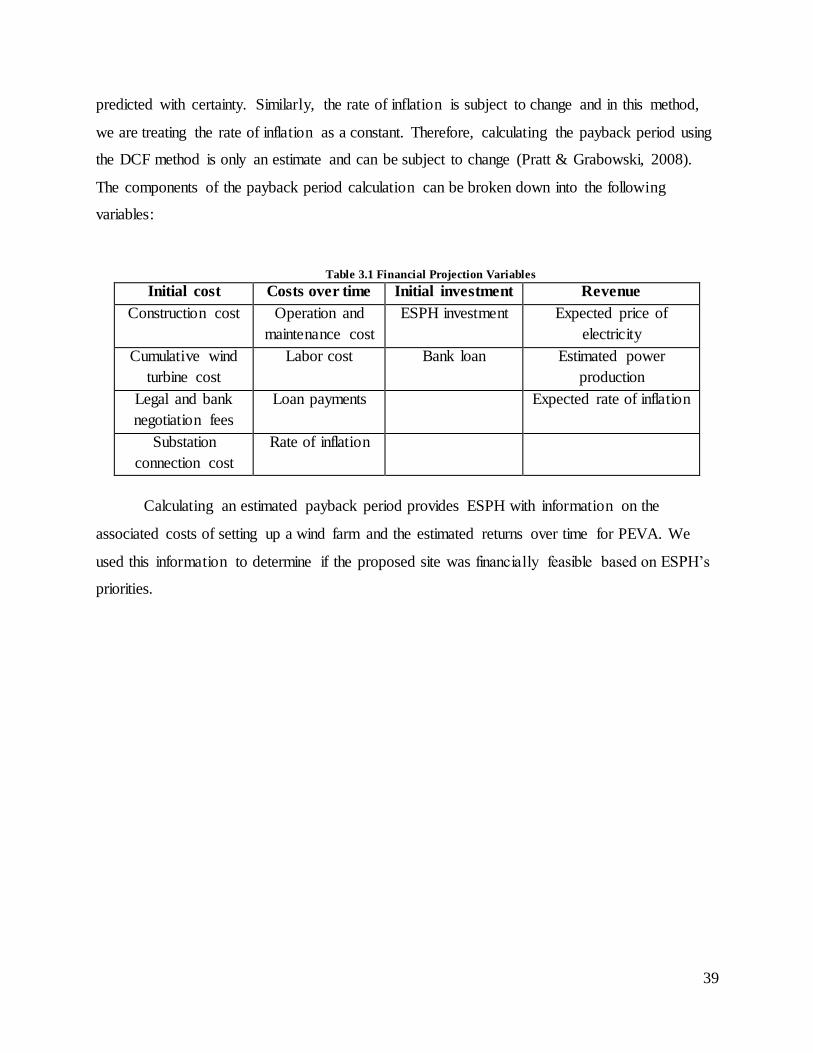
39
predicted with certainty. Similarly, the rate of inflation is subject to change and in this method,
we are treating the rate of inflation as a constant. Therefore, calculating the payback period using
the DCF method is only an estimate and can be subject to change (Pratt & Grabowski, 2008).
The components of the payback period calculation can be broken down into the following
variables:
Table 3.1 Financial Projection Variables
Initial cost Costs over time Initial investment Revenue
Construction cost Operation and
maintenance cost
ESPH investment Expected price of
electricity
Cumulative wind
turbine cost
Labor cost Bank loan Estimated power
production
Legal and bank
negotiation fees
Loan payments Expected rate of inflation
Substation
connection cost
Rate of inflation
Calculating an estimated payback period provides ESPH with information on the
associated costs of setting up a wind farm and the estimated returns over time for PEVA. We
used this information to determine if the proposed site was financially feasible based on ESPH’s
priorities.

40
3.6 Environmental and Social Feasibility
The environmental and social feasibility of a wind farm is mainly dependent on its effect
on the local ecosystem and its effect on the communities that surround it. We combined our
onsite observations and any information on local fauna as observed by ESPH and the owner of
the proposed site to obtain an understanding of the ecosystem present on the proposed site.
However, this method does not provide us with a complete understanding of how building the
wind farm will affect every aspect of the ecosystem.
In addition, an evaluation was performed to derive the noise level generated by the
potential wind turbines used on the proposed site. We utilized the sound calculator6 and the
sound map calculator7 to assess the amount of noise generation from the wind farms. We used
the sound calculator to determine the specific decibel values of noise heard at different distances
from a particular wind turbine. We also used the sound map calculator for a detailed visual and
quantitative representation of the noise level generated by a wind farm with different layouts
(Danish Wind Industry Association, 2003). These estimates, coupled with observations from the
site visits, gave an understanding of wind turbine noise and the extent we expect it to affect
nearby communities.
To determine the number and type of job opportunities that would result if the wind farm
is constructed and in operation, we consulted ESPH on the workforce they plan to employ. Based
on the required work force, we examined the availability for the specified labor in nearby towns
to evaluate the extent of the effects these job opportunities would have.
6 http://www.vindselskab.dk/en/tour/env/db/db2calc.htm
7 http://www.vindselskab.dk/en/tour/env/db/dbcalc.htm

41
3.7 Summary
The wind farm feasibility evaluation involved a detailed investigation of the available
wind speeds on site, financial feasibility, construction feasibility, environmental feasibility and
social feasibility. The wind farm size and power production were addressed in the wind data
analysis, turbine selection and turbine placement phase. The construction feasibility of a site
depended on the road access and the transmission lines to the site as well as any potential issues
that ESPH could be encounter during the construction of the wind farm. The financial feasibility
involved collecting information on the costs involved with the setup of a wind farm and its
payback period corresponding to the power production. In summary, we assessed whether the
site satisfies the criteria we established while following this methodology to create a wind farm
feasibility report.

42
Chapter 4 – Results and Findings Our analysis of the PEVA wind farm site yielded many important conclusions about the
feasibility of the site and the issues that will be faced by ESPH in the future. We analyzed all
available wind data for the site to determine whether the wind on-site was sufficient for an
effective wind farm. The potential for power generation was assessed with respect to the possible
different wind turbines and turbine layouts ESPH could employ to ensure that the site produced
energy efficiently. We examined if the site was construction feasible, assessing if suitable access
roads were present, if there existed local substations for the wind farm to connect to, and if land
conditions could support wind farm construction. We performed financial analysis and projection
of payback periods for different numbers and sizes of turbines to gain an understanding of what
choices would yield the most revenue for ESPH. Lastly, we evaluated the noise that would be
generated by the wind turbines to ensure that it would not be detrimental to the quality of life of
people living nearby.
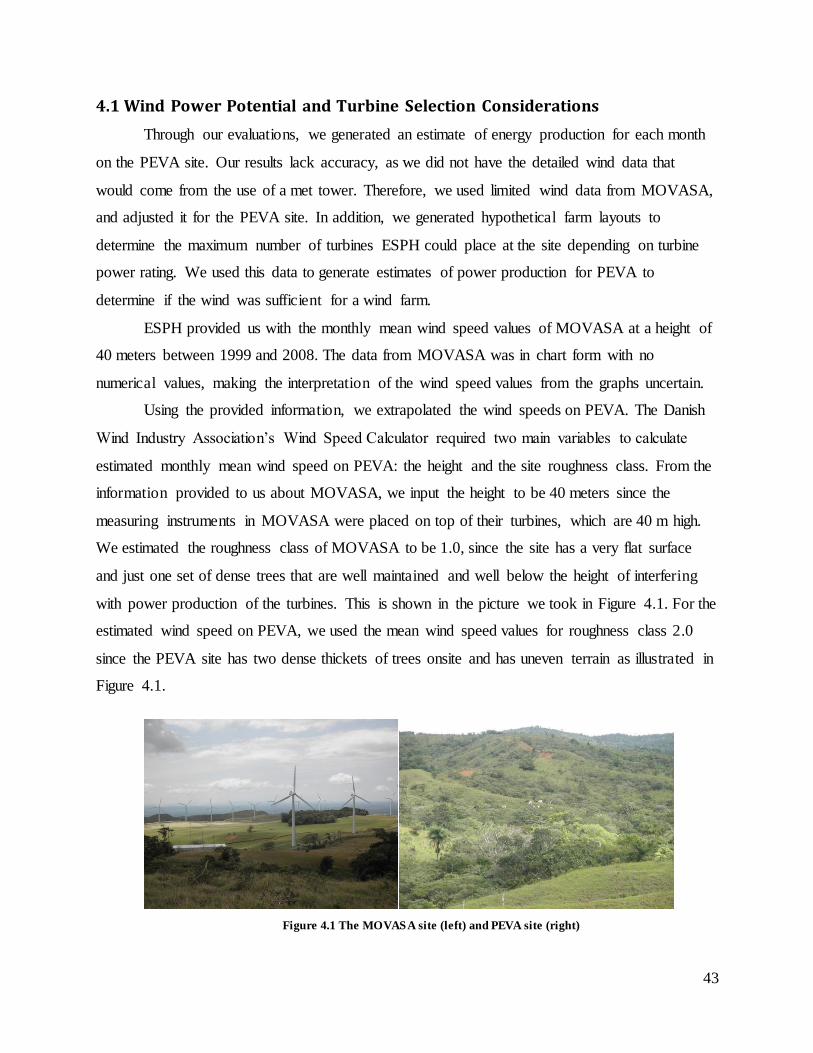
43
4.1 Wind Power Potential and Turbine Selection Considerations
Through our evaluations, we generated an estimate of energy production for each month
on the PEVA site. Our results lack accuracy, as we did not have the detailed wind data that
would come from the use of a met tower. Therefore, we used limited wind data from MOVASA,
and adjusted it for the PEVA site. In addition, we generated hypothetical farm layouts to
determine the maximum number of turbines ESPH could place at the site depending on turbine
power rating. We used this data to generate estimates of power production for PEVA to
determine if the wind was sufficient for a wind farm.
ESPH provided us with the monthly mean wind speed values of MOVASA at a height of
40 meters between 1999 and 2008. The data from MOVASA was in chart form with no
numerical values, making the interpretation of the wind speed values from the graphs uncertain.
Using the provided information, we extrapolated the wind speeds on PEVA. The Danish
Wind Industry Association’s Wind Speed Calculator required two main variables to calculate
estimated monthly mean wind speed on PEVA: the height and the site roughness class. From the
information provided to us about MOVASA, we input the height to be 40 meters since the
measuring instruments in MOVASA were placed on top of their turbines, which are 40 m high.
We estimated the roughness class of MOVASA to be 1.0, since the site has a very flat surface
and just one set of dense trees that are well maintained and well below the height of interfering
with power production of the turbines. This is shown in the picture we took in Figure 4.1. For the
estimated wind speed on PEVA, we used the mean wind speed values for roughness class 2.0
since the PEVA site has two dense thickets of trees onsite and has uneven terrain as illustrated in
Figure 4.1.
Figure 4.1 The MOVASA site (left) and PEVA site (right)

44
To represent turbines of different heights that might be used on the PEVA site, we used
the wind speed values from the calculator corresponding to the heights 50m, 60m, 70m, and 80m
at roughness class 2.0. The tables in Appendices C and D list the recorded monthly mean wind
speeds on MOVASA and the extrapolated values at the heights of 50m, 60m, 70m, and 80m later
used for the estimation of energy production on PEVA. For these calculations, we assumed that
there are no obstacles at or above the specified hub height. In addition, as shown by our choice of
roughness class being 2.0, we assumed that there is minimal turbulence caused by the
unevenness of the terrain.
A list of all turbines manufactured by GE, Vestas, Enercon, Gamesa, and Siemens was
compiled with their corresponding cut-in speed, cut-out speed, rated speed, rotor diameters, hub
heights, and turbine class. This information is represented in Appendix G. To estimate power
generation corresponding to each turbine power rating we used the power curves of the turbine
models presented in Table 4.1. These turbine models were chosen from the initial list of turbines
since they had power curves that could be used more accurately for modeling.
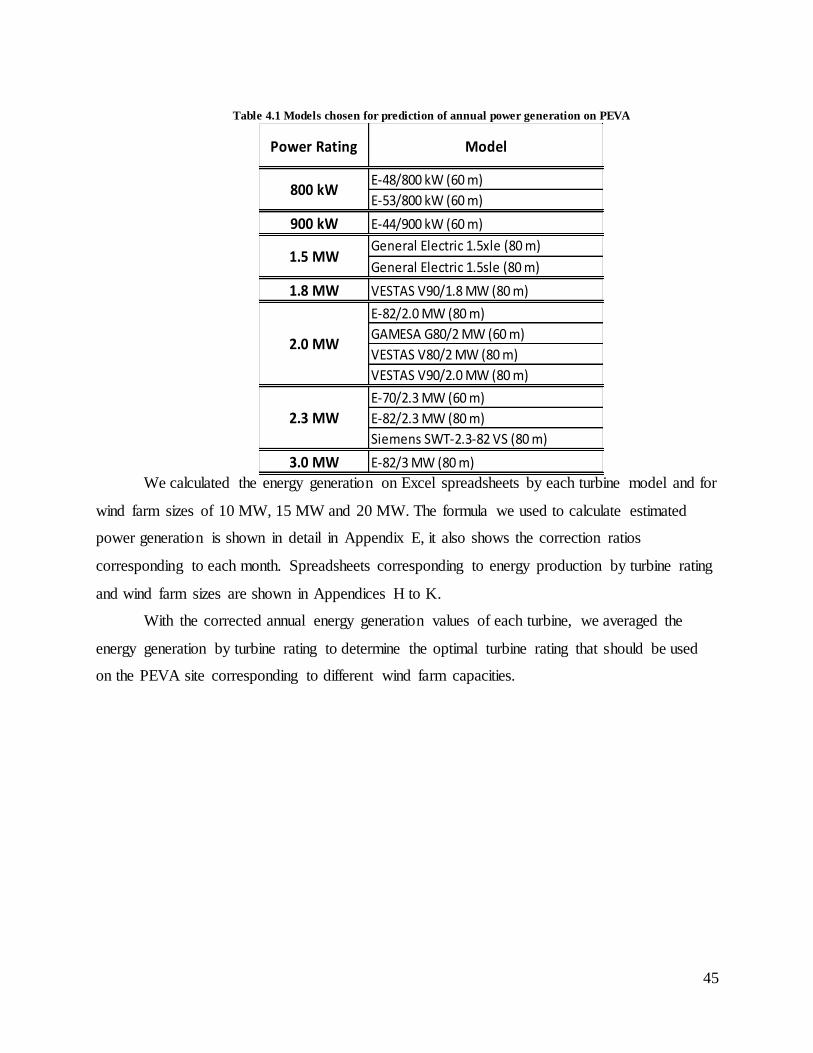
45
Table 4.1 Models chosen for prediction of annual power generation on PEVA
We calculated the energy generation on Excel spreadsheets by each turbine model and for
wind farm sizes of 10 MW, 15 MW and 20 MW. The formula we used to calculate estimated
power generation is shown in detail in Appendix E, it also shows the correction ratios
corresponding to each month. Spreadsheets corresponding to energy production by turbine rating
and wind farm sizes are shown in Appendices H to K.
With the corrected annual energy generation values of each turbine, we averaged the
energy generation by turbine rating to determine the optimal turbine rating that should be used
on the PEVA site corresponding to different wind farm capacities.
Power Rating Model
E-48/800 kW (60 m)
E-53/800 kW (60 m)
900 kW E-44/900 kW (60 m)
General Electric 1.5xle (80 m)
General Electric 1.5sle (80 m)
1.8 MW VESTAS V90/1.8 MW (80 m)
E-82/2.0 MW (80 m)
GAMESA G80/2 MW (60 m)
VESTAS V80/2 MW (80 m)
VESTAS V90/2.0 MW (80 m)
E-70/2.3 MW (60 m)
E-82/2.3 MW (80 m)
Siemens SWT-2.3-82 VS (80 m)
3.0 MW E-82/3 MW (80 m)
1.5 MW
2.3 MW
2.0 MW
800 kW
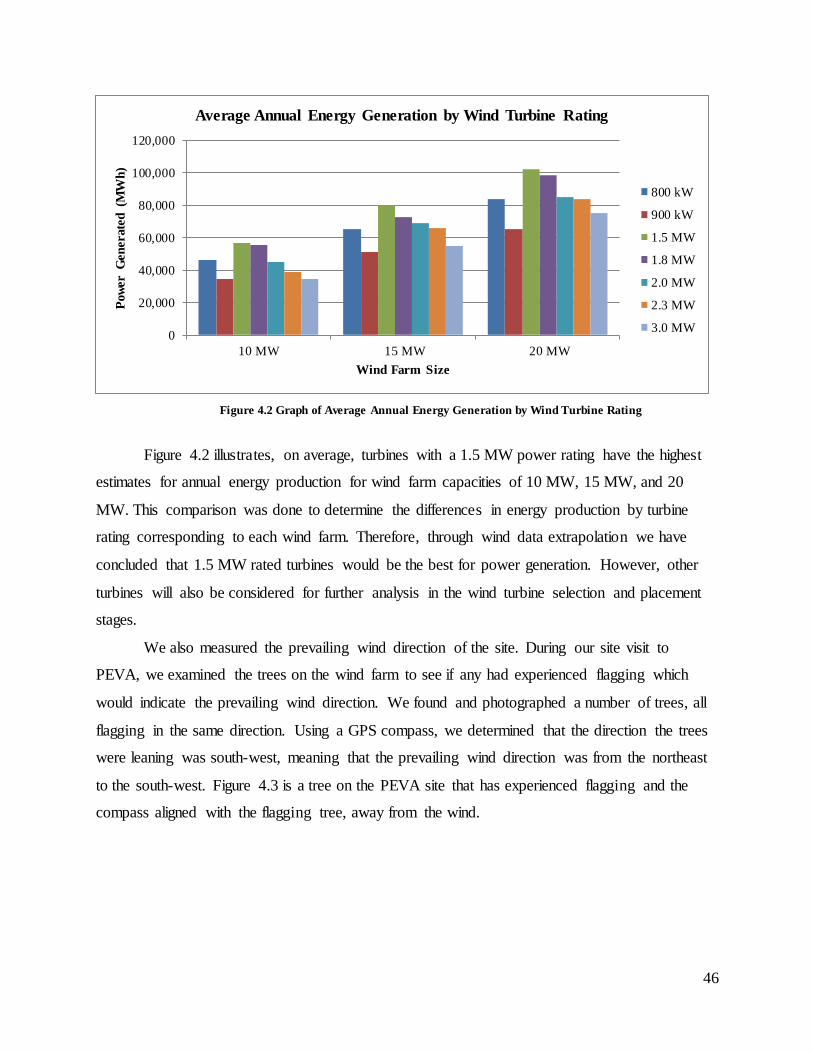
46
Figure 4.2 Graph of Average Annual Energy Generation by Wind Turbine Rating
Figure 4.2 illustrates, on average, turbines with a 1.5 MW power rating have the highest
estimates for annual energy production for wind farm capacities of 10 MW, 15 MW, and 20
MW. This comparison was done to determine the differences in energy production by turbine
rating corresponding to each wind farm. Therefore, through wind data extrapolation we have
concluded that 1.5 MW rated turbines would be the best for power generation. However, other
turbines will also be considered for further analysis in the wind turbine selection and placement
stages.
We also measured the prevailing wind direction of the site. During our site visit to
PEVA, we examined the trees on the wind farm to see if any had experienced flagging which
would indicate the prevailing wind direction. We found and photographed a number of trees, all
flagging in the same direction. Using a GPS compass, we determined that the direction the trees
were leaning was south-west, meaning that the prevailing wind direction was from the northeast
to the south-west. Figure 4.3 is a tree on the PEVA site that has experienced flagging and the
compass aligned with the flagging tree, away from the wind.
0
20,000
40,000
60,000
80,000
100,000
120,000
10 MW 15 MW 20 MW
Pow
er G
en
erate
d
(MW
h)
Wind Farm Size
Average Annual Energy Generation by Wind Turbine Rating
800 kW
900 kW
1.5 MW
1.8 MW
2.0 MW
2.3 MW
3.0 MW
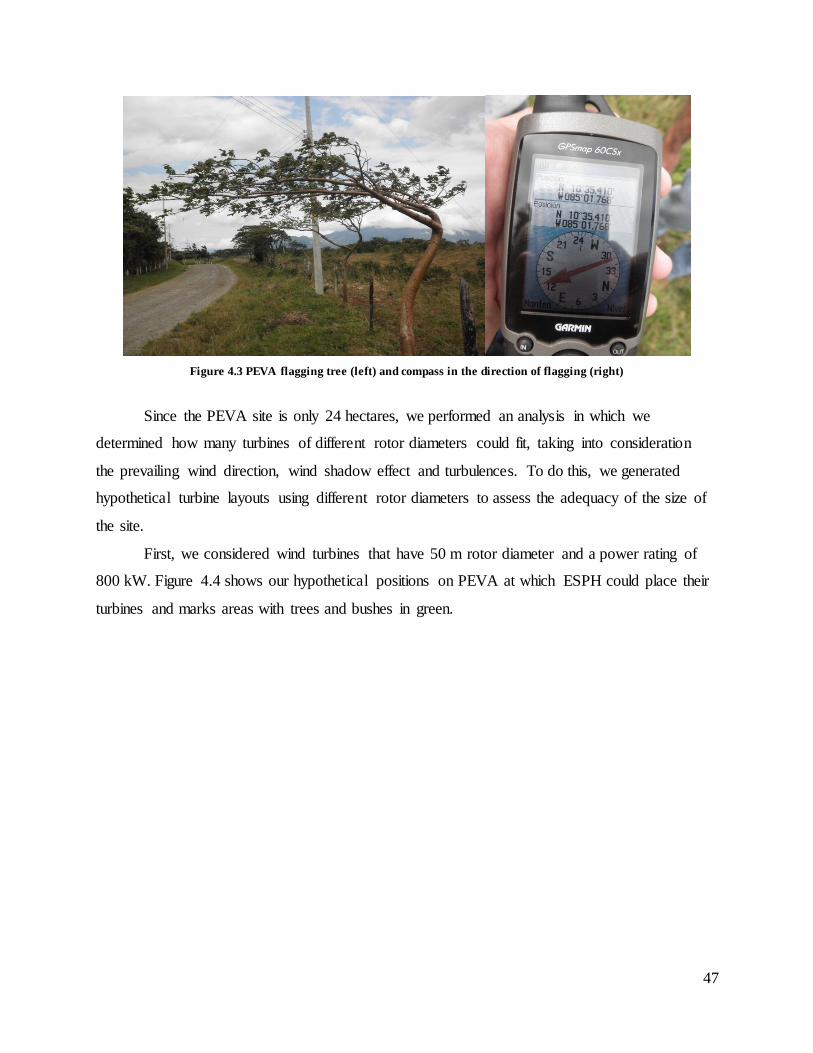
47
Figure 4.3 PEVA flagging tree (left) and compass in the direction of flagging (right)
Since the PEVA site is only 24 hectares, we performed an analysis in which we
determined how many turbines of different rotor diameters could fit, taking into consideration
the prevailing wind direction, wind shadow effect and turbulences. To do this, we generated
hypothetical turbine layouts using different rotor diameters to assess the adequacy of the size of
the site.
First, we considered wind turbines that have 50 m rotor diameter and a power rating of
800 kW. Figure 4.4 shows our hypothetical positions on PEVA at which ESPH could place their
turbines and marks areas with trees and bushes in green.
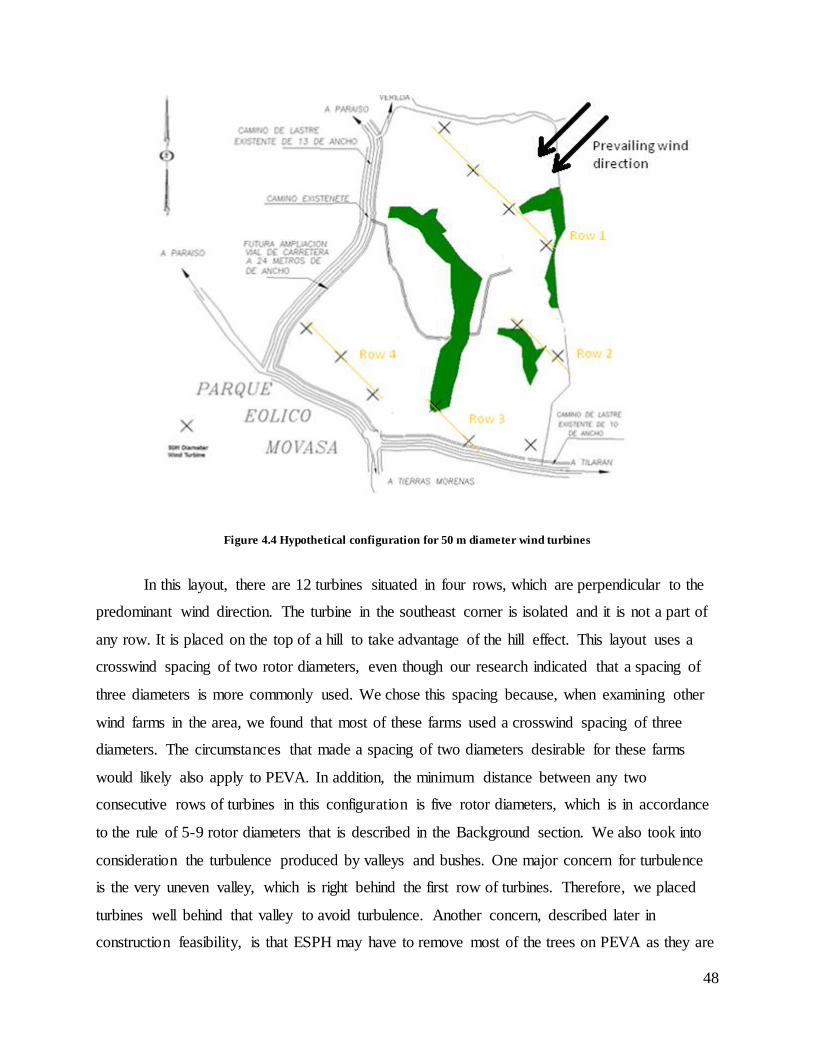
48
Figure 4.4 Hypothetical configuration for 50 m diameter wind turbines
In this layout, there are 12 turbines situated in four rows, which are perpendicular to the
predominant wind direction. The turbine in the southeast corner is isolated and it is not a part of
any row. It is placed on the top of a hill to take advantage of the hill effect. This layout uses a
crosswind spacing of two rotor diameters, even though our research indicated that a spacing of
three diameters is more commonly used. We chose this spacing because, when examining other
wind farms in the area, we found that most of these farms used a crosswind spacing of three
diameters. The circumstances that made a spacing of two diameters desirable for these farms
would likely also apply to PEVA. In addition, the minimum distance between any two
consecutive rows of turbines in this configuration is five rotor diameters, which is in accordance
to the rule of 5-9 rotor diameters that is described in the Background section. We also took into
consideration the turbulence produced by valleys and bushes. One major concern for turbulence
is the very uneven valley, which is right behind the first row of turbines. Therefore, we placed
turbines well behind that valley to avoid turbulence. Another concern, described later in
construction feasibility, is that ESPH may have to remove most of the trees on PEVA as they are
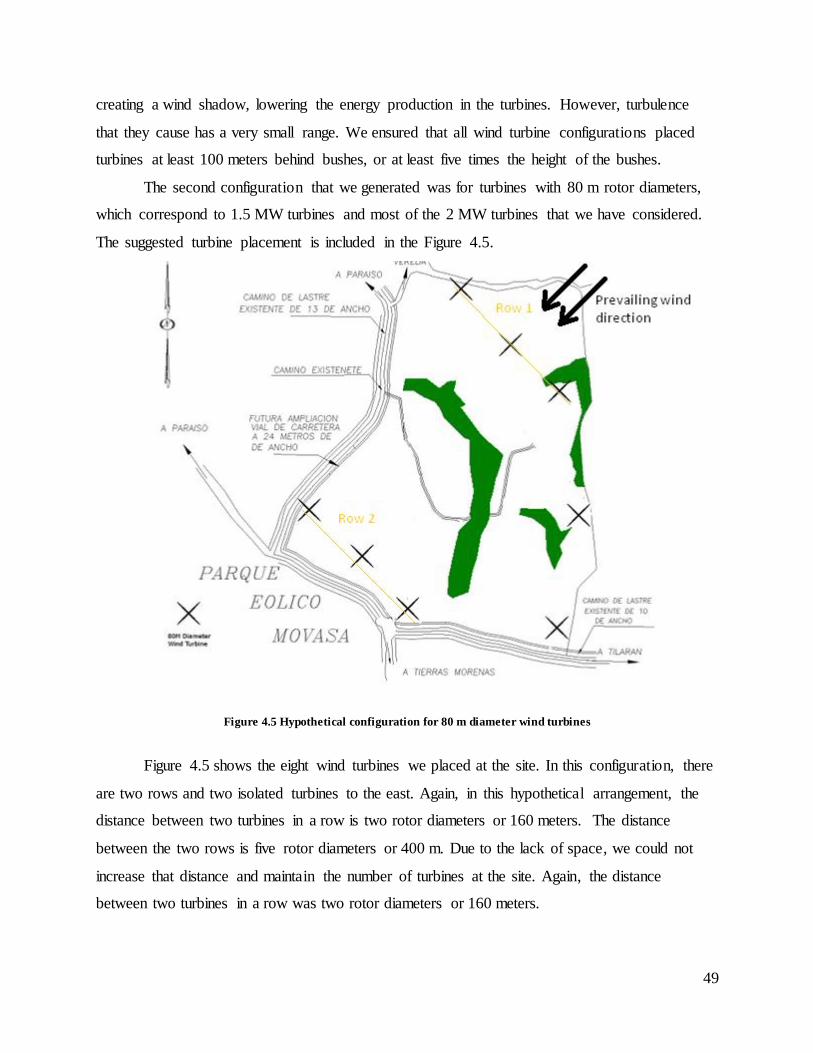
49
creating a wind shadow, lowering the energy production in the turbines. However, turbulence
that they cause has a very small range. We ensured that all wind turbine configurations placed
turbines at least 100 meters behind bushes, or at least five times the height of the bushes.
The second configuration that we generated was for turbines with 80 m rotor diameters,
which correspond to 1.5 MW turbines and most of the 2 MW turbines that we have considered.
The suggested turbine placement is included in the Figure 4.5.
Figure 4.5 Hypothetical configuration for 80 m diameter wind turbines
Figure 4.5 shows the eight wind turbines we placed at the site. In this configuration, there
are two rows and two isolated turbines to the east. Again, in this hypothetical arrangement, the
distance between two turbines in a row is two rotor diameters or 160 meters. The distance
between the two rows is five rotor diameters or 400 m. Due to the lack of space, we could not
increase that distance and maintain the number of turbines at the site. Again, the distance
between two turbines in a row was two rotor diameters or 160 meters.
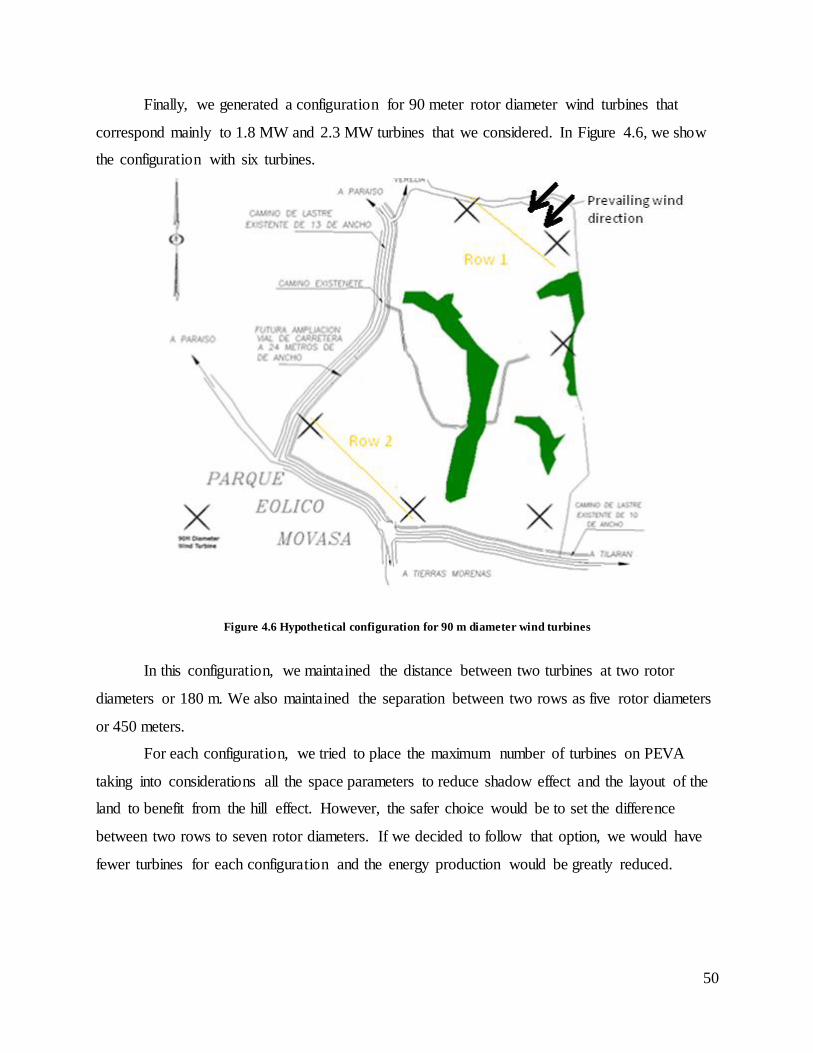
50
Finally, we generated a configuration for 90 meter rotor diameter wind turbines that
correspond mainly to 1.8 MW and 2.3 MW turbines that we considered. In Figure 4.6, we show
the configuration with six turbines.
Figure 4.6 Hypothetical configuration for 90 m diameter wind turbines
In this configuration, we maintained the distance between two turbines at two rotor
diameters or 180 m. We also maintained the separation between two rows as five rotor diameters
or 450 meters.
For each configuration, we tried to place the maximum number of turbines on PEVA
taking into considerations all the space parameters to reduce shadow effect and the layout of the
land to benefit from the hill effect. However, the safer choice would be to set the difference
between two rows to seven rotor diameters. If we decided to follow that option, we would have
fewer turbines for each configuration and the energy production would be greatly reduced.
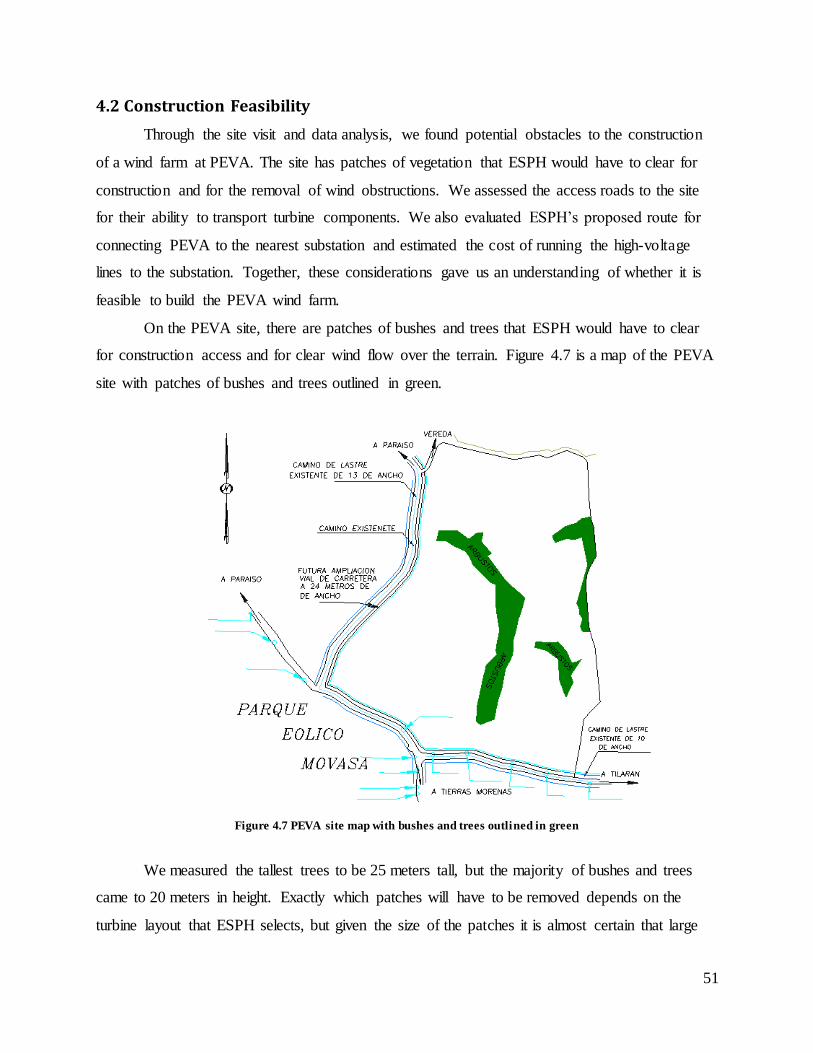
51
4.2 Construction Feasibility
Through the site visit and data analysis, we found potential obstacles to the construction
of a wind farm at PEVA. The site has patches of vegetation that ESPH would have to clear for
construction and for the removal of wind obstructions. We assessed the access roads to the site
for their ability to transport turbine components. We also evaluated ESPH’s proposed route for
connecting PEVA to the nearest substation and estimated the cost of running the high-voltage
lines to the substation. Together, these considerations gave us an understanding of whether it is
feasible to build the PEVA wind farm.
On the PEVA site, there are patches of bushes and trees that ESPH would have to clear
for construction access and for clear wind flow over the terrain. Figure 4.7 is a map of the PEVA
site with patches of bushes and trees outlined in green.
Figure 4.7 PEVA site map with bushes and trees outlined in green
We measured the tallest trees to be 25 meters tall, but the majority of bushes and trees
came to 20 meters in height. Exactly which patches will have to be removed depends on the
turbine layout that ESPH selects, but given the size of the patches it is almost certain that large
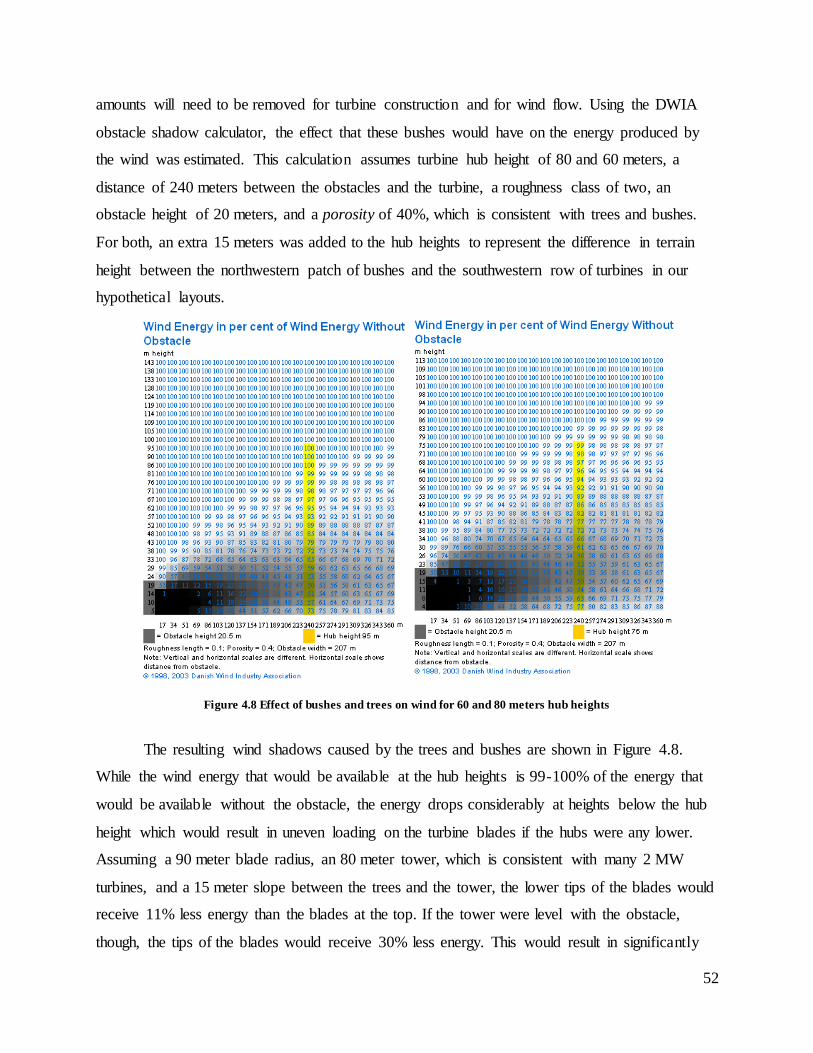
52
amounts will need to be removed for turbine construction and for wind flow. Using the DWIA
obstacle shadow calculator, the effect that these bushes would have on the energy produced by
the wind was estimated. This calculation assumes turbine hub height of 80 and 60 meters, a
distance of 240 meters between the obstacles and the turbine, a roughness class of two, an
obstacle height of 20 meters, and a porosity of 40%, which is consistent with trees and bushes.
For both, an extra 15 meters was added to the hub heights to represent the difference in terrain
height between the northwestern patch of bushes and the southwestern row of turbines in our
hypothetical layouts.
Figure 4.8 Effect of bushes and trees on wind for 60 and 80 meters hub heights
The resulting wind shadows caused by the trees and bushes are shown in Figure 4.8.
While the wind energy that would be available at the hub heights is 99-100% of the energy that
would be available without the obstacle, the energy drops considerably at heights below the hub
height which would result in uneven loading on the turbine blades if the hubs were any lower.
Assuming a 90 meter blade radius, an 80 meter tower, which is consistent with many 2 MW
turbines, and a 15 meter slope between the trees and the tower, the lower tips of the blades would
receive 11% less energy than the blades at the top. If the tower were level with the obstacle,
though, the tips of the blades would receive 30% less energy. This would result in significantly
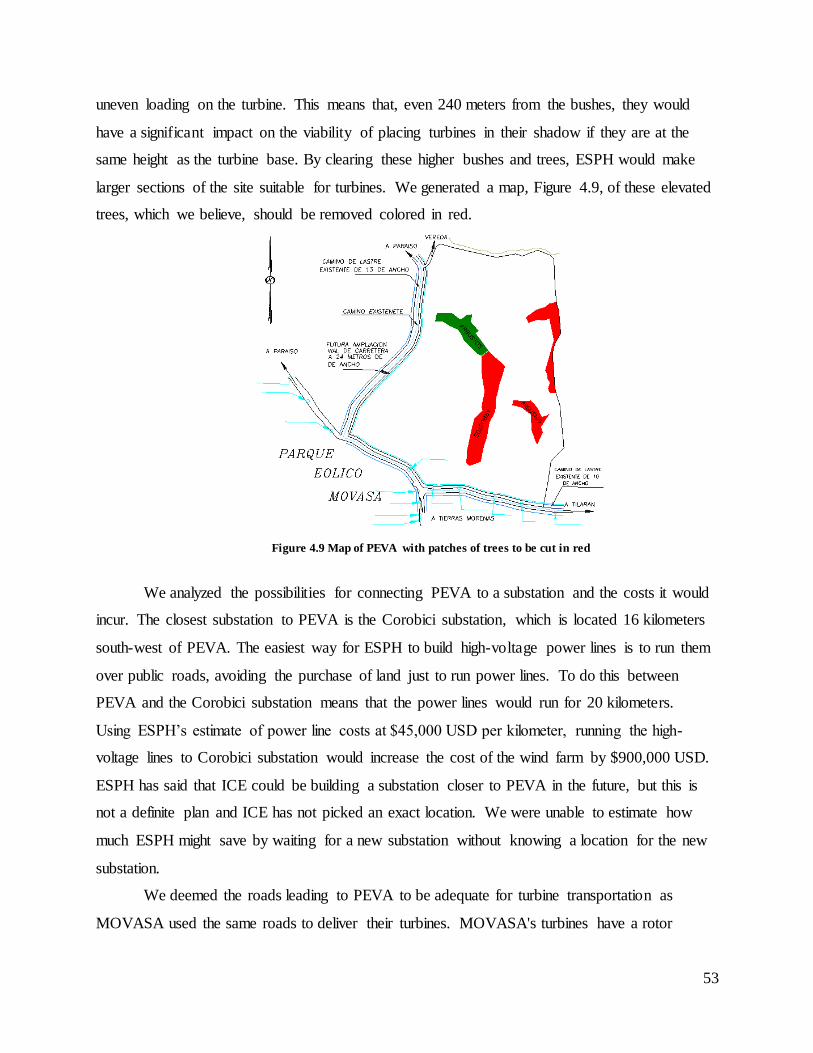
53
uneven loading on the turbine. This means that, even 240 meters from the bushes, they would
have a significant impact on the viability of placing turbines in their shadow if they are at the
same height as the turbine base. By clearing these higher bushes and trees, ESPH would make
larger sections of the site suitable for turbines. We generated a map, Figure 4.9, of these elevated
trees, which we believe, should be removed colored in red.
Figure 4.9 Map of PEVA with patches of trees to be cut in red
We analyzed the possibilities for connecting PEVA to a substation and the costs it would
incur. The closest substation to PEVA is the Corobici substation, which is located 16 kilometers
south-west of PEVA. The easiest way for ESPH to build high-voltage power lines is to run them
over public roads, avoiding the purchase of land just to run power lines. To do this between
PEVA and the Corobici substation means that the power lines would run for 20 kilometers.
Using ESPH’s estimate of power line costs at $45,000 USD per kilometer, running the high-
voltage lines to Corobici substation would increase the cost of the wind farm by $900,000 USD.
ESPH has said that ICE could be building a substation closer to PEVA in the future, but this is
not a definite plan and ICE has not picked an exact location. We were unable to estimate how
much ESPH might save by waiting for a new substation without knowing a location for the new
substation.
We deemed the roads leading to PEVA to be adequate for turbine transportation as
MOVASA used the same roads to deliver their turbines. MOVASA's turbines have a rotor

54
diameter of 44 meters, meaning that the same roads could be used for delivering turbines of this
size to PEVA. Due to time constraints, we were unable to collect detailed road maps and assess
whether the roads would be adequate for turbines with a rotor diameter greater than 44 meters.
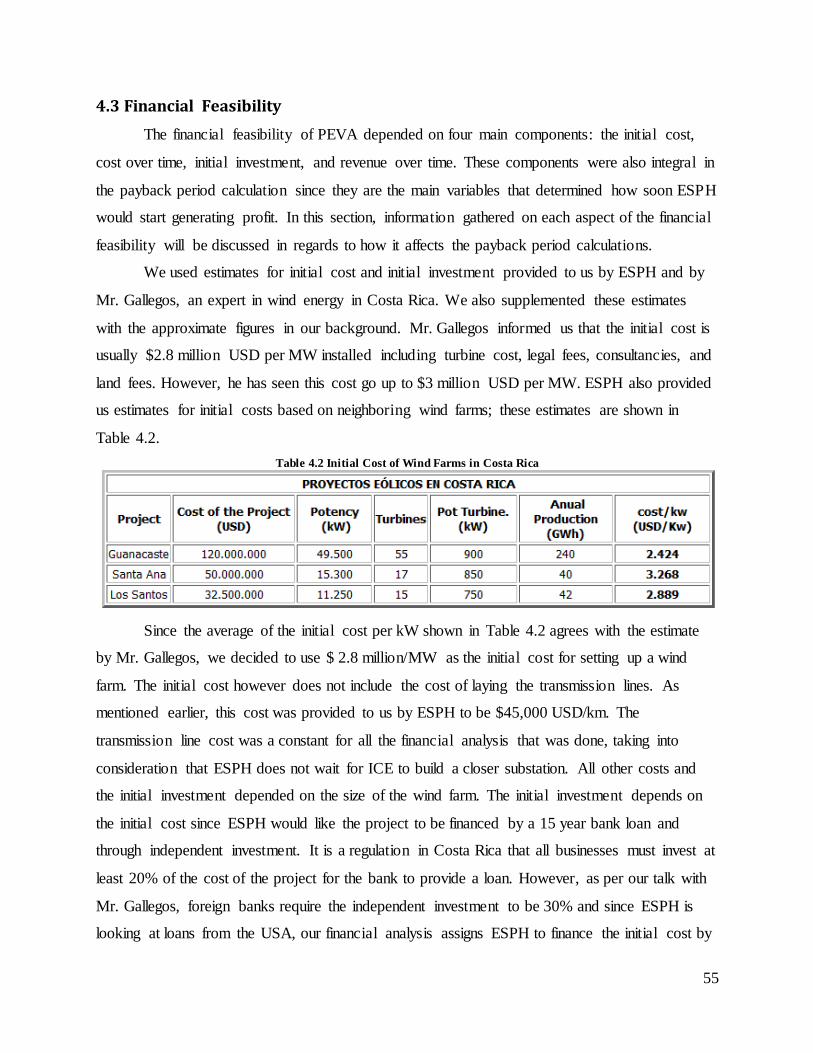
55
4.3 Financial Feasibility
The financial feasibility of PEVA depended on four main components: the initial cost,
cost over time, initial investment, and revenue over time. These components were also integral in
the payback period calculation since they are the main variables that determined how soon ESPH
would start generating profit. In this section, information gathered on each aspect of the financial
feasibility will be discussed in regards to how it affects the payback period calculations.
We used estimates for initial cost and initial investment provided to us by ESPH and by
Mr. Gallegos, an expert in wind energy in Costa Rica. We also supplemented these estimates
with the approximate figures in our background. Mr. Gallegos informed us that the initial cost is
usually $2.8 million USD per MW installed including turbine cost, legal fees, consultancies, and
land fees. However, he has seen this cost go up to $3 million USD per MW. ESPH also provided
us estimates for initial costs based on neighboring wind farms; these estimates are shown in
Table 4.2.
Table 4.2 Initial Cost of Wind Farms in Costa Rica
Since the average of the initial cost per kW shown in Table 4.2 agrees with the estimate
by Mr. Gallegos, we decided to use $ 2.8 million/MW as the initial cost for setting up a wind
farm. The initial cost however does not include the cost of laying the transmission lines. As
mentioned earlier, this cost was provided to us by ESPH to be $45,000 USD/km. The
transmission line cost was a constant for all the financial analysis that was done, taking into
consideration that ESPH does not wait for ICE to build a closer substation. All other costs and
the initial investment depended on the size of the wind farm. The initial investment depends on
the initial cost since ESPH would like the project to be financed by a 15 year bank loan and
through independent investment. It is a regulation in Costa Rica that all businesses must invest at
least 20% of the cost of the project for the bank to provide a loan. However, as per our talk with
Mr. Gallegos, foreign banks require the independent investment to be 30% and since ESPH is
looking at loans from the USA, our financial analysis assigns ESPH to finance the initial cost by
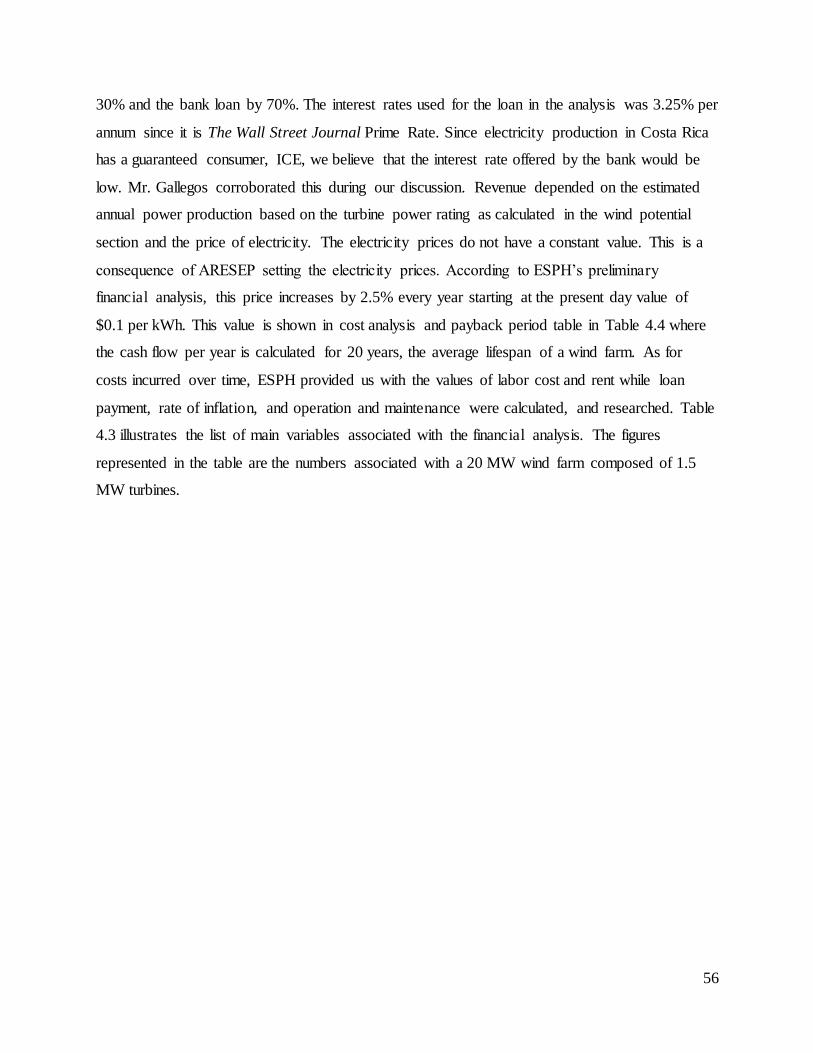
56
30% and the bank loan by 70%. The interest rates used for the loan in the analysis was 3.25% per
annum since it is The Wall Street Journal Prime Rate. Since electricity production in Costa Rica
has a guaranteed consumer, ICE, we believe that the interest rate offered by the bank would be
low. Mr. Gallegos corroborated this during our discussion. Revenue depended on the estimated
annual power production based on the turbine power rating as calculated in the wind potential
section and the price of electricity. The electricity prices do not have a constant value. This is a
consequence of ARESEP setting the electricity prices. According to ESPH’s preliminary
financial analysis, this price increases by 2.5% every year starting at the present day value of
$0.1 per kWh. This value is shown in cost analysis and payback period table in Table 4.4 where
the cash flow per year is calculated for 20 years, the average lifespan of a wind farm. As for
costs incurred over time, ESPH provided us with the values of labor cost and rent while loan
payment, rate of inflation, and operation and maintenance were calculated, and researched. Table
4.3 illustrates the list of main variables associated with the financial analysis. The figures
represented in the table are the numbers associated with a 20 MW wind farm composed of 1.5
MW turbines.
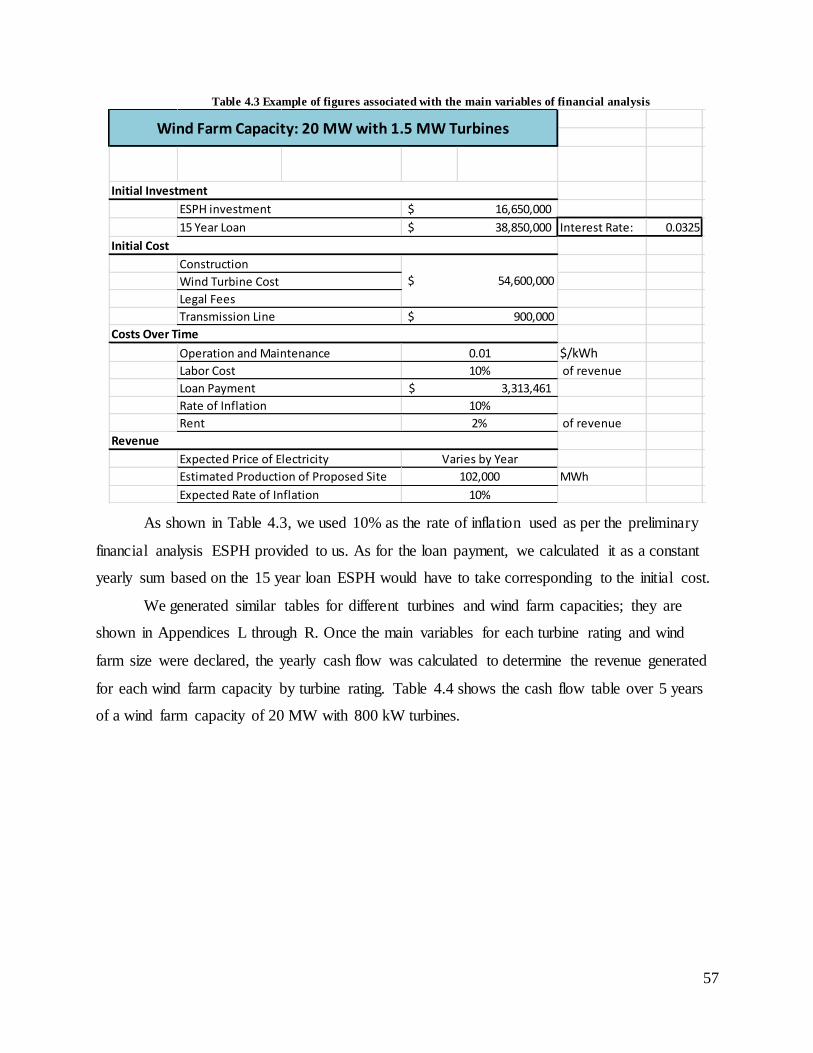
57
Table 4.3 Example of figures associated with the main variables of financial analysis
As shown in Table 4.3, we used 10% as the rate of inflation used as per the preliminary
financial analysis ESPH provided to us. As for the loan payment, we calculated it as a constant
yearly sum based on the 15 year loan ESPH would have to take corresponding to the initial cost.
We generated similar tables for different turbines and wind farm capacities; they are
shown in Appendices L through R. Once the main variables for each turbine rating and wind
farm size were declared, the yearly cash flow was calculated to determine the revenue generated
for each wind farm capacity by turbine rating. Table 4.4 shows the cash flow table over 5 years
of a wind farm capacity of 20 MW with 800 kW turbines.
YearBalance Interest
Amount Paid on
PrincipalAnnual Payment
0 38,850,000$
1 1,262,625$ 2,050,836$ 3,313,461$
Interest Rate: 0.0325 2 36,799,164$ 1,195,973$ 2,117,489$ 3,313,461$
3 34,681,675$ 1,127,154$ 2,186,307$ 3,313,461$
4 32,495,368$ 1,056,099$ 2,257,362$ 3,313,461$
5 30,238,006$ 982,735$ 2,330,726$ 3,313,461$
6 27,907,280$ 906,987$ 2,406,475$ 3,313,461$
7 25,500,806$ 828,776$ 2,484,685$ 3,313,461$
8 23,016,120$ 748,024$ 2,565,437$ 3,313,461$
$/kWh 9 20,450,683$ 664,647$ 2,648,814$ 3,313,461$
of revenue 10 17,801,869$ 578,561$ 2,734,901$ 3,313,461$
11 15,066,968$ 489,676$ 2,823,785$ 3,313,461$
12 12,243,184$ 397,903$ 2,915,558$ 3,313,461$
of revenue 13 9,327,626$ 303,148$ 3,010,313$ 3,313,461$
14 6,317,312$ 205,313$ 3,108,149$ 3,313,461$
15 3,209,164$ 104,298$ 3,209,164$ 3,313,461$
MWh Total 10,851,920$ 38,850,000$ 49,701,920$
16,650,000$
38,850,000$
Construction
ESPH investment
15 Year Loan
Wind Turbine Cost
Estimated Production of Proposed Site
Expected Rate of Inflation 10%
102,000
Varies by Year
Legal Fees
Transmission Line
Revenue
Rent
Expected Price of Electricity
Wind Farm Capacity: 20 MW with 1.5 MW TurbinesLoan Payment
$ 54,600,000
2%
Initial Investment
Initial Cost
Costs Over Time
Operation and Maintenance
Labor Cost
Loan Payment
Rate of Inflation
0.01
10%
10%
3,313,461$
$ 900,000
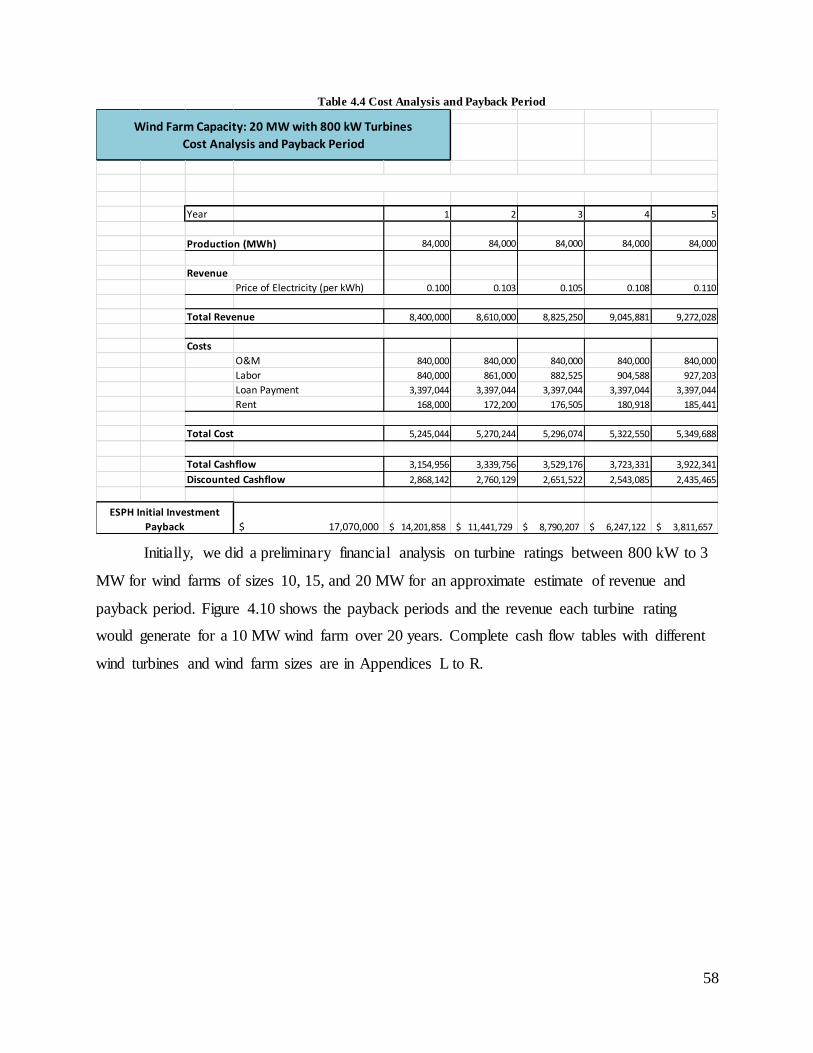
58
Table 4.4 Cost Analysis and Payback Period
Initially, we did a preliminary financial analysis on turbine ratings between 800 kW to 3
MW for wind farms of sizes 10, 15, and 20 MW for an approximate estimate of revenue and
payback period. Figure 4.10 shows the payback periods and the revenue each turbine rating
would generate for a 10 MW wind farm over 20 years. Complete cash flow tables with different
wind turbines and wind farm sizes are in Appendices L to R.
Year 1 2 3 4 5
84,000 84,000 84,000 84,000 84,000
Price of Electricity (per kWh) 0.100 0.103 0.105 0.108 0.110
8,400,000 8,610,000 8,825,250 9,045,881 9,272,028
Costs
O&M 840,000 840,000 840,000 840,000 840,000
Labor 840,000 861,000 882,525 904,588 927,203
Loan Payment 3,397,044 3,397,044 3,397,044 3,397,044 3,397,044
Rent 168,000 172,200 176,505 180,918 185,441
5,245,044 5,270,244 5,296,074 5,322,550 5,349,688
3,154,956 3,339,756 3,529,176 3,723,331 3,922,341
2,868,142 2,760,129 2,651,522 2,543,085 2,435,465
17,070,000$ 14,201,858$ 11,441,729$ 8,790,207$ 6,247,122$ 3,811,657$
ESPH Initial Investment
Payback
Wind Farm Capacity: 20 MW with 800 kW Turbines
Cost Analysis and Payback Period
Total Cashflow
Discounted Cashflow
Total Revenue
Total Cost
Production (MWh)
Revenue
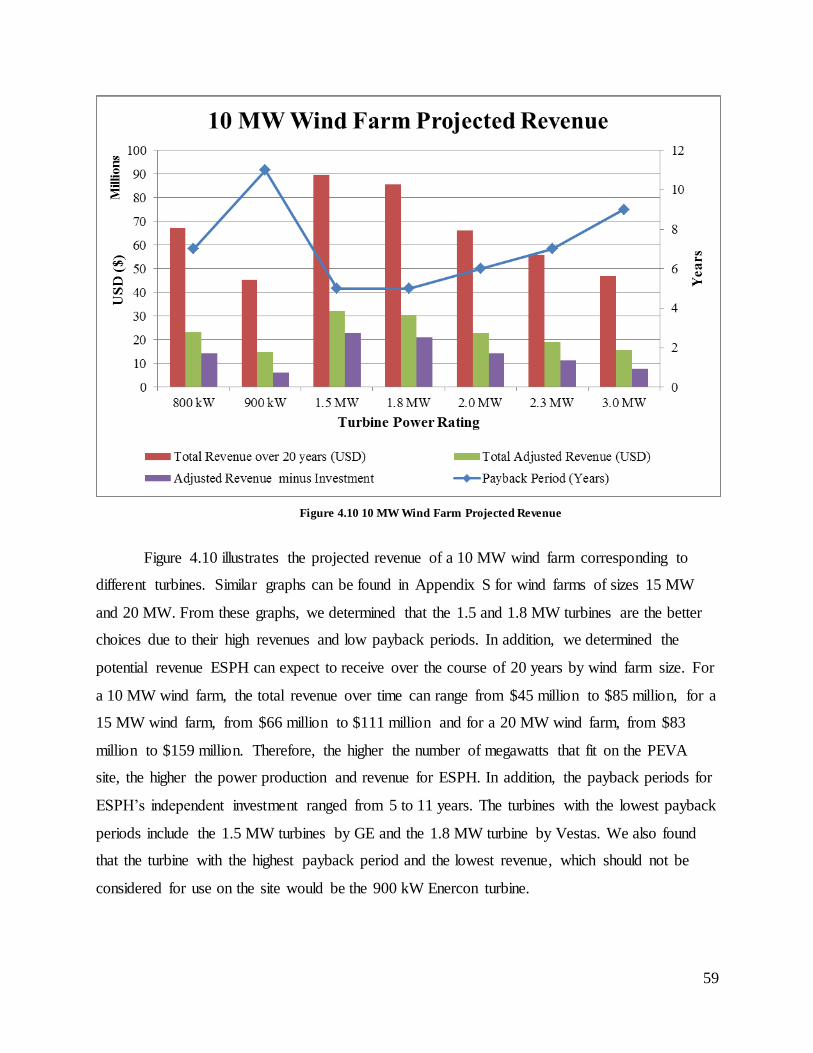
59
Figure 4.10 10 MW Wind Farm Projected Revenue
Figure 4.10 illustrates the projected revenue of a 10 MW wind farm corresponding to
different turbines. Similar graphs can be found in Appendix S for wind farms of sizes 15 MW
and 20 MW. From these graphs, we determined that the 1.5 and 1.8 MW turbines are the better
choices due to their high revenues and low payback periods. In addition, we determined the
potential revenue ESPH can expect to receive over the course of 20 years by wind farm size. For
a 10 MW wind farm, the total revenue over time can range from $45 million to $85 million, for a
15 MW wind farm, from $66 million to $111 million and for a 20 MW wind farm, from $83
million to $159 million. Therefore, the higher the number of megawatts that fit on the PEVA
site, the higher the power production and revenue for ESPH. In addition, the payback periods for
ESPH’s independent investment ranged from 5 to 11 years. The turbines with the lowest payback
periods include the 1.5 MW turbines by GE and the 1.8 MW turbine by Vestas. We also found
that the turbine with the highest payback period and the lowest revenue, which should not be
considered for use on the site would be the 900 kW Enercon turbine.
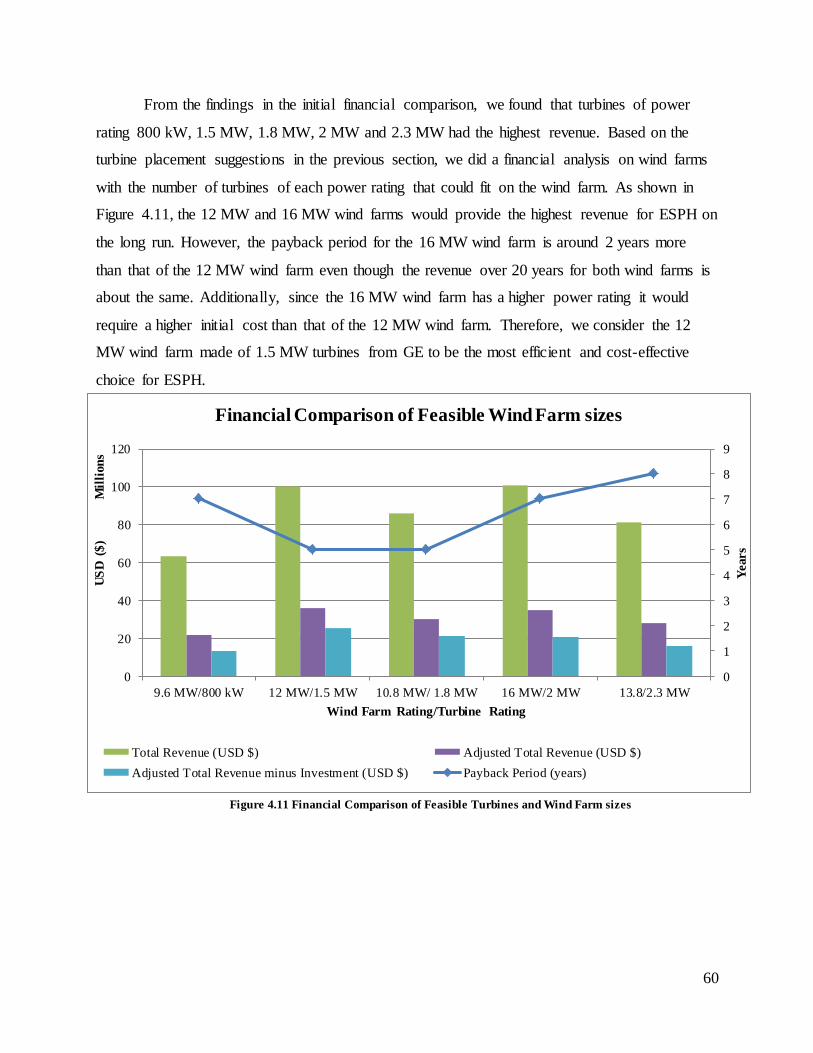
60
0
1
2
3
4
5
6
7
8
9
0
20
40
60
80
100
120
9.6 MW/800 kW 12 MW/1.5 MW 10.8 MW/ 1.8 MW 16 MW/2 MW 13.8/2.3 MW
Years
US
D (
$)
Mil
lion
s
Wind Farm Rating/Turbine Rating
Financial Comparison of Feasible Wind Farm sizes
Total Revenue (USD $) Adjusted Total Revenue (USD $)
Adjusted Total Revenue minus Investment (USD $) Payback Period (years)
From the findings in the initial financial comparison, we found that turbines of power
rating 800 kW, 1.5 MW, 1.8 MW, 2 MW and 2.3 MW had the highest revenue. Based on the
turbine placement suggestions in the previous section, we did a financial analysis on wind farms
with the number of turbines of each power rating that could fit on the wind farm. As shown in
Figure 4.11, the 12 MW and 16 MW wind farms would provide the highest revenue for ESPH on
the long run. However, the payback period for the 16 MW wind farm is around 2 years more
than that of the 12 MW wind farm even though the revenue over 20 years for both wind farms is
about the same. Additionally, since the 16 MW wind farm has a higher power rating it would
require a higher initial cost than that of the 12 MW wind farm. Therefore, we consider the 12
MW wind farm made of 1.5 MW turbines from GE to be the most efficient and cost-effective
choice for ESPH.
Figure 4.11 Financial Comparison of Feasible Turbines and Wind Farm sizes
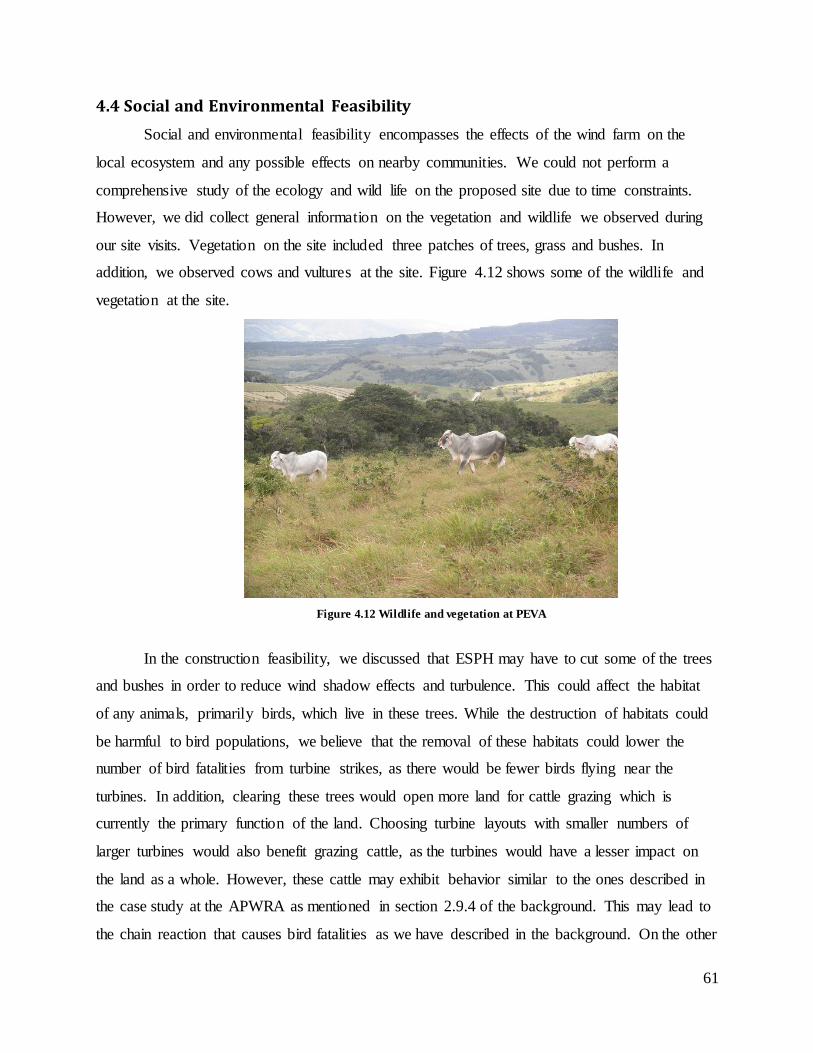
61
4.4 Social and Environmental Feasibility
Social and environmental feasibility encompasses the effects of the wind farm on the
local ecosystem and any possible effects on nearby communities. We could not perform a
comprehensive study of the ecology and wild life on the proposed site due to time constraints.
However, we did collect general information on the vegetation and wildlife we observed during
our site visits. Vegetation on the site included three patches of trees, grass and bushes. In
addition, we observed cows and vultures at the site. Figure 4.12 shows some of the wildlife and
vegetation at the site.
Figure 4.12 Wildlife and vegetation at PEVA
In the construction feasibility, we discussed that ESPH may have to cut some of the trees
and bushes in order to reduce wind shadow effects and turbulence. This could affect the habitat
of any animals, primarily birds, which live in these trees. While the destruction of habitats could
be harmful to bird populations, we believe that the removal of these habitats could lower the
number of bird fatalities from turbine strikes, as there would be fewer birds flying near the
turbines. In addition, clearing these trees would open more land for cattle grazing which is
currently the primary function of the land. Choosing turbine layouts with smaller numbers of
larger turbines would also benefit grazing cattle, as the turbines would have a lesser impact on
the land as a whole. However, these cattle may exhibit behavior similar to the ones described in
the case study at the APWRA as mentioned in section 2.9.4 of the background. This may lead to
the chain reaction that causes bird fatalities as we have described in the background. On the other
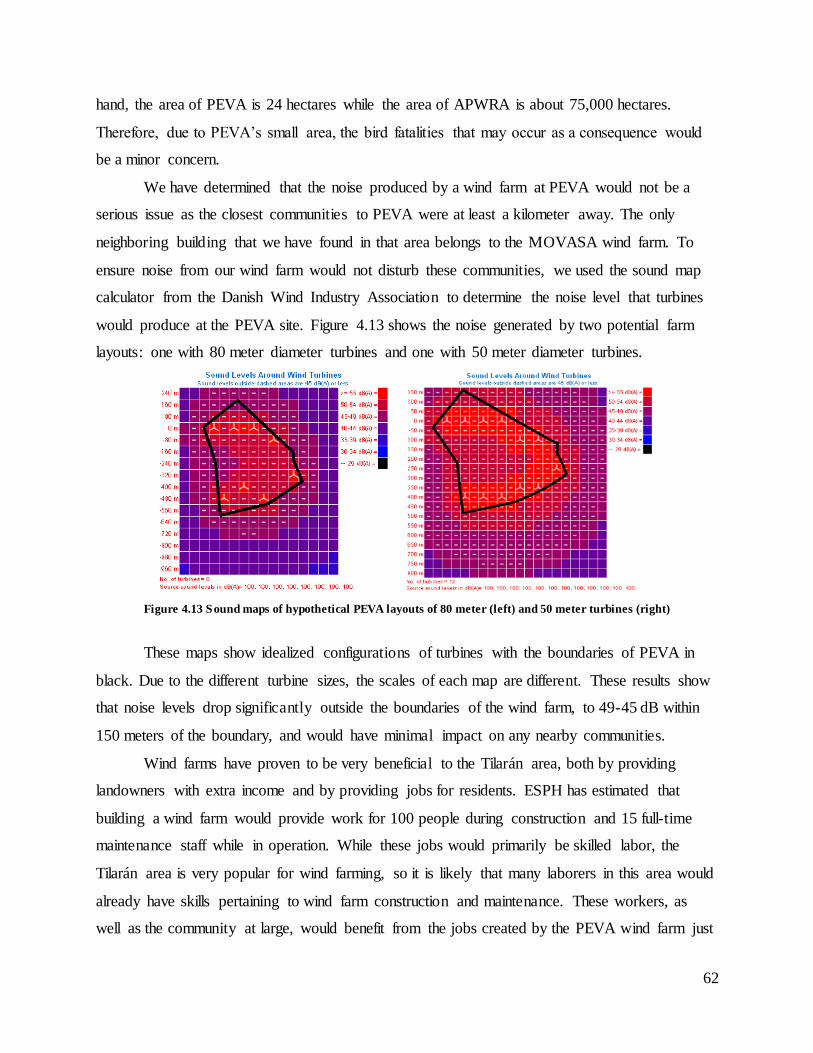
62
hand, the area of PEVA is 24 hectares while the area of APWRA is about 75,000 hectares.
Therefore, due to PEVA’s small area, the bird fatalities that may occur as a consequence would
be a minor concern.
We have determined that the noise produced by a wind farm at PEVA would not be a
serious issue as the closest communities to PEVA were at least a kilometer away. The only
neighboring building that we have found in that area belongs to the MOVASA wind farm. To
ensure noise from our wind farm would not disturb these communities, we used the sound map
calculator from the Danish Wind Industry Association to determine the noise level that turbines
would produce at the PEVA site. Figure 4.13 shows the noise generated by two potential farm
layouts: one with 80 meter diameter turbines and one with 50 meter diameter turbines.
Figure 4.13 Sound maps of hypothetical PEVA layouts of 80 meter (left) and 50 meter turbines (right)
These maps show idealized configurations of turbines with the boundaries of PEVA in
black. Due to the different turbine sizes, the scales of each map are different. These results show
that noise levels drop significantly outside the boundaries of the wind farm, to 49-45 dB within
150 meters of the boundary, and would have minimal impact on any nearby communities.
Wind farms have proven to be very beneficial to the Tilarán area, both by providing
landowners with extra income and by providing jobs for residents. ESPH has estimated that
building a wind farm would provide work for 100 people during construction and 15 full-time
maintenance staff while in operation. While these jobs would primarily be skilled labor, the
Tilarán area is very popular for wind farming, so it is likely that many laborers in this area would
already have skills pertaining to wind farm construction and maintenance. These workers, as
well as the community at large, would benefit from the jobs created by the PEVA wind farm just
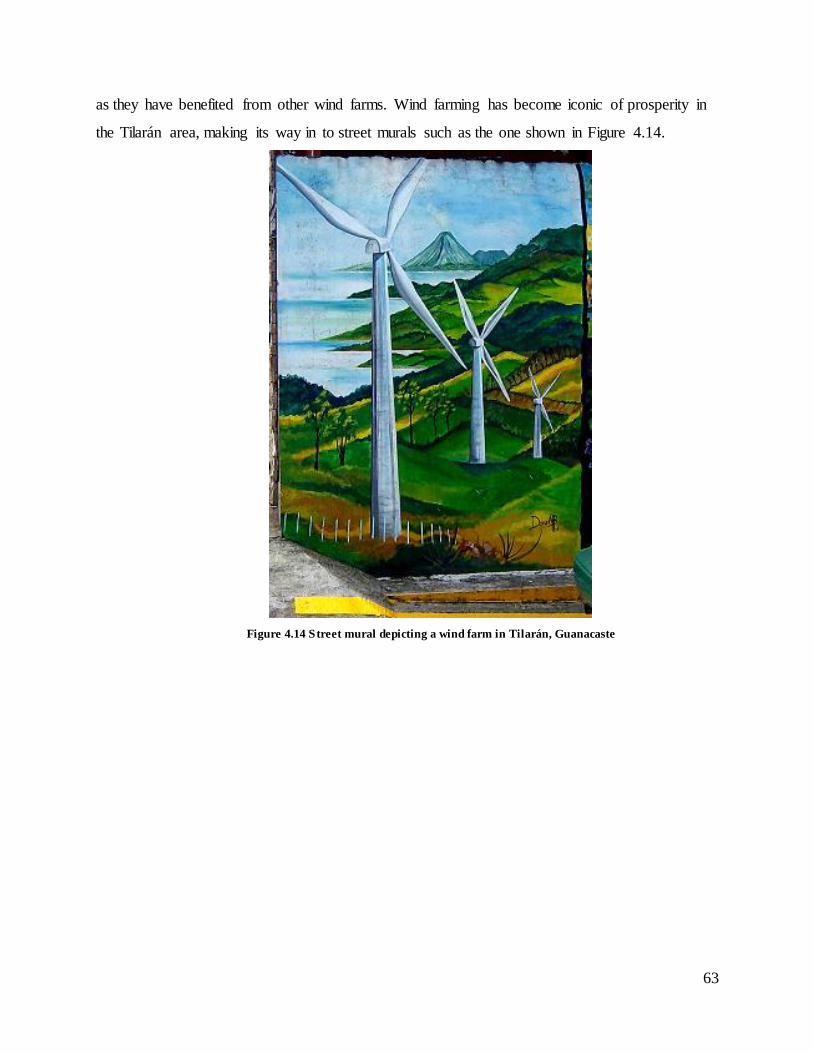
63
as they have benefited from other wind farms. Wind farming has become iconic of prosperity in
the Tilarán area, making its way in to street murals such as the one shown in Figure 4.14.
Figure 4.14 Street mural depicting a wind farm in Tilarán, Guanacaste
64
Chapter 5 - Conclusions and Recommendations Once we had collected all available data and made our projections as to the energy
outputs and finances of PEVA, we were able to make conclusions as to the feasibility of the
PEVA wind farm as well as recommendations for what ESPH should do from here.
5.1 PEVA Feasibility
Through our evaluations, we found that the PEVA site is a feasible location for a wind
farm. While a 20 MW farm could physically be built on the site, the turbines would have to be
placed very close together, introducing considerable wind-damping interference between
turbines and decreasing the efficiency of the individual turbines. The PEVA site has wind
conditions well suited for a wind farm, but the site is not large enough to support a wind farm
with a 20 MW capacity. The size of the site is more suited for a 10-15 MW wind farm.
Most payback periods for PEVA respective to wind turbines, range between five and
eight years and are excellent for a wind project. Our findings show that PEVA should have a
payback period in this window with any farm size between 10 and 15 MW with a broad range of
turbine choices. These payback periods are very short and we attribute them to the high wind
speeds on site and the high generation potential of modern wind turbines. The cost of connecting
PEVA to the nearest substation is considerable. It is not so large, though, that ESPH should wait
for ICE to build a closer substation, especially considering that there is no guarantee ICE will do
so.
Transportation of wind turbines to the site would be an issue if the turbines selected have
a diameter greater than 44 meters. If the turbines are 44 meters or smaller, the installation of the
neighboring MOVASA wind farm has already proven road access adequate. Once ESPH has
decided on a turbine size, ESPH will have to evaluate the access roads to the site for the chosen
blade length if the turbines have a diameter greater than 44 meters. While all the turbines we
evaluated had diameters of 50 meters or above, there may be smaller turbines available from
other manufacturers. We do not believe that ESPH should limit themselves to turbines smaller
than 44 meters as we have found that many larger turbines could be better suited to the site from
our wind and financial analysis.
Sound and its effects on nearby communities are negligible for the PEVA site as the only
nearby buildings are those belonging to the MOVASA wind farm. The site is far enough
removed from the communities of Tilarán and Tierras Morenas that there would be no harmful

65
effects on the community from the noise of the wind turbines. Building these wind farms will
definitely provide benefits to nearby communities since they provide a demand for skilled
laborers and provide a source of revenue for landowners whose lands have high wind potential.
The city nearest to PEVA has demonstrated just this since the town of Tilarán has flourished
under the development of nearby wind farms.
While PEVA might not be able to support the generation capacity ESPH had originally
envisioned, it is still a feasible site for a wind farm. Through our analysis, we believe that a 12
MW wind farm made of 1.5 MW GE turbines would be the most efficient for ESPH to install,
due to the high revenue and short five year payback period. However, on a more general scale,
we believe that ESPH can build a 10 to 15 MW wind farm on the site with an expected payback
period of 5 to 6 years. This would provide considerable benefit to ESPH by complementing their
hydropower generation with up to 80 GWh yearly, generating revenue, and decreasing their
reliance on energy from ICE.
66
5.2 Recommendations
Our primary recommendation for ESPH is the need for the collection of more site-
specific data, specifically detailed information on wind speeds for more accurate estimates of
power production. These estimates would contribute to a better financial feasibility analysis
especially once ESPH has determined the cost quotations by different turbine manufacturers to
build the wind farm.
Since most of our uncertainties come from the fact that we did not receive highly detailed
wind data for PEVA, we recommend the installation of met towers that would collect all the
information needed for an accurate estimate of the available wind potential. ESPH is already
planning this, and has contracted Campbell Scientific to collect the data. The data should be
collected on PEVA for at least a year. This way, monthly wind potential can be analyzed to
determine the energy produced during the wet and dry seasons. In addition, banks require this
detailed wind data before they invest in a site to ensure that it is a suitable wind farm site. ESPH
will need to have comprehensive wind data to ensure that their projects are feasible and
persuasive to banks.
Once the wind speed variations throughout the year are recorded, we recommend that
ESPH represent the frequencies of each wind speed by fitting the given wind data to a Weibull
distribution or another probability density function. The Weibull distribution encompasses many
different probability density functions such as the Rayleigh distribution. It is very flexible and is
widely used to provide a close approximation to the probabilistic behavior of many natural
phenomena. It has been used in recent years for wind energy applications to give an accurate fit
for experimental data (Lam & Lun, 2000). This method is widely used because the shape and
scale parameters allow us to describe and predict future wind potential on the site (Danish Wind
Industry Association, 2003). Using MATLAB or wind analysis software such as WAsP, they
should perform a non-linear least squares curve fit to a Weibull distribution to determine the
shape and scale parameters of the corresponding curve equation. They should also use this
software to determine that the Weibull distribution is an accurate representation of their data.
While the Weibull distribution can represent almost all naturally occurring wind behavior, they
might want to use a different probability density function that is a better fit. WAsP and
MATLAB can both perform curve fit confidence checks, using r-square and sum of squares due
to error fits or other statistical methods (MathWorks, 2010). Since the wind speeds in Costa Rica
67
differ significantly throughout the year, they should derive these parameters as well as mean
wind speeds on a monthly scale. The prediction of future wind potential will provide an accurate
estimate of future energy generation.
ESPH can then determine corresponding power outputs for different turbines based on
wind conditions available on site with the wind turbine power calculator8. They would need to
input measured values of the monthly mean wind speeds, the Weibull distribution parameters,
and the roughness class into this calculator. This calculator would provide them with information
on power input, power output, energy output, and capacity factor information corresponding to
each wind turbine (Danish Wind Industry Association, 2003). From this information, ESPH can
deduce the wind turbines most suitable for PEVA and the energy generated by a wind farm
composed of these turbines.
With more detailed wind data, ESPH should perform a more accurate financial analysis
for the site once better estimates of energy production can be determined. We recommend that
ESPH use the Excel files we have given them to derive the pay back periods specific to the
quotes they gather from different turbine manufacturers. Our findings through these spreadsheets
can be found in Appendices L through R. These files will allow them to determine the
production capacities relative to each turbine model, compare it to the initial price tag, and derive
the payback period relative to each manufacturer.
For the construction of the wind farm, we recommend that ESPH re-evaluate the access
roads leading to the site to ensure that they are adequate for whichever turbine diameter they
select. We believe that ESPH’s best options for turbines are well above the size used on the
MOVASA site and, therefore, ESPH will have to ensure that it is possible to transport the turbine
blades to PEVA.
The construction phase is when ESPH will also have an opportunity to protect their wind
turbines from seismic activity, and we recommend that ESPH discuss all options for seismic
accommodations with the turbine manufacturers and any construction firms involved in the
project. While we believe that seismic activity does not significantly influence the feasibility of
this wind project, it is crucial that ESPH understands all of their options moving forward.
8 http://www.vindselskab.dk/en/tour/wres/pow/index.htm
68
References
Alberts, D. J.Addressing wind turbine noise.Lawrence Technological University. Retrieved from http://www.maine.gov/doc/mfs/windpower/pubs/pdf/AddressingWindTurbineNoise.pdf
Al-Soud, M. (2009). Feasibility of wind energy for electrification of rural jordanian sites
Retrieved from http://gateway.isiknowledge.com/gateway/Gateway.cgi?&GWVersion=2&SrcAuth=Serials
Solutions&SrcApp=360&DestLinkType=FullRecord&DestApp=WOS&KeyUT=000266812400010; http://AU4SB9AX7M.search.serialssolutions.com?sid=CentralSearch:EGQ&genre=article&
atitle=Feasibility+of+wind+energy+for+electrification+of+rural+Jordanian+sites&volume=11&issue=2&title=CLEAN+TECHNOLOGIES+AND+ENVIRONMENTAL+POLICY&da
te=2009-06-01&spage=215&aulast=Al-Soud&aufirst=MS
ARENAL.NET. (2006). Arenal and miravalles seismological network., 2010. Retrieved from http://www.arenal.net/volcano-eruption/arenal-miravalles-seismological.htm
AWEA.10 steps to developing a wind farm. Retrieved 09/26, 2010, from
http://www.awea.org/pubs/factsheets/Ten_Steps.pdf
AWEA.Iec wind turbine standards. Retrieved 09/26, 2010, from http://www.awea.org/standards/iec_stds.html
AWEA.Wind web tutorial - WIND ENERGY and the ENVIRONMENT. Retrieved 09/26, 2010,
from http://www.awea.org/faq/wwt_environment.html
AWEA.Wind web tutorial - WIND ENERGY BASICS. Retrieved 09/26, 2010, from http://www.awea.org/faq/wwt_basics.html
Boucher, K., Guerra, J., & Watkins, B.Auburn, massachusetts wind feasibility study. Worcester: Worcester Polytechnic Institute.
Burnett, J. (2008). Costa rica aims to be a carbon-neutral nation ., 2010. Retrieved from http://www.npr.org/templates/story/story.php?storyId=19141333
Burton, T., Sharpe, D., Jenkins, N., & Bossanyi, E. (2001). Wind energy handbook. West Sussex:
Jon Wiley & Sons Ltd.
Caracoglia, L. (2010). Feasibility assessment of a leading-edge-flutter wind power generator Retrieved from
http://gateway.isiknowledge.com/gateway/Gateway.cgi?&GWVersion=2&SrcAuth=SerialsSolutions&SrcApp=360&DestLinkType=FullRecord&DestApp=WOS&KeyUT=000280928300018;
http://AU4SB9AX7M.search.serialssolutions.com?sid=CentralSearch:EGQ&genre=article&
69
atitle=Feasibility+assessment+of+a+leading-edge-flutter+wind+power+generator&volume=98&issue=10-
11&title=JOURNAL+OF+WIND+ENGINEERING+AND+INDUSTRIAL+AERODYNAMICS&date=2010-10-01&spage=679&aulast=Caracoglia&aufirst=L
CIA.COUNTRY COMPARISON:: ELECTRICITY - CONSUMPTION. Retrieved 09/26, 2010,
from https://www.cia.gov/library/publications/the-world-factbook/rankorder/2042rank.html
Clean Energy Ideas. (2009). Advantages & disadvantages of WInd energy., 2010. Retrieved from http://www.clean-energy-
ideas.com/articles/advantages_and_disadvantages_of_wind_energy.html
Committee on Environmental Impacts of Wind Energy Projects National Research Council. (2007). Environmental impacts of wind-energy projects. Washington, DC, USA: National Academies Press.
Costa Rica News. (2009). Wind power in costa rica., 2010. Retrieved from
http://thecostaricanews.com/wind-power- in-costa-rica/643
Cruz-Delgado, F., Wiedenfeld, D. A., & González, J. A. (2010). Assessing the potential impact of wind turbines on the endangered galapagos petrel pterodroma phaeopygia at san cristóbal
island, galapagos. Biodiversity and Conservation, 19(3), 679-694.
Danish Wind Industry Association. (2003). Guided tour, wind. Retrieved 11/08, 2010, from http://guidedtour.windpower.org/en/tour/wres/index.htm
de Araujo Lima, L., & Bezerra Filho, C. R. (2010). Wind energy assessment and wind farm
simulation in triunfo – pernambuco, brazil. Renewable Energy, 35(12), 2705-2713. doi:DOI: 10.1016/j.renene.2010.04.019
D'Silva, R. (2010). Advantages and disadvantages of wind energy. [http://www.buzzle.com/articles/advantages-disadvantages-wind-energy.html] , 2010.
Empresa de Servicios Públicos de Heredia S.A. (ESPH) (2010). PROYECTO EÓLICO VOLCÁN ARENAL PERFIL DEL PROYECTO. Heredia: Empresa de Servicios Públicos de Heredia S.A.
Enercon.Enercon wind turbines - product overview. Retrieved 09/26, 2009, from
http://www.enercon.de/www/en/broschueren.nsf/vwwebAnzeige/15686F537B20CA13C125719400261D37/$FILE/ENE_Produktuebersicht_eng.pdf
Environment Canada. (2009). Canadian wind energy atlas. Retrieved 11/08, 2010, from
http://www.windatlas.ca/en/faq.php
Erickson, W. P., Johnson, G. D., Strickland, M. D., Young Jr., D. P., Sernka, K. J., & Good, R. E. (2001). Avian collisions with wind turbines: A summary of existing studies and
70
comparisons to other sources of avian collision mortality in the united states. (Technical Report No. 1E). Retrieved from
http://www.osti.gov/energycitations/product.biblio.jsp?osti_id=822418. (Avian Collisions with Wind Turbines)
Espinoza, J. L., & Vredenburg, H. (2010). The development of renewable energy industries in
emerging economies: The role of economic, institutional, and socio-cultural contexts in latin america. International Journal of Economics and Business Research, 2(3), 245-270.
European Wind Energy Association. (2010). Frequently asked questions. Retrieved 11/20, 2010,
from http://www.ewea.org/index.php?id=1884
Frandsen, S. T., Jørgensen, H. E., Barthelmie, R., Rathmann, O., Badger, J., Hansen, K., Ott, S., Rethore, P. -., Larsen, S. E., & Jensen, L. E. (2009). The making of a second-generation wind farm efficiency model complex. Wind Energy, 12(5), 445-458. doi:10.1002/we.351
Fry, M. (2010). Permits for puerto rico wind farm clash with endangered puerto rucan nightjars.,
10.
Gamesa.Wind turbine catalog. Retrieved 09/26, 2010, from http://www.gamesacorp.com/en/products/wind-turbines/catalogue
GE Energy.Wind energy at GE. Retrieved 09/26, 2010, from
http://www.gepower.com/businesses/ge_wind_energy/en/index.htm
Ghizzoni, M., Cahill, N., & Low, J. (2009). Winds of worcester. (IQP Worcester, MA: Worcester Polytechnic Institute.
Gomis-Bellmunt, O. (2010). Maximum generation power evaluation of variable frequency
offshore wind farms when connected to a single power converter Retrieved from http://find.galegroup.com/itx/infomark.do?contentSet=IAC-Documents&docType=IAC&type=retrieve&tabID=T001&prodId=AONE&userGroupNam
e=mlin_c_worpoly&version=1.0&searchType=BasicSearchForm&source=library&docId=A230693817&Z3950=1;
http://AU4SB9AX7M.search.serialssolutions.com?sid=CentralSearch:IAO&genre=article&atitle=Maximum+generation+power+evaluation+of+variable+frequency+offshore+wind+farms+when+connected+to+a+single+power+converter.&volume=87&issue=10&title=Applie
d+Energy&issn=0306-2619&date=2010-10-01&spage=3103&aulast=Gomis-Bellmunt&aufirst=Oriol
Grande, J. A. (2009). Retrieved 10/10/2010, 2010, from
http://www.ptonline.com/articles/200810fa2.html
Guralp Systems. (2006). Case study: Discovering the seismic effects of wind farms., 2010.
71
Gurgur, C. Z. (2010). Capacity factor prediction and planning in the wind power generation industry Retrieved from
http://gateway.isiknowledge.com/gateway/Gateway.cgi?&GWVersion=2&SrcAuth=SerialsSolutions&SrcApp=360&DestLinkType=FullRecord&DestApp=WOS&KeyUT=00028037
9400017; http://AU4SB9AX7M.search.serialssolutions.com?sid=CentralSearch:EGQ&genre=article&atitle=Capacity+factor+prediction+and+planning+in+the+wind+power+generation+industry
&volume=35&issue=12&title=RENEWABLE+ENERGY&date=2010-12-01&spage=2761&aulast=Gurgur&aufirst=CZ
Hermann-Josef Wagner, J. M. (2009). Introduction to wind energy systems
basic, technology and operation Springer.
Knipe, M., & McClelland, C. (2008). Wind power in auburn: Siting considerations for a wind turbine. Amherst, MA: University of Massachusetts Department of Mechanical and
Industrial Engineering Renewable Energy Research Laboratory.
Lafee, S. (2010). Wind turbine getting seismic shakedown., 2010. Retrieved from http://www.signonsandiego.com/news/2010/feb/07/wind-turbine-getting-seismic-shakedown/
Lauber, V. (2005). In Lauber V. (Ed.), Switching to renewable power : A framework for the 21st
century. London, , GBR: Earthscan Publications, Limited.
Lovgren, S. (2008).
Costa rica aims to be 1st carbon-neutral country
., 2010. Retrieved from http://news.nationalgeographic.com/news/2008/03/080307-costa-rica.html
Lun, I. Y. F., & Lam, J. C. (2000). A study of weibull parameters using long-term wind
observations 20(2), 2010. Retrieved from http://www.sciencedirect.com/science?_ob=ArticleURL&_udi=B6V4S-3Y162V7-3&_user=74021&_coverDate=06%2F30%2F2000&_rdoc=1&_fmt=high&_orig=search&_
origin=search&_sort=d&_docanchor=&view=c&_searchStrId=1551485677&_rerunOrigin=google&_acct=C000005878&_version=1&_urlVersion=0&_userid=74021&md5=1bbcb964
65253f293c901c3d767dff7c&searchtype=a
Manwell, J. F., McGowen, J. G., & Rogers, A. L. (2002). Wind energy explained theory, design and application. West Sussex: John Wiley & Sons Ltd.
Mathur, J., & Wagner, H. (2009). Introduction to wind energy systems. NY: Springer-Verlag Berlin Heidelberg. Retrieved from
http://www.springerlink.com/content/u61q30/#section=113702&page=3&locus=94
72
MathWorks. (2010). Curve fitting and distribution fitting. Retrieved 11/25, 2010, from http://www.mathworks.com/products/statistics/demos.html?file=/products/demos/shipping/s
tats/cfitdfitdemo.html
McMahan, T. L. (2009). Response by sagebrush power partners to comment letters concerning request for amendment to the kittitas valley wind power project site certificate agreement.
Mears, D. (2008). Feasibility of reidential wind energy: The lack of regulatory integration for
local communities Retrieved from http://find.galegroup.com/itx/infomark.do?contentSet=IAC-
Documents&docType=IAC&type=retrieve&tabID=T001&prodId=AONE&userGroupName=mlin_c_worpoly&version=1.0&searchType=BasicSearchForm&source=library&docId=A196909131&Z3950=1;
http://AU4SB9AX7M.search.serialssolutions.com?sid=CentralSearch:IAO&genre=article&atitle=Feasibility+of+reidential+wind+energy%3A+the+lack+of+regulatory+integration+fo
r+local+communities.&volume=37&issue=3&title=Real+Estate+Law+Journal&issn=0048-6868&date=2008-12-22&spage=133&aulast=Mears&aufirst=David
Mostafaeipour, A. (2010). Feasibility study of harnessing wind energy for turbine installation in province of yazd in iran Retrieved from
http://gateway.isiknowledge.com/gateway/Gateway.cgi?&GWVersion=2&SrcAuth=SerialsSolutions&SrcApp=360&DestLinkType=FullRecord&DestApp=WOS&KeyUT=00027127
9100005; http://AU4SB9AX7M.search.serialssolutions.com?sid=CentralSearch:EGQ&genre=article&atitle=Feasibility+study+of+harnessing+wind+energy+for+turbine+installation+in+provinc
e+of+Yazd+in+Iran&volume=14&issue=1&title=RENEWABLE+%26+SUSTAINABLE+ENERGY+REVIEWS&date=2010-01-01&spage=93&aulast=Mostafaeipour&aufirst=A
Nelson, V. (2009). Wind energy renewable energy and the environment. Boca Raton: CRC Press.
Retrieved from http://www.crcnetbase.com/ISBN/9781420075687
Ntambakw, E., & Roger, M. (2009). Seismic forces for wind turbine foundation., 2010.
Ozerdem, B., Ozer, S., & Tosun, M. (2006). Feasibility study of wind farms: A case study for izmir, turkey. Journal of Wind Engineering and Industrial Aerodynamics, 94(10), 725-743.
doi:DOI: 10.1016/j.jweia.2006.02.004
Perez, C. (2006). Minutes of the workshop on adaptation to climate change in costa rica. Workshop on Adaptation to Climate Change in Costa Rica, National Meteoroligical Institute, San Jose, Costa Rica.
Peri, S. (2010). Global investments in renewable energy are expected to reach $653.35 billion by
2015. Retrieved 11/8, 2010, from http://www.altenergymag.com/emagazine.php?art_id=1501
73
Polish Wind. (2006). Frequently asked questions., 2010. Retrieved from http://www.elektrownie-wiatrowe.org.pl/en/faq.htm
Pratt, S. P., & Grabowski, R. J. (2008). Cost of capital : Applications and examples (3rd edition)
Ragheb, M. (2009). Optimal rotor tip speed ratio. Urbana, IL: University of Illinois at Urbana-Champaign.
Raja, A. K. (2006). Power plant engineering. Daryaganj, Delhi, IND: New Age International.
Rehman, S., & Al-Abbadi, N. M. (2008). Wind shear coefficient, turbulence intensity and wind power potential assessment for dhulom, saudi arabia. Renewable Energy, 33(12), 2653-
2660. doi:DOI: 10.1016/j.renene.2008.02.012
Renewable Energy World. (2010).
49-MW of wind goes live in costa rica
., 2010. Retrieved from http://www.renewableenergyworld.com/rea/news/article/2010/04/49-mw-of-wind-goes- live-
in-costa-rica
Siemens.Wind turbines. Retrieved 09/26, 2010, from http://www.energy.siemens.com/hq/en/power-generation/renewables/wind-power/wind-turbines/
Stronza, A., & Durham, W. H. (2010). Laura Chinchilla wants 100% of the consumed Costa
Rican energy to be clean. [Laura Chinchilla quiere que 100% de la energía consumida por Costa Rica sea "limpia"] , 2010. Retrieved from
http://www.americaeconomia.com/negocios-industrias/laura-chinchilla-quiere-que-100-de-la-energia-consumida-por-costa-rica-sea-limpi
The Wall Street Journal. (2010). Money rates. Retrieved 12/07, 2010, from http://online.wsj.com/mdc/public/page/2_3020-moneyrate.html
Thelander, .Avoiding, minimizing, and mitigating avian and bat impacts.
Valladares, D. (2010). Doors wide open for renewable energy ., 2010.
Vanek, F., & Albright, L. D. (2008). Energy systems engineering : Evaluation and implementation. New York, NY, USA: McGraw-Hill Professional.
Vargas Alejandra M. (2007.). Country wants to be the first carbon neutral nation . [País quiere ser primera nación con balance
neutro de carbono
] , 2010. Retrieved from http://wvw.nacion.com/ln_ee/2007/febrero/21/aldea1002694.html
74
Vaughn Nelson. (2009). Wind energy renewable energy and the environment. Boca Raton, FL: CRC Press.
Verdin, A. (2010). Costa rica: 100% of consumed energy should be clean., 2010. Retrieved from
http://www.energydigital.com/industry-focus/renewables-green-business/costa-rica-100-consumed-energy-should-be-clean
Vestas.Turbine overview. Retrieved 09/26http://www.vestas.com/en/wind-power-
plants/procurement/turbine-overview.aspx#/vestas-univers
Vogel, J. (2005). Wind: A hard-blowing history.(wind power development) Retrieved from http://find.galegroup.com/gtx/infomark.do?&contentSet=IAC-
Documents&type=retrieve&tabID=T001&prodId=AONE&docId=A126849598&source=gale&srcprod=AONE&userGroupName=mlin_c_worpoly&version=1.0
Walsh, B. (2009). Denmark's wind of change., 2010. Retrieved from http://www.time.com/time/magazine/article/0,9171,1881646-1,00.html
WAsP. (2007). The roughness of a terrain. Retrieved 11/20/2010, 2010, from http://www.wasp.dk/support/FAQ/WebHelp/RoughnessofaTerrain.htm
Wind power in power systems (2005). In Ackermann T. (Ed.), . Hoboken, NJ, USA: John Wiley
& Sons, Incorporated.
World Resource Institute. (1999). Energy and ResourcesCountry profile: Costa rica. Retrieved
11/20, 2010, from http://earthtrends.wri.org/text/energy-resources/country-profile-43.html
World Wind Energy Association. (2010). Statistics. Retrieved 11/20, 2010, from http://www.wwindea.org/home/index.php?option=com_content&task=blogcategory&id=21
&Itemid=43
World Wind Energy Association. (2010). World wind energy report 2009. Retrieved from http://www.wwindea.org/home/images/stories/worldwindenergyreport2009_s.pdf
Writer, J. M., Business. (2008, October 31). Wind farm blades ready to turn later this year ; ENERGY; RED HILLS CONCRETE POURED. The Oklahoman (Oklahoma City, OK), pp.
2B.
75
Glossary
Betz's Law: A theory that states that the maximum power coefficient is 0.5925, or 59.25% efficiency
Capacity factor: The ratio, expressed in percent, of the actual output of a power plant over a
period of time and its output if it had operated at its full name-plate power rating the entire time.
Drag force: Opposing force that acts on the rotor blades by the wind
Fictitious force: A force that does not come from the interaction of objects within a frame of reference but rather from the acceleration of the frame of reference as a whole.
Flagging: A phenomenon where trees and other vegetation in a high-wind area lean in the area’s
predominant wind direction.
Lift force: force that acts on the rotor blades that is provided by the motor in the wind turbine
Magnetic induction: A physical phenomenon where a changing magnetic field produces electric voltage in a coil. This principle used in wind turbines to generate electricity.
Met towers: Short for meteorological tower, met towers are erected with anemometers to collect
wind data at a point over a long period of time.
Name-plate power rating: The ideal power rating of a power plant, in watts. Power plants,
especially wind farms, rarely generate their name-plate power rating as it is the maximum output.
Pay-back period: The time between the beginning of wind farm operation and when the wind farm has recouped its initial investment.
Porosity: The ratio between open space within an object and the total volume of the object. In wind, it is related to how much interference objects such as trees have on wind.
Rose diagram: A circular graph that expresses magnitude as a function of angle. Wind roses, for example, show average wind speed in every direction from a central point.
Shadow effect: The decrease in wind speed in the area behind a wind turbine.
Shadow flickering: The flickering of light experience by anyone standing in the shadow of a turbine's blades.
Stator: The non-moving component of a generator, usually a coil, on which voltage is induced by changes in the magnetic field.
Tip speed ratio: The ratio between the speed of the tip of the blade and the wind speed
Transformer: Electric installation which changes the voltage, frequency and/or phase of transmitted electric power.
Weibull distribution: A probability density function commonly used as a flexible representation of the probability of a certain wind speed available at a given location as well as many other natural phenomena.
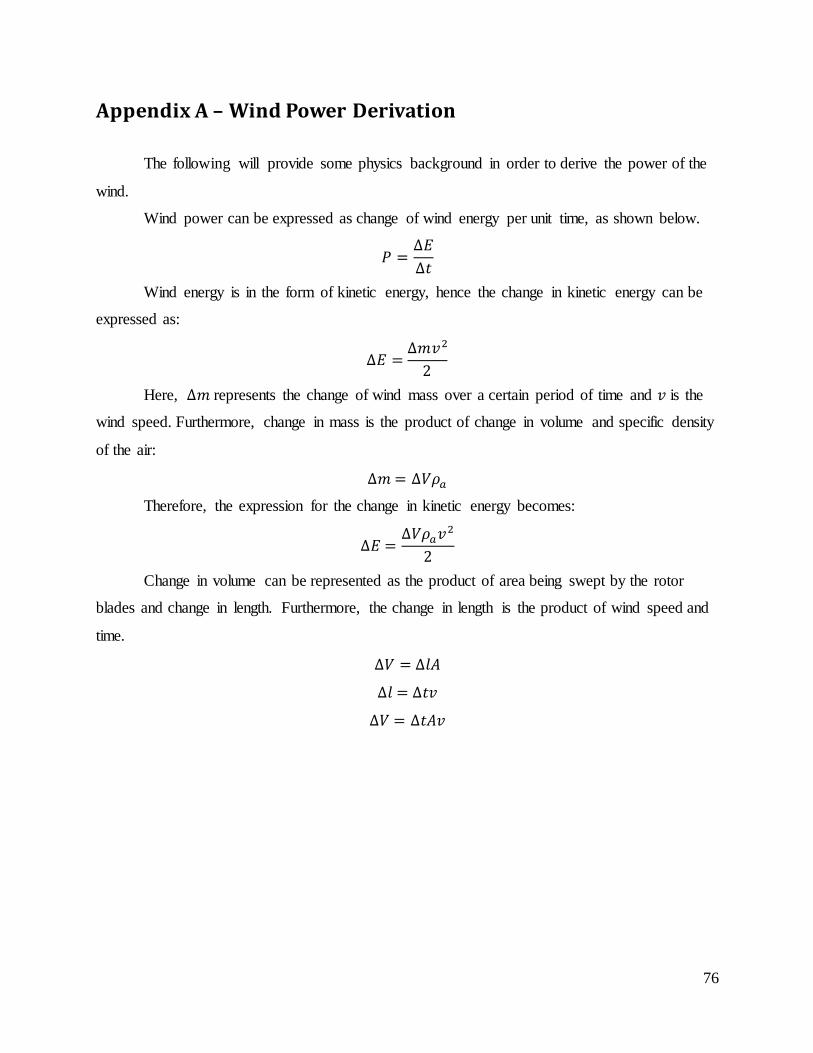
76
Appendix A – Wind Power Derivation
The following will provide some physics background in order to derive the power of the
wind.
Wind power can be expressed as change of wind energy per unit time, as shown below.
Wind energy is in the form of kinetic energy, hence the change in kinetic energy can be
expressed as:
Here, represents the change of wind mass over a certain period of time and is the
wind speed. Furthermore, change in mass is the product of change in volume and specific density
of the air:
Therefore, the expression for the change in kinetic energy becomes:
Change in volume can be represented as the product of area being swept by the rotor
blades and change in length. Furthermore, the change in length is the product of wind speed and
time.
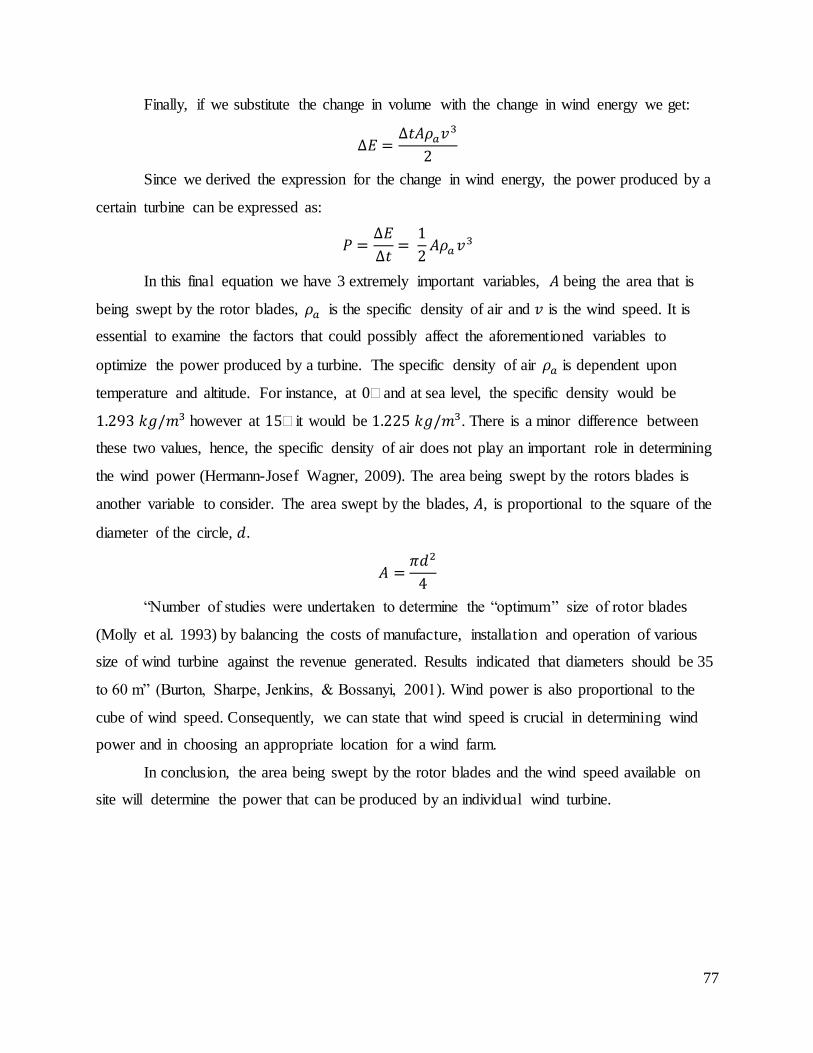
77
Finally, if we substitute the change in volume with the change in wind energy we get:
Since we derived the expression for the change in wind energy, the power produced by a
certain turbine can be expressed as:
In this final equation we have 3 extremely important variables, being the area that is
being swept by the rotor blades, is the specific density of air and is the wind speed. It is
essential to examine the factors that could possibly affect the aforementioned variables to
optimize the power produced by a turbine. The specific density of air is dependent upon
temperature and altitude. For instance, at and at sea level, the specific density would be
however at it would be . There is a minor difference between
these two values, hence, the specific density of air does not play an important role in determining
the wind power (Hermann-Josef Wagner, 2009). The area being swept by the rotors blades is
another variable to consider. The area swept by the blades, , is proportional to the square of the
diameter of the circle,
“Number of studies were undertaken to determine the “optimum” size of rotor blades
(Molly et al. 1993) by balancing the costs of manufacture, installation and operation of various
size of wind turbine against the revenue generated. Results indicated that diameters should be 35
to 60 m” (Burton, Sharpe, Jenkins, & Bossanyi, 2001). Wind power is also proportional to the
cube of wind speed. Consequently, we can state that wind speed is crucial in determining wind
power and in choosing an appropriate location for a wind farm.
In conclusion, the area being swept by the rotor blades and the wind speed available on
site will determine the power that can be produced by an individual wind turbine.

78
Appendix B – Turbine Power Generation & Efficiency
Considering all limitations in transferring the wind power in a wind turbine, the power
that is delivered to the electric grid is approximately:
The previously undefined variables in this equation are: the power
coefficient - the percentage of wind power captured by the blades, - the gearbox efficiency,
and - the electric generator efficiency (Manwell, McGowen, & Rogers, 2002).
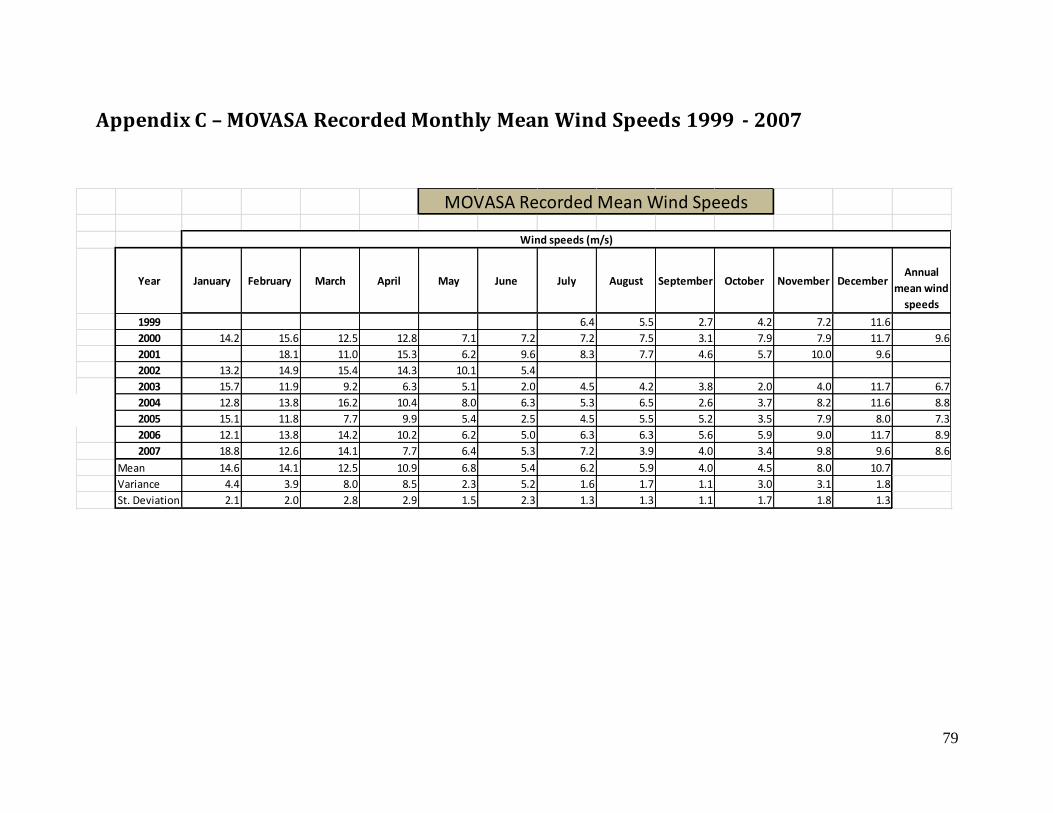
79
Year January February March April May June July August September October November DecemberAnnual
mean wind
speeds
1999 6.4 5.5 2.7 4.2 7.2 11.6
2000 14.2 15.6 12.5 12.8 7.1 7.2 7.2 7.5 3.1 7.9 7.9 11.7 9.6
2001 18.1 11.0 15.3 6.2 9.6 8.3 7.7 4.6 5.7 10.0 9.6
2002 13.2 14.9 15.4 14.3 10.1 5.4
2003 15.7 11.9 9.2 6.3 5.1 2.0 4.5 4.2 3.8 2.0 4.0 11.7 6.7
2004 12.8 13.8 16.2 10.4 8.0 6.3 5.3 6.5 2.6 3.7 8.2 11.6 8.8
2005 15.1 11.8 7.7 9.9 5.4 2.5 4.5 5.5 5.2 3.5 7.9 8.0 7.3
2006 12.1 13.8 14.2 10.2 6.2 5.0 6.3 6.3 5.6 5.9 9.0 11.7 8.9
2007 18.8 12.6 14.1 7.7 6.4 5.3 7.2 3.9 4.0 3.4 9.8 9.6 8.6
Mean 14.6 14.1 12.5 10.9 6.8 5.4 6.2 5.9 4.0 4.5 8.0 10.7
Variance 4.4 3.9 8.0 8.5 2.3 5.2 1.6 1.7 1.1 3.0 3.1 1.8
St. Deviation 2.1 2.0 2.8 2.9 1.5 2.3 1.3 1.3 1.1 1.7 1.8 1.3
Wind speeds (m/s)
MOVASA Recorded Mean Wind Speeds
Appendix C – MOVASA Recorded Monthly Mean Wind Speeds 1999 - 2007
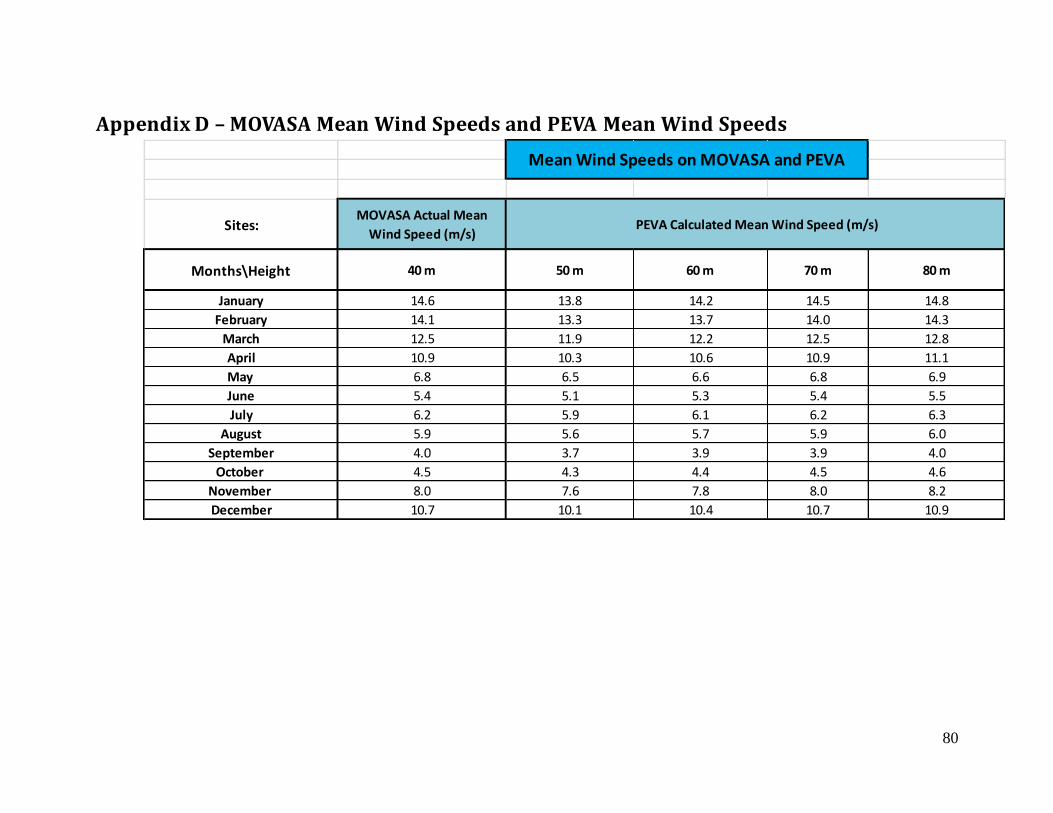
80
Appendix D – MOVASA Mean Wind Speeds and PEVA Mean Wind Speeds
Sites:MOVASA Actual Mean
Wind Speed (m/s)
Months\Height 40 m 50 m 60 m 70 m 80 m
January 14.6 13.8 14.2 14.5 14.8
February 14.1 13.3 13.7 14.0 14.3
March 12.5 11.9 12.2 12.5 12.8
April 10.9 10.3 10.6 10.9 11.1
May 6.8 6.5 6.6 6.8 6.9
June 5.4 5.1 5.3 5.4 5.5
July 6.2 5.9 6.1 6.2 6.3
August 5.9 5.6 5.7 5.9 6.0
September 4.0 3.7 3.9 3.9 4.0
October 4.5 4.3 4.4 4.5 4.6
November 8.0 7.6 7.8 8.0 8.2
December 10.7 10.1 10.4 10.7 10.9
Mean Wind Speeds on MOVASA and PEVA
PEVA Calculated Mean Wind Speed (m/s)
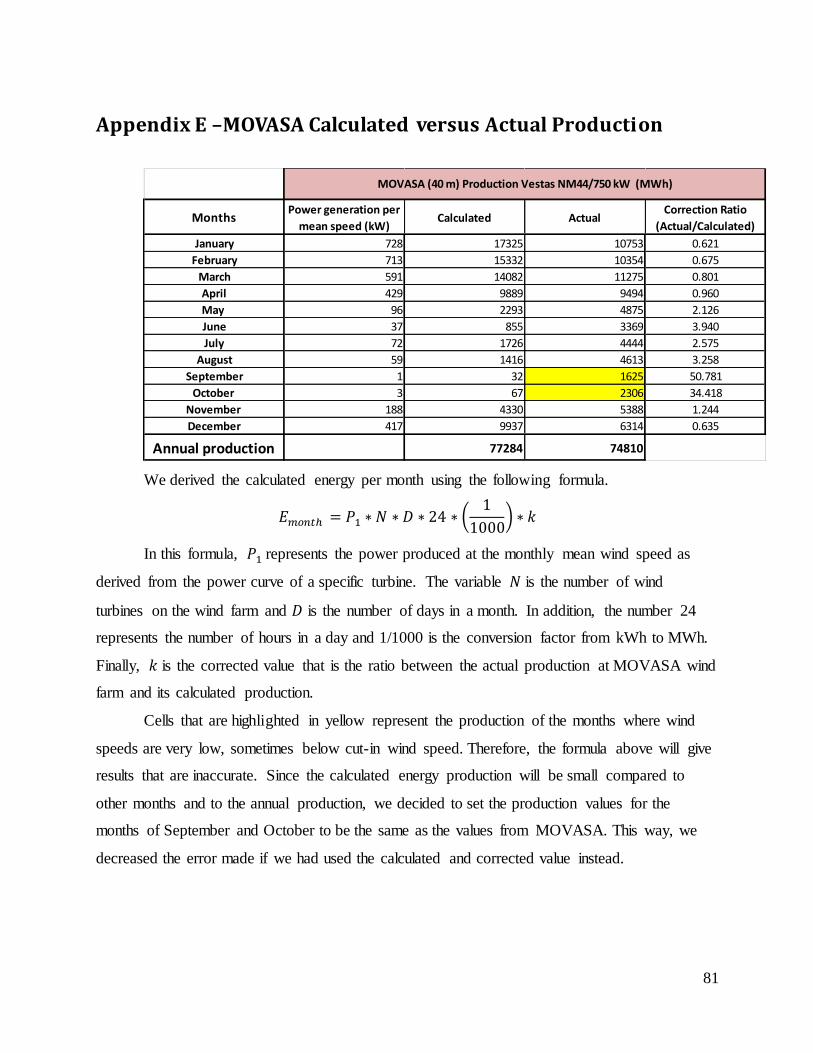
81
Appendix E –MOVASA Calculated versus Actual Production
We derived the calculated energy per month using the following formula.
(
)
In this formula, represents the power produced at the monthly mean wind speed as
derived from the power curve of a specific turbine. The variable is the number of wind
turbines on the wind farm and is the number of days in a month. In addition, the number 24
represents the number of hours in a day and 1/1000 is the conversion factor from kWh to MWh.
Finally, is the corrected value that is the ratio between the actual production at MOVASA wind
farm and its calculated production.
Cells that are highlighted in yellow represent the production of the months where wind
speeds are very low, sometimes below cut-in wind speed. Therefore, the formula above will give
results that are inaccurate. Since the calculated energy production will be small compared to
other months and to the annual production, we decided to set the production values for the
months of September and October to be the same as the values from MOVASA. This way, we
decreased the error made if we had used the calculated and corrected value instead.
MonthsPower generation per
mean speed (kW)Calculated Actual
Correction Ratio
(Actual/Calculated)
January 728 17325 10753 0.621
February 713 15332 10354 0.675
March 591 14082 11275 0.801
April 429 9889 9494 0.960
May 96 2293 4875 2.126
June 37 855 3369 3.940
July 72 1726 4444 2.575
August 59 1416 4613 3.258
September 1 32 1625 50.781
October 3 67 2306 34.418
November 188 4330 5388 1.244
December 417 9937 6314 0.635
Annual production 77284 74810
MOVASA (40 m) Production Vestas NM44/750 kW (MWh)
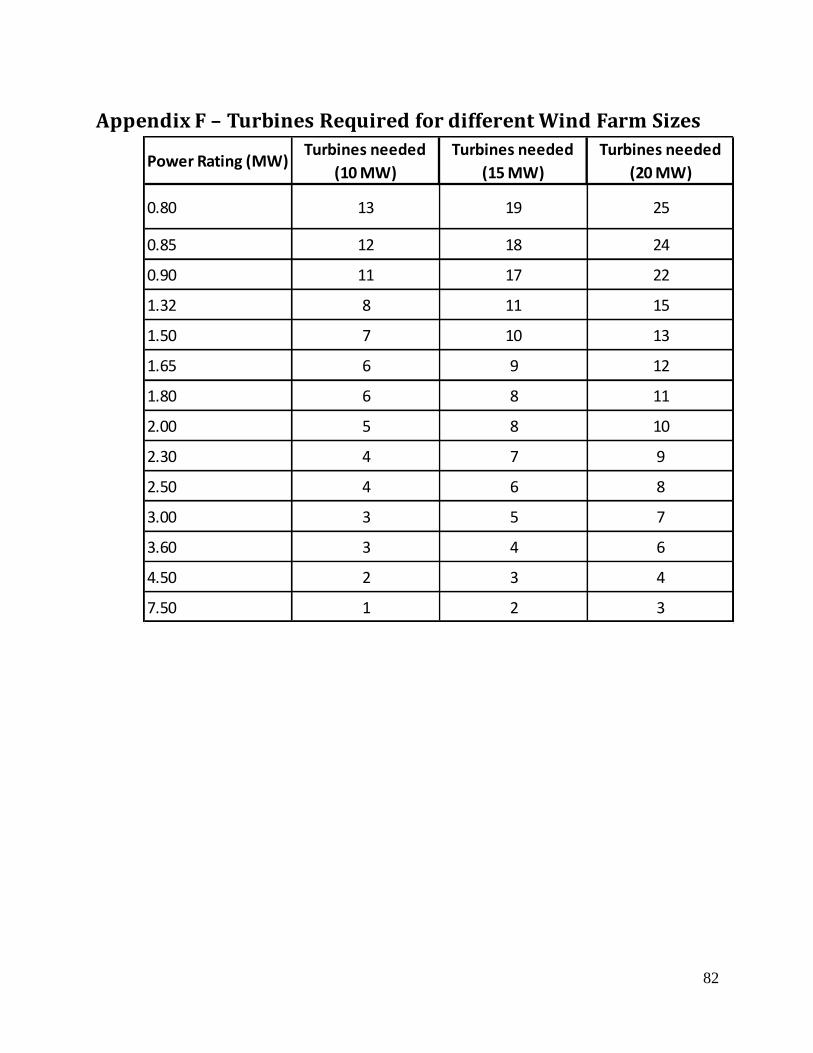
82
Appendix F – Turbines Required for different Wind Farm Sizes
Power Rating (MW)Turbines needed
(10 MW)
Turbines needed
(15 MW)
Turbines needed
(20 MW)
0.80 13 19 25
0.85 12 18 24
0.90 11 17 22
1.32 8 11 15
1.50 7 10 13
1.65 6 9 12
1.80 6 8 11
2.00 5 8 10
2.30 4 7 9
2.50 4 6 8
3.00 3 5 7
3.60 3 4 6
4.50 2 3 4
7.50 1 2 3
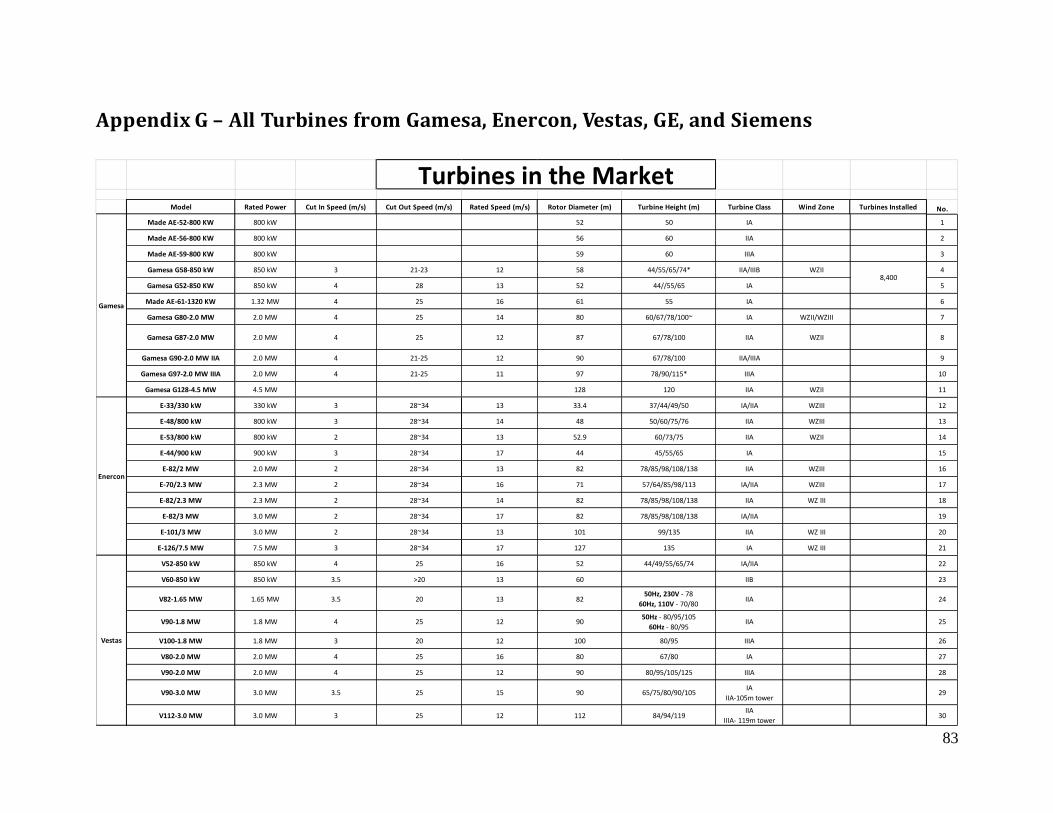
83
Model Rated Power Cut In Speed (m/s) Cut Out Speed (m/s) Rated Speed (m/s) Rotor Diameter (m) Turbine Height (m) Turbine Class Wind Zone Turbines Installed No.
Made AE-52-800 KW 800 kW 52 50 IA 1
Made AE-56-800 KW 800 kW 56 60 IIA 2
Made AE-59-800 KW 800 kW 59 60 IIIA 3
Gamesa G58-850 kW 850 kW 3 21-23 12 58 44/55/65/74* IIA/IIIB WZII 4
Gamesa G52-850 KW 850 kW 4 28 13 52 44//55/65 IA 5
Made AE-61-1320 KW 1.32 MW 4 25 16 61 55 IA 6
Gamesa G80-2.0 MW 2.0 MW 4 25 14 80 60/67/78/100~ IA WZII/WZIII 7
Gamesa G87-2.0 MW 2.0 MW 4 25 12 87 67/78/100 IIA WZII 8
Gamesa G90-2.0 MW IIA 2.0 MW 4 21-25 12 90 67/78/100 IIA/IIIA 9
Gamesa G97-2.0 MW IIIA 2.0 MW 4 21-25 11 97 78/90/115* IIIA 10
Gamesa G128-4.5 MW 4.5 MW 128 120 IIA WZII 11
E-33/330 kW 330 kW 3 28~34 13 33.4 37/44/49/50 IA/IIA WZIII 12
E-48/800 kW 800 kW 3 28~34 14 48 50/60/75/76 IIA WZIII 13
E-53/800 kW 800 kW 2 28~34 13 52.9 60/73/75 IIA WZII 14
E-44/900 kW 900 kW 3 28~34 17 44 45/55/65 IA 15
E-82/2 MW 2.0 MW 2 28~34 13 82 78/85/98/108/138 IIA WZIII 16
E-70/2.3 MW 2.3 MW 2 28~34 16 71 57/64/85/98/113 IA/IIA WZIII 17
E-82/2.3 MW 2.3 MW 2 28~34 14 82 78/85/98/108/138 IIA WZ III 18
E-82/3 MW 3.0 MW 2 28~34 17 82 78/85/98/108/138 IA/IIA 19
E-101/3 MW 3.0 MW 2 28~34 13 101 99/135 IIA WZ III 20
E-126/7.5 MW 7.5 MW 3 28~34 17 127 135 IA WZ III 21
V52-850 kW 850 kW 4 25 16 52 44/49/55/65/74 IA/IIA 22
V60-850 kW 850 kW 3.5 >20 13 60 IIB 23
V82-1.65 MW 1.65 MW 3.5 20 13 8250Hz, 230V - 78
60Hz, 110V - 70/80IIA 24
V90-1.8 MW 1.8 MW 4 25 12 9050Hz - 80/95/105
60Hz - 80/95IIA 25
V100-1.8 MW 1.8 MW 3 20 12 100 80/95 IIIA 26
V80-2.0 MW 2.0 MW 4 25 16 80 67/80 IA 27
V90-2.0 MW 2.0 MW 4 25 12 90 80/95/105/125 IIIA 28
V90-3.0 MW 3.0 MW 3.5 25 15 90 65/75/80/90/105IA
IIA-105m tower29
V112-3.0 MW 3.0 MW 3 25 12 112 84/94/119IIA
IIIA- 119m tower30
Turbines in the Market
8,400
Gamesa
Enercon
Vestas
Appendix G – All Turbines from Gamesa, Enercon, Vestas, GE, and Siemens
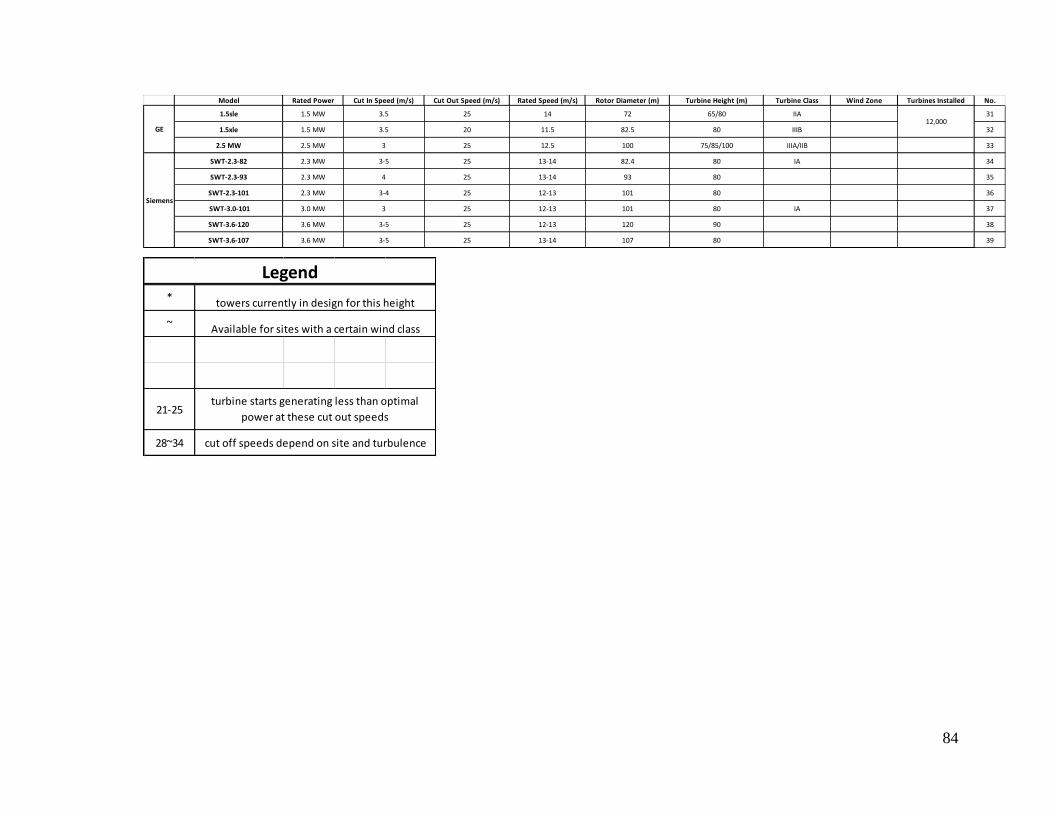
84
Model Rated Power Cut In Speed (m/s) Cut Out Speed (m/s) Rated Speed (m/s) Rotor Diameter (m) Turbine Height (m) Turbine Class Wind Zone Turbines Installed No.
1.5sle 1.5 MW 3.5 25 14 72 65/80 IIA 31
1.5xle 1.5 MW 3.5 20 11.5 82.5 80 IIIB 32
2.5 MW 2.5 MW 3 25 12.5 100 75/85/100 IIIA/IIB 33
SWT-2.3-82 2.3 MW 3-5 25 13-14 82.4 80 IA 34
SWT-2.3-93 2.3 MW 4 25 13-14 93 80 35
SWT-2.3-101 2.3 MW 3-4 25 12-13 101 80 36
SWT-3.0-101 3.0 MW 3 25 12-13 101 80 IA 37
SWT-3.6-120 3.6 MW 3-5 25 12-13 120 90 38
SWT-3.6-107 3.6 MW 3-5 25 13-14 107 80 39
Siemens
12,000GE
*
~
21-25
28~34
towers currently in design for this height
Available for sites with a certain wind class
turbine starts generating less than optimal
power at these cut out speeds
cut off speeds depend on site and turbulence
Legend
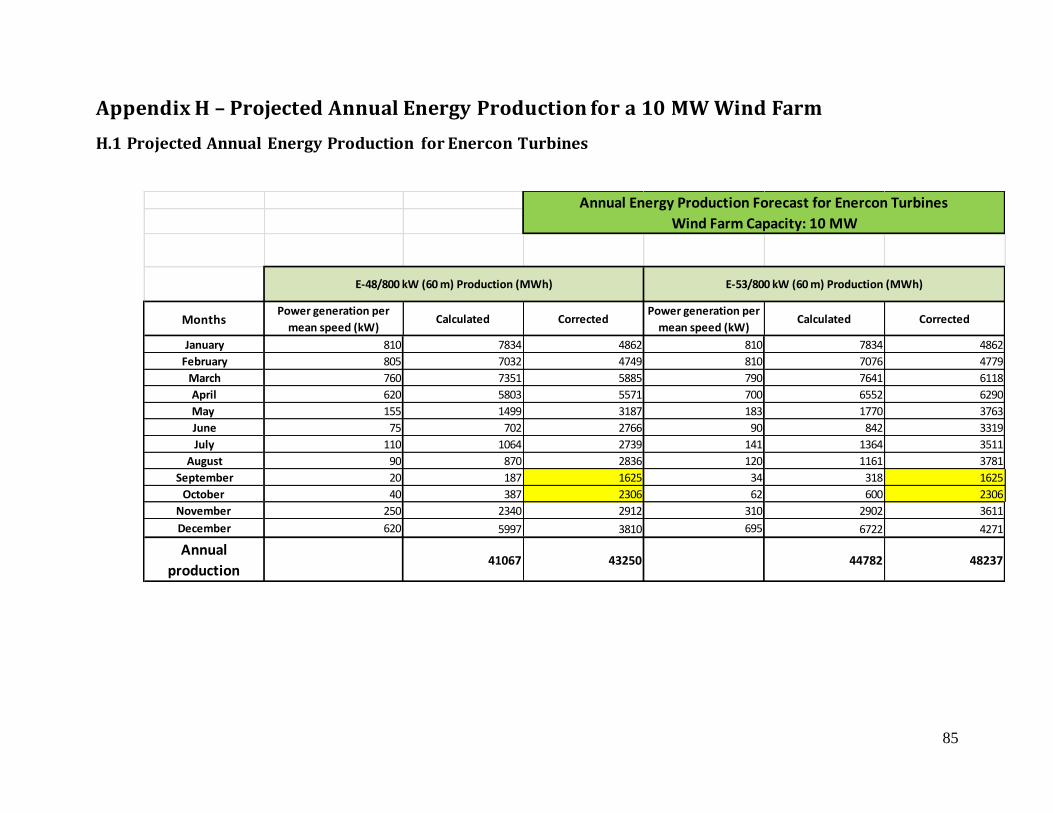
85
Appendix H – Projected Annual Energy Production for a 10 MW Wind Farm
H.1 Projected Annual Energy Production for Enercon Turbines
MonthsPower generation per
mean speed (kW)Calculated Corrected
Power generation per
mean speed (kW)Calculated Corrected
January 810 7834 4862 810 7834 4862
February 805 7032 4749 810 7076 4779
March 760 7351 5885 790 7641 6118
April 620 5803 5571 700 6552 6290
May 155 1499 3187 183 1770 3763
June 75 702 2766 90 842 3319
July 110 1064 2739 141 1364 3511
August 90 870 2836 120 1161 3781
September 20 187 1625 34 318 1625
October 40 387 2306 62 600 2306
November 250 2340 2912 310 2902 3611
December 620 5997 3810 695 6722 4271
Annual
production41067 43250 44782 48237
E-48/800 kW (60 m) Production (MWh) E-53/800 kW (60 m) Production (MWh)
Annual Energy Production Forecast for Enercon Turbines
Wind Farm Capacity: 10 MW

86
MonthsPower generation per
mean speed (kW)Calculated Corrected
Power generation per
mean speed (kW)Calculated Corrected
January 2250 6696 4156 2350 6994 4341
February 2180 5860 3957 2350 6317 4266
March 1930 5744 4599 2220 6607 5290
April 1400 4032 3871 1900 5472 5253
May 350 1042 2214 515 1533 3258
June 150 432 1702 250 720 2837
July 245 729 1877 380 1131 2912
August 210 625 2036 321 955 3112
September 46 132 1625 82 236 1625
October 85 253 2306 135 402 2306
November 590 1699 2114 840 2419 3010
December 1400 4166 2647 1835 5461 3470
Annual
production31410 33106 38246 41680
E-82/2.3 MW (80 m) Production (MWh)E-70/2.3 MW (60 m) Production (MWh)
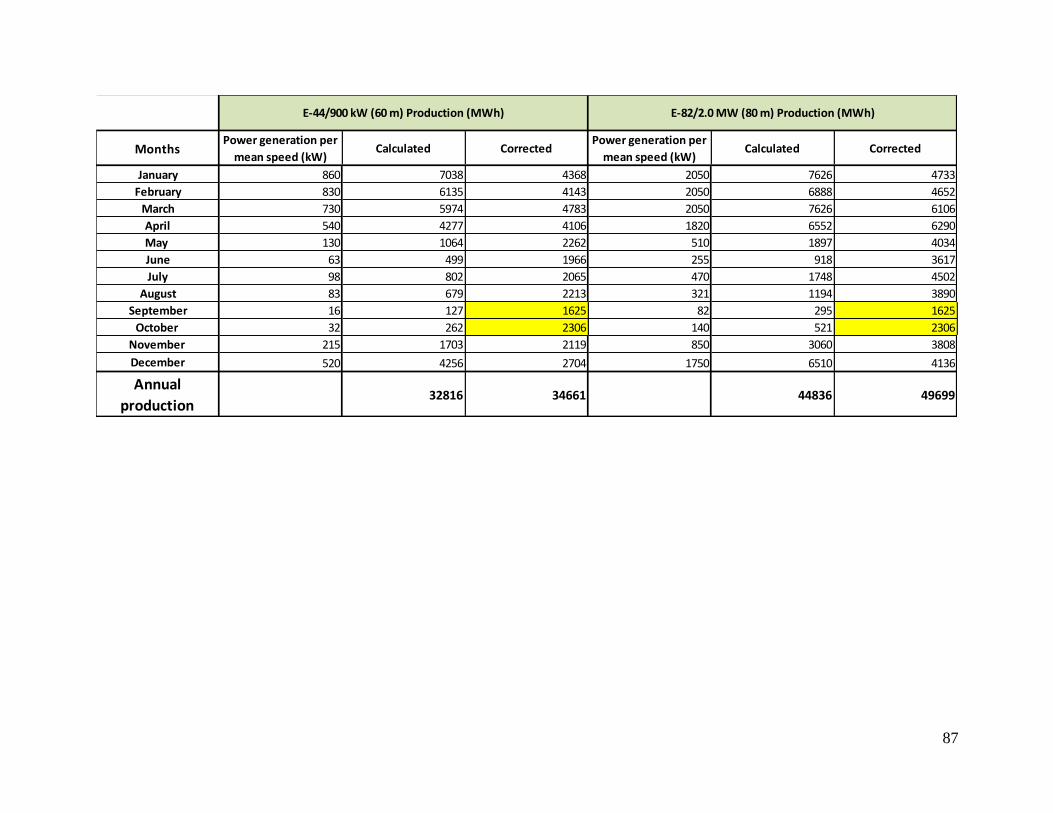
87
MonthsPower generation per
mean speed (kW)Calculated Corrected
Power generation per
mean speed (kW)Calculated Corrected
January 860 7038 4368 2050 7626 4733
February 830 6135 4143 2050 6888 4652
March 730 5974 4783 2050 7626 6106
April 540 4277 4106 1820 6552 6290
May 130 1064 2262 510 1897 4034
June 63 499 1966 255 918 3617
July 98 802 2065 470 1748 4502
August 83 679 2213 321 1194 3890
September 16 127 1625 82 295 1625
October 32 262 2306 140 521 2306
November 215 1703 2119 850 3060 3808
December 520 4256 2704 1750 6510 4136
Annual
production32816 34661 44836 49699
E-44/900 kW (60 m) Production (MWh) E-82/2.0 MW (80 m) Production (MWh)
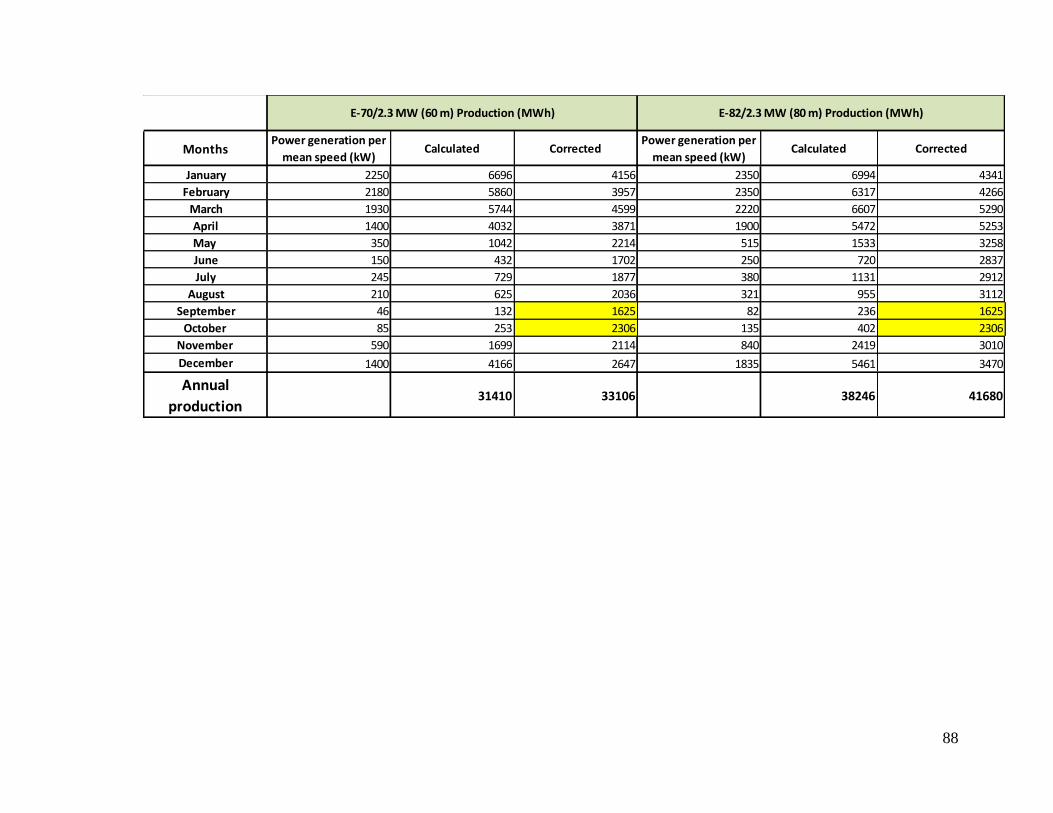
88
MonthsPower generation per
mean speed (kW)Calculated Corrected
Power generation per
mean speed (kW)Calculated Corrected
January 2250 6696 4156 2350 6994 4341
February 2180 5860 3957 2350 6317 4266
March 1930 5744 4599 2220 6607 5290
April 1400 4032 3871 1900 5472 5253
May 350 1042 2214 515 1533 3258
June 150 432 1702 250 720 2837
July 245 729 1877 380 1131 2912
August 210 625 2036 321 955 3112
September 46 132 1625 82 236 1625
October 85 253 2306 135 402 2306
November 590 1699 2114 840 2419 3010
December 1400 4166 2647 1835 5461 3470
Annual
production31410 33106 38246 41680
E-82/2.3 MW (80 m) Production (MWh)E-70/2.3 MW (60 m) Production (MWh)
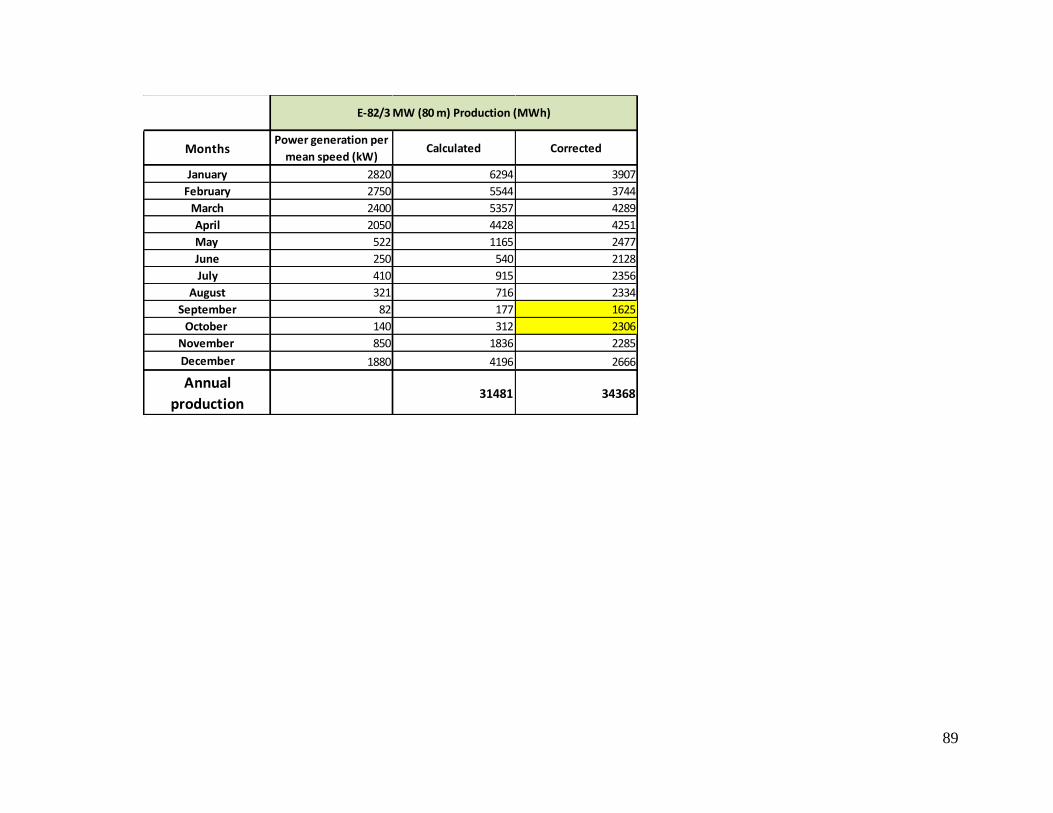
89
MonthsPower generation per
mean speed (kW)Calculated Corrected
January 2820 6294 3907
February 2750 5544 3744
March 2400 5357 4289
April 2050 4428 4251
May 522 1165 2477
June 250 540 2128
July 410 915 2356
August 321 716 2334
September 82 177 1625
October 140 312 2306
November 850 1836 2285
December 1880 4196 2666
Annual
production31481 34368
E-82/3 MW (80 m) Production (MWh)

90
H.2 Projected Annual Energy Production for Other Turbines
MonthsPower generation per
mean speed (kW)Calculated Corrected
Power generation per
mean speed (kW)Calculated Corrected
January 2000 7440 4618 1500 7812 4849
February 1900 6384 4311 1500 7056 4765
March 1800 6696 5361 1500 7812 6255
April 1300 4680 4493 1500 7560 7258
May 300 1116 2373 550 2864 6090
June 150 540 2128 300 1512 5958
July 250 930 2395 430 2239 5766
August 220 818 2666 400 2083 6787
September 0 0 1625 150 756 1625
October 50 186 2306 210 1094 2306
November 500 1800 2240 890 4486 5582
December 1100 4092 2600 1450 7552 4798
Annual
Production34682 37115 52826 62038
GAMESA G80/2 MW (60 m) Production (MWh) General Electric 1.5xle/1.5 MW (80 m) Production (MWh)
Annual Energy Production Forecast for Other Turbines
Wind Farm Capacity: 10 MW
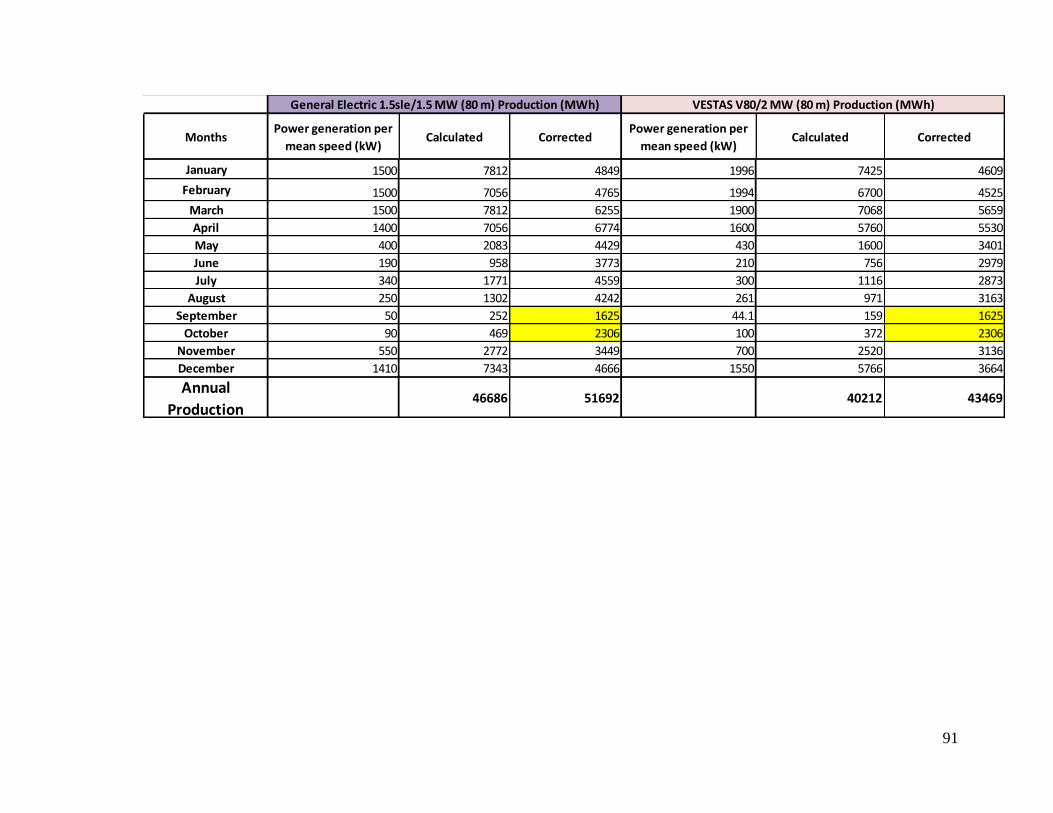
91
MonthsPower generation per
mean speed (kW)Calculated Corrected
Power generation per
mean speed (kW)Calculated Corrected
January 1500 7812 4849 1996 7425 4609
February 1500 7056 4765 1994 6700 4525
March 1500 7812 6255 1900 7068 5659
April 1400 7056 6774 1600 5760 5530
May 400 2083 4429 430 1600 3401
June 190 958 3773 210 756 2979
July 340 1771 4559 300 1116 2873
August 250 1302 4242 261 971 3163
September 50 252 1625 44.1 159 1625
October 90 469 2306 100 372 2306
November 550 2772 3449 700 2520 3136
December 1410 7343 4666 1550 5766 3664
Annual
Production46686 51692 40212 43469
VESTAS V80/2 MW (80 m) Production (MWh)General Electric 1.5sle/1.5 MW (80 m) Production (MWh)
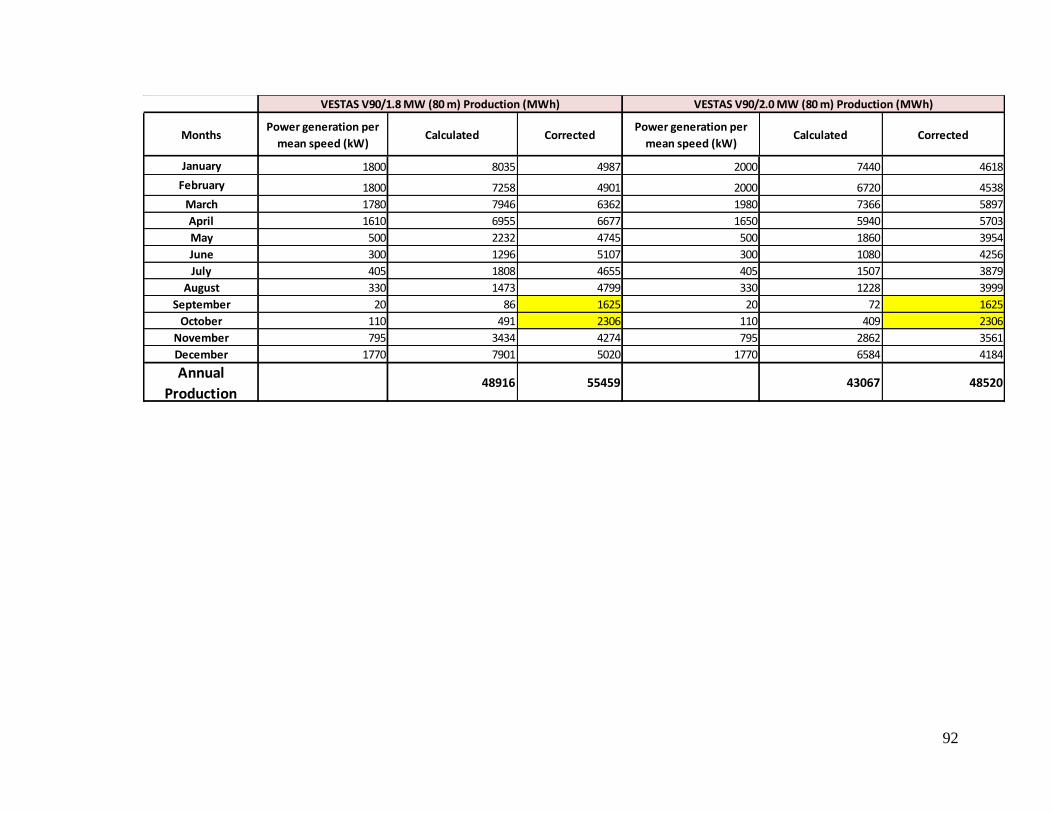
92
MonthsPower generation per
mean speed (kW)Calculated Corrected
Power generation per
mean speed (kW)Calculated Corrected
January 1800 8035 4987 2000 7440 4618
February 1800 7258 4901 2000 6720 4538
March 1780 7946 6362 1980 7366 5897
April 1610 6955 6677 1650 5940 5703
May 500 2232 4745 500 1860 3954
June 300 1296 5107 300 1080 4256
July 405 1808 4655 405 1507 3879
August 330 1473 4799 330 1228 3999
September 20 86 1625 20 72 1625
October 110 491 2306 110 409 2306
November 795 3434 4274 795 2862 3561
December 1770 7901 5020 1770 6584 4184
Annual
Production48916 55459 43067 48520
VESTAS V90/1.8 MW (80 m) Production (MWh) VESTAS V90/2.0 MW (80 m) Production (MWh)
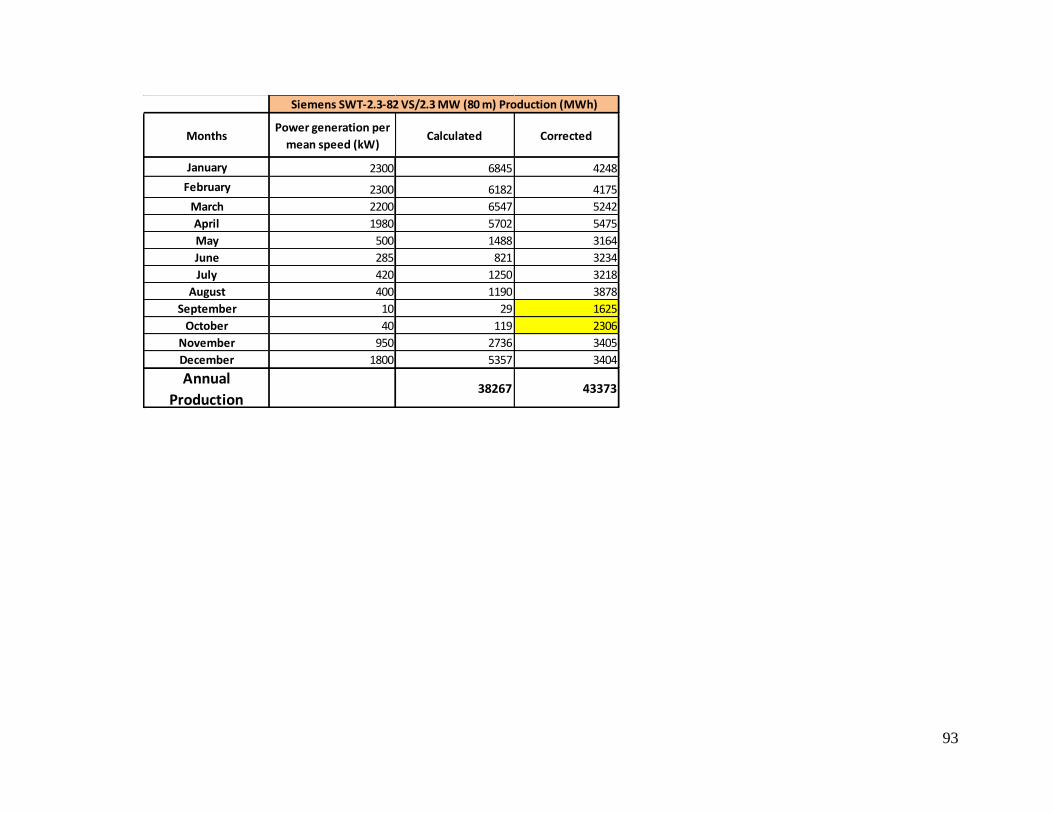
93
MonthsPower generation per
mean speed (kW)Calculated Corrected
January 2300 6845 4248
February 2300 6182 4175
March 2200 6547 5242
April 1980 5702 5475
May 500 1488 3164
June 285 821 3234
July 420 1250 3218
August 400 1190 3878
September 10 29 1625
October 40 119 2306
November 950 2736 3405
December 1800 5357 3404
Annual
Production38267 43373
Siemens SWT-2.3-82 VS/2.3 MW (80 m) Production (MWh)

94
H.3 Projected Average Energy Production by Turbine Power Rating
Power Rating ModelAnnual Power
Generation
Avg. Annual Power
GenerationVariance (±)
E-48/800 kW (60 m) 43,250
E-53/800 kW (60 m) 48,237
900 kW E-44/900 kW (60 m) 34,661 35,000
General Electric 1.5xle (80 m) 62,038
General Electric 1.5sle (80 m) 51,692
1.8 MW VESTAS V90/1.8 MW (80 m) 55,459 55,000
E-82/2.0 MW (80 m) 49,699
GAMESA G80/2 MW (60 m) 37,115
VESTAS V80/2 MW (80 m) 43,469
VESTAS V90/2.0 MW (80 m) 48,520
E-70/2.3 MW (60 m) 33,106
E-82/2.3 MW (80 m) 41,680
Siemens SWT-2.3-82 VS (80 m) 43,373
3.0 MW E-82/3 MW (80 m) 34,368 34,000
Calculated Annual Power Production by Power Rating - 10 MW
1.5 MW
2.3 MW
2.0 MW
800 kW 2500
5,200
6,000
5,000
46,000
57,000
45,000
39,000
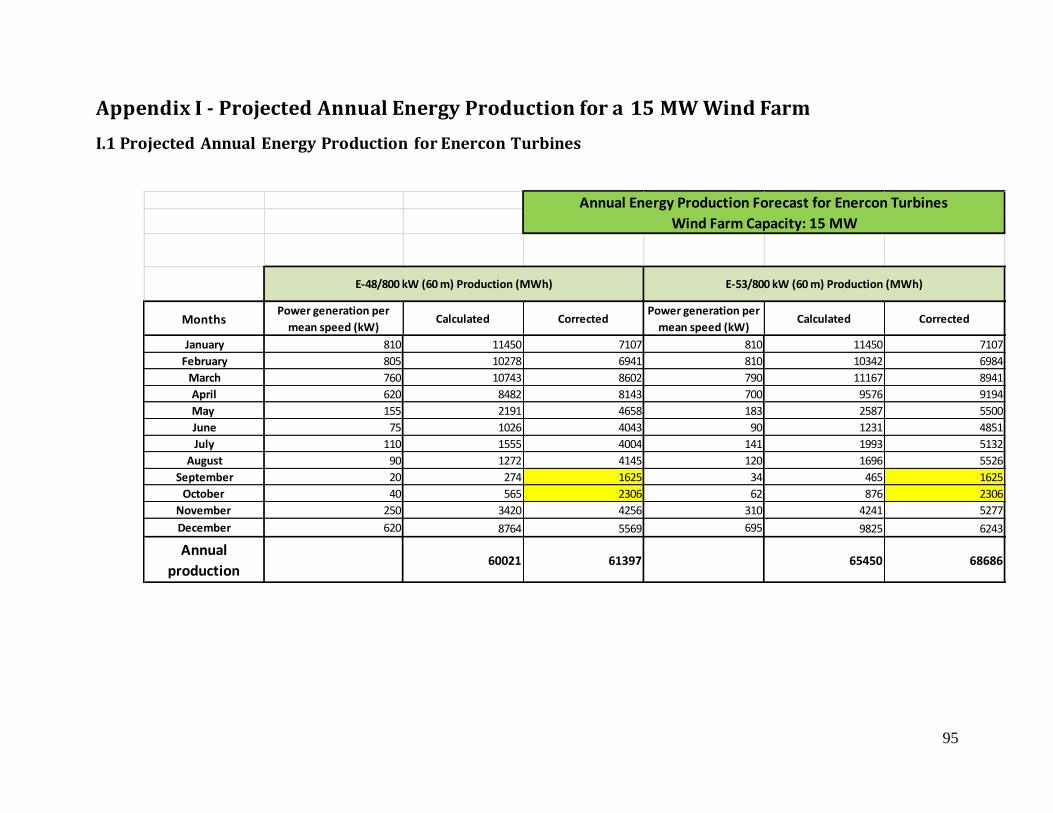
95
Appendix I - Projected Annual Energy Production for a 15 MW Wind Farm
I.1 Projected Annual Energy Production for Enercon Turbines
MonthsPower generation per
mean speed (kW)Calculated Corrected
Power generation per
mean speed (kW)Calculated Corrected
January 810 11450 7107 810 11450 7107
February 805 10278 6941 810 10342 6984
March 760 10743 8602 790 11167 8941
April 620 8482 8143 700 9576 9194
May 155 2191 4658 183 2587 5500
June 75 1026 4043 90 1231 4851
July 110 1555 4004 141 1993 5132
August 90 1272 4145 120 1696 5526
September 20 274 1625 34 465 1625
October 40 565 2306 62 876 2306
November 250 3420 4256 310 4241 5277
December 620 8764 5569 695 9825 6243
Annual
production60021 61397 65450 68686
E-48/800 kW (60 m) Production (MWh) E-53/800 kW (60 m) Production (MWh)
Annual Energy Production Forecast for Enercon Turbines
Wind Farm Capacity: 15 MW

96
MonthsPower generation per
mean speed (kW)Calculated Corrected
Power generation per
mean speed (kW)Calculated Corrected
January 860 10877 6751 2050 12202 7573
February 830 9482 6403 2050 11021 7443
March 730 9233 7393 2050 12202 9769
April 540 6610 6346 1820 10483 10064
May 130 1644 3496 510 3036 6454
June 63 771 3038 255 1469 5788
July 98 1240 3191 470 2797 7203
August 83 1050 3420 321 1911 6224
September 16 196 1625 82 472 1625
October 32 405 2306 140 833 2306
November 215 2632 3275 850 4896 6092
December 520 6577 4179 1750 10416 6618
Annual
production50716 51423 71737 77159
E-44/900 kW (60 m) Production (MWh) E-82/2.0 MW (80 m) Production (MWh)
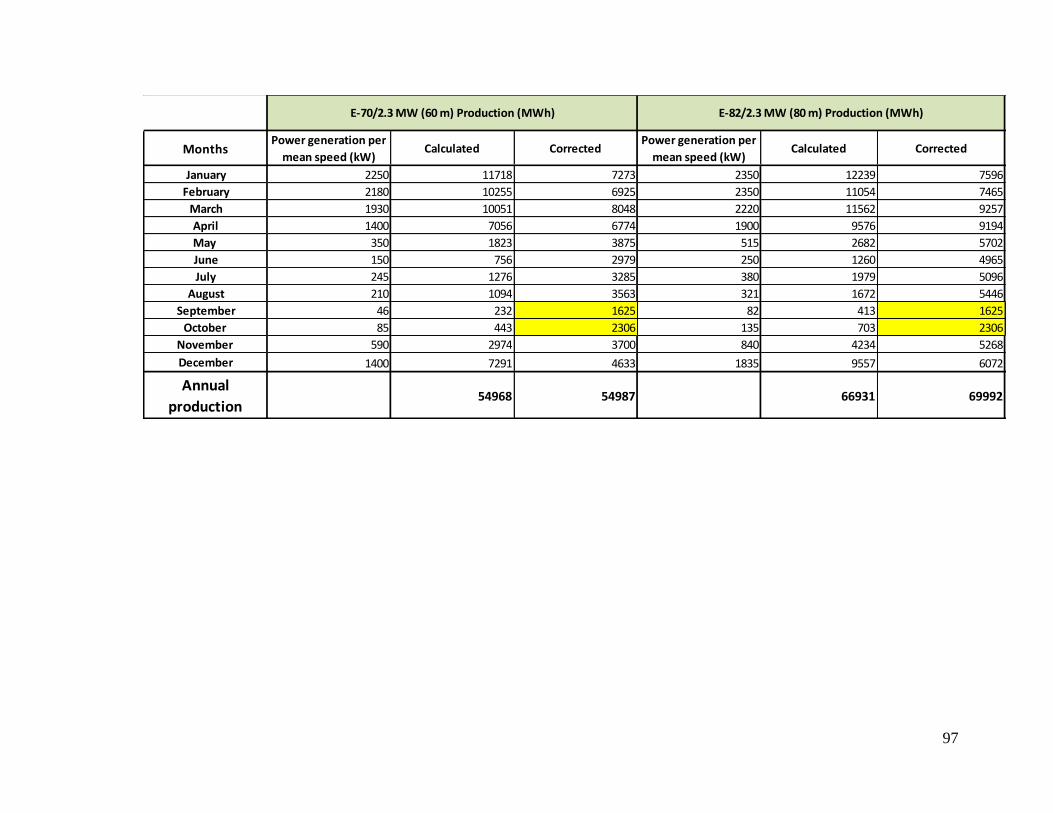
97
MonthsPower generation per
mean speed (kW)Calculated Corrected
Power generation per
mean speed (kW)Calculated Corrected
January 2250 11718 7273 2350 12239 7596
February 2180 10255 6925 2350 11054 7465
March 1930 10051 8048 2220 11562 9257
April 1400 7056 6774 1900 9576 9194
May 350 1823 3875 515 2682 5702
June 150 756 2979 250 1260 4965
July 245 1276 3285 380 1979 5096
August 210 1094 3563 321 1672 5446
September 46 232 1625 82 413 1625
October 85 443 2306 135 703 2306
November 590 2974 3700 840 4234 5268
December 1400 7291 4633 1835 9557 6072
Annual
production54968 54987 66931 69992
E-82/2.3 MW (80 m) Production (MWh)E-70/2.3 MW (60 m) Production (MWh)

98
MonthsPower generation per
mean speed (kW)Calculated Corrected
January 2820 10490 6511
February 2750 9240 6240
March 2400 8928 7148
April 2050 7380 7085
May 522 1942 4128
June 250 900 3546
July 410 1525 3927
August 321 1194 3890
September 82 295 1625
October 140 521 2306
November 850 3060 3808
December 1880 6994 4444
Annual
production52469 54659
E-82/3 MW (80 m) Production (MWh)

99
I.2 Projected Annual Energy Production for Other Turbines
MonthsPower generation per
mean speed (kW)Calculated Corrected
Power generation per
mean speed (kW)Calculated Corrected
January 2000 11904 7388 1500 11160 6927
February 1900 10214 6898 1500 10080 6807
March 1800 10714 8578 1500 11160 8935
April 1300 7488 7189 1500 10800 10369
May 300 1786 3796 550 4092 8700
June 150 864 3404 300 2160 8511
July 250 1488 3831 430 3199 8237
August 220 1309 4266 400 2976 9695
September 0 0 1625 150 1080 1625
October 50 298 2306 210 1562 2306
November 500 2880 3584 890 6408 7974
December 1100 6547 4160 1450 10788 6855
Annual
Production55492 57026 75466 86940
Annual Energy Production Forecast for Other Turbines
Wind Farm Capacity: 15 MW
General Electric 1.5xle/1.5 MW (80 m) Production (MWh)GAMESA G80/2 MW (60 m) Production (MWh)
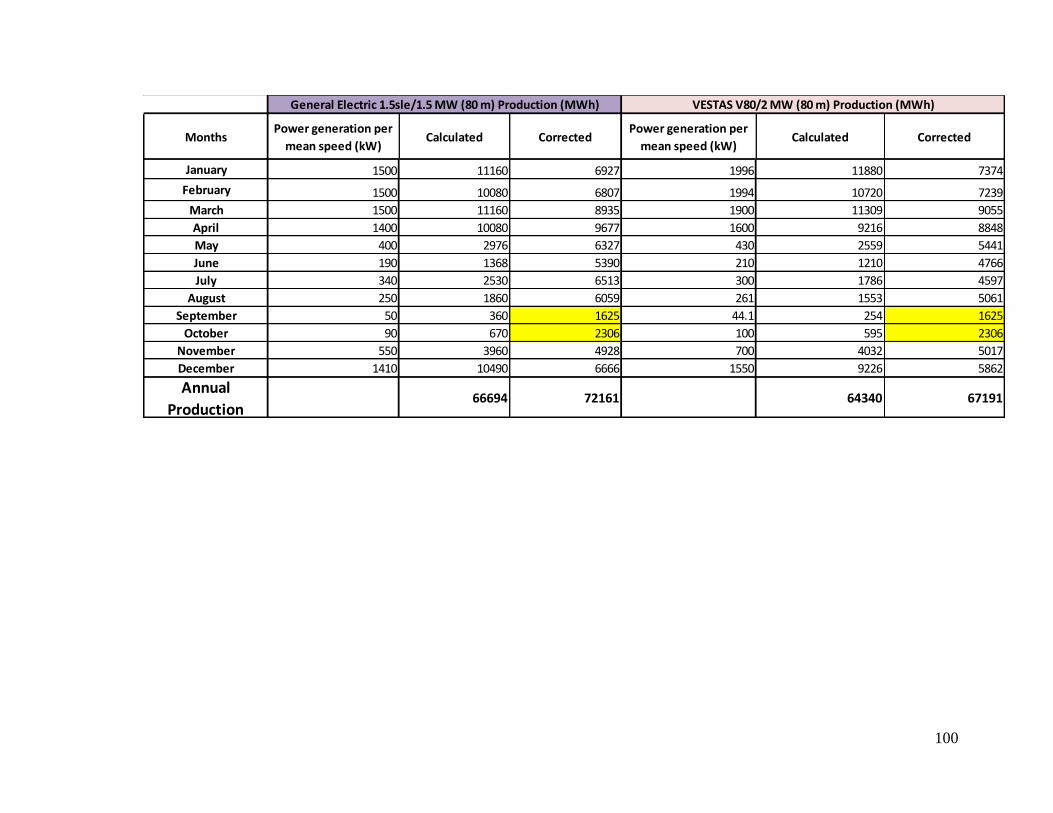
100
MonthsPower generation per
mean speed (kW)Calculated Corrected
Power generation per
mean speed (kW)Calculated Corrected
January 1500 11160 6927 1996 11880 7374
February 1500 10080 6807 1994 10720 7239
March 1500 11160 8935 1900 11309 9055
April 1400 10080 9677 1600 9216 8848
May 400 2976 6327 430 2559 5441
June 190 1368 5390 210 1210 4766
July 340 2530 6513 300 1786 4597
August 250 1860 6059 261 1553 5061
September 50 360 1625 44.1 254 1625
October 90 670 2306 100 595 2306
November 550 3960 4928 700 4032 5017
December 1410 10490 6666 1550 9226 5862
Annual
Production66694 72161 64340 67191
General Electric 1.5sle/1.5 MW (80 m) Production (MWh) VESTAS V80/2 MW (80 m) Production (MWh)
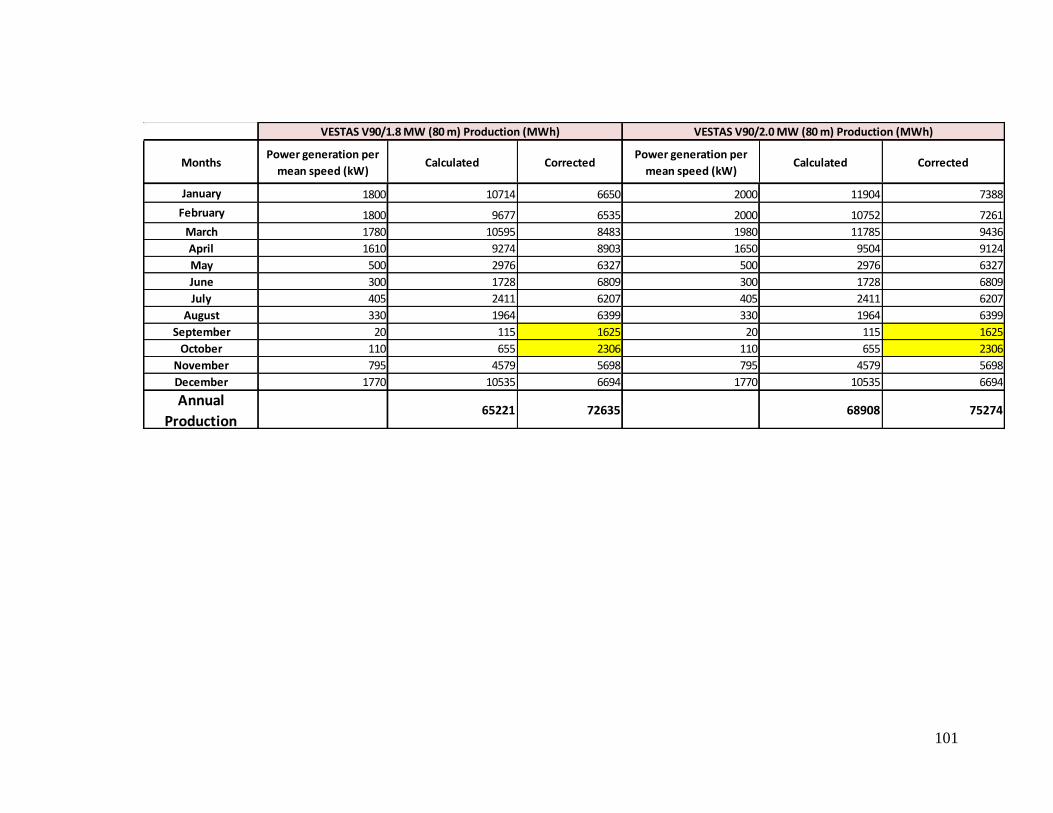
101
MonthsPower generation per
mean speed (kW)Calculated Corrected
Power generation per
mean speed (kW)Calculated Corrected
January 1800 10714 6650 2000 11904 7388
February 1800 9677 6535 2000 10752 7261
March 1780 10595 8483 1980 11785 9436
April 1610 9274 8903 1650 9504 9124
May 500 2976 6327 500 2976 6327
June 300 1728 6809 300 1728 6809
July 405 2411 6207 405 2411 6207
August 330 1964 6399 330 1964 6399
September 20 115 1625 20 115 1625
October 110 655 2306 110 655 2306
November 795 4579 5698 795 4579 5698
December 1770 10535 6694 1770 10535 6694
Annual
Production65221 72635 68908 75274
VESTAS V90/1.8 MW (80 m) Production (MWh) VESTAS V90/2.0 MW (80 m) Production (MWh)
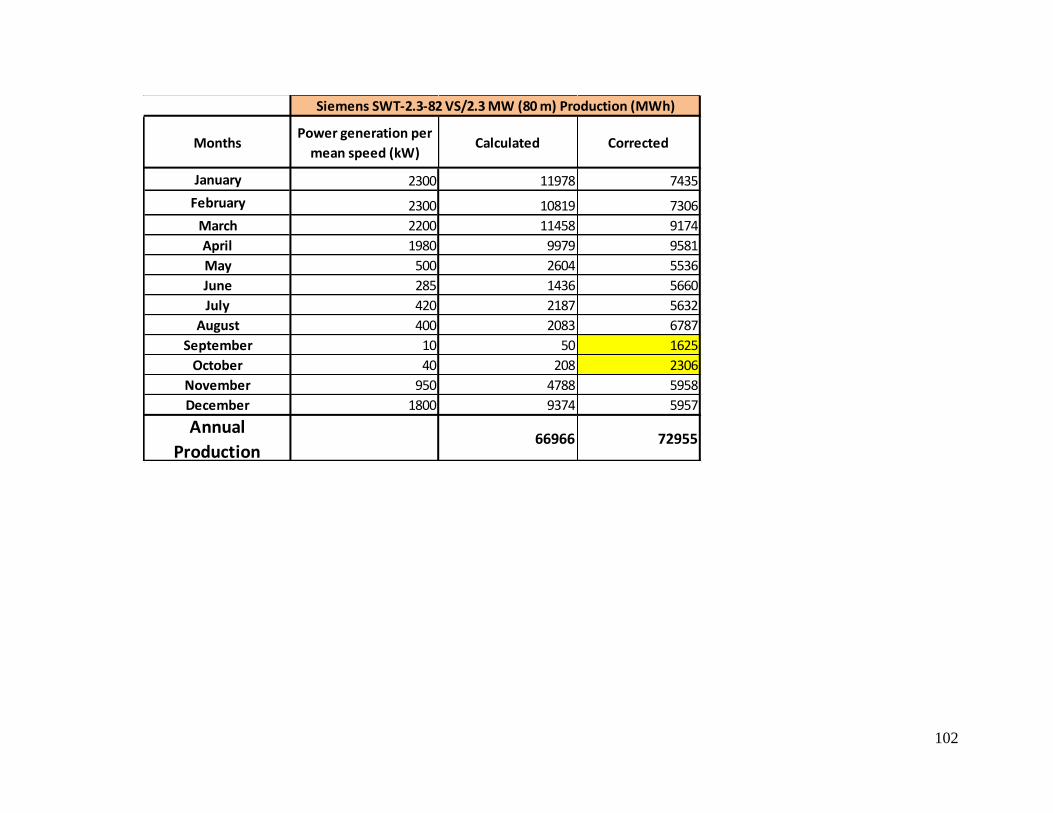
102
MonthsPower generation per
mean speed (kW)Calculated Corrected
January 2300 11978 7435
February 2300 10819 7306
March 2200 11458 9174
April 1980 9979 9581
May 500 2604 5536
June 285 1436 5660
July 420 2187 5632
August 400 2083 6787
September 10 50 1625
October 40 208 2306
November 950 4788 5958
December 1800 9374 5957
Annual
Production66966 72955
Siemens SWT-2.3-82 VS/2.3 MW (80 m) Production (MWh)
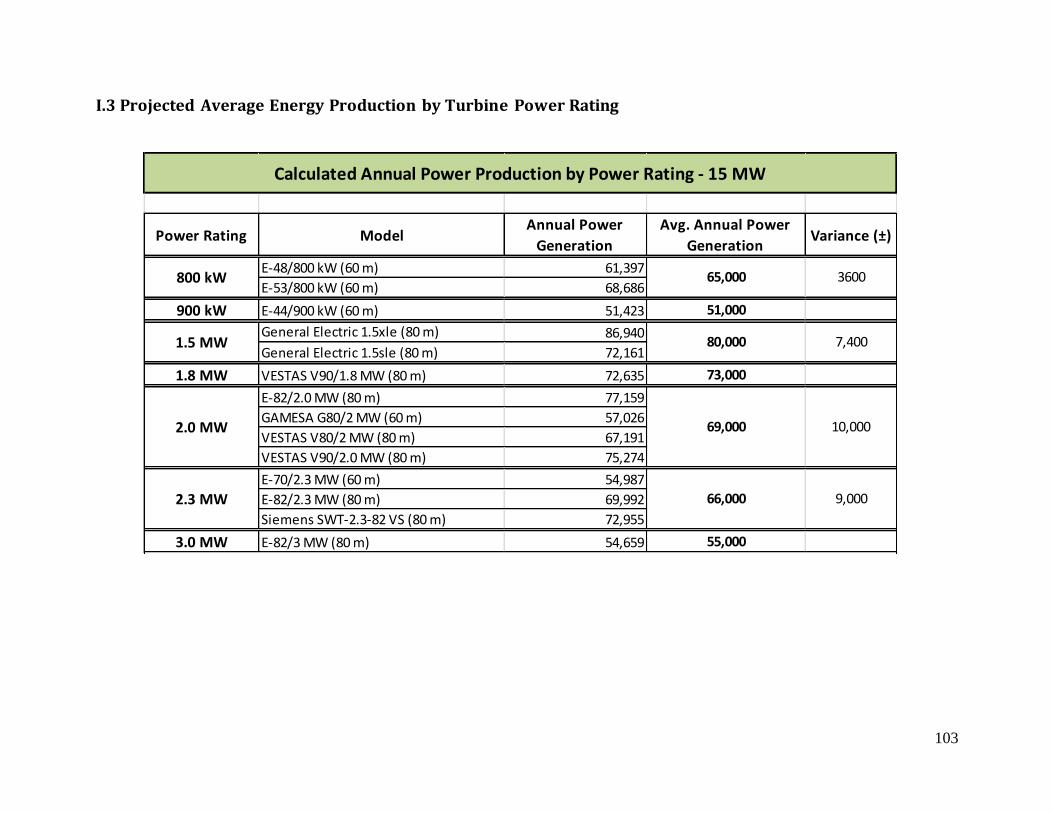
103
I.3 Projected Average Energy Production by Turbine Power Rating
Power Rating ModelAnnual Power
Generation
Avg. Annual Power
GenerationVariance (±)
E-48/800 kW (60 m) 61,397
E-53/800 kW (60 m) 68,686
900 kW E-44/900 kW (60 m) 51,423 51,000
General Electric 1.5xle (80 m) 86,940
General Electric 1.5sle (80 m) 72,161
1.8 MW VESTAS V90/1.8 MW (80 m) 72,635 73,000
E-82/2.0 MW (80 m) 77,159
GAMESA G80/2 MW (60 m) 57,026
VESTAS V80/2 MW (80 m) 67,191
VESTAS V90/2.0 MW (80 m) 75,274
E-70/2.3 MW (60 m) 54,987
E-82/2.3 MW (80 m) 69,992
Siemens SWT-2.3-82 VS (80 m) 72,955
3.0 MW E-82/3 MW (80 m) 54,659 55,000
Calculated Annual Power Production by Power Rating - 15 MW
1.5 MW
2.3 MW
2.0 MW
800 kW 3600
7,400
10,000
9,000
65,000
80,000
69,000
66,000
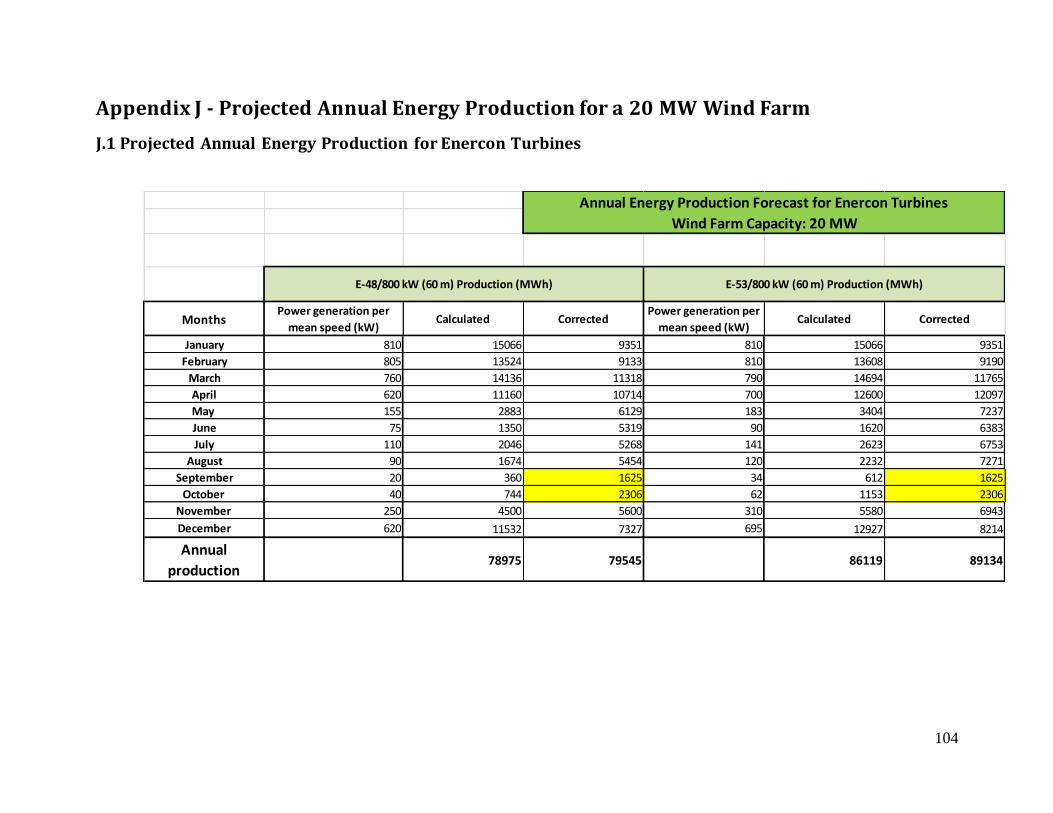
104
Appendix J - Projected Annual Energy Production for a 20 MW Wind Farm
J.1 Projected Annual Energy Production for Enercon Turbines
MonthsPower generation per
mean speed (kW)Calculated Corrected
Power generation per
mean speed (kW)Calculated Corrected
January 810 15066 9351 810 15066 9351
February 805 13524 9133 810 13608 9190
March 760 14136 11318 790 14694 11765
April 620 11160 10714 700 12600 12097
May 155 2883 6129 183 3404 7237
June 75 1350 5319 90 1620 6383
July 110 2046 5268 141 2623 6753
August 90 1674 5454 120 2232 7271
September 20 360 1625 34 612 1625
October 40 744 2306 62 1153 2306
November 250 4500 5600 310 5580 6943
December 620 11532 7327 695 12927 8214
Annual
production78975 79545 86119 89134
E-48/800 kW (60 m) Production (MWh) E-53/800 kW (60 m) Production (MWh)
Annual Energy Production Forecast for Enercon Turbines
Wind Farm Capacity: 20 MW
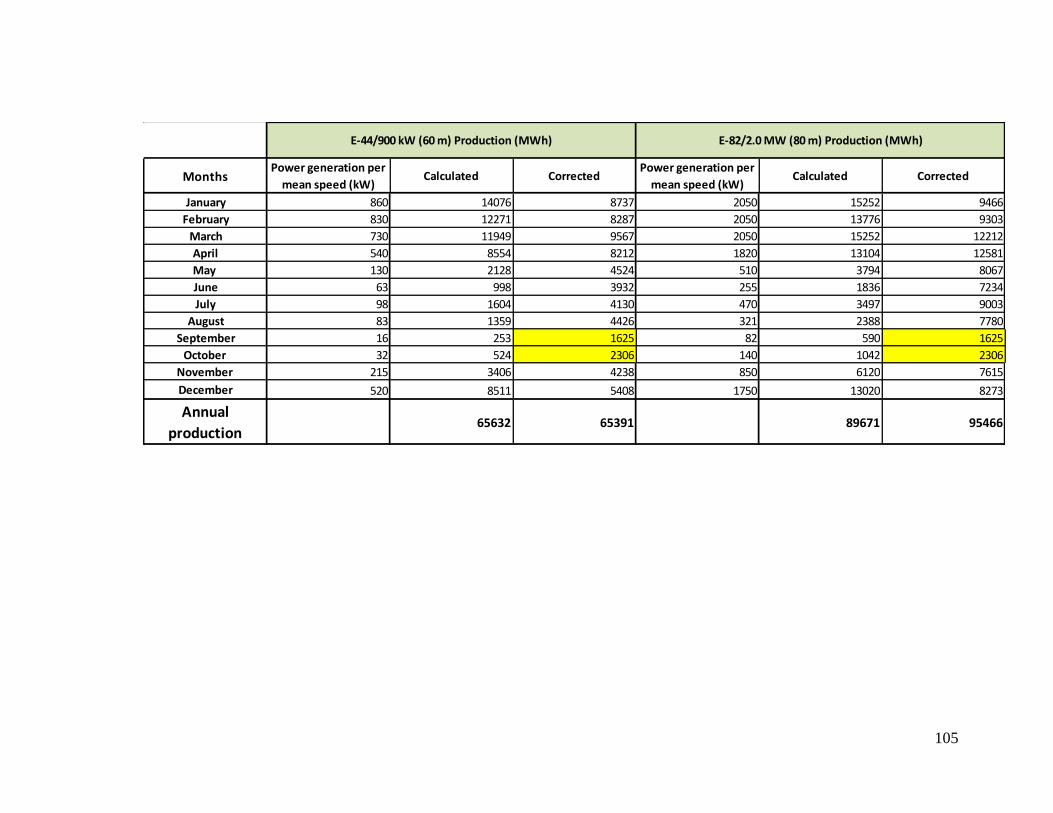
105
MonthsPower generation per
mean speed (kW)Calculated Corrected
Power generation per
mean speed (kW)Calculated Corrected
January 860 14076 8737 2050 15252 9466
February 830 12271 8287 2050 13776 9303
March 730 11949 9567 2050 15252 12212
April 540 8554 8212 1820 13104 12581
May 130 2128 4524 510 3794 8067
June 63 998 3932 255 1836 7234
July 98 1604 4130 470 3497 9003
August 83 1359 4426 321 2388 7780
September 16 253 1625 82 590 1625
October 32 524 2306 140 1042 2306
November 215 3406 4238 850 6120 7615
December 520 8511 5408 1750 13020 8273
Annual
production65632 65391 89671 95466
E-44/900 kW (60 m) Production (MWh) E-82/2.0 MW (80 m) Production (MWh)
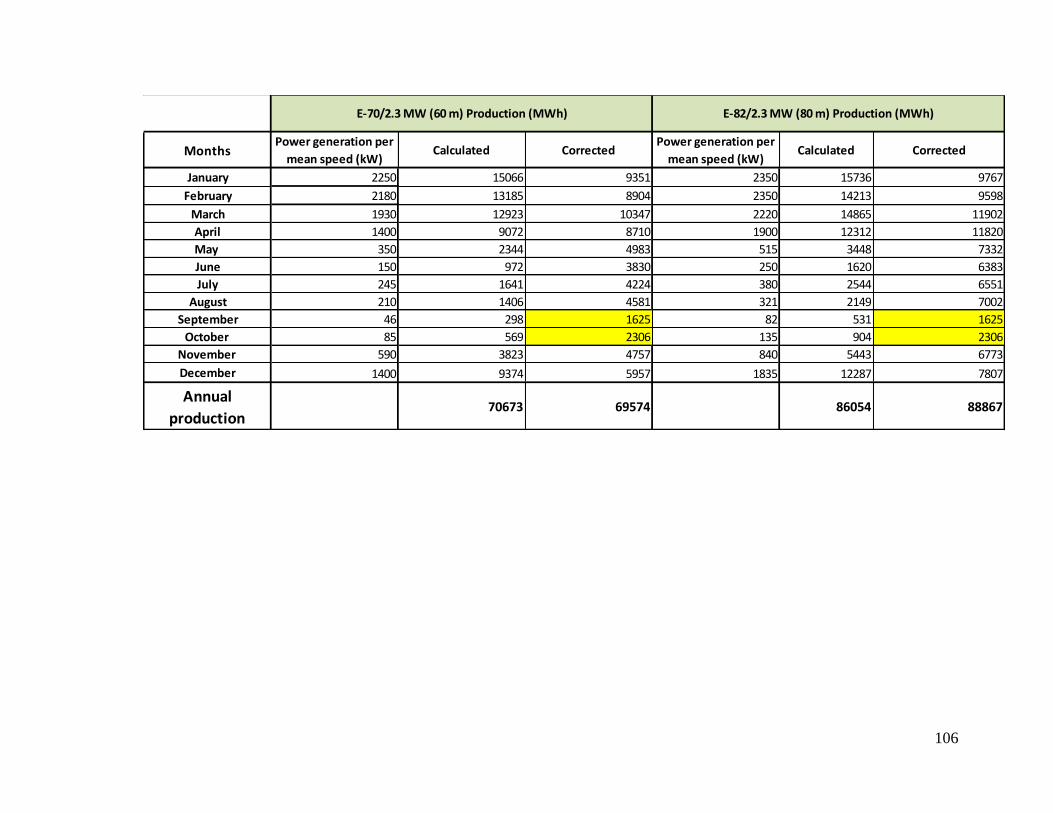
106
MonthsPower generation per
mean speed (kW)Calculated Corrected
Power generation per
mean speed (kW)Calculated Corrected
January 2250 15066 9351 2350 15736 9767
February 2180 13185 8904 2350 14213 9598
March 1930 12923 10347 2220 14865 11902
April 1400 9072 8710 1900 12312 11820
May 350 2344 4983 515 3448 7332
June 150 972 3830 250 1620 6383
July 245 1641 4224 380 2544 6551
August 210 1406 4581 321 2149 7002
September 46 298 1625 82 531 1625
October 85 569 2306 135 904 2306
November 590 3823 4757 840 5443 6773
December 1400 9374 5957 1835 12287 7807
Annual
production70673 69574 86054 88867
E-82/2.3 MW (80 m) Production (MWh)E-70/2.3 MW (60 m) Production (MWh)
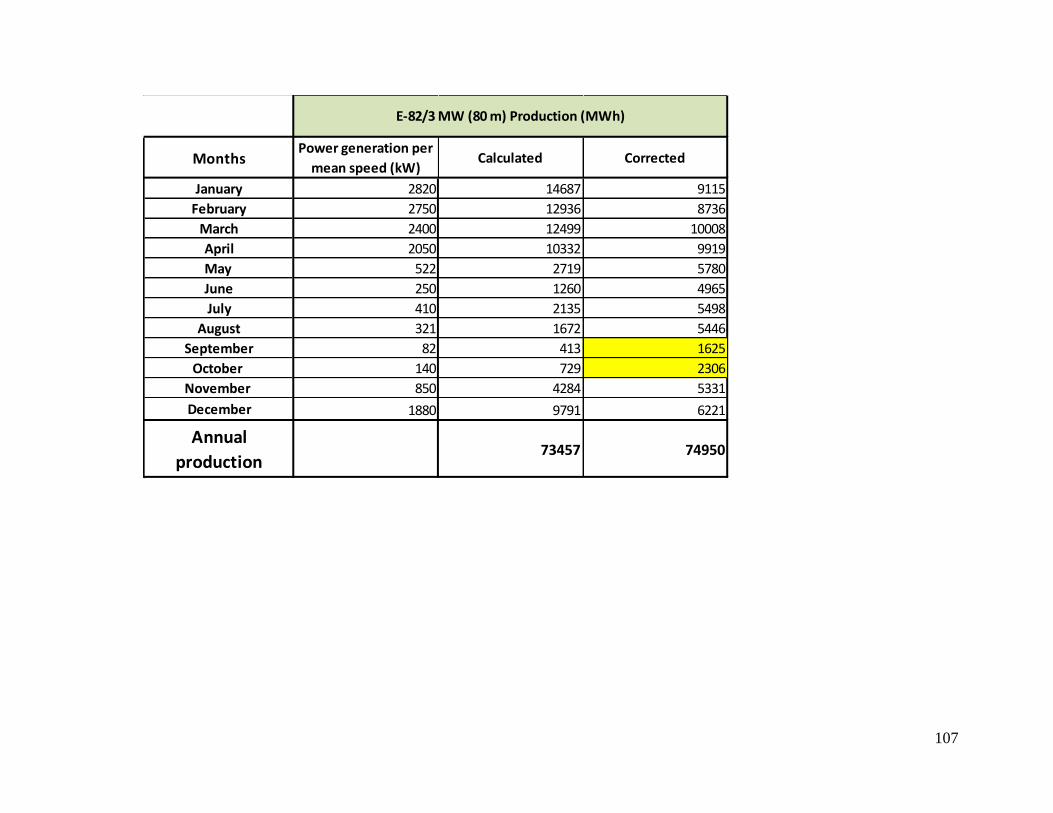
107
MonthsPower generation per
mean speed (kW)Calculated Corrected
January 2820 14687 9115
February 2750 12936 8736
March 2400 12499 10008
April 2050 10332 9919
May 522 2719 5780
June 250 1260 4965
July 410 2135 5498
August 321 1672 5446
September 82 413 1625
October 140 729 2306
November 850 4284 5331
December 1880 9791 6221
Annual
production73457 74950
E-82/3 MW (80 m) Production (MWh)
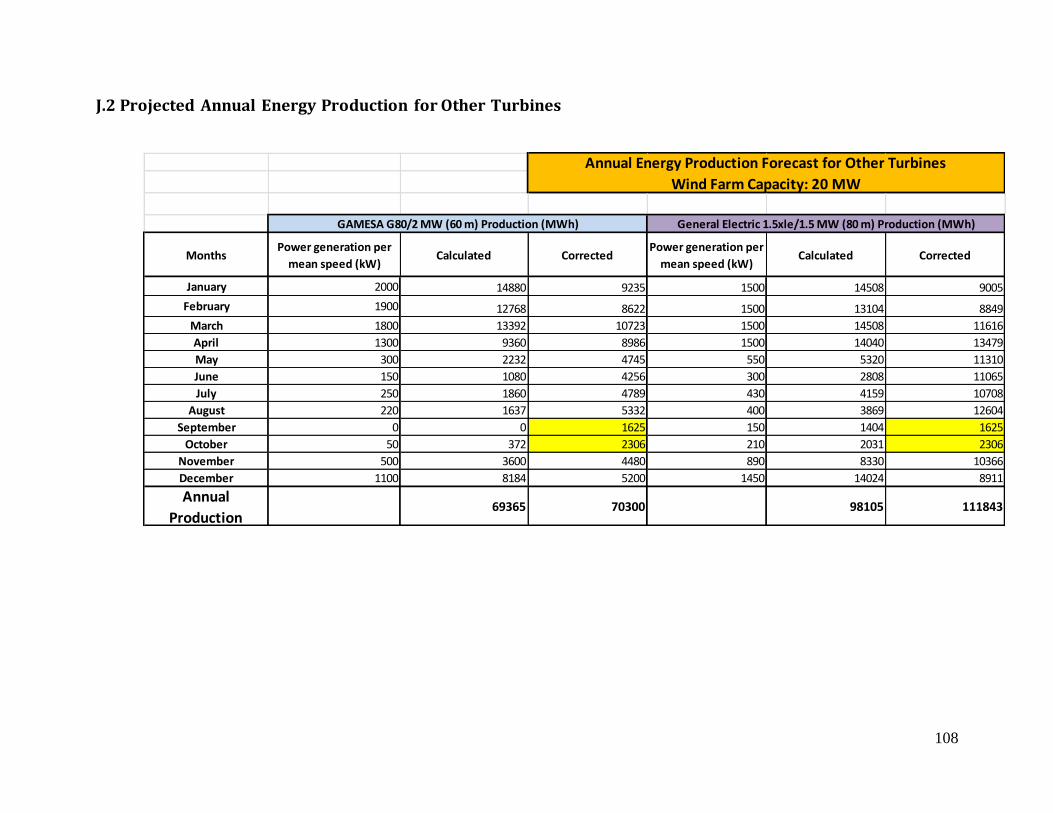
108
J.2 Projected Annual Energy Production for Other Turbines
MonthsPower generation per
mean speed (kW)Calculated Corrected
Power generation per
mean speed (kW)Calculated Corrected
January 2000 14880 9235 1500 14508 9005
February 1900 12768 8622 1500 13104 8849
March 1800 13392 10723 1500 14508 11616
April 1300 9360 8986 1500 14040 13479
May 300 2232 4745 550 5320 11310
June 150 1080 4256 300 2808 11065
July 250 1860 4789 430 4159 10708
August 220 1637 5332 400 3869 12604
September 0 0 1625 150 1404 1625
October 50 372 2306 210 2031 2306
November 500 3600 4480 890 8330 10366
December 1100 8184 5200 1450 14024 8911
Annual
Production69365 70300 98105 111843
GAMESA G80/2 MW (60 m) Production (MWh) General Electric 1.5xle/1.5 MW (80 m) Production (MWh)
Annual Energy Production Forecast for Other Turbines
Wind Farm Capacity: 20 MW

109
MonthsPower generation per
mean speed (kW)Calculated Corrected
Power generation per
mean speed (kW)Calculated Corrected
January 1500 14508 9005 1996 14850 9217
February 1500 13104 8849 1994 13400 9049
March 1500 14508 11616 1900 14136 11318
April 1400 13104 12581 1600 11520 11060
May 400 3869 8225 430 3199 6802
June 190 1778 7008 210 1512 5958
July 340 3288 8467 300 2232 5747
August 250 2418 7877 261 1942 6326
September 50 468 1625 44.1 318 1625
October 90 870 2306 100 744 2306
November 550 5148 6406 700 5040 6271
December 1410 13638 8665 1550 11532 7327
Annual
Production86702 92630 80424 83006
VESTAS V80/2 MW (80 m) Production (MWh)General Electric 1.5sle/1.5 MW (80 m) Production (MWh)

110
MonthsPower generation per
mean speed (kW)Calculated Corrected
Power generation per
mean speed (kW)Calculated Corrected
January 1800 14731 9143 2000 14880 9235
February 1800 13306 8986 2000 13440 9076
March 1780 14568 11664 1980 14731 11795
April 1610 12751 12242 1650 11880 11405
May 500 4092 8700 500 3720 7909
June 300 2376 9362 300 2160 8511
July 405 3315 8534 405 3013 7758
August 330 2701 8798 330 2455 7998
September 20 158 1625 20 144 1625
October 110 900 2306 110 818 2306
November 795 6296 7835 795 5724 7123
December 1770 14486 9204 1770 13169 8367
Annual
Production89679 98399 86135 93110
VESTAS V90/1.8 MW (80 m) Production (MWh) VESTAS V90/2.0 MW (80 m) Production (MWh)
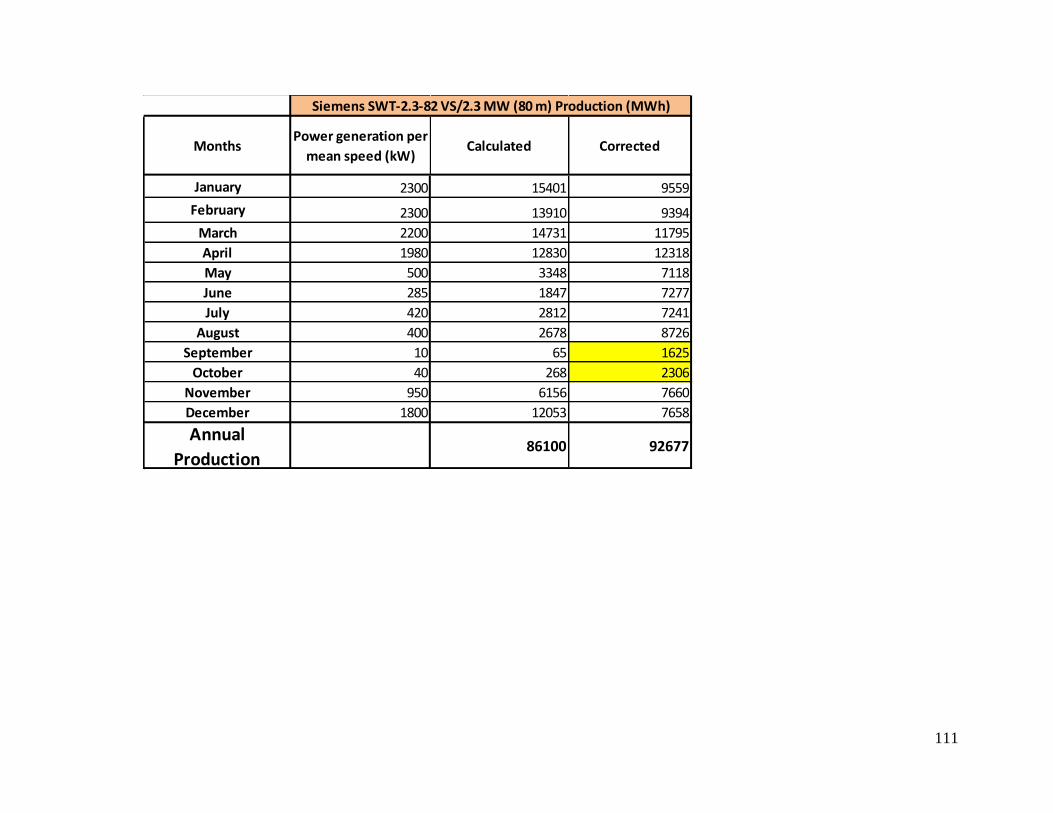
111
MonthsPower generation per
mean speed (kW)Calculated Corrected
January 2300 15401 9559
February 2300 13910 9394
March 2200 14731 11795
April 1980 12830 12318
May 500 3348 7118
June 285 1847 7277
July 420 2812 7241
August 400 2678 8726
September 10 65 1625
October 40 268 2306
November 950 6156 7660
December 1800 12053 7658
Annual
Production86100 92677
Siemens SWT-2.3-82 VS/2.3 MW (80 m) Production (MWh)
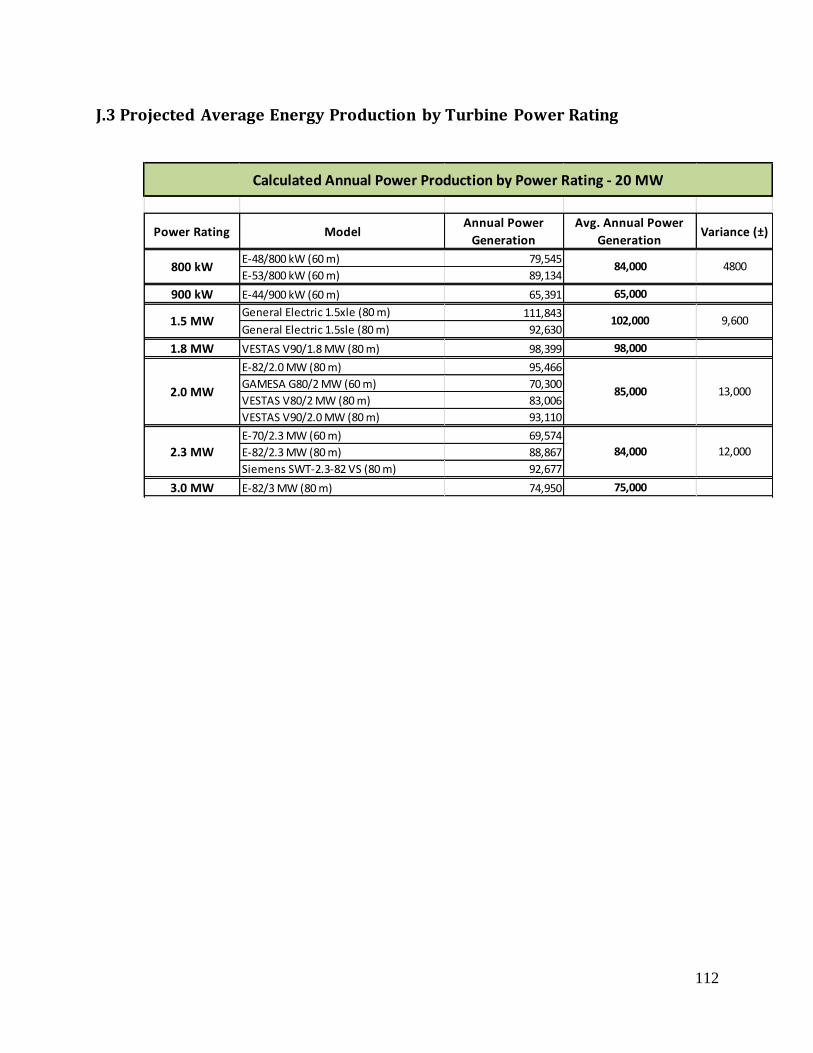
112
J.3 Projected Average Energy Production by Turbine Power Rating
Power Rating ModelAnnual Power
Generation
Avg. Annual Power
GenerationVariance (±)
E-48/800 kW (60 m) 79,545
E-53/800 kW (60 m) 89,134
900 kW E-44/900 kW (60 m) 65,391 65,000
General Electric 1.5xle (80 m) 111,843
General Electric 1.5sle (80 m) 92,630
1.8 MW VESTAS V90/1.8 MW (80 m) 98,399 98,000
E-82/2.0 MW (80 m) 95,466
GAMESA G80/2 MW (60 m) 70,300
VESTAS V80/2 MW (80 m) 83,006
VESTAS V90/2.0 MW (80 m) 93,110
E-70/2.3 MW (60 m) 69,574
E-82/2.3 MW (80 m) 88,867
Siemens SWT-2.3-82 VS (80 m) 92,677
3.0 MW E-82/3 MW (80 m) 74,950 75,000
Calculated Annual Power Production by Power Rating - 20 MW
12,000
84,000
102,000
85,000
84,000
1.5 MW
2.3 MW
2.0 MW
800 kW 4800
9,600
13,000
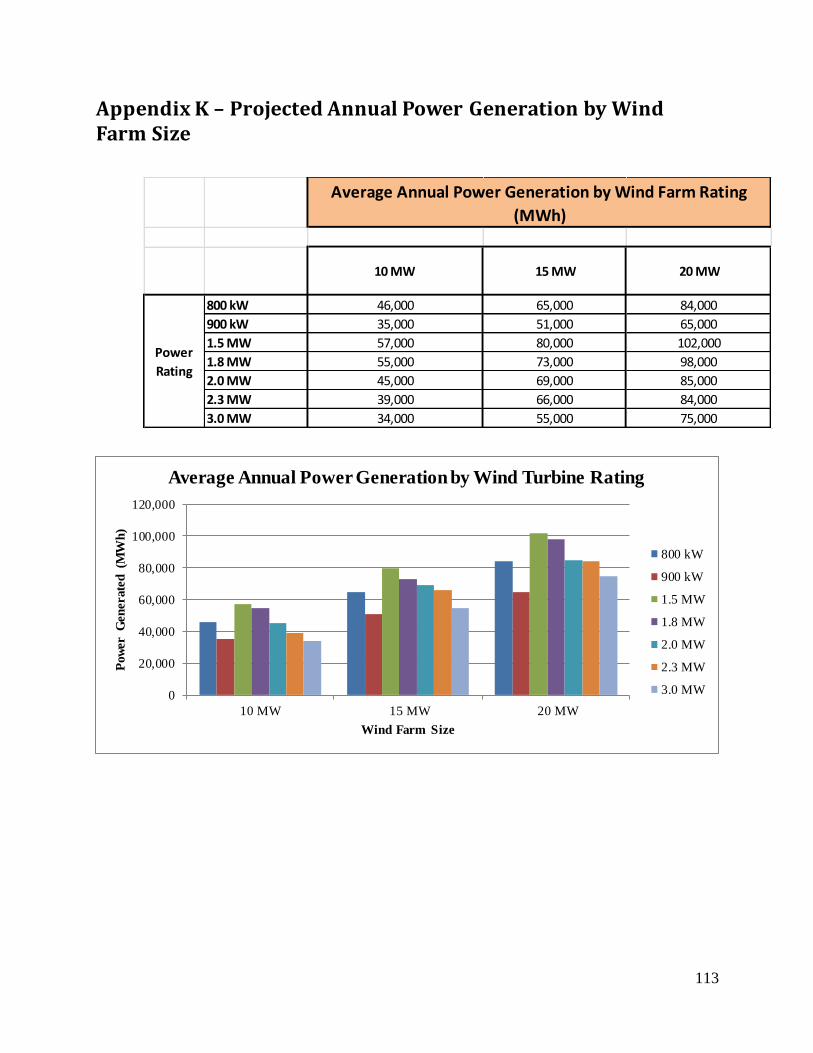
113
Appendix K – Projected Annual Power Generation by Wind Farm Size
10 MW 15 MW 20 MW
800 kW 46,000 65,000 84,000
900 kW 35,000 51,000 65,000
1.5 MW 57,000 80,000 102,000
1.8 MW 55,000 73,000 98,000
2.0 MW 45,000 69,000 85,000
2.3 MW 39,000 66,000 84,000
3.0 MW 34,000 55,000 75,000
Average Annual Power Generation by Wind Farm Rating
(MWh)
Power
Rating
0
20,000
40,000
60,000
80,000
100,000
120,000
10 MW 15 MW 20 MW
Pow
er G
en
erate
d
(MW
h)
Wind Farm Size
Average Annual Power Generation by Wind Turbine Rating
800 kW
900 kW
1.5 MW
1.8 MW
2.0 MW
2.3 MW
3.0 MW
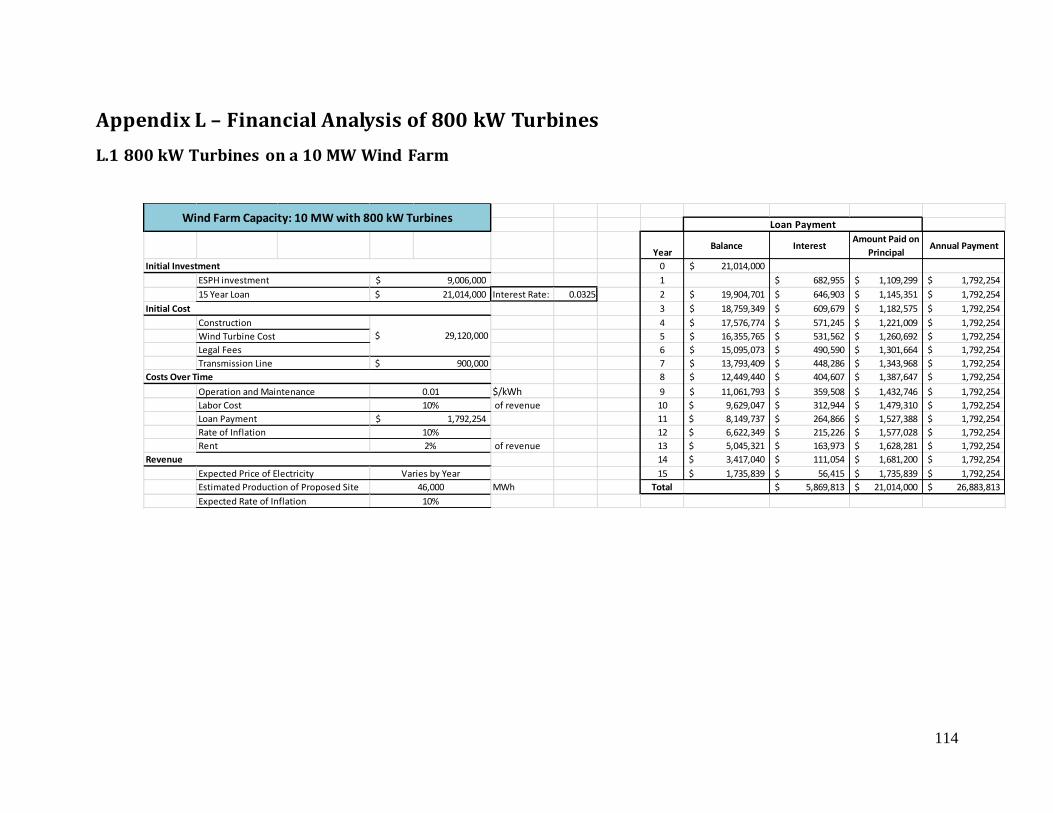
114
Appendix L – Financial Analysis of 800 kW Turbines
L.1 800 kW Turbines on a 10 MW Wind Farm
YearBalance Interest
Amount Paid on
PrincipalAnnual Payment
0 21,014,000$
1 682,955$ 1,109,299$ 1,792,254$
Interest Rate: 0.0325 2 19,904,701$ 646,903$ 1,145,351$ 1,792,254$
3 18,759,349$ 609,679$ 1,182,575$ 1,792,254$
4 17,576,774$ 571,245$ 1,221,009$ 1,792,254$
5 16,355,765$ 531,562$ 1,260,692$ 1,792,254$
6 15,095,073$ 490,590$ 1,301,664$ 1,792,254$
7 13,793,409$ 448,286$ 1,343,968$ 1,792,254$
8 12,449,440$ 404,607$ 1,387,647$ 1,792,254$
$/kWh 9 11,061,793$ 359,508$ 1,432,746$ 1,792,254$
of revenue 10 9,629,047$ 312,944$ 1,479,310$ 1,792,254$
11 8,149,737$ 264,866$ 1,527,388$ 1,792,254$
12 6,622,349$ 215,226$ 1,577,028$ 1,792,254$
of revenue 13 5,045,321$ 163,973$ 1,628,281$ 1,792,254$
14 3,417,040$ 111,054$ 1,681,200$ 1,792,254$
15 1,735,839$ 56,415$ 1,735,839$ 1,792,254$
MWh Total 5,869,813$ 21,014,000$ 26,883,813$ Estimated Production of Proposed Site 46,000
Expected Rate of Inflation 10%
Wind Farm Capacity: 10 MW with 800 kW Turbines
Rate of Inflation 10%
Rent 2%
Revenue
Expected Price of Electricity Varies by Year
Costs Over Time
Operation and Maintenance 0.01
Labor Cost 10%
Loan Payment 1,792,254$
Initial Cost
Construction
$ 29,120,000 Wind Turbine Cost
Legal Fees
Transmission Line $ 900,000
Loan Payment
Initial Investment
ESPH investment 9,006,000$
15 Year Loan 21,014,000$

115
Year 1 2 3 4 5 6 7 8 9
46,000 46,000 46,000 46,000 46,000 46,000 46,000 46,000 46,000
Revenue
Price of Electricity (per kWh) 0.100 0.103 0.105 0.108 0.110 0.113 0.116 0.119 0.122
4,600,000 4,715,000 4,832,875 4,953,697 5,077,539 5,204,478 5,334,590 5,467,954 5,604,653
Costs
O&M 460,000 460,000 460,000 460,000 460,000 460,000 460,000 460,000 460,000
Labor 460,000 471,500 483,288 495,370 507,754 520,448 533,459 546,795 560,465
Loan Payment 1,792,254 1,792,254 1,792,254 1,792,254 1,792,254 1,792,254 1,792,254 1,792,254 1,792,254
Rent 92,000 94,300 96,658 99,074 101,551 104,090 106,692 109,359 112,093
2,804,254 2,818,054 2,832,199 2,846,698 2,861,559 2,876,792 2,892,405 2,908,409 2,924,813
1,795,746 1,896,946 2,000,676 2,106,999 2,215,980 2,327,686 2,442,185 2,559,546 2,679,841
1,632,496 1,567,724 1,503,137 1,439,109 1,375,949 1,313,918 1,253,227 1,194,047 1,136,514
9,006,000$ 7,373,504$ 5,805,780$ 4,302,643$ 2,863,534$ 1,487,585$ 173,666$
Total Cashflow
Discounted Cashflow
ESPH Initial Investment
Payback
Wind Farm Capacity: 10 MW with 800 kW Turbines
Cost Analysis and Payback Period
Production (MWh)
Total Revenue
Total Cost
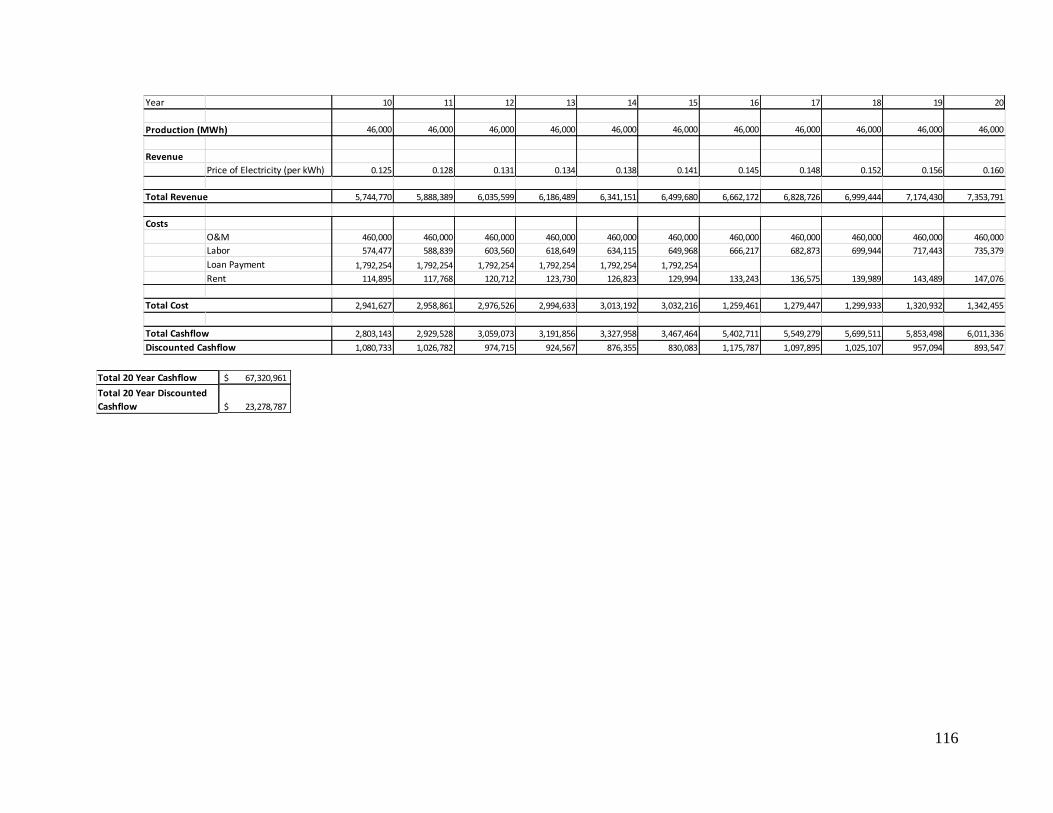
116
67,320,961$
23,278,787$
Total 20 Year Cashflow
Total 20 Year Discounted
Cashflow
Year 10 11 12 13 14 15 16 17 18 19 20
46,000 46,000 46,000 46,000 46,000 46,000 46,000 46,000 46,000 46,000 46,000
Revenue
Price of Electricity (per kWh) 0.125 0.128 0.131 0.134 0.138 0.141 0.145 0.148 0.152 0.156 0.160
5,744,770 5,888,389 6,035,599 6,186,489 6,341,151 6,499,680 6,662,172 6,828,726 6,999,444 7,174,430 7,353,791
Costs
O&M 460,000 460,000 460,000 460,000 460,000 460,000 460,000 460,000 460,000 460,000 460,000
Labor 574,477 588,839 603,560 618,649 634,115 649,968 666,217 682,873 699,944 717,443 735,379
Loan Payment 1,792,254 1,792,254 1,792,254 1,792,254 1,792,254 1,792,254
Rent 114,895 117,768 120,712 123,730 126,823 129,994 133,243 136,575 139,989 143,489 147,076
2,941,627 2,958,861 2,976,526 2,994,633 3,013,192 3,032,216 1,259,461 1,279,447 1,299,933 1,320,932 1,342,455
2,803,143 2,929,528 3,059,073 3,191,856 3,327,958 3,467,464 5,402,711 5,549,279 5,699,511 5,853,498 6,011,336
1,080,733 1,026,782 974,715 924,567 876,355 830,083 1,175,787 1,097,895 1,025,107 957,094 893,547
Production (MWh)
Total Revenue
Total Cost
Total Cashflow
Discounted Cashflow

117
L.2 800 kW Turbines on a 15 MW Wind Farm
YearBalance Interest
Amount Paid on
PrincipalAnnual Payment
0 30,422,000$
1 988,715$ 1,605,934$ 2,594,649$
Interest Rate: 0.0325 2 28,816,066$ 936,522$ 1,658,127$ 2,594,649$
3 27,157,939$ 882,633$ 1,712,016$ 2,594,649$
4 25,445,923$ 826,992$ 1,767,657$ 2,594,649$
5 23,678,266$ 769,544$ 1,825,106$ 2,594,649$
6 21,853,160$ 710,228$ 1,884,421$ 2,594,649$
7 19,968,739$ 648,984$ 1,945,665$ 2,594,649$
8 18,023,074$ 585,750$ 2,008,899$ 2,594,649$
$/kWh 9 16,014,175$ 520,461$ 2,074,188$ 2,594,649$
of revenue 10 13,939,986$ 453,050$ 2,141,600$ 2,594,649$
11 11,798,386$ 383,448$ 2,211,202$ 2,594,649$
12 9,587,185$ 311,584$ 2,283,066$ 2,594,649$
of revenue 13 7,304,119$ 237,384$ 2,357,265$ 2,594,649$
14 4,946,854$ 160,773$ 2,433,876$ 2,594,649$
15 2,512,977$ 81,672$ 2,512,977$ 2,594,649$
MWh Total 8,497,738$ 30,422,000$ 38,919,738$ Estimated Production of Proposed Site 65,000
Expected Rate of Inflation 10%
Rate of Inflation 10%
Rent 2%
Revenue
Expected Price of Electricity Varies by Year
Loan Payment 2,594,649$
Initial Cost
Construction
$ 42,560,000 Wind Turbine Cost
Legal Fees
Transmission Line $ 900,000
Costs Over Time
Operation and Maintenance 0.01
Labor Cost 10%
Loan Payment
Initial Investment
ESPH investment 13,038,000$
15 Year Loan 30,422,000$
Wind Farm Capacity: 15 MW with 800 kW Turbines
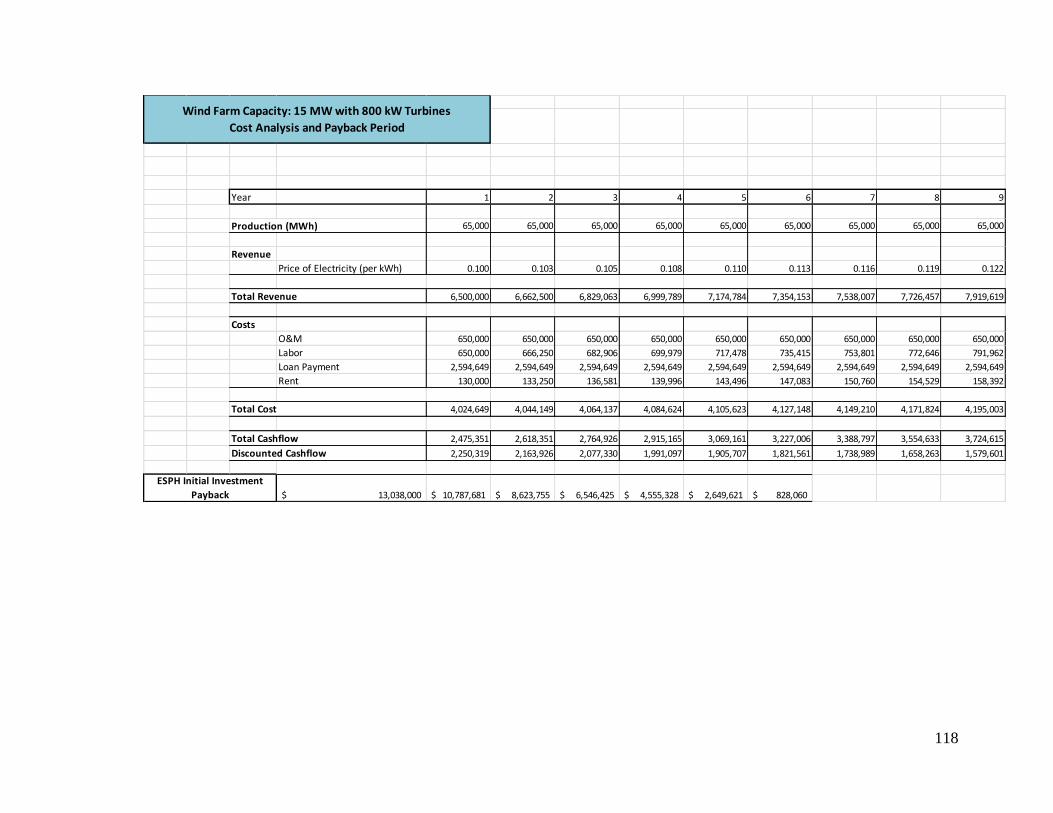
118
Year 1 2 3 4 5 6 7 8 9
65,000 65,000 65,000 65,000 65,000 65,000 65,000 65,000 65,000
Revenue
Price of Electricity (per kWh) 0.100 0.103 0.105 0.108 0.110 0.113 0.116 0.119 0.122
6,500,000 6,662,500 6,829,063 6,999,789 7,174,784 7,354,153 7,538,007 7,726,457 7,919,619
Costs
O&M 650,000 650,000 650,000 650,000 650,000 650,000 650,000 650,000 650,000
Labor 650,000 666,250 682,906 699,979 717,478 735,415 753,801 772,646 791,962
Loan Payment 2,594,649 2,594,649 2,594,649 2,594,649 2,594,649 2,594,649 2,594,649 2,594,649 2,594,649
Rent 130,000 133,250 136,581 139,996 143,496 147,083 150,760 154,529 158,392
4,024,649 4,044,149 4,064,137 4,084,624 4,105,623 4,127,148 4,149,210 4,171,824 4,195,003
2,475,351 2,618,351 2,764,926 2,915,165 3,069,161 3,227,006 3,388,797 3,554,633 3,724,615
2,250,319 2,163,926 2,077,330 1,991,097 1,905,707 1,821,561 1,738,989 1,658,263 1,579,601
13,038,000$ 10,787,681$ 8,623,755$ 6,546,425$ 4,555,328$ 2,649,621$ 828,060$
Discounted Cashflow
ESPH Initial Investment
Payback
Wind Farm Capacity: 15 MW with 800 kW Turbines
Cost Analysis and Payback Period
Total Revenue
Total Cost
Total Cashflow
Production (MWh)
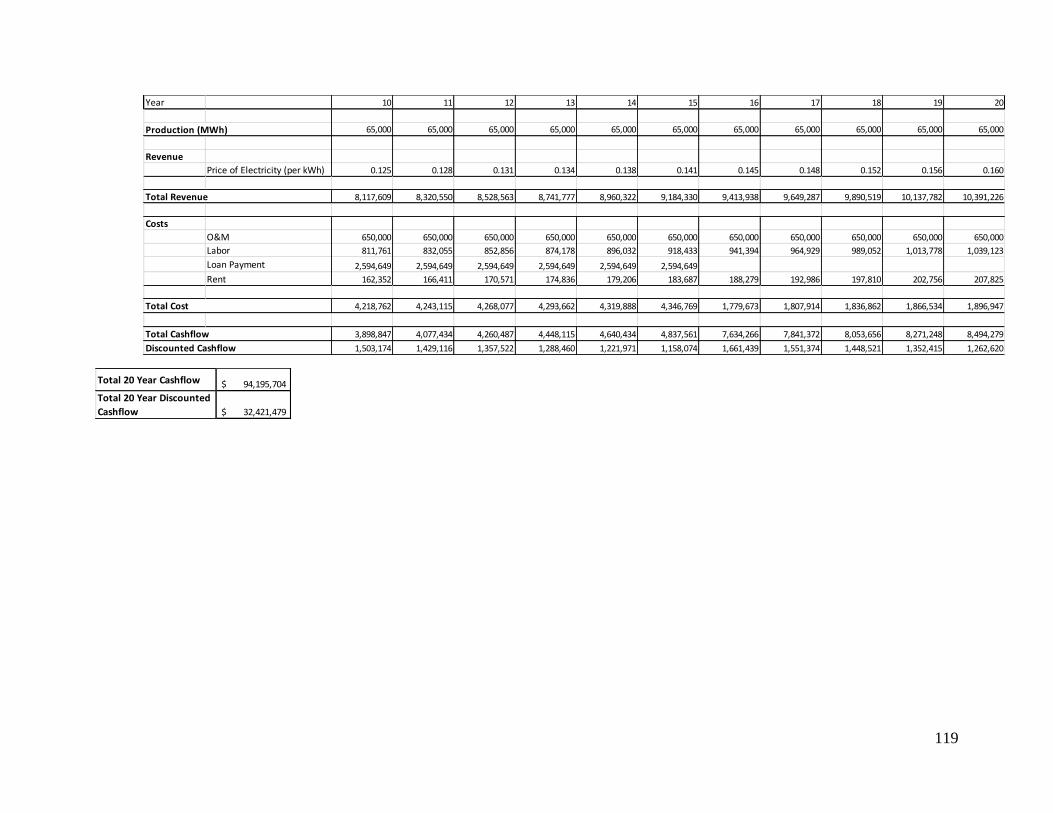
119
94,195,704$
32,421,479$
Total 20 Year Cashflow
Total 20 Year Discounted
Cashflow
Year 10 11 12 13 14 15 16 17 18 19 20
65,000 65,000 65,000 65,000 65,000 65,000 65,000 65,000 65,000 65,000 65,000
Revenue
Price of Electricity (per kWh) 0.125 0.128 0.131 0.134 0.138 0.141 0.145 0.148 0.152 0.156 0.160
8,117,609 8,320,550 8,528,563 8,741,777 8,960,322 9,184,330 9,413,938 9,649,287 9,890,519 10,137,782 10,391,226
Costs
O&M 650,000 650,000 650,000 650,000 650,000 650,000 650,000 650,000 650,000 650,000 650,000
Labor 811,761 832,055 852,856 874,178 896,032 918,433 941,394 964,929 989,052 1,013,778 1,039,123
Loan Payment 2,594,649 2,594,649 2,594,649 2,594,649 2,594,649 2,594,649
Rent 162,352 166,411 170,571 174,836 179,206 183,687 188,279 192,986 197,810 202,756 207,825
4,218,762 4,243,115 4,268,077 4,293,662 4,319,888 4,346,769 1,779,673 1,807,914 1,836,862 1,866,534 1,896,947
3,898,847 4,077,434 4,260,487 4,448,115 4,640,434 4,837,561 7,634,266 7,841,372 8,053,656 8,271,248 8,494,279
1,503,174 1,429,116 1,357,522 1,288,460 1,221,971 1,158,074 1,661,439 1,551,374 1,448,521 1,352,415 1,262,620
Production (MWh)
Total Revenue
Total Cost
Total Cashflow
Discounted Cashflow

120
L.3 800 kW Turbines on a 20 MW Wind Farm
YearBalance Interest
Amount Paid on
PrincipalAnnual Payment
0 39,830,000$
1 1,294,475$ 2,102,569$ 3,397,044$
Interest Rate: 0.0325 2 37,727,431$ 1,226,142$ 2,170,903$ 3,397,044$
3 35,556,528$ 1,155,587$ 2,241,457$ 3,397,044$
4 33,315,071$ 1,082,740$ 2,314,304$ 3,397,044$
5 31,000,767$ 1,007,525$ 2,389,519$ 3,397,044$
6 28,611,248$ 929,866$ 2,467,179$ 3,397,044$
7 26,144,069$ 849,682$ 2,547,362$ 3,397,044$
8 23,596,707$ 766,893$ 2,630,151$ 3,397,044$
$/kWh 9 20,966,556$ 681,413$ 2,715,631$ 3,397,044$
of revenue 10 18,250,925$ 593,155$ 2,803,889$ 3,397,044$
11 15,447,036$ 502,029$ 2,895,015$ 3,397,044$
12 12,552,021$ 407,941$ 2,989,103$ 3,397,044$
of revenue 13 9,562,917$ 310,795$ 3,086,249$ 3,397,044$
14 6,476,668$ 210,492$ 3,186,552$ 3,397,044$
15 3,290,115$ 106,929$ 3,290,115$ 3,397,044$
MWh Total 11,125,662$ 39,830,000$ 50,955,662$
Wind Farm Capacity: 20 MW with 800 kW Turbines
17,070,000$
39,830,000$
Construction
ESPH investment
15 Year Loan
Legal Fees
Transmission Line
Revenue
Rent
Expected Price of Electricity
Estimated Production of Proposed Site
Expected Rate of Inflation 10%
84,000
Varies by Year
Loan Payment
$ 56,000,000
2%
Initial Investment
Initial Cost
Costs Over Time
Operation and Maintenance
Labor Cost
Loan Payment
Rate of Inflation
0.01
10%
10%
3,397,044$
$ 900,000
Wind Turbine Cost

121
Year 1 2 3 4 5 6 7 8 9
84,000 84,000 84,000 84,000 84,000 84,000 84,000 84,000 84,000
Price of Electricity (per kWh) 0.100 0.103 0.105 0.108 0.110 0.113 0.116 0.119 0.122
8,400,000 8,610,000 8,825,250 9,045,881 9,272,028 9,503,829 9,741,425 9,984,960 10,234,584
Costs
O&M 840,000 840,000 840,000 840,000 840,000 840,000 840,000 840,000 840,000
Labor 840,000 861,000 882,525 904,588 927,203 950,383 974,142 998,496 1,023,458
Loan Payment 3,397,044 3,397,044 3,397,044 3,397,044 3,397,044 3,397,044 3,397,044 3,397,044 3,397,044
Rent 168,000 172,200 176,505 180,918 185,441 190,077 194,828 199,699 204,692
5,245,044 5,270,244 5,296,074 5,322,550 5,349,688 5,377,504 5,406,015 5,435,239 5,465,194
3,154,956 3,339,756 3,529,176 3,723,331 3,922,341 4,126,325 4,335,410 4,549,721 4,769,390
2,868,142 2,760,129 2,651,522 2,543,085 2,435,465 2,329,203 2,224,751 2,122,478 2,022,687
17,070,000$ 14,201,858$ 11,441,729$ 8,790,207$ 6,247,122$ 3,811,657$ 1,482,454$
ESPH Initial Investment
Payback
Wind Farm Capacity: 20 MW with 800 kW Turbines
Cost Analysis and Payback Period
Total Cashflow
Discounted Cashflow
Total Revenue
Total Cost
Production (MWh)
Revenue
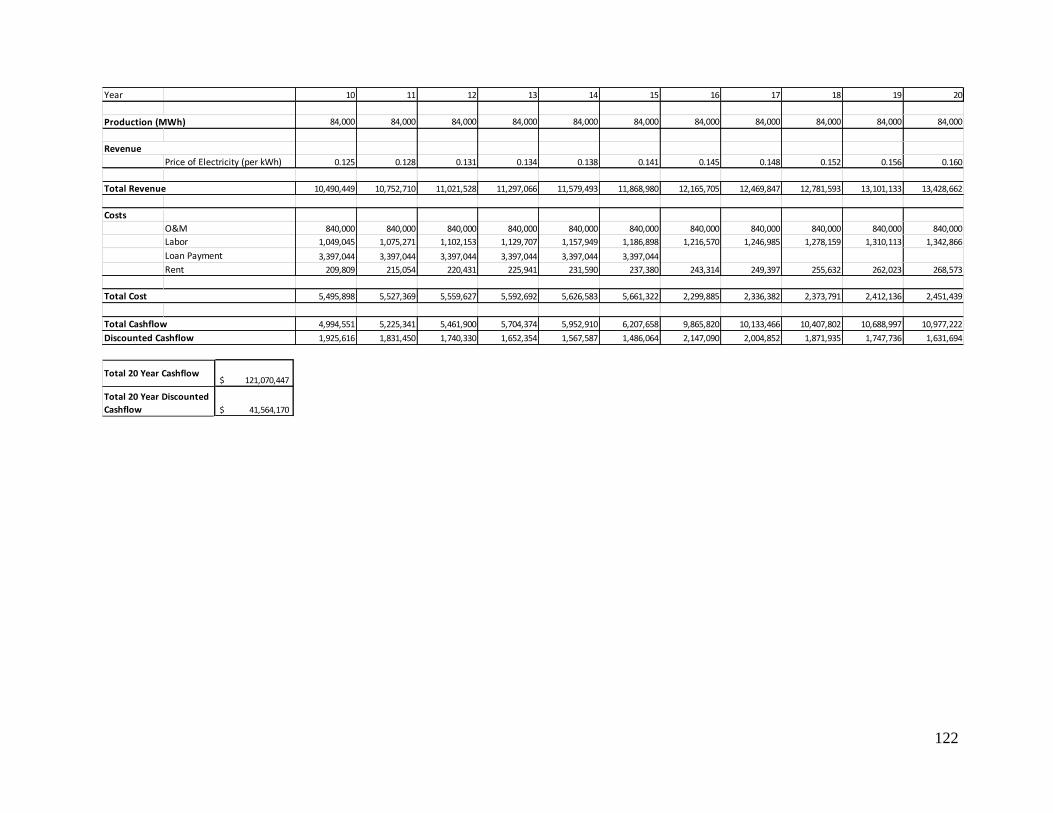
122
121,070,447$
41,564,170$
Total 20 Year Cashflow
Total 20 Year Discounted
Cashflow
Year 10 11 12 13 14 15 16 17 18 19 20
84,000 84,000 84,000 84,000 84,000 84,000 84,000 84,000 84,000 84,000 84,000
Price of Electricity (per kWh) 0.125 0.128 0.131 0.134 0.138 0.141 0.145 0.148 0.152 0.156 0.160
10,490,449 10,752,710 11,021,528 11,297,066 11,579,493 11,868,980 12,165,705 12,469,847 12,781,593 13,101,133 13,428,662
Costs
O&M 840,000 840,000 840,000 840,000 840,000 840,000 840,000 840,000 840,000 840,000 840,000
Labor 1,049,045 1,075,271 1,102,153 1,129,707 1,157,949 1,186,898 1,216,570 1,246,985 1,278,159 1,310,113 1,342,866
Loan Payment 3,397,044 3,397,044 3,397,044 3,397,044 3,397,044 3,397,044
Rent 209,809 215,054 220,431 225,941 231,590 237,380 243,314 249,397 255,632 262,023 268,573
5,495,898 5,527,369 5,559,627 5,592,692 5,626,583 5,661,322 2,299,885 2,336,382 2,373,791 2,412,136 2,451,439
4,994,551 5,225,341 5,461,900 5,704,374 5,952,910 6,207,658 9,865,820 10,133,466 10,407,802 10,688,997 10,977,222
1,925,616 1,831,450 1,740,330 1,652,354 1,567,587 1,486,064 2,147,090 2,004,852 1,871,935 1,747,736 1,631,694Discounted Cashflow
Production (MWh)
Revenue
Total Revenue
Total Cost
Total Cashflow
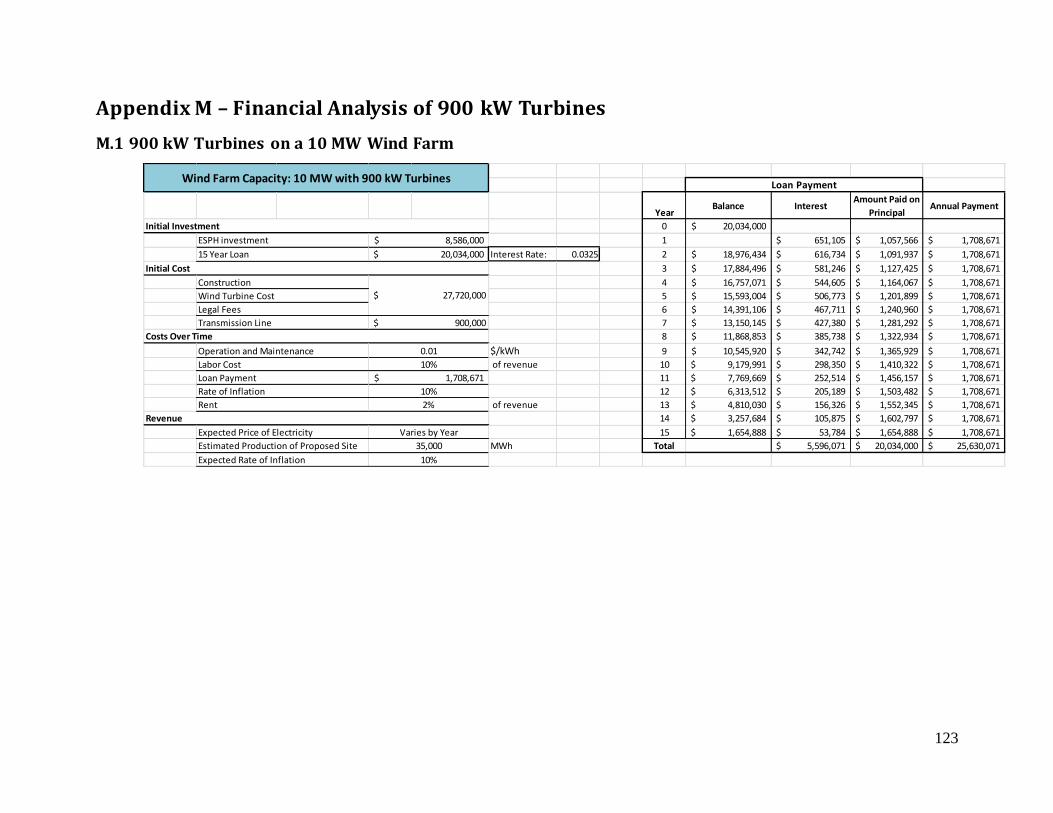
123
Appendix M – Financial Analysis of 900 kW Turbines
M.1 900 kW Turbines on a 10 MW Wind Farm
YearBalance Interest
Amount Paid on
PrincipalAnnual Payment
0 20,034,000$
1 651,105$ 1,057,566$ 1,708,671$
Interest Rate: 0.0325 2 18,976,434$ 616,734$ 1,091,937$ 1,708,671$
3 17,884,496$ 581,246$ 1,127,425$ 1,708,671$
4 16,757,071$ 544,605$ 1,164,067$ 1,708,671$
5 15,593,004$ 506,773$ 1,201,899$ 1,708,671$
6 14,391,106$ 467,711$ 1,240,960$ 1,708,671$
7 13,150,145$ 427,380$ 1,281,292$ 1,708,671$
8 11,868,853$ 385,738$ 1,322,934$ 1,708,671$
$/kWh 9 10,545,920$ 342,742$ 1,365,929$ 1,708,671$
of revenue 10 9,179,991$ 298,350$ 1,410,322$ 1,708,671$
11 7,769,669$ 252,514$ 1,456,157$ 1,708,671$
12 6,313,512$ 205,189$ 1,503,482$ 1,708,671$
of revenue 13 4,810,030$ 156,326$ 1,552,345$ 1,708,671$
14 3,257,684$ 105,875$ 1,602,797$ 1,708,671$
15 1,654,888$ 53,784$ 1,654,888$ 1,708,671$
MWh Total 5,596,071$ 20,034,000$ 25,630,071$ Estimated Production of Proposed Site 35,000
Expected Rate of Inflation 10%
Rate of Inflation 10%
Rent 2%
Revenue
Expected Price of Electricity Varies by Year
10%
Loan Payment 1,708,671$
Initial Cost
Construction
$ 27,720,000 Wind Turbine Cost
Legal Fees
Transmission Line $ 900,000
Costs Over Time
Operation and Maintenance 0.01
Labor Cost
Loan Payment
Initial Investment
ESPH investment 8,586,000$
15 Year Loan 20,034,000$
Wind Farm Capacity: 10 MW with 900 kW Turbines

124
Year 1 2 3 4 5 6 7 8 9
35,000 35,000 35,000 35,000 35,000 35,000 35,000 35,000 35,000
Revenue
Price of Electricity (per kWh) 0.100 0.103 0.105 0.108 0.110 0.113 0.116 0.119 0.122
3,500,000 3,587,500 3,677,188 3,769,117 3,863,345 3,959,929 4,058,927 4,160,400 4,264,410
Costs
O&M 350,000 350,000 350,000 350,000 350,000 350,000 350,000 350,000 350,000
Labor 350,000 358,750 367,719 376,912 386,335 395,993 405,893 416,040 426,441
Loan Payment 1,708,671 1,708,671 1,708,671 1,708,671 1,708,671 1,708,671 1,708,671 1,708,671 1,708,671
Rent 70,000 71,750 73,544 75,382 77,267 79,199 81,179 83,208 85,288
2,478,671 2,489,171 2,499,934 2,510,965 2,522,273 2,533,863 2,545,743 2,557,919 2,570,401
1,021,329 1,098,329 1,177,254 1,258,152 1,341,072 1,426,066 1,513,184 1,602,481 1,694,010
928,481 907,710 884,488 859,335 832,700 804,977 776,503 747,569 718,425
8,586,000$ 7,657,519$ 6,749,810$ 5,865,322$ 5,005,987$ 4,173,287$ 3,368,310$ 2,591,807$ 1,844,238$ 1,125,813$
Total Cashflow
Discounted Cashflow
ESPH Initial Investment
Payback
Wind Farm Capacity: 10 MW with 900 kW Turbines
Cost Analysis and Payback Period
Production (MWh)
Total Revenue
Total Cost
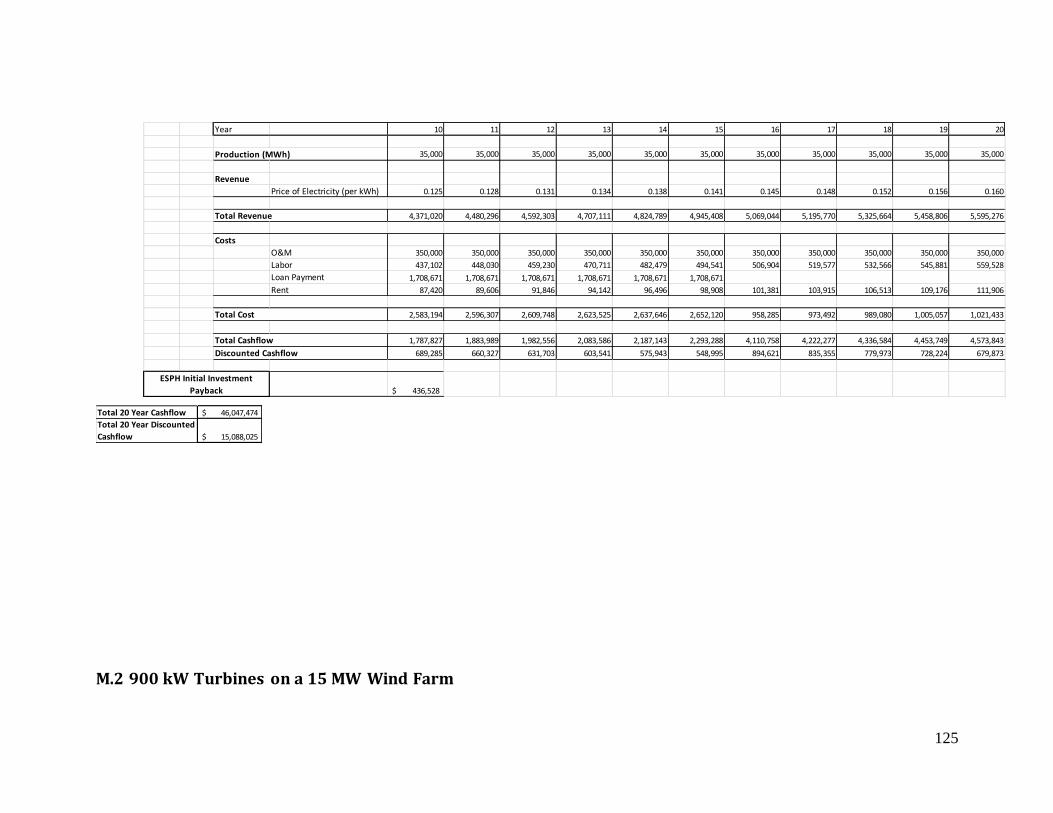
125
46,047,474$
15,088,025$
Total 20 Year Cashflow
Total 20 Year Discounted
Cashflow
M.2 900 kW Turbines on a 15 MW Wind Farm
Year 10 11 12 13 14 15 16 17 18 19 20
35,000 35,000 35,000 35,000 35,000 35,000 35,000 35,000 35,000 35,000 35,000
Revenue
Price of Electricity (per kWh) 0.125 0.128 0.131 0.134 0.138 0.141 0.145 0.148 0.152 0.156 0.160
4,371,020 4,480,296 4,592,303 4,707,111 4,824,789 4,945,408 5,069,044 5,195,770 5,325,664 5,458,806 5,595,276
Costs
O&M 350,000 350,000 350,000 350,000 350,000 350,000 350,000 350,000 350,000 350,000 350,000
Labor 437,102 448,030 459,230 470,711 482,479 494,541 506,904 519,577 532,566 545,881 559,528
Loan Payment 1,708,671 1,708,671 1,708,671 1,708,671 1,708,671 1,708,671
Rent 87,420 89,606 91,846 94,142 96,496 98,908 101,381 103,915 106,513 109,176 111,906
2,583,194 2,596,307 2,609,748 2,623,525 2,637,646 2,652,120 958,285 973,492 989,080 1,005,057 1,021,433
1,787,827 1,883,989 1,982,556 2,083,586 2,187,143 2,293,288 4,110,758 4,222,277 4,336,584 4,453,749 4,573,843
689,285 660,327 631,703 603,541 575,943 548,995 894,621 835,355 779,973 728,224 679,873
436,528$
ESPH Initial Investment
Payback
Production (MWh)
Total Revenue
Total Cost
Total Cashflow
Discounted Cashflow
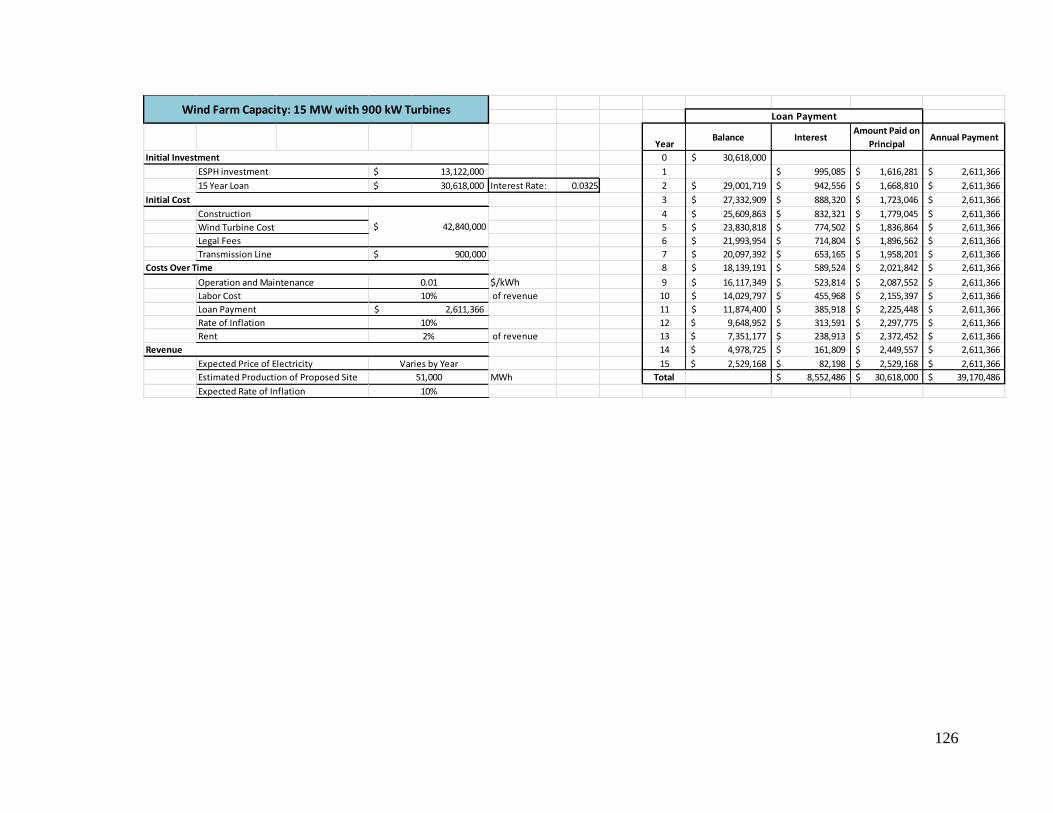
126
YearBalance Interest
Amount Paid on
PrincipalAnnual Payment
0 30,618,000$
1 995,085$ 1,616,281$ 2,611,366$
Interest Rate: 0.0325 2 29,001,719$ 942,556$ 1,668,810$ 2,611,366$
3 27,332,909$ 888,320$ 1,723,046$ 2,611,366$
4 25,609,863$ 832,321$ 1,779,045$ 2,611,366$
5 23,830,818$ 774,502$ 1,836,864$ 2,611,366$
6 21,993,954$ 714,804$ 1,896,562$ 2,611,366$
7 20,097,392$ 653,165$ 1,958,201$ 2,611,366$
8 18,139,191$ 589,524$ 2,021,842$ 2,611,366$
$/kWh 9 16,117,349$ 523,814$ 2,087,552$ 2,611,366$
of revenue 10 14,029,797$ 455,968$ 2,155,397$ 2,611,366$
11 11,874,400$ 385,918$ 2,225,448$ 2,611,366$
12 9,648,952$ 313,591$ 2,297,775$ 2,611,366$
of revenue 13 7,351,177$ 238,913$ 2,372,452$ 2,611,366$
14 4,978,725$ 161,809$ 2,449,557$ 2,611,366$
15 2,529,168$ 82,198$ 2,529,168$ 2,611,366$
MWh Total 8,552,486$ 30,618,000$ 39,170,486$ Estimated Production of Proposed Site 51,000
Expected Rate of Inflation 10%
Rate of Inflation 10%
Rent 2%
Revenue
Expected Price of Electricity Varies by Year
10%
Loan Payment 2,611,366$
Initial Cost
Construction
$ 42,840,000 Wind Turbine Cost
Legal Fees
Transmission Line $ 900,000
Costs Over Time
Operation and Maintenance 0.01
Labor Cost
Loan Payment
Initial Investment
ESPH investment 13,122,000$
15 Year Loan 30,618,000$
Wind Farm Capacity: 15 MW with 900 kW Turbines

127
Year 1 2 3 4 5 6 7 8 9
51,000 51,000 51,000 51,000 51,000 51,000 51,000 51,000 51,000
Revenue
Price of Electricity (per kWh) 0.100 0.103 0.105 0.108 0.110 0.113 0.116 0.119 0.122
5,100,000 5,227,500 5,358,188 5,492,142 5,629,446 5,770,182 5,914,436 6,062,297 6,213,855
Costs
O&M 510,000 510,000 510,000 510,000 510,000 510,000 510,000 510,000 510,000
Labor 510,000 522,750 535,819 549,214 562,945 577,018 591,444 606,230 621,385
Loan Payment 2,611,366 2,611,366 2,611,366 2,611,366 2,611,366 2,611,366 2,611,366 2,611,366 2,611,366
Rent 102,000 104,550 107,164 109,843 112,589 115,404 118,289 121,246 124,277
3,733,366 3,748,666 3,764,348 3,780,423 3,796,899 3,813,788 3,831,098 3,848,841 3,867,028
1,366,634 1,478,834 1,593,839 1,711,719 1,832,547 1,956,394 2,083,338 2,213,456 2,346,826
1,242,395 1,222,177 1,197,475 1,169,127 1,137,867 1,104,334 1,069,082 1,032,594 995,284
13,122,000$ 11,879,605$ 10,657,428$ 9,459,953$ 8,290,826$ 7,152,959$ 6,048,625$ 4,979,543$ 3,946,949$ 2,951,666$
Total Cashflow
Discounted Cashflow
ESPH Initial Investment
Payback
Wind Farm Capacity: 15 MW with 900 kW Turbines
Cost Analysis and Payback Period
Production (MWh)
Total Revenue
Total Cost
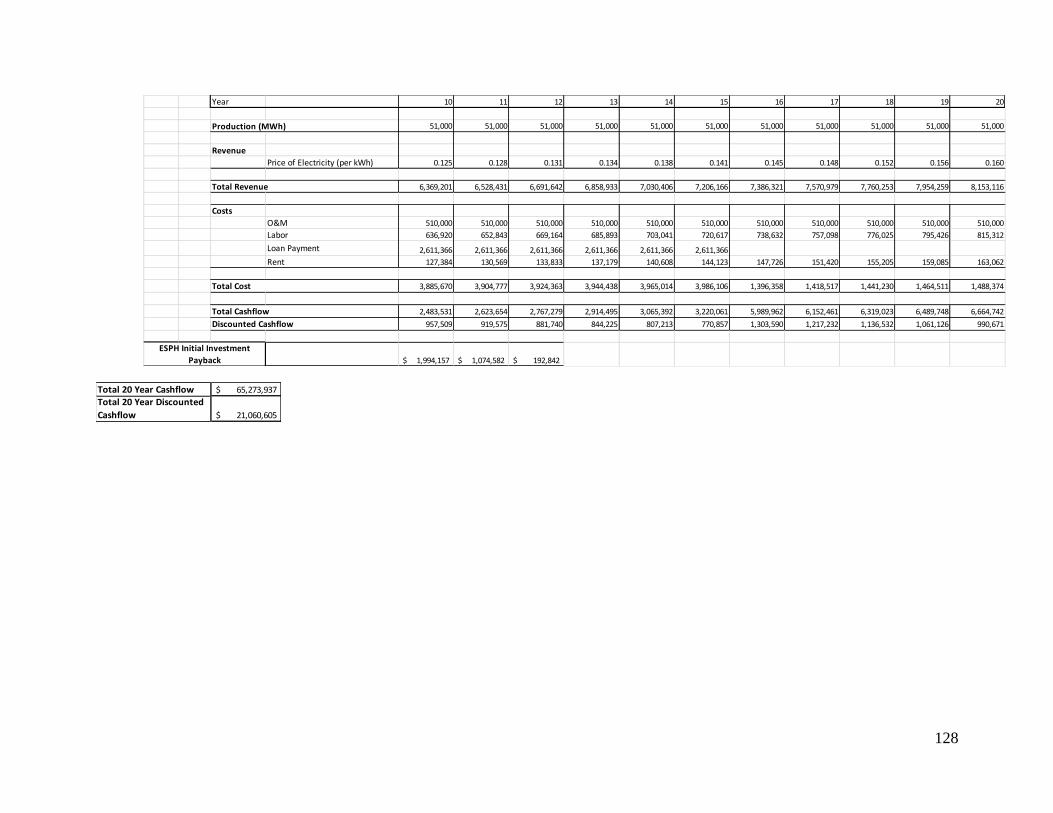
128
65,273,937$
21,060,605$
Total 20 Year Cashflow
Total 20 Year Discounted
Cashflow
Year 10 11 12 13 14 15 16 17 18 19 20
51,000 51,000 51,000 51,000 51,000 51,000 51,000 51,000 51,000 51,000 51,000
Revenue
Price of Electricity (per kWh) 0.125 0.128 0.131 0.134 0.138 0.141 0.145 0.148 0.152 0.156 0.160
6,369,201 6,528,431 6,691,642 6,858,933 7,030,406 7,206,166 7,386,321 7,570,979 7,760,253 7,954,259 8,153,116
Costs
O&M 510,000 510,000 510,000 510,000 510,000 510,000 510,000 510,000 510,000 510,000 510,000
Labor 636,920 652,843 669,164 685,893 703,041 720,617 738,632 757,098 776,025 795,426 815,312
Loan Payment 2,611,366 2,611,366 2,611,366 2,611,366 2,611,366 2,611,366
Rent 127,384 130,569 133,833 137,179 140,608 144,123 147,726 151,420 155,205 159,085 163,062
3,885,670 3,904,777 3,924,363 3,944,438 3,965,014 3,986,106 1,396,358 1,418,517 1,441,230 1,464,511 1,488,374
2,483,531 2,623,654 2,767,279 2,914,495 3,065,392 3,220,061 5,989,962 6,152,461 6,319,023 6,489,748 6,664,742
957,509 919,575 881,740 844,225 807,213 770,857 1,303,590 1,217,232 1,136,532 1,061,126 990,671
1,994,157$ 1,074,582$ 192,842$
ESPH Initial Investment
Payback
Production (MWh)
Total Revenue
Total Cost
Total Cashflow
Discounted Cashflow
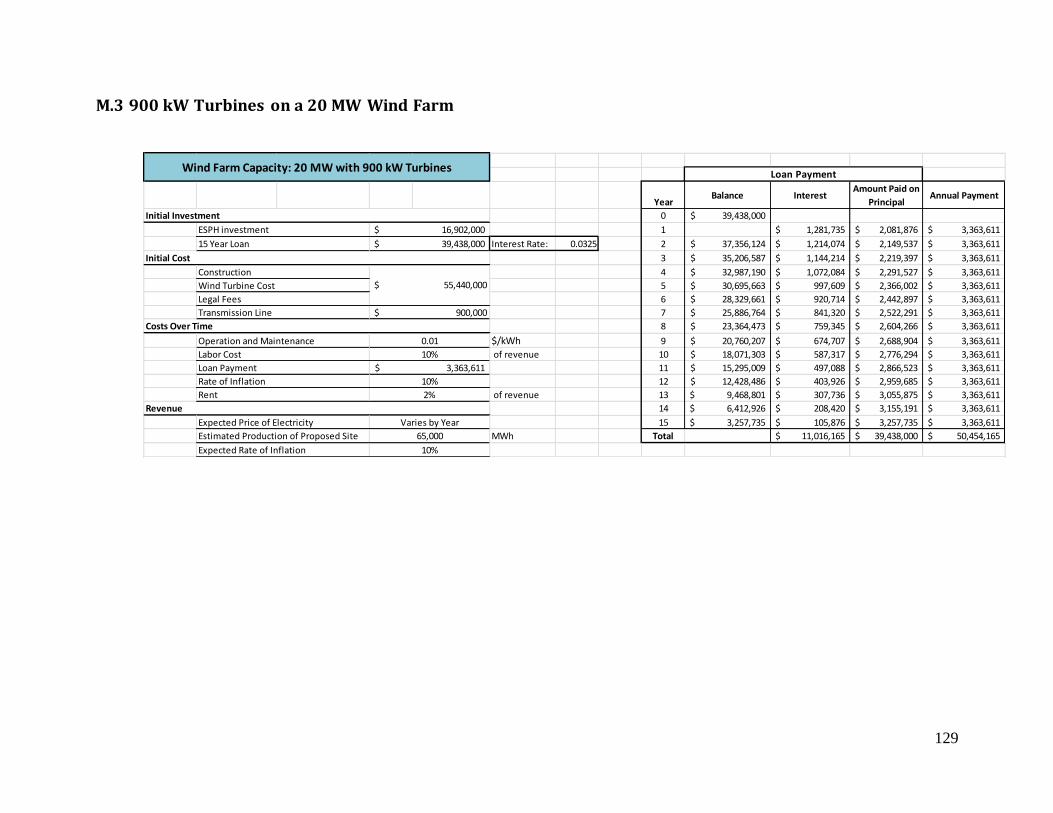
129
M.3 900 kW Turbines on a 20 MW Wind Farm
YearBalance Interest
Amount Paid on
PrincipalAnnual Payment
0 39,438,000$
1 1,281,735$ 2,081,876$ 3,363,611$
Interest Rate: 0.0325 2 37,356,124$ 1,214,074$ 2,149,537$ 3,363,611$
3 35,206,587$ 1,144,214$ 2,219,397$ 3,363,611$
4 32,987,190$ 1,072,084$ 2,291,527$ 3,363,611$
5 30,695,663$ 997,609$ 2,366,002$ 3,363,611$
6 28,329,661$ 920,714$ 2,442,897$ 3,363,611$
7 25,886,764$ 841,320$ 2,522,291$ 3,363,611$
8 23,364,473$ 759,345$ 2,604,266$ 3,363,611$
$/kWh 9 20,760,207$ 674,707$ 2,688,904$ 3,363,611$
of revenue 10 18,071,303$ 587,317$ 2,776,294$ 3,363,611$
11 15,295,009$ 497,088$ 2,866,523$ 3,363,611$
12 12,428,486$ 403,926$ 2,959,685$ 3,363,611$
of revenue 13 9,468,801$ 307,736$ 3,055,875$ 3,363,611$
14 6,412,926$ 208,420$ 3,155,191$ 3,363,611$
15 3,257,735$ 105,876$ 3,257,735$ 3,363,611$
MWh Total 11,016,165$ 39,438,000$ 50,454,165$
16,902,000$
39,438,000$
Construction
ESPH investment
15 Year Loan
Wind Turbine Cost
Estimated Production of Proposed Site
Expected Rate of Inflation 10%
65,000
Varies by Year
Legal Fees
Transmission Line
Revenue
Rent
Expected Price of Electricity
Wind Farm Capacity: 20 MW with 900 kW TurbinesLoan Payment
$ 55,440,000
2%
Initial Investment
Initial Cost
Costs Over Time
Operation and Maintenance
Labor Cost
Loan Payment
Rate of Inflation
0.01
10%
10%
3,363,611$
$ 900,000
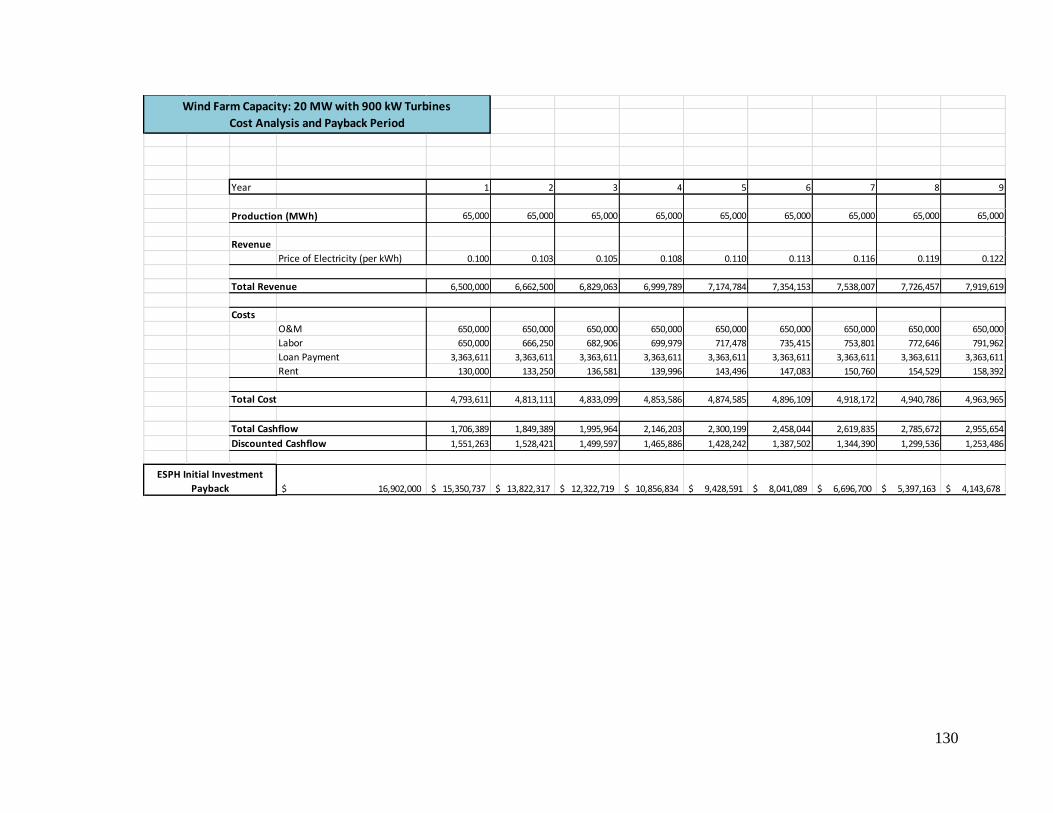
130
Year 1 2 3 4 5 6 7 8 9
65,000 65,000 65,000 65,000 65,000 65,000 65,000 65,000 65,000
Revenue
Price of Electricity (per kWh) 0.100 0.103 0.105 0.108 0.110 0.113 0.116 0.119 0.122
6,500,000 6,662,500 6,829,063 6,999,789 7,174,784 7,354,153 7,538,007 7,726,457 7,919,619
Costs
O&M 650,000 650,000 650,000 650,000 650,000 650,000 650,000 650,000 650,000
Labor 650,000 666,250 682,906 699,979 717,478 735,415 753,801 772,646 791,962
Loan Payment 3,363,611 3,363,611 3,363,611 3,363,611 3,363,611 3,363,611 3,363,611 3,363,611 3,363,611
Rent 130,000 133,250 136,581 139,996 143,496 147,083 150,760 154,529 158,392
4,793,611 4,813,111 4,833,099 4,853,586 4,874,585 4,896,109 4,918,172 4,940,786 4,963,965
1,706,389 1,849,389 1,995,964 2,146,203 2,300,199 2,458,044 2,619,835 2,785,672 2,955,654
1,551,263 1,528,421 1,499,597 1,465,886 1,428,242 1,387,502 1,344,390 1,299,536 1,253,486
16,902,000$ 15,350,737$ 13,822,317$ 12,322,719$ 10,856,834$ 9,428,591$ 8,041,089$ 6,696,700$ 5,397,163$ 4,143,678$
Total Cashflow
Discounted Cashflow
ESPH Initial Investment
Payback
Wind Farm Capacity: 20 MW with 900 kW Turbines
Cost Analysis and Payback Period
Production (MWh)
Total Revenue
Total Cost
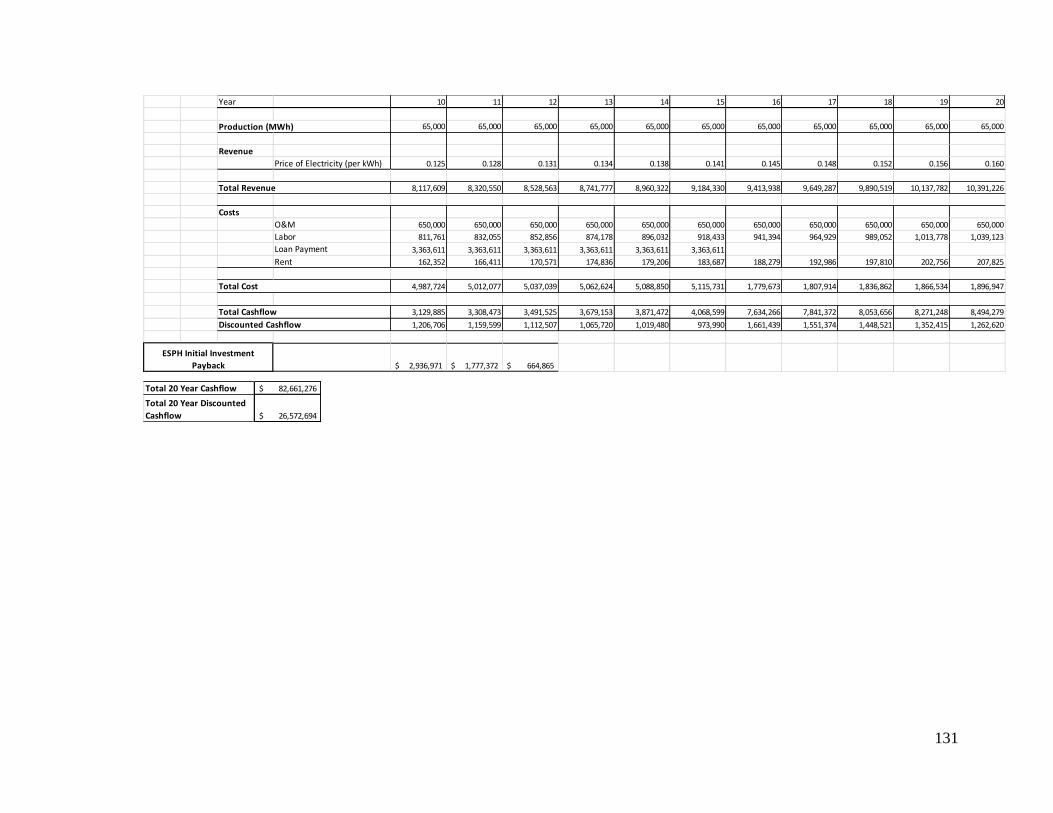
131
Year 10 11 12 13 14 15 16 17 18 19 20
65,000 65,000 65,000 65,000 65,000 65,000 65,000 65,000 65,000 65,000 65,000
Revenue
Price of Electricity (per kWh) 0.125 0.128 0.131 0.134 0.138 0.141 0.145 0.148 0.152 0.156 0.160
8,117,609 8,320,550 8,528,563 8,741,777 8,960,322 9,184,330 9,413,938 9,649,287 9,890,519 10,137,782 10,391,226
Costs
O&M 650,000 650,000 650,000 650,000 650,000 650,000 650,000 650,000 650,000 650,000 650,000
Labor 811,761 832,055 852,856 874,178 896,032 918,433 941,394 964,929 989,052 1,013,778 1,039,123
Loan Payment 3,363,611 3,363,611 3,363,611 3,363,611 3,363,611 3,363,611
Rent 162,352 166,411 170,571 174,836 179,206 183,687 188,279 192,986 197,810 202,756 207,825
4,987,724 5,012,077 5,037,039 5,062,624 5,088,850 5,115,731 1,779,673 1,807,914 1,836,862 1,866,534 1,896,947
3,129,885 3,308,473 3,491,525 3,679,153 3,871,472 4,068,599 7,634,266 7,841,372 8,053,656 8,271,248 8,494,279
1,206,706 1,159,599 1,112,507 1,065,720 1,019,480 973,990 1,661,439 1,551,374 1,448,521 1,352,415 1,262,620
2,936,971$ 1,777,372$ 664,865$
ESPH Initial Investment
Payback
Production (MWh)
Total Revenue
Total Cost
Total Cashflow
Discounted Cashflow
82,661,276$
26,572,694$
Total 20 Year Cashflow
Total 20 Year Discounted
Cashflow
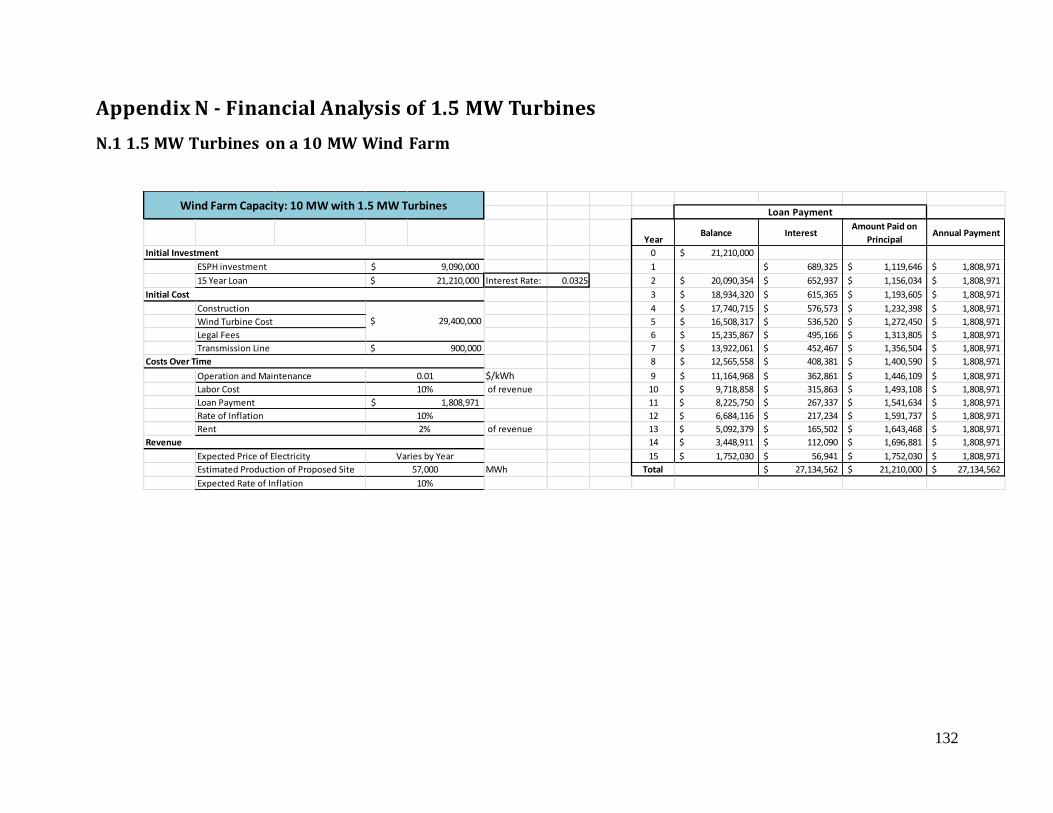
132
Appendix N - Financial Analysis of 1.5 MW Turbines
N.1 1.5 MW Turbines on a 10 MW Wind Farm
YearBalance Interest
Amount Paid on
PrincipalAnnual Payment
0 21,210,000$
1 689,325$ 1,119,646$ 1,808,971$
Interest Rate: 0.0325 2 20,090,354$ 652,937$ 1,156,034$ 1,808,971$
3 18,934,320$ 615,365$ 1,193,605$ 1,808,971$
4 17,740,715$ 576,573$ 1,232,398$ 1,808,971$
5 16,508,317$ 536,520$ 1,272,450$ 1,808,971$
6 15,235,867$ 495,166$ 1,313,805$ 1,808,971$
7 13,922,061$ 452,467$ 1,356,504$ 1,808,971$
8 12,565,558$ 408,381$ 1,400,590$ 1,808,971$
$/kWh 9 11,164,968$ 362,861$ 1,446,109$ 1,808,971$
of revenue 10 9,718,858$ 315,863$ 1,493,108$ 1,808,971$
11 8,225,750$ 267,337$ 1,541,634$ 1,808,971$
12 6,684,116$ 217,234$ 1,591,737$ 1,808,971$
of revenue 13 5,092,379$ 165,502$ 1,643,468$ 1,808,971$
14 3,448,911$ 112,090$ 1,696,881$ 1,808,971$
15 1,752,030$ 56,941$ 1,752,030$ 1,808,971$
MWh Total 27,134,562$ 21,210,000$ 27,134,562$ Estimated Production of Proposed Site 57,000
Expected Rate of Inflation 10%
Wind Farm Capacity: 10 MW with 1.5 MW Turbines
Rate of Inflation 10%
Rent 2%
Revenue
Expected Price of Electricity Varies by Year
Costs Over Time
Operation and Maintenance 0.01
Labor Cost 10%
Loan Payment 1,808,971$
Initial Cost
Construction
$ 29,400,000 Wind Turbine Cost
Legal Fees
Transmission Line $ 900,000
Loan Payment
Initial Investment
ESPH investment 9,090,000$
15 Year Loan 21,210,000$

133
Year 1 2 3 4 5 6 7 8 9
57,000 57,000 57,000 57,000 57,000 57,000 57,000 57,000 57,000
Revenue
Price of Electricity (per kWh) 0.100 0.103 0.105 0.108 0.110 0.113 0.116 0.119 0.122
5,700,000 5,842,500 5,988,563 6,138,277 6,291,733 6,449,027 6,610,252 6,775,509 6,944,897
Costs
O&M 570,000 570,000 570,000 570,000 570,000 570,000 570,000 570,000 570,000
Labor 570,000 584,250 598,856 613,828 629,173 644,903 661,025 677,551 694,490
Loan Payment 1,808,971 1,808,971 1,808,971 1,808,971 1,808,971 1,808,971 1,808,971 1,808,971 1,808,971
Rent 114,000 116,850 119,771 122,766 125,835 128,981 132,205 135,510 138,898
3,062,971 3,080,071 3,097,598 3,115,564 3,133,979 3,152,854 3,172,201 3,192,032 3,212,358
2,637,029 2,762,429 2,890,964 3,022,713 3,157,755 3,296,173 3,438,051 3,583,477 3,732,538
2,397,299 2,282,999 2,172,024 2,064,553 1,960,717 1,860,604 1,764,264 1,671,718 1,582,961
9,090,000$ 6,692,701$ 4,409,701$ 2,237,677$ 173,124$
Total Cashflow
Discounted Cashflow
ESPH Initial Investment
Payback
Wind Farm Capacity: 10 MW with 1.5 MW Turbines
Cost Analysis and Payback Period
Production (MWh)
Total Revenue
Total Cost
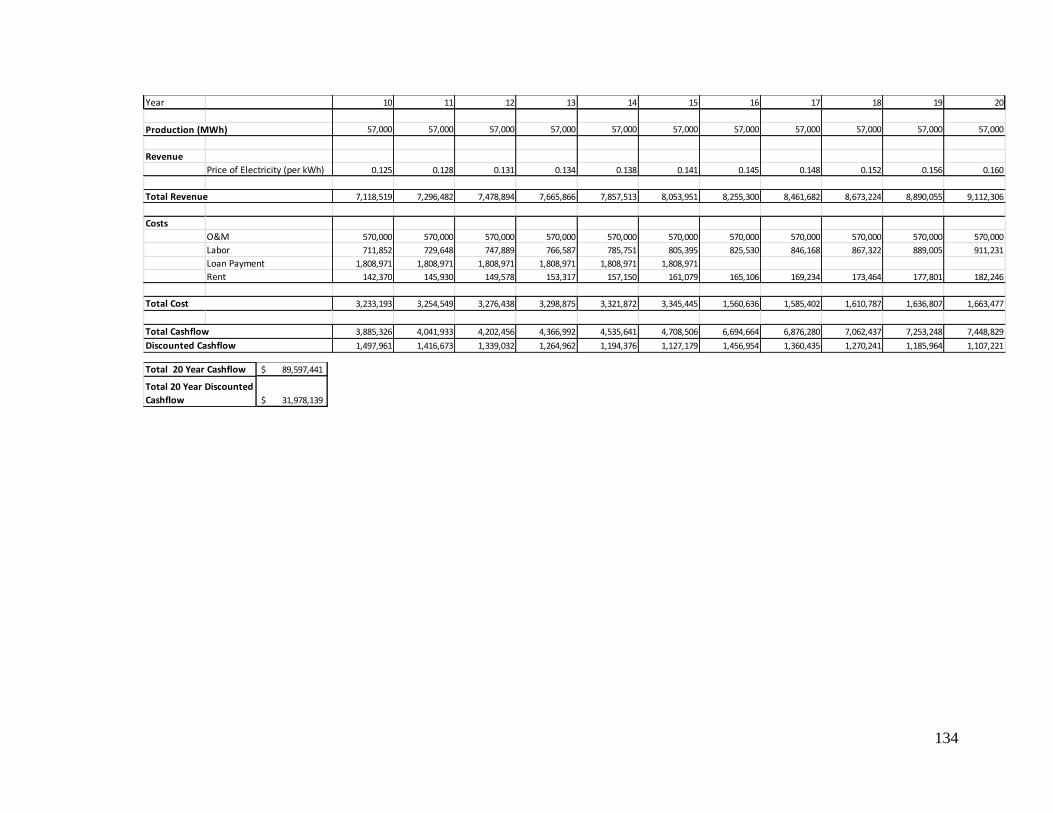
134
Year 10 11 12 13 14 15 16 17 18 19 20
57,000 57,000 57,000 57,000 57,000 57,000 57,000 57,000 57,000 57,000 57,000
Revenue
Price of Electricity (per kWh) 0.125 0.128 0.131 0.134 0.138 0.141 0.145 0.148 0.152 0.156 0.160
7,118,519 7,296,482 7,478,894 7,665,866 7,857,513 8,053,951 8,255,300 8,461,682 8,673,224 8,890,055 9,112,306
Costs
O&M 570,000 570,000 570,000 570,000 570,000 570,000 570,000 570,000 570,000 570,000 570,000
Labor 711,852 729,648 747,889 766,587 785,751 805,395 825,530 846,168 867,322 889,005 911,231
Loan Payment 1,808,971 1,808,971 1,808,971 1,808,971 1,808,971 1,808,971
Rent 142,370 145,930 149,578 153,317 157,150 161,079 165,106 169,234 173,464 177,801 182,246
3,233,193 3,254,549 3,276,438 3,298,875 3,321,872 3,345,445 1,560,636 1,585,402 1,610,787 1,636,807 1,663,477
3,885,326 4,041,933 4,202,456 4,366,992 4,535,641 4,708,506 6,694,664 6,876,280 7,062,437 7,253,248 7,448,829
1,497,961 1,416,673 1,339,032 1,264,962 1,194,376 1,127,179 1,456,954 1,360,435 1,270,241 1,185,964 1,107,221
Production (MWh)
Total Revenue
Total Cost
Total Cashflow
Discounted Cashflow
89,597,441$
31,978,139$
Total 20 Year Cashflow
Total 20 Year Discounted
Cashflow

135
N.2 1.5 MW Turbines on a 15 MW Wind Farm
YearBalance Interest
Amount Paid on
PrincipalAnnual Payment
0 30,030,000$
1 975,975$ 1,585,241$ 2,561,216$
Interest Rate: 0.0325 2 28,444,759$ 924,455$ 1,636,761$ 2,561,216$
3 26,807,998$ 871,260$ 1,689,956$ 2,561,216$
4 25,118,041$ 816,336$ 1,744,880$ 2,561,216$
5 23,373,162$ 759,628$ 1,801,588$ 2,561,216$
6 21,571,573$ 701,076$ 1,860,140$ 2,561,216$
7 19,711,434$ 640,622$ 1,920,594$ 2,561,216$
8 17,790,839$ 578,202$ 1,983,014$ 2,561,216$
$/kWh 9 15,807,825$ 513,754$ 2,047,462$ 2,561,216$
of revenue 10 13,760,364$ 447,212$ 2,114,004$ 2,561,216$
11 11,646,359$ 378,507$ 2,182,709$ 2,561,216$
12 9,463,650$ 307,569$ 2,253,647$ 2,561,216$
of revenue 13 7,210,003$ 234,325$ 2,326,891$ 2,561,216$
14 4,883,112$ 158,701$ 2,402,515$ 2,561,216$
15 2,480,597$ 80,619$ 2,480,597$ 2,561,216$
MWh Total 8,388,241$ 30,030,000$ 38,418,241$ Estimated Production of Proposed Site 80,000
Expected Rate of Inflation 10%
Rate of Inflation 10%
Rent 2%
Revenue
Expected Price of Electricity Varies by Year
10%
Loan Payment 2,561,216$
Initial Cost
Construction
$ 42,000,000 Wind Turbine Cost
Legal Fees
Transmission Line $ 900,000
Costs Over Time
Operation and Maintenance 0.01
Labor Cost
Loan Payment
Initial Investment
ESPH investment 12,870,000$
15 Year Loan 30,030,000$
Wind Farm Capacity: 15 MW with 1.5 MW Turbines

136
Year 1 2 3 4 5 6 7 8 9
80,000 80,000 80,000 80,000 80,000 80,000 80,000 80,000 80,000
Revenue
Price of Electricity (per kWh) 0.100 0.103 0.105 0.108 0.110 0.113 0.116 0.119 0.122
8,000,000 8,200,000 8,405,000 8,615,125 8,830,503 9,051,266 9,277,547 9,509,486 9,747,223
Costs
O&M 800,000 800,000 800,000 800,000 800,000 800,000 800,000 800,000 800,000
Labor 800,000 820,000 840,500 861,513 883,050 905,127 927,755 950,949 974,722
Loan Payment 2,561,216 2,561,216 2,561,216 2,561,216 2,561,216 2,561,216 2,561,216 2,561,216 2,561,216
Rent 160,000 164,000 168,100 172,303 176,610 181,025 185,551 190,190 194,944
4,321,216 4,345,216 4,369,816 4,395,031 4,420,876 4,447,368 4,474,522 4,502,354 4,530,883
3,678,784 3,854,784 4,035,184 4,220,094 4,409,627 4,603,898 4,803,026 5,007,132 5,216,340
3,344,349 3,185,772 3,031,693 2,882,381 2,738,031 2,598,780 2,464,712 2,335,864 2,212,238
12,870,000$ 9,525,651$ 6,339,879$ 3,308,186$ 425,805$
Total Cashflow
Discounted Cashflow
ESPH Initial Investment
Payback
Wind Farm Capacity: 15 MW with 1.5 MW Turbines
Cost Analysis and Payback Period
Production (MWh)
Total Revenue
Total Cost

137
Year 10 11 12 13 14 15 16 17 18 19 20
80,000 80,000 80,000 80,000 80,000 80,000 80,000 80,000 80,000 80,000 80,000
Revenue
Price of Electricity (per kWh) 0.125 0.128 0.131 0.134 0.138 0.141 0.145 0.148 0.152 0.156 0.160
9,990,904 10,240,676 10,496,693 10,759,111 11,028,088 11,303,791 11,586,385 11,876,045 12,172,946 12,477,270 12,789,201
Costs
O&M 800,000 800,000 800,000 800,000 800,000 800,000 800,000 800,000 800,000 800,000 800,000
Labor 999,090 1,024,068 1,049,669 1,075,911 1,102,809 1,130,379 1,158,639 1,187,604 1,217,295 1,247,727 1,278,920
Loan Payment 2,561,216 2,561,216 2,561,216 2,561,216 2,561,216 2,561,216
Rent 199,818 204,814 209,934 215,182 220,562 226,076 231,728 237,521 243,459 249,545 255,784
4,560,124 4,590,097 4,620,819 4,652,309 4,684,587 4,717,671 2,190,366 2,225,125 2,260,754 2,297,272 2,334,704
5,430,779 5,650,579 5,875,874 6,106,801 6,343,502 6,586,120 9,396,019 9,650,920 9,912,193 10,179,997 10,454,497
2,093,801 1,980,494 1,872,235 1,768,923 1,670,442 1,576,665 2,044,848 1,909,383 1,782,795 1,664,511 1,553,994
Production (MWh)
Total Revenue
Total Cost
Total Cashflow
Discounted Cashflow
125,416,149$
44,711,909$
Total 20 Year Cashflow
Total 20 Year Discounted
Cashflow

138
N.3 1.5 MW Turbines on a 20 MW Wind Farm
YearBalance Interest
Amount Paid on
PrincipalAnnual Payment
0 38,850,000$
1 1,262,625$ 2,050,836$ 3,313,461$
Interest Rate: 0.0325 2 36,799,164$ 1,195,973$ 2,117,489$ 3,313,461$
3 34,681,675$ 1,127,154$ 2,186,307$ 3,313,461$
4 32,495,368$ 1,056,099$ 2,257,362$ 3,313,461$
5 30,238,006$ 982,735$ 2,330,726$ 3,313,461$
6 27,907,280$ 906,987$ 2,406,475$ 3,313,461$
7 25,500,806$ 828,776$ 2,484,685$ 3,313,461$
8 23,016,120$ 748,024$ 2,565,437$ 3,313,461$
$/kWh 9 20,450,683$ 664,647$ 2,648,814$ 3,313,461$
of revenue 10 17,801,869$ 578,561$ 2,734,901$ 3,313,461$
11 15,066,968$ 489,676$ 2,823,785$ 3,313,461$
12 12,243,184$ 397,903$ 2,915,558$ 3,313,461$
of revenue 13 9,327,626$ 303,148$ 3,010,313$ 3,313,461$
14 6,317,312$ 205,313$ 3,108,149$ 3,313,461$
15 3,209,164$ 104,298$ 3,209,164$ 3,313,461$
MWh Total 10,851,920$ 38,850,000$ 49,701,920$
16,650,000$
38,850,000$
Construction
ESPH investment
15 Year Loan
Wind Turbine Cost
Estimated Production of Proposed Site
Expected Rate of Inflation 10%
102,000
Varies by Year
Legal Fees
Transmission Line
Revenue
Rent
Expected Price of Electricity
Wind Farm Capacity: 20 MW with 1.5 MW TurbinesLoan Payment
$ 54,600,000
2%
Initial Investment
Initial Cost
Costs Over Time
Operation and Maintenance
Labor Cost
Loan Payment
Rate of Inflation
0.01
10%
10%
3,313,461$
$ 900,000
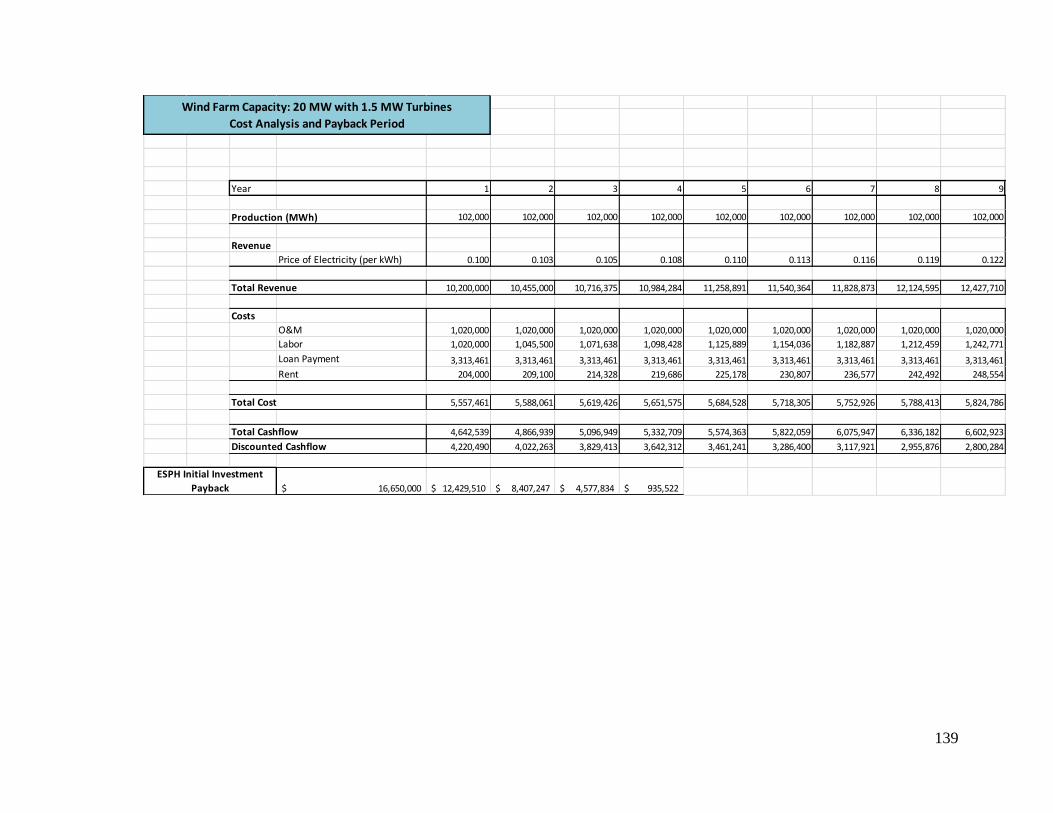
139
Year 1 2 3 4 5 6 7 8 9
102,000 102,000 102,000 102,000 102,000 102,000 102,000 102,000 102,000
Revenue
Price of Electricity (per kWh) 0.100 0.103 0.105 0.108 0.110 0.113 0.116 0.119 0.122
10,200,000 10,455,000 10,716,375 10,984,284 11,258,891 11,540,364 11,828,873 12,124,595 12,427,710
Costs
O&M 1,020,000 1,020,000 1,020,000 1,020,000 1,020,000 1,020,000 1,020,000 1,020,000 1,020,000
Labor 1,020,000 1,045,500 1,071,638 1,098,428 1,125,889 1,154,036 1,182,887 1,212,459 1,242,771
Loan Payment 3,313,461 3,313,461 3,313,461 3,313,461 3,313,461 3,313,461 3,313,461 3,313,461 3,313,461
Rent 204,000 209,100 214,328 219,686 225,178 230,807 236,577 242,492 248,554
5,557,461 5,588,061 5,619,426 5,651,575 5,684,528 5,718,305 5,752,926 5,788,413 5,824,786
4,642,539 4,866,939 5,096,949 5,332,709 5,574,363 5,822,059 6,075,947 6,336,182 6,602,923
4,220,490 4,022,263 3,829,413 3,642,312 3,461,241 3,286,400 3,117,921 2,955,876 2,800,284
16,650,000$ 12,429,510$ 8,407,247$ 4,577,834$ 935,522$
Total Cashflow
Discounted Cashflow
ESPH Initial Investment
Payback
Wind Farm Capacity: 20 MW with 1.5 MW Turbines
Cost Analysis and Payback Period
Production (MWh)
Total Revenue
Total Cost

140
Year 10 11 12 13 14 15 16 17 18 19 20
102,000 102,000 102,000 102,000 102,000 102,000 102,000 102,000 102,000 102,000 102,000
Revenue
Price of Electricity (per kWh) 0.125 0.128 0.131 0.134 0.138 0.141 0.145 0.148 0.152 0.156 0.160
12,738,402 13,056,862 13,383,284 13,717,866 14,060,813 14,412,333 14,772,641 15,141,957 15,520,506 15,908,519 16,306,232
Costs
O&M 1,020,000 1,020,000 1,020,000 1,020,000 1,020,000 1,020,000 1,020,000 1,020,000 1,020,000 1,020,000 1,020,000
Labor 1,273,840 1,305,686 1,338,328 1,371,787 1,406,081 1,441,233 1,477,264 1,514,196 1,552,051 1,590,852 1,630,623
Loan Payment 3,313,461 3,313,461 3,313,461 3,313,461 3,313,461 3,313,461
Rent 254,768 261,137 267,666 274,357 281,216 288,247 295,453 302,839 310,410 318,170 326,125
5,862,070 5,900,285 5,939,455 5,979,605 6,020,759 6,062,941 2,792,717 2,837,035 2,882,461 2,929,022 2,976,748
6,876,333 7,156,578 7,443,829 7,738,261 8,040,054 8,349,392 11,979,924 12,304,922 12,638,046 12,979,497 13,329,484
2,651,124 2,508,337 2,371,833 2,241,499 2,117,197 1,998,778 2,607,181 2,434,463 2,273,064 2,122,251 1,981,343
Production (MWh)
Total Revenue
Total Cost
Total Cashflow
Discounted Cashflow
159,186,927$
56,643,270$
Total 20 Year Cashflow
Total 20 Year Discounted
Cashflow
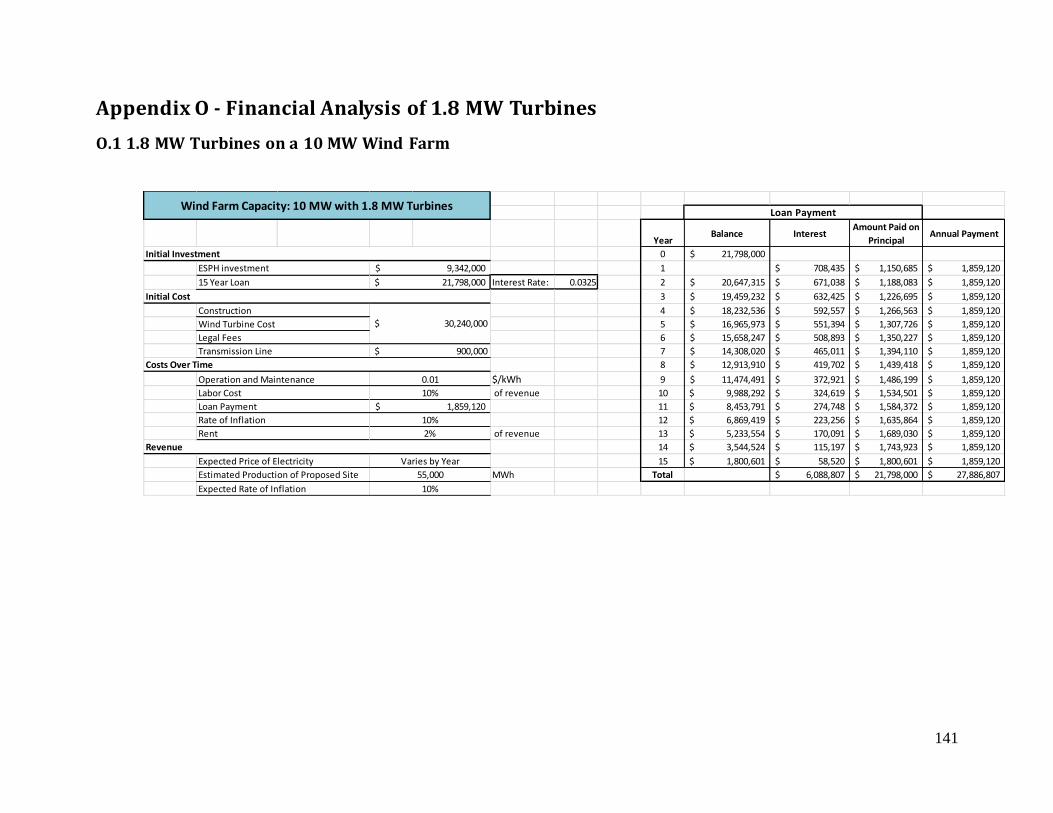
141
Appendix O - Financial Analysis of 1.8 MW Turbines
O.1 1.8 MW Turbines on a 10 MW Wind Farm
YearBalance Interest
Amount Paid on
PrincipalAnnual Payment
0 21,798,000$
1 708,435$ 1,150,685$ 1,859,120$
Interest Rate: 0.0325 2 20,647,315$ 671,038$ 1,188,083$ 1,859,120$
3 19,459,232$ 632,425$ 1,226,695$ 1,859,120$
4 18,232,536$ 592,557$ 1,266,563$ 1,859,120$
5 16,965,973$ 551,394$ 1,307,726$ 1,859,120$
6 15,658,247$ 508,893$ 1,350,227$ 1,859,120$
7 14,308,020$ 465,011$ 1,394,110$ 1,859,120$
8 12,913,910$ 419,702$ 1,439,418$ 1,859,120$
$/kWh 9 11,474,491$ 372,921$ 1,486,199$ 1,859,120$
of revenue 10 9,988,292$ 324,619$ 1,534,501$ 1,859,120$
11 8,453,791$ 274,748$ 1,584,372$ 1,859,120$
12 6,869,419$ 223,256$ 1,635,864$ 1,859,120$
of revenue 13 5,233,554$ 170,091$ 1,689,030$ 1,859,120$
14 3,544,524$ 115,197$ 1,743,923$ 1,859,120$
15 1,800,601$ 58,520$ 1,800,601$ 1,859,120$
MWh Total 6,088,807$ 21,798,000$ 27,886,807$ Estimated Production of Proposed Site 55,000
Expected Rate of Inflation 10%
Wind Farm Capacity: 10 MW with 1.8 MW Turbines
Rate of Inflation 10%
Rent 2%
Revenue
Expected Price of Electricity Varies by Year
Costs Over Time
Operation and Maintenance 0.01
Labor Cost 10%
Loan Payment 1,859,120$
Initial Cost
Construction
$ 30,240,000 Wind Turbine Cost
Legal Fees
Transmission Line $ 900,000
Loan Payment
Initial Investment
ESPH investment 9,342,000$
15 Year Loan 21,798,000$
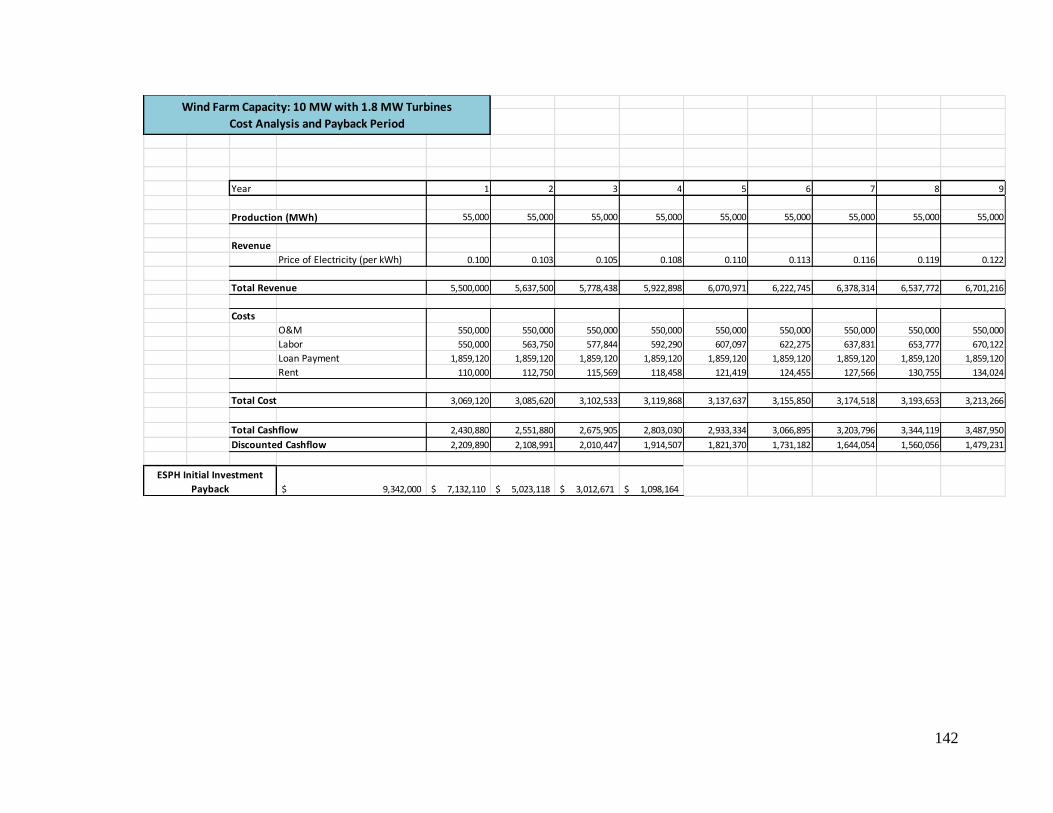
142
Year 1 2 3 4 5 6 7 8 9
55,000 55,000 55,000 55,000 55,000 55,000 55,000 55,000 55,000
Revenue
Price of Electricity (per kWh) 0.100 0.103 0.105 0.108 0.110 0.113 0.116 0.119 0.122
5,500,000 5,637,500 5,778,438 5,922,898 6,070,971 6,222,745 6,378,314 6,537,772 6,701,216
Costs
O&M 550,000 550,000 550,000 550,000 550,000 550,000 550,000 550,000 550,000
Labor 550,000 563,750 577,844 592,290 607,097 622,275 637,831 653,777 670,122
Loan Payment 1,859,120 1,859,120 1,859,120 1,859,120 1,859,120 1,859,120 1,859,120 1,859,120 1,859,120
Rent 110,000 112,750 115,569 118,458 121,419 124,455 127,566 130,755 134,024
3,069,120 3,085,620 3,102,533 3,119,868 3,137,637 3,155,850 3,174,518 3,193,653 3,213,266
2,430,880 2,551,880 2,675,905 2,803,030 2,933,334 3,066,895 3,203,796 3,344,119 3,487,950
2,209,890 2,108,991 2,010,447 1,914,507 1,821,370 1,731,182 1,644,054 1,560,056 1,479,231
9,342,000$ 7,132,110$ 5,023,118$ 3,012,671$ 1,098,164$
Total Cashflow
Discounted Cashflow
ESPH Initial Investment
Payback
Wind Farm Capacity: 10 MW with 1.8 MW Turbines
Cost Analysis and Payback Period
Production (MWh)
Total Revenue
Total Cost

143
Year 10 11 12 13 14 15 16 17 18 19 20
55,000 55,000 55,000 55,000 55,000 55,000 55,000 55,000 55,000 55,000 55,000
Revenue
Price of Electricity (per kWh) 0.125 0.128 0.131 0.134 0.138 0.141 0.145 0.148 0.152 0.156 0.160
6,868,746 7,040,465 7,216,477 7,396,889 7,581,811 7,771,356 7,965,640 8,164,781 8,368,900 8,578,123 8,792,576
Costs
O&M 550,000 550,000 550,000 550,000 550,000 550,000 550,000 550,000 550,000 550,000 550,000
Labor 686,875 704,046 721,648 739,689 758,181 777,136 796,564 816,478 836,890 857,812 879,258
Loan Payment 1,859,120 1,859,120 1,859,120 1,859,120 1,859,120 1,859,120
Rent 137,375 140,809 144,330 147,938 151,636 155,427 159,313 163,296 167,378 171,562 175,852
3,233,370 3,253,976 3,275,098 3,296,747 3,318,938 3,341,683 1,505,877 1,529,774 1,554,268 1,579,375 1,605,109
3,635,376 3,786,489 3,941,379 4,100,141 4,262,873 4,429,673 6,459,763 6,635,007 6,814,632 6,998,748 7,187,467
1,401,595 1,327,141 1,255,845 1,187,665 1,122,548 1,060,428 1,405,833 1,312,701 1,225,672 1,144,351 1,068,371
Production (MWh)
Total Revenue
Total Cost
Total Cashflow
Discounted Cashflow
84,749,336$
29,991,878$
Total 20 Year Cashflow
Total 20 Year Discounted
Cashflow
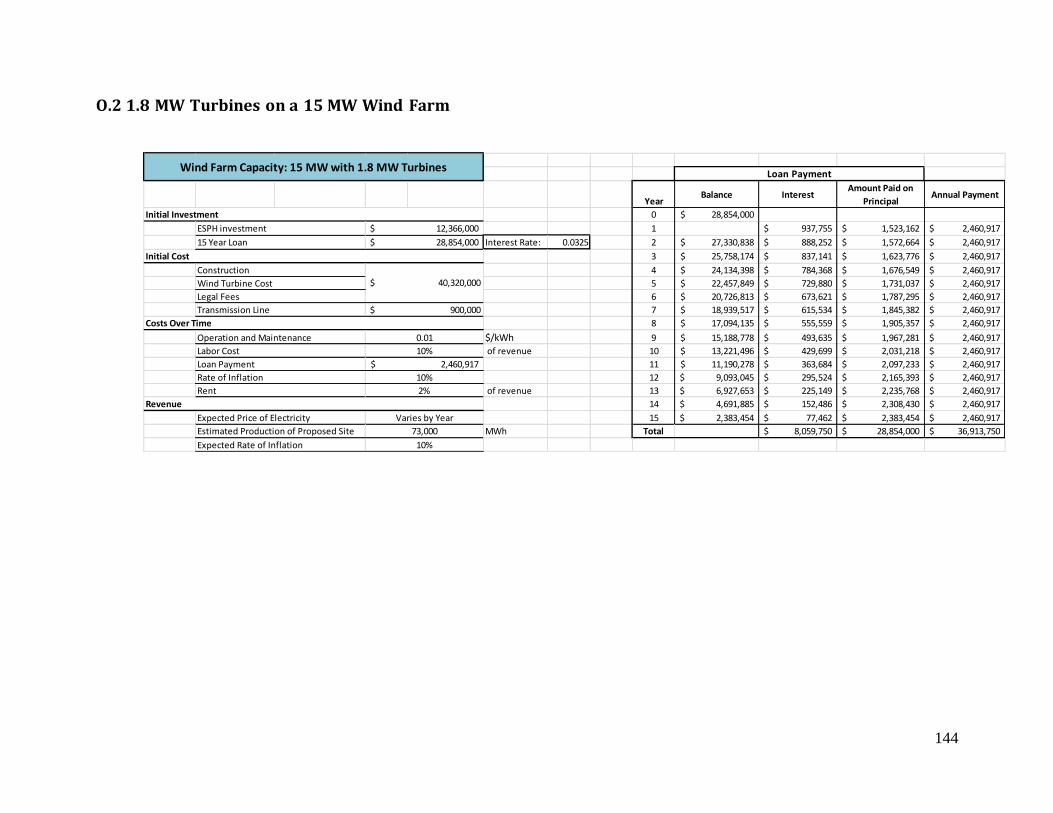
144
O.2 1.8 MW Turbines on a 15 MW Wind Farm
YearBalance Interest
Amount Paid on
PrincipalAnnual Payment
0 28,854,000$
1 937,755$ 1,523,162$ 2,460,917$
Interest Rate: 0.0325 2 27,330,838$ 888,252$ 1,572,664$ 2,460,917$
3 25,758,174$ 837,141$ 1,623,776$ 2,460,917$
4 24,134,398$ 784,368$ 1,676,549$ 2,460,917$
5 22,457,849$ 729,880$ 1,731,037$ 2,460,917$
6 20,726,813$ 673,621$ 1,787,295$ 2,460,917$
7 18,939,517$ 615,534$ 1,845,382$ 2,460,917$
8 17,094,135$ 555,559$ 1,905,357$ 2,460,917$
$/kWh 9 15,188,778$ 493,635$ 1,967,281$ 2,460,917$
of revenue 10 13,221,496$ 429,699$ 2,031,218$ 2,460,917$
11 11,190,278$ 363,684$ 2,097,233$ 2,460,917$
12 9,093,045$ 295,524$ 2,165,393$ 2,460,917$
of revenue 13 6,927,653$ 225,149$ 2,235,768$ 2,460,917$
14 4,691,885$ 152,486$ 2,308,430$ 2,460,917$
15 2,383,454$ 77,462$ 2,383,454$ 2,460,917$
MWh Total 8,059,750$ 28,854,000$ 36,913,750$ Estimated Production of Proposed Site 73,000
Expected Rate of Inflation 10%
Wind Farm Capacity: 15 MW with 1.8 MW Turbines
Rate of Inflation 10%
Rent 2%
Revenue
Expected Price of Electricity Varies by Year
Costs Over Time
Operation and Maintenance 0.01
Labor Cost 10%
Loan Payment 2,460,917$
Initial Cost
Construction
$ 40,320,000 Wind Turbine Cost
Legal Fees
Transmission Line $ 900,000
Loan Payment
Initial Investment
ESPH investment 12,366,000$
15 Year Loan 28,854,000$

145
Year 1 2 3 4 5 6 7 8 9
73,000 73,000 73,000 73,000 73,000 73,000 73,000 73,000 73,000
Revenue
Price of Electricity (per kWh) 0.100 0.103 0.105 0.108 0.110 0.113 0.116 0.119 0.122
7,300,000 7,482,500 7,669,563 7,861,302 8,057,834 8,259,280 8,465,762 8,677,406 8,894,341
Costs
O&M 730,000 730,000 730,000 730,000 730,000 730,000 730,000 730,000 730,000
Labor 730,000 748,250 766,956 786,130 805,783 825,928 846,576 867,741 889,434
Loan Payment 2,460,917 2,460,917 2,460,917 2,460,917 2,460,917 2,460,917 2,460,917 2,460,917 2,460,917
Rent 146,000 149,650 153,391 157,226 161,157 165,186 169,315 173,548 177,887
4,066,917 4,088,817 4,111,264 4,134,273 4,157,857 4,182,030 4,206,808 4,232,205 4,258,238
3,233,083 3,393,683 3,558,298 3,727,029 3,899,977 4,077,250 4,258,954 4,445,201 4,636,104
2,939,167 2,804,697 2,673,402 2,545,611 2,421,579 2,301,501 2,185,517 2,073,719 1,966,160
12,366,000$ 9,426,833$ 6,622,136$ 3,948,734$ 1,403,123$
Total Cashflow
Discounted Cashflow
ESPH Initial Investment
Payback
Wind Farm Capacity: 15 MW with 1.8 MW Turbines
Cost Analysis and Payback Period
Production (MWh)
Total Revenue
Total Cost
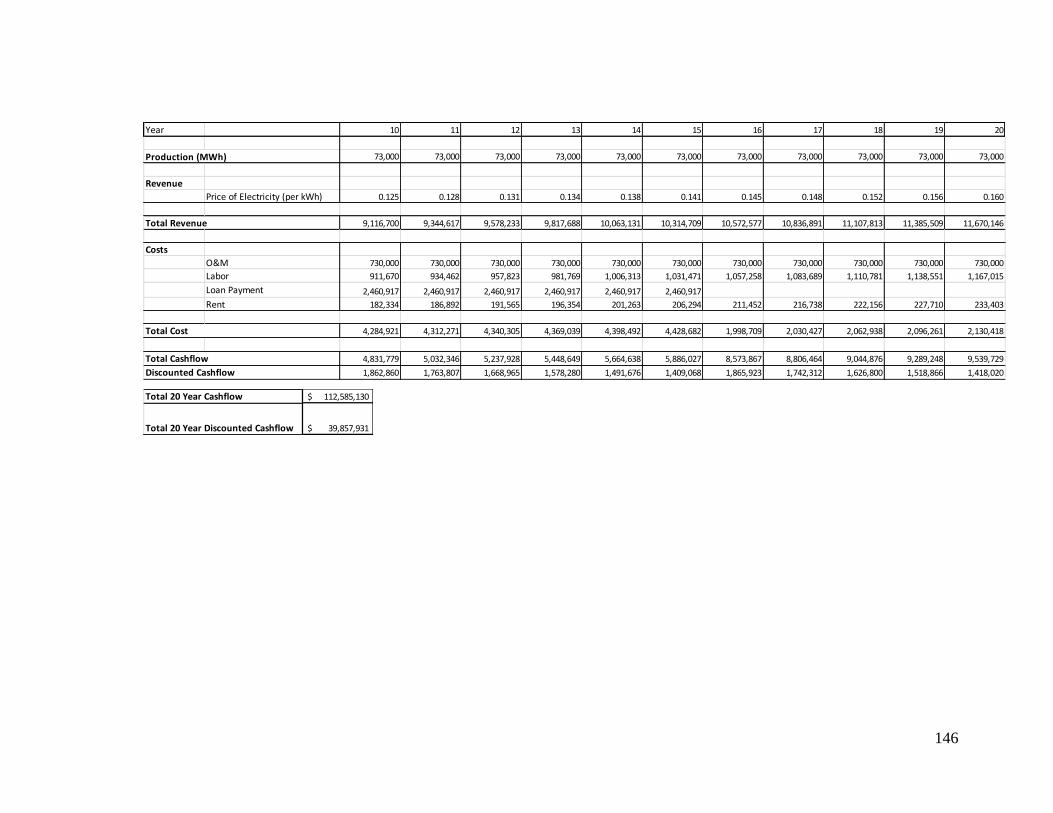
146
Year 10 11 12 13 14 15 16 17 18 19 20
73,000 73,000 73,000 73,000 73,000 73,000 73,000 73,000 73,000 73,000 73,000
Revenue
Price of Electricity (per kWh) 0.125 0.128 0.131 0.134 0.138 0.141 0.145 0.148 0.152 0.156 0.160
9,116,700 9,344,617 9,578,233 9,817,688 10,063,131 10,314,709 10,572,577 10,836,891 11,107,813 11,385,509 11,670,146
Costs
O&M 730,000 730,000 730,000 730,000 730,000 730,000 730,000 730,000 730,000 730,000 730,000
Labor 911,670 934,462 957,823 981,769 1,006,313 1,031,471 1,057,258 1,083,689 1,110,781 1,138,551 1,167,015
Loan Payment 2,460,917 2,460,917 2,460,917 2,460,917 2,460,917 2,460,917
Rent 182,334 186,892 191,565 196,354 201,263 206,294 211,452 216,738 222,156 227,710 233,403
4,284,921 4,312,271 4,340,305 4,369,039 4,398,492 4,428,682 1,998,709 2,030,427 2,062,938 2,096,261 2,130,418
4,831,779 5,032,346 5,237,928 5,448,649 5,664,638 5,886,027 8,573,867 8,806,464 9,044,876 9,289,248 9,539,729
1,862,860 1,763,807 1,668,965 1,578,280 1,491,676 1,409,068 1,865,923 1,742,312 1,626,800 1,518,866 1,418,020
Production (MWh)
Total Revenue
Total Cost
Total Cashflow
Discounted Cashflow
112,585,130$
39,857,931$
Total 20 Year Cashflow
Total 20 Year Discounted Cashflow
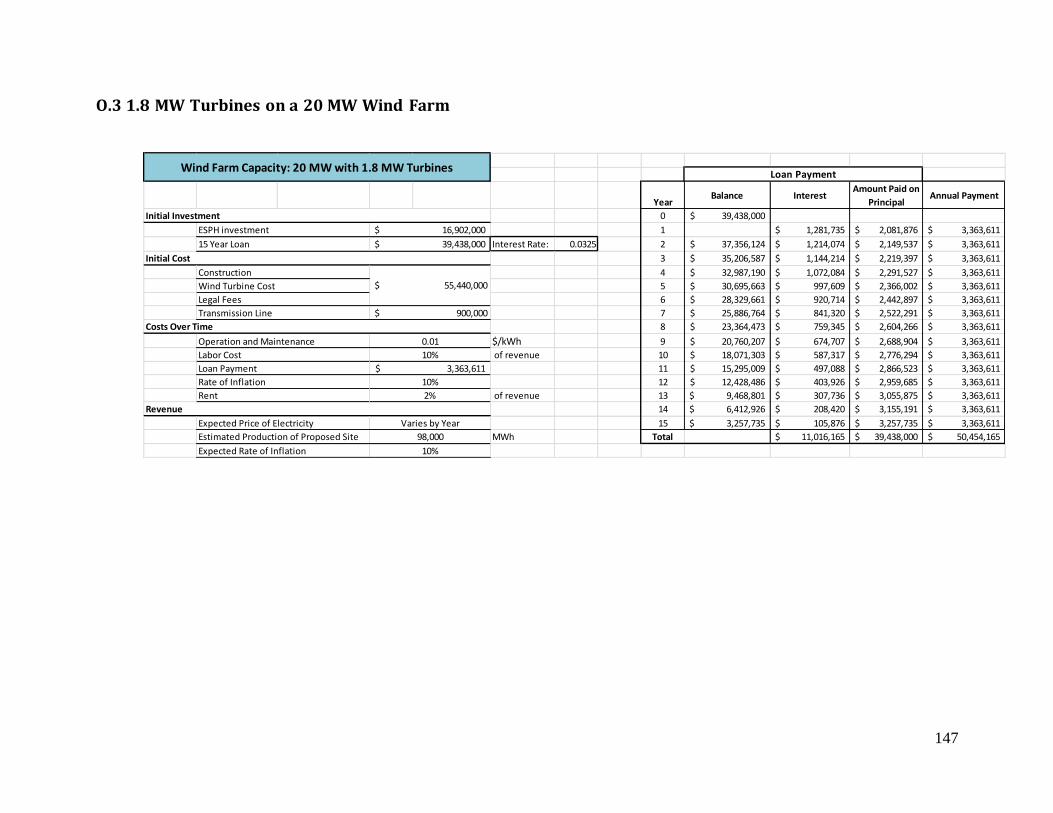
147
O.3 1.8 MW Turbines on a 20 MW Wind Farm
YearBalance Interest
Amount Paid on
PrincipalAnnual Payment
0 39,438,000$
1 1,281,735$ 2,081,876$ 3,363,611$
Interest Rate: 0.0325 2 37,356,124$ 1,214,074$ 2,149,537$ 3,363,611$
3 35,206,587$ 1,144,214$ 2,219,397$ 3,363,611$
4 32,987,190$ 1,072,084$ 2,291,527$ 3,363,611$
5 30,695,663$ 997,609$ 2,366,002$ 3,363,611$
6 28,329,661$ 920,714$ 2,442,897$ 3,363,611$
7 25,886,764$ 841,320$ 2,522,291$ 3,363,611$
8 23,364,473$ 759,345$ 2,604,266$ 3,363,611$
$/kWh 9 20,760,207$ 674,707$ 2,688,904$ 3,363,611$
of revenue 10 18,071,303$ 587,317$ 2,776,294$ 3,363,611$
11 15,295,009$ 497,088$ 2,866,523$ 3,363,611$
12 12,428,486$ 403,926$ 2,959,685$ 3,363,611$
of revenue 13 9,468,801$ 307,736$ 3,055,875$ 3,363,611$
14 6,412,926$ 208,420$ 3,155,191$ 3,363,611$
15 3,257,735$ 105,876$ 3,257,735$ 3,363,611$
MWh Total 11,016,165$ 39,438,000$ 50,454,165$
16,902,000$
39,438,000$
Wind Farm Capacity: 20 MW with 1.8 MW Turbines
Construction
ESPH investment
15 Year Loan
Legal Fees
Transmission Line
Revenue
Rent
Expected Price of Electricity
Estimated Production of Proposed Site
Expected Rate of Inflation 10%
98,000
Varies by Year
Loan Payment
$ 55,440,000
2%
Initial Investment
Initial Cost
Costs Over Time
Operation and Maintenance
Labor Cost
Loan Payment
Rate of Inflation
0.01
10%
10%
3,363,611$
$ 900,000
Wind Turbine Cost
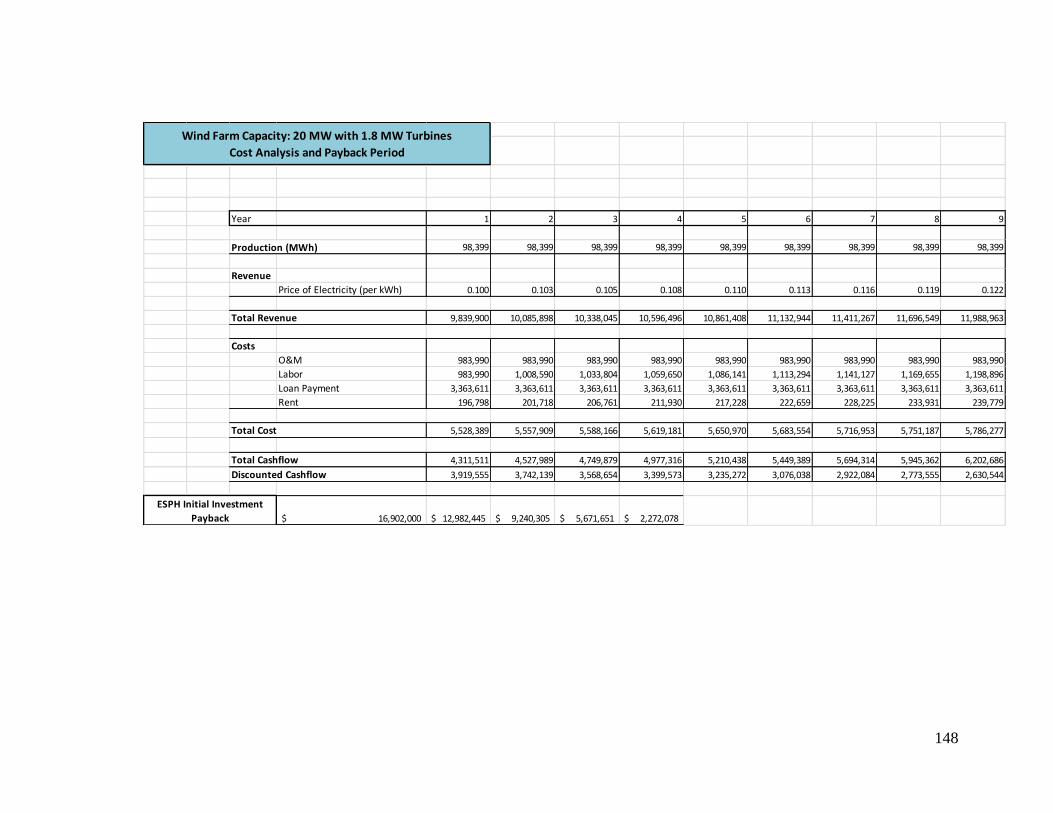
148
Year 1 2 3 4 5 6 7 8 9
98,399 98,399 98,399 98,399 98,399 98,399 98,399 98,399 98,399
Revenue
Price of Electricity (per kWh) 0.100 0.103 0.105 0.108 0.110 0.113 0.116 0.119 0.122
9,839,900 10,085,898 10,338,045 10,596,496 10,861,408 11,132,944 11,411,267 11,696,549 11,988,963
Costs
O&M 983,990 983,990 983,990 983,990 983,990 983,990 983,990 983,990 983,990
Labor 983,990 1,008,590 1,033,804 1,059,650 1,086,141 1,113,294 1,141,127 1,169,655 1,198,896
Loan Payment 3,363,611 3,363,611 3,363,611 3,363,611 3,363,611 3,363,611 3,363,611 3,363,611 3,363,611
Rent 196,798 201,718 206,761 211,930 217,228 222,659 228,225 233,931 239,779
5,528,389 5,557,909 5,588,166 5,619,181 5,650,970 5,683,554 5,716,953 5,751,187 5,786,277
4,311,511 4,527,989 4,749,879 4,977,316 5,210,438 5,449,389 5,694,314 5,945,362 6,202,686
3,919,555 3,742,139 3,568,654 3,399,573 3,235,272 3,076,038 2,922,084 2,773,555 2,630,544
16,902,000$ 12,982,445$ 9,240,305$ 5,671,651$ 2,272,078$
Total Cashflow
Discounted Cashflow
ESPH Initial Investment
Payback
Wind Farm Capacity: 20 MW with 1.8 MW Turbines
Cost Analysis and Payback Period
Production (MWh)
Total Revenue
Total Cost

149
Year 10 11 12 13 14 15 16 17 18 19 20
98,399 98,399 98,399 98,399 98,399 98,399 98,399 98,399 98,399 98,399 98,399
Revenue
Price of Electricity (per kWh) 0.125 0.128 0.131 0.134 0.138 0.141 0.145 0.148 0.152 0.156 0.160
12,288,687 12,595,904 12,910,802 13,233,572 13,564,411 13,903,521 14,251,109 14,607,387 14,972,572 15,346,886 15,730,558
Costs
O&M 983,990 983,990 983,990 983,990 983,990 983,990 983,990 983,990 983,990 983,990 983,990
Labor 1,228,869 1,259,590 1,291,080 1,323,357 1,356,441 1,390,352 1,425,111 1,460,739 1,497,257 1,534,689 1,573,056
Loan Payment 3,363,611 3,363,611 3,363,611 3,363,611 3,363,611 3,363,611
Rent 245,774 251,918 258,216 264,671 271,288 278,070 285,022 292,148 299,451 306,938 314,611
5,822,243 5,859,109 5,896,897 5,935,630 5,975,330 6,016,024 2,694,123 2,736,876 2,780,699 2,825,616 2,871,657
6,466,443 6,736,794 7,013,904 7,297,942 7,589,081 7,887,498 11,556,986 11,870,510 12,191,873 12,521,270 12,858,901
2,493,094 2,361,205 2,234,846 2,113,954 1,998,442 1,888,204 2,515,137 2,348,517 2,192,816 2,047,328 1,911,394
Production (MWh)
Total Revenue
Total Cost
Total Cashflow
Discounted Cashflow
151,060,086$
53,372,353$
Total 20 Year Cashflow
Total 20 Year Discounted
Cashflow

150
Appendix P - Financial Analysis of 2.0 MW Turbines
P.1 2.0 MW Turbines on a 10 MW Wind Farm
YearBalance Interest
Amount Paid on
PrincipalAnnual Payment
0 20,230,000$
1 657,475$ 1,067,913$ 1,725,388$
Interest Rate: 0.0325 2 19,162,087$ 622,768$ 1,102,620$ 1,725,388$
3 18,059,467$ 586,933$ 1,138,455$ 1,725,388$
4 16,921,012$ 549,933$ 1,175,455$ 1,725,388$
5 15,745,557$ 511,731$ 1,213,657$ 1,725,388$
6 14,531,899$ 472,287$ 1,253,101$ 1,725,388$
7 13,278,798$ 431,561$ 1,293,827$ 1,725,388$
8 11,984,971$ 389,512$ 1,335,876$ 1,725,388$
$/kWh 9 10,649,094$ 346,096$ 1,379,292$ 1,725,388$
of revenue 10 9,269,802$ 301,269$ 1,424,119$ 1,725,388$
11 7,845,683$ 254,985$ 1,470,403$ 1,725,388$
12 6,375,279$ 207,197$ 1,518,191$ 1,725,388$
of revenue 13 4,857,088$ 157,855$ 1,567,533$ 1,725,388$
14 3,289,555$ 106,911$ 1,618,477$ 1,725,388$
15 1,671,078$ 54,310$ 1,671,078$ 1,725,388$
MWh Total 5,650,820$ 20,230,000$ 25,880,820$
Loan Payment
Initial Investment
ESPH investment 8,670,000$
15 Year Loan 20,230,000$
10%
Loan Payment 1,725,388$
Initial Cost
Construction
$ 28,000,000 Wind Turbine Cost
Legal Fees
Transmission Line $ 900,000
Estimated Production of Proposed Site 45,000
Expected Rate of Inflation 10%
Wind Farm Capacity: 10 MW with 2.0 MW Turbines
Rate of Inflation 10%
Rent 2%
Revenue
Expected Price of Electricity Varies by Year
Costs Over Time
Operation and Maintenance 0.01
Labor Cost
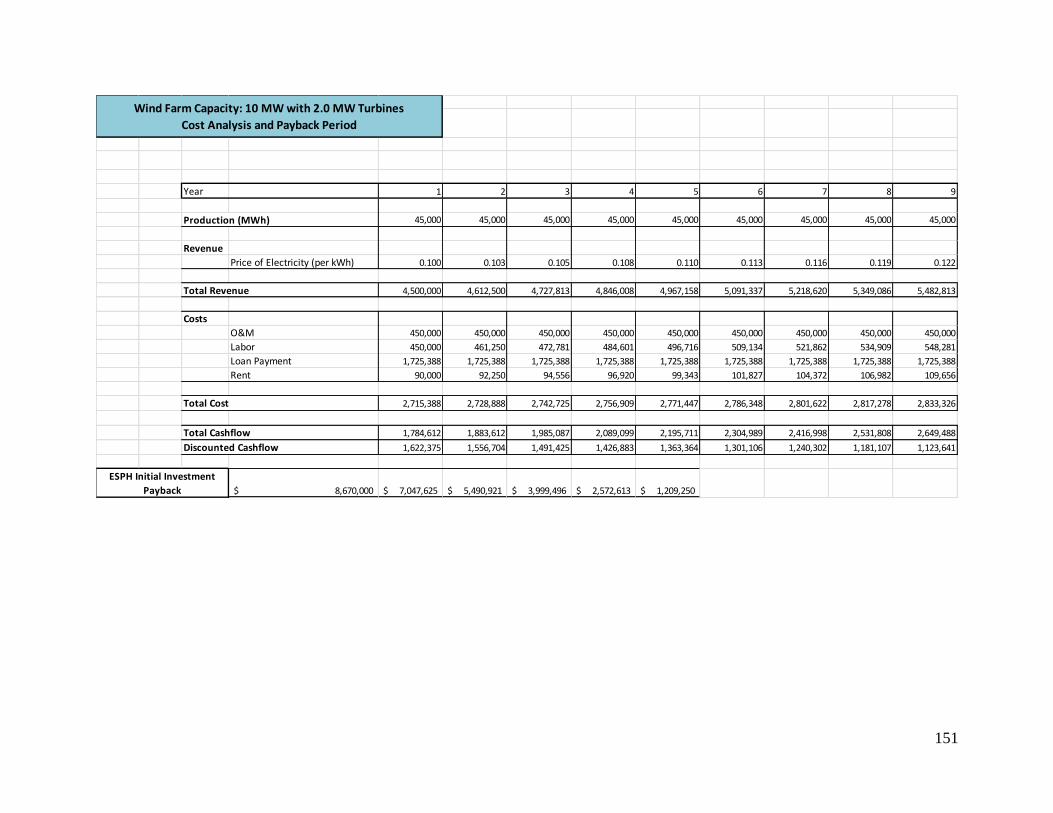
151
Year 1 2 3 4 5 6 7 8 9
45,000 45,000 45,000 45,000 45,000 45,000 45,000 45,000 45,000
Revenue
Price of Electricity (per kWh) 0.100 0.103 0.105 0.108 0.110 0.113 0.116 0.119 0.122
4,500,000 4,612,500 4,727,813 4,846,008 4,967,158 5,091,337 5,218,620 5,349,086 5,482,813
Costs
O&M 450,000 450,000 450,000 450,000 450,000 450,000 450,000 450,000 450,000
Labor 450,000 461,250 472,781 484,601 496,716 509,134 521,862 534,909 548,281
Loan Payment 1,725,388 1,725,388 1,725,388 1,725,388 1,725,388 1,725,388 1,725,388 1,725,388 1,725,388
Rent 90,000 92,250 94,556 96,920 99,343 101,827 104,372 106,982 109,656
2,715,388 2,728,888 2,742,725 2,756,909 2,771,447 2,786,348 2,801,622 2,817,278 2,833,326
1,784,612 1,883,612 1,985,087 2,089,099 2,195,711 2,304,989 2,416,998 2,531,808 2,649,488
1,622,375 1,556,704 1,491,425 1,426,883 1,363,364 1,301,106 1,240,302 1,181,107 1,123,641
8,670,000$ 7,047,625$ 5,490,921$ 3,999,496$ 2,572,613$ 1,209,250$
Total Cashflow
Discounted Cashflow
ESPH Initial Investment
Payback
Wind Farm Capacity: 10 MW with 2.0 MW Turbines
Cost Analysis and Payback Period
Production (MWh)
Total Revenue
Total Cost
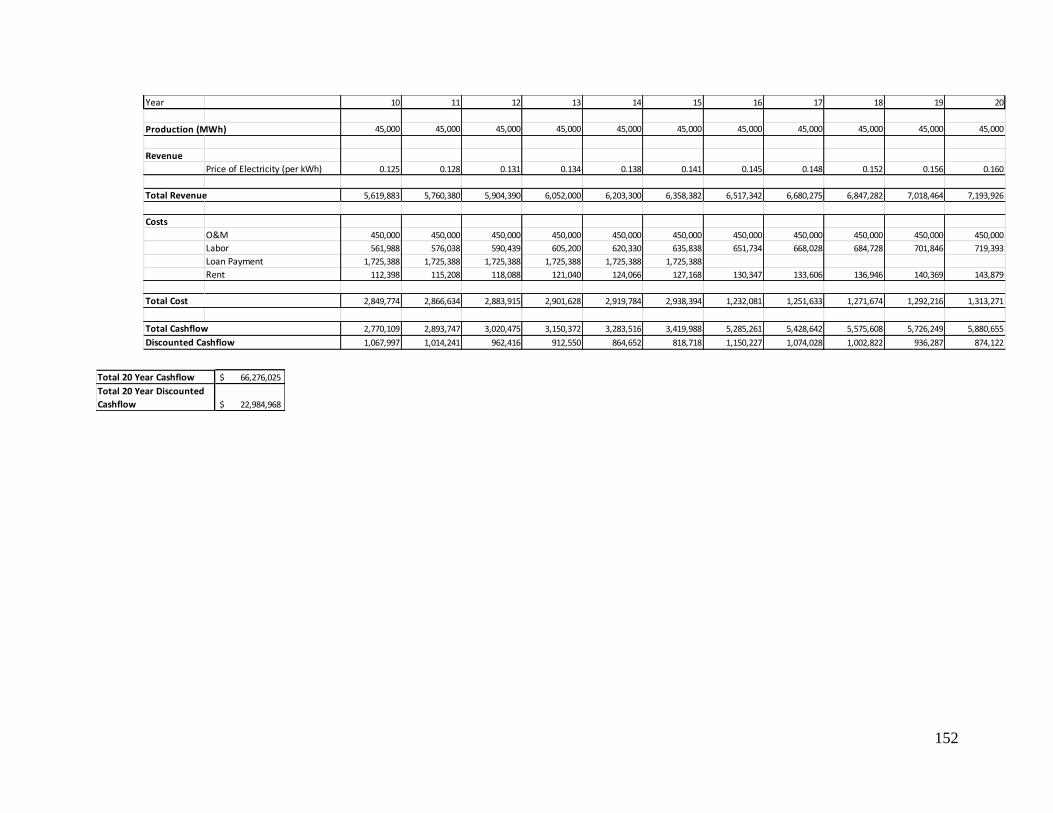
152
66,276,025$
22,984,968$
Total 20 Year Cashflow
Total 20 Year Discounted
Cashflow
Year 10 11 12 13 14 15 16 17 18 19 20
45,000 45,000 45,000 45,000 45,000 45,000 45,000 45,000 45,000 45,000 45,000
Revenue
Price of Electricity (per kWh) 0.125 0.128 0.131 0.134 0.138 0.141 0.145 0.148 0.152 0.156 0.160
5,619,883 5,760,380 5,904,390 6,052,000 6,203,300 6,358,382 6,517,342 6,680,275 6,847,282 7,018,464 7,193,926
Costs
O&M 450,000 450,000 450,000 450,000 450,000 450,000 450,000 450,000 450,000 450,000 450,000
Labor 561,988 576,038 590,439 605,200 620,330 635,838 651,734 668,028 684,728 701,846 719,393
Loan Payment 1,725,388 1,725,388 1,725,388 1,725,388 1,725,388 1,725,388
Rent 112,398 115,208 118,088 121,040 124,066 127,168 130,347 133,606 136,946 140,369 143,879
2,849,774 2,866,634 2,883,915 2,901,628 2,919,784 2,938,394 1,232,081 1,251,633 1,271,674 1,292,216 1,313,271
2,770,109 2,893,747 3,020,475 3,150,372 3,283,516 3,419,988 5,285,261 5,428,642 5,575,608 5,726,249 5,880,655
1,067,997 1,014,241 962,416 912,550 864,652 818,718 1,150,227 1,074,028 1,002,822 936,287 874,122
Production (MWh)
Total Revenue
Total Cost
Total Cashflow
Discounted Cashflow
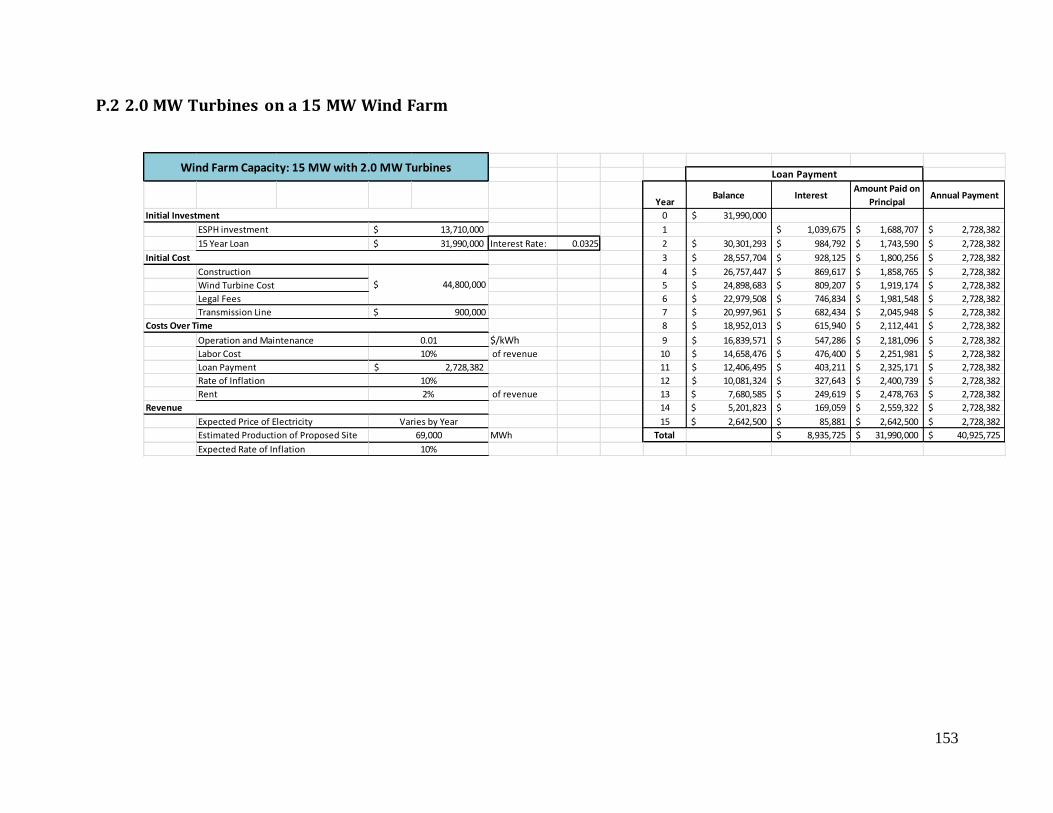
153
P.2 2.0 MW Turbines on a 15 MW Wind Farm
YearBalance Interest
Amount Paid on
PrincipalAnnual Payment
0 31,990,000$
1 1,039,675$ 1,688,707$ 2,728,382$
Interest Rate: 0.0325 2 30,301,293$ 984,792$ 1,743,590$ 2,728,382$
3 28,557,704$ 928,125$ 1,800,256$ 2,728,382$
4 26,757,447$ 869,617$ 1,858,765$ 2,728,382$
5 24,898,683$ 809,207$ 1,919,174$ 2,728,382$
6 22,979,508$ 746,834$ 1,981,548$ 2,728,382$
7 20,997,961$ 682,434$ 2,045,948$ 2,728,382$
8 18,952,013$ 615,940$ 2,112,441$ 2,728,382$
$/kWh 9 16,839,571$ 547,286$ 2,181,096$ 2,728,382$
of revenue 10 14,658,476$ 476,400$ 2,251,981$ 2,728,382$
11 12,406,495$ 403,211$ 2,325,171$ 2,728,382$
12 10,081,324$ 327,643$ 2,400,739$ 2,728,382$
of revenue 13 7,680,585$ 249,619$ 2,478,763$ 2,728,382$
14 5,201,823$ 169,059$ 2,559,322$ 2,728,382$
15 2,642,500$ 85,881$ 2,642,500$ 2,728,382$
MWh Total 8,935,725$ 31,990,000$ 40,925,725$
Loan Payment
Initial Investment
ESPH investment 13,710,000$
15 Year Loan 31,990,000$
10%
Loan Payment 2,728,382$
Initial Cost
Construction
$ 44,800,000 Wind Turbine Cost
Legal Fees
Transmission Line $ 900,000
Estimated Production of Proposed Site 69,000
Expected Rate of Inflation 10%
Wind Farm Capacity: 15 MW with 2.0 MW Turbines
Rate of Inflation 10%
Rent 2%
Revenue
Expected Price of Electricity Varies by Year
Costs Over Time
Operation and Maintenance 0.01
Labor Cost

154
Year 1 2 3 4 5 6 7 8 9
69,000 69,000 69,000 69,000 69,000 69,000 69,000 69,000 69,000
Revenue
Price of Electricity (per kWh) 0.100 0.103 0.105 0.108 0.110 0.113 0.116 0.119 0.122
6,900,000 7,072,500 7,249,313 7,430,545 7,616,309 7,806,717 8,001,885 8,201,932 8,406,980
Costs
O&M 690,000 690,000 690,000 690,000 690,000 690,000 690,000 690,000 690,000
Labor 690,000 707,250 724,931 743,055 761,631 780,672 800,188 820,193 840,698
Loan Payment 2,728,382 2,728,382 2,728,382 2,728,382 2,728,382 2,728,382 2,728,382 2,728,382 2,728,382
Rent 138,000 141,450 144,986 148,611 152,326 156,134 160,038 164,039 168,140
4,246,382 4,267,082 4,288,299 4,310,047 4,332,339 4,355,188 4,378,608 4,402,613 4,427,219
2,653,618 2,805,418 2,961,013 3,120,498 3,283,970 3,451,529 3,623,277 3,799,318 3,979,761
2,412,380 2,318,528 2,224,653 2,131,342 2,039,087 1,948,298 1,859,314 1,772,410 1,687,807
13,710,000$ 11,297,620$ 8,979,092$ 6,754,439$ 4,623,097$ 2,584,010$ 635,711$
Total Cashflow
Discounted Cashflow
ESPH Initial Investment
Payback
Wind Farm Capacity: 15 MW with 2.0 MW Turbines
Cost Analysis and Payback Period
Production (MWh)
Total Revenue
Total Cost
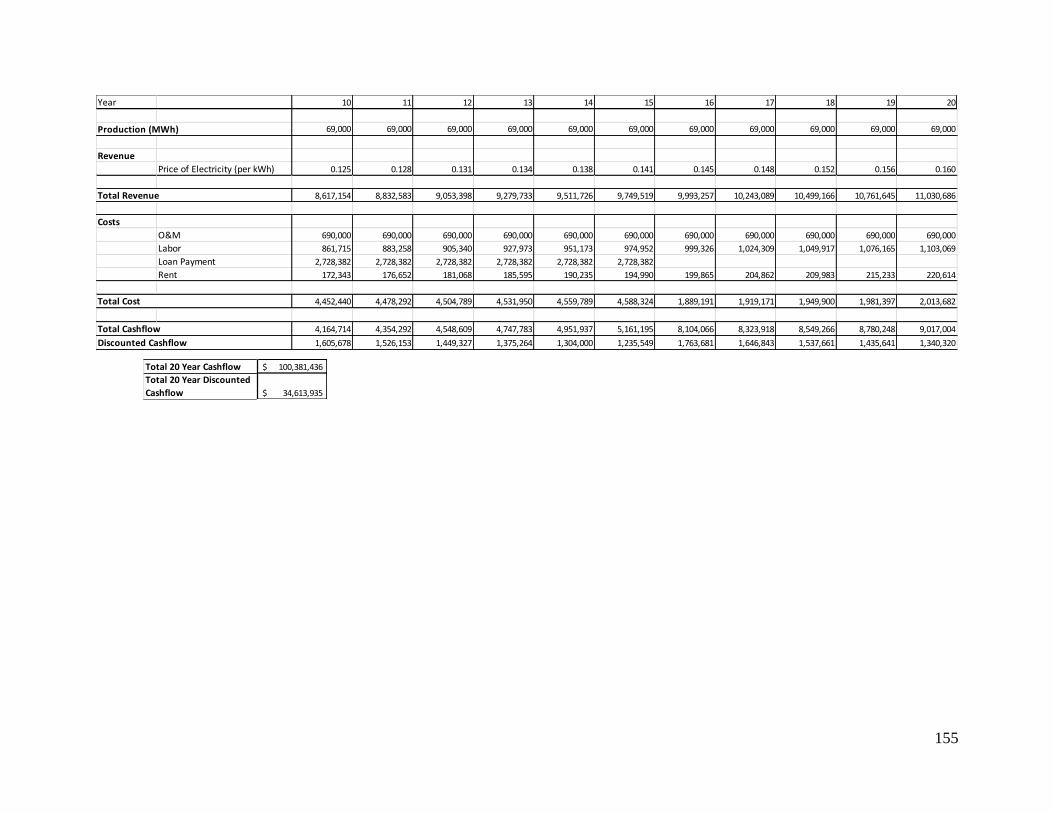
155
Year 10 11 12 13 14 15 16 17 18 19 20
69,000 69,000 69,000 69,000 69,000 69,000 69,000 69,000 69,000 69,000 69,000
Revenue
Price of Electricity (per kWh) 0.125 0.128 0.131 0.134 0.138 0.141 0.145 0.148 0.152 0.156 0.160
8,617,154 8,832,583 9,053,398 9,279,733 9,511,726 9,749,519 9,993,257 10,243,089 10,499,166 10,761,645 11,030,686
Costs
O&M 690,000 690,000 690,000 690,000 690,000 690,000 690,000 690,000 690,000 690,000 690,000
Labor 861,715 883,258 905,340 927,973 951,173 974,952 999,326 1,024,309 1,049,917 1,076,165 1,103,069
Loan Payment 2,728,382 2,728,382 2,728,382 2,728,382 2,728,382 2,728,382
Rent 172,343 176,652 181,068 185,595 190,235 194,990 199,865 204,862 209,983 215,233 220,614
4,452,440 4,478,292 4,504,789 4,531,950 4,559,789 4,588,324 1,889,191 1,919,171 1,949,900 1,981,397 2,013,682
4,164,714 4,354,292 4,548,609 4,747,783 4,951,937 5,161,195 8,104,066 8,323,918 8,549,266 8,780,248 9,017,004
1,605,678 1,526,153 1,449,327 1,375,264 1,304,000 1,235,549 1,763,681 1,646,843 1,537,661 1,435,641 1,340,320
Production (MWh)
Total Revenue
Total Cost
Total Cashflow
Discounted Cashflow
100,381,436$
34,613,935$
Total 20 Year Cashflow
Total 20 Year Discounted
Cashflow
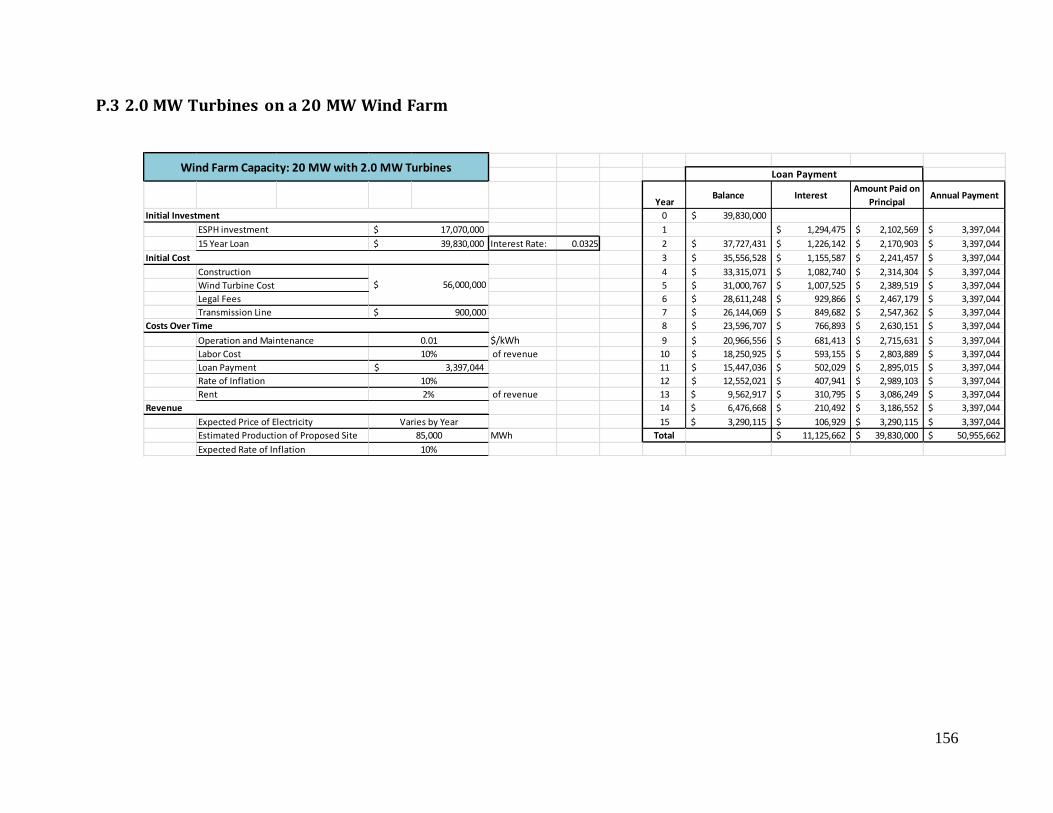
156
P.3 2.0 MW Turbines on a 20 MW Wind Farm
YearBalance Interest
Amount Paid on
PrincipalAnnual Payment
0 39,830,000$
1 1,294,475$ 2,102,569$ 3,397,044$
Interest Rate: 0.0325 2 37,727,431$ 1,226,142$ 2,170,903$ 3,397,044$
3 35,556,528$ 1,155,587$ 2,241,457$ 3,397,044$
4 33,315,071$ 1,082,740$ 2,314,304$ 3,397,044$
5 31,000,767$ 1,007,525$ 2,389,519$ 3,397,044$
6 28,611,248$ 929,866$ 2,467,179$ 3,397,044$
7 26,144,069$ 849,682$ 2,547,362$ 3,397,044$
8 23,596,707$ 766,893$ 2,630,151$ 3,397,044$
$/kWh 9 20,966,556$ 681,413$ 2,715,631$ 3,397,044$
of revenue 10 18,250,925$ 593,155$ 2,803,889$ 3,397,044$
11 15,447,036$ 502,029$ 2,895,015$ 3,397,044$
12 12,552,021$ 407,941$ 2,989,103$ 3,397,044$
of revenue 13 9,562,917$ 310,795$ 3,086,249$ 3,397,044$
14 6,476,668$ 210,492$ 3,186,552$ 3,397,044$
15 3,290,115$ 106,929$ 3,290,115$ 3,397,044$
MWh Total 11,125,662$ 39,830,000$ 50,955,662$
Loan Payment
$ 56,000,000
2%
Initial Investment
Initial Cost
Costs Over Time
Operation and Maintenance
Labor Cost
Loan Payment
Rate of Inflation
0.01
10%
10%
3,397,044$
$ 900,000
Wind Turbine Cost
Estimated Production of Proposed Site
Expected Rate of Inflation 10%
85,000
Varies by Year
Legal Fees
Transmission Line
Revenue
Rent
Expected Price of Electricity
17,070,000$
39,830,000$
Wind Farm Capacity: 20 MW with 2.0 MW Turbines
Construction
ESPH investment
15 Year Loan

157
Year 1 2 3 4 5 6 7 8 9
85,000 85,000 85,000 85,000 85,000 85,000 85,000 85,000 85,000
Revenue
Price of Electricity (per kWh) 0.100 0.103 0.105 0.108 0.110 0.113 0.116 0.119 0.122
8,500,000 8,712,500 8,930,313 9,153,570 9,382,410 9,616,970 9,857,394 10,103,829 10,356,425
Costs
O&M 850,000 850,000 850,000 850,000 850,000 850,000 850,000 850,000 850,000
Labor 850,000 871,250 893,031 915,357 938,241 961,697 985,739 1,010,383 1,035,642
Loan Payment 3,397,044 3,397,044 3,397,044 3,397,044 3,397,044 3,397,044 3,397,044 3,397,044 3,397,044
Rent 170,000 174,250 178,606 183,071 187,648 192,339 197,148 202,077 207,128
5,267,044 5,292,544 5,318,682 5,345,473 5,372,933 5,401,081 5,429,931 5,459,504 5,489,815
3,232,956 3,419,956 3,611,631 3,808,098 4,009,476 4,215,889 4,427,463 4,644,325 4,866,610
2,939,051 2,826,410 2,713,472 2,600,982 2,489,569 2,379,760 2,271,988 2,166,612 2,063,918
17,070,000$ 14,130,949$ 11,304,539$ 8,591,068$ 5,990,086$ 3,500,516$ 1,120,757$
Total Cashflow
Discounted Cashflow
ESPH Initial Investment
Payback
Wind Farm Capacity: 20 MW with 2.0 MW Turbines
Cost Analysis and Payback Period
Production (MWh)
Total Revenue
Total Cost

158
Year 10 11 12 13 14 15 16 17 18 19 20
85,000 85,000 85,000 85,000 85,000 85,000 85,000 85,000 85,000 85,000 85,000
Revenue
Price of Electricity (per kWh) 0.125 0.128 0.131 0.134 0.138 0.141 0.145 0.148 0.152 0.156 0.160
10,615,335 10,880,719 11,152,737 11,431,555 11,717,344 12,010,277 12,310,534 12,618,298 12,933,755 13,257,099 13,588,527
Costs
O&M 850,000 850,000 850,000 850,000 850,000 850,000 850,000 850,000 850,000 850,000 850,000
Labor 1,061,534 1,088,072 1,115,274 1,143,156 1,171,734 1,201,028 1,231,053 1,261,830 1,293,376 1,325,710 1,358,853
Loan Payment 3,397,044 3,397,044 3,397,044 3,397,044 3,397,044 3,397,044
Rent 212,307 217,614 223,055 228,631 234,347 240,206 246,211 252,366 258,675 265,142 271,771
5,520,884 5,552,730 5,585,373 5,618,831 5,653,125 5,688,277 2,327,264 2,364,196 2,402,051 2,440,852 2,480,623
5,094,451 5,327,988 5,567,364 5,812,724 6,064,218 6,322,000 9,983,270 10,254,102 10,531,705 10,816,247 11,107,903
1,964,131 1,867,427 1,773,934 1,683,739 1,596,898 1,513,437 2,172,650 2,028,719 1,894,220 1,768,543 1,651,119
Production (MWh)
Total Revenue
Total Cost
Total Cashflow
Discounted Cashflow
123,118,377$
42,366,579$
Total 20 Year Cashflow
Total 20 Year Discounted
Cashflow

159
Appendix Q - Financial Analysis of 2.3 MW Turbines
Q.1 2.3 MW Turbines on a 10 MW Wind Farm
YearBalance Interest
Amount Paid on
PrincipalAnnual Payment
0 18,662,000$
1 606,515$ 985,140$ 1,591,655$
Interest Rate: 0.0325 2 17,676,860$ 574,498$ 1,017,158$ 1,591,655$
3 16,659,702$ 541,440$ 1,050,215$ 1,591,655$
4 15,609,487$ 507,308$ 1,084,347$ 1,591,655$
5 14,525,140$ 472,067$ 1,119,588$ 1,591,655$
6 13,405,551$ 435,680$ 1,155,975$ 1,591,655$
7 12,249,576$ 398,111$ 1,193,544$ 1,591,655$
8 11,056,032$ 359,321$ 1,232,334$ 1,591,655$
$/kWh 9 9,823,697$ 319,270$ 1,272,385$ 1,591,655$
of revenue 10 8,551,312$ 277,918$ 1,313,738$ 1,591,655$
11 7,237,574$ 235,221$ 1,356,434$ 1,591,655$
12 5,881,140$ 191,137$ 1,400,518$ 1,591,655$
of revenue 13 4,480,622$ 145,620$ 1,446,035$ 1,591,655$
14 3,034,586$ 98,624$ 1,493,031$ 1,591,655$
15 1,541,555$ 50,101$ 1,541,555$ 1,591,655$
MWh Total 5,212,832$ 18,662,000$ 23,874,832$
Loan Payment
Initial Investment
ESPH investment 7,998,000$
15 Year Loan 18,662,000$
10%
Loan Payment 1,591,655$
Initial Cost
Construction
$ 25,760,000 Wind Turbine Cost
Legal Fees
Transmission Line $ 900,000
Estimated Production of Proposed Site 39,000
Expected Rate of Inflation 10%
Wind Farm Capacity: 10 MW with 2.3 MW Turbines
Rate of Inflation 10%
Rent 2%
Revenue
Expected Price of Electricity Varies by Year
Costs Over Time
Operation and Maintenance 0.01
Labor Cost
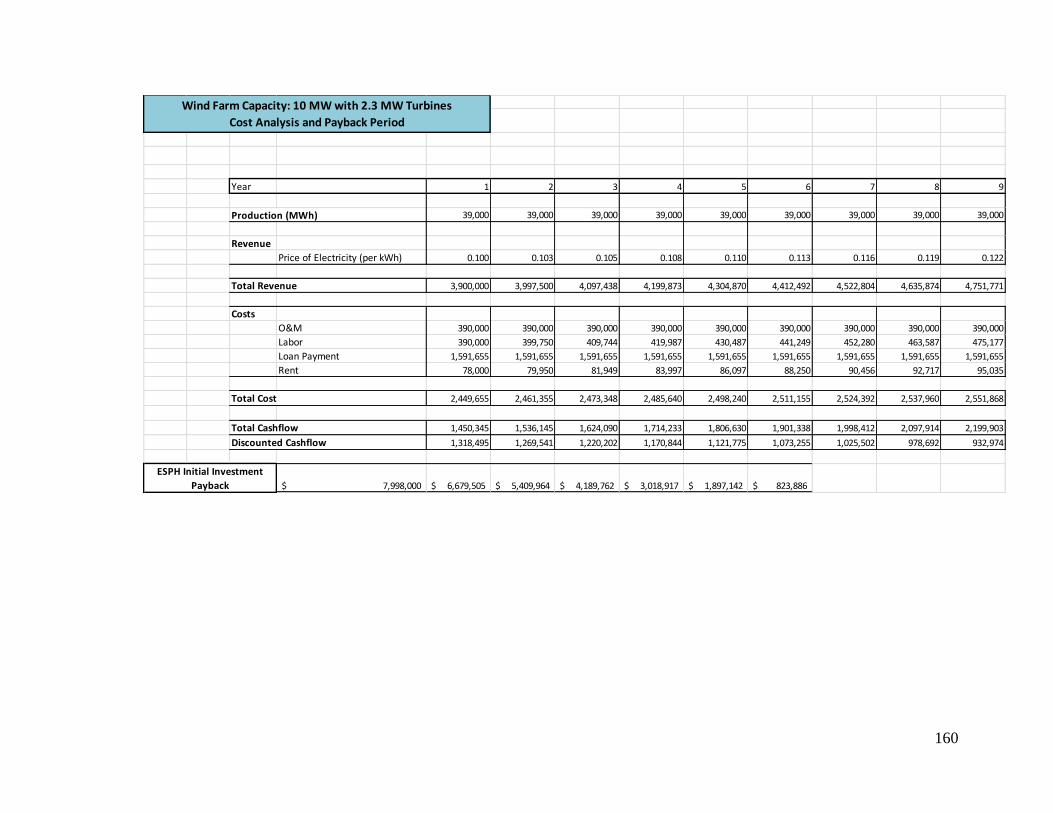
160
Year 1 2 3 4 5 6 7 8 9
39,000 39,000 39,000 39,000 39,000 39,000 39,000 39,000 39,000
Revenue
Price of Electricity (per kWh) 0.100 0.103 0.105 0.108 0.110 0.113 0.116 0.119 0.122
3,900,000 3,997,500 4,097,438 4,199,873 4,304,870 4,412,492 4,522,804 4,635,874 4,751,771
Costs
O&M 390,000 390,000 390,000 390,000 390,000 390,000 390,000 390,000 390,000
Labor 390,000 399,750 409,744 419,987 430,487 441,249 452,280 463,587 475,177
Loan Payment 1,591,655 1,591,655 1,591,655 1,591,655 1,591,655 1,591,655 1,591,655 1,591,655 1,591,655
Rent 78,000 79,950 81,949 83,997 86,097 88,250 90,456 92,717 95,035
2,449,655 2,461,355 2,473,348 2,485,640 2,498,240 2,511,155 2,524,392 2,537,960 2,551,868
1,450,345 1,536,145 1,624,090 1,714,233 1,806,630 1,901,338 1,998,412 2,097,914 2,199,903
1,318,495 1,269,541 1,220,202 1,170,844 1,121,775 1,073,255 1,025,502 978,692 932,974
7,998,000$ 6,679,505$ 5,409,964$ 4,189,762$ 3,018,917$ 1,897,142$ 823,886$
Total Cashflow
Discounted Cashflow
ESPH Initial Investment
Payback
Wind Farm Capacity: 10 MW with 2.3 MW Turbines
Cost Analysis and Payback Period
Production (MWh)
Total Revenue
Total Cost

161
Year 10 11 12 13 14 15 16 17 18 19 20
39,000 39,000 39,000 39,000 39,000 39,000 39,000 39,000 39,000 39,000 39,000
Revenue
Price of Electricity (per kWh) 0.125 0.128 0.131 0.134 0.138 0.141 0.145 0.148 0.152 0.156 0.160
4,870,566 4,992,330 5,117,138 5,245,066 5,376,193 5,510,598 5,648,363 5,789,572 5,934,311 6,082,669 6,234,736
Costs
O&M 390,000 390,000 390,000 390,000 390,000 390,000 390,000 390,000 390,000 390,000 390,000
Labor 487,057 499,233 511,714 524,507 537,619 551,060 564,836 578,957 593,431 608,267 623,474
Loan Payment 1,591,655 1,591,655 1,591,655 1,591,655 1,591,655 1,591,655
Rent 97,411 99,847 102,343 104,901 107,524 110,212 112,967 115,791 118,686 121,653 124,695
2,566,123 2,580,735 2,595,712 2,611,063 2,626,799 2,642,927 1,067,804 1,084,749 1,102,117 1,119,920 1,138,168
2,304,442 2,411,595 2,521,426 2,634,003 2,749,394 2,867,671 4,580,559 4,704,823 4,832,194 4,962,749 5,096,567
888,462 845,249 803,404 762,977 724,001 686,498 996,863 930,824 869,113 811,449 757,572
Production (MWh)
Total Revenue
Total Cost
Total Cashflow
Discounted Cashflow
55,994,433$
19,187,694$
Total 20 Year Cashflow
Total 20 Year Discounted
Cashflow
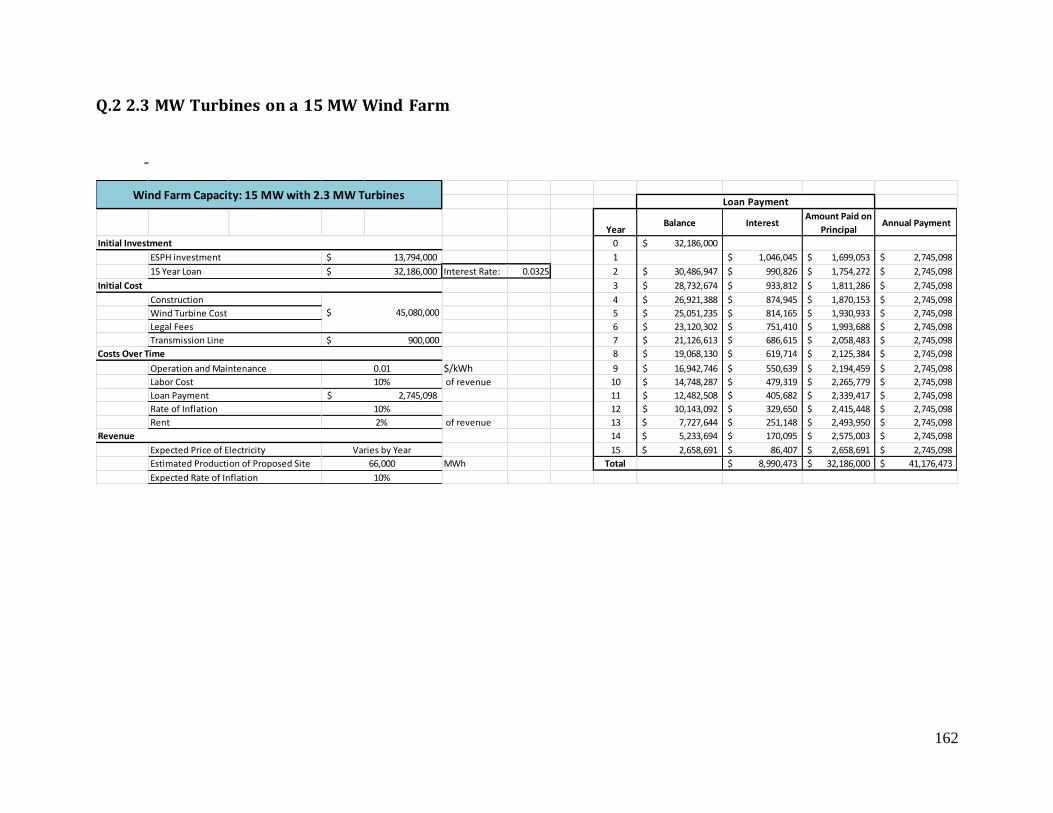
162
Q.2 2.3 MW Turbines on a 15 MW Wind Farm
-
YearBalance Interest
Amount Paid on
PrincipalAnnual Payment
0 32,186,000$
1 1,046,045$ 1,699,053$ 2,745,098$
Interest Rate: 0.0325 2 30,486,947$ 990,826$ 1,754,272$ 2,745,098$
3 28,732,674$ 933,812$ 1,811,286$ 2,745,098$
4 26,921,388$ 874,945$ 1,870,153$ 2,745,098$
5 25,051,235$ 814,165$ 1,930,933$ 2,745,098$
6 23,120,302$ 751,410$ 1,993,688$ 2,745,098$
7 21,126,613$ 686,615$ 2,058,483$ 2,745,098$
8 19,068,130$ 619,714$ 2,125,384$ 2,745,098$
$/kWh 9 16,942,746$ 550,639$ 2,194,459$ 2,745,098$
of revenue 10 14,748,287$ 479,319$ 2,265,779$ 2,745,098$
11 12,482,508$ 405,682$ 2,339,417$ 2,745,098$
12 10,143,092$ 329,650$ 2,415,448$ 2,745,098$
of revenue 13 7,727,644$ 251,148$ 2,493,950$ 2,745,098$
14 5,233,694$ 170,095$ 2,575,003$ 2,745,098$
15 2,658,691$ 86,407$ 2,658,691$ 2,745,098$
MWh Total 8,990,473$ 32,186,000$ 41,176,473$
Loan Payment
Initial Investment
ESPH investment 13,794,000$
15 Year Loan 32,186,000$
10%
Loan Payment 2,745,098$
Initial Cost
Construction
$ 45,080,000 Wind Turbine Cost
Legal Fees
Transmission Line $ 900,000
Estimated Production of Proposed Site 66,000
Expected Rate of Inflation 10%
Wind Farm Capacity: 15 MW with 2.3 MW Turbines
Rate of Inflation 10%
Rent 2%
Revenue
Expected Price of Electricity Varies by Year
Costs Over Time
Operation and Maintenance 0.01
Labor Cost
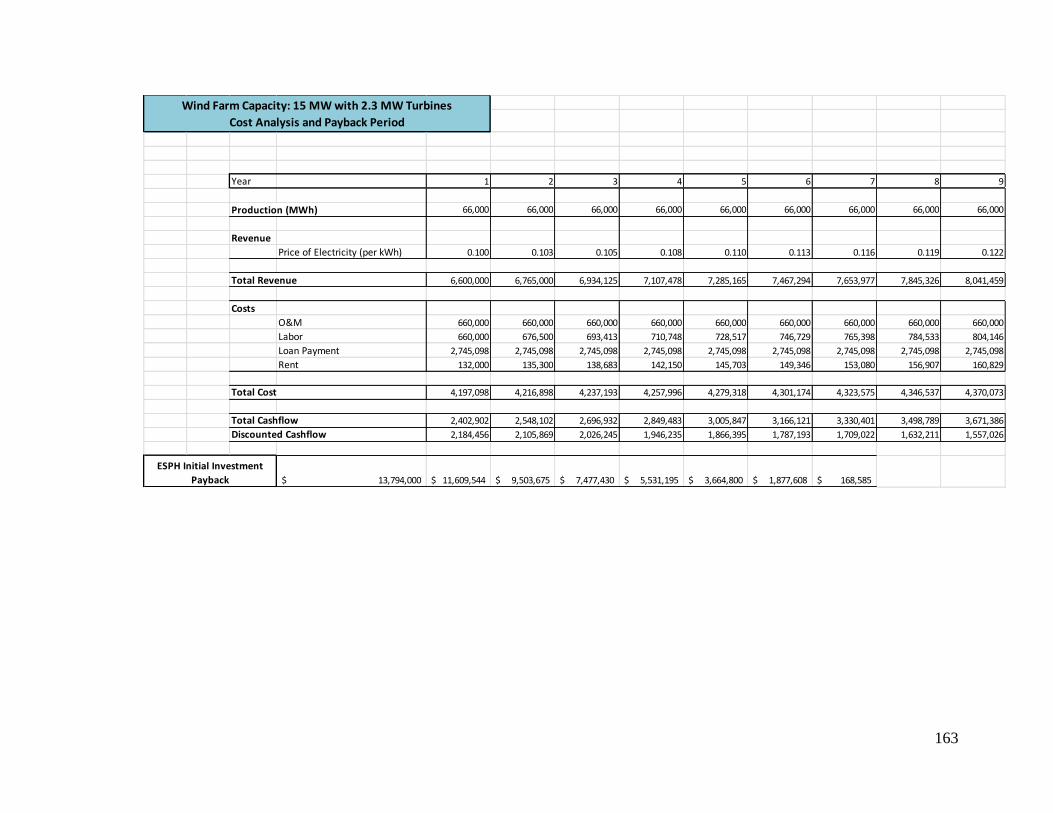
163
Year 1 2 3 4 5 6 7 8 9
66,000 66,000 66,000 66,000 66,000 66,000 66,000 66,000 66,000
Revenue
Price of Electricity (per kWh) 0.100 0.103 0.105 0.108 0.110 0.113 0.116 0.119 0.122
6,600,000 6,765,000 6,934,125 7,107,478 7,285,165 7,467,294 7,653,977 7,845,326 8,041,459
Costs
O&M 660,000 660,000 660,000 660,000 660,000 660,000 660,000 660,000 660,000
Labor 660,000 676,500 693,413 710,748 728,517 746,729 765,398 784,533 804,146
Loan Payment 2,745,098 2,745,098 2,745,098 2,745,098 2,745,098 2,745,098 2,745,098 2,745,098 2,745,098
Rent 132,000 135,300 138,683 142,150 145,703 149,346 153,080 156,907 160,829
4,197,098 4,216,898 4,237,193 4,257,996 4,279,318 4,301,174 4,323,575 4,346,537 4,370,073
2,402,902 2,548,102 2,696,932 2,849,483 3,005,847 3,166,121 3,330,401 3,498,789 3,671,386
2,184,456 2,105,869 2,026,245 1,946,235 1,866,395 1,787,193 1,709,022 1,632,211 1,557,026
13,794,000$ 11,609,544$ 9,503,675$ 7,477,430$ 5,531,195$ 3,664,800$ 1,877,608$ 168,585$
Total Cashflow
Discounted Cashflow
ESPH Initial Investment
Payback
Wind Farm Capacity: 15 MW with 2.3 MW Turbines
Cost Analysis and Payback Period
Production (MWh)
Total Revenue
Total Cost

164
Year 10 11 12 13 14 15 16 17 18 19 20
66,000 66,000 66,000 66,000 66,000 66,000 66,000 66,000 66,000 66,000 66,000
Revenue
Price of Electricity (per kWh) 0.125 0.128 0.131 0.134 0.138 0.141 0.145 0.148 0.152 0.156 0.160
8,242,496 8,448,558 8,659,772 8,876,266 9,098,173 9,325,627 9,558,768 9,797,737 10,042,681 10,293,748 10,551,091
Costs
O&M 660,000 660,000 660,000 660,000 660,000 660,000 660,000 660,000 660,000 660,000 660,000
Labor 824,250 844,856 865,977 887,627 909,817 932,563 955,877 979,774 1,004,268 1,029,375 1,055,109
Loan Payment 2,745,098 2,745,098 2,745,098 2,745,098 2,745,098 2,745,098
Rent 164,850 168,971 173,195 177,525 181,963 186,513 191,175 195,955 200,854 205,875 211,022
4,394,198 4,418,925 4,444,271 4,470,250 4,496,879 4,524,173 1,807,052 1,835,728 1,865,122 1,895,250 1,926,131
3,848,298 4,029,633 4,215,501 4,406,016 4,601,294 4,801,454 7,751,716 7,962,009 8,177,559 8,398,498 8,624,960
1,483,685 1,412,362 1,343,189 1,276,266 1,211,664 1,149,430 1,686,999 1,575,241 1,470,806 1,373,222 1,282,045
Production (MWh)
Total Revenue
Total Cost
Total Cashflow
Discounted Cashflow
93,986,898$
32,079,560$
Total 20 Year CashflowTotal 20 Year Discounted
Cashflow

165
Q.3 2.3 MW Turbines on a 20 MW Wind Farm
YearBalance Interest
Amount Paid on
PrincipalAnnual Payment
0 41,202,000$
1 1,339,065$ 2,174,995$ 3,514,060$
Interest Rate: 0.0325 2 39,027,005$ 1,268,378$ 2,245,682$ 3,514,060$
3 36,781,323$ 1,195,393$ 2,318,667$ 3,514,060$
4 34,462,655$ 1,120,036$ 2,394,024$ 3,514,060$
5 32,068,632$ 1,042,231$ 2,471,830$ 3,514,060$
6 29,596,802$ 961,896$ 2,552,164$ 3,514,060$
7 27,044,638$ 878,951$ 2,635,109$ 3,514,060$
8 24,409,529$ 793,310$ 2,720,750$ 3,514,060$
$/kWh 9 21,688,778$ 704,885$ 2,809,175$ 3,514,060$
of revenue 10 18,879,604$ 613,587$ 2,900,473$ 3,514,060$
11 15,979,131$ 519,322$ 2,994,738$ 3,514,060$
12 12,984,392$ 421,993$ 3,092,067$ 3,514,060$
of revenue 13 9,892,325$ 321,501$ 3,192,559$ 3,514,060$
14 6,699,766$ 217,742$ 3,296,318$ 3,514,060$
15 3,403,448$ 110,612$ 3,403,448$ 3,514,060$
MWh Total 11,508,901$ 41,202,000$ 52,710,901$
Loan Payment
$ 57,960,000
2%
Initial Investment
Initial Cost
Costs Over Time
Operation and Maintenance
Labor Cost
Loan Payment
Rate of Inflation
0.01
10%
10%
3,514,060$
$ 900,000
Wind Turbine Cost
Estimated Production of Proposed Site
Expected Rate of Inflation 10%
84,000
Varies by Year
Legal Fees
Transmission Line
Revenue
Rent
Expected Price of Electricity
17,658,000$
41,202,000$
Wind Farm Capacity: 20 MW with 2.3 MW Turbines
Construction
ESPH investment
15 Year Loan
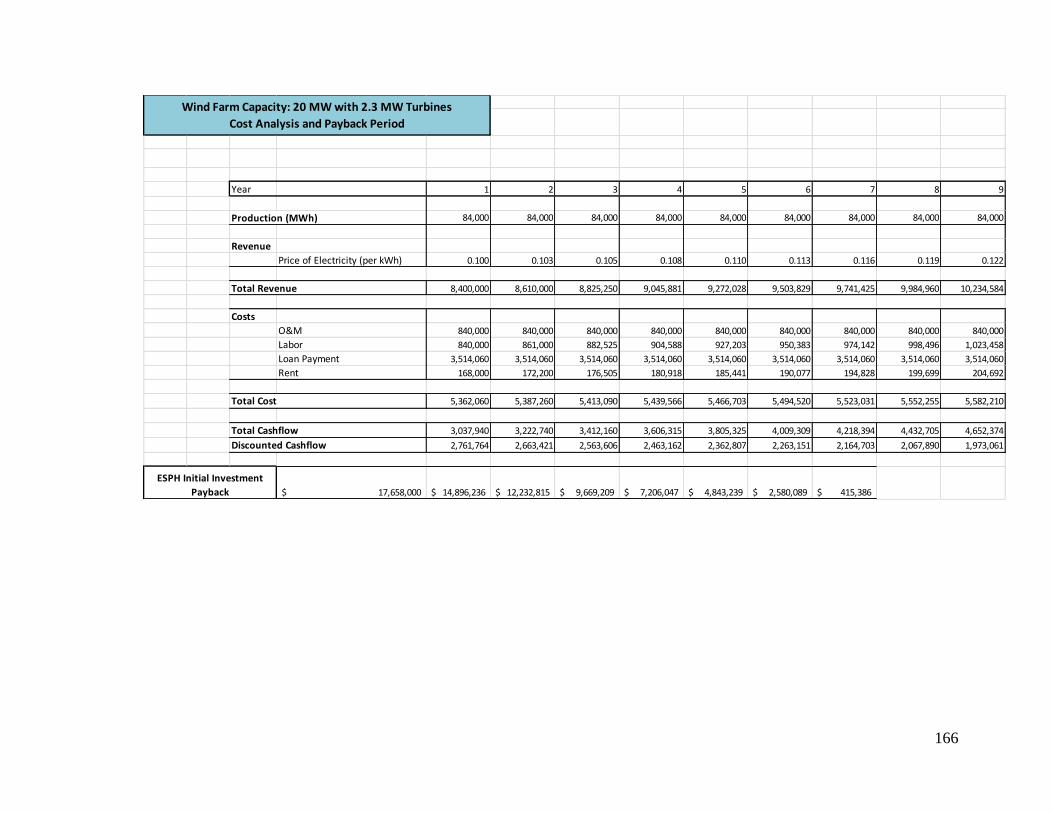
166
Year 1 2 3 4 5 6 7 8 9
84,000 84,000 84,000 84,000 84,000 84,000 84,000 84,000 84,000
Revenue
Price of Electricity (per kWh) 0.100 0.103 0.105 0.108 0.110 0.113 0.116 0.119 0.122
8,400,000 8,610,000 8,825,250 9,045,881 9,272,028 9,503,829 9,741,425 9,984,960 10,234,584
Costs
O&M 840,000 840,000 840,000 840,000 840,000 840,000 840,000 840,000 840,000
Labor 840,000 861,000 882,525 904,588 927,203 950,383 974,142 998,496 1,023,458
Loan Payment 3,514,060 3,514,060 3,514,060 3,514,060 3,514,060 3,514,060 3,514,060 3,514,060 3,514,060
Rent 168,000 172,200 176,505 180,918 185,441 190,077 194,828 199,699 204,692
5,362,060 5,387,260 5,413,090 5,439,566 5,466,703 5,494,520 5,523,031 5,552,255 5,582,210
3,037,940 3,222,740 3,412,160 3,606,315 3,805,325 4,009,309 4,218,394 4,432,705 4,652,374
2,761,764 2,663,421 2,563,606 2,463,162 2,362,807 2,263,151 2,164,703 2,067,890 1,973,061
17,658,000$ 14,896,236$ 12,232,815$ 9,669,209$ 7,206,047$ 4,843,239$ 2,580,089$ 415,386$
Total Cashflow
Discounted Cashflow
ESPH Initial Investment
Payback
Wind Farm Capacity: 20 MW with 2.3 MW Turbines
Cost Analysis and Payback Period
Production (MWh)
Total Revenue
Total Cost
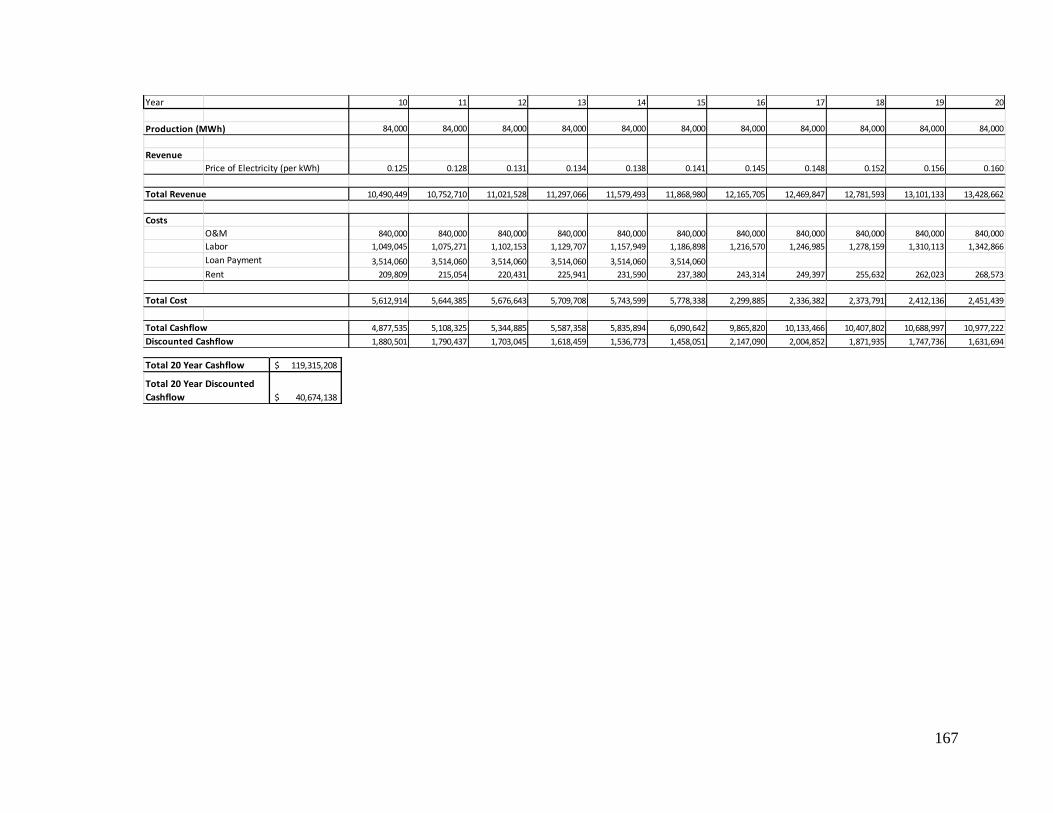
167
Year 10 11 12 13 14 15 16 17 18 19 20
84,000 84,000 84,000 84,000 84,000 84,000 84,000 84,000 84,000 84,000 84,000
Revenue
Price of Electricity (per kWh) 0.125 0.128 0.131 0.134 0.138 0.141 0.145 0.148 0.152 0.156 0.160
10,490,449 10,752,710 11,021,528 11,297,066 11,579,493 11,868,980 12,165,705 12,469,847 12,781,593 13,101,133 13,428,662
Costs
O&M 840,000 840,000 840,000 840,000 840,000 840,000 840,000 840,000 840,000 840,000 840,000
Labor 1,049,045 1,075,271 1,102,153 1,129,707 1,157,949 1,186,898 1,216,570 1,246,985 1,278,159 1,310,113 1,342,866
Loan Payment 3,514,060 3,514,060 3,514,060 3,514,060 3,514,060 3,514,060
Rent 209,809 215,054 220,431 225,941 231,590 237,380 243,314 249,397 255,632 262,023 268,573
5,612,914 5,644,385 5,676,643 5,709,708 5,743,599 5,778,338 2,299,885 2,336,382 2,373,791 2,412,136 2,451,439
4,877,535 5,108,325 5,344,885 5,587,358 5,835,894 6,090,642 9,865,820 10,133,466 10,407,802 10,688,997 10,977,222
1,880,501 1,790,437 1,703,045 1,618,459 1,536,773 1,458,051 2,147,090 2,004,852 1,871,935 1,747,736 1,631,694
Production (MWh)
Total Revenue
Total Cost
Total Cashflow
Discounted Cashflow
119,315,208$
40,674,138$
Total 20 Year Cashflow
Total 20 Year Discounted
Cashflow
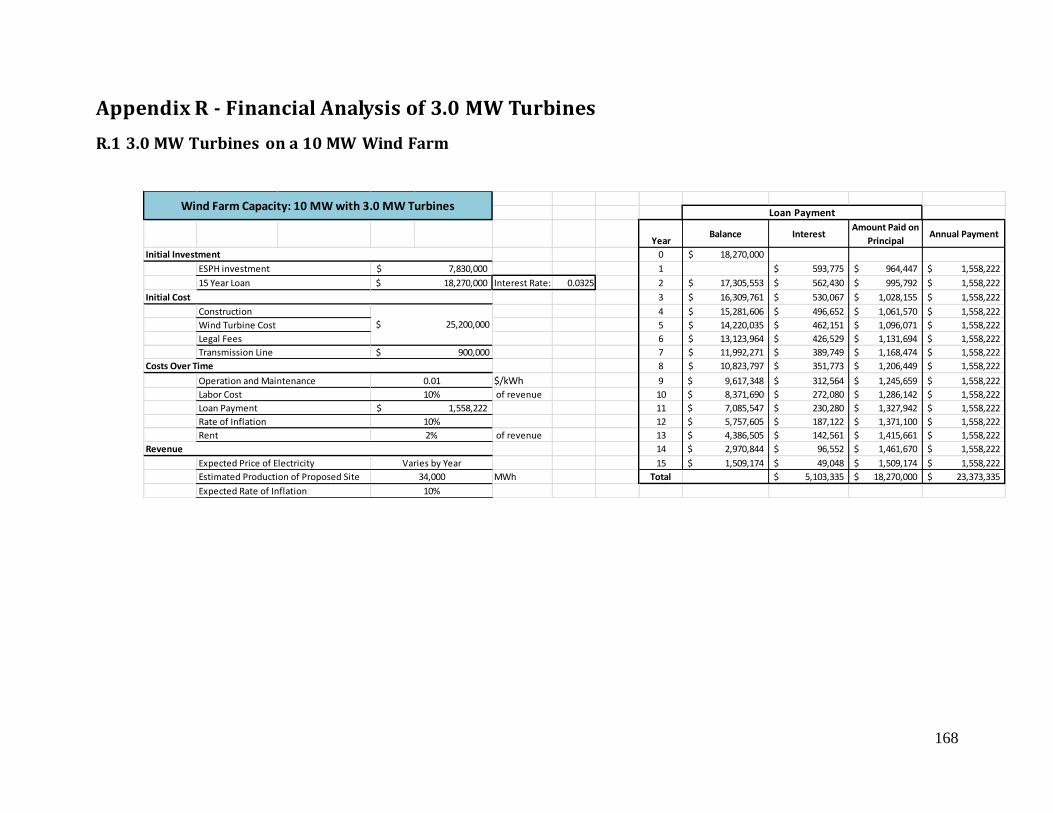
168
Appendix R - Financial Analysis of 3.0 MW Turbines
R.1 3.0 MW Turbines on a 10 MW Wind Farm
YearBalance Interest
Amount Paid on
PrincipalAnnual Payment
0 18,270,000$
1 593,775$ 964,447$ 1,558,222$
Interest Rate: 0.0325 2 17,305,553$ 562,430$ 995,792$ 1,558,222$
3 16,309,761$ 530,067$ 1,028,155$ 1,558,222$
4 15,281,606$ 496,652$ 1,061,570$ 1,558,222$
5 14,220,035$ 462,151$ 1,096,071$ 1,558,222$
6 13,123,964$ 426,529$ 1,131,694$ 1,558,222$
7 11,992,271$ 389,749$ 1,168,474$ 1,558,222$
8 10,823,797$ 351,773$ 1,206,449$ 1,558,222$
$/kWh 9 9,617,348$ 312,564$ 1,245,659$ 1,558,222$
of revenue 10 8,371,690$ 272,080$ 1,286,142$ 1,558,222$
11 7,085,547$ 230,280$ 1,327,942$ 1,558,222$
12 5,757,605$ 187,122$ 1,371,100$ 1,558,222$
of revenue 13 4,386,505$ 142,561$ 1,415,661$ 1,558,222$
14 2,970,844$ 96,552$ 1,461,670$ 1,558,222$
15 1,509,174$ 49,048$ 1,509,174$ 1,558,222$
MWh Total 5,103,335$ 18,270,000$ 23,373,335$
Loan Payment
Initial Investment
ESPH investment 7,830,000$
15 Year Loan 18,270,000$
10%
Loan Payment 1,558,222$
Initial Cost
Construction
$ 25,200,000 Wind Turbine Cost
Legal Fees
Transmission Line $ 900,000
Estimated Production of Proposed Site 34,000
Expected Rate of Inflation 10%
Wind Farm Capacity: 10 MW with 3.0 MW Turbines
Rate of Inflation 10%
Rent 2%
Revenue
Expected Price of Electricity Varies by Year
Costs Over Time
Operation and Maintenance 0.01
Labor Cost
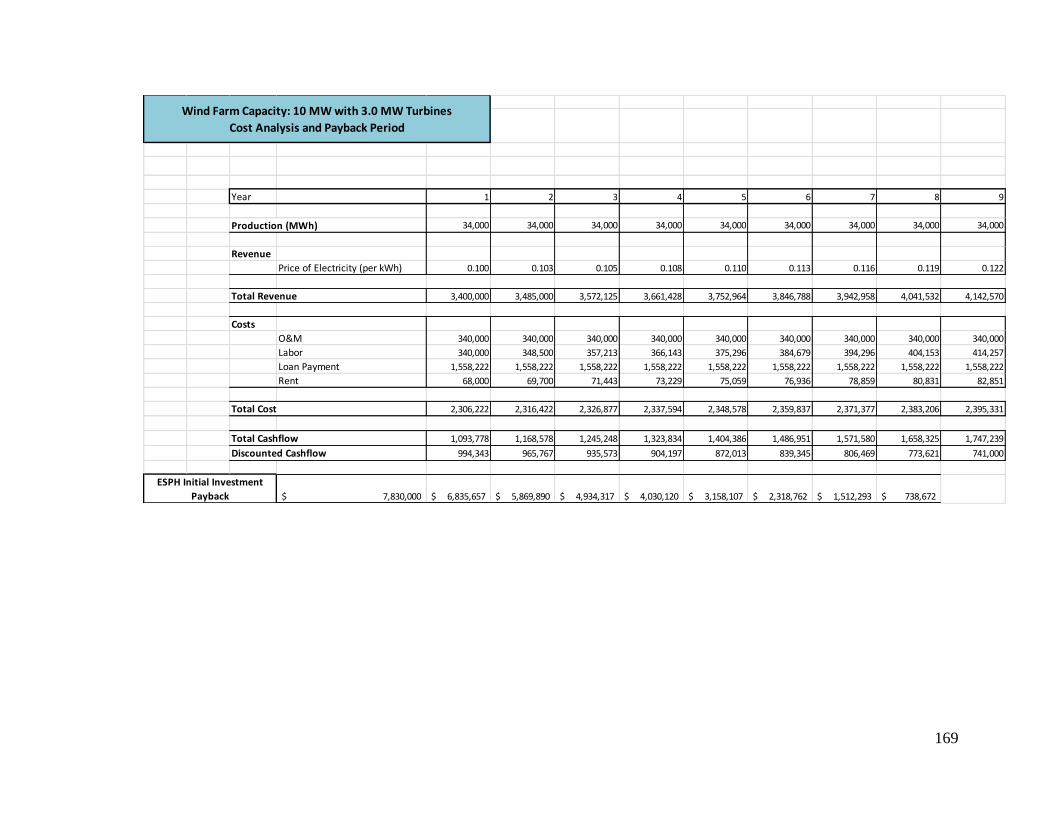
169
Year 1 2 3 4 5 6 7 8 9
34,000 34,000 34,000 34,000 34,000 34,000 34,000 34,000 34,000
Revenue
Price of Electricity (per kWh) 0.100 0.103 0.105 0.108 0.110 0.113 0.116 0.119 0.122
3,400,000 3,485,000 3,572,125 3,661,428 3,752,964 3,846,788 3,942,958 4,041,532 4,142,570
Costs
O&M 340,000 340,000 340,000 340,000 340,000 340,000 340,000 340,000 340,000
Labor 340,000 348,500 357,213 366,143 375,296 384,679 394,296 404,153 414,257
Loan Payment 1,558,222 1,558,222 1,558,222 1,558,222 1,558,222 1,558,222 1,558,222 1,558,222 1,558,222
Rent 68,000 69,700 71,443 73,229 75,059 76,936 78,859 80,831 82,851
2,306,222 2,316,422 2,326,877 2,337,594 2,348,578 2,359,837 2,371,377 2,383,206 2,395,331
1,093,778 1,168,578 1,245,248 1,323,834 1,404,386 1,486,951 1,571,580 1,658,325 1,747,239
994,343 965,767 935,573 904,197 872,013 839,345 806,469 773,621 741,000
7,830,000$ 6,835,657$ 5,869,890$ 4,934,317$ 4,030,120$ 3,158,107$ 2,318,762$ 1,512,293$ 738,672$
Total Cashflow
Discounted Cashflow
ESPH Initial Investment
Payback
Wind Farm Capacity: 10 MW with 3.0 MW Turbines
Cost Analysis and Payback Period
Production (MWh)
Total Revenue
Total Cost
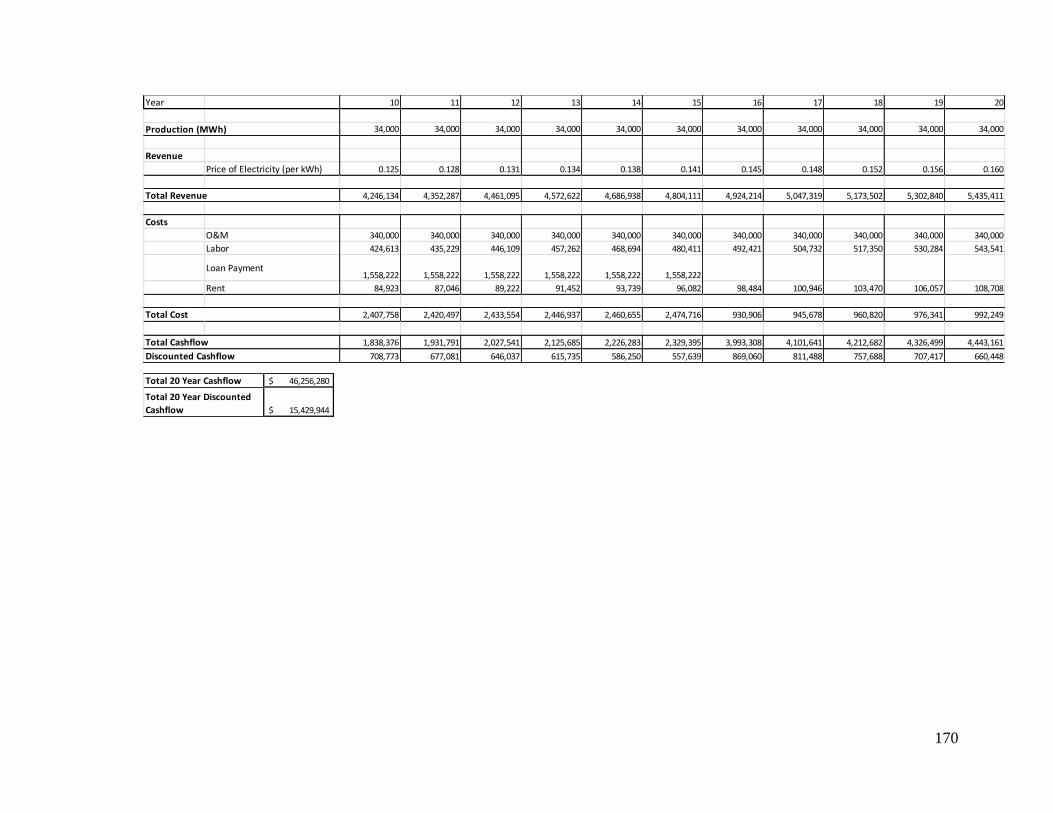
170
Year 10 11 12 13 14 15 16 17 18 19 20
34,000 34,000 34,000 34,000 34,000 34,000 34,000 34,000 34,000 34,000 34,000
Revenue
Price of Electricity (per kWh) 0.125 0.128 0.131 0.134 0.138 0.141 0.145 0.148 0.152 0.156 0.160
4,246,134 4,352,287 4,461,095 4,572,622 4,686,938 4,804,111 4,924,214 5,047,319 5,173,502 5,302,840 5,435,411
Costs
O&M 340,000 340,000 340,000 340,000 340,000 340,000 340,000 340,000 340,000 340,000 340,000
Labor 424,613 435,229 446,109 457,262 468,694 480,411 492,421 504,732 517,350 530,284 543,541
Loan Payment1,558,222 1,558,222 1,558,222 1,558,222 1,558,222 1,558,222
Rent 84,923 87,046 89,222 91,452 93,739 96,082 98,484 100,946 103,470 106,057 108,708
2,407,758 2,420,497 2,433,554 2,446,937 2,460,655 2,474,716 930,906 945,678 960,820 976,341 992,249
1,838,376 1,931,791 2,027,541 2,125,685 2,226,283 2,329,395 3,993,308 4,101,641 4,212,682 4,326,499 4,443,161
708,773 677,081 646,037 615,735 586,250 557,639 869,060 811,488 757,688 707,417 660,448
Production (MWh)
Total Revenue
Total Cost
Total Cashflow
Discounted Cashflow
46,256,280$
15,429,944$
Total 20 Year Cashflow
Total 20 Year Discounted
Cashflow

171
R.2 3.0 MW Turbines on a 15 MW Wind Farm
YearBalance Interest
Amount Paid on
PrincipalAnnual Payment
0 30,030,000$
1 975,975$ 1,585,241$ 2,561,216$
Interest Rate: 0.0325 2 28,444,759$ 924,455$ 1,636,761$ 2,561,216$
3 26,807,998$ 871,260$ 1,689,956$ 2,561,216$
4 25,118,041$ 816,336$ 1,744,880$ 2,561,216$
5 23,373,162$ 759,628$ 1,801,588$ 2,561,216$
6 21,571,573$ 701,076$ 1,860,140$ 2,561,216$
7 19,711,434$ 640,622$ 1,920,594$ 2,561,216$
8 17,790,839$ 578,202$ 1,983,014$ 2,561,216$
$/kWh 9 15,807,825$ 513,754$ 2,047,462$ 2,561,216$
of revenue 10 13,760,364$ 447,212$ 2,114,004$ 2,561,216$
11 11,646,359$ 378,507$ 2,182,709$ 2,561,216$
12 9,463,650$ 307,569$ 2,253,647$ 2,561,216$
of revenue 13 7,210,003$ 234,325$ 2,326,891$ 2,561,216$
14 4,883,112$ 158,701$ 2,402,515$ 2,561,216$
15 2,480,597$ 80,619$ 2,480,597$ 2,561,216$
MWh Total 8,388,241$ 30,030,000$ 38,418,241$
Loan Payment
Initial Investment
ESPH investment 12,870,000$
15 Year Loan 30,030,000$
10%
Loan Payment 2,561,216$
Initial Cost
Construction
$ 42,000,000 Wind Turbine Cost
Legal Fees
Transmission Line $ 900,000
Estimated Production of Proposed Site 55,000
Expected Rate of Inflation 10%
Wind Farm Capacity: 15 MW with 3.0 MW Turbines
Rate of Inflation 10%
Rent 2%
Revenue
Expected Price of Electricity Varies by Year
Costs Over Time
Operation and Maintenance 0.01
Labor Cost
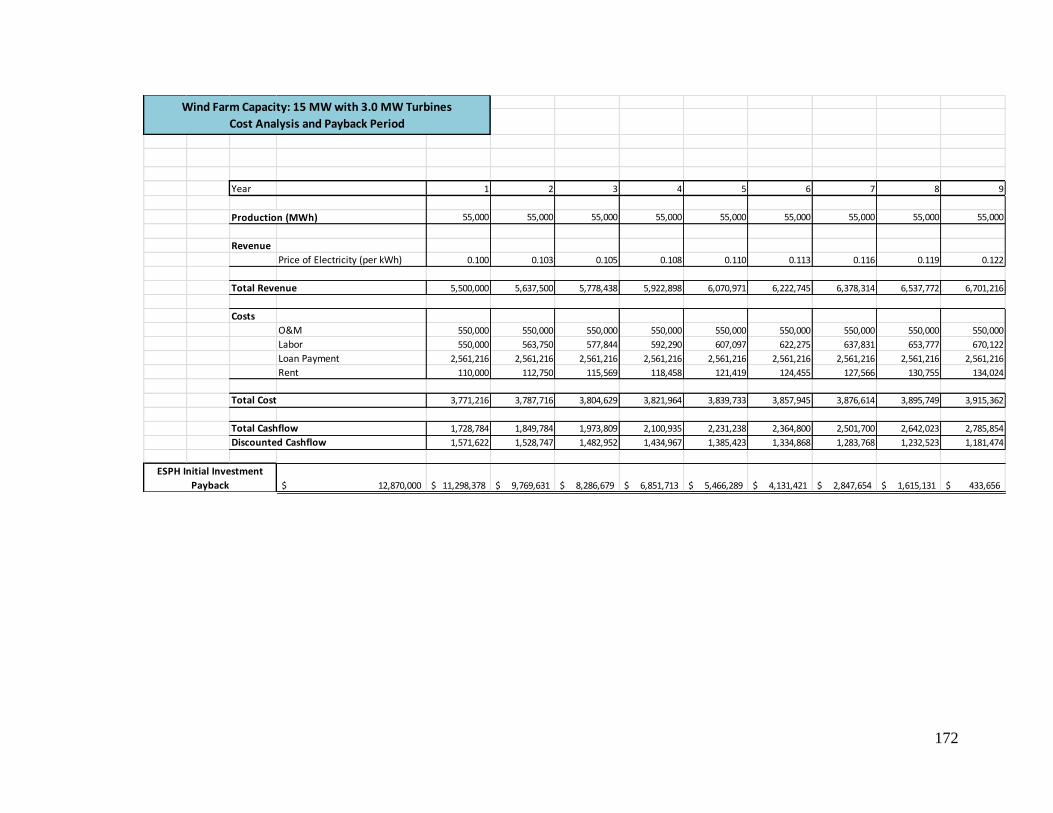
172
Year 1 2 3 4 5 6 7 8 9
55,000 55,000 55,000 55,000 55,000 55,000 55,000 55,000 55,000
Revenue
Price of Electricity (per kWh) 0.100 0.103 0.105 0.108 0.110 0.113 0.116 0.119 0.122
5,500,000 5,637,500 5,778,438 5,922,898 6,070,971 6,222,745 6,378,314 6,537,772 6,701,216
Costs
O&M 550,000 550,000 550,000 550,000 550,000 550,000 550,000 550,000 550,000
Labor 550,000 563,750 577,844 592,290 607,097 622,275 637,831 653,777 670,122
Loan Payment 2,561,216 2,561,216 2,561,216 2,561,216 2,561,216 2,561,216 2,561,216 2,561,216 2,561,216
Rent 110,000 112,750 115,569 118,458 121,419 124,455 127,566 130,755 134,024
3,771,216 3,787,716 3,804,629 3,821,964 3,839,733 3,857,945 3,876,614 3,895,749 3,915,362
1,728,784 1,849,784 1,973,809 2,100,935 2,231,238 2,364,800 2,501,700 2,642,023 2,785,854
1,571,622 1,528,747 1,482,952 1,434,967 1,385,423 1,334,868 1,283,768 1,232,523 1,181,474
12,870,000$ 11,298,378$ 9,769,631$ 8,286,679$ 6,851,713$ 5,466,289$ 4,131,421$ 2,847,654$ 1,615,131$ 433,656$
Total Cashflow
Discounted Cashflow
ESPH Initial Investment
Payback
Wind Farm Capacity: 15 MW with 3.0 MW Turbines
Cost Analysis and Payback Period
Production (MWh)
Total Revenue
Total Cost

173
Year 10 11 12 13 14 15 16 17 18 19 20
55,000 55,000 55,000 55,000 55,000 55,000 55,000 55,000 55,000 55,000 55,000
Revenue
Price of Electricity (per kWh) 0.125 0.128 0.131 0.134 0.138 0.141 0.145 0.148 0.152 0.156 0.160
6,868,746 7,040,465 7,216,477 7,396,889 7,581,811 7,771,356 7,965,640 8,164,781 8,368,900 8,578,123 8,792,576
Costs
O&M 550,000 550,000 550,000 550,000 550,000 550,000 550,000 550,000 550,000 550,000 550,000
Labor 686,875 704,046 721,648 739,689 758,181 777,136 796,564 816,478 836,890 857,812 879,258
Loan Payment 2,561,216 2,561,216 2,561,216 2,561,216 2,561,216 2,561,216
Rent 137,375 140,809 144,330 147,938 151,636 155,427 159,313 163,296 167,378 171,562 175,852
3,935,466 3,956,072 3,977,193 3,998,843 4,021,033 4,043,779 1,505,877 1,529,774 1,554,268 1,579,375 1,605,109
2,933,281 3,084,393 3,239,283 3,398,046 3,560,777 3,727,577 6,459,763 6,635,007 6,814,632 6,998,748 7,187,467
1,130,907 1,081,061 1,032,136 984,293 937,664 892,352 1,405,833 1,312,701 1,225,672 1,144,351 1,068,371
Production (MWh)
Total Revenue
Total Cost
Total Cashflow
Discounted Cashflow
74,217,902$
24,651,683$
Total 20 Year Cashflow
Total 20 Year Discounted
Cashflow

174
R.3 3.0 MW Turbines on a 20 MW Wind Farm
YearBalance Interest
Amount Paid on
PrincipalAnnual Payment
0 41,790,000$
1 1,358,175$ 2,206,035$ 3,564,210$
Interest Rate: 0.0325 2 39,583,965$ 1,286,479$ 2,277,731$ 3,564,210$
3 37,306,234$ 1,212,453$ 2,351,757$ 3,564,210$
4 34,954,477$ 1,136,021$ 2,428,189$ 3,564,210$
5 32,526,288$ 1,057,104$ 2,507,105$ 3,564,210$
6 30,019,183$ 975,623$ 2,588,586$ 3,564,210$
7 27,430,596$ 891,494$ 2,672,715$ 3,564,210$
8 24,757,881$ 804,631$ 2,759,579$ 3,564,210$
$/kWh 9 21,998,302$ 714,945$ 2,849,265$ 3,564,210$
of revenue 10 19,149,037$ 622,344$ 2,941,866$ 3,564,210$
11 16,207,171$ 526,733$ 3,037,477$ 3,564,210$
12 13,169,695$ 428,015$ 3,136,195$ 3,564,210$
of revenue 13 10,033,500$ 326,089$ 3,238,121$ 3,564,210$
14 6,795,379$ 220,850$ 3,343,360$ 3,564,210$
15 3,452,019$ 112,191$ 3,452,019$ 3,564,210$
MWh Total 11,673,146$ 41,790,000$ 53,463,146$
Loan Payment
$ 58,800,000
2%
Initial Investment
Initial Cost
Costs Over Time
Operation and Maintenance
Labor Cost
Loan Payment
Rate of Inflation
0.01
10%
10%
3,564,210$
$ 900,000
Wind Turbine Cost
Estimated Production of Proposed Site
Expected Rate of Inflation 10%
75,000
Varies by Year
Legal Fees
Transmission Line
Revenue
Rent
Expected Price of Electricity
17,910,000$
41,790,000$
Wind Farm Capacity: 20 MW with 3.0 MW Turbines
Construction
ESPH investment
15 Year Loan
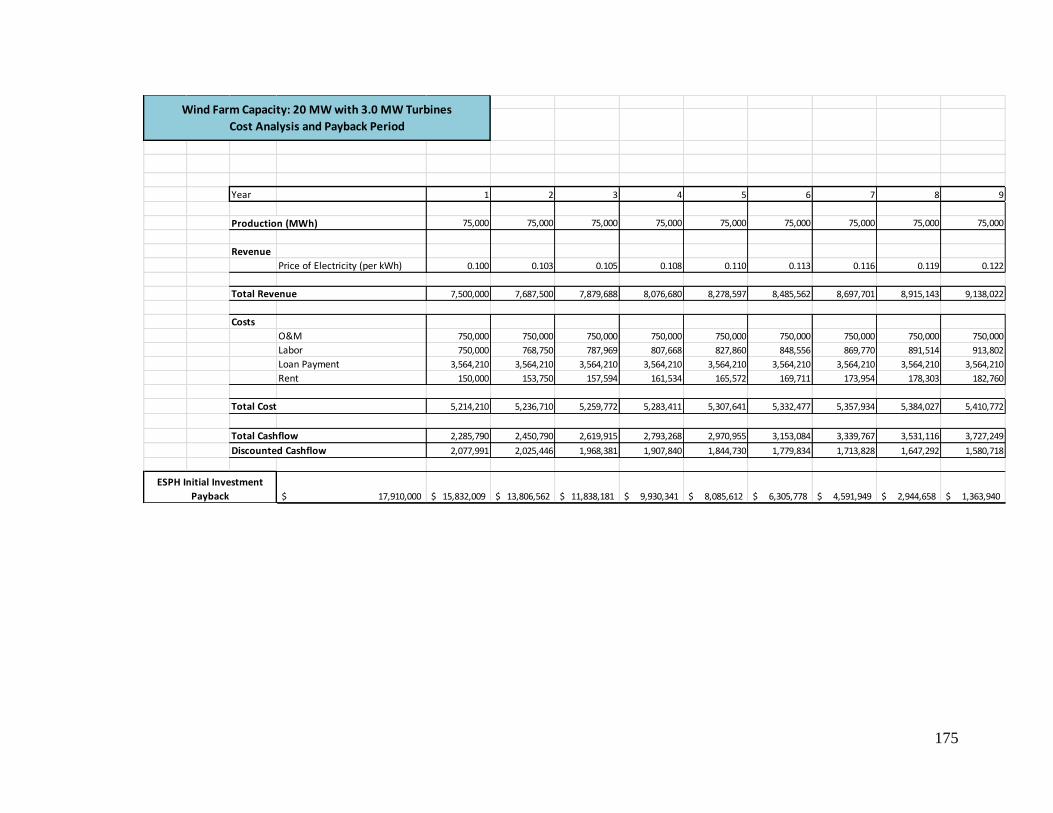
175
Year 1 2 3 4 5 6 7 8 9
75,000 75,000 75,000 75,000 75,000 75,000 75,000 75,000 75,000
Revenue
Price of Electricity (per kWh) 0.100 0.103 0.105 0.108 0.110 0.113 0.116 0.119 0.122
7,500,000 7,687,500 7,879,688 8,076,680 8,278,597 8,485,562 8,697,701 8,915,143 9,138,022
Costs
O&M 750,000 750,000 750,000 750,000 750,000 750,000 750,000 750,000 750,000
Labor 750,000 768,750 787,969 807,668 827,860 848,556 869,770 891,514 913,802
Loan Payment 3,564,210 3,564,210 3,564,210 3,564,210 3,564,210 3,564,210 3,564,210 3,564,210 3,564,210
Rent 150,000 153,750 157,594 161,534 165,572 169,711 173,954 178,303 182,760
5,214,210 5,236,710 5,259,772 5,283,411 5,307,641 5,332,477 5,357,934 5,384,027 5,410,772
2,285,790 2,450,790 2,619,915 2,793,268 2,970,955 3,153,084 3,339,767 3,531,116 3,727,249
2,077,991 2,025,446 1,968,381 1,907,840 1,844,730 1,779,834 1,713,828 1,647,292 1,580,718
17,910,000$ 15,832,009$ 13,806,562$ 11,838,181$ 9,930,341$ 8,085,612$ 6,305,778$ 4,591,949$ 2,944,658$ 1,363,940$
Total Cashflow
Discounted Cashflow
ESPH Initial Investment
Payback
Wind Farm Capacity: 20 MW with 3.0 MW Turbines
Cost Analysis and Payback Period
Production (MWh)
Total Revenue
Total Cost

176
Year 10 11 12 13 14 15 16 17 18 19 20
75,000 75,000 75,000 75,000 75,000 75,000 75,000 75,000 75,000 75,000 75,000
Revenue
Price of Electricity (per kWh) 0.125 0.128 0.131 0.134 0.138 0.141 0.145 0.148 0.152 0.156 0.160
9,366,472 9,600,634 9,840,650 10,086,666 10,338,833 10,597,304 10,862,236 11,133,792 11,412,137 11,697,440 11,989,876
Costs
O&M 750,000 750,000 750,000 750,000 750,000 750,000 750,000 750,000 750,000 750,000 750,000
Labor 936,647 960,063 984,065 1,008,667 1,033,883 1,059,730 1,086,224 1,113,379 1,141,214 1,169,744 1,198,988
Loan Payment 3,564,210 3,564,210 3,564,210 3,564,210 3,564,210 3,564,210
Rent 187,329 192,013 196,813 201,733 206,777 211,946 217,245 222,676 228,243 233,949 239,798
5,438,186 5,466,286 5,495,088 5,524,610 5,554,870 5,585,886 2,053,468 2,086,055 2,119,456 2,153,693 2,188,785
3,928,286 4,134,348 4,345,562 4,562,056 4,783,963 5,011,417 8,808,768 9,047,737 9,292,681 9,543,748 9,801,091
1,514,524 1,449,064 1,384,630 1,321,465 1,259,767 1,199,693 1,917,045 1,790,047 1,671,370 1,560,479 1,456,870
Production (MWh)
Total Revenue
Total Cost
Total Cashflow
Discounted Cashflow
100,131,594$
33,071,014$
Total 20 Year Cashflow
Total 20 Year Discounted
Cashflow
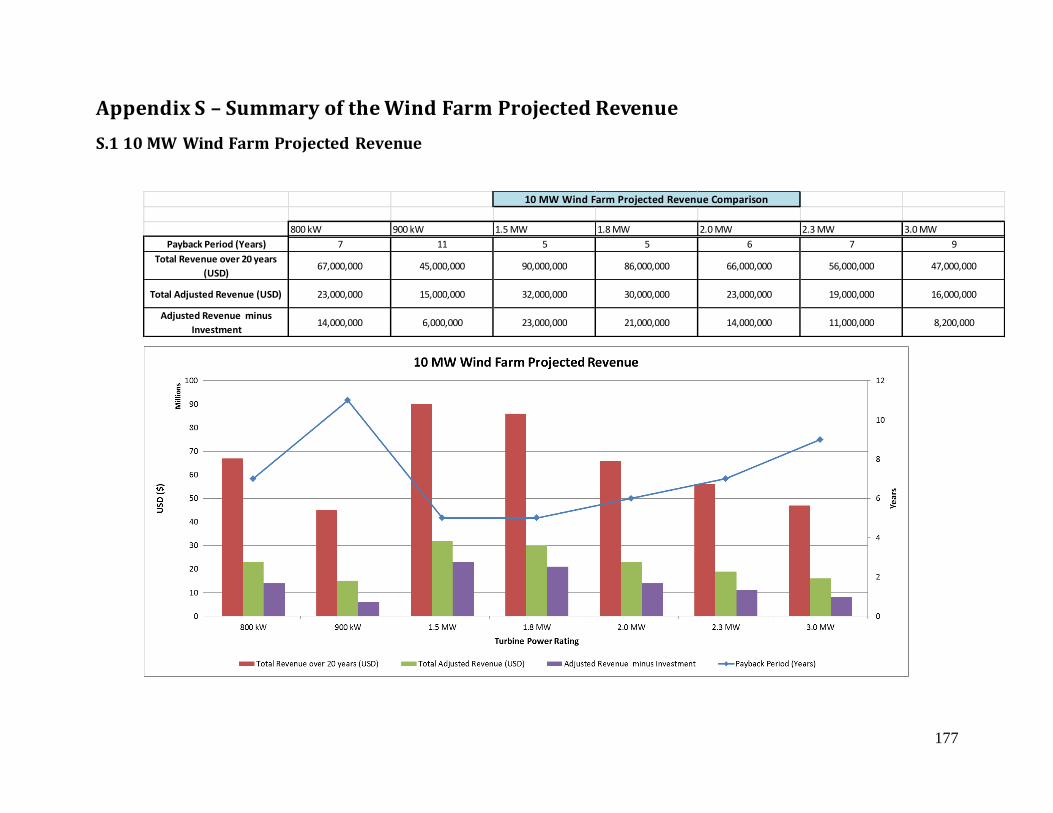
177
Appendix S – Summary of the Wind Farm Projected Revenue
S.1 10 MW Wind Farm Projected Revenue
800 kW 900 kW 1.5 MW 1.8 MW 2.0 MW 2.3 MW 3.0 MW
Payback Period (Years) 7 11 5 5 6 7 9
Total Revenue over 20 years
(USD)67,000,000 45,000,000 90,000,000 86,000,000 66,000,000 56,000,000 47,000,000
Total Adjusted Revenue (USD) 23,000,000 15,000,000 32,000,000 30,000,000 23,000,000 19,000,000 16,000,000
Adjusted Revenue minus
Investment14,000,000 6,000,000 23,000,000 21,000,000 14,000,000 11,000,000 8,200,000
10 MW Wind Farm Projected Revenue Comparison
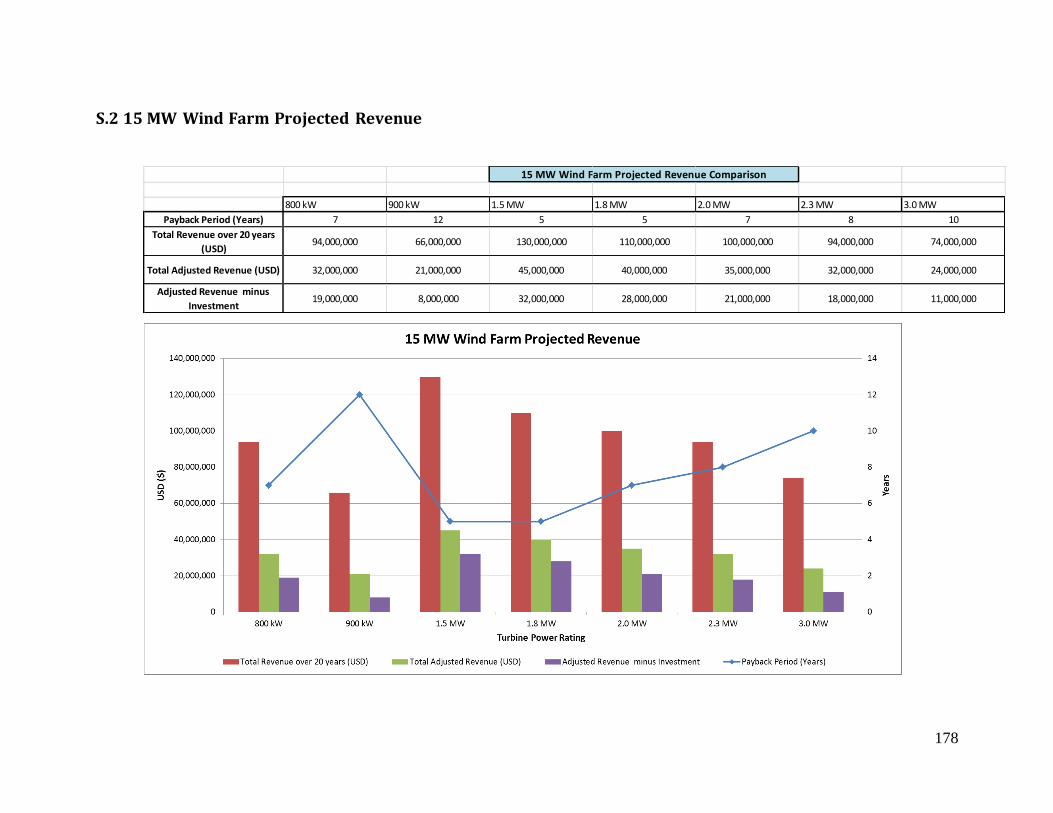
178
S.2 15 MW Wind Farm Projected Revenue
800 kW 900 kW 1.5 MW 1.8 MW 2.0 MW 2.3 MW 3.0 MW
Payback Period (Years) 7 12 5 5 7 8 10
Total Revenue over 20 years
(USD)94,000,000 66,000,000 130,000,000 110,000,000 100,000,000 94,000,000 74,000,000
Total Adjusted Revenue (USD) 32,000,000 21,000,000 45,000,000 40,000,000 35,000,000 32,000,000 24,000,000
Adjusted Revenue minus
Investment19,000,000 8,000,000 32,000,000 28,000,000 21,000,000 18,000,000 11,000,000
15 MW Wind Farm Projected Revenue Comparison
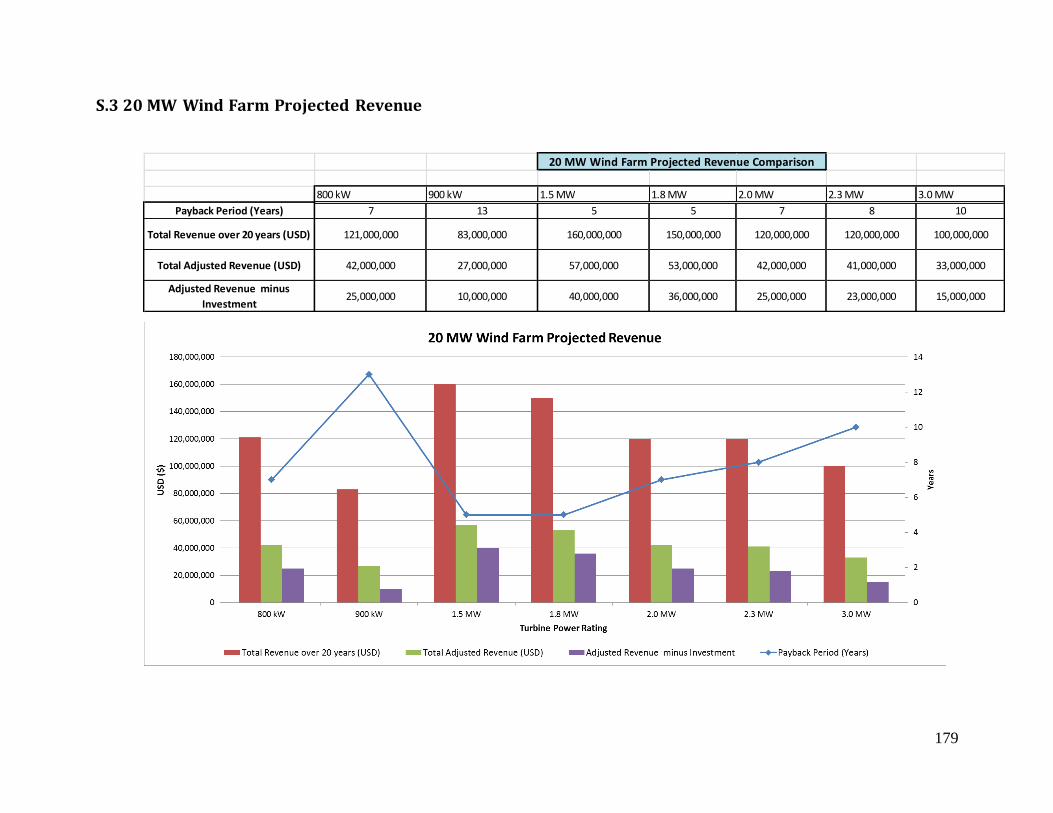
179
S.3 20 MW Wind Farm Projected Revenue
800 kW 900 kW 1.5 MW 1.8 MW 2.0 MW 2.3 MW 3.0 MW
Payback Period (Years) 7 13 5 5 7 8 10
Total Revenue over 20 years (USD) 121,000,000 83,000,000 160,000,000 150,000,000 120,000,000 120,000,000 100,000,000
Total Adjusted Revenue (USD) 42,000,000 27,000,000 57,000,000 53,000,000 42,000,000 41,000,000 33,000,000
Adjusted Revenue minus
Investment25,000,000 10,000,000 40,000,000 36,000,000 25,000,000 23,000,000 15,000,000
20 MW Wind Farm Projected Revenue Comparison
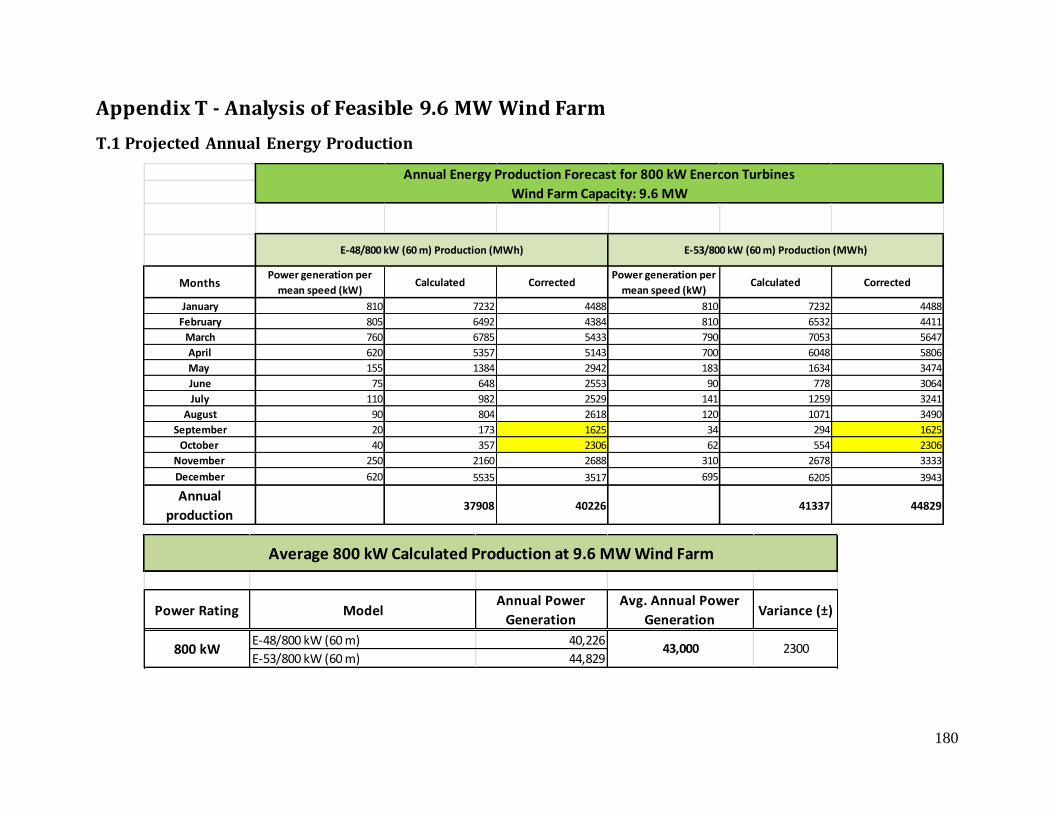
180
Appendix T - Analysis of Feasible 9.6 MW Wind Farm
T.1 Projected Annual Energy Production
MonthsPower generation per
mean speed (kW)Calculated Corrected
Power generation per
mean speed (kW)Calculated Corrected
January 810 7232 4488 810 7232 4488
February 805 6492 4384 810 6532 4411
March 760 6785 5433 790 7053 5647
April 620 5357 5143 700 6048 5806
May 155 1384 2942 183 1634 3474
June 75 648 2553 90 778 3064
July 110 982 2529 141 1259 3241
August 90 804 2618 120 1071 3490
September 20 173 1625 34 294 1625
October 40 357 2306 62 554 2306
November 250 2160 2688 310 2678 3333
December 620 5535 3517 695 6205 3943
Annual
production37908 40226 41337 44829
E-48/800 kW (60 m) Production (MWh) E-53/800 kW (60 m) Production (MWh)
Annual Energy Production Forecast for 800 kW Enercon Turbines
Wind Farm Capacity: 9.6 MW
Power Rating ModelAnnual Power
Generation
Avg. Annual Power
GenerationVariance (±)
E-48/800 kW (60 m) 40,226
E-53/800 kW (60 m) 44,829
Average 800 kW Calculated Production at 9.6 MW Wind Farm
800 kW 230043,000

181
T.2 Projected Revenue
YearBalance Interest
Amount Paid on
PrincipalAnnual Payment
0 19,446,000$
1 631,995$ 1,026,527$ 1,658,522$
Interest Rate: 0.0325 2 18,419,473$ 598,633$ 1,059,889$ 1,658,522$
3 17,359,584$ 564,186$ 1,094,335$ 1,658,522$
4 16,265,249$ 528,621$ 1,129,901$ 1,658,522$
5 15,135,348$ 491,899$ 1,166,623$ 1,658,522$
6 13,968,725$ 453,984$ 1,204,538$ 1,658,522$
7 12,764,187$ 414,836$ 1,243,686$ 1,658,522$
8 11,520,501$ 374,416$ 1,284,105$ 1,658,522$
$/kWh 9 10,236,396$ 332,683$ 1,325,839$ 1,658,522$
of revenue 10 8,910,557$ 289,593$ 1,368,929$ 1,658,522$
11 7,541,628$ 245,103$ 1,413,419$ 1,658,522$
12 6,128,210$ 199,167$ 1,459,355$ 1,658,522$
of revenue 13 4,668,855$ 151,738$ 1,506,784$ 1,658,522$
14 3,162,071$ 102,767$ 1,555,754$ 1,658,522$
15 1,606,316$ 52,205$ 1,606,316$ 1,658,522$
MWh Total 5,431,826$ 19,446,000$ 24,877,826$ Estimated Production of Proposed Site 43,000
Expected Rate of Inflation 10%
Wind Farm Capacity: 9.6 MW with 800 kW Turbines
Rate of Inflation 10%
Rent 2%
Revenue
Expected Price of Electricity Varies by Year
Costs Over Time
Operation and Maintenance 0.01
Labor Cost 10%
Loan Payment 1,658,522$
Initial Cost
Construction
$ 26,880,000 Wind Turbine Cost
Legal Fees
Transmission Line $ 900,000
Loan Payment
Initial Investment
ESPH investment 8,334,000$
15 Year Loan 19,446,000$

182
Year 1 2 3 4 5 6 7 8 9
43,000 43,000 43,000 43,000 43,000 43,000 43,000 43,000 43,000
Revenue
Price of Electricity (per kWh) 0.100 0.103 0.105 0.108 0.110 0.113 0.116 0.119 0.122
4,300,000 4,407,500 4,517,688 4,630,630 4,746,395 4,865,055 4,986,682 5,111,349 5,239,132
Costs
O&M 430,000 430,000 430,000 430,000 430,000 430,000 430,000 430,000 430,000
Labor 430,000 440,750 451,769 463,063 474,640 486,506 498,668 511,135 523,913
Loan Payment 1,658,522 1,658,522 1,658,522 1,658,522 1,658,522 1,658,522 1,658,522 1,658,522 1,658,522
Rent 86,000 88,150 90,354 92,613 94,928 97,301 99,734 102,227 104,783
2,604,522 2,617,422 2,630,644 2,644,197 2,658,089 2,672,328 2,686,924 2,701,884 2,717,218
1,695,478 1,790,078 1,887,043 1,986,432 2,088,306 2,192,727 2,299,758 2,409,465 2,521,915
1,541,344 1,479,404 1,417,764 1,356,760 1,296,674 1,237,737 1,180,140 1,124,033 1,069,538
8,334,000$ 6,792,656$ 5,313,253$ 3,895,489$ 2,538,729$ 1,242,055$ 4,318$
Total Cashflow
Discounted Cashflow
ESPH Initial Investment
Payback
Wind Farm Capacity: 9.6 MW with 800 kW Turbines
Cost Analysis and Payback Period
Production (MWh)
Total Revenue
Total Cost

183
Year 10 11 12 13 14 15 16 17 18 19 20
43,000 43,000 43,000 43,000 43,000 43,000 43,000 43,000 43,000 43,000 43,000
Revenue
Price of Electricity (per kWh) 0.125 0.128 0.131 0.134 0.138 0.141 0.145 0.148 0.152 0.156 0.160
5,370,111 5,504,364 5,641,973 5,783,022 5,927,597 6,075,787 6,227,682 6,383,374 6,542,959 6,706,532 6,874,196
Costs
O&M 430,000 430,000 430,000 430,000 430,000 430,000 430,000 430,000 430,000 430,000 430,000
Labor 537,011 550,436 564,197 578,302 592,760 607,579 622,768 638,337 654,296 670,653 687,420
Loan Payment 1,658,522 1,658,522 1,658,522 1,658,522 1,658,522 1,658,522
Rent 107,402 110,087 112,839 115,660 118,552 121,516 124,554 127,667 130,859 134,131 137,484
2,732,935 2,749,045 2,765,558 2,782,484 2,799,833 2,817,616 1,177,322 1,196,005 1,215,155 1,234,784 1,254,903
2,637,176 2,755,318 2,876,414 3,000,538 3,127,764 3,258,171 5,050,360 5,187,369 5,327,804 5,471,749 5,619,292
1,016,745 965,722 916,514 869,149 823,638 779,980 1,099,106 1,026,293 958,252 894,675 835,272
Production (MWh)
Total Revenue
Total Cost
Total Cashflow
Discounted Cashflow
63,183,159$
21,888,740$
Total 20 Year Cashflow
Total 20 Year Discounted
Cashflow
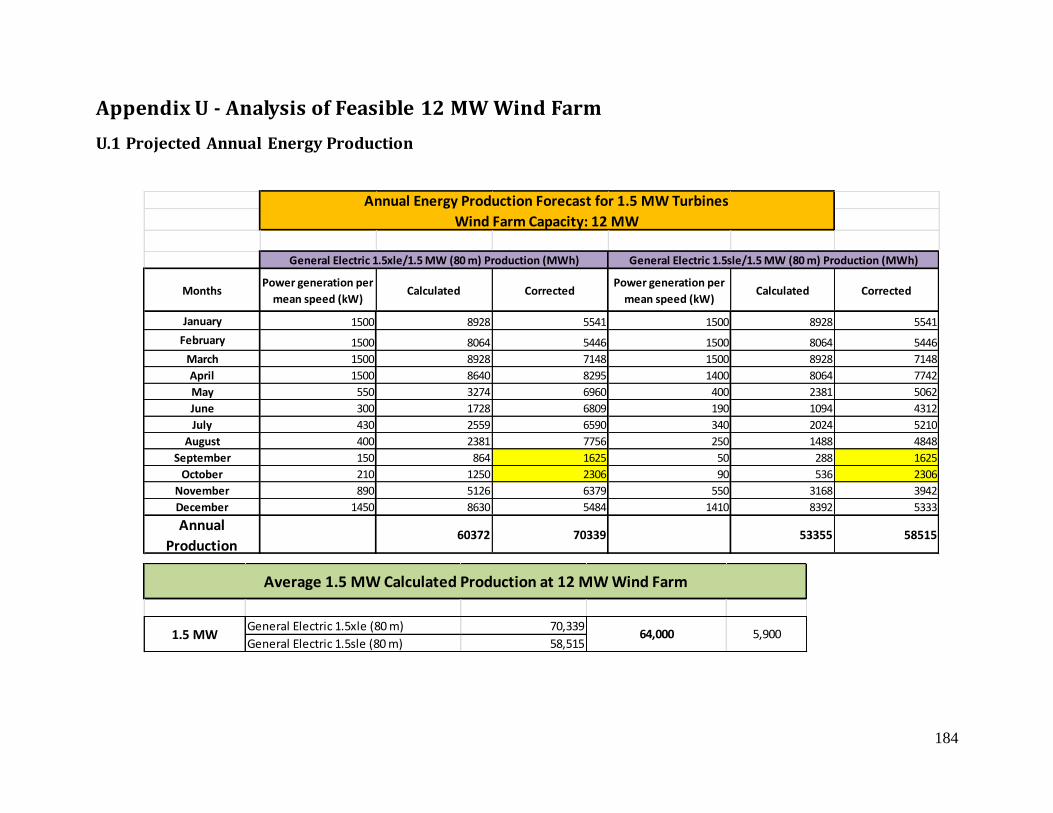
184
Appendix U - Analysis of Feasible 12 MW Wind Farm
U.1 Projected Annual Energy Production
MonthsPower generation per
mean speed (kW)Calculated Corrected
Power generation per
mean speed (kW)Calculated Corrected
January 1500 8928 5541 1500 8928 5541
February 1500 8064 5446 1500 8064 5446
March 1500 8928 7148 1500 8928 7148
April 1500 8640 8295 1400 8064 7742
May 550 3274 6960 400 2381 5062
June 300 1728 6809 190 1094 4312
July 430 2559 6590 340 2024 5210
August 400 2381 7756 250 1488 4848
September 150 864 1625 50 288 1625
October 210 1250 2306 90 536 2306
November 890 5126 6379 550 3168 3942
December 1450 8630 5484 1410 8392 5333
Annual
Production60372 70339 53355 58515
Annual Energy Production Forecast for 1.5 MW Turbines
Wind Farm Capacity: 12 MW
General Electric 1.5xle/1.5 MW (80 m) Production (MWh) General Electric 1.5sle/1.5 MW (80 m) Production (MWh)
General Electric 1.5xle (80 m) 70,339
General Electric 1.5sle (80 m) 58,515
Average 1.5 MW Calculated Production at 12 MW Wind Farm
1.5 MW 5,90064,000

185
U.2 Projected Revenue
YearBalance Interest
Amount Paid on
PrincipalAnnual Payment
0 24,150,000$
1 784,875$ 1,274,844$ 2,059,719$
Interest Rate: 0.0325 2 22,875,156$ 743,443$ 1,316,277$ 2,059,719$
3 21,558,879$ 700,664$ 1,359,056$ 2,059,719$
4 20,199,824$ 656,494$ 1,403,225$ 2,059,719$
5 18,796,599$ 610,889$ 1,448,830$ 2,059,719$
6 17,347,769$ 563,802$ 1,495,917$ 2,059,719$
7 15,851,852$ 515,185$ 1,544,534$ 2,059,719$
8 14,307,318$ 464,988$ 1,594,731$ 2,059,719$
$/kWh 9 12,712,587$ 413,159$ 1,646,560$ 2,059,719$
of revenue 10 11,066,027$ 359,646$ 1,700,073$ 2,059,719$
11 9,365,953$ 304,393$ 1,755,326$ 2,059,719$
12 7,610,628$ 247,345$ 1,812,374$ 2,059,719$
of revenue 13 5,798,254$ 188,443$ 1,871,276$ 2,059,719$
14 3,926,978$ 127,627$ 1,932,092$ 2,059,719$
15 1,994,885$ 64,834$ 1,994,885$ 2,059,719$
MWh Total 6,745,788$ 24,150,000$ 30,895,788$ Estimated Production of Proposed Site 64,000
Expected Rate of Inflation 10%
Wind Farm Capacity: 12 MW with 1.5 MW Turbines
Rate of Inflation 10%
Rent 2%
Revenue
Expected Price of Electricity Varies by Year
Costs Over Time
Operation and Maintenance 0.01
Labor Cost 10%
Loan Payment 2,059,719$
Initial Cost
Construction
$ 33,600,000 Wind Turbine Cost
Legal Fees
Transmission Line $ 900,000
Loan Payment
Initial Investment
ESPH investment 10,350,000$
15 Year Loan 24,150,000$

186
Year 1 2 3 4 5 6 7 8 9
64,000 64,000 64,000 64,000 64,000 64,000 64,000 64,000 64,000
Revenue
Price of Electricity (per kWh) 0.100 0.103 0.105 0.108 0.110 0.113 0.116 0.119 0.122
6,400,000 6,560,000 6,724,000 6,892,100 7,064,403 7,241,013 7,422,038 7,607,589 7,797,779
Costs
O&M 640,000 640,000 640,000 640,000 640,000 640,000 640,000 640,000 640,000
Labor 640,000 656,000 672,400 689,210 706,440 724,101 742,204 760,759 779,778
Loan Payment 2,059,719 2,059,719 2,059,719 2,059,719 2,059,719 2,059,719 2,059,719 2,059,719 2,059,719
Rent 128,000 131,200 134,480 137,842 141,288 144,820 148,441 152,152 155,956
3,467,719 3,486,919 3,506,599 3,526,771 3,547,447 3,568,641 3,590,364 3,612,630 3,635,453
2,932,281 3,073,081 3,217,401 3,365,329 3,516,955 3,672,372 3,831,674 3,994,959 4,162,326
2,665,710 2,539,736 2,417,281 2,298,565 2,183,752 2,072,958 1,966,255 1,863,678 1,765,233
10,350,000$ 7,684,290$ 5,144,554$ 2,727,273$ 428,708$
Total Cashflow
Discounted Cashflow
ESPH Initial Investment
Payback
Wind Farm Capacity: 12 MW with 1.5 MW Turbines
Cost Analysis and Payback Period
Production (MWh)
Total Revenue
Total Cost

187
Year 10 11 12 13 14 15 16 17 18 19 20
64,000 64,000 64,000 64,000 64,000 64,000 64,000 64,000 64,000 64,000 64,000
Revenue
Price of Electricity (per kWh) 0.125 0.128 0.131 0.134 0.138 0.141 0.145 0.148 0.152 0.156 0.160
7,992,723 8,192,541 8,397,355 8,607,288 8,822,471 9,043,032 9,269,108 9,500,836 9,738,357 9,981,816 10,231,361
Costs
O&M 640,000 640,000 640,000 640,000 640,000 640,000 640,000 640,000 640,000 640,000 640,000
Labor 799,272 819,254 839,735 860,729 882,247 904,303 926,911 950,084 973,836 998,182 1,023,136
Loan Payment 2,059,719 2,059,719 2,059,719 2,059,719 2,059,719 2,059,719
Rent 159,854 163,851 167,947 172,146 176,449 180,861 185,382 190,017 194,767 199,636 204,627
3,658,846 3,682,824 3,707,402 3,732,594 3,758,416 3,784,883 1,752,293 1,780,100 1,808,603 1,837,818 1,867,763
4,333,877 4,509,717 4,689,953 4,874,695 5,064,055 5,258,149 7,516,815 7,720,736 7,929,754 8,143,998 8,363,598
1,670,897 1,580,628 1,494,364 1,412,025 1,333,524 1,258,759 1,635,878 1,527,506 1,426,236 1,331,609 1,243,196
Production (MWh)
Total Revenue
Total Cost
Total Cashflow
Discounted Cashflow
100,171,724$
35,687,789$
Total 20 Year Cashflow
Total 20 Year Discounted
Cashflow
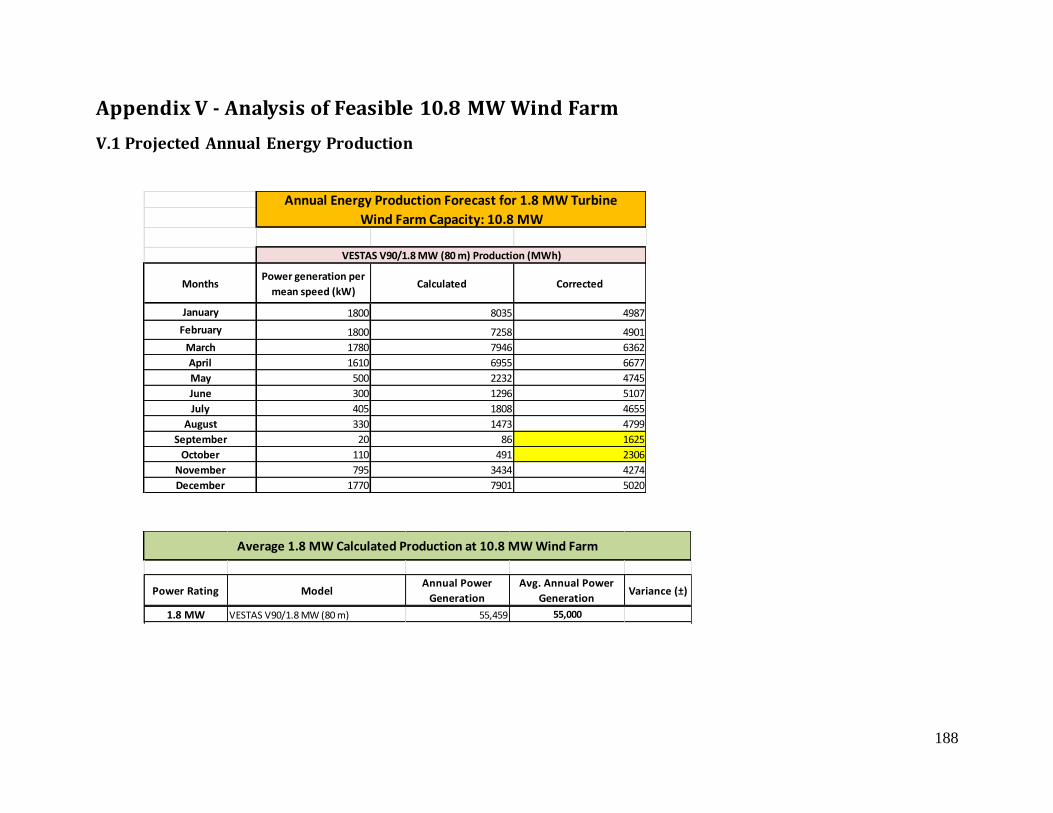
188
Appendix V - Analysis of Feasible 10.8 MW Wind Farm
V.1 Projected Annual Energy Production
MonthsPower generation per
mean speed (kW)Calculated Corrected
January 1800 8035 4987
February 1800 7258 4901
March 1780 7946 6362
April 1610 6955 6677
May 500 2232 4745
June 300 1296 5107
July 405 1808 4655
August 330 1473 4799
September 20 86 1625
October 110 491 2306
November 795 3434 4274
December 1770 7901 5020
VESTAS V90/1.8 MW (80 m) Production (MWh)
Annual Energy Production Forecast for 1.8 MW Turbine
Wind Farm Capacity: 10.8 MW
Power Rating ModelAnnual Power
Generation
Avg. Annual Power
GenerationVariance (±)
1.8 MW VESTAS V90/1.8 MW (80 m) 55,459 55,000
Average 1.8 MW Calculated Production at 10.8 MW Wind Farm
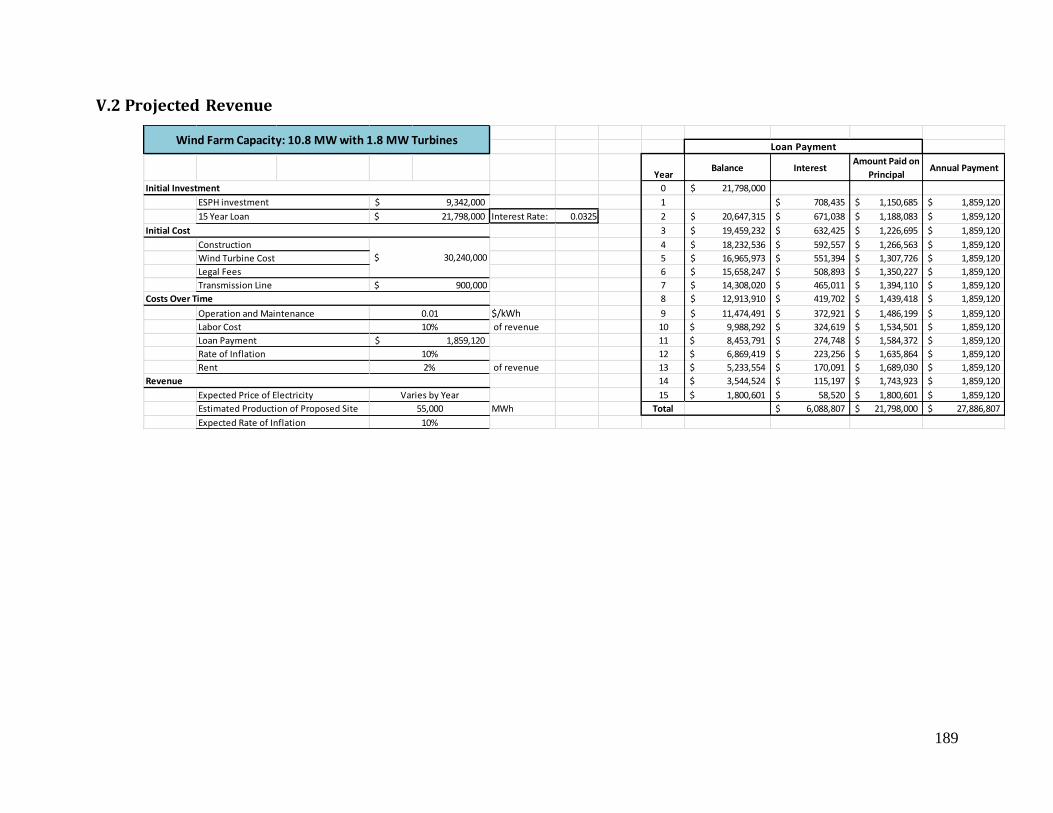
189
V.2 Projected Revenue
YearBalance Interest
Amount Paid on
PrincipalAnnual Payment
0 21,798,000$
1 708,435$ 1,150,685$ 1,859,120$
Interest Rate: 0.0325 2 20,647,315$ 671,038$ 1,188,083$ 1,859,120$
3 19,459,232$ 632,425$ 1,226,695$ 1,859,120$
4 18,232,536$ 592,557$ 1,266,563$ 1,859,120$
5 16,965,973$ 551,394$ 1,307,726$ 1,859,120$
6 15,658,247$ 508,893$ 1,350,227$ 1,859,120$
7 14,308,020$ 465,011$ 1,394,110$ 1,859,120$
8 12,913,910$ 419,702$ 1,439,418$ 1,859,120$
$/kWh 9 11,474,491$ 372,921$ 1,486,199$ 1,859,120$
of revenue 10 9,988,292$ 324,619$ 1,534,501$ 1,859,120$
11 8,453,791$ 274,748$ 1,584,372$ 1,859,120$
12 6,869,419$ 223,256$ 1,635,864$ 1,859,120$
of revenue 13 5,233,554$ 170,091$ 1,689,030$ 1,859,120$
14 3,544,524$ 115,197$ 1,743,923$ 1,859,120$
15 1,800,601$ 58,520$ 1,800,601$ 1,859,120$
MWh Total 6,088,807$ 21,798,000$ 27,886,807$ Estimated Production of Proposed Site 55,000
Expected Rate of Inflation 10%
Wind Farm Capacity: 10.8 MW with 1.8 MW Turbines
Rate of Inflation 10%
Rent 2%
Revenue
Expected Price of Electricity Varies by Year
Costs Over Time
Operation and Maintenance 0.01
Labor Cost 10%
Loan Payment 1,859,120$
Initial Cost
Construction
$ 30,240,000 Wind Turbine Cost
Legal Fees
Transmission Line $ 900,000
Loan Payment
Initial Investment
ESPH investment 9,342,000$
15 Year Loan 21,798,000$

190
Year 1 2 3 4 5 6 7 8 9
55,000 55,000 55,000 55,000 55,000 55,000 55,000 55,000 55,000
Revenue
Price of Electricity (per kWh) 0.100 0.103 0.105 0.108 0.110 0.113 0.116 0.119 0.122
5,500,000 5,637,500 5,778,438 5,922,898 6,070,971 6,222,745 6,378,314 6,537,772 6,701,216
Costs
O&M 550,000 550,000 550,000 550,000 550,000 550,000 550,000 550,000 550,000
Labor 550,000 563,750 577,844 592,290 607,097 622,275 637,831 653,777 670,122
Loan Payment 1,859,120 1,859,120 1,859,120 1,859,120 1,859,120 1,859,120 1,859,120 1,859,120 1,859,120
Rent 110,000 112,750 115,569 118,458 121,419 124,455 127,566 130,755 134,024
3,069,120 3,085,620 3,102,533 3,119,868 3,137,637 3,155,850 3,174,518 3,193,653 3,213,266
2,430,880 2,551,880 2,675,905 2,803,030 2,933,334 3,066,895 3,203,796 3,344,119 3,487,950
2,209,890 2,108,991 2,010,447 1,914,507 1,821,370 1,731,182 1,644,054 1,560,056 1,479,231
9,342,000$ 7,132,110$ 5,023,118$ 3,012,671$ 1,098,164$
Total Cashflow
Discounted Cashflow
ESPH Initial Investment
Payback
Wind Farm Capacity: 10.8 MW with 1.8 MW Turbines
Cost Analysis and Payback Period
Production (MWh)
Total Revenue
Total Cost
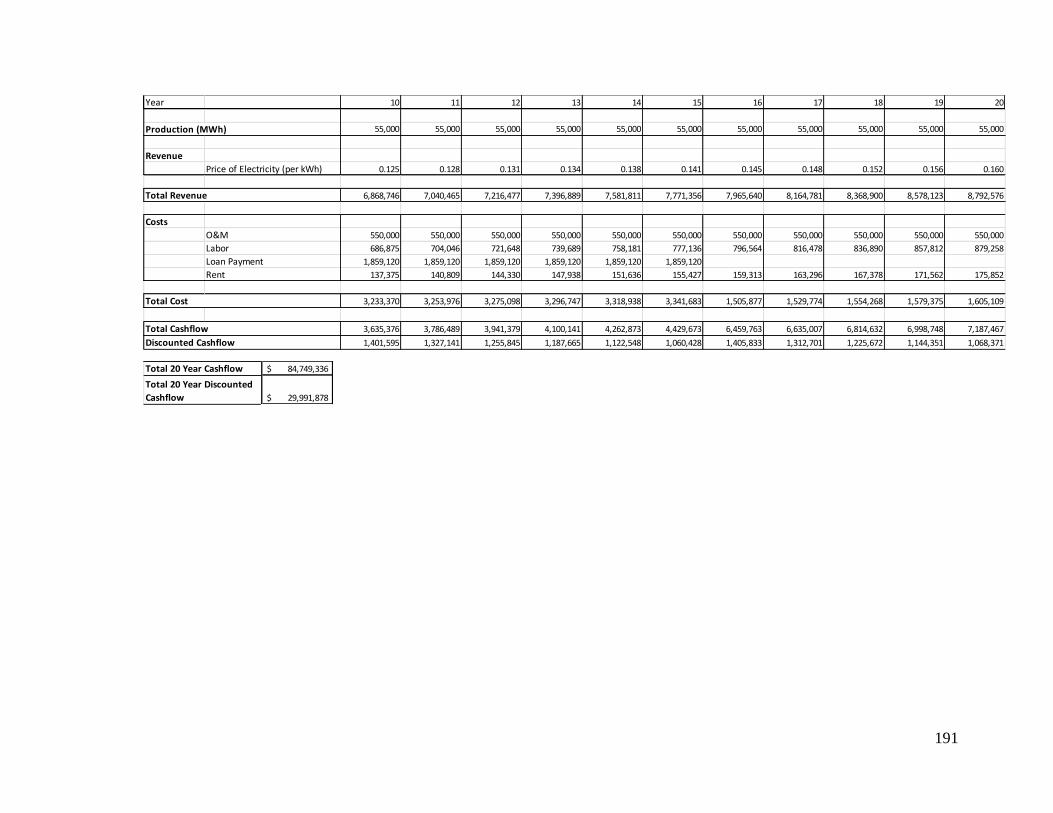
191
Year 10 11 12 13 14 15 16 17 18 19 20
55,000 55,000 55,000 55,000 55,000 55,000 55,000 55,000 55,000 55,000 55,000
Revenue
Price of Electricity (per kWh) 0.125 0.128 0.131 0.134 0.138 0.141 0.145 0.148 0.152 0.156 0.160
6,868,746 7,040,465 7,216,477 7,396,889 7,581,811 7,771,356 7,965,640 8,164,781 8,368,900 8,578,123 8,792,576
Costs
O&M 550,000 550,000 550,000 550,000 550,000 550,000 550,000 550,000 550,000 550,000 550,000
Labor 686,875 704,046 721,648 739,689 758,181 777,136 796,564 816,478 836,890 857,812 879,258
Loan Payment 1,859,120 1,859,120 1,859,120 1,859,120 1,859,120 1,859,120
Rent 137,375 140,809 144,330 147,938 151,636 155,427 159,313 163,296 167,378 171,562 175,852
3,233,370 3,253,976 3,275,098 3,296,747 3,318,938 3,341,683 1,505,877 1,529,774 1,554,268 1,579,375 1,605,109
3,635,376 3,786,489 3,941,379 4,100,141 4,262,873 4,429,673 6,459,763 6,635,007 6,814,632 6,998,748 7,187,467
1,401,595 1,327,141 1,255,845 1,187,665 1,122,548 1,060,428 1,405,833 1,312,701 1,225,672 1,144,351 1,068,371
Production (MWh)
Total Revenue
Total Cost
Total Cashflow
Discounted Cashflow
84,749,336$
29,991,878$
Total 20 Year Cashflow
Total 20 Year Discounted
Cashflow
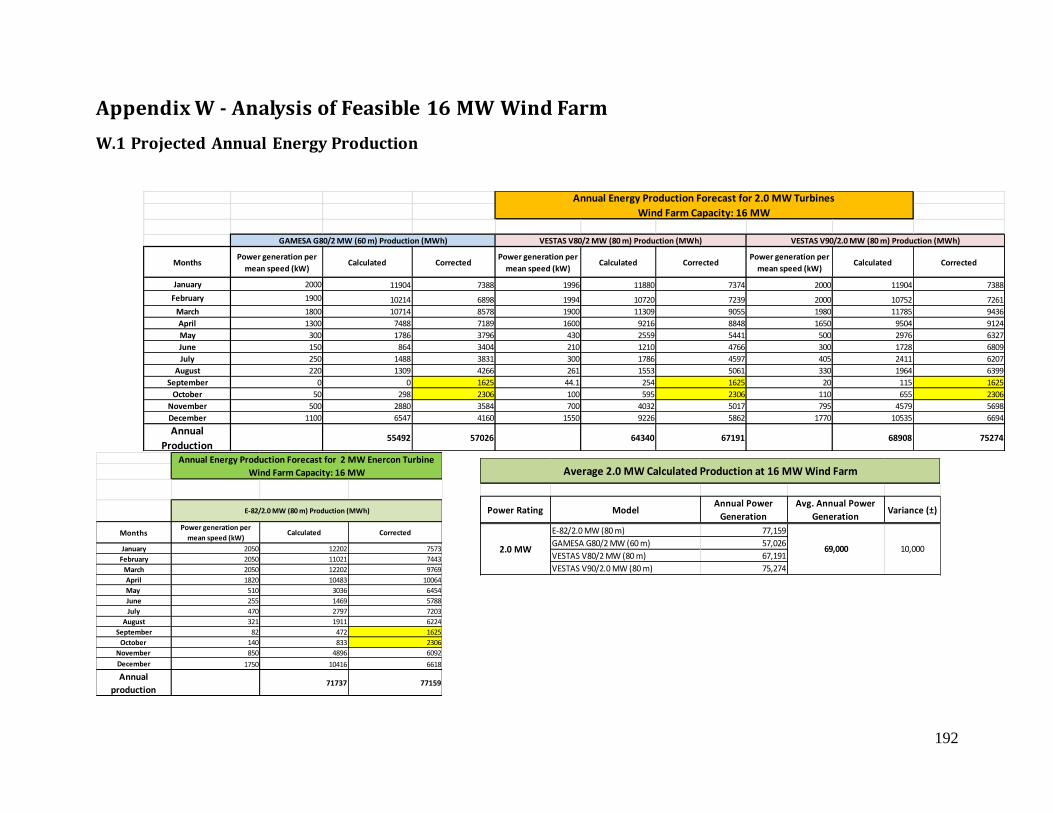
192
Power Rating ModelAnnual Power
Generation
Avg. Annual Power
GenerationVariance (±)
E-82/2.0 MW (80 m) 77,159
GAMESA G80/2 MW (60 m) 57,026
VESTAS V80/2 MW (80 m) 67,191
VESTAS V90/2.0 MW (80 m) 75,274
Average 2.0 MW Calculated Production at 16 MW Wind Farm
2.0 MW 10,00069,000
Appendix W - Analysis of Feasible 16 MW Wind Farm
W.1 Projected Annual Energy Production
MonthsPower generation per
mean speed (kW)Calculated Corrected
Power generation per
mean speed (kW)Calculated Corrected
Power generation per
mean speed (kW)Calculated Corrected
January 2000 11904 7388 1996 11880 7374 2000 11904 7388
February 1900 10214 6898 1994 10720 7239 2000 10752 7261
March 1800 10714 8578 1900 11309 9055 1980 11785 9436
April 1300 7488 7189 1600 9216 8848 1650 9504 9124
May 300 1786 3796 430 2559 5441 500 2976 6327
June 150 864 3404 210 1210 4766 300 1728 6809
July 250 1488 3831 300 1786 4597 405 2411 6207
August 220 1309 4266 261 1553 5061 330 1964 6399
September 0 0 1625 44.1 254 1625 20 115 1625
October 50 298 2306 100 595 2306 110 655 2306
November 500 2880 3584 700 4032 5017 795 4579 5698
December 1100 6547 4160 1550 9226 5862 1770 10535 6694
Annual
Production55492 57026 64340 67191 68908 75274
GAMESA G80/2 MW (60 m) Production (MWh) VESTAS V80/2 MW (80 m) Production (MWh)
Annual Energy Production Forecast for 2.0 MW Turbines
Wind Farm Capacity: 16 MW
VESTAS V90/2.0 MW (80 m) Production (MWh)
MonthsPower generation per
mean speed (kW)Calculated Corrected
January 2050 12202 7573
February 2050 11021 7443
March 2050 12202 9769
April 1820 10483 10064
May 510 3036 6454
June 255 1469 5788
July 470 2797 7203
August 321 1911 6224
September 82 472 1625
October 140 833 2306
November 850 4896 6092
December 1750 10416 6618
Annual
production71737 77159
E-82/2.0 MW (80 m) Production (MWh)
Annual Energy Production Forecast for 2 MW Enercon Turbine
Wind Farm Capacity: 16 MW

193
W.2 Projected Revenue
YearBalance Interest
Amount Paid on
PrincipalAnnual Payment
0 31,990,000$
1 1,039,675$ 1,688,707$ 2,728,382$
Interest Rate: 0.0325 2 30,301,293$ 984,792$ 1,743,590$ 2,728,382$
3 28,557,704$ 928,125$ 1,800,256$ 2,728,382$
4 26,757,447$ 869,617$ 1,858,765$ 2,728,382$
5 24,898,683$ 809,207$ 1,919,174$ 2,728,382$
6 22,979,508$ 746,834$ 1,981,548$ 2,728,382$
7 20,997,961$ 682,434$ 2,045,948$ 2,728,382$
8 18,952,013$ 615,940$ 2,112,441$ 2,728,382$
$/kWh 9 16,839,571$ 547,286$ 2,181,096$ 2,728,382$
of revenue 10 14,658,476$ 476,400$ 2,251,981$ 2,728,382$
11 12,406,495$ 403,211$ 2,325,171$ 2,728,382$
12 10,081,324$ 327,643$ 2,400,739$ 2,728,382$
of revenue 13 7,680,585$ 249,619$ 2,478,763$ 2,728,382$
14 5,201,823$ 169,059$ 2,559,322$ 2,728,382$
15 2,642,500$ 85,881$ 2,642,500$ 2,728,382$
MWh Total 8,935,725$ 31,990,000$ 40,925,725$
Loan Payment
Initial Investment
ESPH investment 13,710,000$
15 Year Loan 31,990,000$
10%
Loan Payment 2,728,382$
Initial Cost
Construction
$ 44,800,000 Wind Turbine Cost
Legal Fees
Transmission Line $ 900,000
Estimated Production of Proposed Site 69,000
Expected Rate of Inflation 10%
Wind Farm Capacity: 16 MW with 2.0 MW Turbines
Rate of Inflation 10%
Rent 2%
Revenue
Expected Price of Electricity Varies by Year
Costs Over Time
Operation and Maintenance 0.01
Labor Cost

194
Year 1 2 3 4 5 6 7 8 9
69,000 69,000 69,000 69,000 69,000 69,000 69,000 69,000 69,000
Revenue
Price of Electricity (per kWh) 0.100 0.103 0.105 0.108 0.110 0.113 0.116 0.119 0.122
6,900,000 7,072,500 7,249,313 7,430,545 7,616,309 7,806,717 8,001,885 8,201,932 8,406,980
Costs
O&M 690,000 690,000 690,000 690,000 690,000 690,000 690,000 690,000 690,000
Labor 690,000 707,250 724,931 743,055 761,631 780,672 800,188 820,193 840,698
Loan Payment 2,728,382 2,728,382 2,728,382 2,728,382 2,728,382 2,728,382 2,728,382 2,728,382 2,728,382
Rent 138,000 141,450 144,986 148,611 152,326 156,134 160,038 164,039 168,140
4,246,382 4,267,082 4,288,299 4,310,047 4,332,339 4,355,188 4,378,608 4,402,613 4,427,219
2,653,618 2,805,418 2,961,013 3,120,498 3,283,970 3,451,529 3,623,277 3,799,318 3,979,761
2,412,380 2,318,528 2,224,653 2,131,342 2,039,087 1,948,298 1,859,314 1,772,410 1,687,807
13,710,000$ 11,297,620$ 8,979,092$ 6,754,439$ 4,623,097$ 2,584,010$ 635,711$
Total Cashflow
Discounted Cashflow
ESPH Initial Investment
Payback
Wind Farm Capacity: 16 MW with 2.0 MW Turbines
Cost Analysis and Payback Period
Production (MWh)
Total Revenue
Total Cost

195
Year 10 11 12 13 14 15 16 17 18 19 20
69,000 69,000 69,000 69,000 69,000 69,000 69,000 69,000 69,000 69,000 69,000
Revenue
Price of Electricity (per kWh) 0.125 0.128 0.131 0.134 0.138 0.141 0.145 0.148 0.152 0.156 0.160
8,617,154 8,832,583 9,053,398 9,279,733 9,511,726 9,749,519 9,993,257 10,243,089 10,499,166 10,761,645 11,030,686
Costs
O&M 690,000 690,000 690,000 690,000 690,000 690,000 690,000 690,000 690,000 690,000 690,000
Labor 861,715 883,258 905,340 927,973 951,173 974,952 999,326 1,024,309 1,049,917 1,076,165 1,103,069
Loan Payment 2,728,382 2,728,382 2,728,382 2,728,382 2,728,382 2,728,382
Rent 172,343 176,652 181,068 185,595 190,235 194,990 199,865 204,862 209,983 215,233 220,614
4,452,440 4,478,292 4,504,789 4,531,950 4,559,789 4,588,324 1,889,191 1,919,171 1,949,900 1,981,397 2,013,682
4,164,714 4,354,292 4,548,609 4,747,783 4,951,937 5,161,195 8,104,066 8,323,918 8,549,266 8,780,248 9,017,004
1,605,678 1,526,153 1,449,327 1,375,264 1,304,000 1,235,549 1,763,681 1,646,843 1,537,661 1,435,641 1,340,320
Production (MWh)
Total Revenue
Total Cost
Total Cashflow
Discounted Cashflow
100,381,436$
34,613,935$
Total 20 Year
Discounted Cashflow
Total 20 Year Cashflow
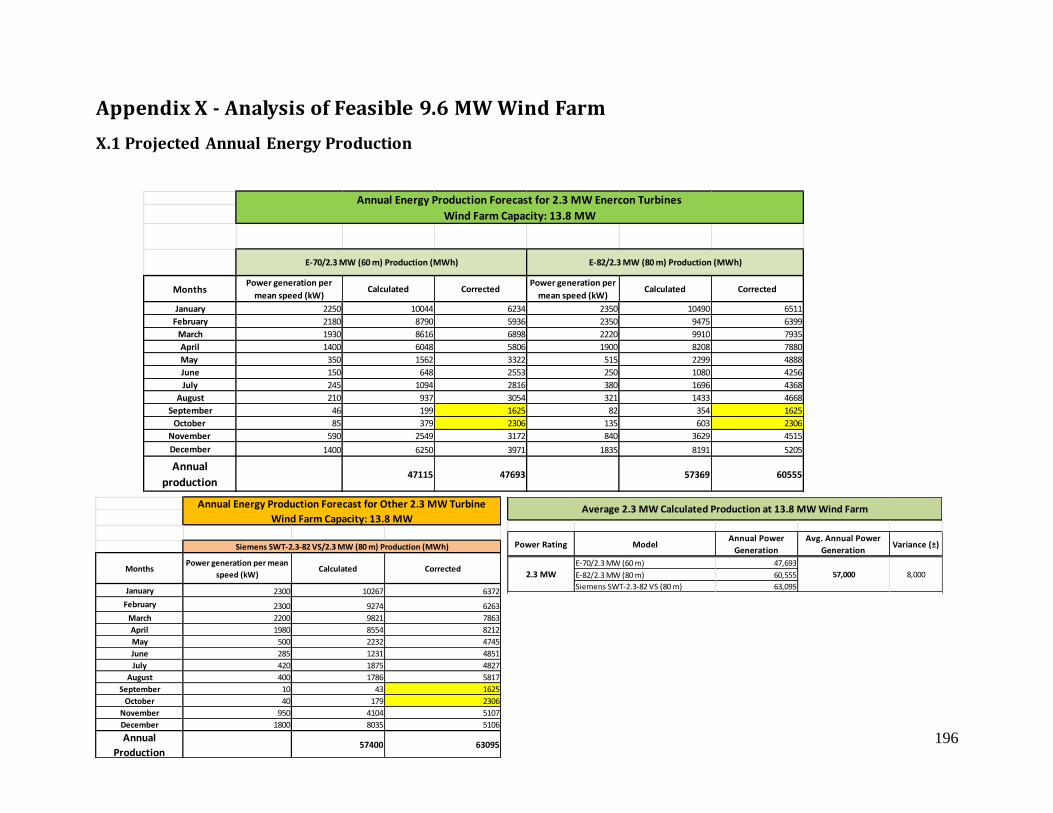
196
MonthsPower generation per mean
speed (kW)Calculated Corrected
January 2300 10267 6372
February 2300 9274 6263
March 2200 9821 7863
April 1980 8554 8212
May 500 2232 4745
June 285 1231 4851
July 420 1875 4827
August 400 1786 5817
September 10 43 1625
October 40 179 2306
November 950 4104 5107
December 1800 8035 5106
Annual
Production57400 63095
Siemens SWT-2.3-82 VS/2.3 MW (80 m) Production (MWh)
Annual Energy Production Forecast for Other 2.3 MW Turbine
Wind Farm Capacity: 13.8 MW
Power Rating ModelAnnual Power
Generation
Avg. Annual Power
GenerationVariance (±)
E-70/2.3 MW (60 m) 47,693
E-82/2.3 MW (80 m) 60,555
Siemens SWT-2.3-82 VS (80 m) 63,095
Average 2.3 MW Calculated Production at 13.8 MW Wind Farm
2.3 MW 8,00057,000
Appendix X - Analysis of Feasible 9.6 MW Wind Farm
X.1 Projected Annual Energy Production
MonthsPower generation per
mean speed (kW)Calculated Corrected
Power generation per
mean speed (kW)Calculated Corrected
January 2250 10044 6234 2350 10490 6511
February 2180 8790 5936 2350 9475 6399
March 1930 8616 6898 2220 9910 7935
April 1400 6048 5806 1900 8208 7880
May 350 1562 3322 515 2299 4888
June 150 648 2553 250 1080 4256
July 245 1094 2816 380 1696 4368
August 210 937 3054 321 1433 4668
September 46 199 1625 82 354 1625
October 85 379 2306 135 603 2306
November 590 2549 3172 840 3629 4515
December 1400 6250 3971 1835 8191 5205
Annual
production47115 47693 57369 60555
E-82/2.3 MW (80 m) Production (MWh)E-70/2.3 MW (60 m) Production (MWh)
Annual Energy Production Forecast for 2.3 MW Enercon Turbines
Wind Farm Capacity: 13.8 MW
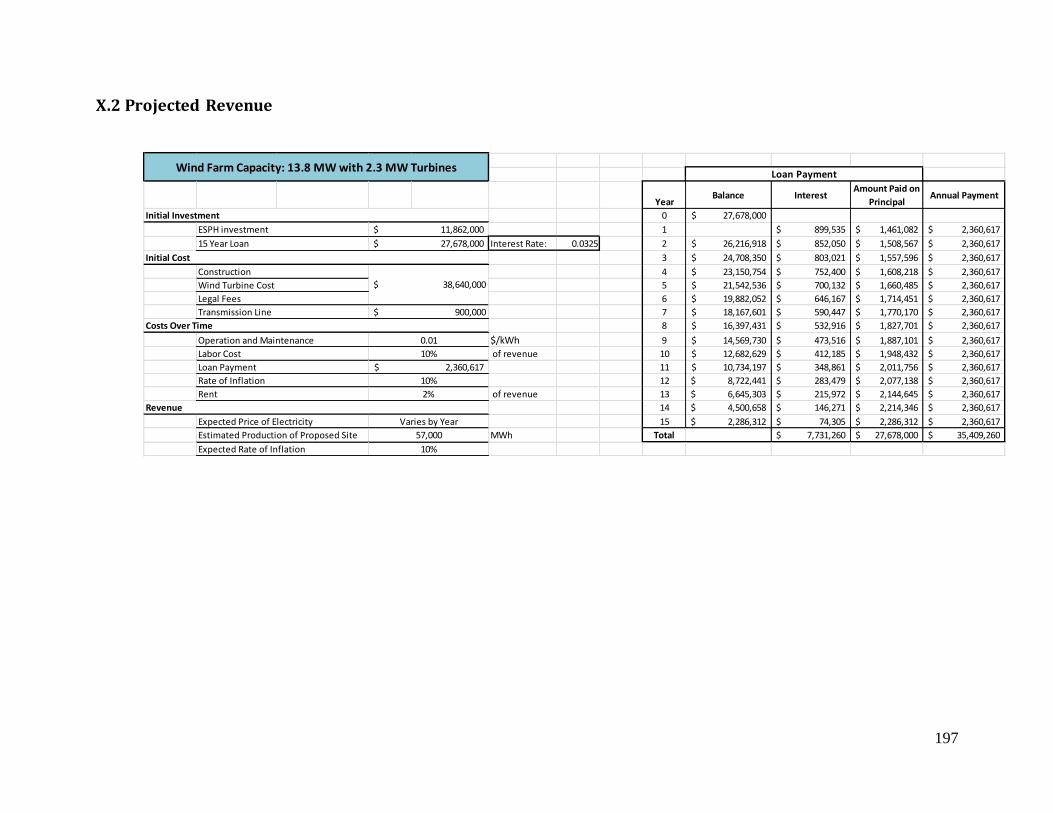
197
X.2 Projected Revenue
YearBalance Interest
Amount Paid on
PrincipalAnnual Payment
0 27,678,000$
1 899,535$ 1,461,082$ 2,360,617$
Interest Rate: 0.0325 2 26,216,918$ 852,050$ 1,508,567$ 2,360,617$
3 24,708,350$ 803,021$ 1,557,596$ 2,360,617$
4 23,150,754$ 752,400$ 1,608,218$ 2,360,617$
5 21,542,536$ 700,132$ 1,660,485$ 2,360,617$
6 19,882,052$ 646,167$ 1,714,451$ 2,360,617$
7 18,167,601$ 590,447$ 1,770,170$ 2,360,617$
8 16,397,431$ 532,916$ 1,827,701$ 2,360,617$
$/kWh 9 14,569,730$ 473,516$ 1,887,101$ 2,360,617$
of revenue 10 12,682,629$ 412,185$ 1,948,432$ 2,360,617$
11 10,734,197$ 348,861$ 2,011,756$ 2,360,617$
12 8,722,441$ 283,479$ 2,077,138$ 2,360,617$
of revenue 13 6,645,303$ 215,972$ 2,144,645$ 2,360,617$
14 4,500,658$ 146,271$ 2,214,346$ 2,360,617$
15 2,286,312$ 74,305$ 2,286,312$ 2,360,617$
MWh Total 7,731,260$ 27,678,000$ 35,409,260$
Loan Payment
Initial Investment
ESPH investment 11,862,000$
15 Year Loan 27,678,000$
10%
Loan Payment 2,360,617$
Initial Cost
Construction
$ 38,640,000 Wind Turbine Cost
Legal Fees
Transmission Line $ 900,000
Estimated Production of Proposed Site 57,000
Expected Rate of Inflation 10%
Wind Farm Capacity: 13.8 MW with 2.3 MW Turbines
Rate of Inflation 10%
Rent 2%
Revenue
Expected Price of Electricity Varies by Year
Costs Over Time
Operation and Maintenance 0.01
Labor Cost

198
Year 1 2 3 4 5 6 7 8 9
57,000 57,000 57,000 57,000 57,000 57,000 57,000 57,000 57,000
Revenue
Price of Electricity (per kWh) 0.100 0.103 0.105 0.108 0.110 0.113 0.116 0.119 0.122
5,700,000 5,842,500 5,988,563 6,138,277 6,291,733 6,449,027 6,610,252 6,775,509 6,944,897
Costs
O&M 570,000 570,000 570,000 570,000 570,000 570,000 570,000 570,000 570,000
Labor 570,000 584,250 598,856 613,828 629,173 644,903 661,025 677,551 694,490
Loan Payment 2,360,617 2,360,617 2,360,617 2,360,617 2,360,617 2,360,617 2,360,617 2,360,617 2,360,617
Rent 114,000 116,850 119,771 122,766 125,835 128,981 132,205 135,510 138,898
3,614,617 3,631,717 3,649,245 3,667,210 3,685,625 3,704,501 3,723,848 3,743,678 3,764,005
2,085,383 2,210,783 2,339,318 2,471,066 2,606,108 2,744,526 2,886,405 3,031,830 3,180,892
1,895,802 1,827,093 1,757,564 1,687,771 1,618,188 1,549,214 1,481,182 1,414,371 1,349,009
11,862,000$ 9,966,198$ 8,139,104$ 6,381,540$ 4,693,769$ 3,075,581$ 1,526,367$ 45,185$
Total Cashflow
Discounted Cashflow
ESPH Initial Investment
Payback
Wind Farm Capacity: 13.8 MW with 2.3 MW Turbines
Cost Analysis and Payback Period
Production (MWh)
Total Revenue
Total Cost
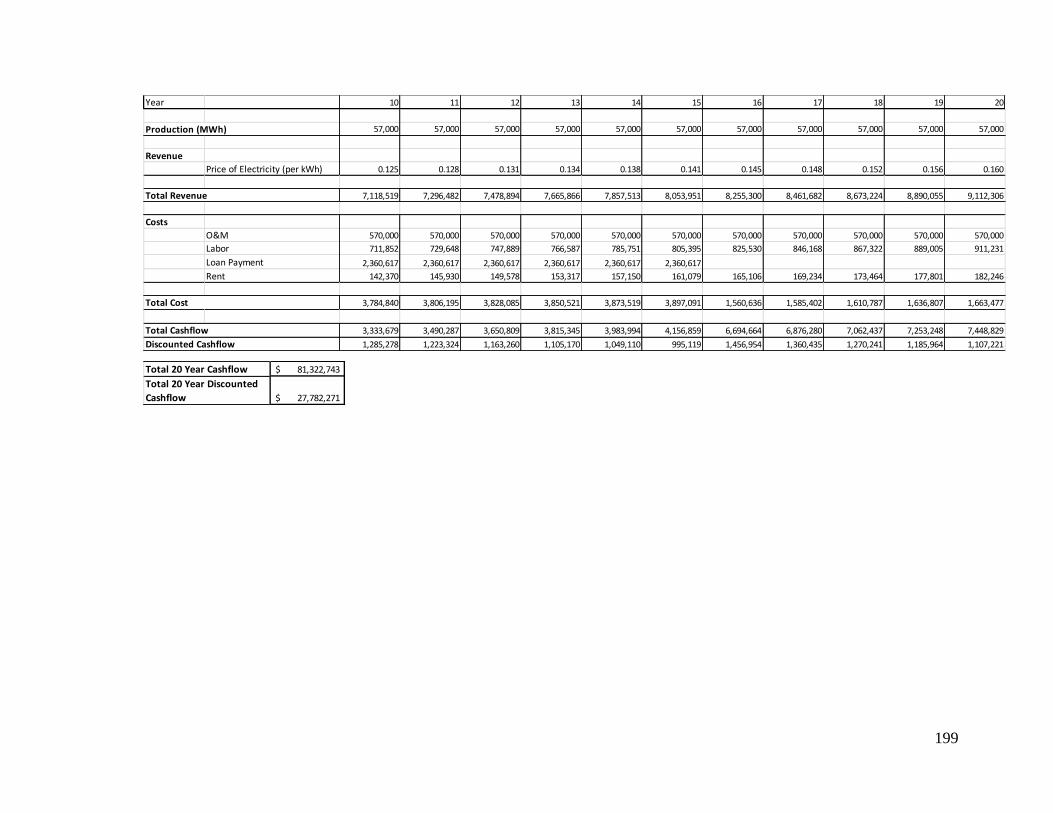
199
Year 10 11 12 13 14 15 16 17 18 19 20
57,000 57,000 57,000 57,000 57,000 57,000 57,000 57,000 57,000 57,000 57,000
Revenue
Price of Electricity (per kWh) 0.125 0.128 0.131 0.134 0.138 0.141 0.145 0.148 0.152 0.156 0.160
7,118,519 7,296,482 7,478,894 7,665,866 7,857,513 8,053,951 8,255,300 8,461,682 8,673,224 8,890,055 9,112,306
Costs
O&M 570,000 570,000 570,000 570,000 570,000 570,000 570,000 570,000 570,000 570,000 570,000
Labor 711,852 729,648 747,889 766,587 785,751 805,395 825,530 846,168 867,322 889,005 911,231
Loan Payment 2,360,617 2,360,617 2,360,617 2,360,617 2,360,617 2,360,617
Rent 142,370 145,930 149,578 153,317 157,150 161,079 165,106 169,234 173,464 177,801 182,246
3,784,840 3,806,195 3,828,085 3,850,521 3,873,519 3,897,091 1,560,636 1,585,402 1,610,787 1,636,807 1,663,477
3,333,679 3,490,287 3,650,809 3,815,345 3,983,994 4,156,859 6,694,664 6,876,280 7,062,437 7,253,248 7,448,829
1,285,278 1,223,324 1,163,260 1,105,170 1,049,110 995,119 1,456,954 1,360,435 1,270,241 1,185,964 1,107,221
Production (MWh)
Total Revenue
Total Cost
Total Cashflow
Discounted Cashflow
81,322,743$
27,782,271$
Total 20 Year Cashflow
Total 20 Year Discounted
Cashflow
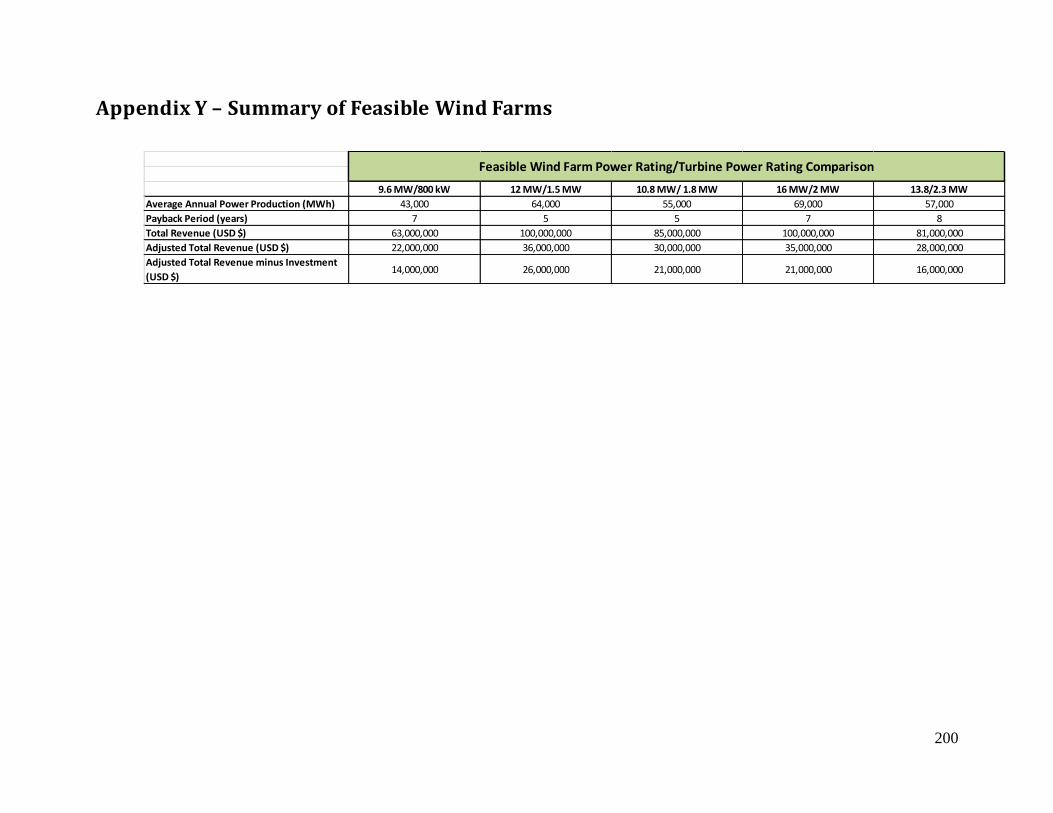
200
Appendix Y – Summary of Feasible Wind Farms
9.6 MW/800 kW 12 MW/1.5 MW 10.8 MW/ 1.8 MW 16 MW/2 MW 13.8/2.3 MW
Average Annual Power Production (MWh) 43,000 64,000 55,000 69,000 57,000
Payback Period (years) 7 5 5 7 8
Total Revenue (USD $) 63,000,000 100,000,000 85,000,000 100,000,000 81,000,000
Adjusted Total Revenue (USD $) 22,000,000 36,000,000 30,000,000 35,000,000 28,000,000
Adjusted Total Revenue minus Investment
(USD $)14,000,000 26,000,000 21,000,000 21,000,000 16,000,000
Feasible Wind Farm Power Rating/Turbine Power Rating Comparison
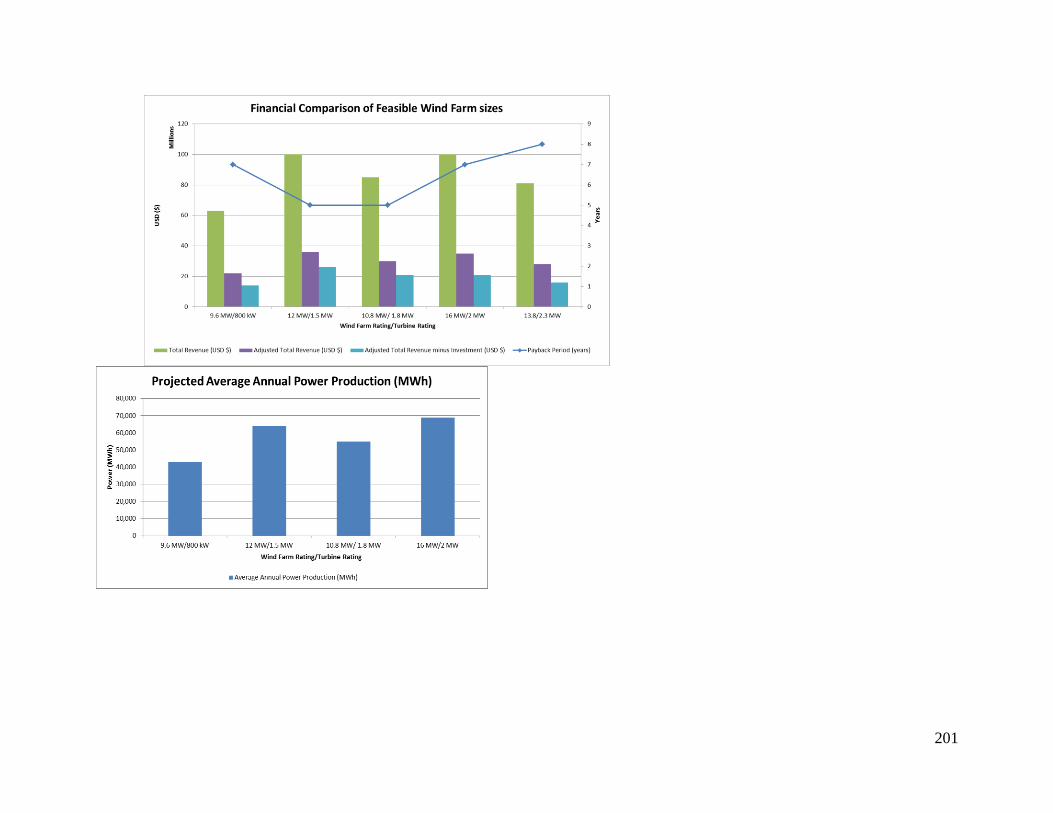
201
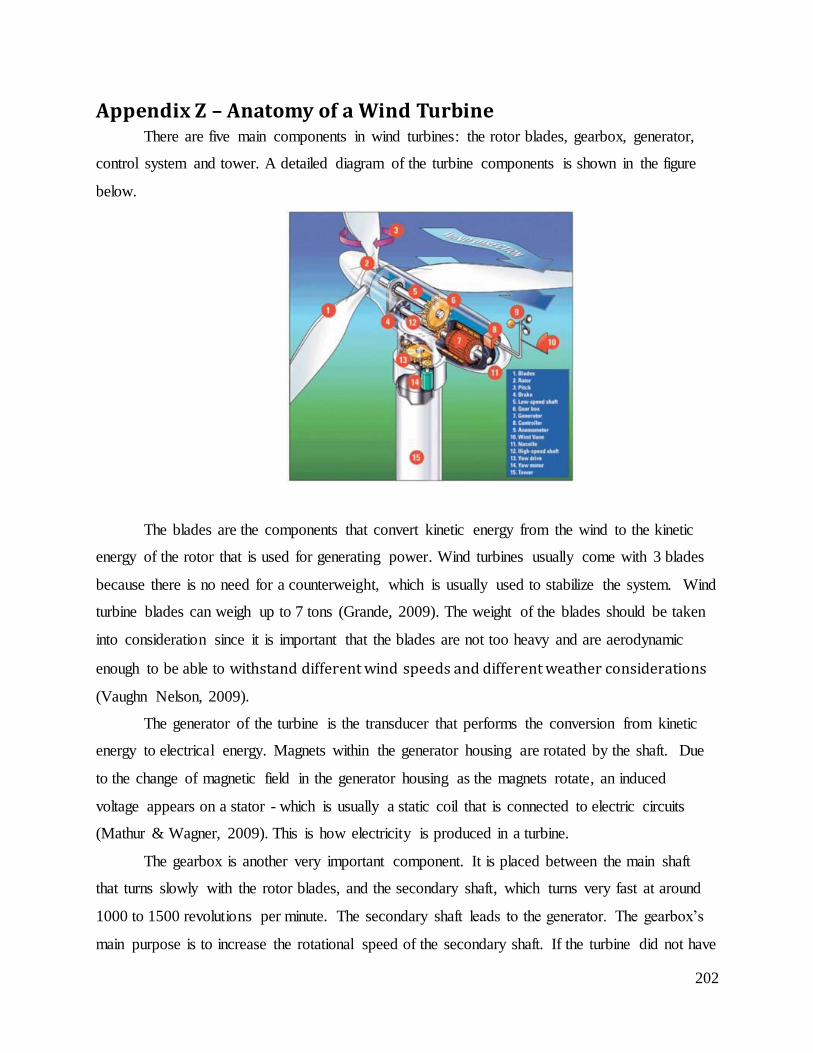
202
Appendix Z – Anatomy of a Wind Turbine There are five main components in wind turbines: the rotor blades, gearbox, generator,
control system and tower. A detailed diagram of the turbine components is shown in the figure
below.
The blades are the components that convert kinetic energy from the wind to the kinetic
energy of the rotor that is used for generating power. Wind turbines usually come with 3 blades
because there is no need for a counterweight, which is usually used to stabilize the system. Wind
turbine blades can weigh up to 7 tons (Grande, 2009). The weight of the blades should be taken
into consideration since it is important that the blades are not too heavy and are aerodynamic
enough to be able to withstand different wind speeds and different weather considerations
(Vaughn Nelson, 2009).
The generator of the turbine is the transducer that performs the conversion from kinetic
energy to electrical energy. Magnets within the generator housing are rotated by the shaft. Due
to the change of magnetic field in the generator housing as the magnets rotate, an induced
voltage appears on a stator - which is usually a static coil that is connected to electric circuits
(Mathur & Wagner, 2009). This is how electricity is produced in a turbine.
The gearbox is another very important component. It is placed between the main shaft
that turns slowly with the rotor blades, and the secondary shaft, which turns very fast at around
1000 to 1500 revolutions per minute. The secondary shaft leads to the generator. The gearbox’s
main purpose is to increase the rotational speed of the secondary shaft. If the turbine did not have

203
a gearbox, then the generator would be rotating at the same speed as the blades. This would
mean that the turbine would need more magnets in the generator to create the same amount of
electrical energy as a turbine with a gearbox. In the current wind turbine market, there are
models available that don’t have a gearbox. Although turbines with gearboxes often end up aging
more quickly, those without them are expensive due to the costs of magnetic poles (Mathur &
Wagner, 2009).
It is important that the wind farm delivers a voltage that can be transferred to the local
electricity grid with the same phase shift and frequency. Synchronous generators sometimes have
additional networks that convert voltages of various frequencies into the one that the electric grid
uses. When the voltage being produced by the wind farm is too large, it will not be connected
directly to the electricity grid of smaller communities, since they would need electricity at a low
voltage. Through the use of a transformer, the voltage from the grid can be lowered in order to
meet the demand of local communities (Manwell, McGowen, & Rogers, 2002).
When the wind speeds are very high and the generated power is higher than the rated
power of a turbine, the wind turbine will break down. There are two ways to ensure that very
high wind speeds will not destroy a wind turbine. One of the common solutions is to have a
turbine that can vary the pitch angle of the blades. Pitch angle is the angle at which the blades
meet the wind. That angle is constant between all the blades. When the wind speeds begin to be
high enough that there is a possibility of damage to the turbine, the pitch angle will be increased,
causing the wind turbine to generate less power and prevent the turbine from being damaged. If
under all pitch angles, the generated power is higher than rated power, then wind turbine should
be turned off. There are special brakes inside the turbine that can stop the rotor blades. The
control system of the turbine is what sets the pitch angle according to wind speed, and decides
whether to apply the brakes (Vaughn Nelson, 2009).
Finally, the tower is the part of a wind turbine on which other components are placed,
including the blades, gearbox and generator. As mentioned previously, height determines wind
speed; therefore, usually the greater the tower height, the higher the wind speed (Mathur &
Wagner, 2009).