Feasibility Study of Biogas Production from Hardly ...
11
energies Article Feasibility Study of Biogas Production from Hardly Degradable Material in Co-Inoculated Bioreactor Spyridon Achinas * and Gerrit Jan Willem Euverink Faculty of Science and Engineering, University of Groningen, Nijenborgh 4, 9747 AG Groningen, The Netherlands; [email protected] * Correspondence: [email protected]; Tel.: +31-50-363-9203 Received: 27 February 2019; Accepted: 15 March 2019; Published: 18 March 2019 Abstract: Anaerobic technology is a well-established technique to wean the fossil fuel-based energy off with various positive environmental inferences. Biowaste treatment is favorable due to its low emissions. Biogas is merely regarded as the main product of anaerobic digestion with high energy value. One of the key concerns of the waste water treatment plants is the vast amount of cellulosic residuals produced after the treatment of waste waters. The fine sieve fraction, collected after the primary sludge removal, has great energy value. In this study, the economic performance of a biogas plant has been analyzed based on net present value and pay-back period concepts. The plant in the base scenario produced 309,571 m 3 biogas per year. The annual electricity production has been 390,059 kWh. The producible heat energy has been 487,574 kWh or 1755 GJ per year. The plant depicts a positive economic situation with 11 years pay-back time, earning low profits and showing a positive net present value of 11,240 €. Keywords: anaerobic digestion; fine sieve fraction; financial modeling; biogas plant 1. Introduction Current environmental and political pressures, the wobbling price of the fuels, and the depleted energy derived from fossil fuel reserves such as crude oil, coal, and natural gas have increased the industrial focus to bioenergy derived from biowaste, and encouraged technological progress in the biogas production sector in the EU [1–3]. In the Netherlands, a vast amount of waste water is yearly treated in WWTPs. Several abatement techniques are applied to treat organic waste, with the anaerobic digestion (AD) technology being widely used for biogas production [4–6]. The AD process comprises four main steps: hydrolysis, acidogenesis, acetogenesis, and methanogenesis. During AD, bioenergy is produced in the form of a gaseous fuel, the so-called biogas, with an approximate composition of 66% CH 4 , 33% CO 2, 0.5% N 2 , 0.1% O 2 , and 103 mg/L biogas H 2 S[7,8]. Biogas can be used for electricity and heat generation or as a vehicle fuel [9–11]. Several studies focus on the potential of biogas in fuel cell systems [12,13]. AD is an appealing technique playing a key role in the bioenergy sector within the EU [14–17]. Co-digestion had been extensively investigated and reported as an alternative solution to treat simultaneously various waste streams [18,19]. The benefit from co-digestion is that the optimal carbon to nitrogen (C:N) ratio (20:1 to 30:1) can be arranged by mixing different substrates. However, an alternative technique was recently reported for the improvement of AD performance. Co-inoculation with two or more inocula provides a vast and wide consortium of microorganism within the bioreactor [20]. The source of the microbial inoculum will influence the degradation efficiency, the bioreactor stability as well as the biogas yield and composition [21–23]. A preceding study cited that the inoculum also provided macro- and micronutrients enhancing the microbial activity and thus augmenting the biogas yield [24]. To date, materials recovery and energy management are Energies 2019, 12, 1040; doi:10.3390/en12061040 www.mdpi.com/journal/energies
Transcript of Feasibility Study of Biogas Production from Hardly ...
energies
Article
Feasibility Study of Biogas Production from HardlyDegradable Material in Co-Inoculated Bioreactor
Spyridon Achinas * and Gerrit Jan Willem Euverink
Faculty of Science and Engineering, University of Groningen, Nijenborgh 4, 9747 AG Groningen,The Netherlands; [email protected]* Correspondence: [email protected]; Tel.: +31-50-363-9203
Received: 27 February 2019; Accepted: 15 March 2019; Published: 18 March 2019�����������������
Abstract: Anaerobic technology is a well-established technique to wean the fossil fuel-based energyoff with various positive environmental inferences. Biowaste treatment is favorable due to its lowemissions. Biogas is merely regarded as the main product of anaerobic digestion with high energyvalue. One of the key concerns of the waste water treatment plants is the vast amount of cellulosicresiduals produced after the treatment of waste waters. The fine sieve fraction, collected after theprimary sludge removal, has great energy value. In this study, the economic performance of a biogasplant has been analyzed based on net present value and pay-back period concepts. The plant inthe base scenario produced 309,571 m3 biogas per year. The annual electricity production has been390,059 kWh. The producible heat energy has been 487,574 kWh or 1755 GJ per year. The plantdepicts a positive economic situation with 11 years pay-back time, earning low profits and showing apositive net present value of 11,240 €.
Keywords: anaerobic digestion; fine sieve fraction; financial modeling; biogas plant
1. Introduction
Current environmental and political pressures, the wobbling price of the fuels, and the depletedenergy derived from fossil fuel reserves such as crude oil, coal, and natural gas have increased theindustrial focus to bioenergy derived from biowaste, and encouraged technological progress in thebiogas production sector in the EU [1–3]. In the Netherlands, a vast amount of waste water is yearlytreated in WWTPs. Several abatement techniques are applied to treat organic waste, with the anaerobicdigestion (AD) technology being widely used for biogas production [4–6].
The AD process comprises four main steps: hydrolysis, acidogenesis, acetogenesis, andmethanogenesis. During AD, bioenergy is produced in the form of a gaseous fuel, the so-calledbiogas, with an approximate composition of 66% CH4, 33% CO2, 0.5% N2, 0.1% O2, and 103 mg/Lbiogas H2S [7,8]. Biogas can be used for electricity and heat generation or as a vehicle fuel [9–11].Several studies focus on the potential of biogas in fuel cell systems [12,13]. AD is an appealingtechnique playing a key role in the bioenergy sector within the EU [14–17]. Co-digestion had beenextensively investigated and reported as an alternative solution to treat simultaneously various wastestreams [18,19]. The benefit from co-digestion is that the optimal carbon to nitrogen (C:N) ratio (20:1 to30:1) can be arranged by mixing different substrates.
However, an alternative technique was recently reported for the improvement of AD performance.Co-inoculation with two or more inocula provides a vast and wide consortium of microorganism withinthe bioreactor [20]. The source of the microbial inoculum will influence the degradation efficiency,the bioreactor stability as well as the biogas yield and composition [21–23]. A preceding study citedthat the inoculum also provided macro- and micronutrients enhancing the microbial activity andthus augmenting the biogas yield [24]. To date, materials recovery and energy management are
Energies 2019, 12, 1040; doi:10.3390/en12061040 www.mdpi.com/journal/energies
Energies 2019, 12, 1040 2 of 11
pivotal issues to corroborate sustainability [25,26]. Organic material, rich in cellulosic residuals, can becollected with sieves from the influent of a waste water treatment plants [27]. These residuals or FSFcan be digested in anaerobic digesters for energy recovery [28].
This study continues the work of Achinas and Euverink [20] and focusses on the feasibilityof combined inoculation through experimental tests and financial assessment. Cash flow analysiswas performed to evaluate the viability of a biogas plant. PFSF was selected as substrate and twodifferent inocula were used in the experiments. The biogas yield, methane content, pH, redox, FANand FOS/TAC ratio were determined to assess the efficiency of the co-inoculation. It is notable that atechno-economic assessment on the treatment of PFSF has not been previously conducted and reported,thus this study may provide new realistic insight on the exploitation of a different waste material.The two specific objectives of this study were to (1) evaluate the AD performance of co-inoculatedbioreactors treating PFSF in semi-continuous mode and (2) examine the profitability of pilot biogasunit treating PFSF in combination with co-inoculation using the NPV analysis.
2. Materials and Methods
2.1. Inocula and Substrate
The PFSF was obtained from the Blaricum sewage treatment plant in The Netherlands, and wasstored at 6 ◦C to prevent possible hydrolysis. The inocula used in the experimental tests were collectedfrom three different sources and their characteristics are shown in Table 1.
Table 1. Characteristics of the inocula and substrate used in the batch tests.
Parameter Unit IN1 IN2 PFSF
pH - 7.52 7.27 NDTS g·kg−1 47.3 (0.8) 112.9 (1.5) 202.4 (12.9)VS g·kg−1 29.6 (0.4) 61.5 (1.0) 174.8 (6.3)
VS/TS - 0.63 0.55 0.94COD g·kg−1 50.3 (2.2) 81.8 (3.9) ND
VS/COD - 0.59 0.75 ND
IN1: digestate from reactor treating activated sludge, IN2: digestate from reactor treating organic fraction of MSW,ND: not determined. Values are the average of three determinations. In parentheses is given the standard deviation.
The first inoculum (IN1) was obtained from an anaerobic digester treating anaerobic activatedsludge from the WWTP of Garmerwolden (Groningen, The Netherlands). The second inoculum (IN2)was collected from an anaerobic bioreactor treating the organic fraction of MSW in the MSW treatmentplant of Attero (Groningen, The Netherlands). All inocula were stored at 6 ◦C to maintain freshnessand microbial activity and reactivated at 37 ◦C for two days prior to use.
2.2. Semi-Continuous Tests
Two identical 380 mL single-stage continuously stirred reactors (R1, R2) (BioBLU single–usevessels, Eppendorf, Nijmegen, The Netherlands) with working volumes of 304 mL were establishedto perform the semi-continuous digestion tests [29]. The OLR and process conditions used in thesemi-continuous experiment are given in Table 2.
The vessels were placed in a temperature-controlled water bath (36 ◦C) and fed once a day.The PFSF solution was impelled with a syringe pump (NE1000, World Precision Instruments, Sarasota,Florida, USA), 30 mL syringes (inner diameter 23.1 mm Terumo) and tubing (Teflon, outer diameter1.37 mm, inner diameter 1.07 mm).
Energies 2019, 12, 1040 3 of 11
Table 2. Process conditions applied in the semi-continuous tests.
Reactors IN1(%)
IN2(%)
Organic Load(g VSsubstrate·L−1)
Temperature(◦C)
HRT(d)
R1 25 75 1.5 36 20R2 25 75 1.5 36 20
IN1: digestate from reactor treating activated sludge, IN2: digestate from reactor treating organic fraction of MSW,IN3: digested cow manure.
2.3. Analytical Methods
Total and volatile solids (g·kg−1) were estimated according to the Standard Methods of APHA(2005) [30]. pH was calculated using a pH meter (HI991001, Hanna Instruments, Woonsocket, RhodeIsland, USA). Chemical oxygen demand (g·kg−1) and ammonium (g·kg−1) were estimated usingassay test kits (Hach Lange GmbH, Germany) and were quantified by a spectrophotometer (DR3900,Hach, Loveland, Colorado, USA). Free ammonia nitrogen (FAN; g·kg−1) was calculated based on theequation [31]:
N − NH3 =TAN × 10pH
e(6344
273.15+T ) + 10pH(1)
Total alkalinity (g CaCO3·L−1), total volatile fatty acids (TVFA; mg acetate/L), FOS/TAC(TVFA/TA) ratio were determined using Nordmann titration method. The biogas volume(mL·g VSsubstrate
−1·day−1) was measured according to the methodology followed by Achinas andEuverink [20]. The methane content was determined with a micro gas chromatography (GC)device (single channel 2-stream selector system, Thermo Fisher Scientific Inc, Waltham, MA, USA)equipped with a chromatographic column (PLOT-U). Helium was used as carrier gas at a total flowof 10 mL·min−1. A gas standard consisting of 50% (v/v) CH4, 20% (v/v) CO2 and 30% (v/v) N2 wasused to calibrate the micro GC device.
2.4. Statistical Analysis
Statistical significance of the data was determined by one-way ANOVA using Microsoft OfficeExcel (Microsoft, Redmond, WA, USA) with a threshold p-value of 0.05.
2.5. Economics
As for all investments, the economic assessment is a pivotal factor for the final decision (go/no-go)to continue with a project. In this part, the costs and revenues of a biogas installation treating finesieve fraction are discussed. The AD plant comprises investment costs, operation and maintenancecosts, insurance and taxes. The investment costs for a biogas unit depends on the specific needs of theinstallation. As a result, it is difficult to clarify investment costs beforehand. For better comprehension,it is indispensable to state that the total cost of installation for a biogas power plant can vary from2500 € to 7500 € per kWh/h electricity generation [32]. In this study, the equation estimating the totalcapital investment (TCI) is:
TCI = TIC · Pel (2)
where TCI is total capital investment (€), TIC is total installation cost per power installed (€/kW),and Pel is total power installed (kW). It is possible to estimate also the electricity yield (E) and the heatyield (H) multiplying the total methane by specific conversion factors: for electricity the conversionfactor is included between 1.8 and 2.2 kWhe [33,34], whereas the heat conversion factor could varyfrom 2 kWh/m3 biogas to 3 kWh/m3 biogas [33]. In this study, the average values are consideredusing the following equations:
E (kWhe) = Total Methane · 2 (3)
H (kWh) = Total Methane · 2.5 (4)
Energies 2019, 12, 1040 4 of 11
To evaluate the profitability of the installation, NPV, IRR and PP concepts were used as valuationcriteria. NPV analysis is a form of intrinsic valuation and is used extensively across finance fordetermining the value of a business project investment. The NPV is the sum of expected net cash flowsmeasured in today’s currency and is given by:
NPV = −I +n
∑t=0
CAFt
(1 + r)t (5)
and:CAFt = ptYi − vtZi (6)
where CAF is expected cash flow at time t, r is discount factor, and I is initial capital investmentcost. CAF is a function of income pt from i outputs (Y) where output relates to electricity and heat(no income from digestate sale is assumed) and cost νt from i inputs (Z) where input include totaloperating and maintenance costs including labor cost (no cost for feedstock supply and digestatedisposal are assumed). IRR is the discount rate for which the total present value of cash flows equalscost of investment. if the IRR is greater than or equal to the cost of capital, the investor can accept theproject as a good investment.
3. Results
3.1. Experimental Study
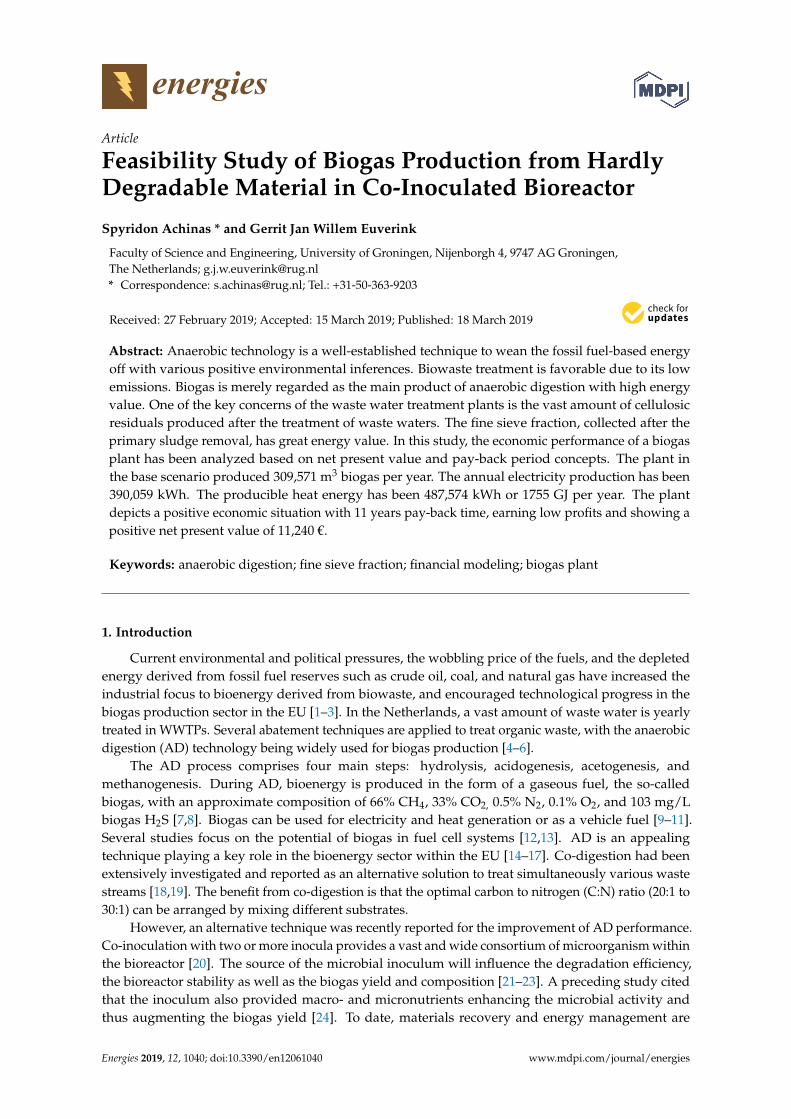
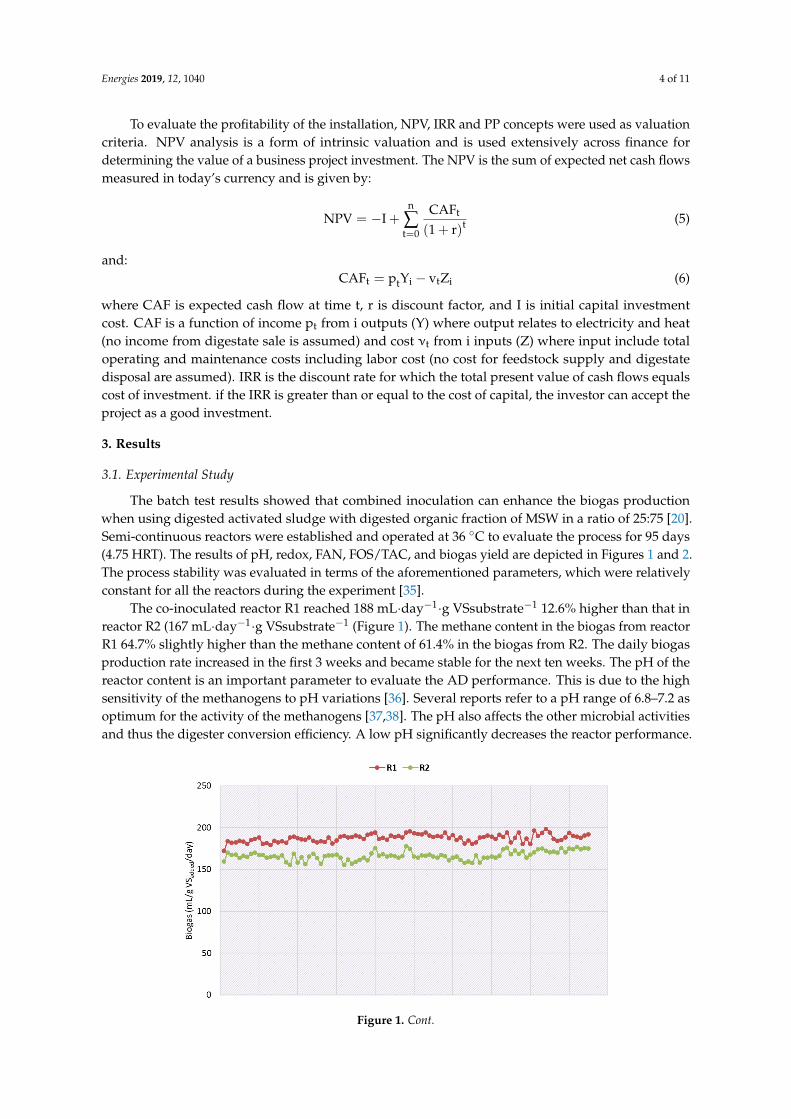
The batch test results showed that combined inoculation can enhance the biogas productionwhen using digested activated sludge with digested organic fraction of MSW in a ratio of 25:75 [20].Semi-continuous reactors were established and operated at 36 ◦C to evaluate the process for 95 days(4.75 HRT). The results of pH, redox, FAN, FOS/TAC, and biogas yield are depicted in Figures 1 and 2.The process stability was evaluated in terms of the aforementioned parameters, which were relativelyconstant for all the reactors during the experiment [35].
The co-inoculated reactor R1 reached 188 mL·day−1·g VSsubstrate−1 12.6% higher than that inreactor R2 (167 mL·day−1·g VSsubstrate−1 (Figure 1). The methane content in the biogas from reactorR1 64.7% slightly higher than the methane content of 61.4% in the biogas from R2. The daily biogasproduction rate increased in the first 3 weeks and became stable for the next ten weeks. The pH of thereactor content is an important parameter to evaluate the AD performance. This is due to the highsensitivity of the methanogens to pH variations [36]. Several reports refer to a pH range of 6.8–7.2 asoptimum for the activity of the methanogens [37,38]. The pH also affects the other microbial activitiesand thus the digester conversion efficiency. A low pH significantly decreases the reactor performance.
Energies 2019, 12 4
for determining the value of a business project investment. The NPV is the sum of expected net cash
flows measured in today s currency and is given by:
NPV = −I + ∑CAFt
(1 + r)t
n
t=0
(5)
and:
CAFt = ptYi − vtZi (6)
where CAF is expected cash flow at time t, r is discount factor, and I is initial capital investment cost.
CAF is a function of income pt from i outputs (Y) where output relates to electricity and heat (no
income from digestate sale is assumed) and cost νt from i inputs (Z) where input include total
operating and maintenance costs including labor cost (no cost for feedstock supply and digestate
disposal are assumed). IRR is the discount rate for which the total present value of cash flows equals
cost of investment. if the IRR is greater than or equal to the cost of capital, the investor can accept the
project as a good investment.
3. Results
3.1. Experimental Study
The batch test results showed that combined inoculation can enhance the biogas production
when using digested activated sludge with digested organic fraction of MSW in a ratio of 25:75 [20].
Semi-continuous reactors were established and operated at 36 °C to evaluate the process for 95 days
(4.75 HRT). The results of pH, redox, FAN, FOS/TAC, and biogas yield are depicted in Figures 1 and
2. The process stability was evaluated in terms of the aforementioned parameters, which were
relatively constant for all the reactors during the experiment [35].
The co-inoculated reactor R1 reached 188 mL∙day-1∙g VSsubstrate-1 12.6% higher than that in
reactor R2 (167 mL∙day-1∙g VSsubstrate-1 (Figure 1). The methane content in the biogas from reactor
R1 64.7% slightly higher than the methane content of 61.4% in the biogas from R2. The daily biogas
production rate increased in the first 3 weeks and became stable for the next ten weeks. The pH of
the reactor content is an important parameter to evaluate the AD performance. This is due to the high
sensitivity of the methanogens to pH variations [36]. Several reports refer to a pH range of 6.8–7.2 as
optimum for the activity of the methanogens [37,38]. The pH also affects the other microbial activities
and thus the digester conversion efficiency. A low pH significantly decreases the reactor
performance.
1
2
3
Figure 1. Cont.
Energies 2019, 12, 1040 5 of 11
Energies 2019, 12 5
Figure 1. Cont.
Figure 1 Evolution of biogas yield, pH, and redox during the semi-continuous experiment.
The pH range for the co-inoculated reactors was between 6.84-7.28 for R1 and 6.85-7.27 for R2
(Figure 1). Preceding studies also state that different microbial species have specific pH values for
optimal activity [39,40].
Concentration of volatile fatty acids and total alkalinity in the reactors were monitored daily and
were plotted as FOS/TAC ratio in Figure 2.
1
2
3
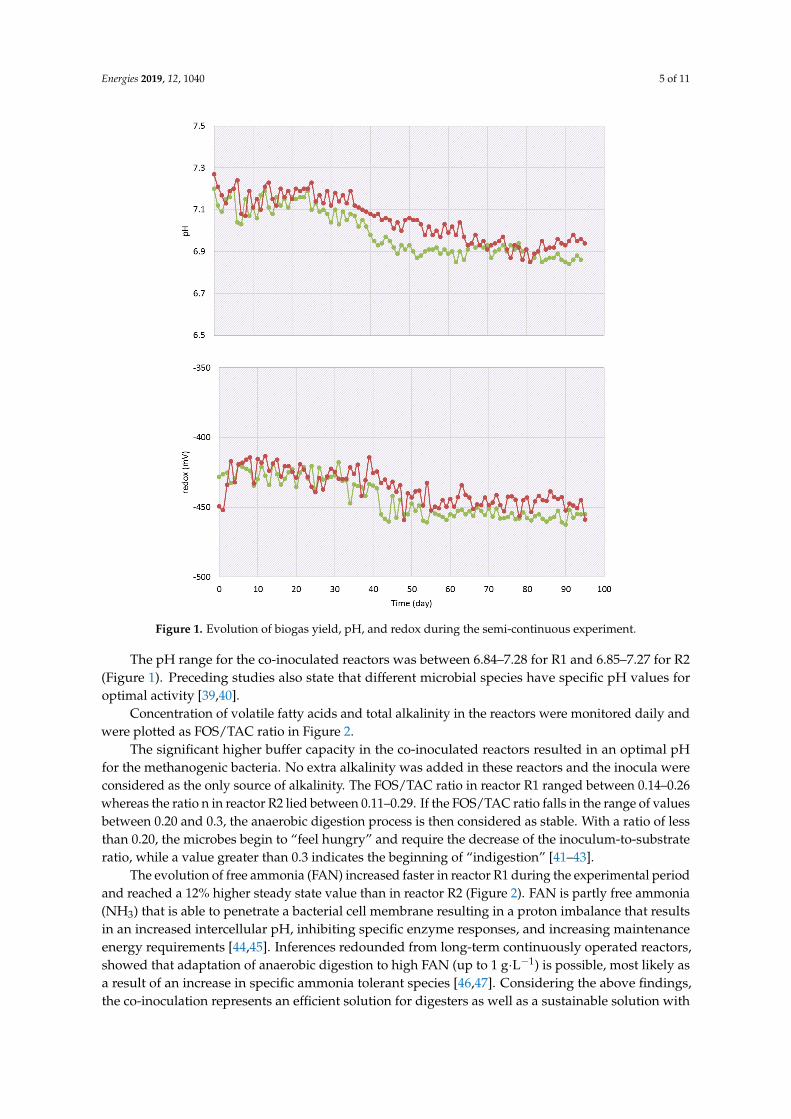
Figure 1. Evolution of biogas yield, pH, and redox during the semi-continuous experiment.
The pH range for the co-inoculated reactors was between 6.84–7.28 for R1 and 6.85–7.27 for R2(Figure 1). Preceding studies also state that different microbial species have specific pH values foroptimal activity [39,40].
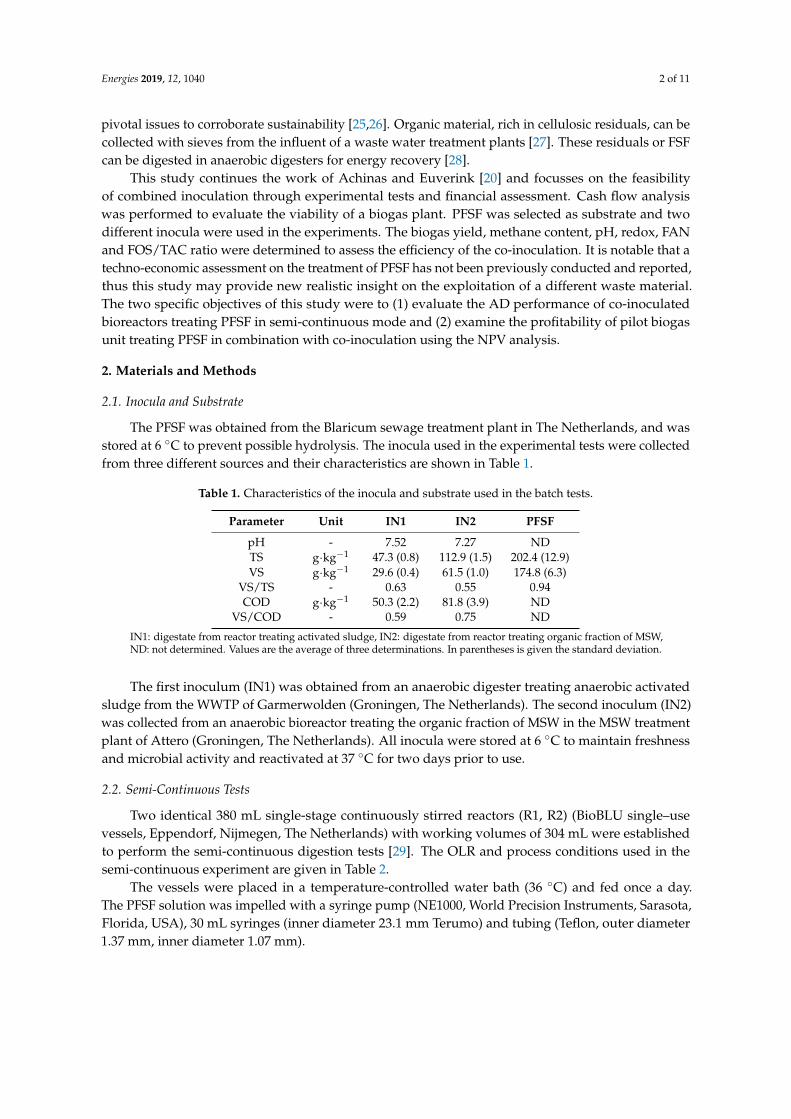
Concentration of volatile fatty acids and total alkalinity in the reactors were monitored daily andwere plotted as FOS/TAC ratio in Figure 2.
The significant higher buffer capacity in the co-inoculated reactors resulted in an optimal pHfor the methanogenic bacteria. No extra alkalinity was added in these reactors and the inocula wereconsidered as the only source of alkalinity. The FOS/TAC ratio in reactor R1 ranged between 0.14–0.26whereas the ratio n in reactor R2 lied between 0.11–0.29. If the FOS/TAC ratio falls in the range of valuesbetween 0.20 and 0.3, the anaerobic digestion process is then considered as stable. With a ratio of lessthan 0.20, the microbes begin to “feel hungry” and require the decrease of the inoculum-to-substrateratio, while a value greater than 0.3 indicates the beginning of “indigestion” [41–43].
The evolution of free ammonia (FAN) increased faster in reactor R1 during the experimental periodand reached a 12% higher steady state value than in reactor R2 (Figure 2). FAN is partly free ammonia(NH3) that is able to penetrate a bacterial cell membrane resulting in a proton imbalance that resultsin an increased intercellular pH, inhibiting specific enzyme responses, and increasing maintenanceenergy requirements [44,45]. Inferences redounded from long-term continuously operated reactors,showed that adaptation of anaerobic digestion to high FAN (up to 1 g·L−1) is possible, most likely asa result of an increase in specific ammonia tolerant species [46,47]. Considering the above findings,the co-inoculation represents an efficient solution for digesters as well as a sustainable solution with

Energies 2019, 12, 1040 6 of 11
ecological benefits. A financial evaluation is interesting to assess other factors than the mixing ratio forfull-scale applications.
Energies 2019, 12 5
Figure 1. Cont.
Figure 1 Evolution of biogas yield, pH, and redox during the semi-continuous experiment.
The pH range for the co-inoculated reactors was between 6.84-7.28 for R1 and 6.85-7.27 for R2
(Figure 1). Preceding studies also state that different microbial species have specific pH values for
optimal activity [39,40].
Concentration of volatile fatty acids and total alkalinity in the reactors were monitored daily and
were plotted as FOS/TAC ratio in Figure 2.
1
2
3
Energies 2019, 12 6
Figure 2. Cont.
Figure 2. Evolution of FOS/TAC and FAN during the semi-continuous experiment.
The significant higher buffer capacity in the co-inoculated reactors resulted in an optimal pH for
the methanogenic bacteria. No extra alkalinity was added in these reactors and the inocula were
considered as the only source of alkalinity. The FOS/TAC ratio in reactor R1 ranged between 0.14 -
0.26 whereas the ratio n in reactor R2 lied between 0.11–0.29. If the FOS/TAC ratio falls in the range
of values between 0.20 and 0.3, the anaerobic digestion process is then considered as stable. With a
ratio of less than 0.20, the microbes begin to “feel hungry” and require the decrease of the inoculum-
to-substrate ratio, while a value greater than 0.3 indicates the beginning of “indigestion” [41–43].
The evolution of free ammonia (FAN) increased faster in reactor R1 during the experimental
period and reached a 12% higher steady state value than in reactor R2 (Figure 2). FAN is partly free
ammonia (NH3) that is able to penetrate a bacterial cell membrane resulting in a proton imbalance
that results in an increased intercellular pH, inhibiting specific enzyme responses, and increasing
maintenance energy requirements [44,45]. Inferences redounded from long-term continuously
operated reactors, showed that adaptation of anaerobic digestion to high FAN (up to 1 g∙L-1) is
possible, most likely as a result of an increase in specific ammonia tolerant species [46,47].
Considering the above findings, the co-inoculation represents an efficient solution for digesters as
well as a sustainable solution with ecological benefits. A financial evaluation is interesting to assess
other factors than the mixing ratio for full-scale applications.
3.2. Feasibility Study
The biogas yield, methane content, and AD performance from the experimental study support
the financial assessment. The annual consumption of toilet paper in the Netherlands is approximately
180 kton [48]. Assuming 70% recovery, the FSF that can be annually extracted from waste water
treatment plants is up to 126 kton (dry basis) or 630 kton pressed FSF (wet basis). In our study, we
examined the case of 10 kton pressed FSF (wet basis) that corresponds to 1.6% of the total capacity of
pressed FSF treatment potential in The Netherlands. To have a prudential assessment and avoid
overestimation, the values of Table 3 were set for the base scenario of the biogas installation:
Figure 2. Evolution of FOS/TAC and FAN during the semi-continuous experiment.
3.2. Feasibility Study
The biogas yield, methane content, and AD performance from the experimental study supportthe financial assessment. The annual consumption of toilet paper in the Netherlands is approximately180 kton [48]. Assuming 70% recovery, the FSF that can be annually extracted from waste watertreatment plants is up to 126 kton (dry basis) or 630 kton pressed FSF (wet basis). In our study, weexamined the case of 10 kton pressed FSF (wet basis) that corresponds to 1.6% of the total capacityof pressed FSF treatment potential in The Netherlands. To have a prudential assessment and avoidoverestimation, the values of Table 3 were set for the base scenario of the biogas installation:
Investment is paid from own equity capital (100% down payment) with no borrowed capital(i.e., loan) or subsidy. We assumed 12 years as the average life-span of the installation with a discountrate of 7%. In addition, costs for the maintenance of digester and CHP unit are included in the for theoperation and maintenance in the O&M cost.
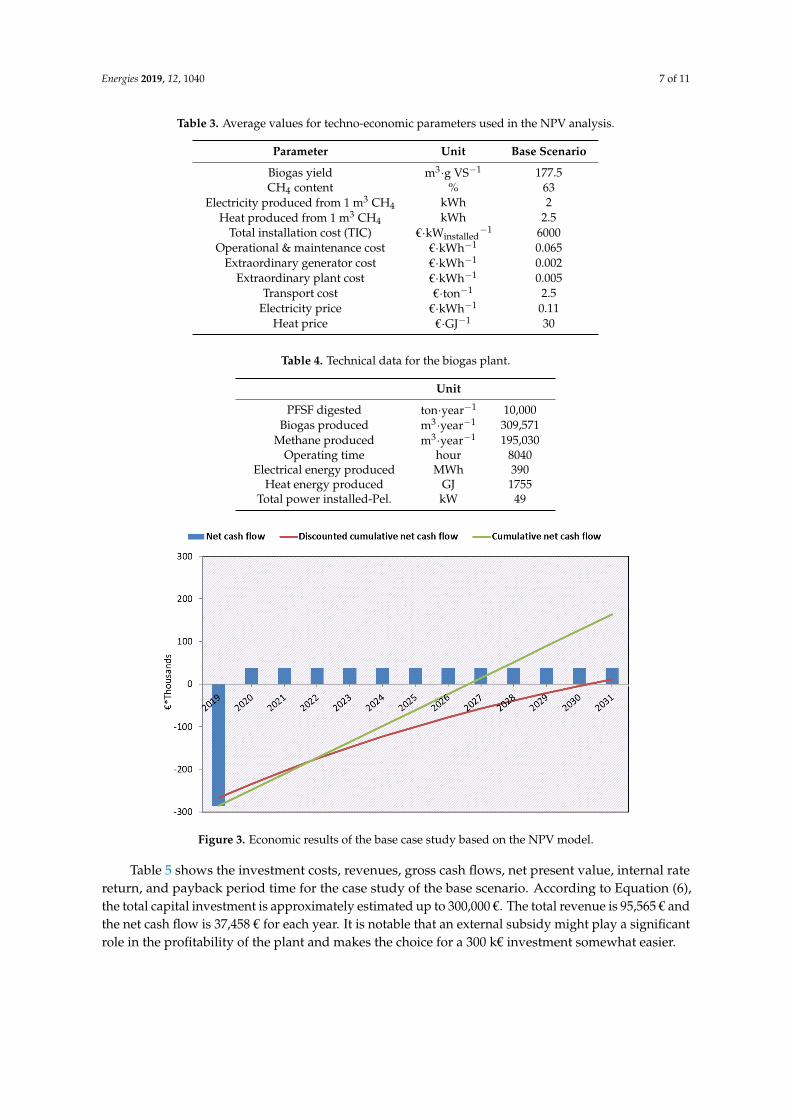
The base scenario produces 39 kWh per ton feedstock digested based on the values of Table 4.Further to the biogas quantity, the economic analysis for the biogas plant that used pressed fine sievefraction as a substrate has been examined for the NPV concept. Higher NPV values represent greatereconomic benefits. In a “no subsidy” situation, the plant has 11 years payback time (PP), and showinga positive NPV of 11,240 € and IRR of 8% (Figure 3).
Energies 2019, 12, 1040 7 of 11
Table 3. Average values for techno-economic parameters used in the NPV analysis.
Parameter Unit Base Scenario
Biogas yield m3·g VS−1 177.5CH4 content % 63
Electricity produced from 1 m3 CH4 kWh 2Heat produced from 1 m3 CH4 kWh 2.5
Total installation cost (TIC) €·kWinstalled−1 6000
Operational & maintenance cost €·kWh−1 0.065Extraordinary generator cost €·kWh−1 0.002
Extraordinary plant cost €·kWh−1 0.005Transport cost €·ton−1 2.5
Electricity price €·kWh−1 0.11Heat price €·GJ−1 30
Table 4. Technical data for the biogas plant.
Unit
PFSF digested ton·year−1 10,000Biogas produced m3·year−1 309,571
Methane produced m3·year−1 195,030Operating time hour 8040
Electrical energy produced MWh 390Heat energy produced GJ 1755
Total power installed-Pel. kW 49
Energies 2019, 12 7
Table 3 Average values for techno-economic parameters used in the NPV analysis.
Parameter Unit Base scenario
Biogas yield m3 ∙g VS-1 177.5
CH4 content % 63
Electricity produced from 1 m3 CH4 kWh 2
Heat produced from 1 m3 CH4 kWh 2.5
Total installation cost (TIC) €∙kWinstalled-1 6,000
Operational & maintenance cost €∙kWh-1 0.065
Extraordinary generator cost €∙kWh-1 0.002
Extraordinary plant cost €∙kWh-1 0.005
Transport cost €∙ton-1 2.5
Electricity price €∙kWh-1 0.11
Heat price €∙GJ-1 30
Investment is paid from own equity capital (100% down payment) with no borrowed capital
(i.e., loan) or subsidy. We assumed 12 years as the average life-span of the installation with a discount
rate of 7%. In addition, costs for the maintenance of digester and CHP unit are included in the for the
operation and maintenance in the O&M cost.
The base scenario produces 39 kWh per ton feedstock digested based on the values of Table 4.
Further to the biogas quantity, the economic analysis for the biogas plant that used pressed fine sieve
fraction as a substrate has been examined for the NPV concept. Higher NPV values represent greater
economic benefits. In a “no subsidy” situation, the plant has 11 years payback time (PP), and showing
a positive NPV of 11,240 € and IRR of 8% (Figure 3).
Table 4. Technical data for the biogas plant.
Unit
PFSF digested ton∙year-1 10,000
Biogas produced m3∙year-1 309,571
Methane produced m3∙year-1 195,030
Operating time hour 8040
Electrical energy produced MWh 390
Heat energy produced GJ 1755
Total power installed-Pel. kW 49
Figure 3. Economic results of the base case study based on the NPV model. Figure 3. Economic results of the base case study based on the NPV model.
Table 5 shows the investment costs, revenues, gross cash flows, net present value, internal ratereturn, and payback period time for the case study of the base scenario. According to Equation (6),the total capital investment is approximately estimated up to 300,000 €. The total revenue is 95,565 € andthe net cash flow is 37,458 € for each year. It is notable that an external subsidy might play a significantrole in the profitability of the plant and makes the choice for a 300 k€ investment somewhat easier.
Energies 2019, 12, 1040 8 of 11
Table 5. Economic results of the case study based on the NPV model.
PresentYear Year Year Year Year Year
1 2 3 6 9 12
InvestmentPaid capital −291,089 - - - - - -O&M cost −25,354 −25,354 −25,354 −25,354 −25,354 −25,354EGM cost −780 −780 −780 −780 −780 −780EPM cost −1950 −1950 −1950 −1950 −1950 −1950
Transport cost −25,000 −25,000 −25,000 −25,000 −25,000 −25,000Total −291,089 −53,084 −53,084 −53,084 −53,084 −53,084 −53,084
RevenuesElectricity revenue 42,907 42,907 42,907 42,907 42,907 42,907
Heat revenue 52,658 52,658 52,658 52,658 52,658 52,658Total revenues 95,565 95,565 95,565 95,565 95,565 95,565
Cash flowsGross cash flow 42,480 42,480 42,480 42,480 42,480 42,480
EBITDA 42,480 42,480 42,480 42,480 42,480 42,480Asset value 268,698 246,306 223,915 156,740 89,566 22,391
Fiscal depreciation 22,391 22,391 22,391 22,391 22,391 22,391EBIT 20,089 20,089 20,089 20,089 20,089 20,089Tax 5,022 5,022 5,022 5,022 5,022 5,022
Net cash flow (NCF) 37,458 37,458 37,458 37,458 37,458 37,458Cumulative NCF −248,033 −210,575 -173,117 −60,743 51,631 164,005
Net discounted CF (NDCF) 32,717 30,577 28,577 23,327 19,042 15,544Cumulative NDCF −248,033 −210,575 -173,117 −99,949 −38,732 11,240
Net present value (NPV) 11,240Internal rate of return (IRR) 8%
Payback period (PP) 11
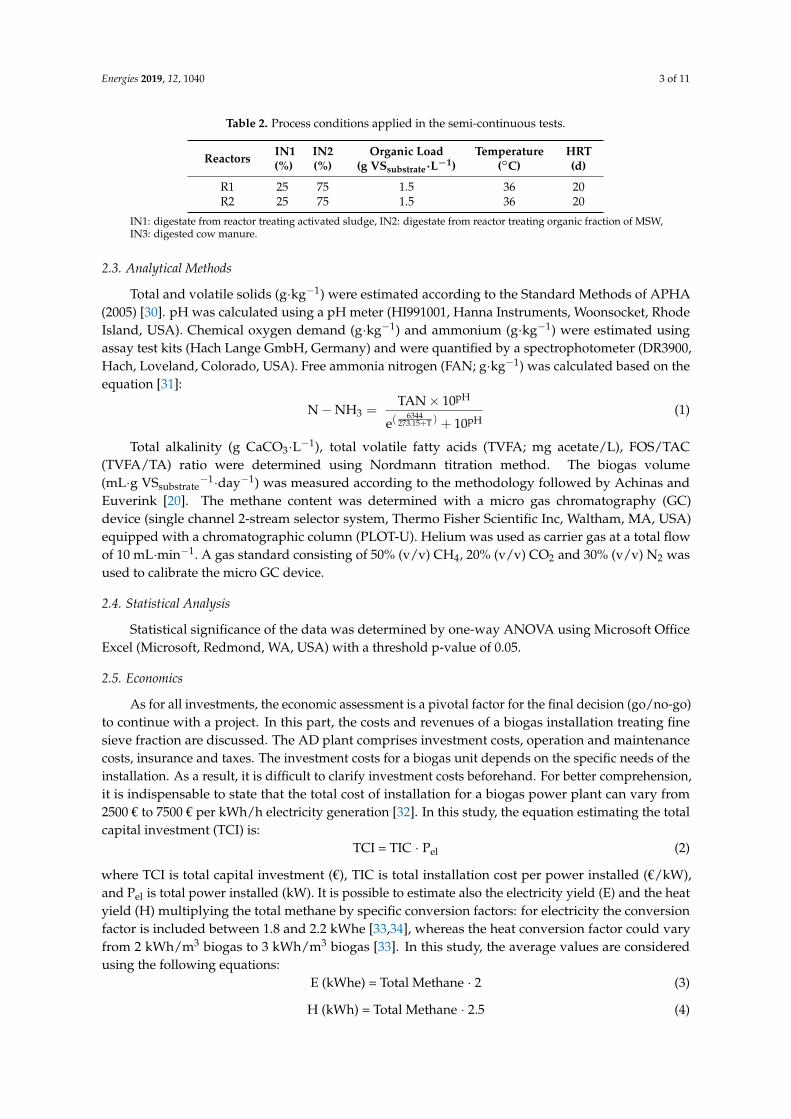
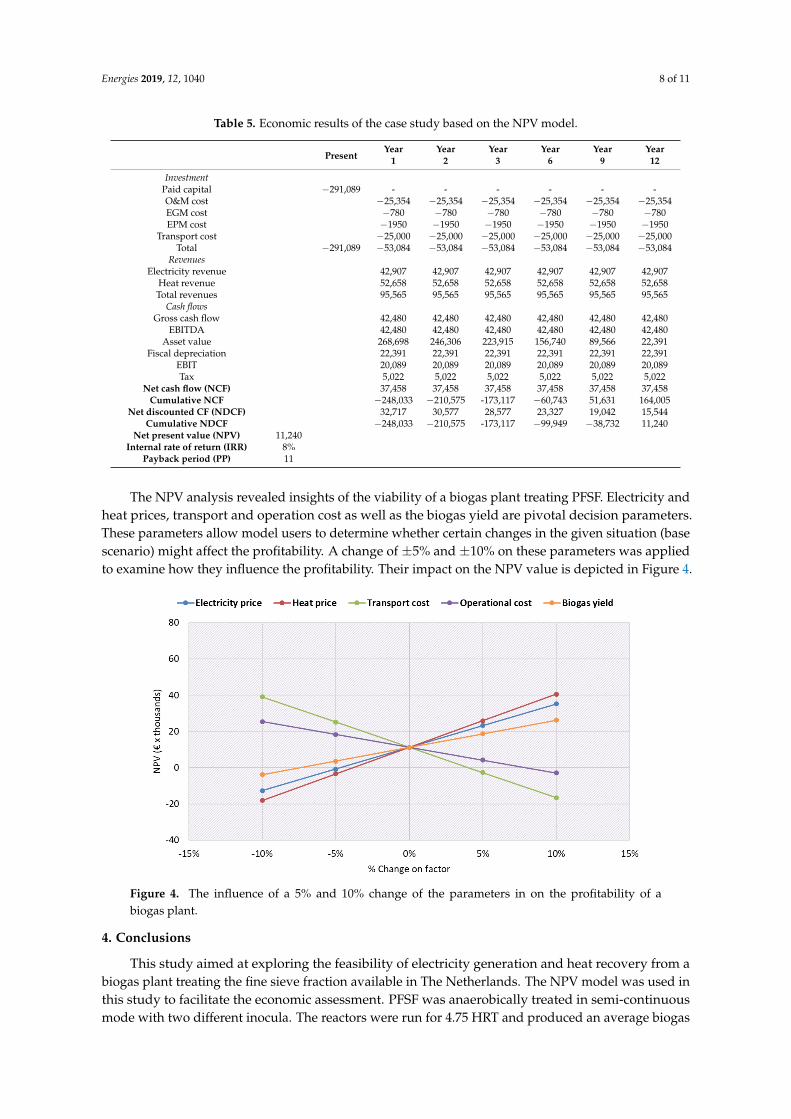
The NPV analysis revealed insights of the viability of a biogas plant treating PFSF. Electricity andheat prices, transport and operation cost as well as the biogas yield are pivotal decision parameters.These parameters allow model users to determine whether certain changes in the given situation (basescenario) might affect the profitability. A change of ±5% and ±10% on these parameters was appliedto examine how they influence the profitability. Their impact on the NPV value is depicted in Figure 4.
Energies 2019, 12 8
Table 5 shows the investment costs, revenues, gross cash flows, net present value, internal rate
return, and payback period time for the case study of the base scenario. According to equation 6, the
total capital investment is approximately estimated up to 300,000 €. The total revenue is 95,565 € and
the net cash flow is 37,458 € for each year. It is notable that an external subsidy might play a significant
role in the profitability of the plant and makes the choice for a 300 k€ investment somewhat easier.
Table 5. Economic results of the case study based on the NPV model.
Present Year Year Year Year Year Year
1 2 3 6 9 12
Investment
Paid capital −291,089 - - - - - -
O&M cost −25,354 −25,354 −25,354 −25,354 −25,354 −25,354
EGM cost −780 −780 −780 −780 −780 −780
EPM cost −1950 −1950 −1950 −1950 −1950 −1950
Transport cost −25,000 −25,000 −25,000 −25,000 −25,000 −25,000
Total −291,089 −53,084 −53,084 −53,084 −53,084 −53,084 −53,084
Revenues
Electricity revenue 42,907 42,907 42,907 42,907 42,907 42,907
Heat revenue 52,658 52,658 52,658 52,658 52,658 52,658
Total revenues 95,565 95,565 95,565 95,565 95,565 95,565
Cash flows
Gross cash flow 42,480 42,480 42,480 42,480 42,480 42,480
EBITDA 42,480 42,480 42,480 42,480 42,480 42,480
Asset value 268,698 246,306 223,915 156,740 89,566 22,391
Fiscal depreciation 22,391 22,391 22,391 22,391 22,391 22,391
EBIT 20,089 20,089 20,089 20,089 20,089 20,089
Tax 5,022 5,022 5,022 5,022 5,022 5,022
Net cash flow (NCF) 37,458 37,458 37,458 37,458 37,458 37,458
Cumulative NCF −248,033 −210,575 -173,117 −60,743 51,631 164,005
Net discounted CF (NDCF) 32,717 30,577 28,577 23,327 19,042 15,544
Cumulative NDCF −248,033 −210,575 -173,117 −99,949 −38,732 11,240
Net present value (NPV) 11,240
Internal rate of return (IRR) 8%
Payback period (PP) 11
Figure 4. The influence of a 5% and 10% change of the parameters in on the profitability of a biogas
plant.
The NPV analysis revealed insights of the viability of a biogas plant treating PFSF. Electricity
and heat prices, transport and operation cost as well as the biogas yield are pivotal decision
parameters. These parameters allow model users to determine whether certain changes in the given
Figure 4. The influence of a 5% and 10% change of the parameters in on the profitability of abiogas plant.
4. Conclusions
This study aimed at exploring the feasibility of electricity generation and heat recovery from abiogas plant treating the fine sieve fraction available in The Netherlands. The NPV model was used inthis study to facilitate the economic assessment. PFSF was anaerobically treated in semi-continuousmode with two different inocula. The reactors were run for 4.75 HRT and produced an average biogas

Energies 2019, 12, 1040 9 of 11
yield of 177.5 mL·day−1·g VSsubstrate−1. The results from the semi-continuous mode were used in theeconomic analysis to evaluate the feasibility of a biogas unit treating PFSF. The potential producibleelectricity energy and heat energy from a biogas plant treating PFSF have been 390 MWh and 1755 GJper year respectively. In The Netherlands, biogas is mainly produced from the sludge that is producedin aerobic wastewater treatment and combusted for electricity generation. In addition, AD technologyand policy drivers might reinforce the implementation of alternative AD pathways. This study can befurther expanded to incorporate and address the assumptions and uncertainties associated with theoperation costs, funding, price of feedstock purchase (if available), and the price of digestate sale anddisposal. Notwithstanding, environmental and ecological assessment would be interesting in order toexamine other factors than the techno-economic for full-scale applications.
Author Contributions: Writing—original draft, S.A.; Writing—review & editing, G.J.W.E.
Funding: This research received no external funding.
Conflicts of Interest: The authors declare no conflict of interest.
Abbreviations
AD anaerobic digestionEBIT earnings before interest and taxEBITDA earnings before interest, taxes, depreciation and amortizationEGM extraordinary generator maintenanceEPM extraordinary plant maintenanceEU European UnionFAN free-ammonia nitrogenFOS/TAC fatty acids/total alkalinityFSF fine sieved fractionHRT hydraulic retention timeIRR internal rate of returnMSW municipal solid wasteNPV net present valueO&M operation and maintenanceOLR organic loading ratePFSF pressed fine sieve fractionPP payback periodTCI total capital investmentTIC total installation costWWTP waste water treatment plant
References
1. Sahajwalla, V. Green processes: Transforming waste into valuable resources. Engineering 2018, 4, 309–310.[CrossRef]
2. Lauer, M.; Thrän, D. Flexible biogas in future energy systems—Sleeping beauty for a cheaper powergeneration. Energies 2018, 11, 761. [CrossRef]
3. Davis, L.A. The shale oil and gas revolution. Engineering 2018, 4, 438–439. [CrossRef]4. Chen, P.; Anderson, E.; Addy, M.; Zhang, R.; Cheng, Y.; Peng, P.; Ma, Y.; Fan, L.; Zhang, Y.; Lu, Q.; et al.
Breakthrough technologies for the biorefining of organic solid and liquid wastes. Engineering 2018, 4, 574–580.[CrossRef]
5. Matsakas, L.; Gao, Q.; Jansson, S.; Rova, U.; Christakopoulos, P. Green conversion of municipal solid wastesinto fuels and chemicals. Electron. J. Biotechnol. 2017, 26, 69–83. [CrossRef]
6. RedCorn, R.; Fatemi, S.; Engelberth, A.S. Comparing end-use potential for industrial food-waste sources.Engineering 2018, 4, 371–380. [CrossRef]
7. Aryal, N.; Torben Kvist, T. Alternative of biogas injection into the Danish gas grid system—A study fromdemand perspective. ChemEngineering 2018, 2, 43. [CrossRef]

Energies 2019, 12, 1040 10 of 11
8. Achinas, S.; Achinas, V.; Euverink, G.J.W. A technological overview of biogas production from biowaste.Engineering 2017, 3, 299–307. [CrossRef]
9. Solarte-Toro, J.C.; Chacón-Pérez, Y.; Cardona-Alzate, C.A. Evaluation of biogas and syngas as energy vectorsfor heat and power generation using lignocellulosic biomass as raw material. Electron. J. Biotechnol. 2018, 33,52–62. [CrossRef]
10. Macedonio, F.; Drioli, E. Membrane engineering for green process engineering. Engineering 2017, 3, 290–298.[CrossRef]
11. Achinas, S.; Achinas, V. Biogas combustion: An introductory briefing. In Biogas: Production, Applications andGlobal Developments; Vico, A., Artemio, N., Eds.; Nova Science Publishers, Inc.: New York, NY, USA, 2017;pp. 179–193.
12. Wang, J.; Wang, H.; Fan, Y. Techno-economic challenges of fuel cell commercialization. Engineering 2018, 4,352–360. [CrossRef]
13. Huarachi-Oliveraa, R.; Dueñas-Gonzab, A.; Yapo-Parib, Y.; Vegab, P.; Romero-Ugarteb, M.; Tapiab, J.;Molinab, L.; Lazarte-Riverab, A.; Pacheco-Salazarc, D.D.; Esparza, M. Bioelectrogenesis with microbial fuelcells (MFCs) using the microalgaChlorella vulgarisand bacterial communities. Electron. J. Biotechnol. 2019, 37,34–40.
14. Chen, J.F. Green chemical engineering. Engineering 2017, 3, 283–284. [CrossRef]15. Wen-Wei, L.; Han-Qing, Y. Advances in energy-producing anaerobic biotechnologies for municipal
wastewater treatment. Engineering 2016, 2, 438–446.16. Chen, J.F. Green chemical engineering for a better life. Engineering 2017, 3, 279. [CrossRef]17. Nelson, M.J.; Nakhla, G.; Zhu, J. Fluidized-bed bioreactor applications for biological wastewater treatment:
A review of research and developments. Engineering 2017, 3, 330–342. [CrossRef]18. Boonpiyo, S.; Sittijunda, S.; Reungsang, A. Co-digestion of napier grass with food waste and napier silage
with food waste for methane production. Energies 2018, 11, 3200. [CrossRef]19. De Souza Guimarães, C.; da Silva Maia, D.R.; Gonçalves Serra, E. Construction of biodigesters to optimize
the production of biogas from anaerobic co-digestion of food waste and sewage. Energies 2018, 11, 870.[CrossRef]
20. Achinas, S.; Euverink, G.J.W. Effect of Combined Inoculation on Biogas Production from Hardly DegradableMaterial. Energies 2019, 12, 217. [CrossRef]
21. Achinas, S.; Euverink, G.J.W. Consolidated briefing of biochemical ethanol production from lignocellulosicbiomass. Electron. J. Biotechnol. 2016, 23, 44–53. [CrossRef]
22. Reihani, S.F.S.; Khosravi-Darani, K. Influencing factors on single-cell protein production by submergedfermentation: A review. Electron. J. Biotechnol. 2019, 37, 34–40. [CrossRef]
23. Gao, Y.; Kong, X.; Xing, T.; Sun, Y.; Zhang, Y.; Luo, X.; Sun, Y. Digestion performance and microbial metabolicmechanism in thermophilic and mesophilic anaerobic digesters exposed to elevated loadings of organicfraction of municipal solid waste. Energies 2018, 11, 952. [CrossRef]
24. Demirel, B.; Scherer, P. Trace element requirements of agricultural biogas digesters during biologicalconversion of renewable biomass to methane. Biomass Bioenergy 2011, 35, 992–998. [CrossRef]
25. Wagner, O.; Lackner, N.; Mutschlechner, M.; Prem, E.M.; Markt, R.; Illmer, P. Biological pretreatmentstrategies for second-generation lignocellulosic resources to enhance biogas production. Energies 2018,11, 1797. [CrossRef]
26. Chiumenti, A.; Boscaro, D.; da Borso, F.; Sartori, L.; Pezzuolo, A. Biogas from fresh spring and summer grass:Effect of the harvesting period. Energies 2018, 11, 1466. [CrossRef]
27. Ranieri, L.; Mossa, G.; Pellegrino, R.; Digiesi, S. Energy recovery from the organic fraction of Municipal SolidWaste: A real options-based facility assessment. Sustainability 2018, 10, 368. [CrossRef]
28. Ghasimi, D.S.M.; de Kreuk, M.; Maeng, S.K.; Zandvoort, M.H.; van Lier, J.B. High-rate thermophilicbio-methanation of the fine sieved fraction from Dutch municipal raw sewage: Cost-effective potentials foron-site energy recovery. Appl. Energy 2016, 165, 569–582. [CrossRef]
29. Kasprzycka, A.; Kuna, J. Methodical aspects of biogas production in small-volume bioreactors in laboratoryinvestigations. Energies 2018, 11, 1378. [CrossRef]
30. Eaton, A.D.; American Public Health Association; American Water Works Association; Water EnvironmentFederation. Standard Methods for the Examination of Water and Wastewater; APHA-AWWA-WEF: Washington,DC, USA, 2005.
Energies 2019, 12, 1040 11 of 11
31. Anthonisen, A.C.; Loehr, R.C.; Prakasam, T.B.S.; Srinath, E.G. Inhibition of nitrification by ammonia andnitrous acid. J. Water Pollut. Control Fed. 1976, 48, 835–849. [PubMed]
32. German Solar Energy Society and Ecofys. Planning and Installing Bioenergy System: A Guide for Installers,Architect and Engineers, 1st ed.; James & James: London, UK, 2005.
33. Piccinini, S. Le tecnologie di produzione del biogas. In Proceedings of the Seminar on IL Biogas: Modello diCalcolo a Supporto Della Fattibilità Tecnico-Economica (C.R.P.A.), Reggio Emilia, Italy, 30 May 2007.
34. Ragazzoni, A.; Navarrotto, P.; Castellini, A.; devenuto, L.; Barbanti, L.; Capponi, S.; Banzato, D. Biogas. Comeottenere reddito per
Energies 2019, 12 11
28. Ghasimi, D.S.M.; de Kreuk, M.; Maeng, S.K.; Zandvoort, M.H.; van Lier, J.B. High-rate thermophilic bio-methanation of the fine sieved fraction from Dutch municipal raw sewage: Cost-effective potentials for on-site energy recovery. Appl. Energy 2016, 165, 569–582.
29. Kasprzycka, A.; Kuna, J. Methodical aspects of biogas production in small-volume bioreactors in laboratory investigations. Energies 2018, 11, 1378.
30. Eaton, A.D.; American Public Health Association; American Water Works Association; Water Environment Federation. Standard Methods for the Examination of Water and Wastewater; APHA-AWWA-WEF: Washington, DC, USA, 2005.
31. Anthonisen, A.C.; Loehr, R.C.; Prakasam, T.B.S.; Srinath, E.G. Inhibition of nitrification by ammonia and nitrous acid. J. Water Pollut. Control Fed. 1976, 48, 835–849.
32. German Solar Energy Society and Ecofys. Planning and Installing Bioenergy System: A Guide for Installers, Architect and Engineers, 1st ed.; James & James: London, UK, 2005.
33. Piccinini, S. Le tecnologie di produzione del biogas. In Proceedings of the Seminar on IL Biogas: Modello di Calcolo a Supporto Della Fattibilità Tecnico-Economica (C.R.P.A.), 30 May 2007, Reggio Emilia, Italy.
34. Ragazzoni, A.; Navarrotto, P.; Castellini, A.; devenuto, L.; Barbanti, L.; Capponi, S.; Banzato, D. Biogas. Come ottenere reddito per l‟agricoltura; Edizioni L‟Informatore Agrario S.p.A.: Verona, Italy, 2010.
35. IEA Bioenergy. Process Monitoring in Biogas Plants; Technical Brochure; IEA Bioenergy: Paris, France, 2013; pp. 39.
36. Świątek, M.; Lewicki, A.; Szymanowska, D.; Kubiak, P. The effect of introduction of chicken manure on the biodiversity and performance of an anaerobic digester. Electron. J. Biotechnol. 2018, doi:10.1016/j.ejbt.2018.11.002.
37. Carotenuto, C.; Guarino, G.; Mario Minale, M. Temperature and pH effect on methane production from buffalo manure anaerobic digestion. Int. J. Heat Technol. 2016, 34, 425–429.
38. Franchi, O.; Rosenkranz, F.; Chamy, R. Key microbial populations involved in anaerobic degradation of phenol and p-cresol using different inocula. Electron. J. Biotechnol. 2018, 35, 33–38.
39. Lindner, J.; Zielonka, S.; Oechsner, H.; Lemmer, A. Effect of different pH-values on process parameters in two-phase anaerobic digestion of high-solid substrates. Environ. Technol. 2015, 36, 198–207.
40. Fox, P.; Pohland, G.K. Anaerobic treatment applications and fundamentals: Substrate specificity during phase separation. Water Environ. Res. 1994, 66, 716–724.
41. Pontoni, L.; Panico, A.; Salzano, E.; Frunzo, L.; Iodice, P.; Pirozzi, F. Innovative parameters to control the efficiency of anaerobic digestion process. Chem. Eng. Trans. 2015, 43, 2089–2094.
42. Andreozzi, R.; Di Somma, I.; Esposito, G.; Pontoni, L. From organic waste to bioenergy: Efficiency, reliability and safety aspects relating to biogas production, purification and utilization. In Environmental Science and Engineering Volume 5: Solid Waste Management; Sharma, U.C., Singh, N., Gurjar, B.R., Govil, J.N., Eds.; Studium Press LLC: Houston, TX, USA, 2017.
43. Rosato, M.A. Redimensioning the Importance of the VFA/TA (FOS/TAC) Method. Available online: https://agronotizie.imagelinenetwork.com/bio-energie-rinnovabili/2015/01/08/ridimensionando-lrsquoimportanza-del-test-fostac/41369 (accessed on 17 March 2019).
44. Ariunbaatar, J.; Scotto Di Perta, E.; Panico, A.; Frunzo, L.; Esposito, G.; Lens, P.N.L.; Pirozzi, F. Effect of ammoniacal nitrogen on one-stage and two-stage anaerobic digestion of food waste. Waste Manag. 2015, 38, 388–398.
45. Akindele, A.; Sartaj, M. The toxicity effects of ammonia on anaerobic digestion of organic fraction of municipal solid waste. Waste Manag. 2018, 71, 757–766.
46. Calli, B.; Mertoglu, B.; Inanc, B.; Yenigun, O. Effects of high free ammonia concentrations on the performances of anaerobic bioreactors. Process Biochem. 2005, 40, 1285–1292.
47. Sun, L.; Müller, B.; Westerholm, M.; Schnürer, A. Syntrophic acetate oxidation in industrial CSTR biogas digesters. J. Biotechnol. 2014, 171, 39–44.
48. The Dutch have built a cycle lane from used toilet paper. Available online: https://www.weforum.org/agenda/2017/10/the-dutch-have-built-a-cycle-lane-from-used-toilet-paper/ (accessed on 17 March 2019).
© 2019 by the authors. Submitted for possible open access publication under the terms and conditions of the Creative Commons Attribution (CC BY) license (http://creativecommons.org/licenses/by/4.0/).
; Edizioni
Energies 2019, 12 11
28. Ghasimi, D.S.M.; de Kreuk, M.; Maeng, S.K.; Zandvoort, M.H.; van Lier, J.B. High-rate thermophilic bio-methanation of the fine sieved fraction from Dutch municipal raw sewage: Cost-effective potentials for on-site energy recovery. Appl. Energy 2016, 165, 569–582.
29. Kasprzycka, A.; Kuna, J. Methodical aspects of biogas production in small-volume bioreactors in laboratory investigations. Energies 2018, 11, 1378.
30. Eaton, A.D.; American Public Health Association; American Water Works Association; Water Environment Federation. Standard Methods for the Examination of Water and Wastewater; APHA-AWWA-WEF: Washington, DC, USA, 2005.
31. Anthonisen, A.C.; Loehr, R.C.; Prakasam, T.B.S.; Srinath, E.G. Inhibition of nitrification by ammonia and nitrous acid. J. Water Pollut. Control Fed. 1976, 48, 835–849.
32. German Solar Energy Society and Ecofys. Planning and Installing Bioenergy System: A Guide for Installers, Architect and Engineers, 1st ed.; James & James: London, UK, 2005.
33. Piccinini, S. Le tecnologie di produzione del biogas. In Proceedings of the Seminar on IL Biogas: Modello di Calcolo a Supporto Della Fattibilità Tecnico-Economica (C.R.P.A.), 30 May 2007, Reggio Emilia, Italy.
34. Ragazzoni, A.; Navarrotto, P.; Castellini, A.; devenuto, L.; Barbanti, L.; Capponi, S.; Banzato, D. Biogas. Come ottenere reddito per l‟agricoltura; Edizioni L‟Informatore Agrario S.p.A.: Verona, Italy, 2010.
35. IEA Bioenergy. Process Monitoring in Biogas Plants; Technical Brochure; IEA Bioenergy: Paris, France, 2013; pp. 39.
36. Świątek, M.; Lewicki, A.; Szymanowska, D.; Kubiak, P. The effect of introduction of chicken manure on the biodiversity and performance of an anaerobic digester. Electron. J. Biotechnol. 2018, doi:10.1016/j.ejbt.2018.11.002.
37. Carotenuto, C.; Guarino, G.; Mario Minale, M. Temperature and pH effect on methane production from buffalo manure anaerobic digestion. Int. J. Heat Technol. 2016, 34, 425–429.
38. Franchi, O.; Rosenkranz, F.; Chamy, R. Key microbial populations involved in anaerobic degradation of phenol and p-cresol using different inocula. Electron. J. Biotechnol. 2018, 35, 33–38.
39. Lindner, J.; Zielonka, S.; Oechsner, H.; Lemmer, A. Effect of different pH-values on process parameters in two-phase anaerobic digestion of high-solid substrates. Environ. Technol. 2015, 36, 198–207.
40. Fox, P.; Pohland, G.K. Anaerobic treatment applications and fundamentals: Substrate specificity during phase separation. Water Environ. Res. 1994, 66, 716–724.
41. Pontoni, L.; Panico, A.; Salzano, E.; Frunzo, L.; Iodice, P.; Pirozzi, F. Innovative parameters to control the efficiency of anaerobic digestion process. Chem. Eng. Trans. 2015, 43, 2089–2094.
42. Andreozzi, R.; Di Somma, I.; Esposito, G.; Pontoni, L. From organic waste to bioenergy: Efficiency, reliability and safety aspects relating to biogas production, purification and utilization. In Environmental Science and Engineering Volume 5: Solid Waste Management; Sharma, U.C., Singh, N., Gurjar, B.R., Govil, J.N., Eds.; Studium Press LLC: Houston, TX, USA, 2017.
43. Rosato, M.A. Redimensioning the Importance of the VFA/TA (FOS/TAC) Method. Available online: https://agronotizie.imagelinenetwork.com/bio-energie-rinnovabili/2015/01/08/ridimensionando-lrsquoimportanza-del-test-fostac/41369 (accessed on 17 March 2019).
44. Ariunbaatar, J.; Scotto Di Perta, E.; Panico, A.; Frunzo, L.; Esposito, G.; Lens, P.N.L.; Pirozzi, F. Effect of ammoniacal nitrogen on one-stage and two-stage anaerobic digestion of food waste. Waste Manag. 2015, 38, 388–398.
45. Akindele, A.; Sartaj, M. The toxicity effects of ammonia on anaerobic digestion of organic fraction of municipal solid waste. Waste Manag. 2018, 71, 757–766.
46. Calli, B.; Mertoglu, B.; Inanc, B.; Yenigun, O. Effects of high free ammonia concentrations on the performances of anaerobic bioreactors. Process Biochem. 2005, 40, 1285–1292.
47. Sun, L.; Müller, B.; Westerholm, M.; Schnürer, A. Syntrophic acetate oxidation in industrial CSTR biogas digesters. J. Biotechnol. 2014, 171, 39–44.
48. The Dutch have built a cycle lane from used toilet paper. Available online: https://www.weforum.org/agenda/2017/10/the-dutch-have-built-a-cycle-lane-from-used-toilet-paper/ (accessed on 17 March 2019).
© 2019 by the authors. Submitted for possible open access publication under the terms and conditions of the Creative Commons Attribution (CC BY) license (http://creativecommons.org/licenses/by/4.0/).
Agrario S.p.A.: Verona, Italy, 2010.35. IEA Bioenergy. Process Monitoring in Biogas Plants; Technical Brochure; IEA Bioenergy: Paris, France, 2013;
p. 39.36. Swiatek, M.; Lewicki, A.; Szymanowska, D.; Kubiak, P. The effect of introduction of chicken manure on the
biodiversity and performance of an anaerobic digester. Electron. J. Biotechnol. 2018. [CrossRef]37. Carotenuto, C.; Guarino, G.; Mario Minale, M. Temperature and pH effect on methane production from
buffalo manure anaerobic digestion. Int. J. Heat Technol. 2016, 34, 425–429. [CrossRef]38. Franchi, O.; Rosenkranz, F.; Chamy, R. Key microbial populations involved in anaerobic degradation of
phenol and p-cresol using different inocula. Electron. J. Biotechnol. 2018, 35, 33–38. [CrossRef]39. Lindner, J.; Zielonka, S.; Oechsner, H.; Lemmer, A. Effect of different pH-values on process parameters in
two-phase anaerobic digestion of high-solid substrates. Environ. Technol. 2015, 36, 198–207. [CrossRef][PubMed]
40. Fox, P.; Pohland, G.K. Anaerobic treatment applications and fundamentals: Substrate specificity duringphase separation. Water Environ. Res. 1994, 66, 716–724. [CrossRef]
41. Pontoni, L.; Panico, A.; Salzano, E.; Frunzo, L.; Iodice, P.; Pirozzi, F. Innovative parameters to control theefficiency of anaerobic digestion process. Chem. Eng. Trans. 2015, 43, 2089–2094.
42. Andreozzi, R.; Di Somma, I.; Esposito, G.; Pontoni, L. From organic waste to bioenergy: Efficiency, reliabilityand safety aspects relating to biogas production, purification and utilization. In Environmental Scienceand Engineering Volume 5: Solid Waste Management; Sharma, U.C., Singh, N., Gurjar, B.R., Govil, J.N., Eds.;Studium Press LLC: Houston, TX, USA, 2017.
43. Rosato, M.A. Redimensioning the Importance of the VFA/TA (FOS/TAC) Method. Availableonline: https://agronotizie.imagelinenetwork.com/bio-energie-rinnovabili/2015/01/08/ridimensionando-lrsquoimportanza-del-test-fostac/41369 (accessed on 17 March 2019).
44. Ariunbaatar, J.; Scotto Di Perta, E.; Panico, A.; Frunzo, L.; Esposito, G.; Lens, P.N.L.; Pirozzi, F. Effect ofammoniacal nitrogen on one-stage and two-stage anaerobic digestion of food waste. Waste Manag. 2015, 38,388–398. [CrossRef] [PubMed]
45. Akindele, A.; Sartaj, M. The toxicity effects of ammonia on anaerobic digestion of organic fraction ofmunicipal solid waste. Waste Manag. 2018, 71, 757–766. [CrossRef]
46. Calli, B.; Mertoglu, B.; Inanc, B.; Yenigun, O. Effects of high free ammonia concentrations on the performancesof anaerobic bioreactors. Process Biochem. 2005, 40, 1285–1292. [CrossRef]
47. Sun, L.; Müller, B.; Westerholm, M.; Schnürer, A. Syntrophic acetate oxidation in industrial CSTR biogasdigesters. J. Biotechnol. 2014, 171, 39–44. [CrossRef]
48. The Dutch Have Built a Cycle Lane from Used Toilet Paper. Available online: https://www.weforum.org/agenda/2017/10/the-dutch-have-built-a-cycle-lane-from-used-toilet-paper/ (accessed on 17 March 2019).
© 2019 by the authors. Licensee MDPI, Basel, Switzerland. This article is an open accessarticle distributed under the terms and conditions of the Creative Commons Attribution(CC BY) license (http://creativecommons.org/licenses/by/4.0/).