FEASIBILITY STUDY OF A HYDROPOWER PROJECT: CASE STUDY OF...
126
FEASIBILITY STUDY OF A HYDROPOWER PROJECT: CASE STUDY OF NİKSAR HEPP, TURKEY A THESIS SUBMITTED TO THE GRADUATE SCHOOL OF NATURAL AND APPLIED SCIENCES OF MIDDLE EAST TECHNICAL UNIVERSITY BY REYHAN MUTLU IN PARTIAL FULFILLMENT OF THE REQUIREMENTS FOR THE DEGREE OF MASTER OF SCIENCE IN CIVIL ENGINEERING SEPTEMBER 2010
Transcript of FEASIBILITY STUDY OF A HYDROPOWER PROJECT: CASE STUDY OF...
FEASIBILITY STUDY OF A HYDROPOWER PROJECT:
CASE STUDY OF NİKSAR HEPP, TURKEY
A THESIS SUBMITTED TO
THE GRADUATE SCHOOL OF NATURAL AND APPLIED SCIENCES
OF
MIDDLE EAST TECHNICAL UNIVERSITY
BY
REYHAN MUTLU
IN PARTIAL FULFILLMENT OF THE REQUIREMENTS
FOR
THE DEGREE OF MASTER OF SCIENCE
IN
CIVIL ENGINEERING
SEPTEMBER 2010

Approval of the thesis:
FEASIBILITY STUDY OF A HYDROPOWER PROJECT:
CASE STUDY OF NİKSAR HEPP, TURKEY
submitted by REYHAN MUTLU in partial fulfillment of the requirements for
the degree of Master of Science in Civil Engineering Department, Middle
East Technical University by,
Prof. Dr. Canan Özgen ___________________
Dean, Graduate School of Natural and Applies Sciences
Prof. Dr. Güney Özcebe ___________________
Head of Department, Civil Engineering
Assist. Prof. Dr. Elçin Kentel ___________________
Supervisor, Civil Engineering Dept., METU
Prof. Dr. Doğan Altınbilek ___________________
Co-Supervisor, Civil Engineering Dept., METU
Examining Committee Members:
Prof. Dr. Melih Yanmaz ___________________
Civil Engineering Dept., METU
Assist. Prof. Dr. Elçin Kentel ___________________
Civil Engineering Dept., METU
Assoc. Prof. Dr. Nurünnisa Usul ___________________
Civil Engineering Dept., METU
Assoc. Prof. Dr. Zuhal Akyürek ___________________
Civil Engineering Dept., METU
Dr. Emre Alp ___________________
Environmental Engineering Dept., METU
Date: 15.09.2010

iii
I hereby declare that all information in this document has been obtained and
presented in accordance with academic rules and ethical conduct. I also declare
that, as required by these rules and conduct, I have fully cited and referenced
all material and results that are not original to this work.
Name, Last name : Reyhan Mutlu
Signature :
iv
ABSTRACT
FEASIBILITY STUDY OF A HYDROPOWER PROJECT:
CASE STUDY OF NİKSAR HEPP, TURKEY
Mutlu, Reyhan
M.Sc., Department of Civil Engineering
Supervisor : Assist. Prof. Dr. Elçin Kentel
Co-Supervisor : Prof. Dr. Doğan Altınbilek
September 2010, 110 pages
Hydropower helps countries meet their energy needs in an economically,
environmentally, and socially sustainable way while saving money and increasing
energy security and self-reliance. Being one of the fastest developing countries,
electricity demand of Turkey has been increasing and is expected to increase in the
future. Untapped hydropower potential is among the prospective alternative
resources to supply this demand. Developing a hydropower project requires a great
deal of expertise in multiple disciplines. RETScreen software developed by
CanmetENERGY helps the planners and decision makers to assess the feasibility of
renewable energy projects at the pre-feasibility and feasibility stages. This study is an
application of RETScreen to assess the feasibility of alternative formulations for
Niksar HEPP, a small hydropower project which is under construction in Turkey.
Three alternative formulations are generated and their economic performances are
evaluated and compared. First, optimum design discharges are calculated and then
economical analysis is conducted for various electricity export rates by RETScreen
for all the alternatives. This study provides a detailed literature review on
hydropower and its economical, social and environmental aspects, and shows how

v
RETScreen can be used in assessing the economical feasibilities of the current
formulation for Niksar HEPP and its alternative schemes.
Keywords: Hydropower, Feasibility, RETScreen
vi
ÖZ
BİR HİDROELEKTRİK SANTRALİN YAPILABİLİRLİK ÇALIŞMASI:
NİKSAR HES ÖRNEĞİ, TÜRKİYE
Mutlu, Reyhan
Yüksek Lisans, İnşaat Mühendisliği Bölümü
Tez Yöneticisi : Yrd. Doç. Dr. Elçin Kentel
Ortak Tez Yöneticisi : Prof. Dr. Doğan Altınbilek
Eylül 2010, 110 sayfa
Hidroelektrik enerji, ülkelerin enerji ihtiyaçlarını ekonomik, çevresel ve sosyal
açıdan sürdürülebilir bir şekilde karşılamalarına yardım etmekle birlikte enerji
güvenliğinin sağlanmasında ve enerjide dışa bağımlılığın azaltılmasında önemli rol
oynar. Dünyanın en hızlı gelişen ülkelerden biri olan Türkiye‟nin elektrik talebi
büyük bir artış göstermiştir ve gelecekte bu talebin daha da artması beklenmektedir.
Potansiyelinin büyük bir kısmı henüz kullanılmamış olan hidroelektrik enerji, bu
talebi karşılamada kullanılabilecek önemli kaynaklardan biridir. Hidroelektrik enerji
projelerinin geliştirilmesi birçok disiplinde uzmanlık gerektirir. CanmetENERGY
tarafından geliştirilen RETScreen yazılımı planlamacılara ve karar vericilere ön
fizibilite ve fizibilite aşamalarında yenilenebilir enerji projelerinin
yapılabilirliklerinin değerlendirilmesinde yardımcı olmaktadır. Bu çalışma,
Türkiye‟de halihazırda inşaat aşamasında olan Niksar HES‟in alternatif
formülasyonlarının fizibilitelerinin değerlendirilmesinde RETScreen‟in kullanımına
bir örnektir. Üç alternatif formülasyon üretilmiş ve bunların ekonomik
performansları değerlendirilip karşılaştırılmıştır. Önce optimum dizayn debileri
hesaplanmış, sonra değişik elektrik fiyatları için bu alternatiflerin ekonomik
analizleri yapılmıştır. Bu çalışma hidroelektrik enerji ve onun ekonomik, sosyal ve

vii
çevresel etkileri üzerine detaylı bir literatür çalışması sunmakta ve Niksar HES‟in
alternatif formülasyonlarının ekonomik fizibilitelerinin incelenmesinde
RETScreen‟in nasıl kullanılabileceğini anlatmaktadır.
Anahtar Kelimeler: Hidroelektrik Enerji, Fizibilite, RETScreen

viii
DEDICATION
To My Family

ix
ACKNOWLEDGMENTS
The author wishes to express his deepest appreciation to his supervisor Assist. Prof.
Dr. Elçin Kentel for her direction, assistance and guidance. Without her invaluable
suggestions and persistent help this thesis would not have been possible.
The author would also like to thank his co-supervisor Prof. Dr. Doğan Altınbilek for
suggesting this study, providing the data and sharing his precious experience and
knowledge.
The author wishes to express his deepest gratitude to Reşat Köymen and Nadi Bakır
from ERE Group for their encouragement and financial support.
The author is also very grateful to TÜBİTAK for granting a scholarship during this
study.
Special thanks should be given to Boran Ekin Aydın and Arzu Soytekin for their help
and sincere support.
Finally, words alone cannot express the thanks the author owes to his family and his
fiancée, Gülay Kılıç, for their endless love and assistance.
x
TABLE OF CONTENTS
ABSTRACT ................................................................................................................ iv
ÖZ ............................................................................................................................. vi
ACKNOWLEDGMENTS .......................................................................................... ix
TABLE OF CONTENTS ............................................................................................. x
LIST OF TABLES ..................................................................................................... xii
LIST OF FIGURES .................................................................................................. xiv
LIST OF ABBREVIATIONS ................................................................................... xvi
CHAPTERS
1. INTRODUCTION ............................................................................................... 1
2. LITERATURE REVIEW..................................................................................... 5
2.1 Hydropower ................................................................................................... 5
2.1.1 Definition of Hydropower ...................................................................... 5
2.1.2 History of Hydropower .......................................................................... 7
2.1.3 Types of Hydropower Plants .................................................................. 8
2.1.4 Hydropower Potential .......................................................................... 14
2.1.5 Hydropower in the World .................................................................... 15
2.1.6 Hydropower in Turkey ......................................................................... 17
2.1.7 Advantages and Disadvantages of Hydropower .................................. 25
2.1.8 Planning and Implementation of Hydropower Projects ....................... 36
2.1.9 Sustainable Development of Hydropower ........................................... 41
xi
2.2 RETScreen Clean Energy Analysis Software ............................................. 44
2.2.1 Assessment Tools for Small Hydropower Projects .............................. 44
2.2.2 RETScreen Clean Energy Project Analysis Software .......................... 45
3. A CASE STUDY FROM TURKEY: NiKSAR HEPP ...................................... 50
3.1 Lower Kelkit Project Master Plan Report ................................................... 50
3.2 Niksar HEPP ................................................................................................ 53
3.3 DSİ Formulation for Niksar HEPP .............................................................. 59
3.4 Possible Alternatives to DSİ formulation of Niksar HEPP ......................... 60
4. APPLICATION OF RETSCREEN TO NİKSAR HEPP .................................. 65
4.1 Application of RETScreen to DSİ formulation of Niksar HEPP ................ 65
4.1.1 Start Sheet ............................................................................................ 66
4.1.2 Energy Model Sheet ............................................................................. 67
4.1.3 Cost Analysis Sheet and Hydro Formula Costing Method Tool ......... 73
4.1.4 Financial Analysis Sheet ...................................................................... 82
4.1.5 Identification of Design Discharge ...................................................... 87
4.2 Application of RETScreen to Alternative 1 and Alternative 2.................... 91
4.2.1 Lengths of Tunnel and Channel Sections............................................. 92
4.2.2 Alowable Tunnel Headloss Factors ..................................................... 92
4.3 The Results of the Analyses ........................................................................ 93
5. CONCLUSION .................................................................................................. 96
REFERENCES ......................................................................................................... 100
xii
LIST OF TABLES
TABLES
Table 1 Status of economical potential of HEPPs as of 2009 ................................... 18
Table 2 Peak Load and Electricity Consumption in Turkey in 1999-2008 ............... 21
Table 3 Demand forecast for low demand case ........................................................ 22
Table 4 Demand forecast for high demand case ....................................................... 22
Table 5 Demand and supply forecast for the best case (low demand & scenario 1) in
accordance with firm generation capacity ................................................................. 23
Table 6 Demand and supply forecast for the worst case (high demand & scenario 2)
in accordance with firm generation capacity ............................................................ 24
Table 7 Assessment methods for small hydro projects ............................................. 44
Table 8 Characteristics of hydropower plants in Lower Kelkit Project .................... 51
Table 9 Discharge at Akıncı Diversion Weir ............................................................ 55
Table 10 Monthly average discharges between 2002-2004 ...................................... 57
Table 11 Energy production for two different flow duration curves ......................... 58
Table 12 Cell color coding system of RETScreen ..................................................... 65
Table 13 Fuel prices and exchange rates in Turkey and Canada ............................... 77
Table 14 Estimation of Turkish versus Canadian labor cost ratio ............................. 78
Table 15 RETScreen's project classification ............................................................. 78
Table 16 Tunnel parameters for a discharge of 60 m3/s, DSİ formulation ................ 81
Table 17 Diameters for different discharges .............................................................. 82
Table 18 Discharge optimization for DSİ formulation .............................................. 89
Table 19 Discharge optimization for DSİ formulation .............................................. 90
Table 20 Lengths of tunnel and channel sections for different alternatives .............. 92
Table 21 Results of Analyses ..................................................................................... 93

xiii
Table 22 Annual net benefits for optimum discharges of the alternative projects..... 93
Table 23 Comparison of Tunnel and Channel Costs (Q = 60 m3/s) .......................... 95
xiv
LIST OF FIGURES
FIGURES
Figure 1 Hydrologic Cycle .......................................................................................... 6
Figure 2 Main parts of storage type hydropower plants ............................................. 9
Figure 3 General layout of a run-of-river plant ......................................................... 10
Figure 4 Pumped Storage Plant ................................................................................. 11
Figure 5 A typical daily load curve ........................................................................... 13
Figure 6 Fuel share of electricity generation in 2007 ............................................... 15
Figure 7 Total hydropower potential by continent .................................................... 16
Figure 8 Share of total electricity generation from renewables by region ................ 17
Figure 9 Development of hydroelectric power plants ............................................... 18
Figure 10 Share of hydropower in total electricity generation between 1970 and 2008
.................................................................................................................................... 19
Figure 11 Turkey‟s gross electricity generation by share of primary energy sources
.................................................................................................................................... 20
Figure 12 Demand and supply forecast for the best case .......................................... 23
Figure 13 Demand and supply forecast for the worst case ....................................... 24
Figure 14 Renewables Technology Development .................................................... 26
Figure 15 Energy payback ratio of energy options ................................................... 27
Figure 16 Land requirements of energy options ....................................................... 31
Figure 17 Greenhouse gas emissions of energy options ........................................... 33
Figure 18 Accuracy of the project cost estimates ..................................................... 47
Figure 19 Five step standard analysis used by the RETScreen software .................. 48
Figure 20 General Layout of Lower Kelkit Project .................................................. 52
Figure 21 Earthquake zoning map of Tokat .............................................................. 53
xv
Figure 22 Flow duration curve of Niksar HEPP ........................................................ 56
Figure 23 Flow duration curve of Niksar HEPP, with the addition of the flow data
between 2002-2004 .................................................................................................... 57
Figure 24 General Layout of Niksar HEPP (DSİ formulation).................................. 59
Figure 25 DSİ formulation and the alternatives ......................................................... 62
Figure 26 Topographic view of the project site ......................................................... 63
Figure 27 Start Sheet of RETScreen .......................................................................... 66
Figure 28 Niksar HEPP DSİ formulation, Energy Model.......................................... 67
Figure 29 Combined turbine efficiency, Niksar HEPP .............................................. 69
Figure 30 Turbine efficiency for one turbine, Niksar HEPP ..................................... 70
Figure 31 Niksar HEPP DSİ formulation, Energy Model.......................................... 71
Figure 32 Flow duration and power curves, Niksar HEPP ........................................ 73
Figure 33 Cost analysis sheet, Niksar HEPP, DSİ formulation ................................. 75
Figure 34 Hydro costing formula method, Niksar HEPP, DSİ formulation .............. 76
Figure 35 Representative cross section of a tunnel .................................................... 80
Figure 36 Financial Parameters, Niksar HEPP .......................................................... 83
Figure 37 Project costs and savings/income summary .............................................. 84
Figure 38 Financial viability, Niksar HEPP ............................................................... 85
Figure 39 Cumulative cash flow graph, Niksar HEPP ............................................... 85
Figure 40 Yearly cash flow, Niksar HEPP................................................................. 86
Figure 41 Discharge optimization graph for DSİ formulation ................................... 89
Figure 42 Discharge optimization for DSİ formulation ............................................. 90
Figure 43 Evaluation of alternatives for various design discharges and electricity
prices .......................................................................................................................... 91
xvi
LIST OF ABBREVIATIONS
CAD Canadian Dollar
ÇATOM Multipurpose Community Center
DSİ General Directorate of State Hydraulic Works
EIA Environmental Impact Assessment
EU European Union
EURELECTRIC The Union of the Electricity Industry
GEF Global Environment Facility
GHG Greenhouse gas
HEPP Hydroelectric Power Plant
ICOLD International Commission of Large Dams
IHA International Hydropower Association
Krş Kuruş (1 Turkish Lira is equal to 100 Kuruş)
NASA National Aeronautics and Space Administration
OECD Organisation for Economic Co-operation and Development
REEP The Renewable Energy & Energy Efficiency Partnership
TEİAŞ Turkish Electricity Transmission Company
TL Turkish Lira
UNEP United Nations Environment Programme
USA The United States of America
USD The United States Dollar
1
CHAPTER 1
1. INTRODUCTION
The demand for energy in the world has significantly increased in the last decades as
a result of the growing population and the increase in the level of industrialization.
Global energy use has risen by 70 % since 1971 [1], and is predicted to increase by
40 % by 2030 [2]. On the other hand, approximately 1.6 billion people have no
access to electricity [3].
Fossil fuel-oriented energy sector has been accused of being the main source of
global warming. Increased awareness of climate change and international agreements
such as Kyoto Protocol has forced the governments to search for alternative energy
sources; and increased oil prices accelerated this process.
Within this conjuncture, governments have started to pay more attention on
renewable energy technologies. Investors are encouraged to develop renewable
energy technologies. Among these technologies, hydropower is the cheapest and the
most widely used one. In 2007, 16 % of the world‟s total electricity was generated in
hydropower plants [4].
Hydropower is the most mature renewable energy technology. Hydropower has been
used for more than a century and has become the major source of electricity for 55
countries [3]. Although it is widely used all around the world, only one-third of the
economical hydropower potential has been utilized yet [5]. In Asia, Africa and South
America a great portion of the economical potential remains to be developed. On the
other hand, the developed countries have already utilized much of their economical
INTRODUCTION
2
potential. However, these countries continue investing in renewable resources,
especially small hydropower projects.
Hydropower is clean energy technology. It helps to slow down climate change since
hydropower plants produces very small amounts of greenhouse gases [3].
Hydropower plants produce no air pollutants. They neither consume nor pollute the
water. Moreover, hydropower plants prevent depletion of non-renewable fuel
resources thus ensuring the social justice among generations.
There are of course some adverse effects of hydropower plants at the river
ecosystem. However these effects can clearly be identified and mitigated. By
conducting environmental impact assessment and raising the public awareness,
hydropower projects can be developed in an environmentally sound and socially
responsible manner.
Although Turkey has been using hydropower since 1902, only 35 % of its economic
hydroelectric potential is utilized [6, 7]. Being one of the fastest developing
countries, Turkey is in urgent need for additional electricity production capacity. The
demand for electricity is expected to increase by 6–7 % every year for the next
decade [8]. In order to accelerate the utilization of energy resources, the energy
markets were privatized. Companies have been competing to undertake the
hydropower projects since then.
In a competitive market, time and money are invaluable for companies. Developing a
hydropower project requires a great deal of money and time as well as expertise in
engineering. In order to help the developers to make an initial assessment of the
economical feasibility of a project before spending considerable amount of money
and time, numerous computer tools have been developed.
RETSceen Clean Energy Analysis Software is one of the successful energy project
assessment tools developed by CanmetENERGY, a Canadian government
organization. It can be used for various types of energy technologies, including
hydropower, to evaluate the energy production and savings, costs, emission
reductions, and financial viabilities of the projects.
3
Korkmaz [9] utilized RETScreen for two hydropower projects in Turkey and tested
the accuracy of the cost calculations of the software by comparing with the feasibility
reports of these projects.
Küçükbeycan [10] also tested the accuracy of RETScreen in Turkish practice
studying two case studies from Turkey. In addition, he utilized RETScreen for
assessing the feasibility of generating electricity in a dam which is used for flood
control and irrigation.
In 1990, DSİ prepared a master plan report for Lower Kelkit Project which
comprises five Hydroelectric Power Plants (HEPPs). The subject of this study is
Niksar HEPP, which is one of these five HEPPs. Niksar HEPP will be located on
Kelkit Stream. A private company has been awarded with the contract and the
construction works still continue.
DSİ suggested a formulation of Niksar HEPP. In this study two alternative projects
to DSİ formulation are devised by changing the course of the water conveyance
system. These three alternatives are evaluated in terms of economical aspects using
RETScreen Clean Energy Project Analysis Software (v. 4). Financial parameters of
the three alternatives are compared and the best alternative is selected.
One of the most important design parameters in hydropower project planning is the
design discharge. In this study, prior to the cost-benefit analysis, the optimum design
discharges for each of the three alternatives are determined using an iterative
approach.
In addition to design discharge, frequently changing electricity prices in Turkey is
another parameter that is considered during the planning phase of the HEPPs.
Therefore, while determining the optimum discharges for the alternatives of Niksar
HEPP, impact of electricity prices are evaluated as well.
Korkmaz [9] and Küçükbeycan [10] utilized RETScreen for small hydropower
projects in Turkey in order to check the suitability of the software to the Turkish
practice. The costs obtained from the software are compared with the actual

4
feasibility reports. In this study, however, the cost calculations are assumed correct
and several alternatives are investigated in order to obtain the best formulation.
Although RETScreen is widely used in many countries, there are not many
applications in Turkey. Thus, this study provides another example application of
RETScreen for a small hydropower plant in Turkey. It is intended to arouse interest
of the project developers to this practical and useful tool.
In Chapter 1, introductory remarks and the scope of the study is given briefly. In
Chapter 2, general information about hydropower and hydropower project
development are reviewed. Moreover, a concise presentation of RETScreen is given.
In Chapter 3, Niksar HEPP project is introduced and the alternatives are explained.
Chapter 4 is dedicated to the application of RETScreen for the alternative projects. In
Chapter 5, conclusions of the study is given.
5
CHAPTER 2
2. LITERATURE REVIEW
2.1 Hydropower
2.1.1 Definition of Hydropower
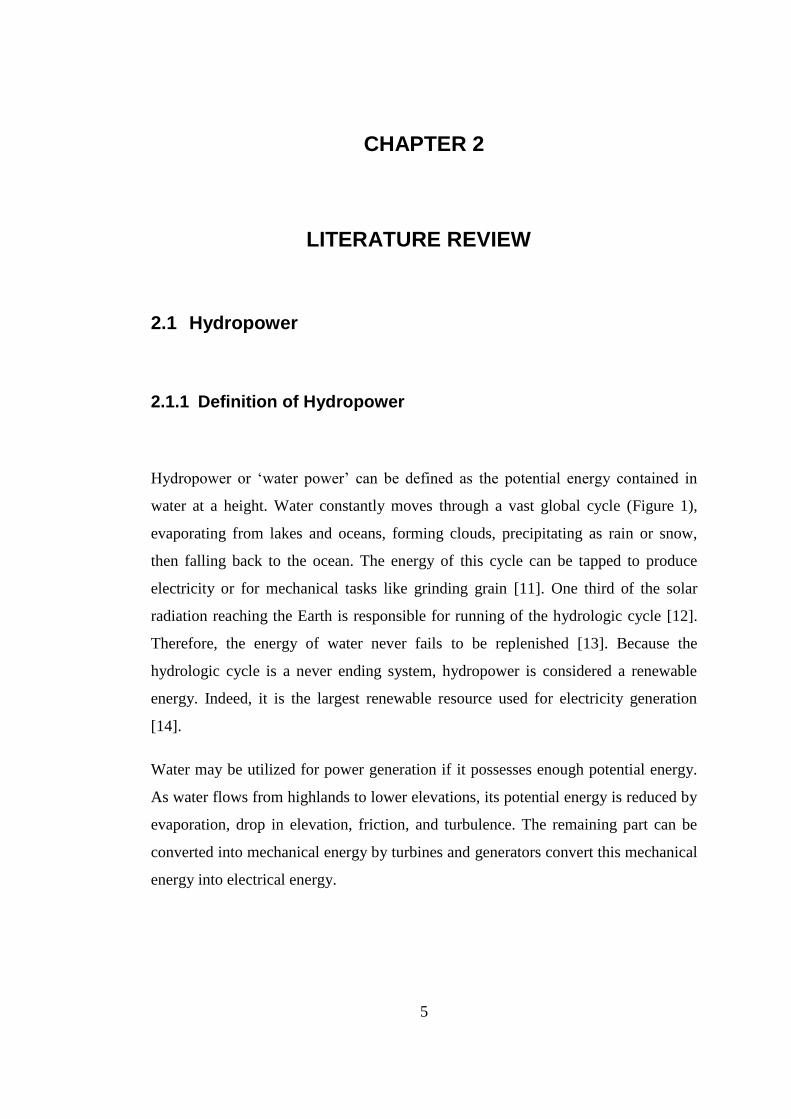
Hydropower or „water power‟ can be defined as the potential energy contained in
water at a height. Water constantly moves through a vast global cycle (Figure 1),
evaporating from lakes and oceans, forming clouds, precipitating as rain or snow,
then falling back to the ocean. The energy of this cycle can be tapped to produce
electricity or for mechanical tasks like grinding grain [11]. One third of the solar
radiation reaching the Earth is responsible for running of the hydrologic cycle [12].
Therefore, the energy of water never fails to be replenished [13]. Because the
hydrologic cycle is a never ending system, hydropower is considered a renewable
energy. Indeed, it is the largest renewable resource used for electricity generation
[14].
Water may be utilized for power generation if it possesses enough potential energy.
As water flows from highlands to lower elevations, its potential energy is reduced by
evaporation, drop in elevation, friction, and turbulence. The remaining part can be
converted into mechanical energy by turbines and generators convert this mechanical
energy into electrical energy.
LITERATURE REVIEW
6
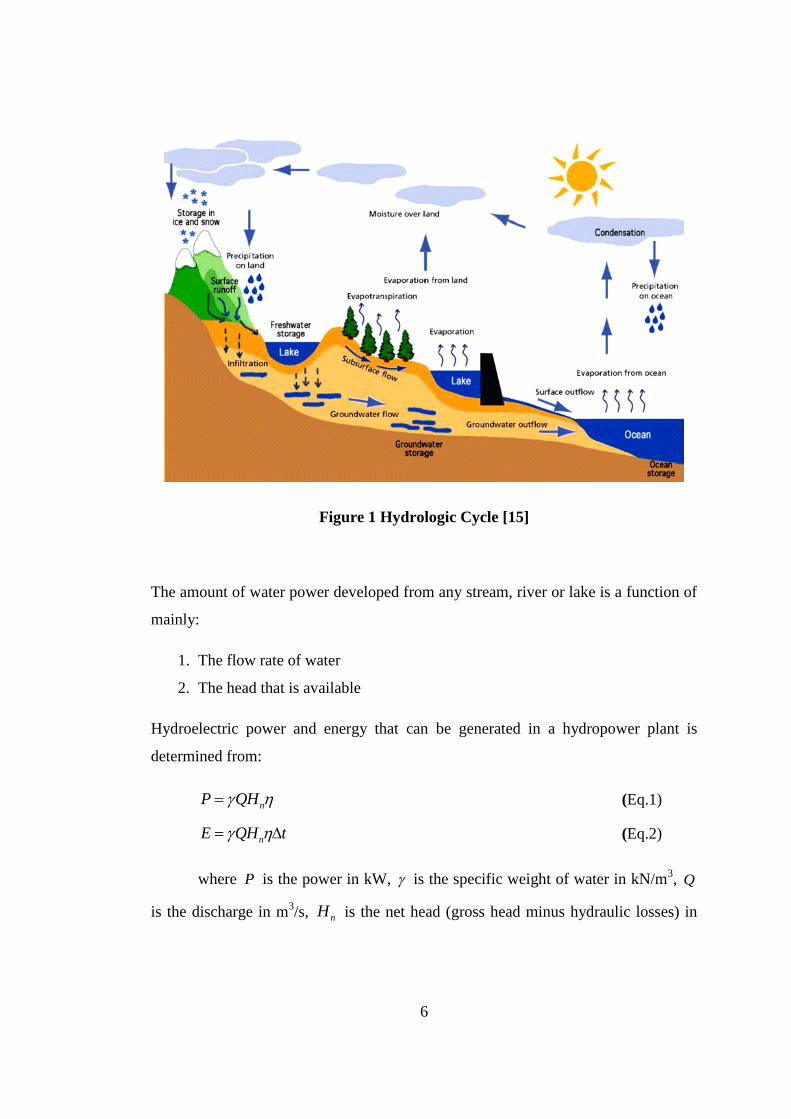
Figure 1 Hydrologic Cycle [15]
The amount of water power developed from any stream, river or lake is a function of
mainly:
1. The flow rate of water
2. The head that is available
Hydroelectric power and energy that can be generated in a hydropower plant is
determined from:
nP QH (Eq.1)
nE QH t (Eq.2)
where P is the power in kW, is the specific weight of water in kN/m3, Q
is the discharge in m3/s, nH is the net head (gross head minus hydraulic losses) in
7
meters, is the overall efficiency (%), E is the hydroelectric energy in kWh and t
is the time interval for power generation in hours.
2.1.2 History of Hydropower
Harnessing hydropower dates back over 2000 years. It was used by the Greeks to
turn water wheels for grinding wheat into flour more than 2000 years ago [16]. Other
tasks that used hydropower included sawing wood, powering textile mills, and later
operating manufacturing plants [17].
During the Industrial Revolution, hydropower played an important role in improving
the textile, leather and machine industries. Steam engine technology had already
been developed. However, coal was scarce and wood was unsatisfactory. Until the
middle of the 19th
century, when cheap coal became available, hydropower helped to
develop early industrial cities in Europe and the United States [16].
The modern turbine has been developed as a result of the improvements of the
waterwheel. Most of the developments were achieved by French engineers. Since
France lacked rich coal resources, they focused on the water power. Even today the
French word houille blanche, meaning “white coal” is used for water power [17].
Not surprisingly, a French engineer, Benoit Fourneyron (1802 – 1867), won the prize
given by Société d'Encouragement pour l'Industrie Nationale for “applying at large
scale, in a satisfactory manner, in mills and factories, the hydraulic turbines or
wheels with curved blades” [17, 18]. Therefore, he is credited with developing the
first modern turbine in 1833 [17].
In 1849, the Francis turbine was invented and later used in the world‟s first
hydroelectric power plant on the Fox River in Appleton, Wisconsin in 1882 [17, 19,
20]. With the demonstration of the economic transmission of high-voltage alternating
current at the Frankfurt Exhibition in 1891, larger hydropower schemes were
accepted as feasible [19].
8
The golden age of hydropower was the first half of the 20th
century. Europe and
North America built hydropower plants at a rapid rate and utilized up to 50 % of
their technically available potential. Then oil took over as the dominant force in
energy provision [21] and the hydropower continued to develop at a slower pace
from then on.
2.1.3 Types of Hydropower Plants
Hydroelectric power plants can be classified in different ways according to their
characteristics.
2.1.3.1 Classification According to Operation Mode
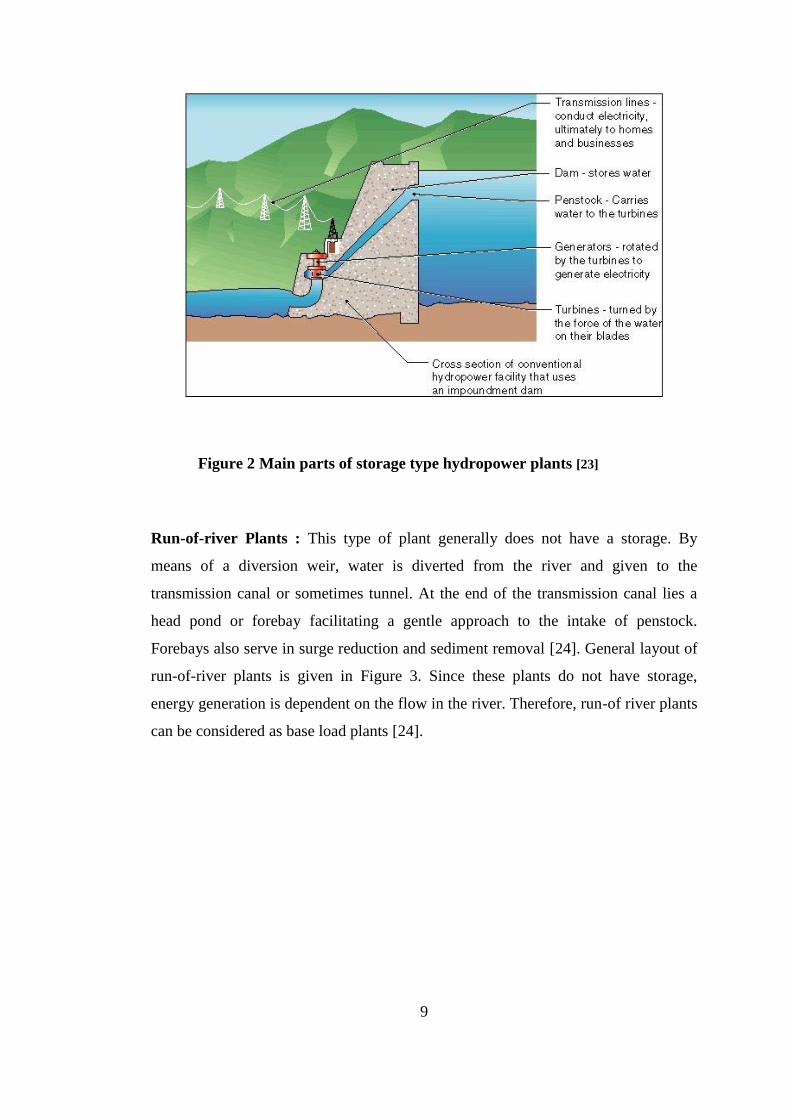
Impoundment Plants: Also called „storage plants‟ or „reservoir plants‟, is the most
common type of hydroelectric power plants [22]. These plants are usually large
hydropower schemes and use a dam to store river water in a reservoir. Water is not
distributed uniformly in time. These plants store water when the flows are relatively
high and this storage compensates for the low-flow seasons. Therefore, a relatively
constant supply of energy is maintained throughout a year. The main parts of a
typical reservoir type hydropower plant are presented in Figure 2.
9
Figure 2 Main parts of storage type hydropower plants [23]
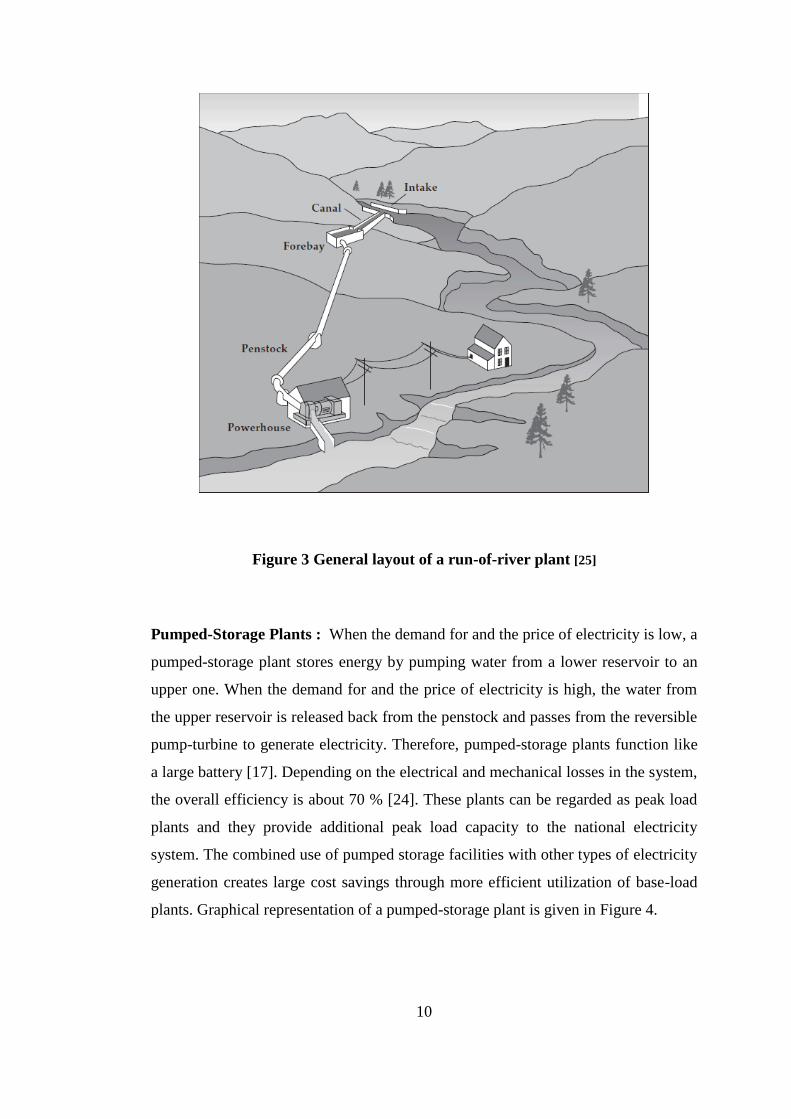
Run-of-river Plants : This type of plant generally does not have a storage. By
means of a diversion weir, water is diverted from the river and given to the
transmission canal or sometimes tunnel. At the end of the transmission canal lies a
head pond or forebay facilitating a gentle approach to the intake of penstock.
Forebays also serve in surge reduction and sediment removal [24]. General layout of
run-of-river plants is given in Figure 3. Since these plants do not have storage,
energy generation is dependent on the flow in the river. Therefore, run-of river plants
can be considered as base load plants [24].
10
Figure 3 General layout of a run-of-river plant [25]
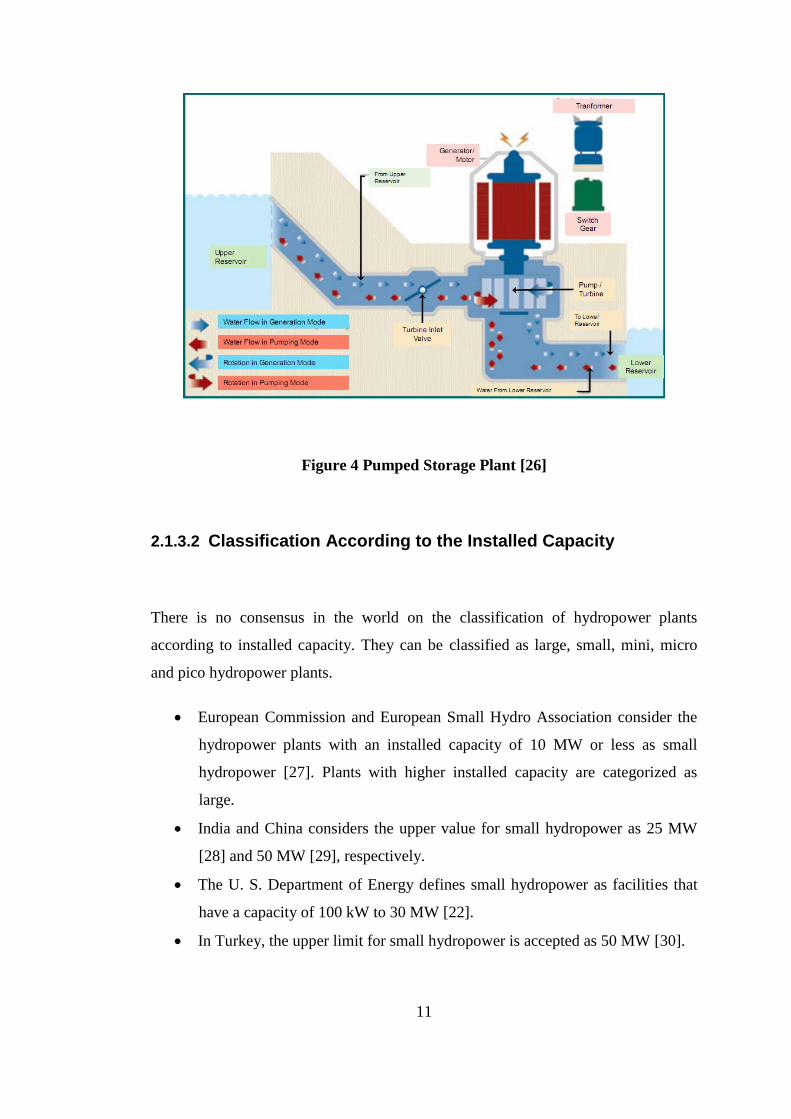
Pumped-Storage Plants : When the demand for and the price of electricity is low, a
pumped-storage plant stores energy by pumping water from a lower reservoir to an
upper one. When the demand for and the price of electricity is high, the water from
the upper reservoir is released back from the penstock and passes from the reversible
pump-turbine to generate electricity. Therefore, pumped-storage plants function like
a large battery [17]. Depending on the electrical and mechanical losses in the system,
the overall efficiency is about 70 % [24]. These plants can be regarded as peak load
plants and they provide additional peak load capacity to the national electricity
system. The combined use of pumped storage facilities with other types of electricity
generation creates large cost savings through more efficient utilization of base-load
plants. Graphical representation of a pumped-storage plant is given in Figure 4.
11
Figure 4 Pumped Storage Plant [26]
2.1.3.2 Classification According to the Installed Capacity
There is no consensus in the world on the classification of hydropower plants
according to installed capacity. They can be classified as large, small, mini, micro
and pico hydropower plants.
European Commission and European Small Hydro Association consider the
hydropower plants with an installed capacity of 10 MW or less as small
hydropower [27]. Plants with higher installed capacity are categorized as
large.
India and China considers the upper value for small hydropower as 25 MW
[28] and 50 MW [29], respectively.
The U. S. Department of Energy defines small hydropower as facilities that
have a capacity of 100 kW to 30 MW [22].
In Turkey, the upper limit for small hydropower is accepted as 50 MW [30].
12
Mini, micro and pico hydropower plants could be regarded as small hydro power
plants; however, they have specific technical characteristics and deserve their own
definition. Different countries and organizations have different definitions. An
example is the one made by Natural Resources Canada. According to this definition
[31];
Mini hydropower 100 kW to 1 MW
Micro hydropower 10 kW to 100 kW
Pico hydropower less than 10 kW
2.1.3.3 Classification According To Operating Conditions
Base Load Plants: These plants operate continuously at a nearly constant
power and provide the power demand at base of the load curve (Figure 5).
Storage type and run-of river plants can provide base load service.
Peak Load Plants: These power plants are designed primarily for the purpose
of supplying the peak load of a power system (Figure 5). Pumped-storage
plants are good examples of peak load plants. Storage type plants may also
provide peak load service. Run-of-river plants can supply peak power only if
they have a pond.

13
Figure 5 A typical daily load curve [32]
2.1.3.4 Classification According to Head
Power that can be generated in a hydroelectric power plant depends on the flow
regime in the river and the available head. Since head is an important parameter in
describing a power plant, classifying the plants according to the available head would
be meaningful. Başeşme classifies the hydropower plants according to available head
as follows [33];
Low head H < 10 m
Medium head 10 m < H < 50 m
High head H > 50 m
14
2.1.4 Hydropower Potential
Hydropower potential is generally evaluated in three categories, namely theoretical,
technical and economical potential.
Theoretical potential is defined as the sum of the annual energy potentially available
from all natural flows from the largest rivers to the smallest creek, regardless of the
losses.
Technical potential is the part of theoretical potential which can be utilized with the
current technology regardless of economic and other considerations. This definition
of potential subtracts friction losses in water ways and efficiencies in the electro-
mechanical equipment as well as the extreme low heads which are considered as
infeasible. Technical potential is a function of theoretical potential. Since changes in
hydropower technology is not rapid and no big changes are expected in the near
future, technical potential can be accepted as constant [34]. In other words, it does
not vary with time. Öziş [34] estimates the effect of these inevitable losses as 50 %.
Economic potential is the part of the technical potential which can be regarded as
economic when compared to alternative sources of power like oil and coal. It is
dependent on the cost of alternative sources. Therefore, it may change with time and
should be updated regularly.
Union of the Electricity Industry (EURELECTRIC) uses a definition called
exploitable hydropower potential for the portion of the economical potential which
can be harnessed considering environmental and other special restrictions [35].
Moreover, International Hydropower Association (IHA) often uses realistic potential
for 80 % of the economical potential.
15
2.1.5 Hydropower in the World
The demand for energy in the world is continuously increasing with the increase in
population and level of industrialization. Global energy use has risen by 70 % since
1971 and continuously increases by approximately 2 % every year [1].
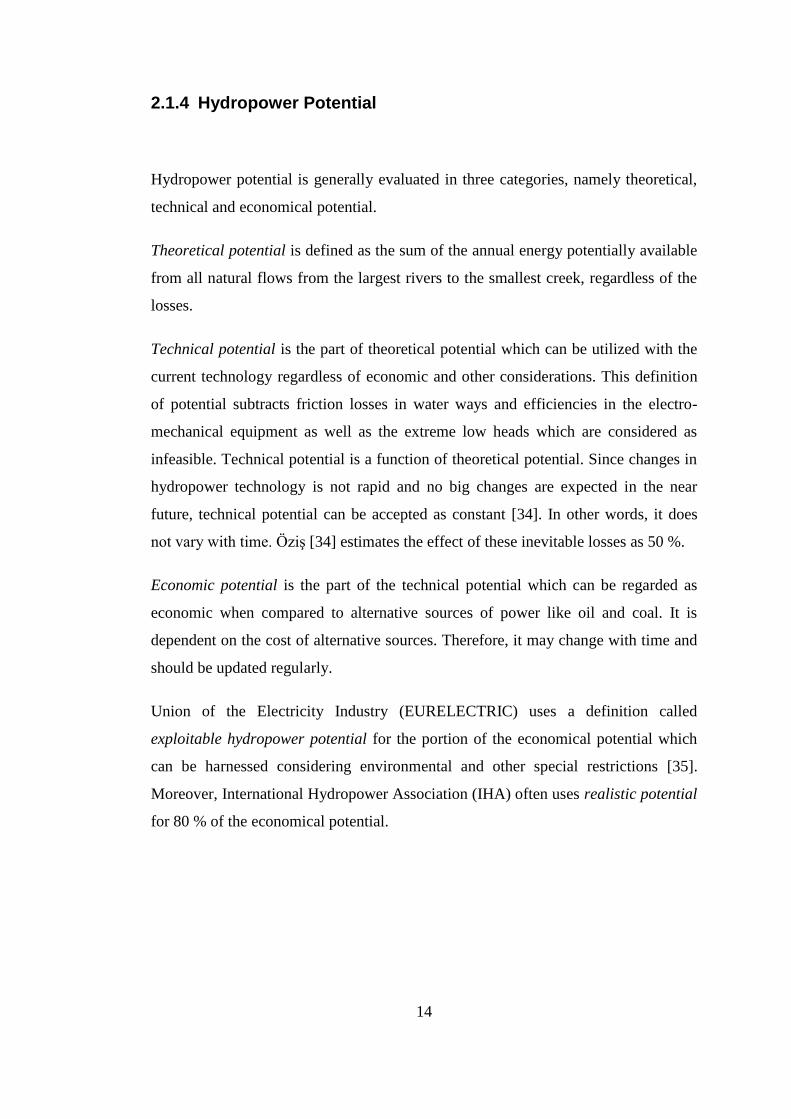
In 2007, hydropower contributed 15.6 % of the world‟s power generation (Figure 6).
When generation from pumped storage plants is added, the total hydropower
generation becomes 3162 TWh which is 16 % of the world‟s electricity generation
for the year 2007 [4].
Figure 6 Fuel share of electricity generation in 2007 [4]
Hydropower provides the majority of supply in 55 countries and for several countries
it is the only domestic energy resource [3]. Although hydropower is a mature
technology and has been utilized for a long time, much of the potential remain to be
developed. World‟s technical and economical potentials are estimated as 14370
TWh/yr and 8080 TWh/yr, respectively [21, 36]. However, only one-third of the
economical potential has been developed yet. Much of the remaining potential exists
*

16
in Asia, Africa and South America. At the same time, these continents are precisely
where the needs for water and energy are the greatest [5]. On the other hand, all
Western countries had exploited most of their rivers for hydroelectricity generation
by 1975 [37]. Deployment of the hydroelectric potential by continents is given in
Figure 7.
Figure 7 Total hydropower potential by continent [38]
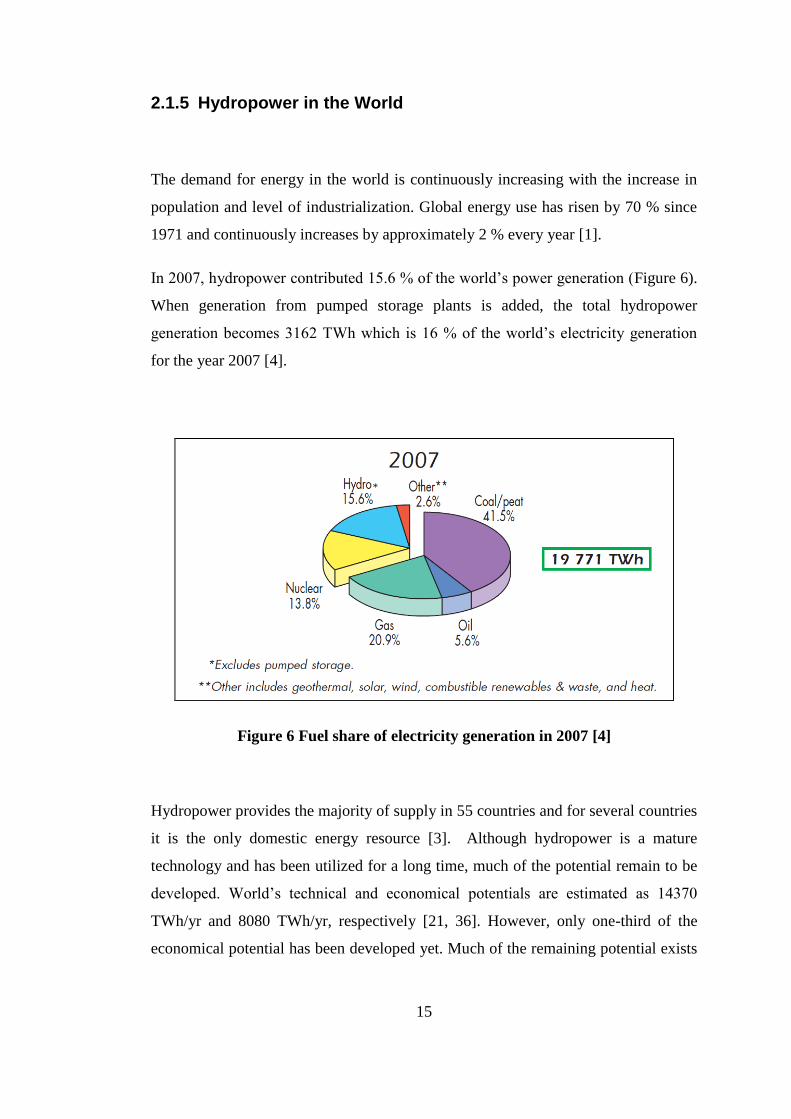
Among the renewable energy sources of electricity, hydropower is in the leading
role. International Energy Agency expects this role to remain the same in the future
(Figure 8). In the future, hydropower utilization is expected to increase. In non-
OECD countries, for instance, hydroelectricity generation is expected to double
between 2006 and 2030. However, as can be seen from Figure 8, share of
hydropower in total electricity generation is in a decreasing trend. This is because the
use of other renewables as well as fossil fuels increases faster than hydropower [39].
17
Figure 8 Share of total electricity generation from renewables by region [39]
2.1.6 Hydropower in Turkey
Turkey‟s theoretical hydroelectric potential is 433 TWh/yr, which is 1 % of that of
the World and 16 % of Europe‟s potential. The technical potential is 216 TWh/yr.
DSİ estimates the economical hydroelectric potential as 140 TWh/yr. However it
also estimates that the economical potential will reach 150 TWh/yr as a result of
projects developed by the private sector [6]. Bakır [40], on the other hand, claims
that the economical potential should be much greater. He proposes new criteria for
the peak power, firm and secondary energy benefits than those are used by DSİ in
feasibility studies. According to these new criteria, which consider some ignored
benefits of hydropower plants, and overestimated benefits of thermal power plants,
he estimates the economical hydroelectric potential of Turkey as 188 TWh/yr [40].
Although Turkey has a huge hydropower potential, only 35 % of it is currently
utilized [6]. Table 1 shows the current situation of hydroelectric power plants
(HEPPs) in Turkey.
18
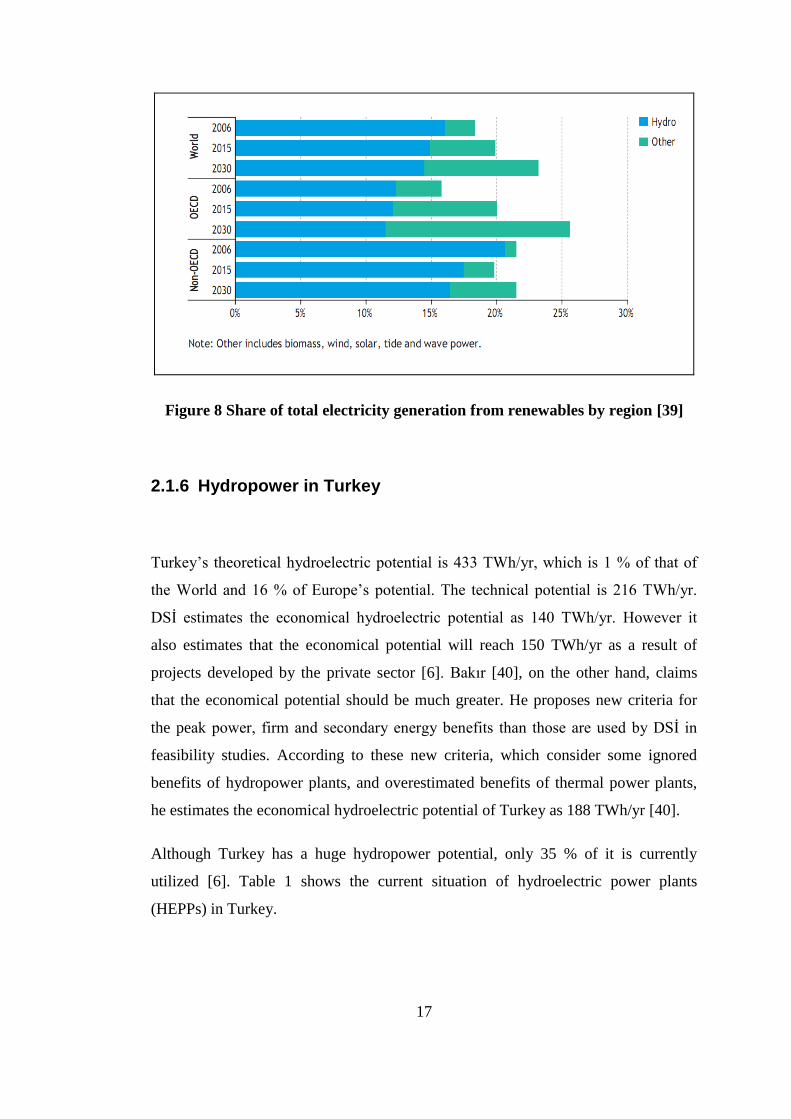
Table 1 Status of economical potential of HEPPs as of 2009 [6]
Status of
Economical
Potential
Number of
Hydroelectric
Power Plants
Total
Installed
Capacity
(MW)
Average Annual
Generation
GWh/yr
Ratio
(%)
In Operation 172 13700 48000 35
Under
Construction 148 8600 20000 14
In Program 1418 22700 72000 51
Total Potential 1738 45000 140000 100
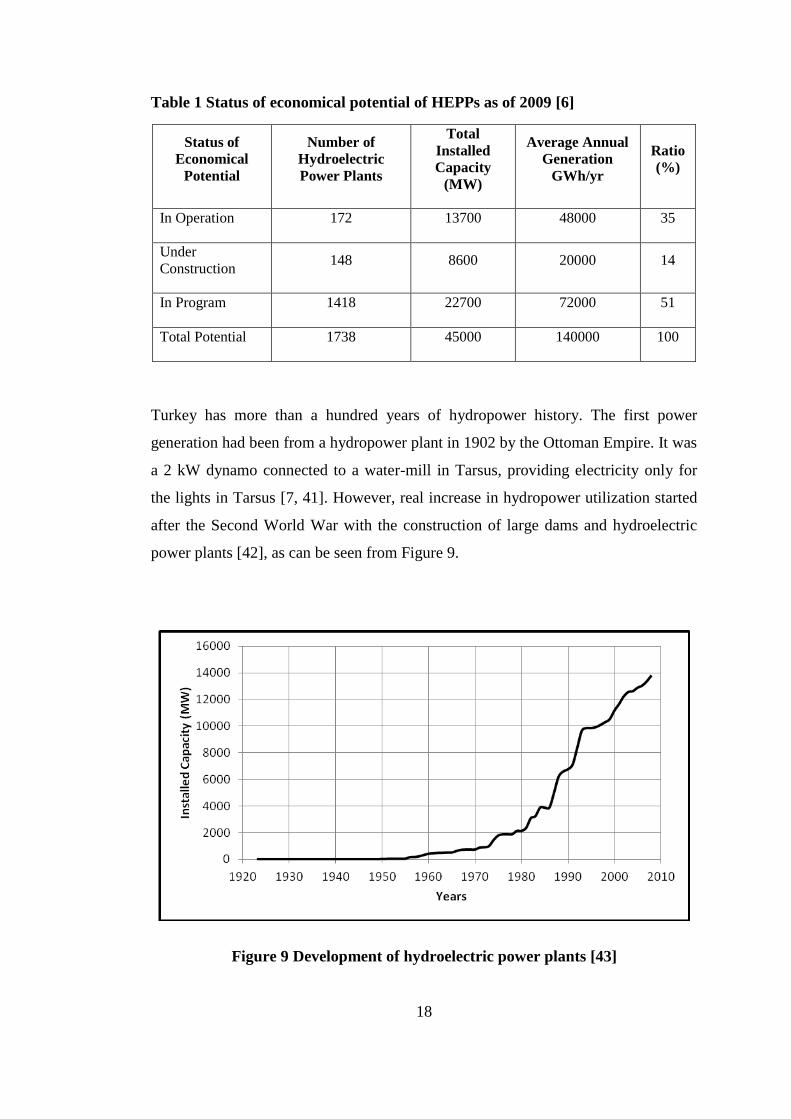
Turkey has more than a hundred years of hydropower history. The first power
generation had been from a hydropower plant in 1902 by the Ottoman Empire. It was
a 2 kW dynamo connected to a water-mill in Tarsus, providing electricity only for
the lights in Tarsus [7, 41]. However, real increase in hydropower utilization started
after the Second World War with the construction of large dams and hydroelectric
power plants [42], as can be seen from Figure 9.
Figure 9 Development of hydroelectric power plants [43]
19
Large dams are defined by ICOLD (International Committee on Large Dams) as the
dams having a height of more than 15 m or a reservoir volume of more than 3 hm3.
DSİ reports that as of 2009, there are 673 large and 657 small dams according to
ICOLD‟s classification [44]. However, not all of the dams are for energy generation.
As seen in Table 1, there are 172 HEPPs in Turkey. Most of the dams serve other
purposes like irrigation, water supply and flood control, while some are multi-
purpose dams.
Level of energy consumption is an indication of the level of industrialization and
prosperity of countries. Annual energy consumption per capita has reached 2900
kWh recently in Turkey. It is slightly above world‟s average (2500 kWh), but is very
low when compared to the average of developed countries (8900 kWh) [44]. Turkey
has taken steps to reach the level of developed countries in economic terms for
decades. As of 2009, it is the 17th
largest economy in the world [45]. Hydroelectric
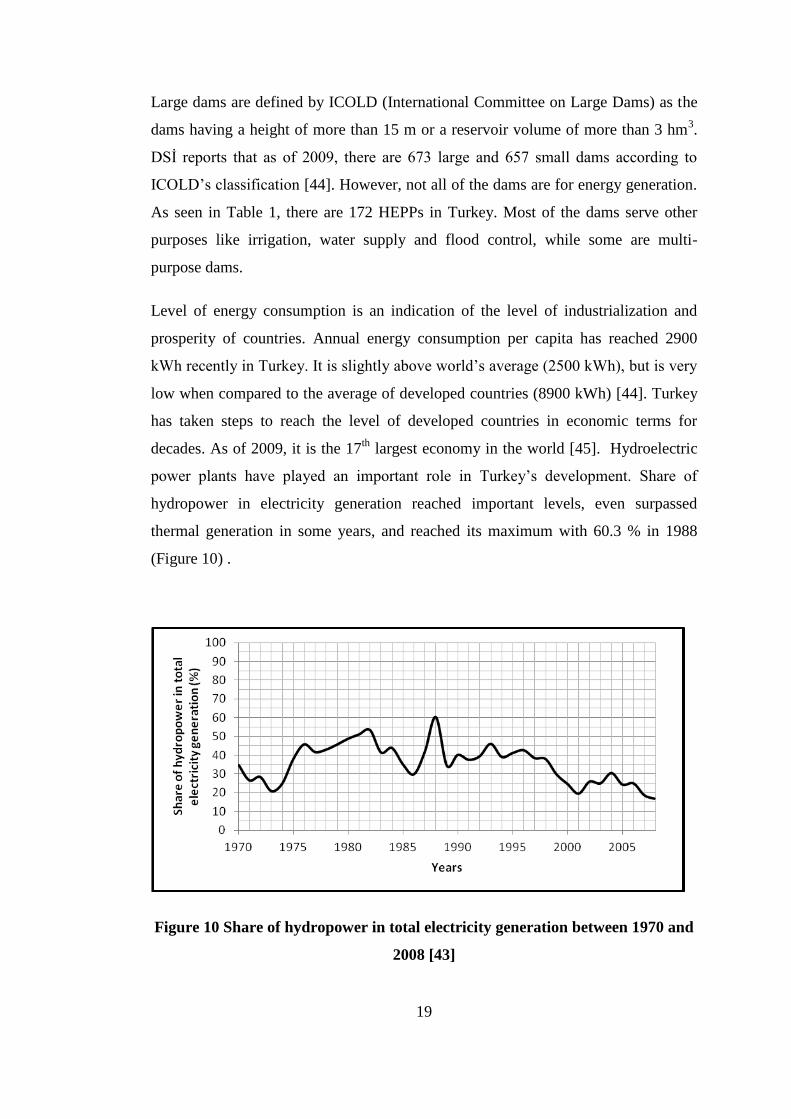
power plants have played an important role in Turkey‟s development. Share of
hydropower in electricity generation reached important levels, even surpassed
thermal generation in some years, and reached its maximum with 60.3 % in 1988
(Figure 10) .
Figure 10 Share of hydropower in total electricity generation between 1970 and
2008 [43]
20
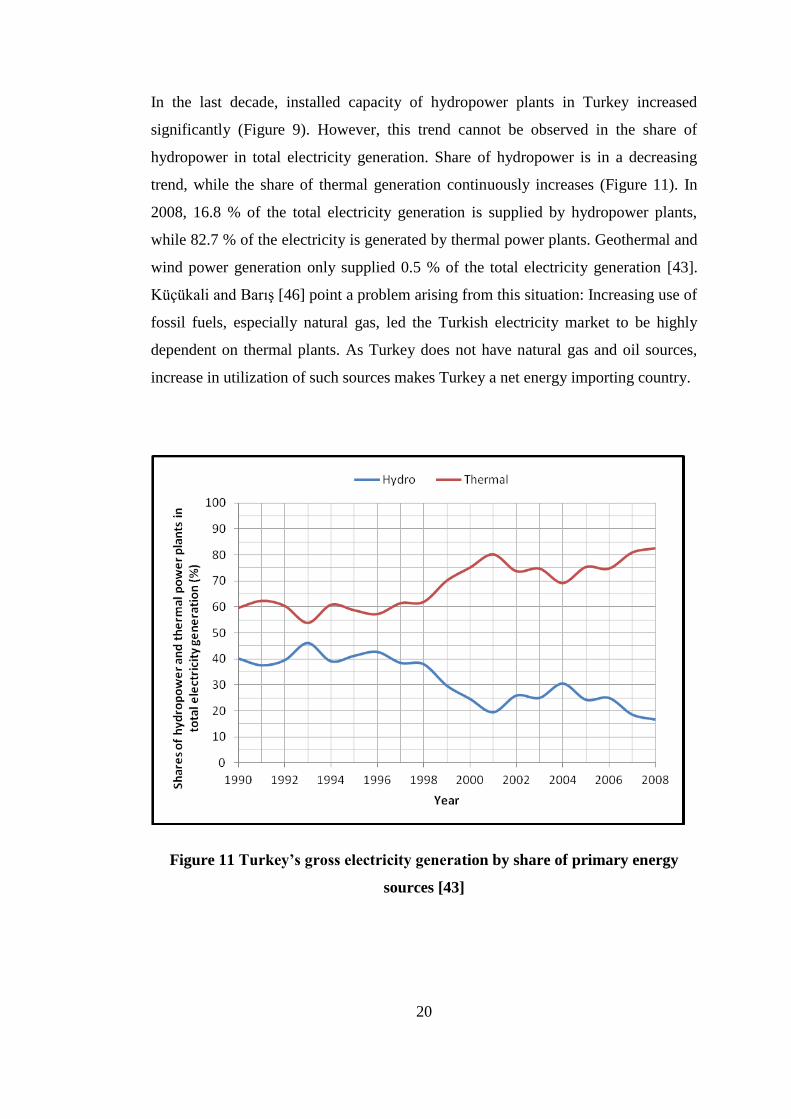
In the last decade, installed capacity of hydropower plants in Turkey increased
significantly (Figure 9). However, this trend cannot be observed in the share of
hydropower in total electricity generation. Share of hydropower is in a decreasing
trend, while the share of thermal generation continuously increases (Figure 11). In
2008, 16.8 % of the total electricity generation is supplied by hydropower plants,
while 82.7 % of the electricity is generated by thermal power plants. Geothermal and
wind power generation only supplied 0.5 % of the total electricity generation [43].
Küçükali and Barış [46] point a problem arising from this situation: Increasing use of
fossil fuels, especially natural gas, led the Turkish electricity market to be highly
dependent on thermal plants. As Turkey does not have natural gas and oil sources,
increase in utilization of such sources makes Turkey a net energy importing country.
Figure 11 Turkey’s gross electricity generation by share of primary energy
sources [43]
21
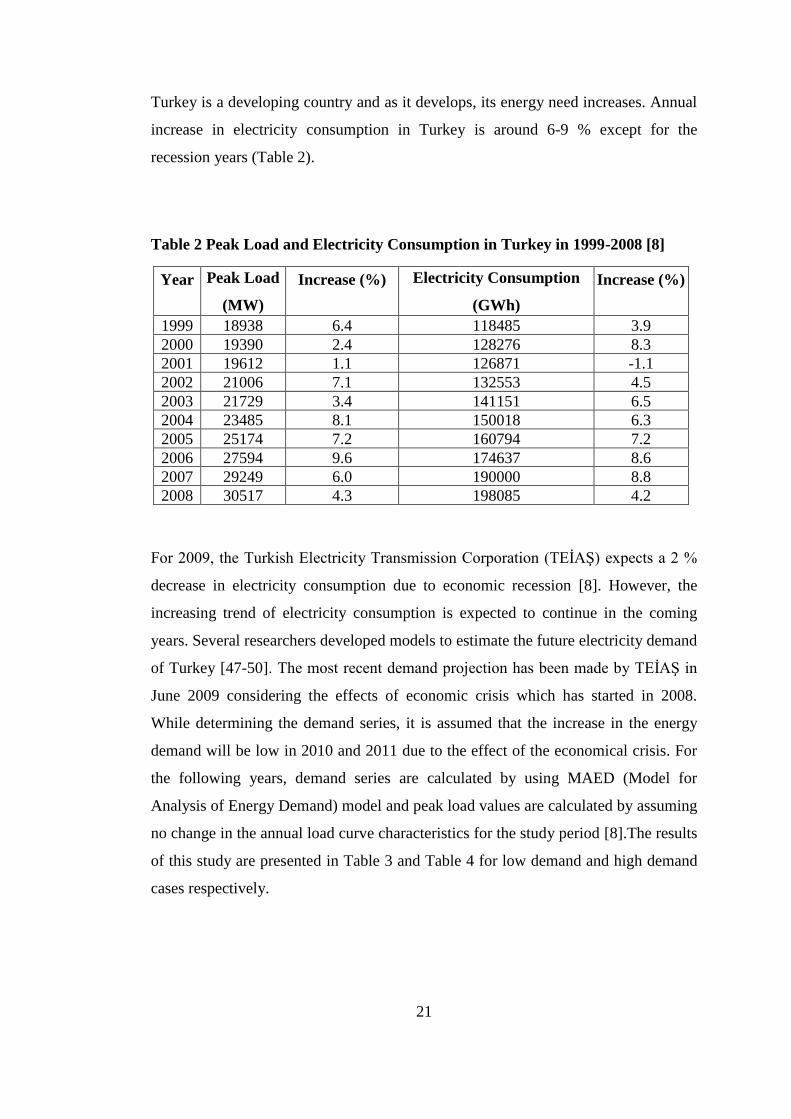
Turkey is a developing country and as it develops, its energy need increases. Annual
increase in electricity consumption in Turkey is around 6-9 % except for the
recession years (Table 2).
Table 2 Peak Load and Electricity Consumption in Turkey in 1999-2008 [8]
Year Peak Load
(MW)
Increase (%) Electricity Consumption
(GWh)
Increase (%)
1999 18938 6.4 118485 3.9
2000 19390 2.4 128276 8.3
2001 19612 1.1 126871 -1.1
2002 21006 7.1 132553 4.5
2003 21729 3.4 141151 6.5
2004 23485 8.1 150018 6.3
2005 25174 7.2 160794 7.2
2006 27594 9.6 174637 8.6
2007 29249 6.0 190000 8.8
2008 30517 4.3 198085 4.2
For 2009, the Turkish Electricity Transmission Corporation (TEİAŞ) expects a 2 %
decrease in electricity consumption due to economic recession [8]. However, the
increasing trend of electricity consumption is expected to continue in the coming
years. Several researchers developed models to estimate the future electricity demand
of Turkey [47-50]. The most recent demand projection has been made by TEİAŞ in
June 2009 considering the effects of economic crisis which has started in 2008.
While determining the demand series, it is assumed that the increase in the energy
demand will be low in 2010 and 2011 due to the effect of the economical crisis. For
the following years, demand series are calculated by using MAED (Model for
Analysis of Energy Demand) model and peak load values are calculated by assuming
no change in the annual load curve characteristics for the study period [8].The results
of this study are presented in Table 3 and Table 4 for low demand and high demand
cases respectively.
22
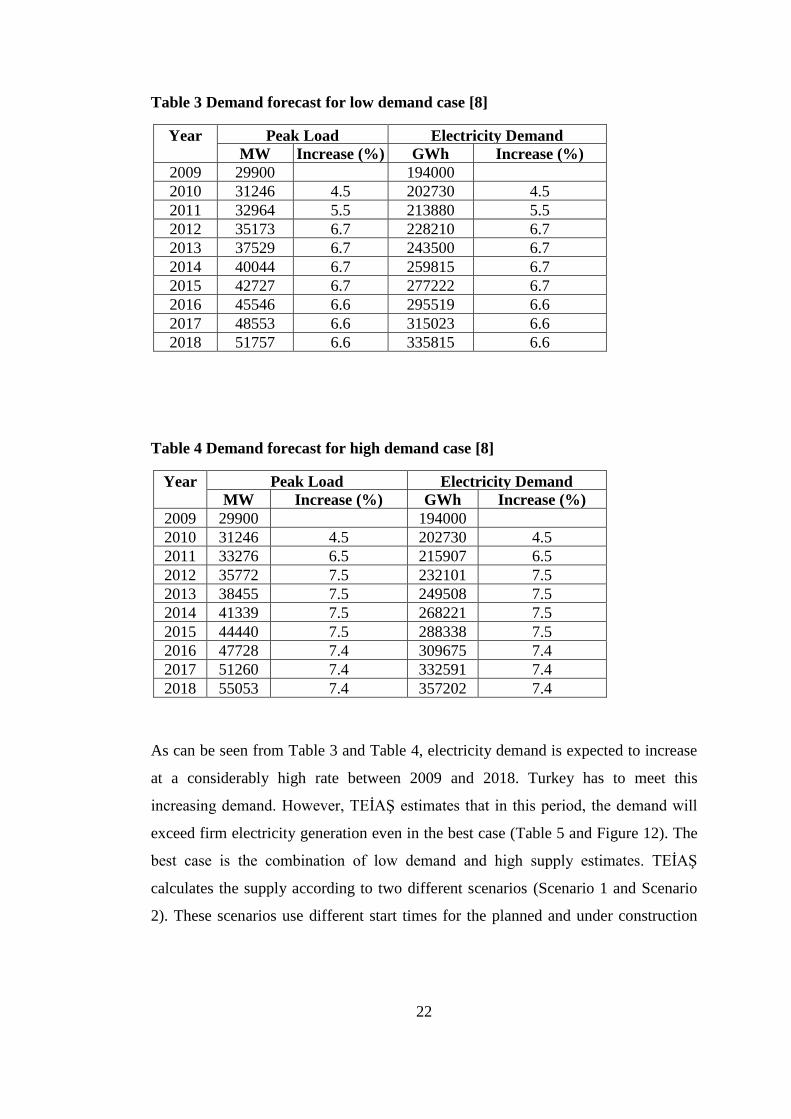
Table 3 Demand forecast for low demand case [8]
Year Peak Load Electricity Demand
MW Increase (%) GWh Increase (%)
2009 29900 194000
2010 31246 4.5 202730 4.5
2011 32964 5.5 213880 5.5
2012 35173 6.7 228210 6.7
2013 37529 6.7 243500 6.7
2014 40044 6.7 259815 6.7
2015 42727 6.7 277222 6.7
2016 45546 6.6 295519 6.6
2017 48553 6.6 315023 6.6
2018 51757 6.6 335815 6.6
Table 4 Demand forecast for high demand case [8]
Year Peak Load Electricity Demand
MW Increase (%) GWh Increase (%)
2009 29900 194000
2010 31246 4.5 202730 4.5
2011 33276 6.5 215907 6.5
2012 35772 7.5 232101 7.5
2013 38455 7.5 249508 7.5
2014 41339 7.5 268221 7.5
2015 44440 7.5 288338 7.5
2016 47728 7.4 309675 7.4
2017 51260 7.4 332591 7.4
2018 55053 7.4 357202 7.4
As can be seen from Table 3 and Table 4, electricity demand is expected to increase
at a considerably high rate between 2009 and 2018. Turkey has to meet this
increasing demand. However, TEİAŞ estimates that in this period, the demand will
exceed firm electricity generation even in the best case (Table 5 and Figure 12). The
best case is the combination of low demand and high supply estimates. TEİAŞ
calculates the supply according to two different scenarios (Scenario 1 and Scenario
2). These scenarios use different start times for the planned and under construction
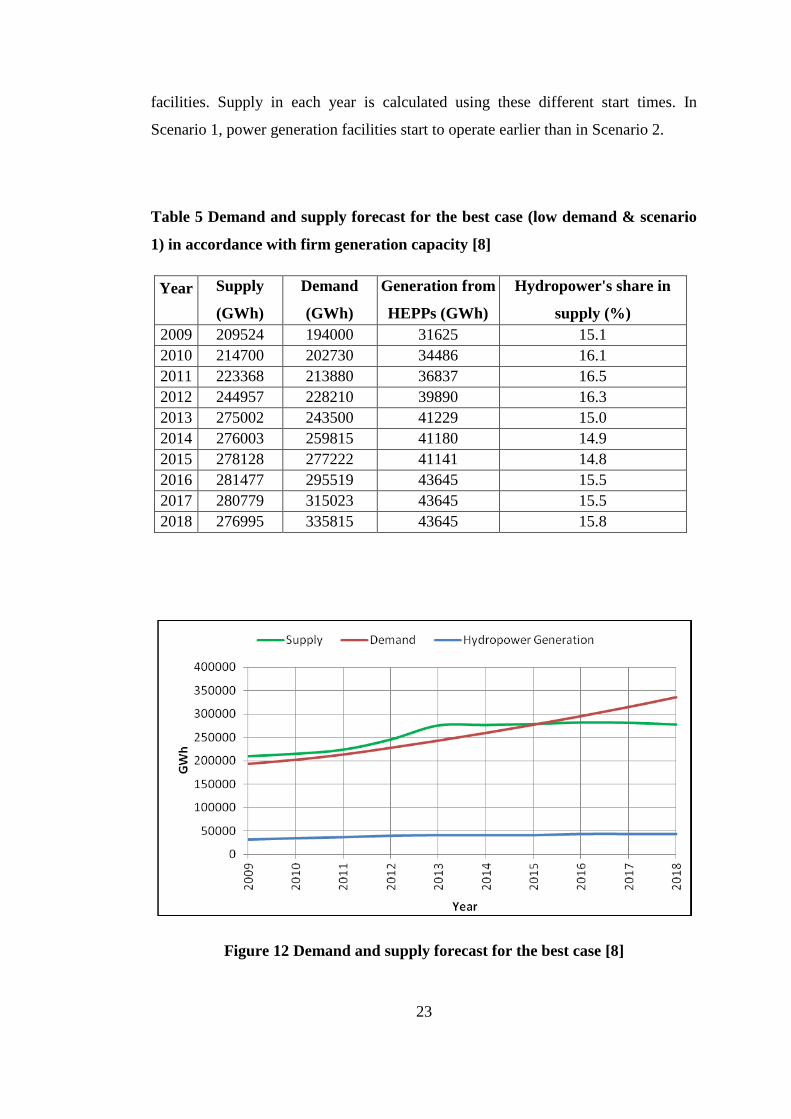
23
facilities. Supply in each year is calculated using these different start times. In
Scenario 1, power generation facilities start to operate earlier than in Scenario 2.
Table 5 Demand and supply forecast for the best case (low demand & scenario
1) in accordance with firm generation capacity [8]
Year Supply
(GWh)
Demand
(GWh)
Generation from
HEPPs (GWh)
Hydropower's share in
supply (%)
2009 209524 194000 31625 15.1
2010 214700 202730 34486 16.1
2011 223368 213880 36837 16.5
2012 244957 228210 39890 16.3
2013 275002 243500 41229 15.0
2014 276003 259815 41180 14.9
2015 278128 277222 41141 14.8
2016 281477 295519 43645 15.5
2017 280779 315023 43645 15.5
2018 276995 335815 43645 15.8
Figure 12 Demand and supply forecast for the best case [8]

24
As can be seen in Table 5 and Figure 12, in the best case, where the demand is low
and supply is high, a shortage of electricity is expected in 2016.
For the worst case which is a combination of high demand and low supply (low
supply corresponds to Scenario 2 in TEİAŞ‟s study), a shortage of electricity is
expected in 2014 (Table 6 and Figure 13).
Table 6 Demand and supply forecast for the worst case (high demand &
scenario 2) in accordance with firm generation capacity [8]
Year Supply
(GWh)
Demand
(GWh)
Generation from
HEPPs (GWh)
Hydropower's share in
supply (%)
2009 209278 194000 31479 15.0
2010 213924 202730 34114 15.9
2011 222416 215907 36340 16.3
2012 234119 232101 39187 16.7
2013 258346 249508 40343 15.6
2014 263547 268221 40294 15.3
2015 265672 288338 40255 15.2
2016 269021 309675 42759 15.9
2017 268323 332591 42759 15.9
2018 264539 357202 42759 16.2
Figure 13 Demand and supply forecast for the worst case [8]
25
Supply in the best and worst cases above is defined in terms of firm generation
capacity. Firm generation capacity is calculated by taking into account maintenance,
planned outages, forced outages, hydrologic conditions and rehabilitation schedule or
power plants. For example, for hydropower plants, dry hydrologic conditions are
assumed when firm generation capacity is calculated.
It is obvious that, even if Turkey develops all of its economical hydropower
potential, it will not be sufficient to meet the demand in the future. However, since it
is a reliable, domestic, emission-free and renewable resource providing clean, fast
and flexible electricity generation, it should be prioritized in the energy policy
together with other renewable energy technologies such as wind and solar power.
2.1.7 Advantages and Disadvantages of Hydropower
Hydropower is the most widely used renewable energy technology. It is a mature
technology and its strengths and weaknesses are equally well understood [3].
Advantages and disadvantages of hydropower schemes can be listed in terms of
economic, social and environmental aspects.
2.1.7.1 Economic Aspects
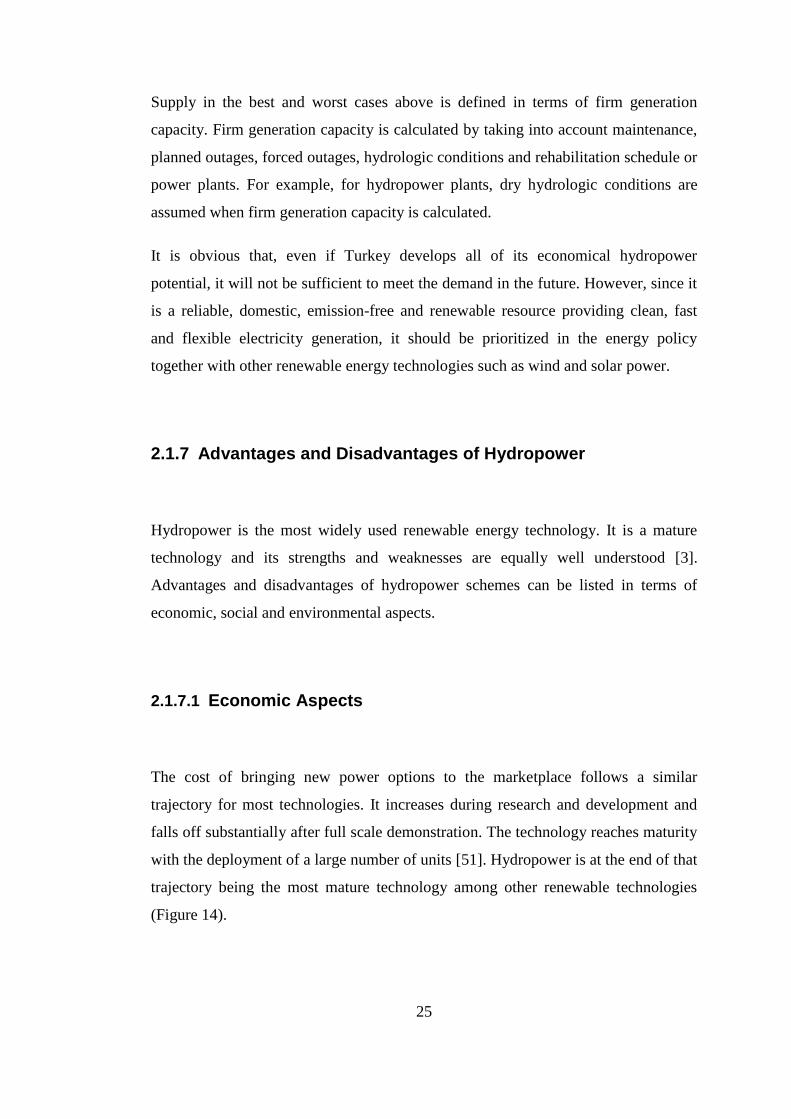
The cost of bringing new power options to the marketplace follows a similar
trajectory for most technologies. It increases during research and development and
falls off substantially after full scale demonstration. The technology reaches maturity
with the deployment of a large number of units [51]. Hydropower is at the end of that
trajectory being the most mature technology among other renewable technologies
(Figure 14).
26
Figure 14 Renewables Technology Development [51]
Hydropower plants can provide peak load service. Their fast response times enable
them to meet sudden fluctuations in demand and this improves electricity grid
stability and reliability. Production from hydropower plants can start within just a
few minutes while the time needed for other turbines are as much as 30 minutes [52].
This feature, when combined with a storage capacity, offers a unique operational
flexibility that can assist the development of other less flexible and less reliable
renewable energy technologies such as wind and solar power.
Hydropower projects have a long life span of 50 to 100 years or more, unlike thermal
plants having a lifetime of 25 to 30 years. Also operation and maintenance costs of
hydropower plants are very low when compared to thermal plants [3].
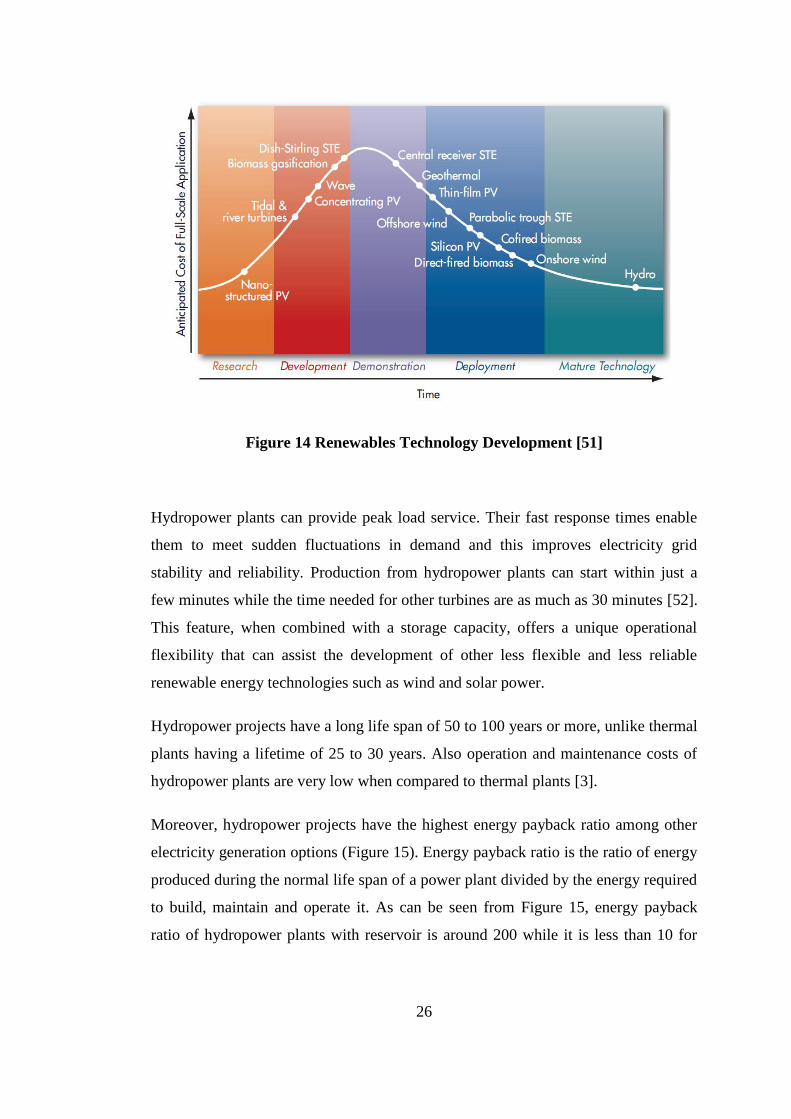
Moreover, hydropower projects have the highest energy payback ratio among other
electricity generation options (Figure 15). Energy payback ratio is the ratio of energy
produced during the normal life span of a power plant divided by the energy required
to build, maintain and operate it. As can be seen from Figure 15, energy payback
ratio of hydropower plants with reservoir is around 200 while it is less than 10 for
27
coal and natural gas. The highest energy payback ratio belongs to run-of river plants,
which is around 270.
Figure 15 Energy payback ratio of energy options [53]
Water is a domestic resource and hydropower uses its energy without depleting it.
Actually, this is the definition of “renewable energy”. All hydropower plants,
whether a run-of-river or a storage plant, meet this definition. Since water is a
domestic resource, hydropower provides independency in terms of energy and fosters
energy security and price stability. In Turkey, total electricity generation in 2008 was
200 TWh [43]. Hydropower plants generated 33.3 TWh while thermal plants using
natural gas generated 100 TWh [43]. These thermal plants consumed 21.6 x 10⁹ m
3
natural gas [43]. If the entire economic hydropower potential (140 TWh) had been
utilized, there would have been no need for thermal plants running with natural gas.
If the price of 1000 m3 natural gas is assumed to be roughly $400, the saved import
cost would be $8.6 billion. If all hydropower potential is utilized, 70 % of Turkey‟s
demand for 2008 can be generated from hydropower. Most of the remaining
28
electricity demand would be met by lignite (42 TWh [43]), which is also a domestic
resource. This scenario will result in dependency on foreign resources to decrease
significantly.
Another economic benefit of the hydropower plants is that some of the plants with
reservoirs are used for water supply and irrigation purposes as well.
There are some disadvantages of hydropower plants in economic terms. For large
scale projects the most important economic disadvantage is the need for high upfront
investment and long term planning. In this point of view, large hydropower projects
are not solely adequate as a complete solution in the short term. However, for small
scale projects this disadvantage disappears.
Small hydropower plants, especially run-of river plants without storage are
dependent on precipitation. In dry hydrologic seasons, small plants may not be able
to generate the expected amount of electricity. This is one of the most important
drawbacks of run-of river-plants. For hydropower plants with storage, however,
hydrologic conditions do not have a pronounced effect, since these plants can store
water in seasons of high flows and use it in dry seasons.
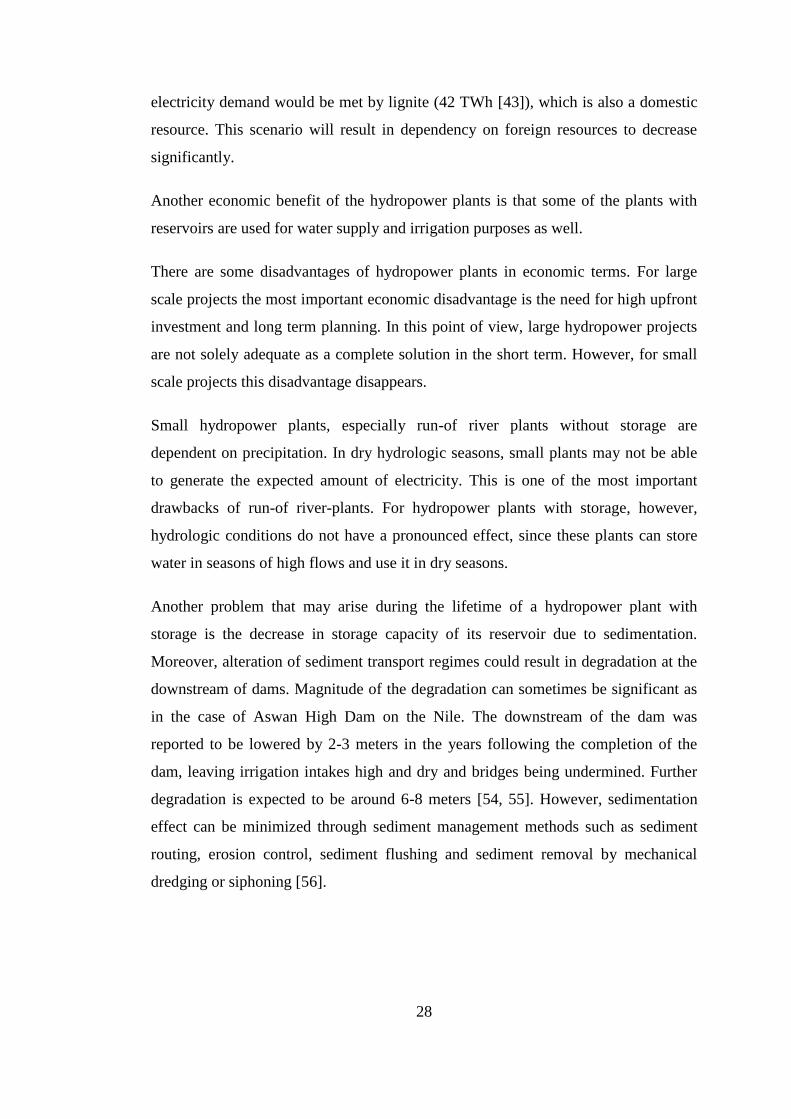
Another problem that may arise during the lifetime of a hydropower plant with
storage is the decrease in storage capacity of its reservoir due to sedimentation.
Moreover, alteration of sediment transport regimes could result in degradation at the
downstream of dams. Magnitude of the degradation can sometimes be significant as
in the case of Aswan High Dam on the Nile. The downstream of the dam was
reported to be lowered by 2-3 meters in the years following the completion of the
dam, leaving irrigation intakes high and dry and bridges being undermined. Further
degradation is expected to be around 6-8 meters [54, 55]. However, sedimentation
effect can be minimized through sediment management methods such as sediment
routing, erosion control, sediment flushing and sediment removal by mechanical
dredging or siphoning [56].
29
2.1.7.2 Social Aspects
Hydropower projects can have both positive and negative social impacts. According
to IHA [3], hydropower has a huge potential for improving social justice, as long as
projects are developed and managed in a way that enhances equity between:
Present and future generations
Local and regional communities
Vulnerable social groups and society at large
Nations
Equity between present and future generations is enhanced through the use of clean
and renewable resources. Therefore, present generations do not deplete natural
resources, saving them for future generations and maintaining a cleaner world by
minimizing the use of fossil fuels.
Hydropower projects often provide flood control, supply water for domestic and
agricultural uses, enhance navigation conditions and accessibility of the territory with
access roads and bridges, and provide employment opportunities for the local
communities. In many places, hydropower alone facilitated the social and economic
development of societies. For example, development of the arid regions of the
western USA has only been possible through the construction of dams and in Asia
the so-called “Green Revolution”, which has led to large increases in food production
over the last 40 years, is to a large extend supported by dams [3].
Hydropower projects may have negative effects on local communities. Negative
social impacts of hydropower projects are mainly associated with displacement of
people living at and in the close vicinity of the dam and the reservoir area. For large
projects, number of people forced to resettle reaches millions. For instance, more
than 1.2 million people are relocated due to Three Gorges Dam in China although the
reservoir area is typically regarded as a poor mountainous area with little
development [57]. Even if the population to be relocated is not very high, serious
30
social conflicts may appear. The San Juan Dam in Mexico was indefinitely
postponed when confronted with a tough opposition from the local Indian
population. The residents affected by the Chico River project in the Philippines
joined the guerillas to stop the project [58]. However, there is a growing awareness
about the consequences of resettlement in the world. The countries suffering the most
from these consequences in Asia and Latin America have developed comprehensive
strategies for compensation and support for the affected people. Successful examples
revealed the key concepts in resettlement actions as [52]:
Timely and continuous communications between developers and those
affected
Adequate compensation, support and long term contact
Efforts to ensure that the disruption of relocation is balanced by some benefits
from the project.
One of the successful examples is Birecik Dam in the Southeastern Anatolia Region
of Turkey. 30000 people were affected and 6500 of them were subject to
resettlement due to the construction of the dam [59]. In the planning and
implementation process of the project, public awareness and participation were
sought. Questionnaires and public meetings were arranged and the final shape of the
plans was given under the guidance of public opinion. New settlement areas were
chosen by the affected people. Besides the funds awarded to the ones affected, new
income generating facilities like beekeeping and new crop types suitable to the
region were introduced in order to compensate for the losses due to the dam
construction. A Multi-Purpose Community Center (ÇATOM) was established in
order to facilitate social adaptation to the new settlement area.
Another social impact of hydropower projects arise from the land requirements [3].
Especially large projects with reservoirs can inundate fertile lands, and cultural
heritages. For example, Ilısu Dam in Southeastern Anatolia will inundate Hasankeyf,
an international heritage which witnessed numerous civilizations for 12000 years
[60].
31
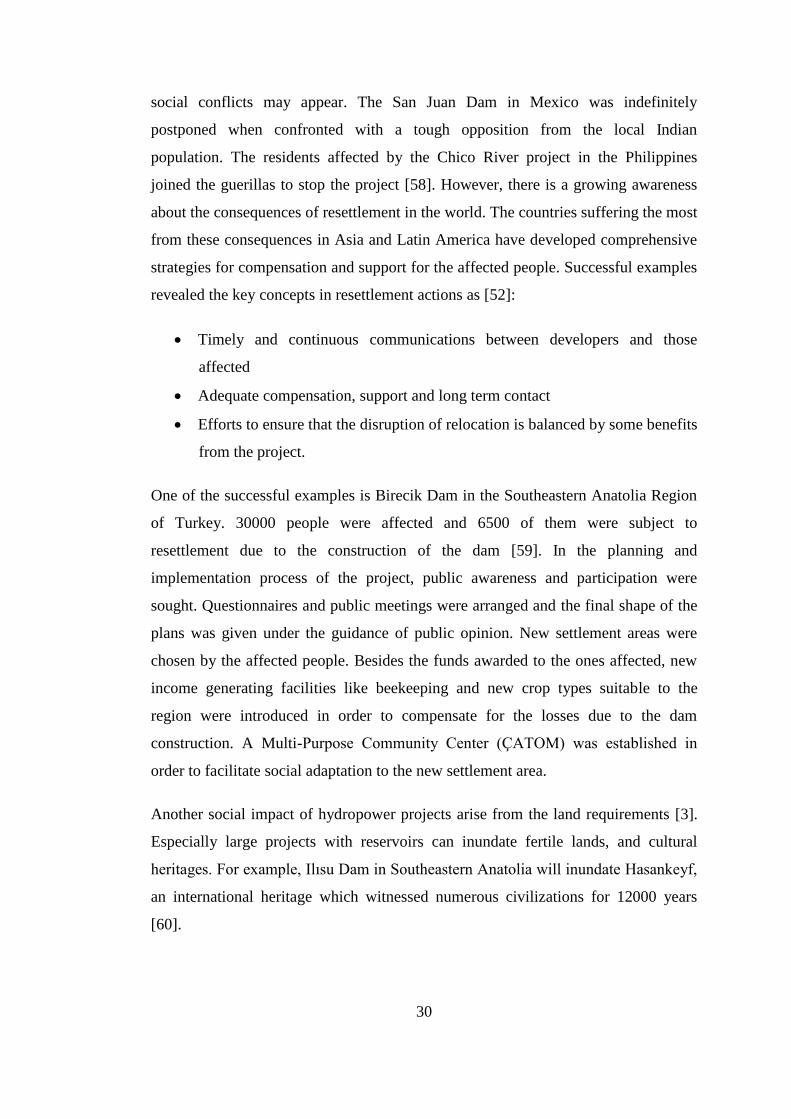
These negative impacts of hydropower projects are mostly related with large
hydropower projects with reservoirs. Run-of-river plants do not require large areas.
Actually, when compared to other energy options, a run-of river hydropower plant is
one of the least land requiring options [53]. As can be seen from Figure 16, run-of
river plants need 1 km2/TWh while hydropower plants with reservoir and biomass
plantation need 152 km2/TWh and 533 km
2/TWh, respectively. Therefore
resettlement and land requirement problems are irrelevant for these types of projects.
Figure 16 Land requirements of energy options [53]
Although run-of-river hydropower plants have relatively small impacts as compared
to storage plants, they are also confronted with public opposition. Construction of
access road, transmission lines and powerhouse can damage unique ecosystems.
Moreover, these plants may negatively impact human activities such as fishing and
ecotourism. Since water is diverted from its natural course, the locals who use the
water for drinking or irrigation purposes may be affected. Some of them earn their

32
living from the river and they may have to move their house in search of other jobs.
Their lifestyle are altered and threatened.
2.1.7.3 Environmental Aspects
United Nations Environment Programme (UNEP) recognizes climate change as a
major global challenge that will have significant and long lasting impacts on human
well-being and development. The main drivers of climate change are anthropogenic
greenhouse gas (GHG) emissions, especially CO2 [61]. GHG emissions are mainly
produced by burning of fossil fuels. On the other hand, hydropower plants produce
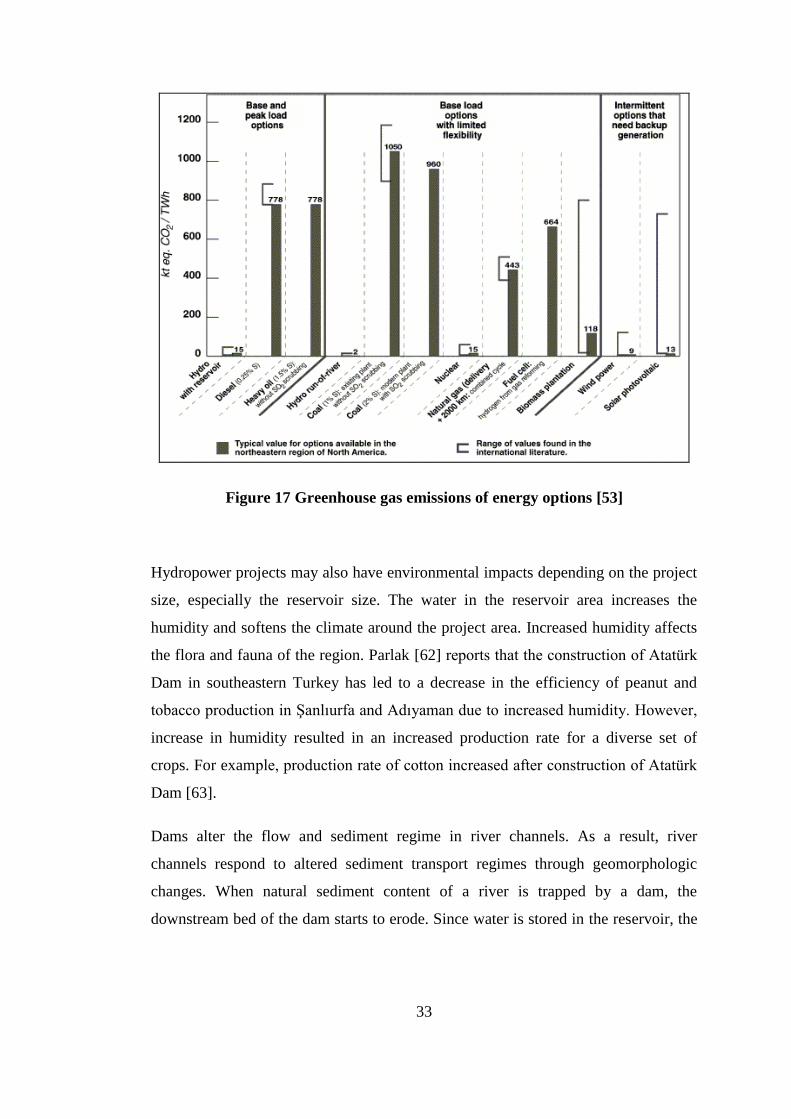
very small amount of GHGs when compared to other energy options (Figure 17).
The source of GHG emissions in hydropower plants is the rotting of organic matter
from the vegetation and soils flooded when the reservoir is first filled. By offsetting
GHG emissions from gas, coal and oil fired power plants, hydropower can help slow
down global warming. Studies have shown that development of even half of the
world‟s economically feasible hydropower potential could reduce GHG emissions by
about 13 % [52].
Furthermore, hydropower plants do not emit any air pollutants. A coal-fired plant can
emit 1000 times more SO2 (main cause of acid rain) than a hydropower plant when
the fuel required to build the hydropower plant is taken into account [52]. Increased
utilization of hydropower plants can help reduce emissions of SO2 as well as other
air pollutants like nitrous oxides, thus leaving a cleaner air to future generations and
minimize life losses which are estimated at 2 million each year [61].
33
Figure 17 Greenhouse gas emissions of energy options [53]
Hydropower projects may also have environmental impacts depending on the project
size, especially the reservoir size. The water in the reservoir area increases the
humidity and softens the climate around the project area. Increased humidity affects
the flora and fauna of the region. Parlak [62] reports that the construction of Atatürk
Dam in southeastern Turkey has led to a decrease in the efficiency of peanut and
tobacco production in Şanlıurfa and Adıyaman due to increased humidity. However,
increase in humidity resulted in an increased production rate for a diverse set of
crops. For example, production rate of cotton increased after construction of Atatürk
Dam [63].
Dams alter the flow and sediment regime in river channels. As a result, river
channels respond to altered sediment transport regimes through geomorphologic
changes. When natural sediment content of a river is trapped by a dam, the
downstream bed of the dam starts to erode. Since water is stored in the reservoir, the

34
amount of water to be released decreases. The change in flow regime can have
detrimental effects on aquatic ecology and habitats [3, 54].
One of the possible negative impacts of dams is the prevention of fish and other
aquatic life from traveling upstream. Their reproduction cycle is disturbed. More
importantly, the ecology of the entire river basin is at stake since the natural
biological interchanges along the river course are disturbed. Nutrient supply to
downstream areas will be changed and insect life will be affected. Migration of the
living aquatic organisms will be prevented and the existing food webs and
biodiversity conditions will be changed [54].
Water temperature is also affected by hydropower projects. In some cases very
sensitive ecosystems may suffer from temperature changes [54]. Water quality of the
stored water is another issue to be considered regarding the environmental effects of
hydropower systems. Decaying organic material and blooms of algae may cause
anaerobic processes to be set up in the reservoir, making it impossible for aquatic life
to sustain [54].
Besides the aquatic life, terrestrial life can also be affected from hydropower
projects. Habitats of some species can be inundated. For example in Balıkesir,
Turkey, a colony of more than 20000 bats, were living in the caves which are now
under water due to the construction of Havran Dam. However, in this case, DSİ
constructed artificial caves and eventually the bat colonies have settled in the
artificial caves after the natural caves are inundated [64].
Although environmental impacts of run-of-river hydroelectric plants are smaller as
compared to plants with reservoirs, they may also affect the ecosystems. The main
problem is that water is diverted from its natural course into channels or tunnels and
released back into a downstream section of the river. This results in a decrease in the
amount of flowing water between the points where it is diverted and released back.
Fish life in these river sections may not survive. Moreover, migration of fish may
also be disturbed by run-of-river plants.
35
In East Blacksea Region of Turkey, people strongly oppose construction of
hydroelectric plants. The area has a rich ecosystem with 2300 plant species, 550 of
which are endemic [65]. On the other hand, there is a huge hydropower potential in
the region. In Çoruh Basin, around 10.5 TWh of electricity can be generated every
year, which is one third of the hydroelectricity generated in Turkey in 2008, and this
potential is planned to be harnessed by 15 hydropower plants with storage and 22
run-of-river plants [66]. However, local communities are so concerned about the
environment that they took most of the projects into court. In Turkey, more than 25
HEPPs are suspended or cancelled by courts [67]. Most of the time, HEPPs are taken
to court claiming that these HEPPs damage the environment and destroy the social
life at and in the vicinity of the project area.
In Turkey, preparation of an Environmental Impact Assessment (EIA) Report is
obligatory for HEPP projects with installed capacities of 25 MW or more [68].
Ministry of Environment and Forestry evaluates the EIA report and issues an
“Environmental Impact Assessment is Positive” or “Environmental Impact
Assessment is Negative” decision. For “negative” decisions, owners may make a
new application after revising the EIA report. Projects failing to get an “EIA is
positive” decision cannot be realized. Projects with installed capacities between 0.5
MW and 25 MW are subject to the Selection and Elimination Criteria. The owner
prepares a “Project Presentation File” [68]. Ministry of Environment and Forestry
decides whether EIA is required or not.
EIA Regulation in Turkey has been changed in 2008 to comply with the EU
Directives, and a strong legal infrastructure now exists for EIA procedure [69].
However, there are significant deficiencies in implementation, monitoring and
control of EIA procedure. Structure of the EIA report examining commission is
specified in the regulation. However, the qualifications and experience of these
members are not mentioned. Objectiveness of these commissions is often questioned
by the stakeholders. Moreover, there are some issues related to public participation in
the EIA Regulation. In the Selection and Elimination Procedure, there is no
obligation to consult public opinion. Public participation meetings are mandatory

36
only in the EIA process. However, there is no binding article for the decision makers
to reflect the public opinions to the final decision. Therefore, participation in Turkey
is generally performed by judicial power [69].
2.1.8 Planning and Implementation of Hydropower Projects
Hydropower planning covers a wide range of topics. Professionals from many
disciplines take part in the planning and implementation of hydropower projects.
Civil engineers, mechanical engineers, electrical engineers, geologists, economists,
ecologists, sociologists and many other experts combine their skills in order to
develop an optimum design considering technical, financial, environmental and
social aspects of hydropower development.
Hydropower project development consists of three main parts:
Preconstruction
Implementation
Operation and Maintenance
2.1.8.1 Preconstruction Phase
The most important part of the project development takes place in the
preconstruction phase since the majority of the investigation, planning and design
studies are completed in this phase.
There may be several alternative projects to be investigated and each alternative has
different properties to be considered. These alternatives are investigated in several
consecutive stages with increasing order of detail, importance and reliability. The
stages of preconstruction phase are:
37
Reconnaissance studies
Prefeasibility studies
Feasibility studies
In each of these stages, the alternatives are investigated to the depth necessary for
reaching a conclusion on their suitability for the stated purpose. The alternatives
failing to meet the requirements of that stage are eliminated, and the remaining ones
pass to a new stage where more detailed investigations and evaluations are carried
out. This elimination procedure saves money and time since the redundant and less
attractive options are eliminated at the early stages.
2.1.8.2 Reconnaissance Studies
These studies are the first step to project planning and the main concern is the
identification and investigation of the alternatives. At this early stage of planning, the
successful identification and evaluation of the alternatives rely on experienced
hydropower planners. The investigations are generally headed by engineers with an
extensive experience of planning and construction of hydropower projects.
Contractor experience is also needed for costing and scheduling estimations.
Contribution of these experienced engineers helps to formulate well balanced project
with more practical engineering solutions [70].
For reconnaissance studies, as a first step, all relevant data and information are
collected about the power market, hydrology, geology, topography, environment and
socio-economy, etc. Using the available data, planners try to establish the main
parameters for the project, such as flow, head and environmental constraints. These
parameters are not definite but subject to continuous revisions and adjustments
throughout the planning process.

38
With the established tentative parameters, initial planning of the project starts.
Several layouts are prepared and with field trips, the suitability of these layouts to the
project area is evaluated and unsuitable options are discarded.
Preliminary cost estimates are also prepared using the tentative parameters; and the
assessment of the economic viability of the projects is carried out. Alternatives are
compared according to the generation capabilities (cost per kWh annual generation).
At the end of the reconnaissance studies, a report is prepared to reflect the planners‟
opinions about the suitability of the project together with the findings of the study.
2.1.8.3 Prefeasibility Studies
In this stage, the identified projects are brought one step further in the planning
process. More detailed investigations are carried out in order to produce more
reliable results.
Geological investigations are extended to include drilling, sampling and testing in
areas where foundation uncertainties exist since these uncertainties can have a major
effect on costs. Moreover, availability of construction materials and suitable borrow
pit locations are investigated, preliminary selection of the main project characteristics
such as installed capacity and project type (whether run-of river or storage) are
realized, possible environmental and social impacts of the alternatives are identified.
With the prefeasibility investigations done and more detailed data obtained, the
alternative projects are studied and tested in order to improve project plans. Benefits
and costs are estimated based on major quantities and comparison of alternatives is
realized.
At the end of prefeasibility studies, a comprehensive report is prepared. Based on this
report owners of the project decide whether or not to continue investigations. It also
39
enables the owners to provide a basis for appropriation of funds if they decide to
continue investigations.
2.1.8.4 Feasibility Studies
Feasibility study is a comprehensive analysis and detailed study of the proposed
project. It is carried out in order to determine whether the potential development is
technically, economically and environmentally feasible and justifiable under
anticipated economic conditions [70].
Feasibility studies include estimation of diversion, design and probable maximum
floods, determination of power potential for a range of dam heights and installed
capacities for project optimization, preliminary design of main structures, earthquake
effect analysis, optimization of the project layout, water levels and components,
detailed cost estimates, development of cash flow tables, production of
implementation schedule and development plans, economical and financial analyses
and environmental impact assessment [70, 71].
At the end of the feasibility study, a feasibility study report is prepared. This report
should provide firm, detailed and reliable information about the project since the
owners decide whether or not to go for implementation of the project. Moreover, the
report is important for the funding of the project. Lending agencies require these
reports in order to determine the desirability of financing the cost of development
[70].
The report of the feasibility studies also serves as application documentation for the
development license. In Turkey, companies willing to develop a hydropower project
prepare a feasibility report and submit it to DSİ in the very early stages of their
application to obtain their Independent Power Producer License.
40
In this study, two alternative projects for Niksar HEPP project, in addition to the one
proposed by DSİ, are developed and investigated especially in terms of economical
aspects. The analyses carried out in this study are generally performed in pre-
feasibility and feasibility phases of the project development cycle in practice.
2.1.8.5 Implementation
The implementation phase of the project consists of three stages: 1) definite plan
study, 2) tendering and contracting, and 3) construction. Although these stages are
presented as separated tasks, most of the parts are carried out simultaneously as the
project progresses.
In the definite plan studies, the project is given its final formulation and
configuration. The detailed designs of the project components are finalized. Tender
drawings are prepared. All of the details of civil engineering, electromechanical and
transmission works are determined. Road relocation designs, specifications and bill
of quantities, schedules for construction and supply, and financial plans are prepared
providing the basis for tendering procedure.
Tendering and contracting procedure starts with prequalification of tenderers, then
the tenders are evaluated and eventually contracts are signed after negotiations and
bargaining.
After a contractor is awarded with the contract, construction starts. In the
construction stage, some of the design works continue. Workshop drawings, as-built
drawings, operation and maintenance manuals, training of operation personnel
continues along with construction works. The construction works conclude when all
of the civil engineering, mechanical, electrical and transmissions works are finished.
41
2.1.8.6 Operation and Maintenance
Last but not the least is the operation and maintenance stages. The purpose of
operation and maintenance is to reduce failure risk and ensure the smooth operation
of the facility. In order to achieve this, preventive maintenance schedules should be
prepared beforehand. Each component of a hydropower project has an economic life.
By careful inspection and repairing, life span of these components can be extended
saving considerable amount of money. In some cases, however, renewal of some
components can be more feasible. For example, Keban Dam in Turkey will be
rehabilitated and turbines will be renewed. This operation will cost €50 million.
However, annual increase in the income will be $50 million due to increased
efficiency [72]. This means that the cost of the rehabilitation will be compensated in
1-2 years.
Hydropower plant operations are generally automated and remote controlled.
Therefore, a small number of employees are necessary. Periodic cleaning and small
repair works are carried out by the staff employed in the power plant, whereas, large
maintenance tasks, overhaul and repair are usually contracted to manufacturers of
electricity generation equipment.
2.1.9 Sustainable Development of Hydropower
Sustainable development is defined as the development that meets the needs of the
present without compromising the ability of future generations to meet their own
needs [73]. The role of hydropower in sustainable development has been recognized
by the United Nations. The Beijing Declaration on Hydropower and Sustainable
Development adopted at the United Nations Symposium on Hydropower and
Sustainable Development, Beijing, China, 29 October 2004 states that [74]:
42
“Having considered the social, economic and environmental dimensions of
hydropower and its potential contribution to achieving sustainable development
goals, we firmly believe that there is a need to develop hydropower that is
economically, socially, and environmentally sustainable.”
Hydropower, large or small, was identified as one of the renewable sources to be
developed with a sense of urgency in the Political Declaration signed by Ministers
and Government Representatives from 154 countries in the International Conference
for Renewable Energies, which is held in Bonn, Germany in 2004 [75]. However,
developing the remaining hydropower potential offers many difficulties. Concerns
about environmental and social performance of hydropower projects draw the
attention of public, in an unprecedented magnitude. In some cases, projects have
been cancelled due to public resistance. However, the review of the successful
applications in the hydropower sector reveals that the hydropower projects can be
truly sustainable when they fully account for their environmental and social costs
[76].
In order to guide the projects to be developed in a sustainable way, some national
and international organizations have published guidelines. In 1998, Task Committee
on Sustainability Criteria, Water Resources planning and Management of American
Society of Civil Engineers published a report on Sustainability Criteria for Water
Resources Systems. In 2004, the International Federation of Consulting Engineers
(FIDIC) published Project Sustainability Management Guidelines [77].
In February 2004, the International Hydropower Association (IHA) published
Sustainability Guidelines to “promote greater consideration of environmental, social
and economic aspects in the sustainability assessment of new hydro projects and the
management and operation of existing power schemes” [78]. The key points of the
Sustainability Guidelines are [3]:
Encouragement for the development of national energy policy plans
Reducing the carbon intensity of energy production
A full evaluation of energy alternatives
43
A comparison of hydroelectric project alternatives
The application of environmental impact assessment principles for new
projects
Operational practices which take into account of legal and institutional
arrangements, incorporate environmental management systems and safety
considerations
Optimizing environmental outcomes by identifying issues and mitigation
strategies
Consideration of social equity issues at all stages of project implementation
through a planned programme of community consultation
IHA Sustainability Guidelines emphasize the importance of planning,
implementation and operation based on an open, transparent and effective decision-
making process. The guidelines recognize that sustainable development is the
collective responsibility of government, business and the community and call for
increased cooperation and coordination between these actors.
IHA has also developed a Sustainability Assessment Protocol in order to assist IHA
members in assessing performance of new or existing hydropower projects against
criteria described in the IHA Sustainability Guidelines. The first section of the
assessment protocol describes the selected sustainability aspects and lists key
considerations and assessment requirements for each aspect. The second part is used
to evaluate and score the hydropower projects against a large number of
sustainability aspects [79].

44
2.2 RETScreen Clean Energy Analysis Software
2.2.1 Assessment Tools for Small Hydropower Projects
Developing a hydropower project requires a great deal of money and time as well as
expertise in engineering. Investors and developers are very meticulous when
spending time and money. Any tool that can help to save money and time can easily
attract their attention. In order to enable a prospective developer to make an initial
assessment of the economic feasibility of a project, numerous computer based
assessment tools have been developed. These tools range from very simple programs
to quite advanced software packages. The main objective of these tools is to predict
the energy output of a particular hydropower scheme. Some of them can perform
other tasks such as cost estimation or financial analysis as well. Wilson [80]
evaluated available tools that are used for an initial assessment of a small
hydropower project. Table 7 shows some of the main features of small hydropower
assessment tools.
Table 7 Assessment methods for small hydro projects [80]
Assessment Tool Features
Product Applicable
Countries Hydrology
Power
&
Energy Costing
Economic
Evaluation Preliminary
Design
ASCE Small
Hydro USA
HES USA
Hydra Europe
IMP International
PEACH France
PROPHETE France Remote
Small Hydro Canada
RETScreen International
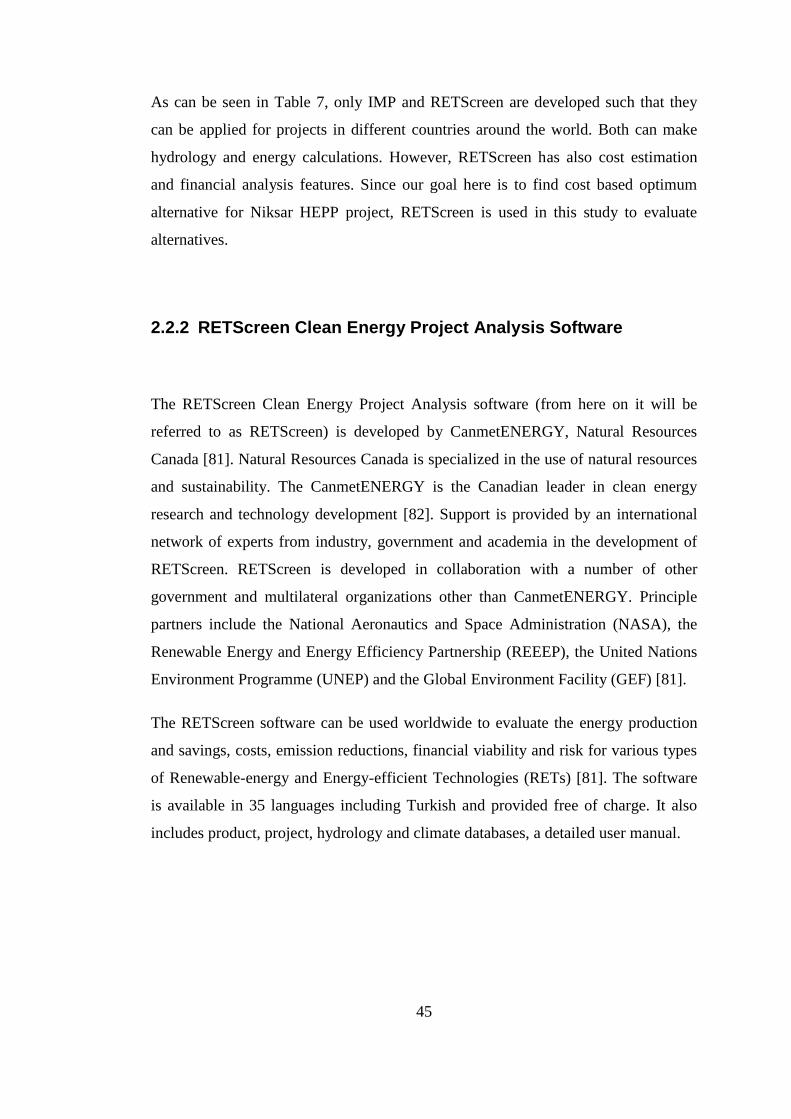
45
As can be seen in Table 7, only IMP and RETScreen are developed such that they
can be applied for projects in different countries around the world. Both can make
hydrology and energy calculations. However, RETScreen has also cost estimation
and financial analysis features. Since our goal here is to find cost based optimum
alternative for Niksar HEPP project, RETScreen is used in this study to evaluate
alternatives.
2.2.2 RETScreen Clean Energy Project Analysis Software
The RETScreen Clean Energy Project Analysis software (from here on it will be
referred to as RETScreen) is developed by CanmetENERGY, Natural Resources
Canada [81]. Natural Resources Canada is specialized in the use of natural resources
and sustainability. The CanmetENERGY is the Canadian leader in clean energy
research and technology development [82]. Support is provided by an international
network of experts from industry, government and academia in the development of
RETScreen. RETScreen is developed in collaboration with a number of other
government and multilateral organizations other than CanmetENERGY. Principle
partners include the National Aeronautics and Space Administration (NASA), the
Renewable Energy and Energy Efficiency Partnership (REEEP), the United Nations
Environment Programme (UNEP) and the Global Environment Facility (GEF) [81].
The RETScreen software can be used worldwide to evaluate the energy production
and savings, costs, emission reductions, financial viability and risk for various types
of Renewable-energy and Energy-efficient Technologies (RETs) [81]. The software
is available in 35 languages including Turkish and provided free of charge. It also
includes product, project, hydrology and climate databases, a detailed user manual.

46
2.2.2.1 RETScreen Objectives
Numerous opportunities for implementing commercially viable energy efficient and
renewable energy technologies around the world are currently being missed because
planners and decision makers do not routinely consider them [83]. Even when these
technologies have proven to be cost effective and reliable, planners and decision
makers often fail to appreciate the benefits of these technologies at the critically
important initial planning stage. The result then is missed opportunities that could
otherwise help countries meet energy needs locally, in a sustainable way, while
reducing greenhouse gas emissions, saving money and increasing energy security
and self-reliance [84]. This is one of the main reasons why CanmetENERGY
developed RETScreen. The software aims to help planners, decision makers and
industry to implement renewable energy and energy efficient projects.
The RETScreen software is designed to be used primarily at the pre-feasibility and
feasibility levels of project development cycle. It significantly reduces the costs and
helps developers to save time while identifying and assessing potential energy
projects and alternatives at the critically important initial planning stage [85]. It is a
very practical tool to determine whether work on the project should proceed further
or to be dropped. According to an independent impact assessment of the RETScreen
International, the user savings attributed to the software between 1998 and 2004 are
estimated to be $ 600 million worldwide, and expected to reach $ 7.9 billion by 2012
[83].
RETScreen is not a detailed engineering design tool. It provides rough estimations of
the project cost. Indeed, in the pre-feasibility and feasibility stages, cost estimations
are not expected to be very accurate. Figure 18 shows accuracy of project cost
estimates throughout the project completion period. At the prefeasibility stage,
project cost accuracy is within ± 40 % to 50 % of the final cost. As the work
progresses and more detailed calculations are made, accuracy increases.
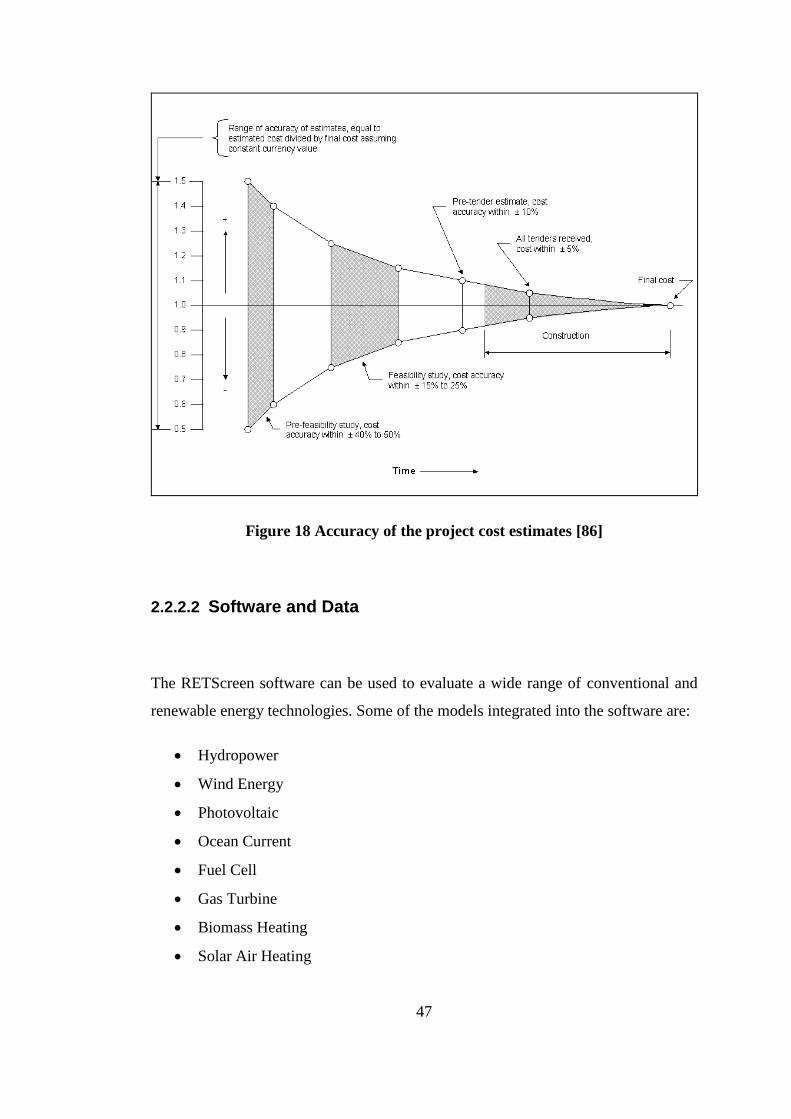
47
Figure 18 Accuracy of the project cost estimates [86]
2.2.2.2 Software and Data
The RETScreen software can be used to evaluate a wide range of conventional and
renewable energy technologies. Some of the models integrated into the software are:
Hydropower
Wind Energy
Photovoltaic
Ocean Current
Fuel Cell
Gas Turbine
Biomass Heating
Solar Air Heating

48
Wave
Geothermal
Combined Heat & Power (CHP)
Energy Efficiency Measures, etc.
The software runs on Microsoft® Excel workbooks. On the start sheet the project
type and the technology used in the system is selected. For each technology, there are
integrated meteorological and equipment performance data used by the software.
Some additional data regarding the costs and financial parameters are also needed to
evaluate the financial aspects of the project. Since gathering these data may be very
expensive and time consuming the software integrates a series of databases to
overcome this problem. However, the user can enter data manually at any time.
Although each technology has its own analysis model, a five step standard analysis
procedure is common for all of these technologies. Figure 19 shows the five step
standard analysis procedure.
Figure 19 Five step standard analysis used by the RETScreen software [87]
Step 1 – Energy Model: In this worksheet, some parameters describing the project
layout, equipment and technology to be used and load(s) or resource(s) (hydrology in
the hydropower case) are entered by the user. The software then calculates some
other values such as the annual energy production and power capacity of the plant.
49
Step 2 – Cost Analysis: There are two alternatives to carry out cost analysis. In the
cost analysis worksheet, the software allows the user to enter the initial, annual and
periodic costs. In cost analysis sheet, all of the costs are entered by the user. The
second alternative for cost analysis is called the “hydro formula costing method”.
This method is based on empirical cost formulas and is described in more detail in
Section 4.1.3.
Step 3 – Emission Analysis or Greenhouse Gas (GHG) Analysis: This is an
optional worksheet. It can be used to determine reduction in the emission of
greenhouse gases as a result of using a renewable or clean technology instead of
conventional technologies.
Step 4 – Financial Analysis: In this worksheet, the user enters the financial
parameters needed for a financial analysis. These parameters include inflation,
discount rate, debts, taxes, etc. Using these parameters together with the costs and
electricity price, RETScreen calculates some financial indicators to evaluate the
viability of the proposed project. Some of these indicators are internal rate of return
(IRR), net present value and benefit-cost ratio. Yearly cash flows together with a
cumulative cash flow diagram are also presented in the financial analysis worksheet.
Step 5 – Sensitivity & Risk Analysis: This is another optional worksheet. It helps
user determine how uncertainty in some input parameters may affect the overall
financial viability of the project.
50
CHAPTER 3
3. A CASE STUDY FROM TURKEY: NiKSAR HEPP
Niksar HEPP is a part of Lower Kelkit Project Master Plan Report, which is prepared
by State Hydraulic Works (DSİ) in 1990.
3.1 Lower Kelkit Project Master Plan Report
Project area is located in Black Sea Region of Turkey. It is at the downstream of
Kelkit Stream, within the boundaries of Tokat and Sivas.
The master plan report [88] aims to utilize the hydroelectric potential in Yeşilırmak
Basin. The project area is bounded by Çamlıgöze Dam on Kelkit Stream at the
upstream and Hasan Uğurlu Dam on Yeşilırmak at the downstream. There is 535 m
of gross head available. This much of head is planned to be converted into energy by
means of five consecutive run-of-river hydropower plants:
1. Koyulhisar HEPP
2. Reşadiye HEPP
3. Akıncı HEPP
4. Niksar HEPP
5. Erbaa HEPP
Koyulhisar HEPP has been completed in 2009 [89]. Reşadiye, Akıncı and Niksar
HEPPs are under construction [90-92]. Erbaa HEPP project has been suspended due
to “stay of execution” decision of the Council of State in December, 2009 [93]. Some
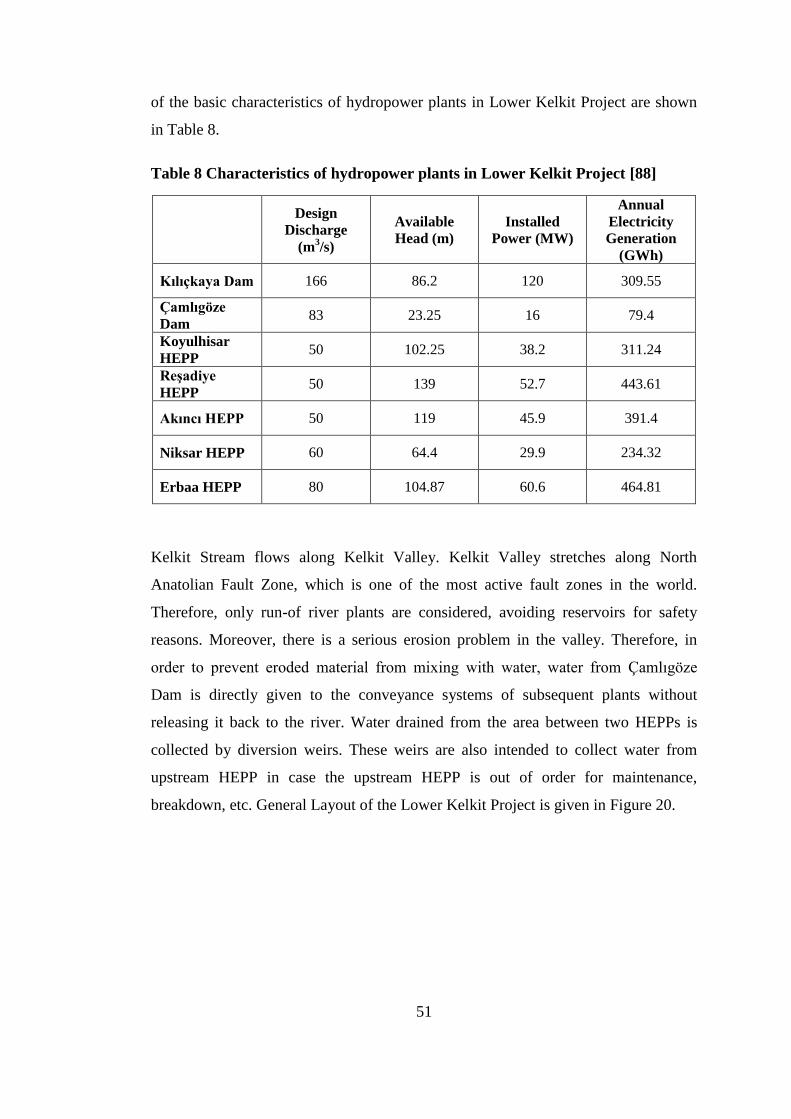
51
of the basic characteristics of hydropower plants in Lower Kelkit Project are shown
in Table 8.
Table 8 Characteristics of hydropower plants in Lower Kelkit Project [88]
Design
Discharge
(m3/s)
Available
Head (m) Installed
Power (MW)
Annual
Electricity
Generation
(GWh)
Kılıçkaya Dam 166 86.2 120 309.55
Çamlıgöze
Dam 83 23.25 16 79.4
Koyulhisar
HEPP 50 102.25 38.2 311.24
Reşadiye
HEPP 50 139 52.7 443.61
Akıncı HEPP 50 119 45.9 391.4
Niksar HEPP 60 64.4 29.9 234.32
Erbaa HEPP 80 104.87 60.6 464.81
Kelkit Stream flows along Kelkit Valley. Kelkit Valley stretches along North
Anatolian Fault Zone, which is one of the most active fault zones in the world.
Therefore, only run-of river plants are considered, avoiding reservoirs for safety
reasons. Moreover, there is a serious erosion problem in the valley. Therefore, in
order to prevent eroded material from mixing with water, water from Çamlıgöze
Dam is directly given to the conveyance systems of subsequent plants without
releasing it back to the river. Water drained from the area between two HEPPs is
collected by diversion weirs. These weirs are also intended to collect water from
upstream HEPP in case the upstream HEPP is out of order for maintenance,
breakdown, etc. General Layout of the Lower Kelkit Project is given in Figure 20.
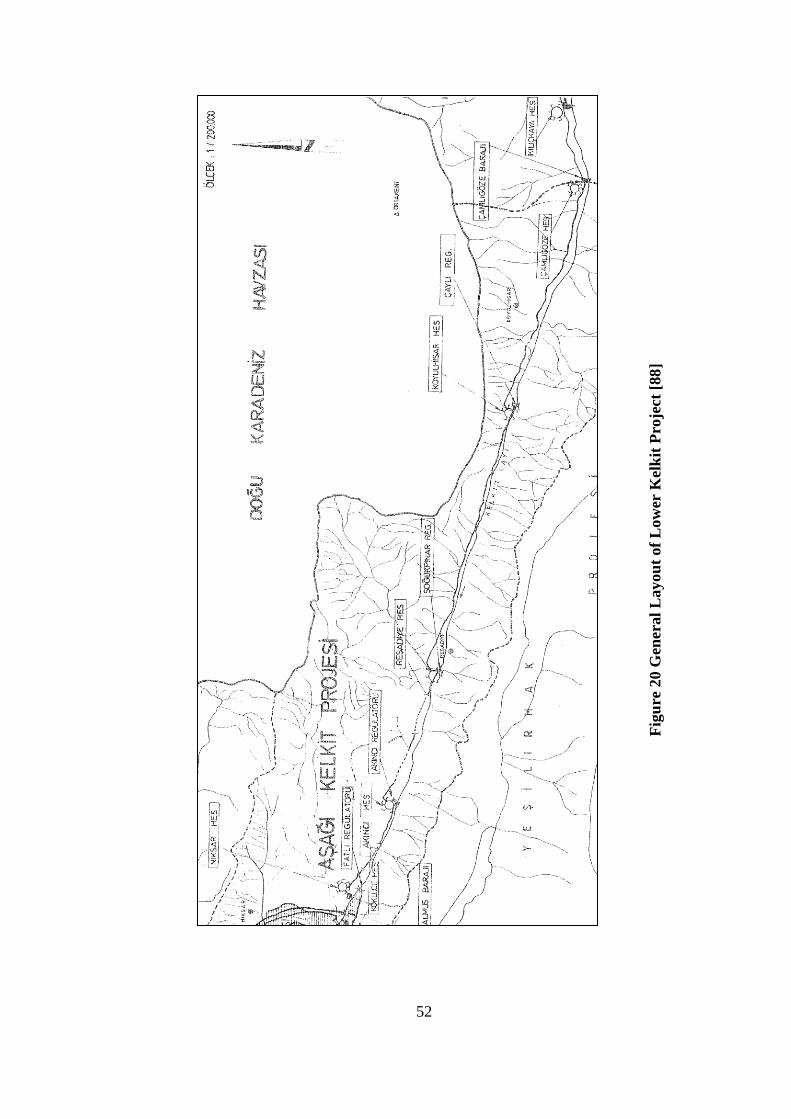
52
Fig
ure
20 G
ener
al
Layou
t of
Low
er K
elk
it P
roje
ct [
88
]
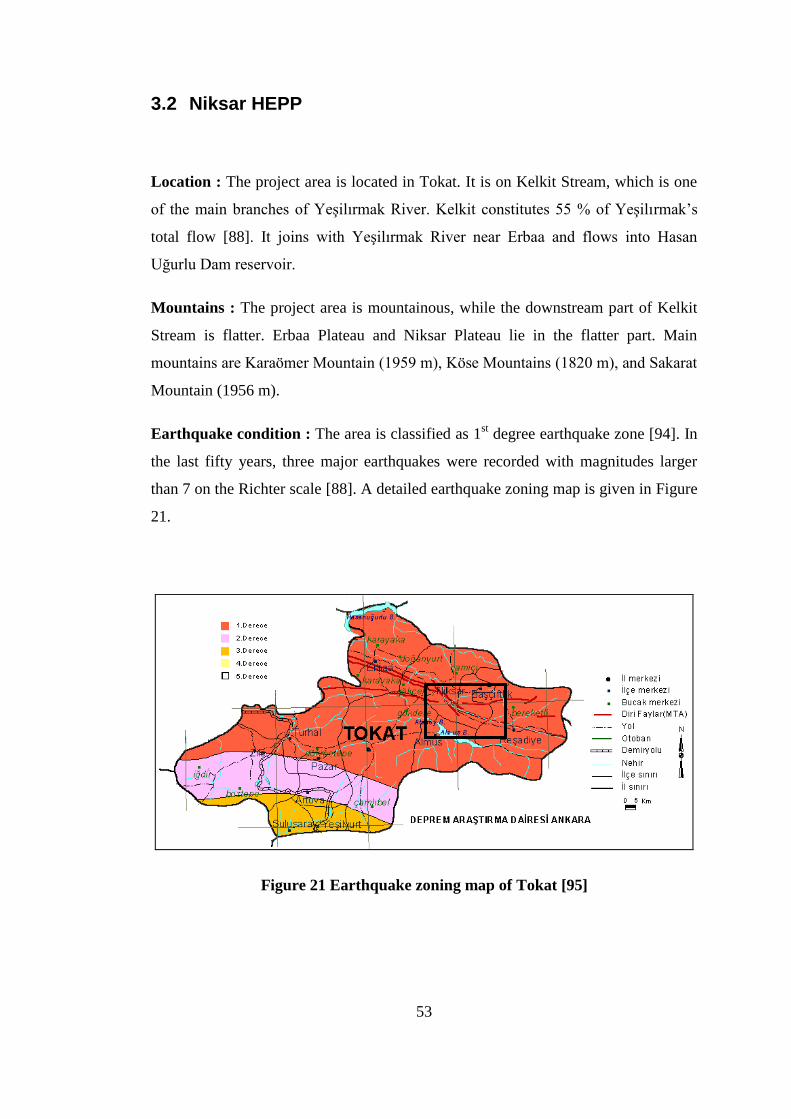
53
3.2 Niksar HEPP
Location : The project area is located in Tokat. It is on Kelkit Stream, which is one
of the main branches of Yeşilırmak River. Kelkit constitutes 55 % of Yeşilırmak‟s
total flow [88]. It joins with Yeşilırmak River near Erbaa and flows into Hasan
Uğurlu Dam reservoir.
Mountains : The project area is mountainous, while the downstream part of Kelkit
Stream is flatter. Erbaa Plateau and Niksar Plateau lie in the flatter part. Main
mountains are Karaömer Mountain (1959 m), Köse Mountains (1820 m), and Sakarat
Mountain (1956 m).
Earthquake condition : The area is classified as 1st degree earthquake zone [94]. In
the last fifty years, three major earthquakes were recorded with magnitudes larger
than 7 on the Richter scale [88]. A detailed earthquake zoning map is given in Figure
21.
Figure 21 Earthquake zoning map of Tokat [95]
54
Water resources : Kelkit Stream is formed by small creeks arising from Pülür,
Otlükbeli, Sarhan, and Bolaban Mountains in Erzincan. Kelkit‟s mean source
elevation is 1500 m. It is 245.5 km long, and has a drainage area of 11445 km2 [88].
Niksar HEPP area shows transitional characteristics between Black Sea and Central
Anatolian climates. Rainfall is concentrated in spring. In December-March period,
the area is mostly under snow cover. This cover is thicker on the northern and eastern
parts of the region. In spring, when snow melts, discharge in Kelkit Stream
significantly increases. The discharges at the location of diversion weir of Niksar
HEPP between 1966 and 2001 are given in Table 9. These discharges include the
effects of upstream plants. The values given in Table 9 are taken from the feasibility
report prepared for Niksar HEPP. Due to confidentiality reasons we will refer to this
report as The Feasibility Report [96] throughout the thesis.
A flow duration curve gives the percentage of time a given flow has been equaled or
exceeded for the period of record [17]. This curve provides information about the
future regime of the river and is used to estimate the electricity generation potential
of a power scheme at a given location. Flow duration curve can be computed from
mean monthly flows or daily flows. It is preferable to use daily flows since there may
be significant variation in flow within a month. These variations cannot be seen in
monthly flow duration curves. However, daily measurements might not be available
for each project. In such cases, mean monthly curves can be used, ignoring the errors
involved. These errors usually range from 5 % to 15 % depending on the
characteristics of the stream [97]. In order the curve to represent the flow with
sufficient accuracy, it is necessary to have a record length of at least 30 years [24,
98]. The flow duration curve is derived from the past flow data, and it is accepted to
be time-invariant. In other words, possible changes in future hydrologic regime
cannot be accounted for. Therefore, this procedure includes some uncertainties, but it
is acceptable for feasibility studies.
For the Niksar HEPP, mean monthly discharges are available for a period of 36 years
(1966-2001). Using these discharges, the flow duration curve is obtained and given
in Figure 22.
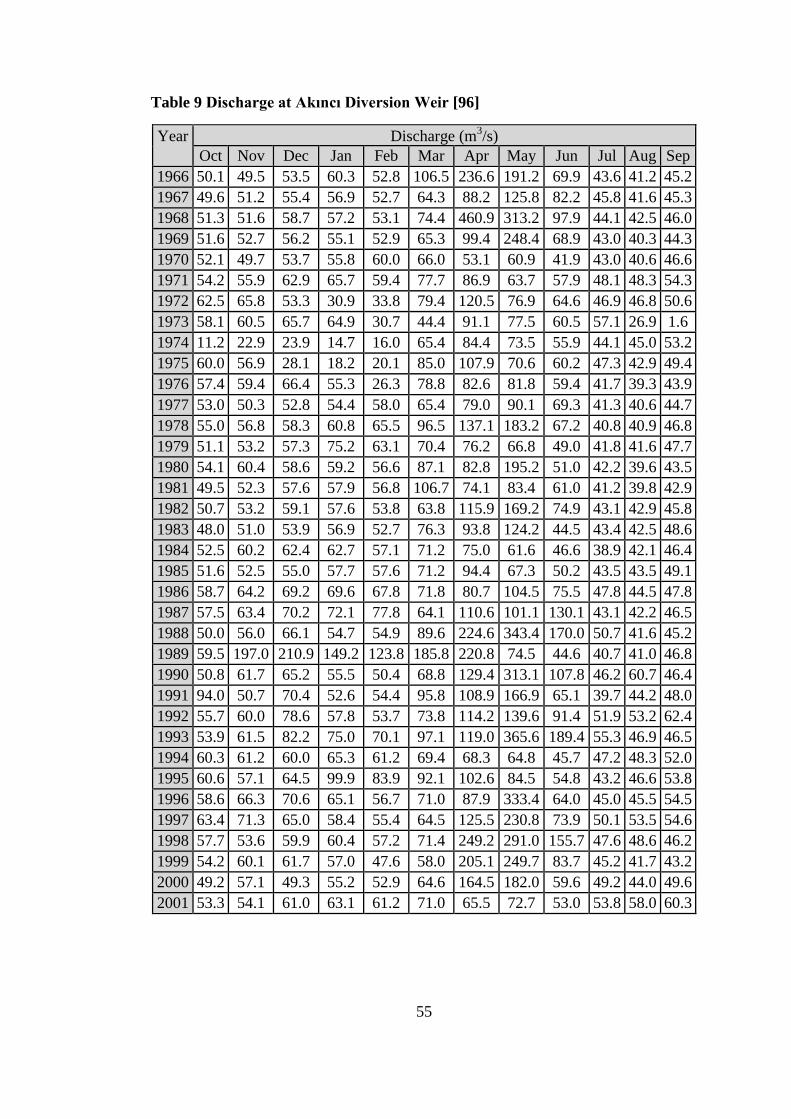
55
Table 9 Discharge at Akıncı Diversion Weir [96]
Year Discharge (m3/s)
Oct Nov Dec Jan Feb Mar Apr May Jun Jul Aug Sep
1966 50.1 49.5 53.5 60.3 52.8 106.5 236.6 191.2 69.9 43.6 41.2 45.2
1967 49.6 51.2 55.4 56.9 52.7 64.3 88.2 125.8 82.2 45.8 41.6 45.3
1968 51.3 51.6 58.7 57.2 53.1 74.4 460.9 313.2 97.9 44.1 42.5 46.0
1969 51.6 52.7 56.2 55.1 52.9 65.3 99.4 248.4 68.9 43.0 40.3 44.3
1970 52.1 49.7 53.7 55.8 60.0 66.0 53.1 60.9 41.9 43.0 40.6 46.6
1971 54.2 55.9 62.9 65.7 59.4 77.7 86.9 63.7 57.9 48.1 48.3 54.3
1972 62.5 65.8 53.3 30.9 33.8 79.4 120.5 76.9 64.6 46.9 46.8 50.6
1973 58.1 60.5 65.7 64.9 30.7 44.4 91.1 77.5 60.5 57.1 26.9 1.6
1974 11.2 22.9 23.9 14.7 16.0 65.4 84.4 73.5 55.9 44.1 45.0 53.2
1975 60.0 56.9 28.1 18.2 20.1 85.0 107.9 70.6 60.2 47.3 42.9 49.4
1976 57.4 59.4 66.4 55.3 26.3 78.8 82.6 81.8 59.4 41.7 39.3 43.9
1977 53.0 50.3 52.8 54.4 58.0 65.4 79.0 90.1 69.3 41.3 40.6 44.7
1978 55.0 56.8 58.3 60.8 65.5 96.5 137.1 183.2 67.2 40.8 40.9 46.8
1979 51.1 53.2 57.3 75.2 63.1 70.4 76.2 66.8 49.0 41.8 41.6 47.7
1980 54.1 60.4 58.6 59.2 56.6 87.1 82.8 195.2 51.0 42.2 39.6 43.5
1981 49.5 52.3 57.6 57.9 56.8 106.7 74.1 83.4 61.0 41.2 39.8 42.9
1982 50.7 53.2 59.1 57.6 53.8 63.8 115.9 169.2 74.9 43.1 42.9 45.8
1983 48.0 51.0 53.9 56.9 52.7 76.3 93.8 124.2 44.5 43.4 42.5 48.6
1984 52.5 60.2 62.4 62.7 57.1 71.2 75.0 61.6 46.6 38.9 42.1 46.4
1985 51.6 52.5 55.0 57.7 57.6 71.2 94.4 67.3 50.2 43.5 43.5 49.1
1986 58.7 64.2 69.2 69.6 67.8 71.8 80.7 104.5 75.5 47.8 44.5 47.8
1987 57.5 63.4 70.2 72.1 77.8 64.1 110.6 101.1 130.1 43.1 42.2 46.5
1988 50.0 56.0 66.1 54.7 54.9 89.6 224.6 343.4 170.0 50.7 41.6 45.2
1989 59.5 197.0 210.9 149.2 123.8 185.8 220.8 74.5 44.6 40.7 41.0 46.8
1990 50.8 61.7 65.2 55.5 50.4 68.8 129.4 313.1 107.8 46.2 60.7 46.4
1991 94.0 50.7 70.4 52.6 54.4 95.8 108.9 166.9 65.1 39.7 44.2 48.0
1992 55.7 60.0 78.6 57.8 53.7 73.8 114.2 139.6 91.4 51.9 53.2 62.4
1993 53.9 61.5 82.2 75.0 70.1 97.1 119.0 365.6 189.4 55.3 46.9 46.5
1994 60.3 61.2 60.0 65.3 61.2 69.4 68.3 64.8 45.7 47.2 48.3 52.0
1995 60.6 57.1 64.5 99.9 83.9 92.1 102.6 84.5 54.8 43.2 46.6 53.8
1996 58.6 66.3 70.6 65.1 56.7 71.0 87.9 333.4 64.0 45.0 45.5 54.5
1997 63.4 71.3 65.0 58.4 55.4 64.5 125.5 230.8 73.9 50.1 53.5 54.6
1998 57.7 53.6 59.9 60.4 57.2 71.4 249.2 291.0 155.7 47.6 48.6 46.2
1999 54.2 60.1 61.7 57.0 47.6 58.0 205.1 249.7 83.7 45.2 41.7 43.2
2000 49.2 57.1 49.3 55.2 52.9 64.6 164.5 182.0 59.6 49.2 44.0 49.6
2001 53.3 54.1 61.0 63.1 61.2 71.0 65.5 72.7 53.0 53.8 58.0 60.3
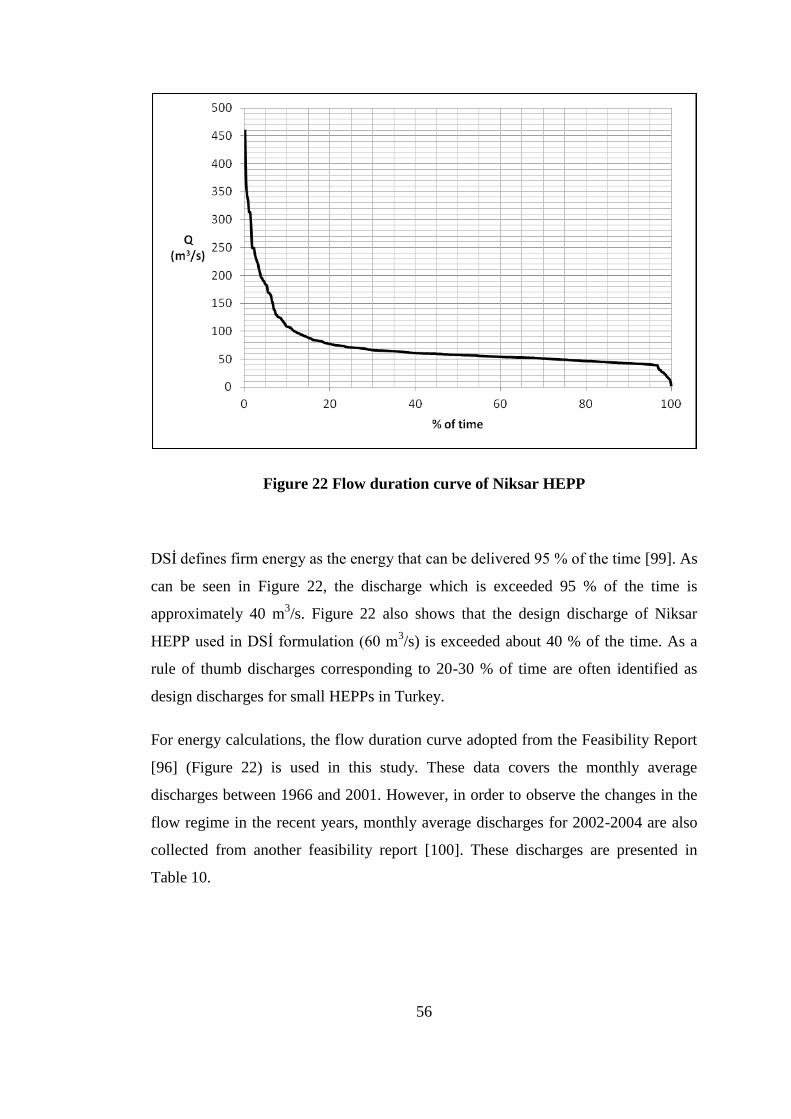
56
Figure 22 Flow duration curve of Niksar HEPP
DSİ defines firm energy as the energy that can be delivered 95 % of the time [99]. As
can be seen in Figure 22, the discharge which is exceeded 95 % of the time is
approximately 40 m3/s. Figure 22 also shows that the design discharge of Niksar
HEPP used in DSİ formulation (60 m3/s) is exceeded about 40 % of the time. As a
rule of thumb discharges corresponding to 20-30 % of time are often identified as
design discharges for small HEPPs in Turkey.
For energy calculations, the flow duration curve adopted from the Feasibility Report
[96] (Figure 22) is used in this study. These data covers the monthly average
discharges between 1966 and 2001. However, in order to observe the changes in the
flow regime in the recent years, monthly average discharges for 2002-2004 are also
collected from another feasibility report [100]. These discharges are presented in
Table 10.
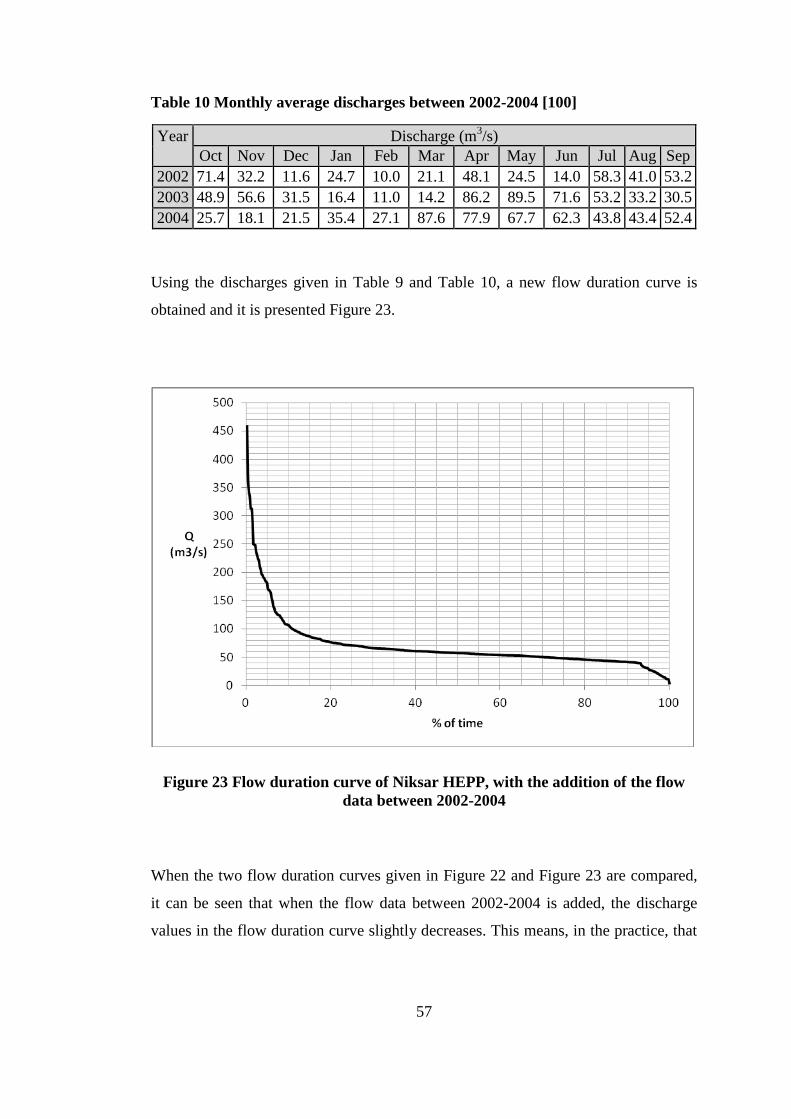
57
Table 10 Monthly average discharges between 2002-2004 [100]
Year Discharge (m3/s)
Oct Nov Dec Jan Feb Mar Apr May Jun Jul Aug Sep
2002 71.4 32.2 11.6 24.7 10.0 21.1 48.1 24.5 14.0 58.3 41.0 53.2
2003 48.9 56.6 31.5 16.4 11.0 14.2 86.2 89.5 71.6 53.2 33.2 30.5
2004 25.7 18.1 21.5 35.4 27.1 87.6 77.9 67.7 62.3 43.8 43.4 52.4
Using the discharges given in Table 9 and Table 10, a new flow duration curve is
obtained and it is presented Figure 23.
Figure 23 Flow duration curve of Niksar HEPP, with the addition of the flow
data between 2002-2004
When the two flow duration curves given in Figure 22 and Figure 23 are compared,
it can be seen that when the flow data between 2002-2004 is added, the discharge
values in the flow duration curve slightly decreases. This means, in the practice, that
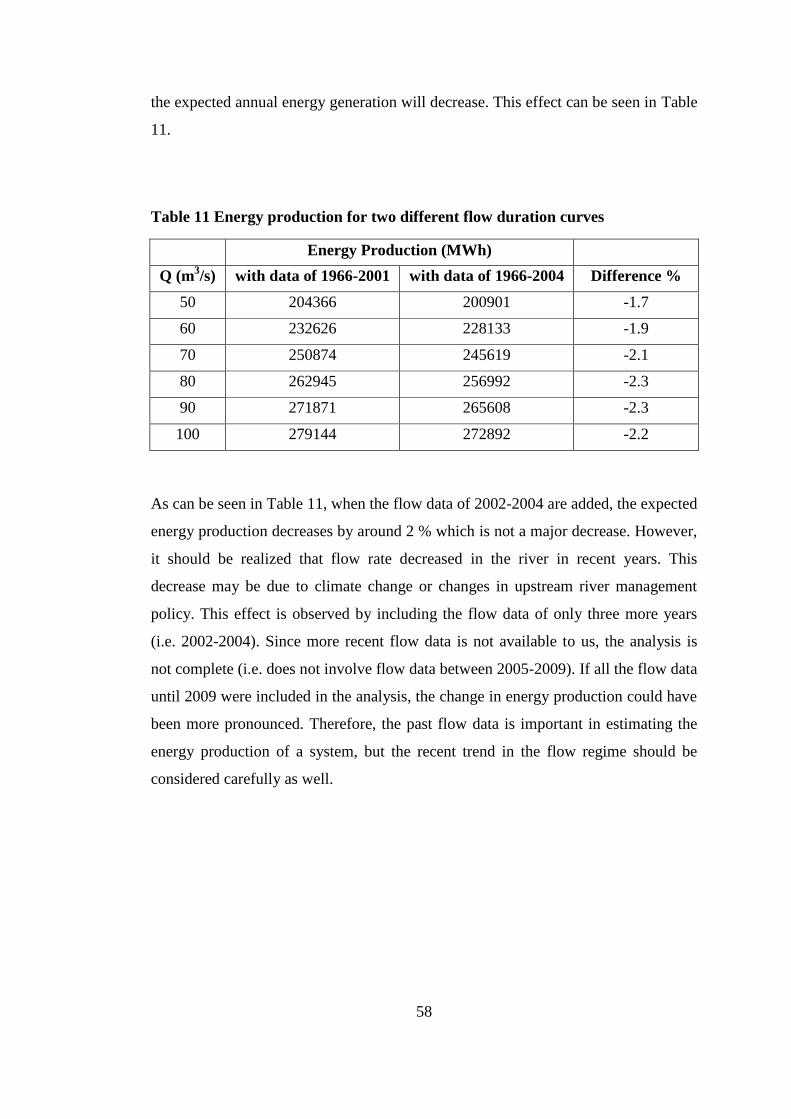
58
the expected annual energy generation will decrease. This effect can be seen in Table
11.
Table 11 Energy production for two different flow duration curves
Energy Production (MWh)
Q (m3/s) with data of 1966-2001 with data of 1966-2004 Difference %
50 204366 200901 -1.7
60 232626 228133 -1.9
70 250874 245619 -2.1
80 262945 256992 -2.3
90 271871 265608 -2.3
100 279144 272892 -2.2
As can be seen in Table 11, when the flow data of 2002-2004 are added, the expected
energy production decreases by around 2 % which is not a major decrease. However,
it should be realized that flow rate decreased in the river in recent years. This
decrease may be due to climate change or changes in upstream river management
policy. This effect is observed by including the flow data of only three more years
(i.e. 2002-2004). Since more recent flow data is not available to us, the analysis is
not complete (i.e. does not involve flow data between 2005-2009). If all the flow data
until 2009 were included in the analysis, the change in energy production could have
been more pronounced. Therefore, the past flow data is important in estimating the
energy production of a system, but the recent trend in the flow regime should be
considered carefully as well.
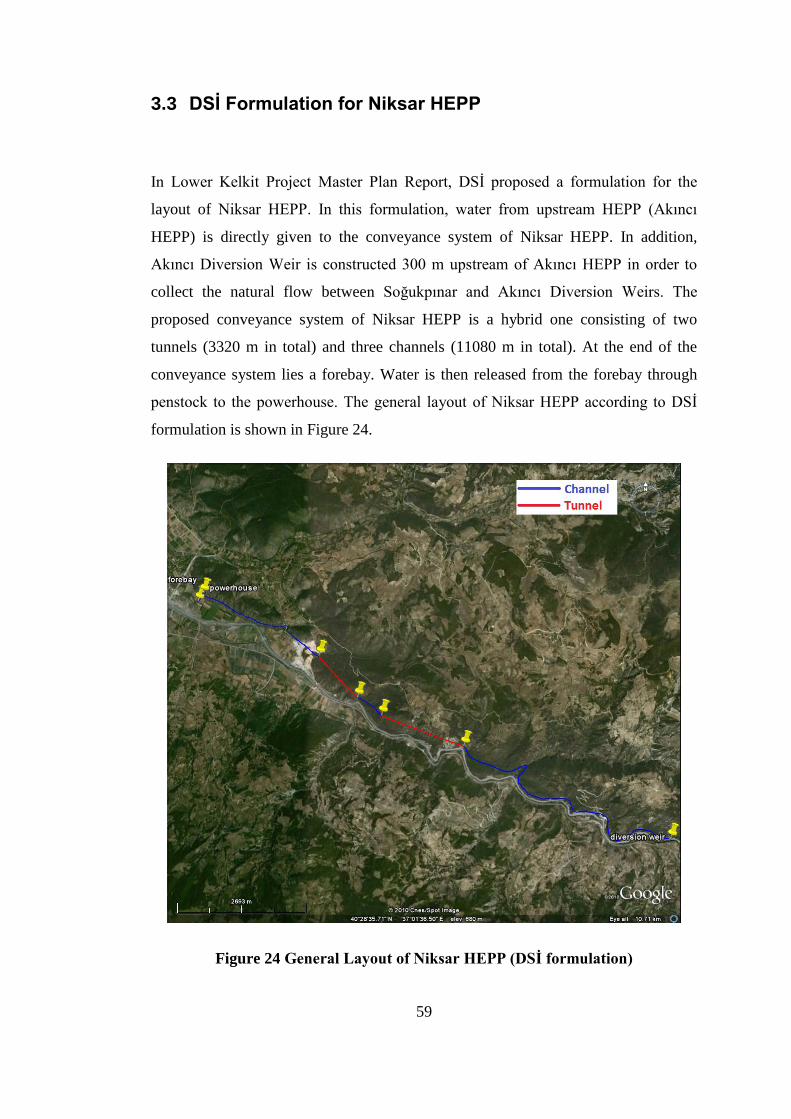
59
3.3 DSİ Formulation for Niksar HEPP
In Lower Kelkit Project Master Plan Report, DSİ proposed a formulation for the
layout of Niksar HEPP. In this formulation, water from upstream HEPP (Akıncı
HEPP) is directly given to the conveyance system of Niksar HEPP. In addition,
Akıncı Diversion Weir is constructed 300 m upstream of Akıncı HEPP in order to
collect the natural flow between Soğukpınar and Akıncı Diversion Weirs. The
proposed conveyance system of Niksar HEPP is a hybrid one consisting of two
tunnels (3320 m in total) and three channels (11080 m in total). At the end of the
conveyance system lies a forebay. Water is then released from the forebay through
penstock to the powerhouse. The general layout of Niksar HEPP according to DSİ
formulation is shown in Figure 24.
Figure 24 General Layout of Niksar HEPP (DSİ formulation)
60
The available gross head for Niksar HEPP is 64 m and the selected discharge is 60
m3/s. DSİ converts the flow duration curve into the power duration curve and
calculates associated net benefits for various power levels. Then these results are
used in selecting the design discharge. For this formulation, two Francis turbines
with a total capacity of 29.9 MW are found suitable. This power system can generate
234.32 GWh of electricity each year.
3.4 Possible Alternatives to DSİ formulation of Niksar HEPP
This study intends to investigate if there are other ways to formulate the Niksar
HEPP project such that more energy can be generated with less cost.
Various alterations to DSİ formulation can be implemented. These alterations include
changing the following items:
1. Locations of the main components such as diversion weir, forebay and power
house,
2. The course of water conveyance system,
3. The design discharge.
Implementation of these alterations will result in various alternatives to DSİ
formulation. Each of these alterations is investigated in detail in the following
paragraphs.
Locations of the main components
Locations of the major project components are very important for energy production
since the gross head is determined from these locations. In order to make changes on
the locations of main components of hydropower plants, the topography of the area
should be carefully investigated. For preliminary assessment of locations, 1:25000
scale topographic maps are sufficient [70]. However, supplementary field
investigations are always useful for a sound conception of the project. The
61
topography of the area may sometimes make it impossible, or infeasible to develop a
hydropower project. If it is too flat, for example, available head will be small and this
may make the project infeasible.
Another consideration that should be taken into account when deciding the locations
of project components is the presence of upstream or downstream power plants. If an
upstream hydropower plant exists, the maximum elevation at which water can be
taken will be the tailwater elevation of the upstream plant.
For Niksar HEPP, topography of the area and presence of upstream power plant
limits the selection of locations of the powerhouse and the diversion weir. In DSİ
formulation, the power house is located at a point where the mountainous terrain
ends and Niksar Plateau begins. If the powerhouse is moved to a downstream
location, increase in the gross head will be negligible because of the level ground of
the plateau. If it is moved to an upstream location, decrease in the gross head will be
significant since the upstream terrain is mountainous. Therefore, the location of the
power house remained unchanged in the alternative projects suggested in this study.
In DSİ formulation, tailwater of the upstream Akıncı HEPP is taken to the
conveyance system of Niksar HEPP just after the Akıncı HEPP. If the diversion weir
and water intake structure of Niksar HEPP is located at a higher elevation, tailwater
of Akıncı HEPP will be missed. On the other hand, if these structures are constructed
at a downstream part, the available gross head will decrease. Therefore, like power
house, diversion weir and water intake are kept in their original locations suggested
by DSİ.
Since the option to change locations of powerhouse and diversion weir is eliminated,
the alternative projects are generated by changing the course of the water conveyance
system and the design discharge.
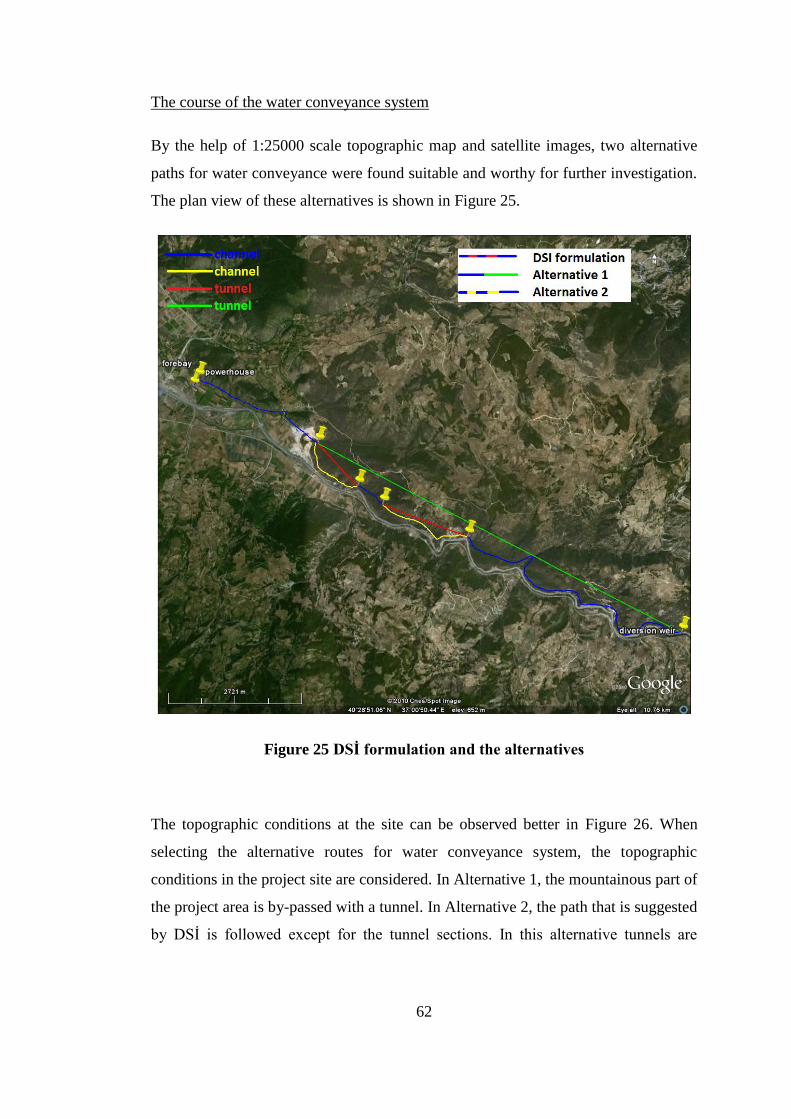
62
The course of the water conveyance system
By the help of 1:25000 scale topographic map and satellite images, two alternative
paths for water conveyance were found suitable and worthy for further investigation.
The plan view of these alternatives is shown in Figure 25.
Figure 25 DSİ formulation and the alternatives
The topographic conditions at the site can be observed better in Figure 26. When
selecting the alternative routes for water conveyance system, the topographic
conditions in the project site are considered. In Alternative 1, the mountainous part of
the project area is by-passed with a tunnel. In Alternative 2, the path that is suggested
by DSİ is followed except for the tunnel sections. In this alternative tunnels are
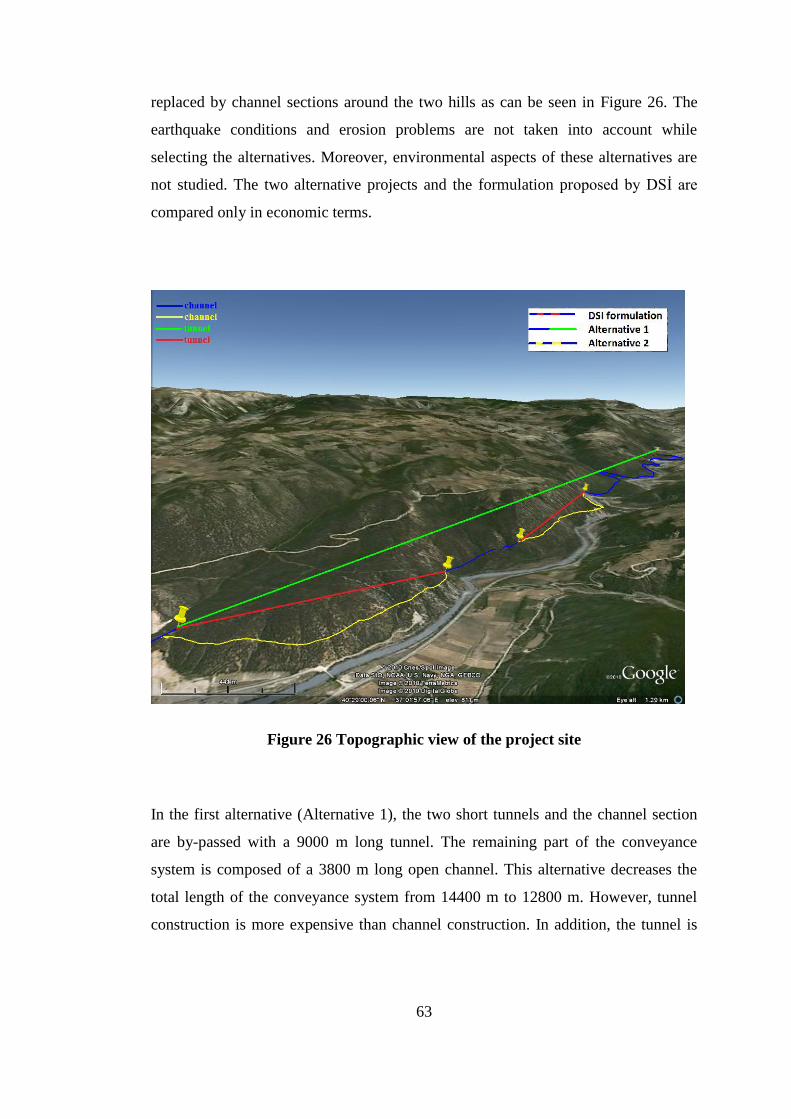
63
replaced by channel sections around the two hills as can be seen in Figure 26. The
earthquake conditions and erosion problems are not taken into account while
selecting the alternatives. Moreover, environmental aspects of these alternatives are
not studied. The two alternative projects and the formulation proposed by DSİ are
compared only in economic terms.
Figure 26 Topographic view of the project site
In the first alternative (Alternative 1), the two short tunnels and the channel section
are by-passed with a 9000 m long tunnel. The remaining part of the conveyance
system is composed of a 3800 m long open channel. This alternative decreases the
total length of the conveyance system from 14400 m to 12800 m. However, tunnel
construction is more expensive than channel construction. In addition, the tunnel is

64
on the North Anatolian Fault Zone. Therefore, it should be earthquake-resistant,
which makes it more expensive.
In the second alternative (Alternative 2), the entire conveyance system is composed
of open channels. This alternative increases the total length of the conveyance
system. However, since tunnels are avoided, the total cost may still be feasible.
The design discharge
Design discharge impacts selection of the installed capacity as well. Thus, it is one of
the key parameters used in the planning of hydropower projects. Selected discharge
dictates the amount of electricity that can be generated in a hydropower plant. If a
high design discharge is selected, the amount of electricity that can be generated in a
year will be more. However, as the design discharge increases, dimensions of the
project components such as hydro turbines or water conveyance systems also
increase, resulting in increased costs in addition to higher risk of not having the
required discharge in the river. Therefore, a cost-benefit analysis has to be carried
out. The discharge giving the maximum net benefit should be selected as the design
discharge of the project.
DSİ formulation and two alternatives (i.e. Alternative 1 and Alternative 2) created by
changing the course of the water conveyance system are evaluated for various design
discharges and electricity prices (RETScreen uses the term “electricity export rate”
for “electricity price”. These terms will be used interchangeably from here on) in this
study. A trial-and-error methodology is used to identify the optimum design
discharge for each of these alternatives.
Frequently changing electricity prices in Turkey is another parameter that needs to be
considered during the planning phases of HEPPs. Thus while selecting the optimum
discharge of various alternatives for Niksar HEPP, impact of electricity prices are
investigated as well. The procedure for determining optimum design discharge for
various possible electricity price alternatives are explained in detail in Section 4.1.5.
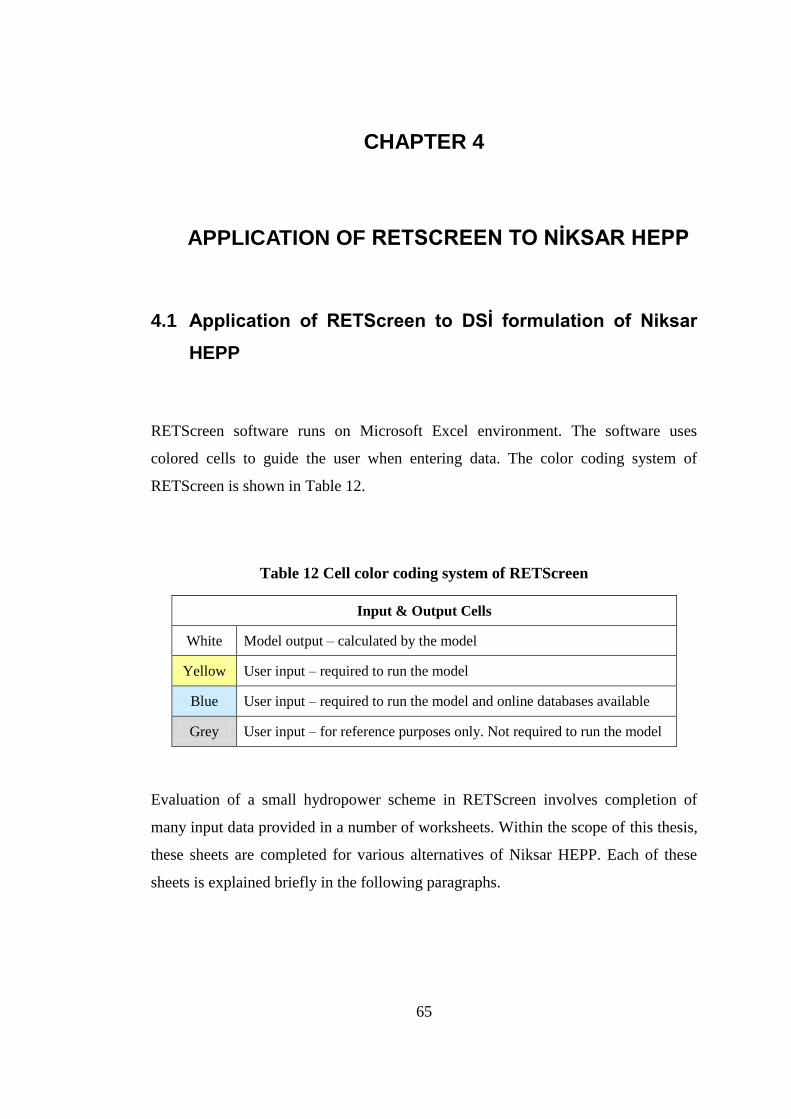
65
CHAPTER 4
4. APPLICATION OF RETSCREEN TO NİKSAR HEPP
4.1 Application of RETScreen to DSİ formulation of Niksar
HEPP
RETScreen software runs on Microsoft Excel environment. The software uses
colored cells to guide the user when entering data. The color coding system of
RETScreen is shown in Table 12.
Table 12 Cell color coding system of RETScreen
Input & Output Cells
White Model output – calculated by the model
Yellow User input – required to run the model
Blue User input – required to run the model and online databases available
Grey User input – for reference purposes only. Not required to run the model
Evaluation of a small hydropower scheme in RETScreen involves completion of
many input data provided in a number of worksheets. Within the scope of this thesis,
these sheets are completed for various alternatives of Niksar HEPP. Each of these
sheets is explained briefly in the following paragraphs.
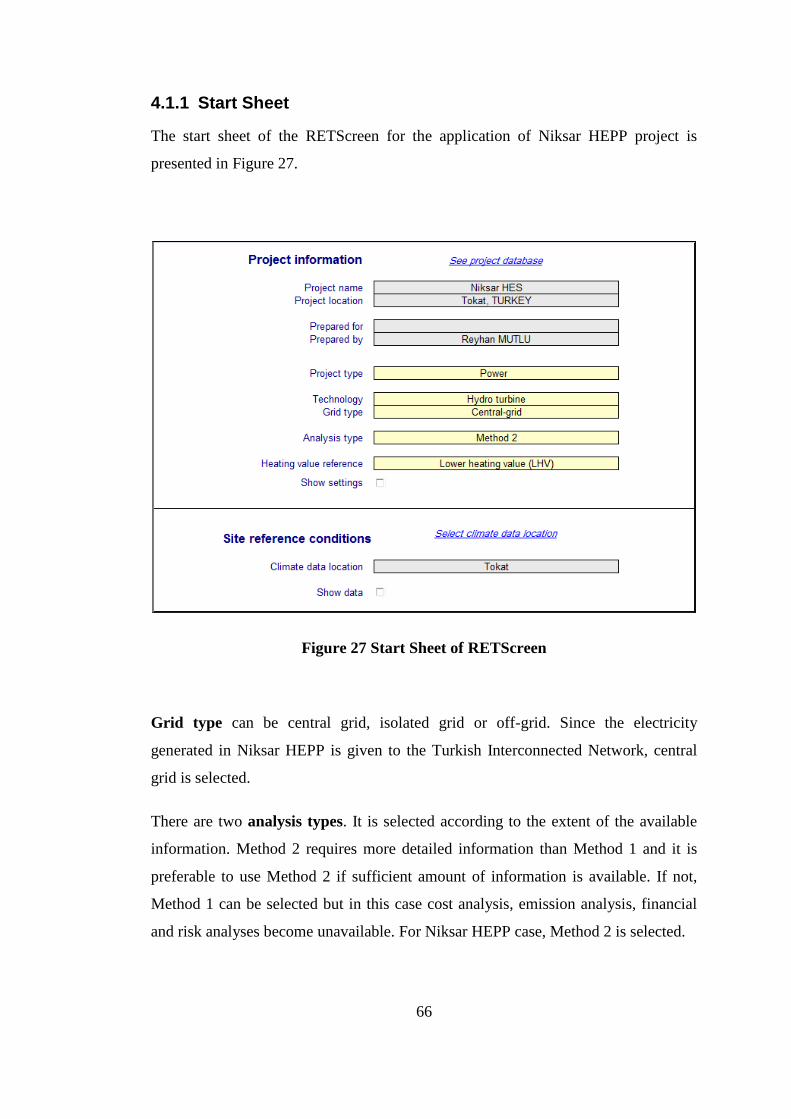
66
4.1.1 Start Sheet
The start sheet of the RETScreen for the application of Niksar HEPP project is
presented in Figure 27.
Figure 27 Start Sheet of RETScreen
Grid type can be central grid, isolated grid or off-grid. Since the electricity
generated in Niksar HEPP is given to the Turkish Interconnected Network, central
grid is selected.
There are two analysis types. It is selected according to the extent of the available
information. Method 2 requires more detailed information than Method 1 and it is
preferable to use Method 2 if sufficient amount of information is available. If not,
Method 1 can be selected but in this case cost analysis, emission analysis, financial
and risk analyses become unavailable. For Niksar HEPP case, Method 2 is selected.

67
Heating value is a measure of energy released when fuel is completely burned. For
hydropower projects, this value is important only if emission analysis will be carried
out. In this study, emission analysis is not carried out.
In the site reference conditions section of the start sheet, the user enters the climatic
data (such as air temperature, relative humidity, wind speed, etc.) of the project area
or copy them from the RETScreen‟s climate database. These data are displayed when
“Show data” is ticked. The climate data are essential for solar or wind power
projects, but not necessary for hydropower projects. Thus, in this study climate data
are not entered.
4.1.2 Energy Model Sheet
The first part of the energy model sheet of RETScreen for the application of Niksar
HEPP project is presented in Figure 28.
Figure 28 Niksar HEPP DSİ formulation, Energy Model
68
For the analysis type in the energy model sheet, if Method 1 is selected, a simplified
analysis based on hydro turbine power capacity and capacity factor is performed. If
Method 2 is selected, a more detailed analysis can be performed with the addition of
hydrology and equipment parameters. For Niksar HEPP project, Method 2 is
selected.
The hydrology method depends on whether the flow duration curve for the subject
river is available. If it is available, user-defined should be selected. If it is not,
specific run-off can be selected and this will result in the hydrology data to be taken
from RETScreen hydrology database. However, only Canada is covered in this
database. Since the flow duration curve was developed for Niksar HEPP, the user-
defined option is selected.
During high flows, the tailwater level may rise resulting in the decrease in gross head
and thus reducing the energy production. However, this is significant for low-head
sites [87]. Since no information is available for Niksar HEPP, maximum tailwater
effect is entered as zero.
Residual flow is the amount of water that should be released to the river for
environmental reasons. This can be entered in the allocated cell. However, if the flow
duration curve is prepared after subtracting the residual flow, this cell should be left
zero. In Niksar HEPP‟s flow duration curve, residual flow has already been
subtracted, thus residual flow cell is left zero. Percent time firm flow available is
taken as 95 % by DSİ [99]. RETScreen suggests a value between 90 % and 100 %
[87]. In this study, 95 % is used.
Turbine efficiency can be entered manually if the turbine efficiency curve is
available. However, RETScreen has integrated efficiency curves for selected turbine
types. Also with the efficiency adjustment, these efficiency curves can be adjusted
and can be used in the sensitivity analysis. For Niksar HEPP‟s Francis turbines,
standard efficiency curves of RETScreen are utilized without adjustment. The
combined turbine efficiency curve generated by RETScreen is shown in Figure 29.
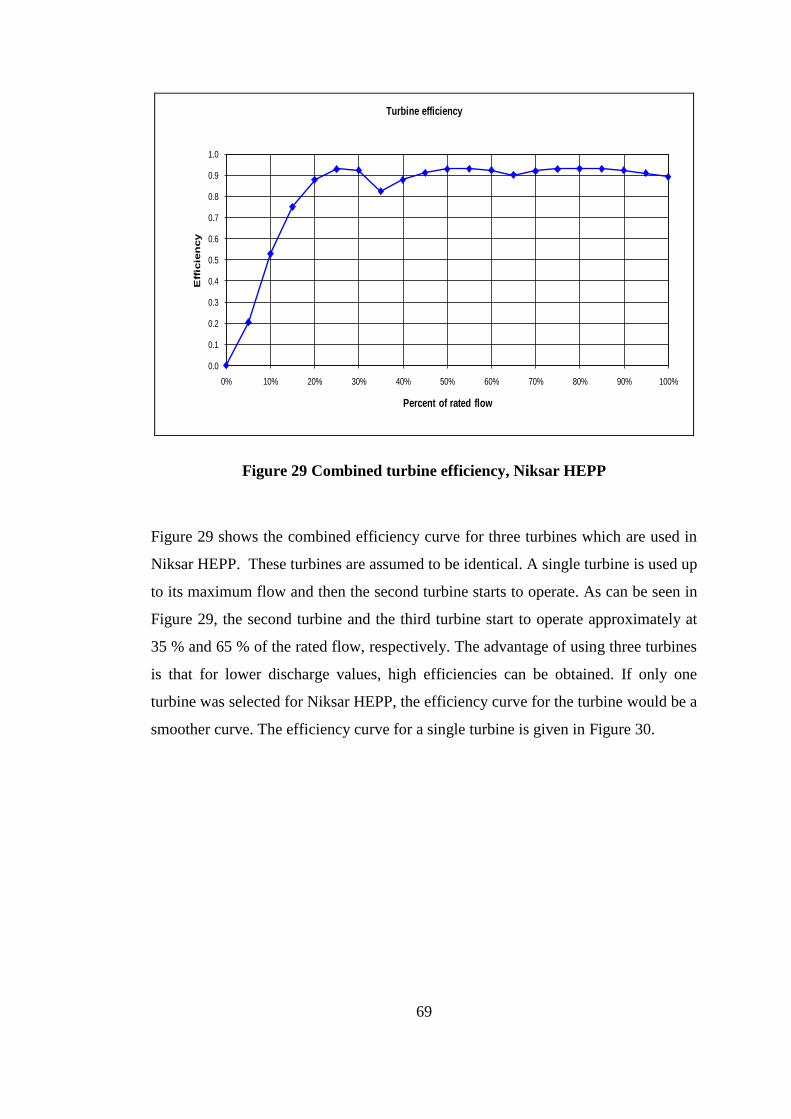
69
0.0
0.1
0.2
0.3
0.4
0.5
0.6
0.7
0.8
0.9
1.0
0% 10% 20% 30% 40% 50% 60% 70% 80% 90% 100%
Eff
icie
ncy
Percent of rated flow
Turbine efficiency
Figure 29 Combined turbine efficiency, Niksar HEPP
Figure 29 shows the combined efficiency curve for three turbines which are used in
Niksar HEPP. These turbines are assumed to be identical. A single turbine is used up
to its maximum flow and then the second turbine starts to operate. As can be seen in
Figure 29, the second turbine and the third turbine start to operate approximately at
35 % and 65 % of the rated flow, respectively. The advantage of using three turbines
is that for lower discharge values, high efficiencies can be obtained. If only one
turbine was selected for Niksar HEPP, the efficiency curve for the turbine would be a
smoother curve. The efficiency curve for a single turbine is given in Figure 30.
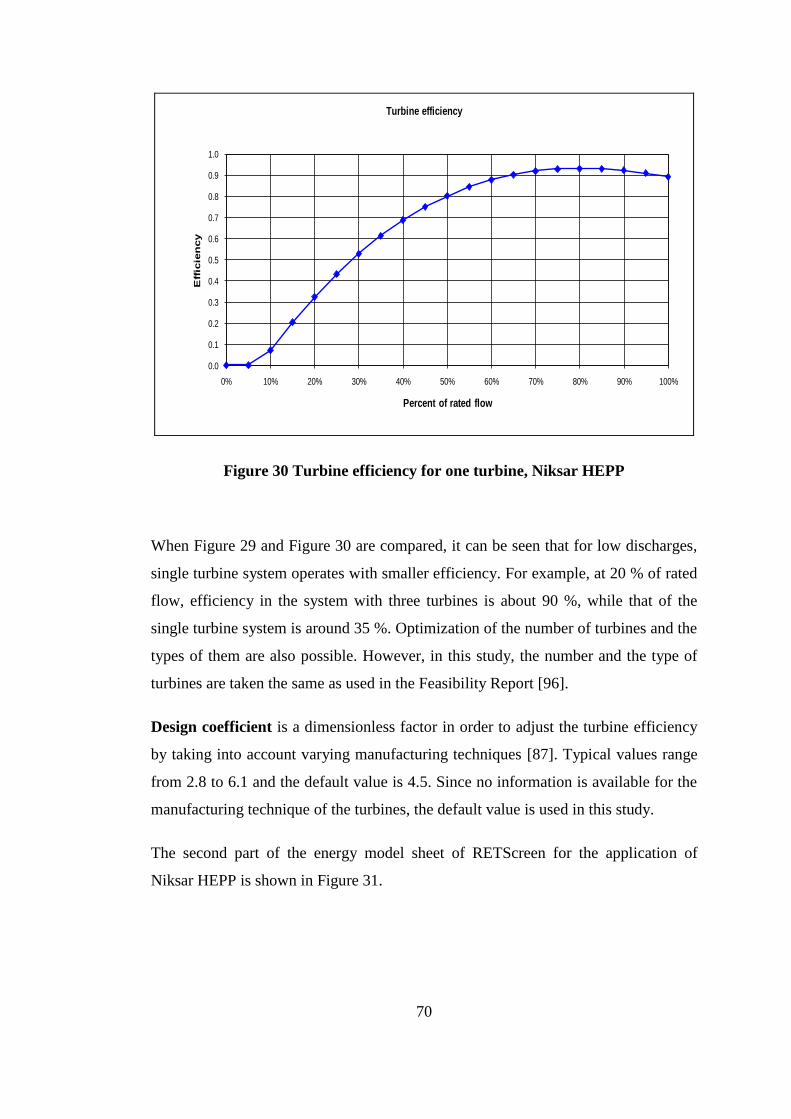
70
0.0
0.1
0.2
0.3
0.4
0.5
0.6
0.7
0.8
0.9
1.0
0% 10% 20% 30% 40% 50% 60% 70% 80% 90% 100%
Eff
icie
ncy
Percent of rated flow
Turbine efficiency
Figure 30 Turbine efficiency for one turbine, Niksar HEPP
When Figure 29 and Figure 30 are compared, it can be seen that for low discharges,
single turbine system operates with smaller efficiency. For example, at 20 % of rated
flow, efficiency in the system with three turbines is about 90 %, while that of the
single turbine system is around 35 %. Optimization of the number of turbines and the
types of them are also possible. However, in this study, the number and the type of
turbines are taken the same as used in the Feasibility Report [96].
Design coefficient is a dimensionless factor in order to adjust the turbine efficiency
by taking into account varying manufacturing techniques [87]. Typical values range
from 2.8 to 6.1 and the default value is 4.5. Since no information is available for the
manufacturing technique of the turbines, the default value is used in this study.
The second part of the energy model sheet of RETScreen for the application of
Niksar HEPP is shown in Figure 31.
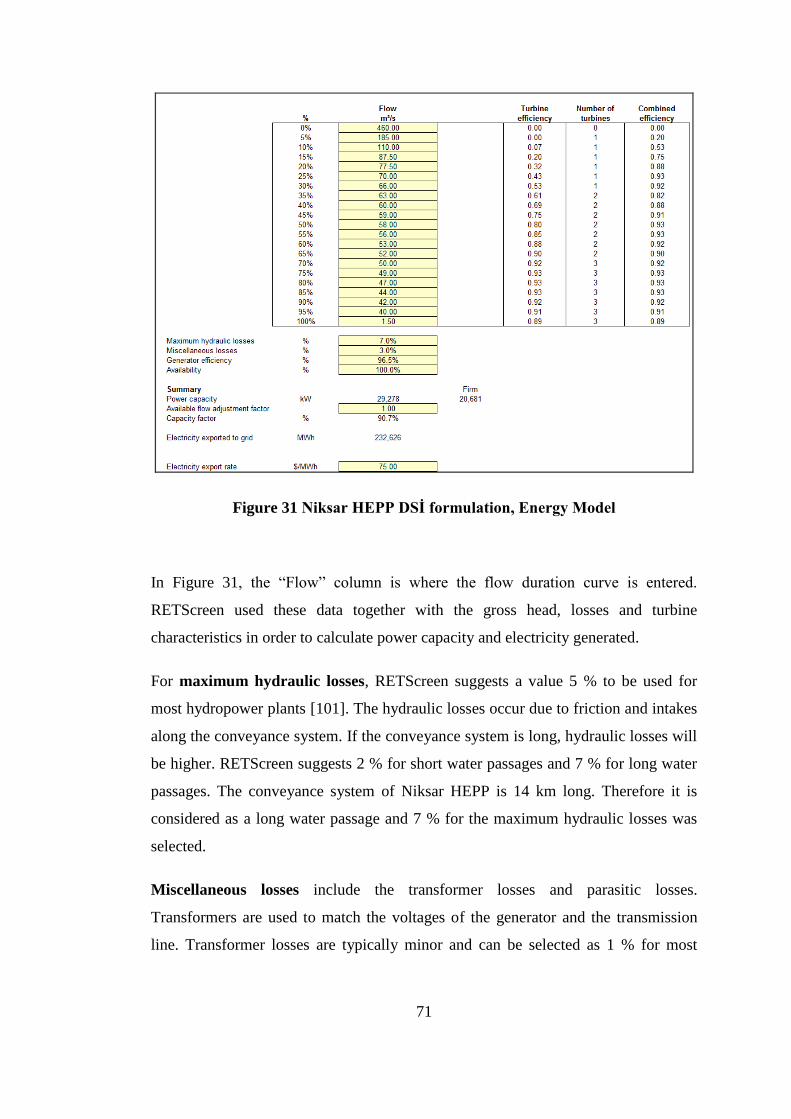
71
Figure 31 Niksar HEPP DSİ formulation, Energy Model
In Figure 31, the “Flow” column is where the flow duration curve is entered.
RETScreen used these data together with the gross head, losses and turbine
characteristics in order to calculate power capacity and electricity generated.
For maximum hydraulic losses, RETScreen suggests a value 5 % to be used for
most hydropower plants [101]. The hydraulic losses occur due to friction and intakes
along the conveyance system. If the conveyance system is long, hydraulic losses will
be higher. RETScreen suggests 2 % for short water passages and 7 % for long water
passages. The conveyance system of Niksar HEPP is 14 km long. Therefore it is
considered as a long water passage and 7 % for the maximum hydraulic losses was
selected.
Miscellaneous losses include the transformer losses and parasitic losses.
Transformers are used to match the voltages of the generator and the transmission
line. Transformer losses are typically minor and can be selected as 1 % for most
72
hydropower projects [101]. Parasitic losses account for the portion of electricity
generated that is used for auxiliary equipment, lighting, heating, etc. A value of 2 %
is appropriate for most hydropower plants. Therefore, miscellaneous losses are taken
as 3 % in total for Niksar HEPP.
Availability of the power plant can also be entered by the user. The power plants can
sometimes be out of order for several reasons such as maintenance or turbine failure.
RETScreen suggests 96 % availability for a typical plant [101]. However, if there are
two or more turbines in a power plant, maintenances can be scheduled to low flow
seasons where the flows are not enough to run all of the turbines. The idle turbines
then can be taken to maintenance and the energy production continues without
interruption. Since there are three turbines in Niksar HEPP, availability was taken as
100 %.
Available flow adjustment factor is intended to allow the user to adjust the capacity
factor and electricity exported to the grid. This factor is primarily used for sensitivity
analysis in order to observe the effects of capacity factor and electricity generated on
the financial summary. This factor was entered as unity in this study, meaning that
the flow values were not changed. If 1.1 was entered, for example, each value in the
flow duration curve would increase by 10 %.
Another input to be entered by the user in the energy model sheet is the electricity
export rate, which is used by the software to calculate the income from electricity
sale. In this study, economical feasibility of the project is investigated for three
different selling prices which are explained in Section 4.1.5. Upon entering the
values as in Figure 31, the software calculates the installed capacity and electricity
generated. The user can also plot the flow duration and power curves as can be seen
in Figure 32.
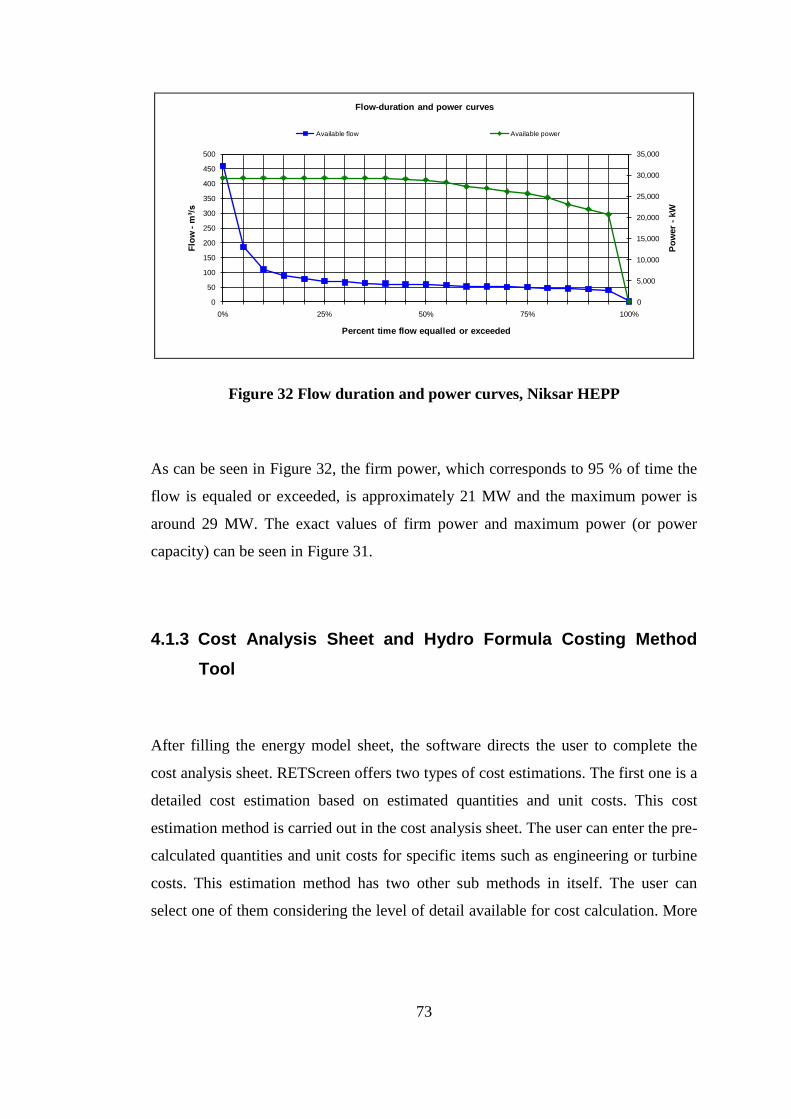
73
0
5,000
10,000
15,000
20,000
25,000
30,000
35,000
0
50
100
150
200
250
300
350
400
450
500
0% 25% 50% 75% 100%
Po
wer
-kW
Flo
w -
m³/
s
Percent time flow equalled or exceeded
Flow-duration and power curves
Available flow Available power
Figure 32 Flow duration and power curves, Niksar HEPP
As can be seen in Figure 32, the firm power, which corresponds to 95 % of time the
flow is equaled or exceeded, is approximately 21 MW and the maximum power is
around 29 MW. The exact values of firm power and maximum power (or power
capacity) can be seen in Figure 31.
4.1.3 Cost Analysis Sheet and Hydro Formula Costing Method
Tool
After filling the energy model sheet, the software directs the user to complete the
cost analysis sheet. RETScreen offers two types of cost estimations. The first one is a
detailed cost estimation based on estimated quantities and unit costs. This cost
estimation method is carried out in the cost analysis sheet. The user can enter the pre-
calculated quantities and unit costs for specific items such as engineering or turbine
costs. This estimation method has two other sub methods in itself. The user can
select one of them considering the level of detail available for cost calculation. More

74
detailed cost estimations can be made with the second sub method. The sub method
to be used is selected at the beginning of the cost analysis sheet.
The second cost estimation method offered by RETScreen is “hydro formula costing
method”. This method is available in the “tools sheet”. The hydro formula costing
method tool estimates the project costs using the empirical formulae derived from the
costs of numerous completed small hydro projects. Since costs associated with
various construction items, engineering and development works are not available for
Niksar HEPP project, hydro formula costing method is used to estimate total initial
costs. However, RETScreen cannot automatically use this calculated total initial
costs in financial analysis and requires the user to externally input this value into the
cost analysis worksheet. Thus, the total initial costs calculated by hydro formula
costing method should be entered into one of the cost item listed in the cost analysis
sheet. For example, the total initial cost of the Niksar HEPP project calculated by the
costing formula method tool is entered as “Road construction” cost into the cost
analysis sheet as can be seen in Figure 33.
The total initial cost is found to be $ 110997000. This value is calculated by the
hydro formula costing method tool. The user can use referencing to the cell rather
than entering the total cost by hand so that it will be automatically updated when the
costs in the formula costing tool change.
There are also annual costs. Annual costs include operation and maintenance costs,
land lease and resource rental, property taxes, insurance premium, parts and labor,
GHG monitoring and verification, community benefits, and general and
administrative expenses [101]. Küçükbeycan [10] suggests 0.2 % of the total
investment cost can be allocated as operation and maintenance costs. Considering the
other sources of annual costs such as labor cost or insurance premium, 0.4 % of the
total investment cost is used for total annual costs in this study. It should be noted
that interest and depreciation costs are not accepted as annual costs by RETScreen.
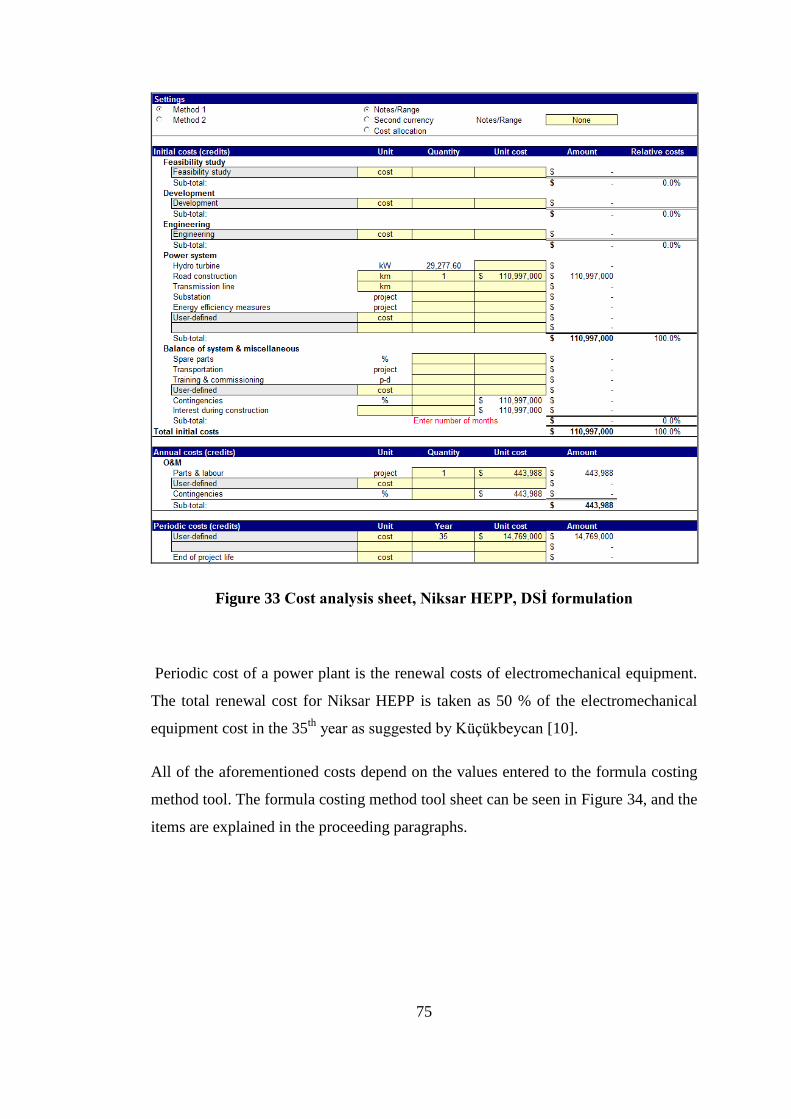
75
Figure 33 Cost analysis sheet, Niksar HEPP, DSİ formulation
Periodic cost of a power plant is the renewal costs of electromechanical equipment.
The total renewal cost for Niksar HEPP is taken as 50 % of the electromechanical
equipment cost in the 35th
year as suggested by Küçükbeycan [10].
All of the aforementioned costs depend on the values entered to the formula costing
method tool. The formula costing method tool sheet can be seen in Figure 34, and the
items are explained in the proceeding paragraphs.
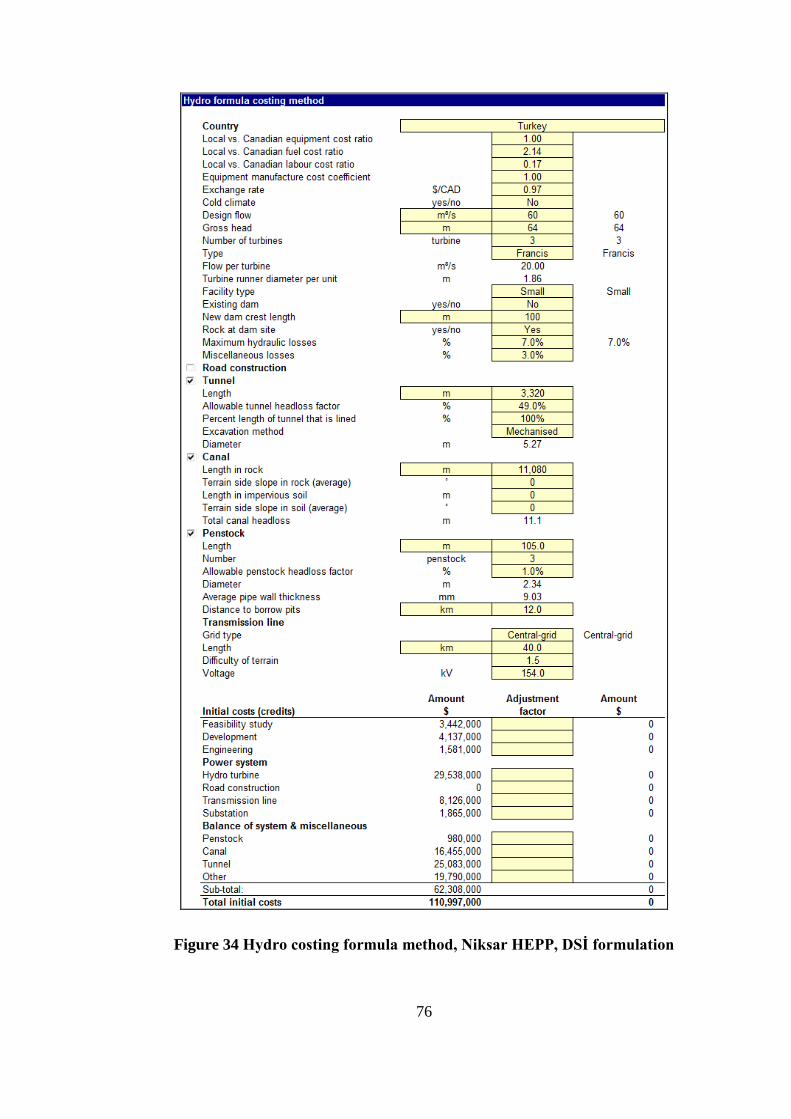
76
Figure 34 Hydro costing formula method, Niksar HEPP, DSİ formulation
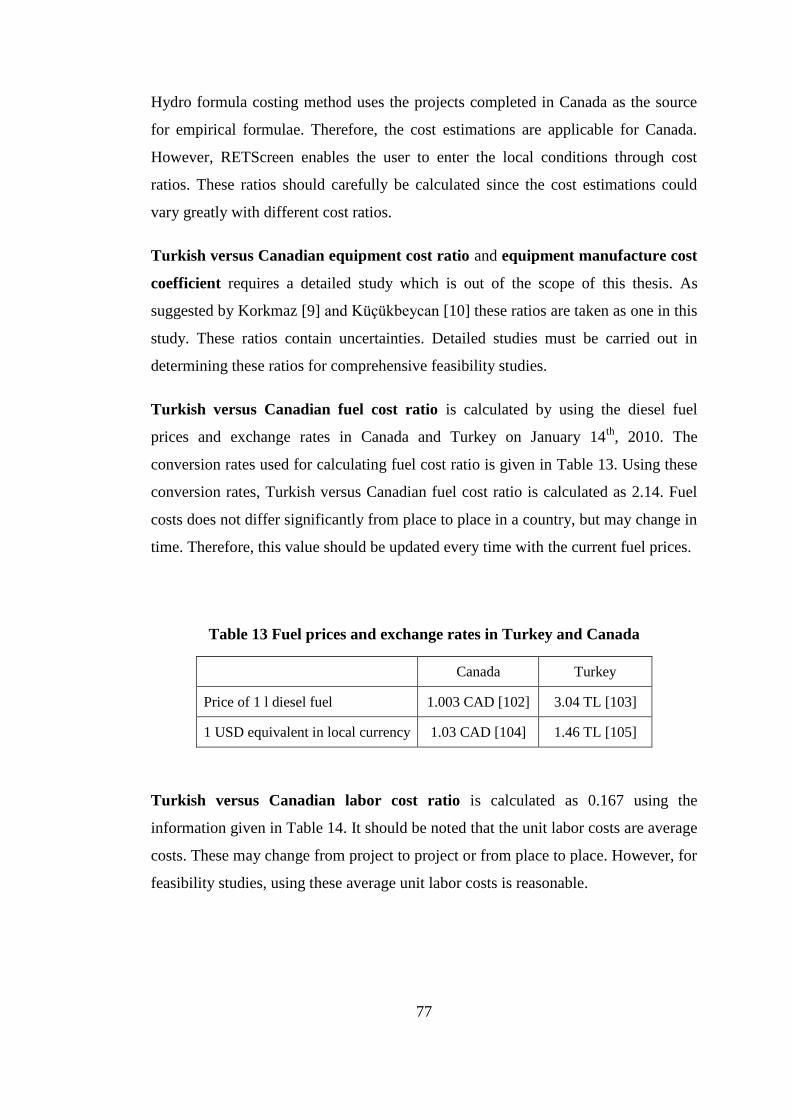
77
Hydro formula costing method uses the projects completed in Canada as the source
for empirical formulae. Therefore, the cost estimations are applicable for Canada.
However, RETScreen enables the user to enter the local conditions through cost
ratios. These ratios should carefully be calculated since the cost estimations could
vary greatly with different cost ratios.
Turkish versus Canadian equipment cost ratio and equipment manufacture cost
coefficient requires a detailed study which is out of the scope of this thesis. As
suggested by Korkmaz [9] and Küçükbeycan [10] these ratios are taken as one in this
study. These ratios contain uncertainties. Detailed studies must be carried out in
determining these ratios for comprehensive feasibility studies.
Turkish versus Canadian fuel cost ratio is calculated by using the diesel fuel
prices and exchange rates in Canada and Turkey on January 14th
, 2010. The
conversion rates used for calculating fuel cost ratio is given in Table 13. Using these
conversion rates, Turkish versus Canadian fuel cost ratio is calculated as 2.14. Fuel
costs does not differ significantly from place to place in a country, but may change in
time. Therefore, this value should be updated every time with the current fuel prices.
Table 13 Fuel prices and exchange rates in Turkey and Canada
Canada Turkey
Price of 1 l diesel fuel 1.003 CAD [102] 3.04 TL [103]
1 USD equivalent in local currency 1.03 CAD [104] 1.46 TL [105]
Turkish versus Canadian labor cost ratio is calculated as 0.167 using the
information given in Table 14. It should be noted that the unit labor costs are average
costs. These may change from project to project or from place to place. However, for
feasibility studies, using these average unit labor costs is reasonable.
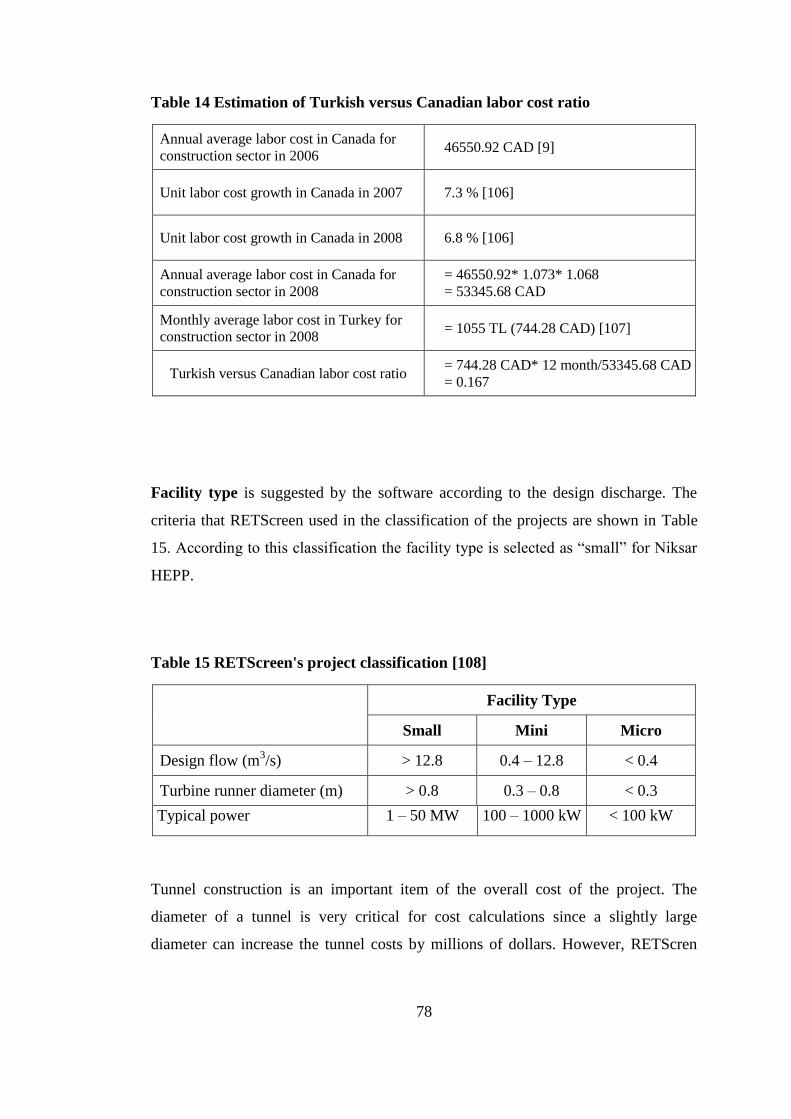
78
Table 14 Estimation of Turkish versus Canadian labor cost ratio
Annual average labor cost in Canada for
construction sector in 2006 46550.92 CAD [9]
Unit labor cost growth in Canada in 2007 7.3 % [106]
Unit labor cost growth in Canada in 2008 6.8 % [106]
Annual average labor cost in Canada for
construction sector in 2008 = 46550.92* 1.073* 1.068 = 53345.68 CAD
Monthly average labor cost in Turkey for
construction sector in 2008 = 1055 TL (744.28 CAD) [107]
Turkish versus Canadian labor cost ratio = 744.28 CAD* 12 month/53345.68 CAD = 0.167
Facility type is suggested by the software according to the design discharge. The
criteria that RETScreen used in the classification of the projects are shown in Table
15. According to this classification the facility type is selected as “small” for Niksar
HEPP.
Table 15 RETScreen's project classification [108]
Facility Type
Small Mini Micro
Design flow (m3/s) > 12.8 0.4 – 12.8 < 0.4
Turbine runner diameter (m) > 0.8 0.3 – 0.8 < 0.3
Typical power 1 – 50 MW 100 – 1000 kW < 100 kW
Tunnel construction is an important item of the overall cost of the project. The
diameter of a tunnel is very critical for cost calculations since a slightly large
diameter can increase the tunnel costs by millions of dollars. However, RETScren
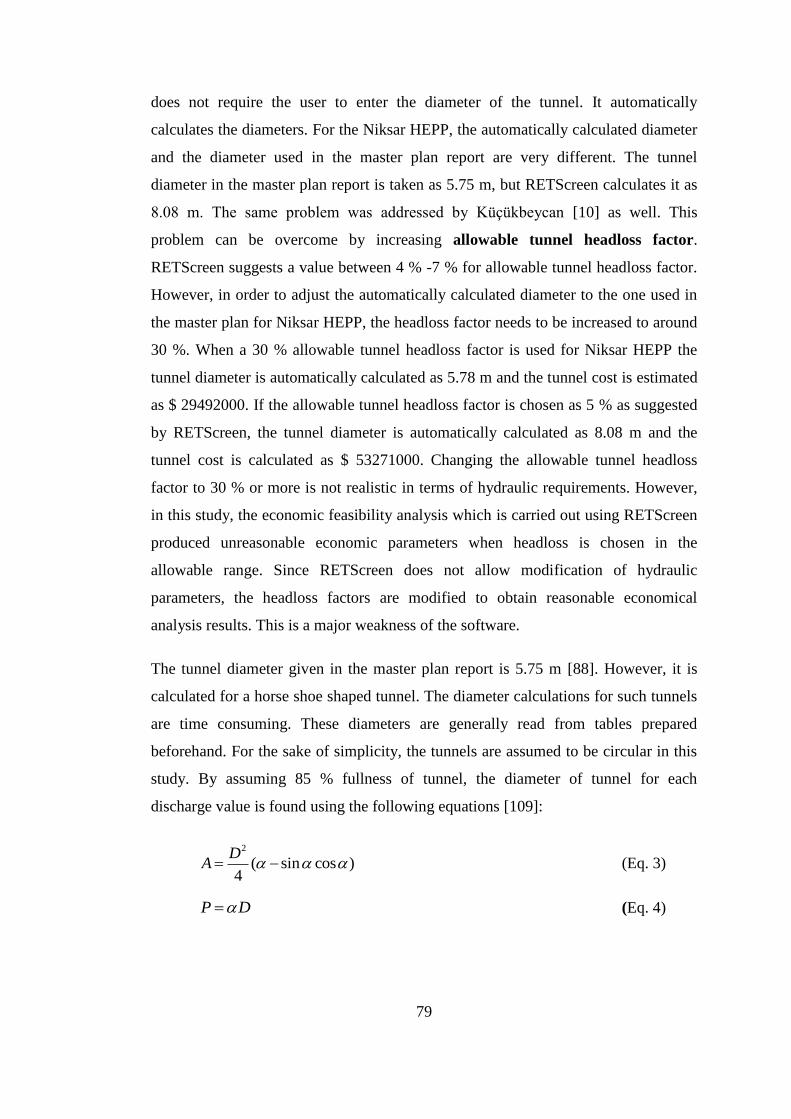
79
does not require the user to enter the diameter of the tunnel. It automatically
calculates the diameters. For the Niksar HEPP, the automatically calculated diameter
and the diameter used in the master plan report are very different. The tunnel
diameter in the master plan report is taken as 5.75 m, but RETScreen calculates it as
8.08 m. The same problem was addressed by Küçükbeycan [10] as well. This
problem can be overcome by increasing allowable tunnel headloss factor.
RETScreen suggests a value between 4 % -7 % for allowable tunnel headloss factor.
However, in order to adjust the automatically calculated diameter to the one used in
the master plan for Niksar HEPP, the headloss factor needs to be increased to around
30 %. When a 30 % allowable tunnel headloss factor is used for Niksar HEPP the
tunnel diameter is automatically calculated as 5.78 m and the tunnel cost is estimated
as $ 29492000. If the allowable tunnel headloss factor is chosen as 5 % as suggested
by RETScreen, the tunnel diameter is automatically calculated as 8.08 m and the
tunnel cost is calculated as $ 53271000. Changing the allowable tunnel headloss
factor to 30 % or more is not realistic in terms of hydraulic requirements. However,
in this study, the economic feasibility analysis which is carried out using RETScreen
produced unreasonable economic parameters when headloss is chosen in the
allowable range. Since RETScreen does not allow modification of hydraulic
parameters, the headloss factors are modified to obtain reasonable economical
analysis results. This is a major weakness of the software.
The tunnel diameter given in the master plan report is 5.75 m [88]. However, it is
calculated for a horse shoe shaped tunnel. The diameter calculations for such tunnels
are time consuming. These diameters are generally read from tables prepared
beforehand. For the sake of simplicity, the tunnels are assumed to be circular in this
study. By assuming 85 % fullness of tunnel, the diameter of tunnel for each
discharge value is found using the following equations [109]:
2
( sin cos )4
DA (Eq. 3)
P D (Eq. 4)
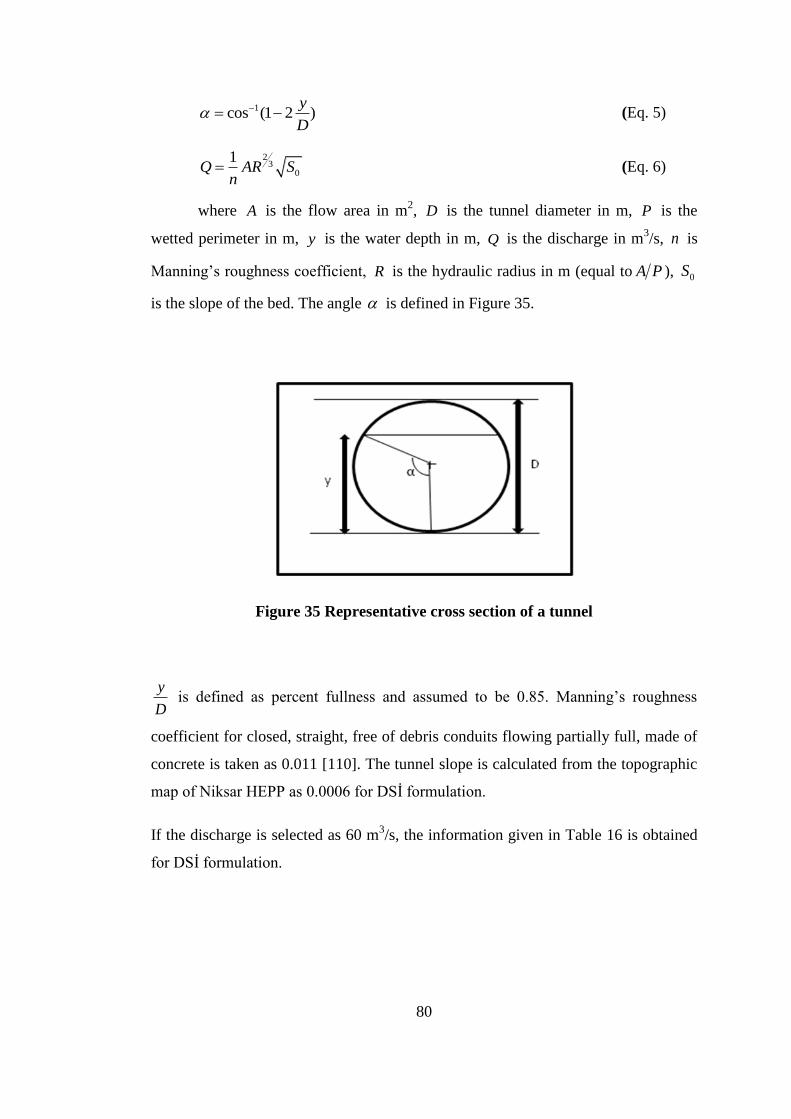
80
1cos (1 2 )y
D (Eq. 5)
23
0
1Q AR S
n (Eq. 6)
where A is the flow area in m2, D is the tunnel diameter in m, P is the
wetted perimeter in m, y is the water depth in m, Q is the discharge in m3/s, n is
Manning‟s roughness coefficient, R is the hydraulic radius in m (equal to A P ), 0S
is the slope of the bed. The angle is defined in Figure 35.
Figure 35 Representative cross section of a tunnel
y
D is defined as percent fullness and assumed to be 0.85. Manning‟s roughness
coefficient for closed, straight, free of debris conduits flowing partially full, made of
concrete is taken as 0.011 [110]. The tunnel slope is calculated from the topographic
map of Niksar HEPP as 0.0006 for DSİ formulation.
If the discharge is selected as 60 m3/s, the information given in Table 16 is obtained
for DSİ formulation.

81
Table 16 Tunnel parameters for a discharge of 60 m3/s, DSİ formulation
Parameter Value
percent fullness ( /y D ) 0.85
D (diameter) (m) 5.265
n (Manning roughness coeff.) 0.011
0S (slope) 0.0006
α (radian) 2.346
P (wetted perimeter) (m) 12.353
A (flow area) (m2) 19.724
R (hydraulic radius) (m) 1.597
Q (discharge) (m3/s) 60.000
u (velocity) (m/s) 3.042
y (water depth) (m) 4.475
As can be seen in Table 16, the tunnel diameter is calculated as 5.265 m which is
close to the one used in DSİ formulation (i.e. 5.75 m). Using the same procedure, the
diameters corresponding to different discharges are calculated. Results of these
calculations are presented in Table 17.
The allowable tunnel headloss factor that is to be selected in order to obtain the same
diameters in RETScreen is found by trial-and-error. For DSİ formulation this factor
is determined to be 49 %. If 49 % is selected, the tunnel diameters calculated by
RETScreen are equal to the diameters given in Table 17 for all the discharges.
However, 49 % is suitable only for this formulation. If any of the parameters such as
the length of the tunnel, percent fullness, bed slope or Manning‟s roughness
coefficient changes, a new value for allowable tunnel headloss factor has to be found
by trial-and-error.

82
Table 17 Diameters for different discharges
SUMMARY (y/D=0.85, S=0.0006)
Q (m3/s) D (m)
50 4.917
55 5.096
60 5.265
65 5.425
70 5.578
75 5.725
80 5.865
85 6.000
90 6.130
95 6.255
100 6.377
For the penstock, another allowable headloss factor is available. RETScreen suggests
a value between 1 - 4 % [101]. For Niksar HEPP, 1 % is used and the software
returned reasonable dimensions for diameter and pipe thickness.
Difficulty of terrain over which the transmission line will be constructed is assumed
as 1.5 since no information is available. RETScreen suggests a value between one
and two. One is used for flat terrains, and two is used for mountainous terrains.
All of the other parameters are taken from the Master Plan Report [88] and the
Feasibility Report [96].
4.1.4 Financial Analysis Sheet
The financial parameters entered to the software are given in Figure 36. The
following information is used:
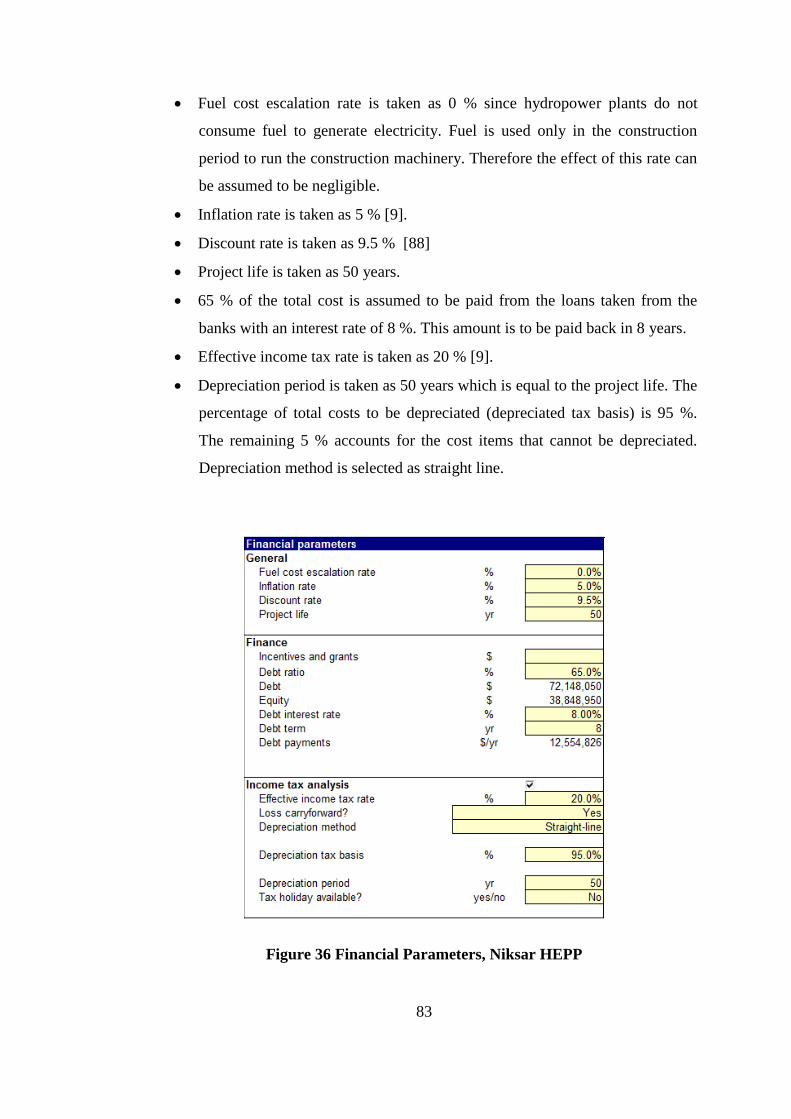
83
Fuel cost escalation rate is taken as 0 % since hydropower plants do not
consume fuel to generate electricity. Fuel is used only in the construction
period to run the construction machinery. Therefore the effect of this rate can
be assumed to be negligible.
Inflation rate is taken as 5 % [9].
Discount rate is taken as 9.5 % [88]
Project life is taken as 50 years.
65 % of the total cost is assumed to be paid from the loans taken from the
banks with an interest rate of 8 %. This amount is to be paid back in 8 years.
Effective income tax rate is taken as 20 % [9].
Depreciation period is taken as 50 years which is equal to the project life. The
percentage of total costs to be depreciated (depreciated tax basis) is 95 %.
The remaining 5 % accounts for the cost items that cannot be depreciated.
Depreciation method is selected as straight line.
Figure 36 Financial Parameters, Niksar HEPP
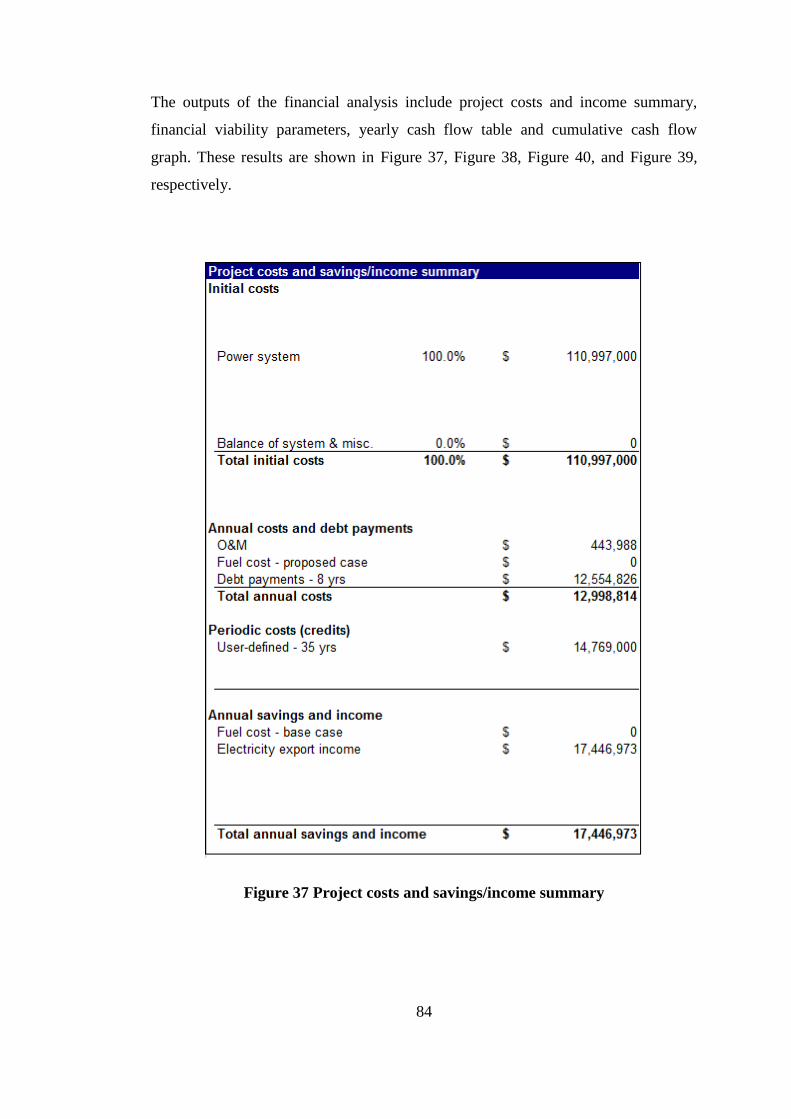
84
The outputs of the financial analysis include project costs and income summary,
financial viability parameters, yearly cash flow table and cumulative cash flow
graph. These results are shown in Figure 37, Figure 38, Figure 40, and Figure 39,
respectively.
Figure 37 Project costs and savings/income summary

85
Figure 38 Financial viability, Niksar HEPP
Figure 39 Cumulative cash flow graph, Niksar HEPP
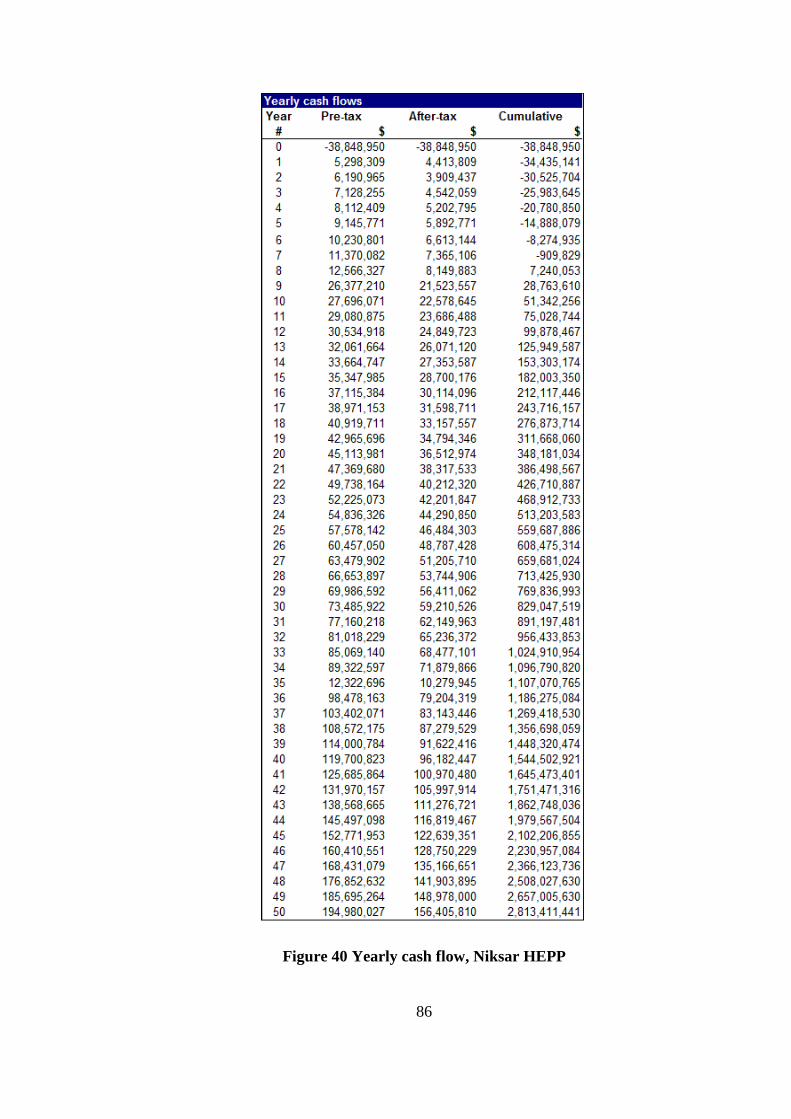
86
Figure 40 Yearly cash flow, Niksar HEPP
87
Projects are called feasible when benefit-cost ratio is greater than 1. The financial
analysis of the project indicates that the project is profitable. As can be seen in
Figure 38, Benefit-Cost Ratio is calculated as 5.59. Therefore, DSİ formulation for
Niksar HEPP project is worth investing.
As can be seen in Figure 39 and Figure 40, cumulative cash flow is negative until the
8th
year. After the 8th
year it turns positive meaning that the investor starts making
profit.
4.1.5 Identification of Design Discharge
In order to obtain the optimum design discharge for a given project, various design
discharges are selected and change of the net income with respect to the selected
discharge is evaluated. The discharge resulting in the maximum annual net benefit
(i.e. annual income-annual cost) is selected as the design discharge for that project
for a given electricity export rate. Alternatives are created for three different
electricity export rates and the optimum design discharges for each alternative
formulation are identified for each one of these export rates.
Selection of electricity export rates:
The first electricity export rate is selected as 75 USD/ MWh. This value is used by
Korkmaz [9] and Küçükbeycan [10] as well. The Turkish Government guarantees to
pay 5.5 Euro Cent for every kilowatt-hour produced by renewable energy
technologies [111]. 75 USD/MWh is very close to 5.5 Euro Cent/kWh (which is
equal to 77.8 USD/ kWh as of January 25, 2010 [112]). Therefore 77.8 USD/kWh is
selected as the first electricity export rate.
The second electricity export rate to be used in RETScreen analysis is taken as the
average wholesale electricity price for 2009 in Turkey. It is suggested as 13.32
88
Krş/kWh by the Energy Market Regulatory Authority of Turkey [113]. 13.32
Krş/kWh is equal to 91.30 USD/MWh [112].
The third electricity export rate is taken as 7.5 Euro Cent/kWh (=106.125
USD/MWh). This value is selected to evaluate the profitability of the HEPPs if the
Turkish Governments raises 5.5 Euro Cent/kWh guarantee to 7.5 Euro Cent/kWh in
the future. This will allow us to see if the profitability of the alternative projects
increases as the electricity export rate increases.
Selection of alternative design discharge rates:
In the master plan report [88] and the Feasibility Report [96], the design discharge of
Niksar HEPP is selected as 60 m3/s. Therefore, it is reasonable to carry out the
analyses for discharges around 60 m3/s. In this study, all the alternative formulations
are evaluated for design discharges starting from 50 m3/s to 80 m
3/s with 5 m
3/s
increments. RETScreen is used to evaluate the annual net benefits corresponding to
each one of these alternative design discharge values (i.e. 50, 55, 60,…, 80 m3/s).
Then a curve is fitted to the results and the interval in which optimum design
discharge occurs (i.e. the value corresponding to the maximum net benefit) is
identified. A more detailed analysis is carried out in this interval: RETScreen is used
to evaluate annual net benefits for discharges with 1 m3/s increments. As a result of
this analysis, the optimum design discharge is identified.
As an example, annual net benefits associated with alternative discharges for an
electricity export rate of 75 USD/MWh for DSİ formulation are given in Table 18.
Discharge versus annual net benefit graph for this formulation is presented in Figure
41. The results of analyses for other alternatives and electricity export rates are given
in Section 4.3.
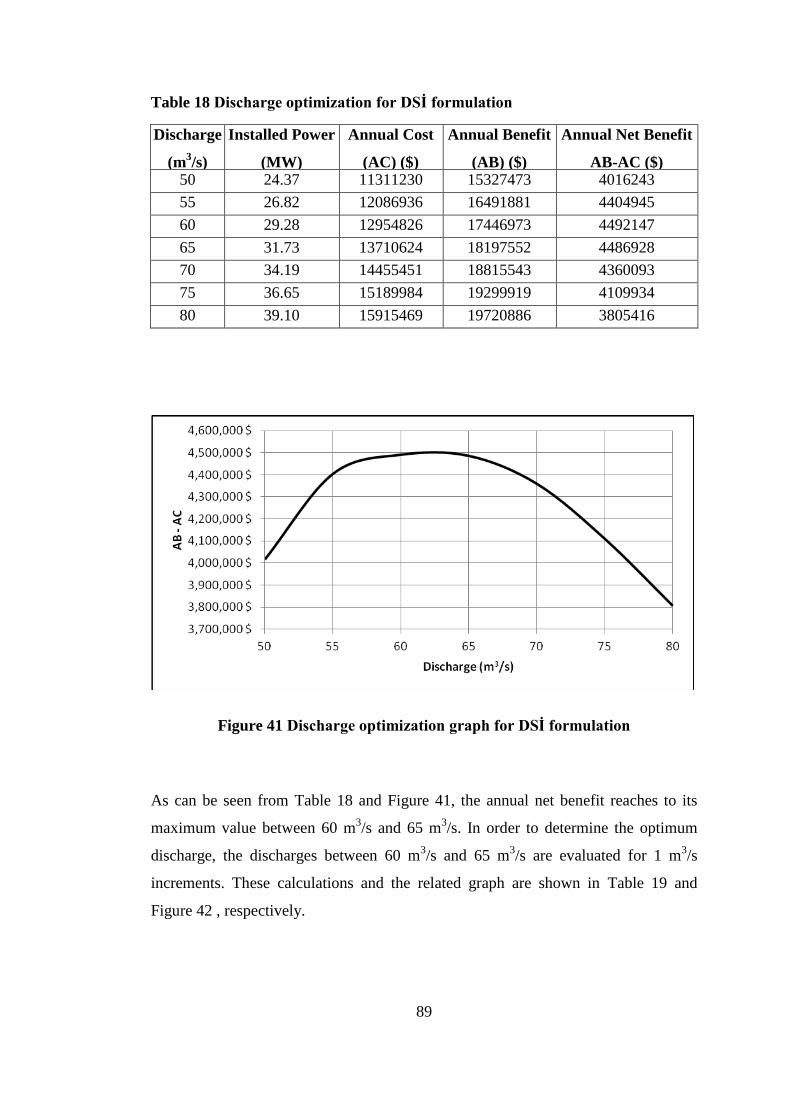
89
Table 18 Discharge optimization for DSİ formulation
Discharge
(m3/s)
Installed Power
(MW)
Annual Cost
(AC) ($)
Annual Benefit
(AB) ($)
Annual Net Benefit
AB-AC ($) 50 24.37 11311230 15327473 4016243
55 26.82 12086936 16491881 4404945
60 29.28 12954826 17446973 4492147
65 31.73 13710624 18197552 4486928
70 34.19 14455451 18815543 4360093
75 36.65 15189984 19299919 4109934
80 39.10 15915469 19720886 3805416
Figure 41 Discharge optimization graph for DSİ formulation
As can be seen from Table 18 and Figure 41, the annual net benefit reaches to its
maximum value between 60 m3/s and 65 m
3/s. In order to determine the optimum
discharge, the discharges between 60 m3/s and 65 m
3/s are evaluated for 1 m
3/s
increments. These calculations and the related graph are shown in Table 19 and
Figure 42 , respectively.
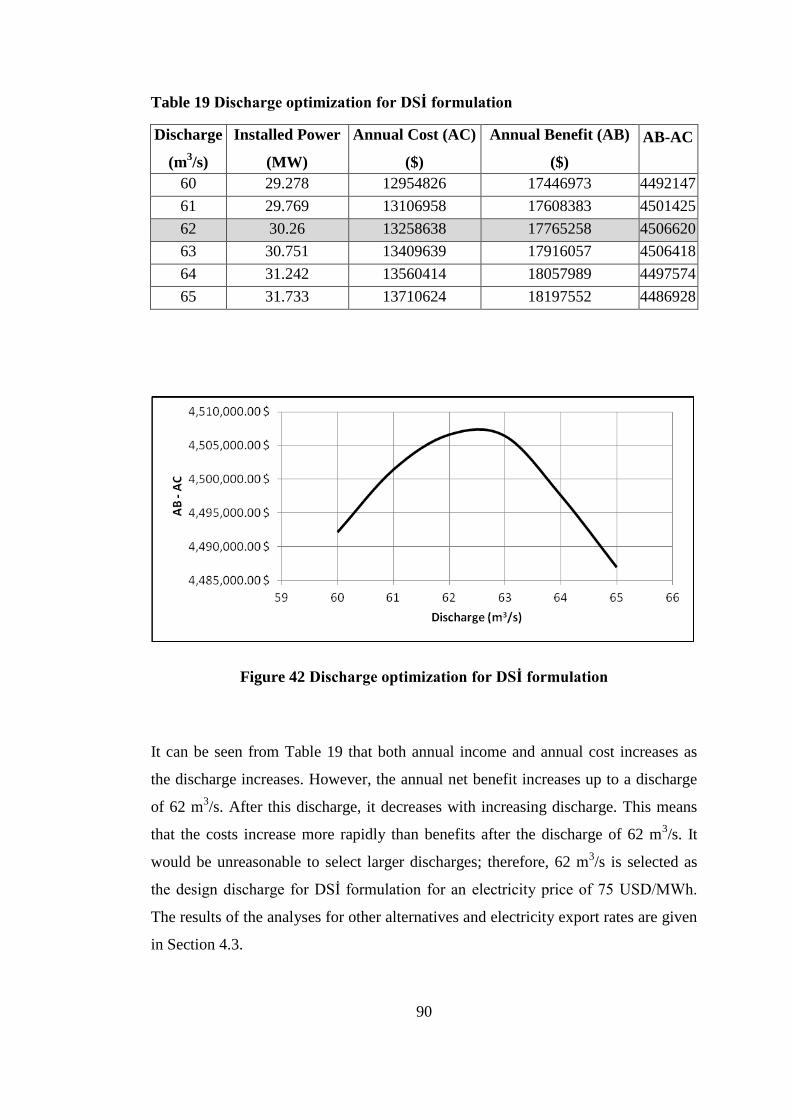
90
Table 19 Discharge optimization for DSİ formulation
Discharge
(m3/s)
Installed Power
(MW)
Annual Cost (AC)
($)
Annual Benefit (AB)
($)
AB-AC
60 29.278 12954826 17446973 4492147
61 29.769 13106958 17608383 4501425
62 30.26 13258638 17765258 4506620
63 30.751 13409639 17916057 4506418
64 31.242 13560414 18057989 4497574
65 31.733 13710624 18197552 4486928
Figure 42 Discharge optimization for DSİ formulation
It can be seen from Table 19 that both annual income and annual cost increases as
the discharge increases. However, the annual net benefit increases up to a discharge
of 62 m3/s. After this discharge, it decreases with increasing discharge. This means
that the costs increase more rapidly than benefits after the discharge of 62 m3/s. It
would be unreasonable to select larger discharges; therefore, 62 m3/s is selected as
the design discharge for DSİ formulation for an electricity price of 75 USD/MWh.
The results of the analyses for other alternatives and electricity export rates are given
in Section 4.3.
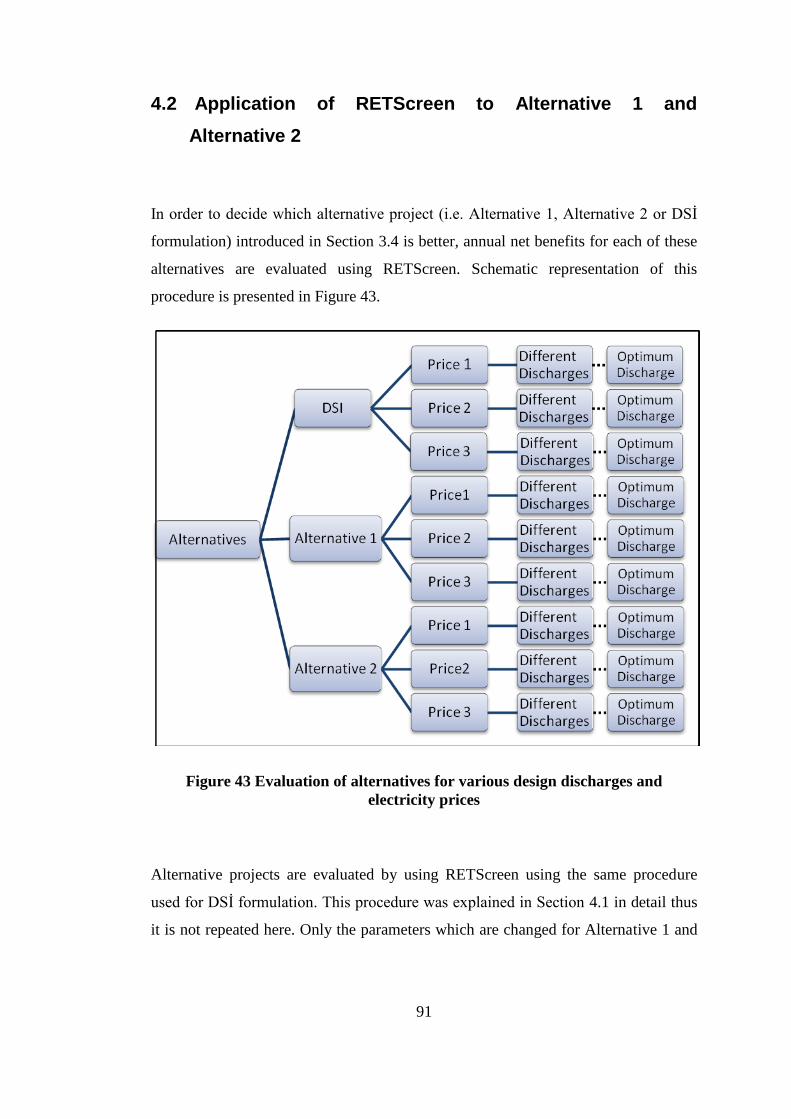
91
4.2 Application of RETScreen to Alternative 1 and
Alternative 2
In order to decide which alternative project (i.e. Alternative 1, Alternative 2 or DSİ
formulation) introduced in Section 3.4 is better, annual net benefits for each of these
alternatives are evaluated using RETScreen. Schematic representation of this
procedure is presented in Figure 43.
Figure 43 Evaluation of alternatives for various design discharges and
electricity prices
Alternative projects are evaluated by using RETScreen using the same procedure
used for DSİ formulation. This procedure was explained in Section 4.1 in detail thus
it is not repeated here. Only the parameters which are changed for Alternative 1 and
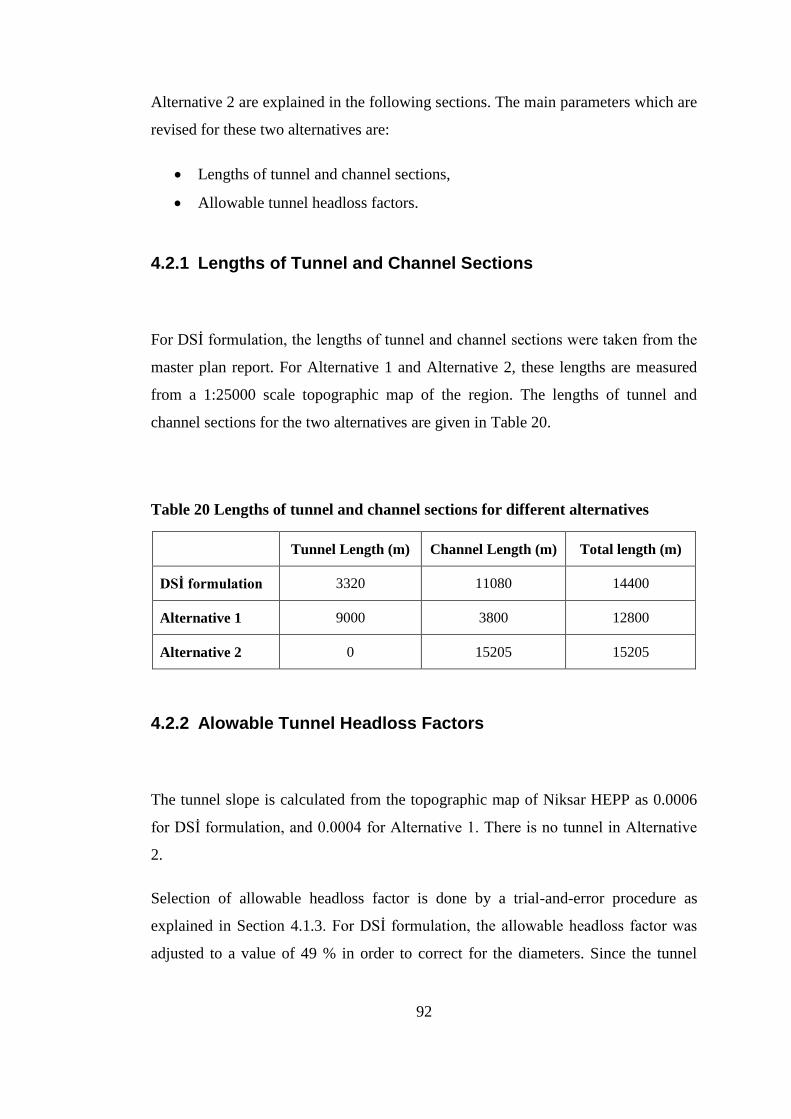
92
Alternative 2 are explained in the following sections. The main parameters which are
revised for these two alternatives are:
Lengths of tunnel and channel sections,
Allowable tunnel headloss factors.
4.2.1 Lengths of Tunnel and Channel Sections
For DSİ formulation, the lengths of tunnel and channel sections were taken from the
master plan report. For Alternative 1 and Alternative 2, these lengths are measured
from a 1:25000 scale topographic map of the region. The lengths of tunnel and
channel sections for the two alternatives are given in Table 20.
Table 20 Lengths of tunnel and channel sections for different alternatives
Tunnel Length (m) Channel Length (m) Total length (m)
DSİ formulation 3320 11080 14400
Alternative 1 9000 3800 12800
Alternative 2 0 15205 15205
4.2.2 Alowable Tunnel Headloss Factors
The tunnel slope is calculated from the topographic map of Niksar HEPP as 0.0006
for DSİ formulation, and 0.0004 for Alternative 1. There is no tunnel in Alternative
2.
Selection of allowable headloss factor is done by a trial-and-error procedure as
explained in Section 4.1.3. For DSİ formulation, the allowable headloss factor was
adjusted to a value of 49 % in order to correct for the diameters. Since the tunnel
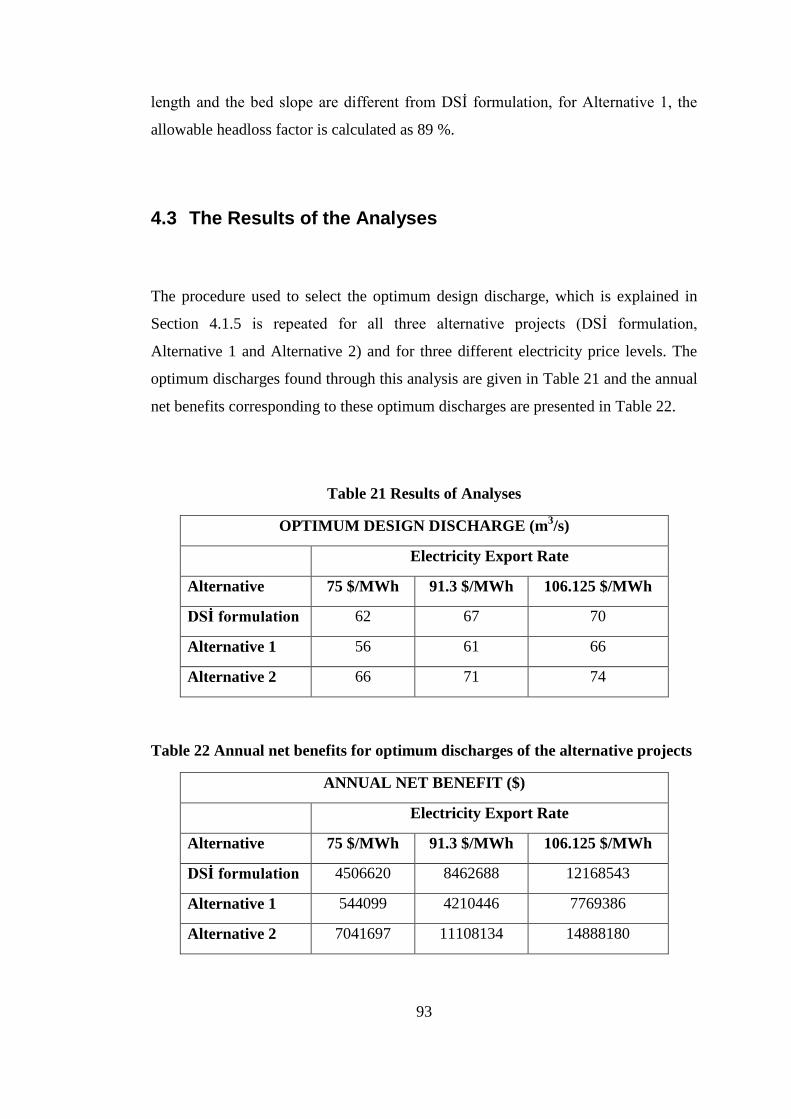
93
length and the bed slope are different from DSİ formulation, for Alternative 1, the
allowable headloss factor is calculated as 89 %.
4.3 The Results of the Analyses
The procedure used to select the optimum design discharge, which is explained in
Section 4.1.5 is repeated for all three alternative projects (DSİ formulation,
Alternative 1 and Alternative 2) and for three different electricity price levels. The
optimum discharges found through this analysis are given in Table 21 and the annual
net benefits corresponding to these optimum discharges are presented in Table 22.
Table 21 Results of Analyses
OPTIMUM DESIGN DISCHARGE (m3/s)
Electricity Export Rate
Alternative 75 $/MWh 91.3 $/MWh 106.125 $/MWh
DSİ formulation 62 67 70
Alternative 1 56 61 66
Alternative 2 66 71 74
Table 22 Annual net benefits for optimum discharges of the alternative projects
ANNUAL NET BENEFIT ($)
Electricity Export Rate
Alternative 75 $/MWh 91.3 $/MWh 106.125 $/MWh
DSİ formulation 4506620 8462688 12168543
Alternative 1 544099 4210446 7769386
Alternative 2 7041697 11108134 14888180
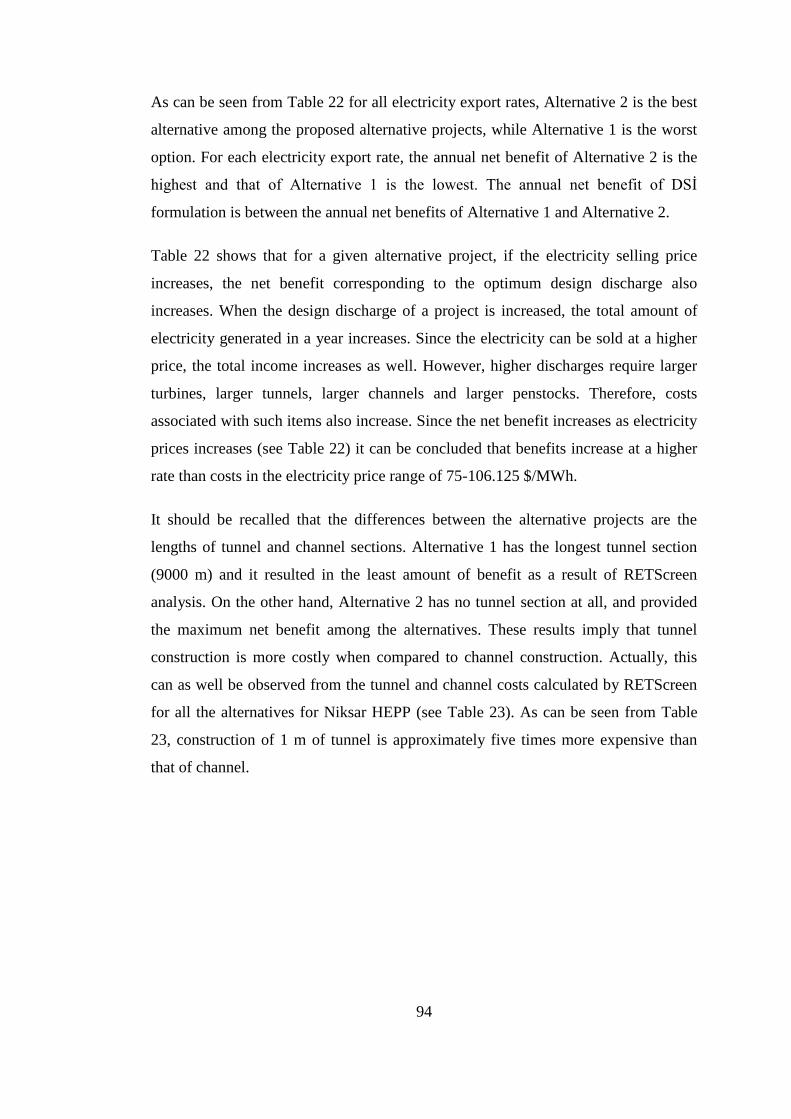
94
As can be seen from Table 22 for all electricity export rates, Alternative 2 is the best
alternative among the proposed alternative projects, while Alternative 1 is the worst
option. For each electricity export rate, the annual net benefit of Alternative 2 is the
highest and that of Alternative 1 is the lowest. The annual net benefit of DSİ
formulation is between the annual net benefits of Alternative 1 and Alternative 2.
Table 22 shows that for a given alternative project, if the electricity selling price
increases, the net benefit corresponding to the optimum design discharge also
increases. When the design discharge of a project is increased, the total amount of
electricity generated in a year increases. Since the electricity can be sold at a higher
price, the total income increases as well. However, higher discharges require larger
turbines, larger tunnels, larger channels and larger penstocks. Therefore, costs
associated with such items also increase. Since the net benefit increases as electricity
prices increases (see Table 22) it can be concluded that benefits increase at a higher
rate than costs in the electricity price range of 75-106.125 $/MWh.
It should be recalled that the differences between the alternative projects are the
lengths of tunnel and channel sections. Alternative 1 has the longest tunnel section
(9000 m) and it resulted in the least amount of benefit as a result of RETScreen
analysis. On the other hand, Alternative 2 has no tunnel section at all, and provided
the maximum net benefit among the alternatives. These results imply that tunnel
construction is more costly when compared to channel construction. Actually, this
can as well be observed from the tunnel and channel costs calculated by RETScreen
for all the alternatives for Niksar HEPP (see Table 23). As can be seen from Table
23, construction of 1 m of tunnel is approximately five times more expensive than
that of channel.
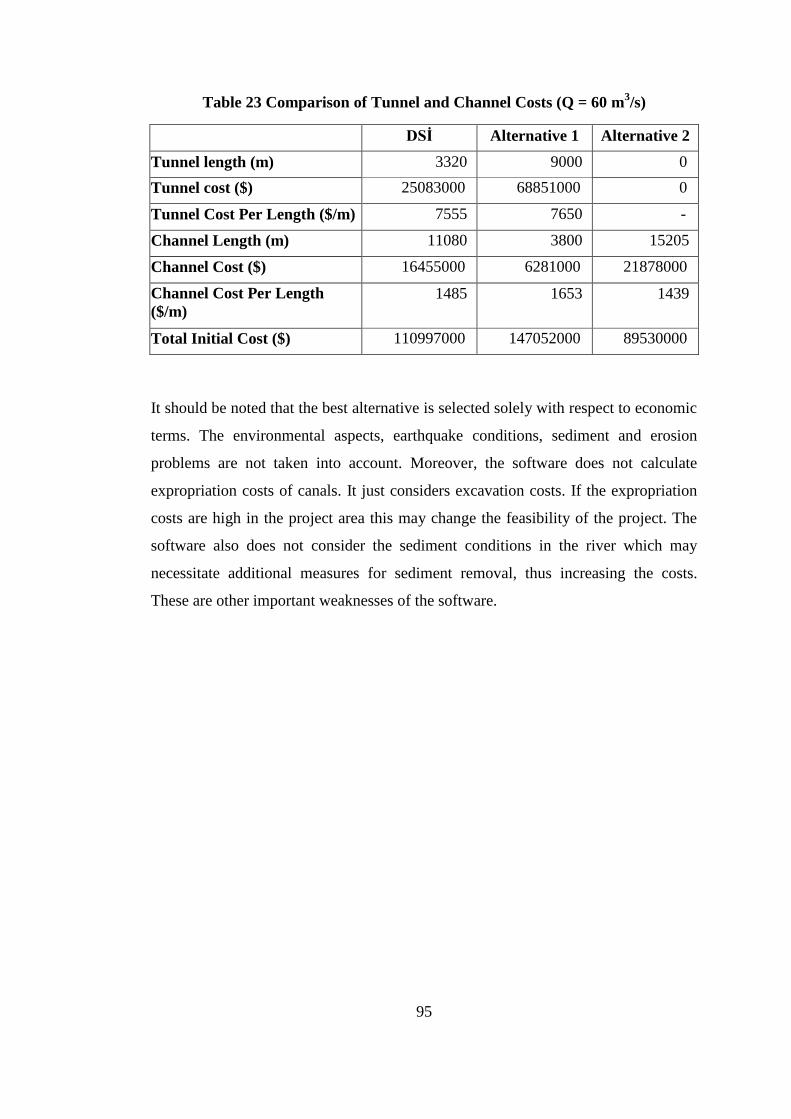
95
Table 23 Comparison of Tunnel and Channel Costs (Q = 60 m3/s)
DSİ Alternative 1 Alternative 2
Tunnel length (m) 3320 9000 0
Tunnel cost ($) 25083000 68851000 0
Tunnel Cost Per Length ($/m) 7555 7650 -
Channel Length (m) 11080 3800 15205
Channel Cost ($) 16455000 6281000 21878000
Channel Cost Per Length
($/m)
1485 1653 1439
Total Initial Cost ($) 110997000 147052000 89530000
It should be noted that the best alternative is selected solely with respect to economic
terms. The environmental aspects, earthquake conditions, sediment and erosion
problems are not taken into account. Moreover, the software does not calculate
expropriation costs of canals. It just considers excavation costs. If the expropriation
costs are high in the project area this may change the feasibility of the project. The
software also does not consider the sediment conditions in the river which may
necessitate additional measures for sediment removal, thus increasing the costs.
These are other important weaknesses of the software.
96
CHAPTER 5
5. CONCLUSION
Hydropower projects offer great opportunities for sustainable development of the
countries. Being the cheapest, domestic, and renewable resource of energy, it
deserves to be high up on the governments‟ investment agenda. It is also a great
market that creates business opportunities for private companies, especially in the
developing countries.
RETScreen Clean Energy Project Analysis Software is a decision support tool
developed in order to assist the planners and decision makers in developing the
renewable energy and energy efficient projects. The software can be utilized
worldwide and it reduces the money and time spent while identifying and assessing
potential energy projects and alternatives at the initial planning stage.
In this study, RETScreen is used to evaluate the economical feasibilities of different
alternatives of the Niksar HEPP project. For each of these alternatives, the optimum
design discharges for different electricity export rates are also calculated.
Using RETScreen, change of financial parameters with respect to electricity prices is
also observed. This allows the developers to see the financial performance of the
projects in different market conditions. The software makes it a lot easier to observe
the effects of the changes in the project formulation, which could otherwise take
considerable amount of time.
The hydro formula costing method tool in RETScreen uses empirical formulas which
are based on the completed projects in Canada. Therefore, these cost calculations
include uncertainties when used in Canada as well as the other countries. The tuning
CONCLUSION
97
parameters such as local manufacture coefficient and labor cost coefficient should
carefully be selected to better estimate the initial costs.
The software considers only economic aspects when calculating total cost of the
project. It does not take into account the environmental aspects. It cannot evaluate
environmentally favorable solutions. The only environmental analysis available in
RETScreen is the Emission Analysis and it can be used to calculate the emissions
reduced when a hydropower project is implemented instead of a conventional
thermal plant. Moreover, the software ignores earthquake, erosion, and sediment
problems. If such problems exist in the project area, the software must be used with
caution.
The software has some deficiencies in calculating tunnel and channel costs as well. It
uses only the excavation amounts but does not consider the expropriation costs.
Another major drawback of the software is that some of the hydraulic parameters
internally calculated by the software may be incorrect. For example, the tunnel
diameters calculated by the software was incorrect for the case studies used in this
thesis. The tunnel diameters are tuned by changing allowable tunnel headloss factor
which resulted in unreasonable headloss values. It might be worth investigating
impact of changing other parameters such as percent length of tunnel that is lined for
tuning tunnel diameters.
Results of the analyses reveal that, tunnel construction is a major item in total costs.
Length of the tunnel section significantly affects the economical feasibility of the
project. Long tunnel sections had better be avoided if possible. However, these
analyses do not cover the assessment of the environmental effects or social and
cultural issues. In some cases a tunnel section may be preferred to a channel section
even if it is more expensive. As far as the number of trees cut is concerned, tunnel
construction is a better alternative. For earthquake-prone areas, tunnels may be
preferred since tunnels are known to be the most earthquake-resistant structures in a
hydropower scheme. However, a collapse in the tunnel can cost a lot more than a
failure in a channel, and can be more difficult to restore. Long tunnels can also cause
groundwater disturbance and dewatering in some places. During the tunnel

98
construction, noise and the vibration created by explosions may impact the fauna. On
the other hand, land acquisition costs for channels may be very costly in some
regions or even impossible in cultural and historical sites. Therefore, economic
considerations are not solely enough in planning of hydropower projects. All of the
other aspects should be taken into account starting from the very beginning of the
project development process.
As explained in the previous paragraphs RETScreen has some weaknesses; but it still
can be used in prefeasibility and feasibility studies, where the cost calculations are
expected to have an accuracy of around ± 40 %. It takes about a couple of weeks to
learn how to use the software, and when the required data is available, it takes two to
three hours to conduct economical analysis for a hydropower project. Moreover,
when the input parameters of the program are changed, the results are updated within
seconds, which helps to save time. It can be concluded that the decision maker may
benefit from the analysis results of RETScreen software in evaluating various
alternatives of the hydropower project if he or she is informed about all the
weaknesses of the software.
Being one of the fastest growing economies in the world, Turkey needs to develop
energy projects in order to provide the industry with the energy it requires.
Significant amount of electricity is generated in thermal plants using natural gas in
Turkey. This makes Turkey reliant on natural gas imported from other countries.
Energy is an important power in politics. Therefore, countries should try to utilize
their domestic energy resources as much as possible. Turkey has a huge untapped
potential in hydroelectric power. Two-thirds of its hydropower potential remains to
be developed. Harnessing this potential should be prioritized in the energy policy.
This will ensure the self reliance of the energy market in Turkey and help to decrease
GHG emissions for a cleaner future.
Utilizing the hydropower potential does not mean that the hydropower plants should
be constructed whatever the cost. Sustainable development of hydropower plants is
essential. Environmental and social aspects of these projects should be carefully
assessed. Legislative and administrative arrangements complying with international

99
standards should be prepared to guarantee the utilization of resources in an
environmentally, socially and economically sustainable way.
100
REFERENCES
[1] World Energy Council, 2007 Survey of Energy Resources. World Energy
Council, 2007.
[2] International Energy Agency, World Energy Outlook 2009. OECD / IEA,
2009.
[3] International Hydropower Association, The Role of Hydropower in
Sustainable Development - IHA White Paper. IHA, 2003.
[4] International Energy Agency, Key World Energy Statistics 2009. IEA, 2009.
[5] P. Karki, “Briefing: IHA sustainability guidelines and assessment protocol,”
Engineering Sustainability, vol. 161, no. 1, pp. 3–5, 2008.
[6] General Directorate of State Hydraulic Works, Turkey Water Report 2009.
General Directorate of State Hydraulic Works, 2009.
[7] M. Türksoy and A. G. Özgün, “Türkiye‟de küçük akarsulardan hidroelektrik
enerji üretim imkanları,” in Hidroelektrik Enerji Sempozyumu Tebliğleri, 1985.
[8] Turkish Electricity Transmission Corporation (TEİAŞ) Research, Planning
and Coordination Department. Turkish electrical energy 10-year generation capacity
projection (2009 – 2018). June 8, 2010. TEİAŞ. [Online]. Available: http://-
www.teias.gov.tr/eng/ApkProjection/index.htm
[9] O. Korkmaz, “A case study on feasibility assessment of small hydropower
scheme,” Master‟s thesis, Middle East Technical University, 2007.
[10] M. Küçükbeycan, “RETScreen decision support system for prefeasibility
analysis of small hydropower projects,” Master‟s thesis, Middle East Technical
University, 2008.

101
[11] U.S. Department of Energy - Energy Efficiency and Renewable Energy -
Wind and Water Program, “How hydropower works.” May 24, 2010. [Online].
Available: http://www1.eere.energy.gov/windandhydro/hydro_how.html
[12] Ü. Öziş, T. Baran and Y. Dalkılıç, “Hidroelektrik enerjiyi geliştirme hızları,”
in Su ve Enerji Konferansı Bildiriler Kitabı, 2008.
[13] I. Ilyinykh, Hydroelectric Stations. Moscow: Mir Publications, 1985.
[14] G. Frey and D. Linke, “Hydropower as a renewable and sustainable energy
resource meeting global energy challenges in a reasonable way,” Energy Policy,
vol. 30, no. 14, pp. 1261–1265, 2002.
[15] François de Dardel, “The water we drink,” August 15, 2010. [Online].
Available: http://dardel.info/EauAnglais.html
[16] International Energy Agency - Hydropower Implementing Agreement, “What
is hydropower‟s history?” May 26, 2010. [Online]. Available: http://-
www.ieahydro.org/faq.htm
[17] J. Gulliver and R. Arndt, Hydropower Engineering Handbook. McGraw-Hill,
Inc., 1991.
[18] N. Smith, “The origins of the water turbine,” Scientific American, vol. 242,
no. 1, pp. 138–48, 1980.
[19] T. Price and D. Probert, “Harnessing hydropower: A practical guide,” Applied
Energy, vol. 57, no. 2-3, pp. 175–251, 1997.
[20] U.S. Department of Energy - Energy Efficiency and Renewable Energy -
Wind and Water Program, “History of hydropower,” May 24, 2010. [Online].
Available: http://www1.eere.energy.gov/windandhydro/hydro_history.html
[21] O. Paish, “Small hydro power: technology and current status,” Renewable
and Sustainable Energy Reviews, vol. 6, no. 6, pp. 537–556, 2002.
[22] U.S. Department of Energy - Energy Efficiency and Renewable Energy -
Wind and Water Program, “Hydropower : Setting a course for our energy future,”

102
May 27, 2010. [Online]. Available: http://hydropower.inel.gov/techtransfer/pdfs/-
34916.pdf
[23] Idaho National Laboratory, “Types of hydropower facilities,” May 27, 2010.
[Online]. Available: http://hydropower.inel.gov/hydrofacts/hydropower_facilities.
shtml
[24] A. M. Yanmaz, Applied Water Resources Engineering. METU Press
Publishing Company, 2006.
[25] National Renewable Energy Laboratory, “Small hydropower systems,” May
27, 2010. [Online]. Available: http://www.nrel.gov/docs/fy01osti/29065.pdf
[26] Middlebury College, “Hydropower,” August 15, 2010. [Online]. Available:
https://mediawiki.middlebury.edu/wiki/OpenSourceLearning/Hydropower
[27] The Thematic Network of Small Hydropower, Guide on How to Develop a
Small Hyropower Plant. European Small Hydropower Association, 2004.
[28] Government of India Ministry of New and Renewable Energy, “Small hydro
power programme,” May 27, 2010. [Online]. Available: http://mnre.gov.in/prog-
smallhydro.htm
[29] China Hydroelectric Corporation, “Market overview,” May 27, 2010.
[Online]. Available: http://www.chinahydroelectric.com/web/guest/market-overview
[30] Ö. Yüksek, M. Kankal, M. İ. Kömürcü H. Önsoy and A. Akpınar, “The
importance of hydropower plants in Turkey‟s energy planning,” in International
River Basin Management Congress Book, 2007.
[31] Hatch Ltd., “Low head hydro market assessment,” Natural Resources Canada,
Tech. Rep., 2008.
[32] Maryland Power Plant Research Program, “Meeting the state‟s electricity
needs,” August 15, 2010. [Online]. Available: http://esm.versar.com/pprp/factbook/-
stateneed.htm
[33] H. Başeşme, Hidroelektrik Santrallar ve Hidroelektrik Santral Tesisleri.
EÜAŞ Genel Müdürlüğü Hidrolik Santraller Dairesi Başkanlığı Yayınları, 2003.
103
[34] Ü. Öziş, “Türkiye‟nin hidroelektrik potansiyeli ve enerji üretimi,” in
Hidroelektrik Enerji Sempozyumu Tebliğleri, 1985.
[35] EURELECTRIC. (1997) Study on the importance of harnessing the
hydropower resources of the world. Union of the Electric Industry
(EURELECTRIC), Hydro Power and other Renewable Energies Study Committee,
Brussels.
[36] The International Journal of Hydropower & Dams, “World Hydropower Atlas
2000.”
[37] D. Altınbilek, “The role of dams in development,” International Journal of
Water Resources Development, vol. 18, no. 1, pp. 9–24, 2002.
[38] EUREC Agency, The Future for Renewable Energy 2: Prospects and
Directions, 2nd ed. Earthscan Publications Ltd., 2002.
[39] International Energy Agency, World Energy Outlook 2008. OECD / IEA,
2008.
[40] N. N. Bakır. Turkey‟s hydropower potential and review of electricity
generation policies from EU perspective. June 2, 2010. [Online]. Available: http://-
www.ere.com.tr/pdf/HIDRO-POT-AB-EN.pdf
[41] Turkish Electricity Transmission Co. (TEİAŞ), “Brief history of Turkish
power system and TEİAŞ,” June 3, 2010. [Online]. Available: http://-
www.teias.gov.tr/eng/TeiasEng.htm
[42] H. Balat, “A renewable perspective for sustainable energy development in
Turkey: The case of small hydropower plants,” Renewable and Sustainable Energy
Reviews, vol. 11, no. 9, pp. 2152–2165, 2007.
[43] Turkish Electricity Transmission Co. (TEİAŞ), “Electricity generation-
transmission statistics of Turkey 2008,” June 3, 2010. [Online]. Available: http://-
www.teias.gov.tr/istatistik2008/index.htm
[44] General Directorate of State Hydraulic Works (DSİ), Water and DSİ. General
Directorate of State Hydraulic Works, 2009.
104
[45] International Monetary Fund, “World economic outlook database,” June 5,
2010. [Online]. Available: http://www.imf.org/external/pubs/ft/weo/2010/01/-
weodata/index.aspx
[46] S. Kucukali and K. Baris, “Assessment of small hydropower (SHP)
development in Turkey: Laws, regulations and EU policy perspective,” Energy
Policy, 2009.
[47] C. Hamzaçebi, “Forecasting of Turkey‟s net electricity energy consumption
on sectoral bases,” Energy policy, vol. 35, no. 3, pp. 2009–2016, 2007.
[48] Ö. Yüksek, “Reevaluation of Turkey‟s hydropower potential and electric
energy demand,” Energy Policy, vol. 36, no. 9, pp. 3374–3382, 2008.
[49] M. Tunç, Ü. Çamdalı and Cem Parmaksızoğlu, “Comparison of Turkey‟s
electrical energy consumption and production with some European countries and
optimization of future electrical power supply investments in Turkey,” Energy
Policy, vol. 34, no. 1, pp. 50–59, 2006.
[50] Z. Yumurtacı and E. Asmaz, “Electric energy demand of Turkey for the year
2050,” Energy Sources, Part A: Recovery, Utilization, and Environmental Effects,
vol. 26, no. 12, pp. 1157–1164, 2004.
[51] J. Douglas, “Renewables: A promising coalition of many,” EPRI Journal,
vol. Summer, pp. 6–15, 2007.
[52] International Hydropower Association and International Commission on
Large Dams and Implementing Agreement on Hydropower Technologies and
Programmes/ IEA and Canadian Hydropower Association, “Hydropower and the
world‟s energy future,” August 7, 2010. [Online]. Available: http://-
www.ieahydro.org/reports/Hydrofut.pdf
[53] L. Gagnon, C. Belanger, and Y. Uchiyama, “Life-cycle assessment of
electricity generation options: The status of research in year 2001,” Energy Policy,
vol. 30, no. 14, pp. 1267–1278, 2002.
[54] E. Helland-Hansen, T. Holtedahl, and K. Lye, Environmental effects.
Norwegian Univ. of Science and Technology, Dep. of Hydraulic and Environmental
Engineering, 2005.
105
[55] S. Shalash, “Degradation of the River Nile,” International Water Power and
Dam Construction, vol. 35, no. 8, 1983.
[56] A. Palmieri, F. Shah, and A. Dinar, “Economics of reservoir sedimentation
and sustainable management of dams,” Journal of Environmental Management,
vol. 61, no. 2, pp. 149–163, 2001.
[57] D. Yuefang and S. Steil, “China Three Gorges project resettlement: Policy,
planning and implementation,” Journal of Refugee Studies, vol. 16, no. 4, p. 422,
2003.
[58] P. Gutman, “Involuntary resettlement in hydropower projects,” Annual
Review of Energy and the Environment, vol. 19, no. 1, pp. 189–210, 1994.
[59] B. Acma, “Promoting sustainable human settlements and eco-city planning
approach: Southeastern Anatolia Region and Southeastern Anatolia Project (GAP) in
Turkey as a case study,” UNISCI DISCUSSION PAPERS, 2005.
[60] O. Yılmazer, A. H. Orhan, I. Yılmazer, A. Ozvan, and S. Bekiroğlu, “Capital
City of the Oldest Civilization: Hasankeyf T-Turkey,” Journal of Applied Sciences
Research, vol. 5, no. 9, pp. 1247–1253, 2009.
[61] UNEP, Global Environment Outlook: Environment for Development (GEO-
4). United Nations Environment Programme, 2007.
[62] Z. G. Parlak, “Dams and sustainable development,” in International River
Basin Management Congress Book, 2007.
[63] C. Tortajada, “Evaluation of Actual Impacts of the Atatürk Dam,”
International Journal of Water Resources Development, vol. 16, no. 4, pp. 453–464,
2000.
[64] Doğan Haber Ajansı, “Yarasalar yapay mağaralarına döndü,” June 10, 2010.
[Online]. Available: http://www.dha.com.tr/n.php?n=yarasalar-yapay-magaralarina-
dondu-2010-06-10
[65] T. Öztürk, “Çoruh Havzası su kaynaklarını geliştirme projelerinin çevresel
etkileri,” in TMMOB Su Politikaları Kongresi, 2006.
106
[66] A. Akpınar, M. . Kömürcü, M. Kankal, and M. H. Filiz, “Çoruh
Havzası‟ndaki küçük hidroelektrik santrallerin durumu,” in V. Yenilenebilir Enerji
Kaynakları Sempozyumu, 2009.
[67] Derelerin Kardeşliği Platformu, “Yargı „Dur‟ Diyor, HES‟ler Çoğalıyor,”
August 17, 2010. [Online]. Available: http://derelerinkardesligi.org/web/-
index.php?option=com_content&task=view&id=20&Itemid=9
[68] Ministry of Environment and Forestry (Turkey), “By-Law on Environmental
Impact Assessment (EIA),” Official Gazette, vol. 26939, 2008.
[69] A. Coşkun and O. Turker, “Analysis of environmental impact assessment
(EIA) system in Turkey,” Environmental Monitoring and Assessment, pp. 1–14.
[70] J. Ravn, Planning and Implementation of Hydropower Projects. Norwegian
Institute of Technology, Division of Hydraulic Engineering, 1992.
[71] RETScreen International, RETScreen Engineering and Cases Textbook.
Minister of Natural Resources Canada, 2004, ch. Small hydro project analysis.
[72] A. F. Karamustafaoğlu, “Küçük ve orta ölçekli hidroelektrik santrallar için
kontrol-kumanda, ölçme ve koruma sistemi tasarımı, geliştirilmesi ve prototip
üretimi (HESKON) projesi,” June 16, 2010, TEMSAN. [Online]. Available: http://-
www.tubitak.gov.tr/tubitak_content_files//BTYPD/btyk/20/20btyk_TEMSAN.pdf
[73] United Nations, “Report of the World Commission on Environment and
Development,” 1987. [Online]. Available: http://www.un-documents.net/wced-
ocf.htm, August 7, 2010
[74] “Beijing declaration on hydropower and sustainable development,” United
Nations Symposium on Hydropower and Sustainable Development, Beijing, China,
29 October 2004. [Online]. Available: http://www.un.org/esa/sustdev/sdissues/-
energy/hydropower_sd_beijingdeclaration.pdf
[75] “Political declaration,” International Conference for Renewable Energies,
Bonn, Germany, August 7, 2010. [Online]. Available: http://-
www.renewables2004.de/pdf/Political_declaration_final.pdf
107
[76] J. Klimpt, C. Rivero, H. Puranen, and F. Koch, “Recommendations for
sustainable hydroelectric development,” Energy Policy, vol. 30, no. 14, pp. 1305–
1312, 2002.
[77] J. Liu, Z. Sun, P. Lou, and Y. Chen, “Project Sustainability Management in
China‟s Hydropower Development,” in Proceedings of the 2006 World
Environmental and Water Resources Congress; Omaha, NE. American Society of
Civil Engineers, 1801 Alexander Bell Drive, Reston, VA, 20191-4400, USA,, 2006.
[78] IHA, Sustainability Guidelines. International Hydropower Association, 2004.
[79] IHA, Sustainability Assessment Protocol. International Hydropower
Association, 2006.
[80] E. M. Wilson, “Assessment methods for small-hydro projects,” The
International Energy Agency – Implementing Agreement for Hydropower
Technologies and Programmes, Tech. Rep., 2000.
[81] RETScreen International, “Centre overview,” July 29, 2010. [Online].
Available: http://www.retscreen.net/ang/g_contri.php
[82] Natural Resources Canada, “About CanmetENERGY,” July 29, 2010.
[Online]. Available: http://canmetenergy-canmetenergie.nrcan-rncan.gc.ca/eng/
[83] RETScreen International, “RETScreen International: Results and Impacts
1996-2012,” June 2004.
[84] E. K. Ackom, “Technical & economic viability analysis of renewable energy
technologies in Ghana,” Ph.D. dissertation, The Brandenburg University of
Technology, 2005.
[85] RETScreen International, “What is RETScreen?” July 29, 2010. [Online].
Available: http://www.retscreen.net/ang/home.php
[86] J. L. Gordon, Black Boxing Hydro Costs, 1989.
[87] RETScreen International, Clean Energy Project Analysis RETScreen®
Engineering & Cases Textbook, 2005.
108
[88] DSI, Aşağı Kelkit Projesi Master Plan Raporu. Devlet Su İşleri Genel
Müdürlüğü, 1990.
[89] Koyulhisar Kaymakamlığı, “Koyulhisar HES açıldı,” August 16, 2010.
[Online]. Available: http://www.koyulhisar.gov.tr/default_B0.aspx?id=31
[90] Reşadiye Belediyesi, “Akıncı HES temeli atıldı,” August 16, 2010. [Online].
Available: http://www.resadiye.bel.tr/haber_goster.asp?id=363
[91] Reşadiye Kaymakamlığı, “Ekonomik Yapı,” August 16, 2010. [Online].
Available: http://www.resadiye.gov.tr/page.asp?id=11
[92] İçtaş İnşaat A.Ş., “Enerji projeleri,” August 16, 2010. [Online]. Available:
http://www.ictas.com.tr/enerji.php
[93] Tokat Gazetesi, “Erbaa HES için Danıştay Kararı,” August 16, 2010.
[Online]. Available: http://tokatgazetesi.com/haber_detay.asp?haberID=327
[94] B. Özmen, M. Nurlu, and H. Güler, Coğrafi Bilgi Sistemi ile Deprem
Bölgelerinin İncelenmesi. Afet İşleri Genel Müdürlüğü, 1997.
[95] Deprem Dairesi Başkanlığı, “Türkiye deprem bölgeleri haritası,” August 15,
2010. [Online]. Available: http://www.deprem.gov.tr/Sarbis/depbolge/tokat.gif
[96] Niksar HEPP Feasibility Report, 2004.
[97] W. Creager and J. Justin, Hydroelectric Handbook. John Wiley & Sons, Inc.,
1950.
[98] L. Mays, Water resources engineering. Wiley, 2001.
[99] İ. Ünsal, “Turkey‟s hydrolectric potential and energy policies,” Stradigma,
vol. 6, 2003.
[100] SU-YAPI Mühendislik ve Müşavirlik A.Ş., Niksar HES Projesi Revize
Fizibilite Raporu (2. Revizyon), 2009.
109
[101] RETScreen International, “RETScreen Software Help,” Integrated to the
software, 2010.
[102] Bank of Canada, “USD - CAD Noon Rate,” January 14, 2010. [Online].
Available: http://www.bankofcanada.ca/en/index.html
[103] Türkiye Cumhuriyeti Merkez Bankası, “TCMB Döviz Kurları,” January 14,
2010. [Online]. Available: http://www.tcmb.gov.tr/
[104] Natural Resource Canada, “Average retail prices for diesel in Canada,”
January 14, 2010. [Online]. Available: http://www2.nrcan.gc.ca/eneene/sources/-
pripri/prices_bycity_e.cfm?PriceYear=0&ProductID=5&LocationID=66&dummy
=#PriceGraph
[105] British Petroleum, “Akaryakıt pompa satış fiyatları,” January 14, 2010.
[Online]. Available: http://www.bppompafiyatlari.com/
[106] OECD, “Unit labour costs,” January 14, 2010. [Online]. Available: http://-
stats.oecd.org
[107] TÜİK, “2004 ve 2008 işgücü maliyeti araştırması sonuçları,” TÜİK Haber
Bülteni, vol. 231, 2009.
[108] RETScreen International, “Small hydro project analysis,” August 16, 2010.
[Online]. Available: www.retscreen.net/download.php/ang/107/1/Course_hydro.ppt
[109] M. C. Potter and D. C. Wiggert, Mechanics of Fluids, 3rd ed. Brooks/Cole,
2002.
[110] V. Chow, Open-channel hydraulics. McGraw-Hill, 1959.
[111] Türkiye Büyük Millet Meclisi, “Kanun No. 5346 - Yenilenebilir Enerji
Kaynaklarının Elektrik Enerjisi Üretimi Amaçlı Kullanımına İlişkin Kanun,” T.C.
Resmi Gazete, vol. 25819, 2005.
[112] Türkiye Cumhuriyeti Merkez Bankası, “Döviz Kurları,” January 25, 2010.
[Online]. Available: http://www.tcmb.gov.tr/yeni/kurlar/kurlar_tr.php

110
[113] Enerji Piyasası Düzenleme Kurumu, “Karar no: 2339,” Resmi Gazete, vol.
27437, 2009.