Feasibility report for Proposed Petroleum Hydrocarbon …gpcb.gov.in/pdf/Feasibility_Report.pdf ·...
48
1 of 48 M/s. GUJARAT HYDROCARBONS AND POWER SEZ LIMITED GIDC – VILAYAT (VAGRA) INDUSTRIAL ESTATE, VILAYAT, TAL : VAGRA, DIST : BHARUCH, GUJARAT Feasibility report for Proposed Petroleum Hydrocarbon SEZ in Gujarat
Transcript of Feasibility report for Proposed Petroleum Hydrocarbon …gpcb.gov.in/pdf/Feasibility_Report.pdf ·...

1 of 48
M/s. GUJARAT HYDROCARBONS AND POWER SEZ LIMITED
GIDC – VILAYAT (VAGRA) INDUSTRIAL ESTATE,
VILAYAT, TAL : VAGRA, DIST : BHARUCH, GUJARAT
Feasibility report for Proposed Petroleum Hydrocarbon
SEZ in Gujarat
2 of 48
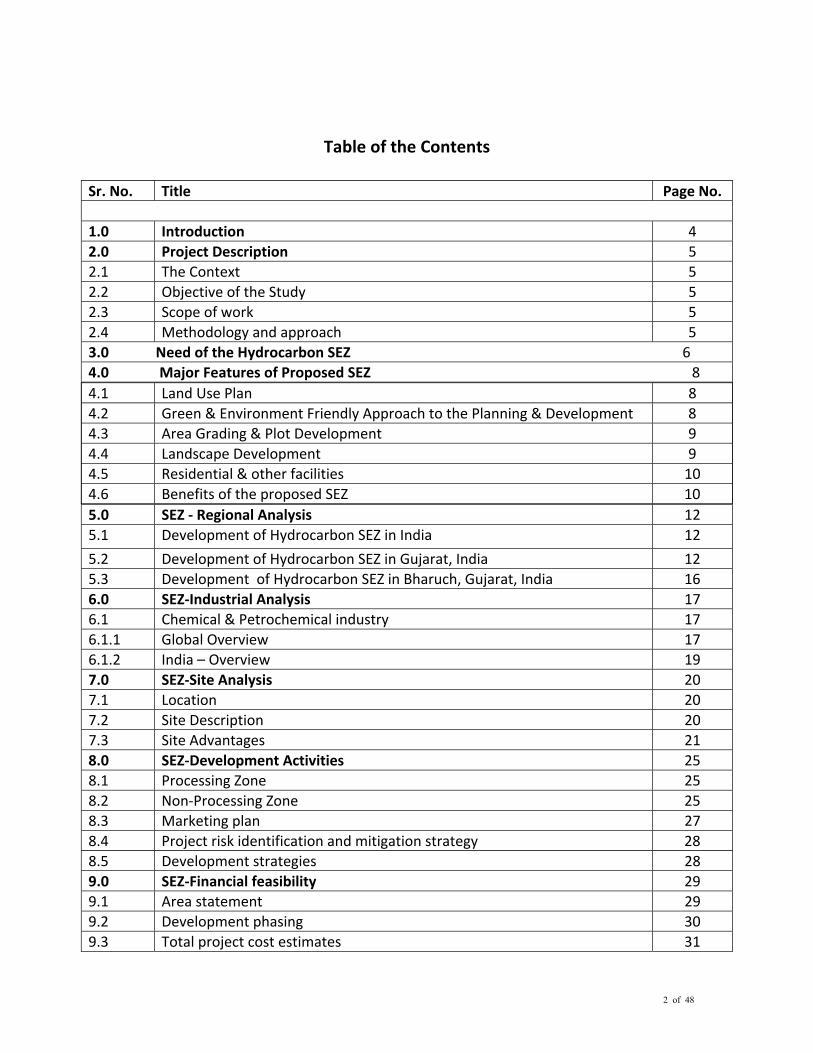
Table of the Contents
Sr. No. Title Page No. 1.0 Introduction 4 2.0 Project Description 5 2.1 The Context 5 2.2 Objective of the Study 5 2.3 Scope of work 5 2.4 Methodology and approach 5 3.0 Need of the Hydrocarbon SEZ 6 4.0 Major Features of Proposed SEZ 8 4.1 Land Use Plan 8 4.2 Green & Environment Friendly Approach to the Planning & Development 8 4.3 Area Grading & Plot Development 9 4.4 Landscape Development 9 4.5 Residential & other facilities 10 4.6 Benefits of the proposed SEZ 10
5.0 SEZ ‐ Regional Analysis 12 5.1 Development of Hydrocarbon SEZ in India 12
5.2 Development of Hydrocarbon SEZ in Gujarat, India 12 5.3 Development of Hydrocarbon SEZ in Bharuch, Gujarat, India 16 6.0 SEZ‐Industrial Analysis 17 6.1 Chemical & Petrochemical industry 17 6.1.1 Global Overview 17 6.1.2 India – Overview 19 7.0 SEZ‐Site Analysis 20 7.1 Location 20 7.2 Site Description 20 7.3 Site Advantages 21 8.0 SEZ‐Development Activities 25 8.1 Processing Zone 25 8.2 Non‐Processing Zone 25 8.3 Marketing plan 27 8.4 Project risk identification and mitigation strategy 28 8.5 Development strategies 28 9.0 SEZ‐Financial feasibility 29 9.1 Area statement 29 9.2 Development phasing 30 9.3 Total project cost estimates 31
3 of 48
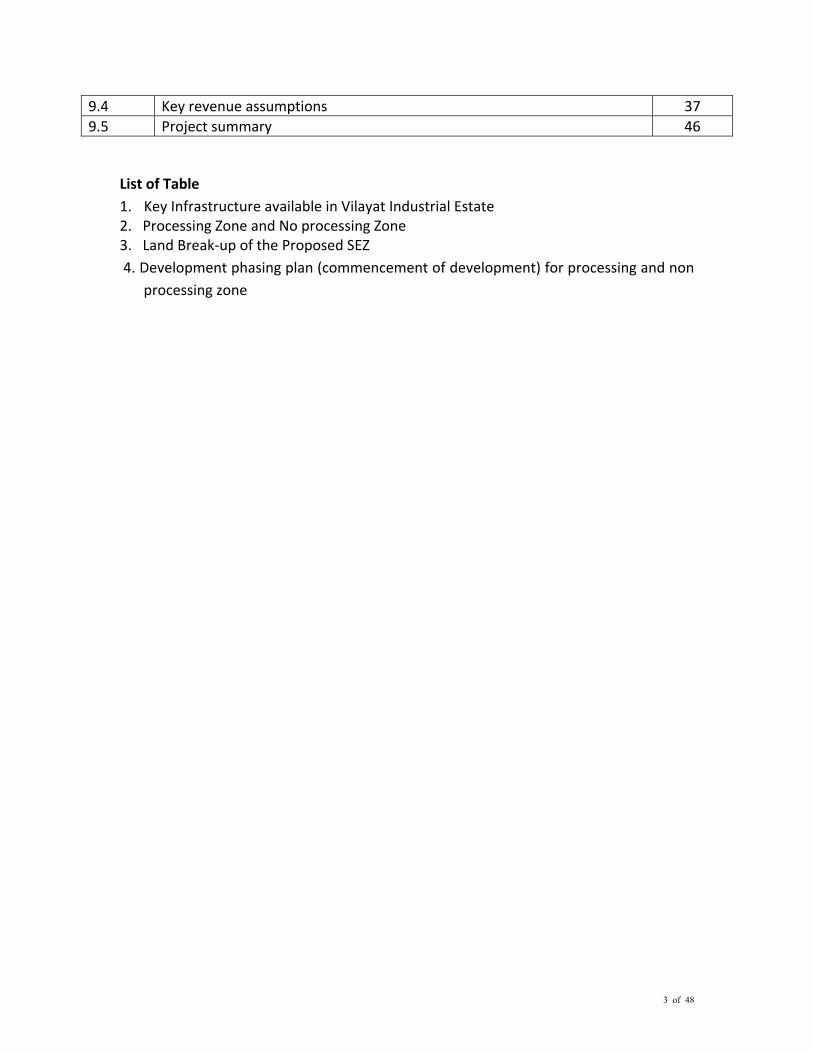
9.4 Key revenue assumptions 37 9.5 Project summary 46
List of Table 1. Key Infrastructure available in Vilayat Industrial Estate 2. Processing Zone and No processing Zone 3. Land Break‐up of the Proposed SEZ 4. Development phasing plan (commencement of development) for processing and non
processing zone
4 of 48
1.0 Introduction • The SEZ going to be developed by Gujarat Hydrocarbons and Power SEZ Limited
(GHPSL) is amongst the first dedicated Hydrocarbon SEZ in India.
• GHPSL proposes to develop the sector specific SEZ project with both foreign and domestic investors as financial or technical collaborators to the project. However, these investors will be introduced into the project on a need basis, depending upon requirements of the project.
• GHPSL, 100% subsidiary of Assam Company Ltd., is setting up India’s first integrated Hydrocarbon in the most investor friendly state Gujarat in India. GHPSL is conceived as One stop “world class” integrated sector specific SEZ for providing products and related services addressing the entire range of Hydrocarbons value and supply chain. GHPSL is designed to exploit the massive unfolding opportunities in this fastest growing sector of the Indian economy addressing the mismatch between the demand and supply. The project intends to attract investors in this unique Special Economic Zone project which will entitle them to several fiscal incentives. Infrastructure availability including power, water, natural gas, effluent treatment, etc. will provide the required impetus.
• GHPSL has acquired land and received formal approval for SEZ, Petroleum hydrocarbon. The operations are expected to commence in 2012, aiding a quantum jump in India’s Hydrocarbon infrastructure.
• SEZ is situated in Bharuch near Dahej which is the hub of Oil & Gas and Chemicals. The SEZ also falls within the boundary of PCPIR (Petroleum, Chemical & Petro‐chemicals Investment Region), are well connected with Road (National Highway), Railway (Delhi‐Mumbai Rail Line), Airport (National Airport at Vadodara 80 Km and International Airport at Ahmedabad, 180 Km), nearest All‐weather port‐ Dahej. These SEZ also falls onto the link of Dedicated Freight Corridors (DFC) a mega project started by Govt. of India, with collaboration from JICA (Japanese International Collaboration Agency) for augmenting to Dedicated High Speed Rail Link between Delhi and Mumbai.
• Any Petroleum hydrocarbon industry service that will support industry in the SEZ for manufacturing, stocking, trading including logistics and utilities with local linkages, and for which site is available as per the approved detailed Master Plan, will be eligible for being set up in the PCPIR.
• GHPSL has also signed MOUs with Gujarat Maritime Board and Gujarat Industrial Development Corporation for setting up Fabrication yard and Shipyard. GHPSL plans to facilitate export activities of the SEZ by adding their own captive jetty.

5 of 48
• The Company is actively scouting for right partners who wish to leverage the state‐of‐art infrastructure and facilities.
2.0 Project Description
2.1 The context Gujarat is known as the Petrochemical capital of India. Further, Gujarat has around 62 % of the petroleum hydrocarbon production capacity available in the India. As a result of strong support infrastructure and number of initiatives by state government; petrochemical and energy industries also have large presence in the state. GHPSL envisages tapping the potential existing in the state of Gujarat and thus proposes to develop sector specific SEZs in Gujarat targeted towards attracting tenants providing equipment and services to oil, gas, petro‐chemical and energy companies. 2.2 Objective of the Study
This study has been undertaken to evaluate the feasibility of the proposed development opportunities in line with the market dynamics. 2.3 Scope of work In line with our understanding of GHPSL‘s requirements, scope of work includes preparation of a feasibility report. 2.4 Methodology and approach Regional analysis (Gujarat overview): This section presents an overview of site‘s regional setting in terms of state and its surroundings which is necessitated in context of the SEZ development opportunities. Demographic, industrial/commercial, urban morphological structure and infrastructure advantages of the region impacting the subject development are presented in the section. Industry analysis: The section maps the recent developments in the global and Indian Petroleum Hydrocarbons industry. Site analysis: This section appraises the physical condition related to the said site and also presents an analysis of location and linkages. It also includes the advantage the state presents in context with the SEZ.
6 of 48
Project development model: Based on the analysis of the subject site vis a vis the potential development components, this portion outlines the development concept and configuration. Subsequently, a land use distribution and development phasing plan is drawn, based on inputs from industry analysis and GHPSL‘s investment objectives. Financial analysis and implementation roadmap: A detailed financial analysis of the proposed development is presented with implementation roadmap. The financial analysis includes revenue and cost projections of the proposed development mix.
3. Need of Hydrocarbon SEZ The petrochemical industry in India has been one of the fastest growing industries in the country. Since the beginning, the Indian petrochemical industry has shown an enviable growth rate. This industry also contributes largely to the economy of the country and the growth and development of manufacturing industry as well. Petrochemical cover basic chemicals like Benzene, Ethylene, Xylene and Propylene. The major components are the intermediates like MEG, PAN and LAB, etc., Synthetic fibers like Nylon, PSF and PFY. Polymers like LDPE/HDPE, PVC, Polyester and PET etc. and Synthetic Rubber like SBR, PBR. The petrochemical sector has a significant growth potential. Although the current per capita consumption of petrochemical is low, the demand for the petrochemical is growing. It is expected that domestic petrochemical sector will double its production capacity in next four five years. The Indian petrochemicals industry witnessed rapid growth in the last decade. Its petrochemicals production capacity has doubled from 2000 to 2010. India's rapidly growing economy has resulted in the growth of end‐use sectors such as automobiles, textiles and fibers. The increased consumption by these end use sectors has boosted the petrochemicals demand in the country. To meet this growing demand, several new petrochemical projects are being planned in India. It is expected that India's petrochemical capacity will increase by more than 50% in 2015. Government policies are also encouraging petrochemicals producers to set up new plants in sector specific Special Economic Zones (SEZs). This growth in capacity is lead by major petrochemicals producers. Demand of the petrochemicals generate from the downstream industries, which in turn are dependent on the state and growth of the economy. Indian economy is poised to grow 9.2% for the next few years. Thus, the demands for the petrochemical products are bound to be on the higher end. There are large numbers of growth drivers for exports in hydrocarbon sector from India, the industry faces competition from their Middle East counterparts due to lower energy cost advantage and integrated operations by major players in these countries.

7 of 48
Petrochemical industry is foreseen to benefit from the proposed SEZ due to rising capex in the global Petrochemical sector; strategic location of Gujarat providing connectivity to proved oil reserves; and SEZs legislation considering sale to other SEZs as exports and allowing unlimited sale to units in domestic tariff area. Further fiscal incentives by locating themselves in an SEZ would help in enhancing these benefits and this augurs in favor of petrochemical sector specific SEZ. The Indian petrochemicals industry shows no sign of slowing down, although it could come up against capacity constraints over the medium‐term, according to the latest India Petrochemicals Report. Indian demand for most petrochemicals products was strong in FY2010/11 (ending end‐March 2011) with polymers up by 10% y‐o‐y. Within the polymer sector, demand for polypropylene (PP) increased by 18% due to strong growth in automobiles, packaging and industrial applications. Growth in construction and agriculture led to 6% growth in polyvinyl chloride (PVC) sales, while home furnishings and textiles helped boost demand for polyester by 13%. Strong growth in the bottled water and packaging sectors led to a 24% rise in polyethylene Terephthalate (PET) consumption. In the year ahead, demand for polyethylene (PE) and PP is forecast to grow in double digits in 2012, with some grades, such as biaxially‐oriented polypropylene (BOPP) film for packaging, non‐woven PP and pipe grade PE expected to grow by more than 20%. In 2011, strong demand for low‐density polyethylene (LDPE) and linear low‐density polyethylene (LLDPE) film sucked in imports, while the country remains self‐sufficient in high‐density polyethylene (HDPE) over the short term due to plentiful capacity and relatively poor demand. The Indian petrochemicals industry has witnessed annual growth of around 14‐15% over the 2005‐2010 period and this double‐digit growth is likely to be sustained over the medium term. India is on course to become the third largest consumer market for high‐tech plastics after the US and China due to growth in the automotive industry, which is set to grow by more than 6% per annum. In the short term, the main engine of the economy – domestic demand – will be fuelled by rising private consumption and fixed investment levels, as well as the need to rebuild inventories, which should drive petrochemicals demand. Indian consumption of plastics is predicted to grow from 8mn tones in 2009 to 16mn tones by 2016 and 25mn tones by 2020, with a lower rate of growth than the 15‐16% seen in recent years. Nevertheless, this should prompt growth in the industry of 9‐10% per annum. Estimates for needed investment to cater for the increase in demand for plastics in 2010‐16 have been put at US$ 10 bn. Even when bearing in mind the delays and cancellations, India will host a rapidly expanding petrochemical industry. Seeing the global and Indian demand of Petrochemical products, to develop the hydrocarbon SEZ would be a boost to the petrochemical Industries.
8 of 48
4. Major Features of Proposed SEZ
4.1 Land Use Plan
Total land area proposed to be developed at this stage is 140 Hectares. Approximately 53.60 % area of total 140 Hectares is allocated to ‘Processing zone’ and balance area caters to ‘Non processing zone’. The balance area is used by infrastructure corridor/ green belt requirements within the Processing zone and Non Processing Zone. Planning recognizes and addresses the need for Phasing of total development. Facilities planned accordingly to manage the development in three phases. Varying operational conditions of different Hydrocarbons SEZ etc. – given due consideration in Planning & Phasing. An area statement giving complete details of land usage is attached with the Master Plan. Non processing zone is used to locate common infrastructure facilities as follows:
• Administrative Complex
• Club/ Guest House
• Training Centre
• Commercial complex to support SEZ activities
• Fire station
• Entrance Complex
• Green areas
• Roads
4.2 Green & Environment Friendly Approach to the Planning & Development
Large areas allocated as greens, water canals, lake and ‘right of way’ to avoid congested look of a normal industrial park. Clusters of green areas planned to have ‘healing’ effect for the users of this Industrial Park. Roads with well defined edges, signage, storm water drains and plantation along each side ‐ are proposed. Sensitivity to issues related to conservation of natural resources like water, energy, etc. and other issues like ecological balance, local culture and materials, etc. – at each stage of Planning & Development.

9 of 48
4.3 Area Grading & Plot Development The proposed site of the park is much lower than the state highway at the front (exact levels are not available in absence of survey reoprt). In order to bring the entire site up to road level, huge quantity of earth (approx. 38 to 40 lac cu.m.) will be required. Such huge volume of good quality earth may not be available in the vicinity of site and will be economically very expensive, even if it is available. Technically, apart from the issue of storm water disposal, the existing lower level may not have any other problems. Hence, it is decided to address the issue of Storm water disposal adequately but raising the level up to/ above state highway is not considered. In absence of survey report containing Contours showing existing ground levels and other details such as levels of surrounding roads, storm drains, etc. finished ground levels of the entire plot are not yet finalized.
4.4 Landscape Development Approx. 33% of the total land area, totaling to 46 hectare is provided for green belt development. Large open space at the center of the Park is the most prominent feature of the plan. Large areas of greens are also provided as buffer between roads and individual units. These features will provide a completely different environment to the users as compared to a conventional ‘industrial park’ look. These areas will have ‘healing’ effect for the people working in the Industrial units and can become relaxation/meeting places just next to their work place. The master plan defines a continuous strip of green belt along the periphery of the park. Similar continuous strip is provided all along the Ring Road. Landscape design is considered to be an integrated part of the Master plan design rather than an activity to be taken up at execution stage or to be patched up over the areas available after providing saleable plots. Landscape design for an area such as this park is not only about superficial beautification or fancy façade treatments. Addressing issues of conservation of Natural resources, harmonious co‐existence of industry – society‐nature, etc. will be central to the ecological approach required for landscape development of this project. Landscape design will also include study of the species of trees/plants compatible to local conditions, ease & economy of their maintenance, water use & conservation plan, organic waste management, etc.

10 of 48
4.5 Residential & other facilities During construction phase best facilities such as sanitation, fuel, restroom, etc. shall be provided to the Labour force and also to casual worker including truck driver during operation phase.

11 of 48
4.6 Benefits of the proposed SEZ
4.6.1 Foreign Direct Investments (FDIs) Project is expected to generate enough cash to fund its debt obligations from foreign investors (around 20% to 25%). But SEZ gives opportunity to have a foreign investor who can invest with Indian investor together or with government. This will be helpful to satiate capital desire of India. FDI is not like FII and lasts in India and may go out in the form of profits. FDIs through SEZ can help India in having improvements in people life. Amenities needed for certain industry, are get encouraged provided to industries situated in the particular SEZ.
4.6.2 Brings technology As foreign companies do invest in Indian companies which are located in SEZ, they bring their technology with them which is prevalent in their countries that can boost up Indian economic system. Still we are backward in technology. This will surely help to get updating of technology in various industries. Technological transfer through SEZ plays important role in Indian economy.
4.6.3 Faster growth As land, cheap labor, capital from India and investor and good managing skills are combined with technology and ready infrastructure is available through SEZ, there is chance of quick growth in Industrial and service sectors. As we are dependent on agriculture, with SEZ, we can strengthen industrial and service sectors. The proposed project is expected to be feasible as the estimated Project and Equity IRR of 18.82% and 20.98% respectively is greater than WACC and Cost of Equity of 14.50% and 18% respectively.
4.6.4 Growth of exports The products produced within the land of SEZ can be reached to the standard of exporting and every facility is provided in the SEZ helps boost up exports. With growing of exports, we can gain foreign exchange reserves and can be out of balance of payment crisis. Through this, we can successfully face the competition from most technologically developed countries as we have adopted technology. We have cheap labor and if we have good technology, we can surely have good exports.
12 of 48
4.6.5 Employment As SEZ are growing, there is chance of employment in those industries set up in the SEZ. People can be diverted from agriculture and take part in the process and there is chance of technically educating people. M/s Gujarat Hydrocarbons and Power SEZ Ltd. will give direct employment to about 3000 employees. In addition to direct employment, indirect employment (approximately 8000) shall generate ancillary business to some extent for the local population.
4.6.6 Growth of industrialization SEZ gives impetus to industrial growth. There needs to be a harmonious growth between sectors. The role of SEZ in Indian economy is appreciable one. 4.6.7 The State Economy In the post‐liberalization period, Gujarat has pioneered the concept of involvement of private sector in the development of infrastructure. The State has constituted a mechanism of single window clearance in the form of Gujarat Infrastructure Development Board (GIDB), headed by Hon’ble Chief Minister. Concession agreements are finalized in a transparent manner. GIDB had prepared a detailed Master Plan. "Infrastructure Agenda ‐Vision 2010", laying down 383 projects estimating an investment of Rs. 1,16,993 Crore. Almost 70% of the investment is envisaged to come from private sector Blue prints for development of power generating plants, ports, roads, a common gas grid, industrial parks, urban infrastructure, airports.

13 of 48
5.0 SEZ‐Regional Analysis
5.1 Development of Hydrocarbon SEZ in India
• Policies of Government of India are also encouraging petrochemicals producers to set up new plants in sector specific Special Economic Zones (SEZs). This growth in capacity is lead by major petrochemicals producers.
• Government has put in place a national policy on petrochemicals and has initiated steps to create mega integrated complexes called petroleum, chemicals and petrochemicals investment regions (PCPIRs). These PCPIRs will be set up in a 2,000 sq km area with an estimated investment of US$ 280 bn. As 100% FDI is permissible in chemical industry, this should provide a boost to the sector. It is expected that domestic petrochemical sector will double its production capacity in next four five years.
• There are large numbers of growth drivers for exports in hydrocarbon sector from India, the industry faces competition from their Middle East counterparts due to lower energy cost advantage and integrated operations by major players in these countries.
• India is opening up as one of the most exciting regions for petrochemical in the world and is set to become a potential exporter in this multi‐billion dollar industry.
• India is the 4th largest consumer of petrochemical in 2011 and is predicted to become the 2nd largest by 2030.
• The Indian petrochemical sector has, on an average, grown at a rate of 13% per annum, which is more than double the growth of the gross domestic product (GDP).
• The Indian petrochemical sector generates a turnover of INR210 billion (US$4.58 billion) and is vital to the economy.
5.2 Development of Hydrocarbon SEZ in Gujarat, India 1. Robust Infrastructure • Airports There are 11 airports under the operational jurisdiction of Airports Authority of India (AAI), including one international airport located at Ahmedabad, connecting Gujarat with key cities across USA, EU, Asia, as well as with other Indian metropolitan cities. • Roads 71% of the road network in the state is surfaced. Total road length is 73,619 kms and total length of railways is 5,186 kms (8.20% of India).

14 of 48
• Dedicated Freight Corridor Government of India plans to develop a Dedicated Freight Corridor (DFC) linking Delhi, Mumbai, Kolkata and Chennai. Gujarat accounts for 38% (564 km) of total DFC length (1,483 km). The influenced area of 150 km on either side of DFC is being developed as “Delhi Mumbai Industrial Corridor” (DMIC). • Rail and Road 71% of the road in the state is metalled or surfaced. It has state‐of‐the‐art road infrastructure such as India‘s first national expressway from Ahmedabad to Baroda with a total road length of 74,111 Km. Additionally, Golden quadrilateral and Delhi Mumbai Industrial Corridor is expected to improve the connectivity of the region. • Power The current per capita electrical energy consumption in Gujarat is approximately 1350 units, which is double of the national average. Currently Gujarat has 32 power plants with a total installed generation capacity of 13,566 MW (as in February‘10) which is estimated to rise to 25,000 MW by 2012. Of the total installed capacity, power generation through thermal energy accounts for 10,590 MW, power from nuclear energy accounts for 560 MW whereas power from hydro renewable energy and other renewable energy sources account for 772 MW and 1,643 MW respectively. • Gas The State has significant amount of natural gas resources available and is home to India‘s first LNG Terminal located at Hazira and Dahej. Gujarat Gas supplies 9.2 lakh standard cubic meters (scm) per day of natural gas to over 1,07,611 domestic households, 1,486 commercial and 372 industrial customers. Gujarat Adani Energy Limited (GAEL), an Adani group company is planning to supply gas to Vadodara and Ahmedabad. The pipelines of Gujarat State Petronet Limited (GSPL) supply gas to 13 districts and 5 more districts are proposed to be connected by the pipeline. Total length of integrated gas grid supplying gas to all districts is 2,200 km, of which 1,200 km is complete and 800 km is under construction. The company plans to cater to industrial consumers in Vadodara and residential and commercial users in Ahmedabad. Infrastructure initiatives: Gujarat Industrial Development Board (GIDB) has taken various steps regarding implementation of infrastructure projects. • The concession agreement for Gujarat State Wide Area Network and Info city has
been approved by GIDB and the projects are implemented. • GIDB, in partnership with Ministry of Railways and Rail Vikas Nigam Limited, is in the
process to develop and strengthen integrated railway network in the State. An SPV

15 of 48
in the name of Kachchh Rail Co. Ltd. has been incorporated to undertake Gandhidham ‐ Palanpur gauge conversion project. Similar exercise is being carried out for Dahej ‐ Bharuch Rail Link and for providing new broad gauge rail link to Hazira Port.
• Gujarat is the only State to propose interlinking of rivers and an extensive water grid network across the State. This network would involve majority of the river and its tributaries in the state. The water proposed to be covered by the grid by 2010.
• Gujarat offers excellent connectivity through airport, rail and road. Education infrastructure Gujarat has five of the country‘s top post‐graduate institutes and is becoming a key educational hub. In the endeavour to make the state an exclusive destination for higher education in India, the total number of seats for higher education (MCA and ME, MBA and allied, Degree and Diploma engineering) in the state has increased from 19,098 in 2001‐02 to 50,862 in 2008‐09. Apart from a management institute of global repute viz the Indian Institute of Management (IIM‐Ahmedabad), the state also has number of institutions focusing on hydrocarbon sectors. A petroleum university has been established near Gandhinagar in collaboration with Gujarat Energy Research and Management Institute (GERMI) and Gujarat State Petroleum Corporation Ltd. (GSPC). The university has the following institutes offering courses in petroleum engineering, chemical engineering, mechanical and instrumentation and control engineering. • Institute of Petroleum Technology, Gandhinagar • Research and Innovation Center, Gandhinagar • Institute of Petroleum Management, Gandhinagar • Executive Training and Development Center, Gandhinagar 2. Excellent Port Connectivity • Gujarat has the longest coastline measuring 1600 kms and is the maritime gateway
to Middle –East, Africa and Europe. • The state has 41 ports which include 1 major ports and 40 no major ports. • Ranks first in terms of Cargo amongst all Indian ports. • Has highest number of operation ports and commercial cargo ports. • The total port capacity of Gujarat grew more than three times, from 45 MMT in
1995 and 197 MMT in 2006‐07. • Port infrastructure like captive terminal, direct burthing port, rail linkage, private
sector port and private jetties exhibited considerable growth in the region. 3. Strategic location • Situated on the west coast of India, Gujarat is one of the leading industrial states of
the country. • Covers a geographical area of 1,96,024 sq km and accounts for 5.96 % of the total
area of India. • Has proximity to Mumbai, the financial capital of India.

16 of 48
• Is gateway to the rich, land‐locked northern and central hinterland. • Has access to all the major port‐based countries such as UK, Australia, China, Japan,
Korea, Gulf region etc. • Has the longest coastline of 1600 kms in the country. 4. Thriving industrial state • Has demonstrated high industrial growth of 12.5% in the last 5 years. • Is home to over 800 large industries and 320,000 Micro, Small & Medium
Enterprises. • Has reported an annual average growth of 9% in the last 3 years. • During the same period, has posted an average industrial growth of 15%, higher
than other states. • Has been the ideal destination for several leading MNCs, including BASF, Bayer,
DuPont, GE Plastics, Solvay, Cairn Energy, Shell, British Gas, Huber etc. • Accounts for 25.8% of the country's total investment. • Contributes 15.59% to the total value of output added by the manufacturing sector
of the country. • Petroleum accounts for the highest (34%) industrial production in Gujarat. • Has extensive presence across industrial sectors – Chemicals & Pharma, Petroleum,
Engineering Industries, Food Processing, Textiles & Apparel, Metallurgical Industries, Mineral‐based Industries.
5. Strong base in Hydrocarbons and Energy sectors • Is home to India’s first LNG Terminal located at Hazira. Another LNG terminal is
located at Dahej. • Has the distinction of statewide uninterrupted power supply. • Only state to have statewide integrated gas grid. • Ranks 3rd in installed capacity of power generation in India. 6. Considered the oil & gas capital of India, Gujarat: • Has oil and gas fields in abundance, with production in progress since 1960. • Ranks 1st in production of crude oil (onshore 55.1%) and natural gas (onshore
32.3%) in India. • Has the highest number of gas fields (onshore and offshore) in India (31.3%). • 36.6% of India’s refining capacity is in Gujarat – the highest in India. • Has the largest grass‐root refinery in Asia‐Pacific. • Is the only state with an extensive transmission network almost 1,200 km of gas grid
is in operation, 800 under construction, and expansion of 200 km is planned. 7. Known as the chemicals & petrochemicals hub of India, Gujarat • Has a booming chemicals and petrochemicals industry, which is one of the fastest
growing sectors in the state’s economy.
17 of 48
• Contributes to more than 51% of Indian production of major chemicals, with revenues at more than approx Rs. 12,000 Crore.
• Produces 13,048 tones of petrochemical products and also contributes around 62% to the total production of the country.
• Contributes 15% of the total national chemical exports. • Has eight chemical clusters, 14 industrial estates and three SEZs which are primarily
dedicated to the chemicals and petrochemicals industry. 5.3 Development of Hydrocarbon SEZ in Bharuch, Gujarat, India • Bharuch is located in the southern part of Gujarat, near the Gulf of Khambhat in
Arabian Sea. • Dahej Port, operated by Gujarat Maritime Board (GMB), has made significant
contribution to facilitate industrial growth in the district. • Excellent port connectivity with the presence of Dahej port makes it an investment
destination in port & shipbuilding activities. • Centrally located within the industrial belt, Dahej is an ideal location in Asia to serve
north, west and central India and international destinations such as, Middle East, Africa, Europe and North America.
• The district has a large number of industrial estates and Special Economic Zones (SEZs).
• Vilayat Industrial Estate falling within the zone of proposed PCPIR (Petroleum, Chemical & Petro Chemical Investment Region.

18 of 48
6.0 SEZ‐Industrial Analysis
6.1 Chemical & Petrochemical industry
6.1.1 Global Overview Petrochemical industry profitability has historically been cyclical. Changes in supply and demand and resulting industry utilization levels are key factors that influence the cycle and profitability of the sector. Additionally, the sector is highly capital intensive, which further contributes to the cyclicality. Capital spending cycles typically follow periods of sustained high profitability and as a consequence new investments in capacity tend to be executed over the same period, resulting in over supply and a period of lower profitability. The industry exhibited an improvement in 2010 after a dramatic slump in demand in 2009, following the onset of the global economic slowdown. This improvement was driven by a faster pace of recovery in the Asia Pacific markets. Additionally, a level of inventory restocking has also been taking place as buyers look to replenish previously depleted stock levels. The short term outlook of the industry remains under pressure as further capacity additions are expected in the short‐term. However, we expect a gradual recovery in utilization rates and industry margins to continue throughout 2011. Industry margins are forecasted to climb to a new cyclical peak in around 2015, with returns comparable to those seen in the last major peak in 2006/7. Within this context, Asia Pacific will represent the most attractive market in terms of growth and profitability and will be a key driver for profitability of the global petrochemical sector. The global chemical market by industry segment is indicated in the figure alongside. Petrochemical segment including bulk petrochemicals, organics, polymers, synthetic rubber and manmade fibers constitute the largest segment (USD 825 billion) of chemical industry accounting for almost 33% share of the global market in 2010. Out of this almost 53% is accounted by bulk petrochemicals and organics and the balance 47% by polymers, synthetic rubber and manmade fibers. Polymers including HDPE, LDPE, LLDPE, PP, PS, PVC etc constitute major segment of petrochemicals globally estimated at 170 million ton capacity. Among the building blocks the major share is with Ethylene followed by Propylene, Benzene and Para‐ xylene. The petrochemical end products from those plants include products such as plastics, soaps, detergents, solvents, paints, drugs, fertilizer, pesticides, explosives, synthetic textile fibers and rubbers, flooring and insulating materials and much more. Petrochemicals are found in common consumer products such as aspirin, cars, clothing, compact discs, video tapes, electronic equipment, furniture, and a great many others. The current world production capacity of major petrochemicals is depicted in the figure below.
19 of 48
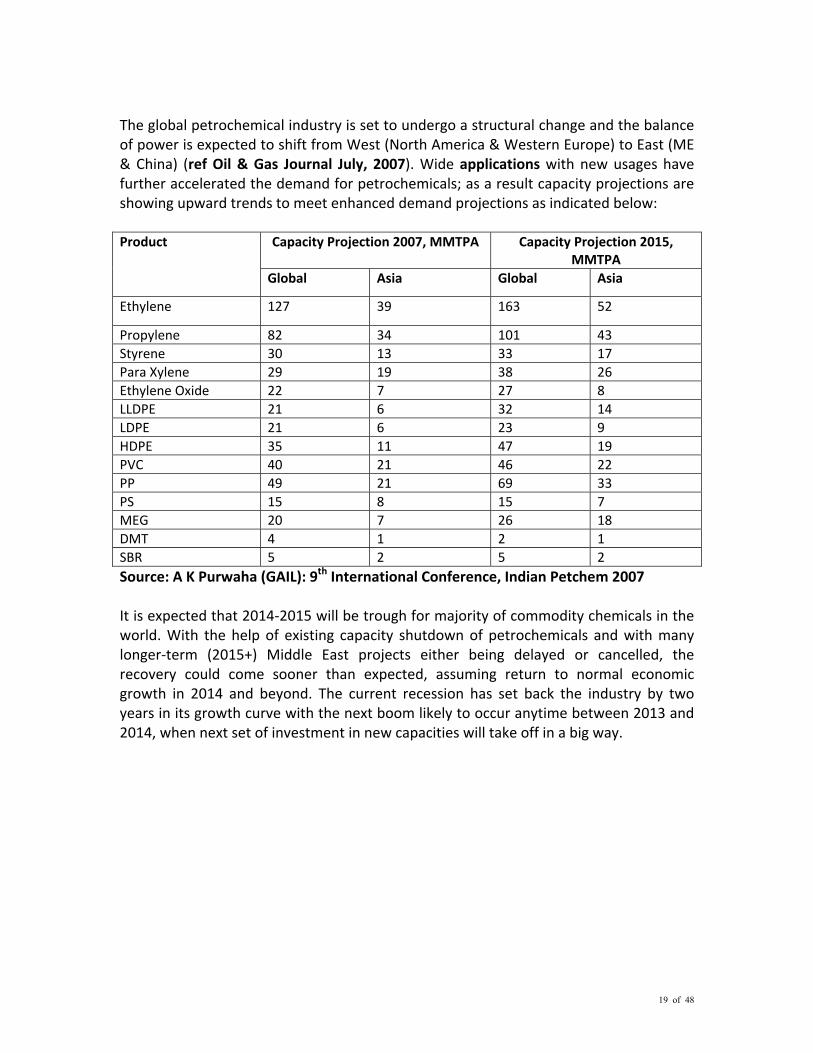
The global petrochemical industry is set to undergo a structural change and the balance of power is expected to shift from West (North America & Western Europe) to East (ME & China) (ref Oil & Gas Journal July, 2007). Wide applications with new usages have further accelerated the demand for petrochemicals; as a result capacity projections are showing upward trends to meet enhanced demand projections as indicated below: Product Capacity Projection 2007, MMTPA Capacity Projection 2015,
MMTPA Global Asia Global Asia
Ethylene 127 39 163 52
Propylene 82 34 101 43 Styrene 30 13 33 17 Para Xylene 29 19 38 26 Ethylene Oxide 22 7 27 8 LLDPE 21 6 32 14 LDPE 21 6 23 9 HDPE 35 11 47 19 PVC 40 21 46 22 PP 49 21 69 33 PS 15 8 15 7 MEG 20 7 26 18 DMT 4 1 2 1 SBR 5 2 5 2 Source: A K Purwaha (GAIL): 9th International Conference, Indian Petchem 2007 It is expected that 2014‐2015 will be trough for majority of commodity chemicals in the world. With the help of existing capacity shutdown of petrochemicals and with many longer‐term (2015+) Middle East projects either being delayed or cancelled, the recovery could come sooner than expected, assuming return to normal economic growth in 2014 and beyond. The current recession has set back the industry by two years in its growth curve with the next boom likely to occur anytime between 2013 and 2014, when next set of investment in new capacities will take off in a big way.
20 of 48
6.1.2 India – Overview Despite certain pricing/tariff challenges and competition from Middle East and other countries, India‘s exports of petrochemicals have been growing at 15% per year. Also, the imports to India are expected to reduce with proposed global size projects in several petrochemical segments. The fundamental drivers for petrochemical industries in India are primarily based on strong domestic demand, emerging potential for exports in select commodities and need for substituting imports with domestic production. India‘s per capita consumption of polymers at about 4 kg (world average 24 kg) and fibers at about 1.4 kg (World average 5 kg) is amongst the lowest in the world providing ample scope for realizing the potential of the petrochemical industry. India has not been able to realize its full potential primarily on account of supply side constraints as the investment involved in intermediate industries is very high, capacities are generally sub optimal and the feed stock availability is limited. India today is a net importer of petrochemicals with around 20% to 25% of the country‘s requirement of petrochemicals (INR 20,000 crore/year) being met through imports, and it has been growing at almost 23% annually over the last 5 years. Proposed global size projects in several petrochemical segments are expected to reduce the reliance on imports. In the case of exports, India has considerable potential for growth in various downstream petrochemicals despite competition from Middle East and other countries. Despite certain pricing/tariff challenges faced by the industry, India‘s exports of petrochemicals have been growing at 15% per year. Overall, India contributes to 1.5% to 2% of the share of the global export basket in downstream petrochemicals as against China‘s 28% to 30% share. Indian government is taking active interest in promoting development of petrochemical industry. Its role has changed from industry regulator to facilitator. GOI in order to promote global investment in Petrochemical sector has come out with the concept of Petroleum, Chemicals and Petrochemical Investment Regions (PCPIRs), which will provide large‐scale sites with sufficiently upgraded infrastructures to attract investment for chemical and petrochemical production. Despite great potential, Indian Petrochemical industry has not been able to realize its true potential in the past due to capacity constraints and poor infrastructure. Chemical and petrochemical attract almost 10% share of the total investment in the country. As a result of large and fast growing domestic markets, growing feed stock availability by virtue of new refineries and petrochemical complexes, easy availability of low cost skilled manpower, lower capital cost (almost 0.8 times the global costs), favorable investment policies and state of art SEZ infrastructure, India is expected to be in a

21 of 48
favorable position to attract large investments in petrochemical field and has the potential to be a major refinery and petrochemical hub in Asia.
7.0 SEZ‐Site Analysis
7.1 Location
Being a part of Vilayat Industrial estate the subject site is well served by basic infrastructure such as power and water and hence, reducing the development cost. The project is also well connected domestically and internationally through airport, rail, road network and ports. The site is within 100 km of the two prominent cities of Gujarat i.e. Surat and Vadodara. Airport in Vadodara, approximately 80 km is the nearest airport. Dahej port, approximately 27 km from the site is developed as an all weather port for large ocean‐going vessels is at a location two km from the shore, where the requisite depth of 18 m is available. Though the port is being developed for handling industrial cargo, it is the only port in India to be equipped with a chemical terminal operated by Gujarat Chemical Port Terminal Company. Major factors involved in the Support Facilities in this Location are listed below:
• Site is very well connected by Vagra road – 3 KM • Availability of sufficient land • Availability of power evacuation facilities ‐ GEB • Availability of water for industrial use – GIDC Water Supply • Availability of Natural gas & nearness to the Gas pipeline Modern infrastructure
support. • Availability of Raw Materials
7.2 Site Description The subject site is a part of the Dahej PCPIR and thus the site neighborhood is primarily characterized by hydrocarbon and refinery units. PCPIR, a specifically delineated investment region with an area of around 250 square kilometers planned for establishment of manufacturing facilities, associated services and infrastructure for promotion of petroleum, chemical and petrochemicals industry in the region. As per information from representatives of GHPSL the subject site admeasures around 140 hectares (346 acres) apparently has no major gradient. However, it is recommended to be confirmed through appropriate topographical surveys. The said site is marked with sparse vegetation and a few trees, and the fencing work has been completed. Subject site is irregular in shape and is accessible through GIDC sector road. As per GHPSL officials, lease deed has been executed with GIDC for the said land. Notification from Board of Approvals has been obtained for the sector specific SEZ for Petroleum hydrocarbon.

22 of 48
7.3 Site Advantages The subject site being part of GIDC industrial estate already has a robust basic infrastructure support in terms of road, power, water, communication and sewage disposal. Physical infrastructure (power, water, existing roads and other trunk services) The subject site has well developed physical infrastructure support in Vilayat Industrial estate well served by basic infrastructure along with support structures such as storage sheds etc. The proposed SEZ site is situated en‐route the Dahej – Ankleshwar water pipeline which has a capacity of 94.6 million liters per day (MLD). The industrial estate has an on‐site Effluent treatment plant connected to Dahej via a 53 kilometers long effluent conveyance pipeline with a carrying capacity of 90 MLD for efficient transportation and disposal of effluent. The industrial estate at Vilayat also consists of a dedicated hazardous waste disposal site. It has an established drainage network as well as road layouts with operational street lights. Uninterrupted power supply to the site is ensured by an existing 220 KVA transformer. Moreover, developing a SEZ at Vilayat Industrial Estate also implies that the developer has an automatic permission to set up one 500 MW gas based power plant. Table: 1 Key Infrastructure available in Vilayat Industrial Estate Features Details Mean Elevation The elevation of the contours of the site varies between 10
m to 18 m above MSL. Communication Reliable telephone, telex and fax services Road network 15 km of four lane road network within estate Water 36 MLD filtered supply system from River Narmada Power One 220 / 66 KV and one 66 / 11 KV sub station under
construction Sewage Treated effluent collection and disposal system of 36 MLD Port Dahej – 25 Km Airport Vadodara & Surat ‐100 Km (Domestic Airport)
Ahmedabad – 175 Km (International & Domestic Airport) Nearest Town/City Bharuch ‐17 Km Hazardous Waste disposal Facility (TSDF)
Ankleshwar – 40 Km
23 of 48
Social infrastructure (institutional, hospitals, educational institutes, sports and entertainment complexes) The nearest urban settlement at Bharuch is about 17 kilometers from Vilayat. The city has well established social infrastructure with adequate health, education and recreational facilities. Reportedly, there are over 35 hospitals in Bharuch, having a capacity of more than 750 beds and approximately 105 dispensaries. On considering nursing homes the bed supply is augmented by approximately 185 beds. Further, there are about 150 beds available under specialized tuberculosis (TB) clinics. Basic education in the city is catered by approximately 25 senior secondary and around 20 secondary schools. Further, there are around 80 primary schools and 165 adult education centers. A law college and a commerce college offer graduate level education in the city. There is one more general college along with three polytechnics. Bharuch is well served by entertainment and recreational facilities. There are three stadiums in the city as well as five auditoriums. There are four cinema halls and equal number of public libraries offering a variety of recreational and entertainment choices to the residents of the city. Connectivity:
Dahej Port to Vilayat our location : 25 Km
Nearest International Airport : Ahmedabad 175 Km
Extensive connectivity ‐ Road, Rail, Air & Port
Road Connectivity :
1. Connected to NH‐8‐Ahmedabad‐Mumbai and State Highway.
2. Direct road connectivity to the nearest railway tract and port.
3. Arterial roads connecting the SEZ to the National Highway and Expressway.
Rail Connectivity : Nearest Rail Station – Bharuch ( 17 Kms)
Airport Connectivity : Vadodara (100 kms).
Port Connectivity : Dahej (all‐weather port).
Topography of the site:
The land is flat. The topography of the land is flat, so that there is no change in Drainage
pattern at project site.

24 of 48
Location of the Project Site

25 of 48
Layout of the Proposed SEZ
26 of 48
8.0 SEZ ‐ Development Activities The subject SEZ is planned to accommodate export oriented industrial units involved in manufacturing, trading, processing and servicing the petrochemical sector in the processing zone (PZ). Hence, in line with GHPSL‘s vision to serve a broader objective of assisting India‘s growth in petrochemical sector, a larger portion of the SEZ admeasuring 140 hectares (346 acres) is attributed to the processing zone. Thus, 54% of the aggregate site is allocated to the processing zone which translates to approximately 75 hectares (185 acres). Balance 54% of the SEZ, i.e. approximately 75 hectares (185 acres) is proposed to accommodate the support infrastructure in the non processing zone primarily comprising the support infrastructure for the processing zone viz. residential, retail, commercial office, hospitality and recreational. Processing zone and Non Processing Zone of SEZ is given in Table – 2 and Land Break‐up of the SEZ is given in Table ‐ 3. 8.1 Processing Zone: GHPSL envisages developing plots in the processing zone and offering them in various sizes to the prospective tenants. These plots will be targeted towards industries with requirements of campus like facility, as in the case of manufacturing plant, factory or a facility for the service industry. Here the tenants for the manufacturing units could be industries involved in manufacturing products / equipments used in the entire value chain of the petrochemical sector such as additives, Polypropylene derivatives, PTA, PET, styrene, synthetic chemicals etc. These primarily constitute of service based industries related to R&D, IT/ITES, data processing, and other services integral. The units in the processing zone will be offered developed plots on long term lease. Tenants could build structures as per their specification and requirement. Support infrastructure facilities such as water supply, power, telecommunication, etc., would be provided for these plots by the government agencies. However, GHPSL will take up the responsibility of laying necessary infrastructure for these services. The SEZ is anticipated to attract lager units / players as anchors with smaller ancillary units to create an integrated petrochemical cluster. 8.2 Non Processing Zone: The industrial units in the processing zone being predominantly export oriented are envisaged to witness significant movement of business traveler. Vilayat currently lacks quality residential infrastructure and support neighborhood functions. Nearest town Bharuch is approximately 17 km from Vilayat and is also devoid of good quality retail, housing hospital and hospitality facilities. The deficit of development in neighboring areas necessitates provision of such facilities within the subject SEZ. Non processing
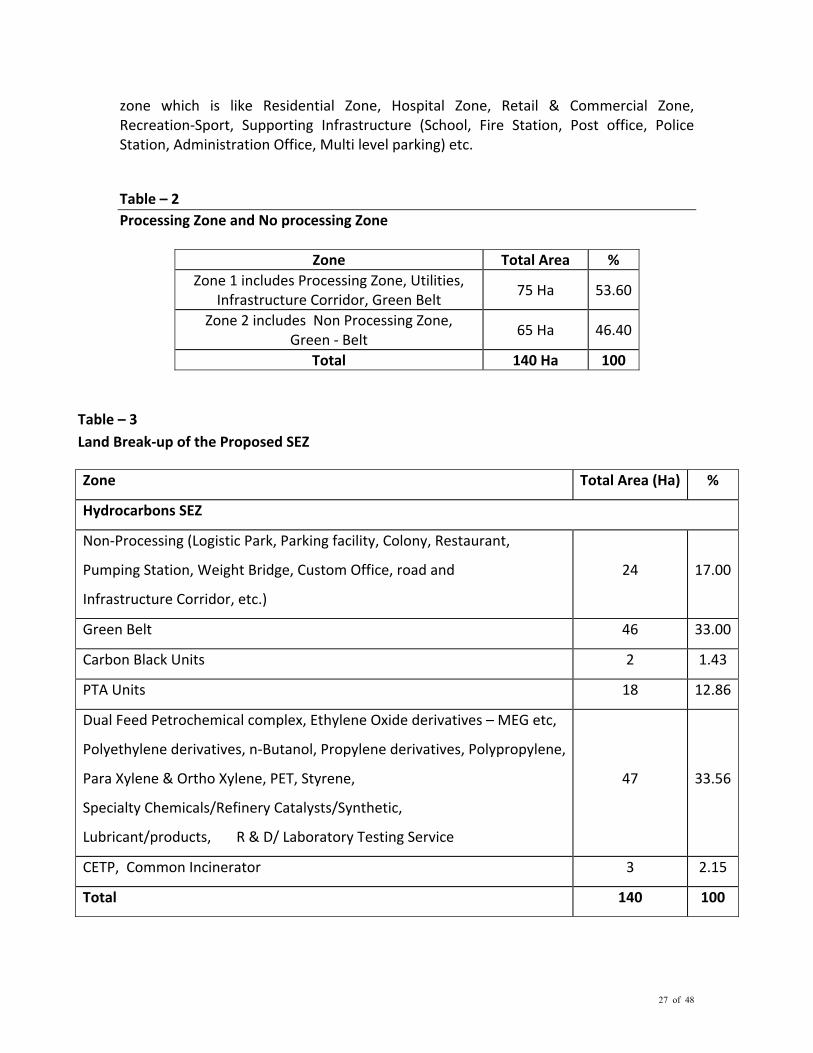
27 of 48
zone which is like Residential Zone, Hospital Zone, Retail & Commercial Zone, Recreation‐Sport, Supporting Infrastructure (School, Fire Station, Post office, Police Station, Administration Office, Multi level parking) etc. Table – 2 Processing Zone and No processing Zone
Zone Total Area % Zone 1 includes Processing Zone, Utilities,
Infrastructure Corridor, Green Belt 75 Ha 53.60
Zone 2 includes Non Processing Zone, Green ‐ Belt
65 Ha 46.40
Total 140 Ha 100
Table – 3 Land Break‐up of the Proposed SEZ
Zone Total Area (Ha) %
Hydrocarbons SEZ
Non‐Processing (Logistic Park, Parking facility, Colony, Restaurant,
Pumping Station, Weight Bridge, Custom Office, road and
Infrastructure Corridor, etc.)
24 17.00
Green Belt 46 33.00
Carbon Black Units 2 1.43
PTA Units 18 12.86
Dual Feed Petrochemical complex, Ethylene Oxide derivatives – MEG etc,
Polyethylene derivatives, n‐Butanol, Propylene derivatives, Polypropylene,
Para Xylene & Ortho Xylene, PET, Styrene,
Specialty Chemicals/Refinery Catalysts/Synthetic,
Lubricant/products, R & D/ Laboratory Testing Service
47 33.56
CETP, Common Incinerator 3 2.15
Total 140 100
28 of 48
8.3 Marketing Plan A detailed program for actual implementation and approach to the target audience will be made with the aid of experts in the field.
• A comprehensive promotion brochure cum presentation aimed at potential tenants highlighting India in general and the subject SEZ in particular as the most preferred destination to invest and operate shall be projected. The key benefits offered in general and in the subject SEZ in particular will be emphasized.
• It is proposed that road shows be conducted in select cities of Europe, USA, Middle East, Singapore, Japan etc to promote the subject SEZ.
• Presentations / road shows to be made at apex level bodies / association / chambers representing industries in India such as CII, ASSOCHAM and FICCI etc. The top 50 business houses in relevant sector shall be approached and persuaded to set up base in the SEZ.
• Special sector focused presentations shall be prepared and presented to members of associations representing relevant sectors.
Key initiatives • Sponsorships/ events
To identify, evaluate and select appropriate platforms to sponsor the event keeping in view the synergy with its brand and the target audience. Sponsorships shall be provided so as to increase the awareness among the target segment, • Corporate advertisements
Corporate advertisement would be done as well as project related advertisements in appropriate mediums like magazines, newspapers, websites etc. One can also identify specific niche magazines for advertorials. • Public relations
To build public relations it could tie up with leading English newspapers and leading national and international business channels for feature program /feature columns. This would enhance the coverage and image of the subject SEZ.

29 of 48
8.4 Project risk identification and mitigation strategy: Potential risks associated with the project implementation have been identified and mitigation strategy has been proposed below: Risk Risk transfer and mitigation measures
Time overrun Risk
The risk is expected to be mitigated by contracting with reputed consultants and contractors who have successfully carried out such scope of work. Components of construction shall be regularly monitored for conformity of time schedules. Reputed project management consultants can be engaged to ensure the timely implementation of project. Moreover contracts shall have suitable penalty clause to ensure compliance to the timelines.
Cost overrun Risk
This risk can be mitigated by regular and strict monitoring for compliance of time schedules by the consultants / contractors. The budget estimates have been prepared in a conservative manner. A contingency of 5% on the construction cost has also been built in.
Market Risk This risk can be mitigated by phased development and staggered supply of plots and built up spaces. The market off take can be increased by improved and innovative marketing strategies.
Operational Risk
This risk can be mitigated by recruiting qualified personnel’s to manage the project. Tight management control and cost cutting measures shall be undertaken.
8.5 Development strategies: Implementation timeline of the project is drawn after considering the size of the project, development complexity and market opportunities 2019 Development Plan Sr. No.
Year Development
1 2011 ‐2013 Approvals, Master Planning, Financial Closures, etc. 2 2011 ‐2013 Fencing, Site Development and landscaping 3 2013‐2015 Utilities 4 2012‐2017 Sale of industrial land parcels 5 2012‐2018 Construction of Non Processing 6 2013 ‐2019 Sale of Residential Units
2012 2012
30 of 48
• Development is to be done in phases to prevent inventory buildup and lock in of capital.
• Industrial space is planned to be developed first as it would be the key commercial driver of the development.
• Development of non‐processing zone may be aligned to the development of industrial space to provide support infrastructure for prospective workforce.
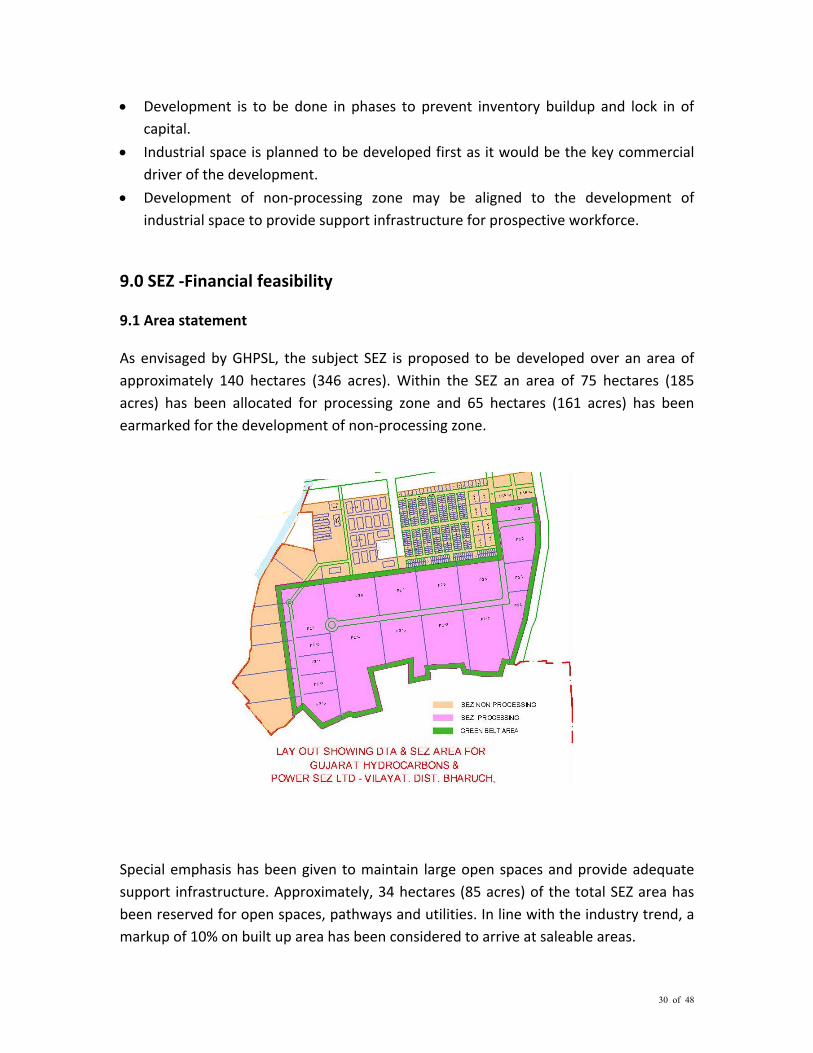
9.0 SEZ ‐Financial feasibility 9.1 Area statement As envisaged by GHPSL, the subject SEZ is proposed to be developed over an area of approximately 140 hectares (346 acres). Within the SEZ an area of 75 hectares (185 acres) has been allocated for processing zone and 65 hectares (161 acres) has been earmarked for the development of non‐processing zone. Special emphasis has been given to maintain large open spaces and provide adequate support infrastructure. Approximately, 34 hectares (85 acres) of the total SEZ area has been reserved for open spaces, pathways and utilities. In line with the industry trend, a markup of 10% on built up area has been considered to arrive at saleable areas.
31 of 48
9.2 Developing Phasing • Land has been acquired for the project and land development is under progress.
• Boundary wall is expected to be completed in CY 2012. Development of the SEZ is planned to commence in CY 2012.
• Development of all the assets in the processing and non‐processing areas is proposed to be phased over a period of 8 years. While the land in the processing zone is proposed to be developed in CY 2013. Construction for assets in NPZ is planned to commence in phases from CY 2013 and complete by CY 2018 years.
• Each asset of the Non‐processing zone is estimated to be constructed in 2 years from its commencement.
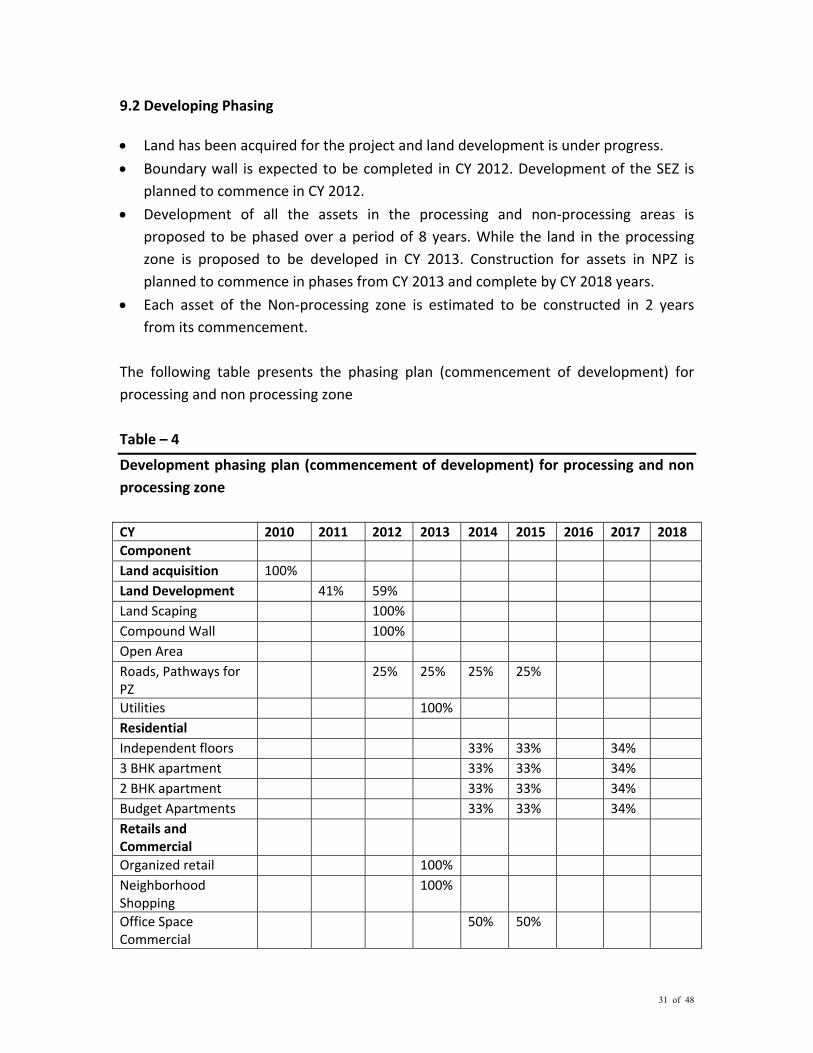
The following table presents the phasing plan (commencement of development) for processing and non processing zone Table – 4
Development phasing plan (commencement of development) for processing and non processing zone CY 2010 2011 2012 2013 2014 2015 2016 2017 2018Component Land acquisition 100% Land Development 41% 59% Land Scaping 100% Compound Wall 100% Open Area Roads, Pathways for PZ
25% 25% 25% 25%
Utilities 100% Residential Independent floors 33% 33% 34% 3 BHK apartment 33% 33% 34% 2 BHK apartment 33% 33% 34% Budget Apartments 33% 33% 34% Retails and Commercial
Organized retail 100% Neighborhood Shopping
100%
Office Space Commercial
50% 50%
32 of 48
Hospitality 3 star budget hotel 100% Service apartments 100% Recreational – Sports and Social
Sport Complex 100% Support facility and social infrastructure
Head office with admin and maintenance office
100%
Security Office 100% Fire Station 100% Post office 100% School 100% Higher education institute
50% 50%
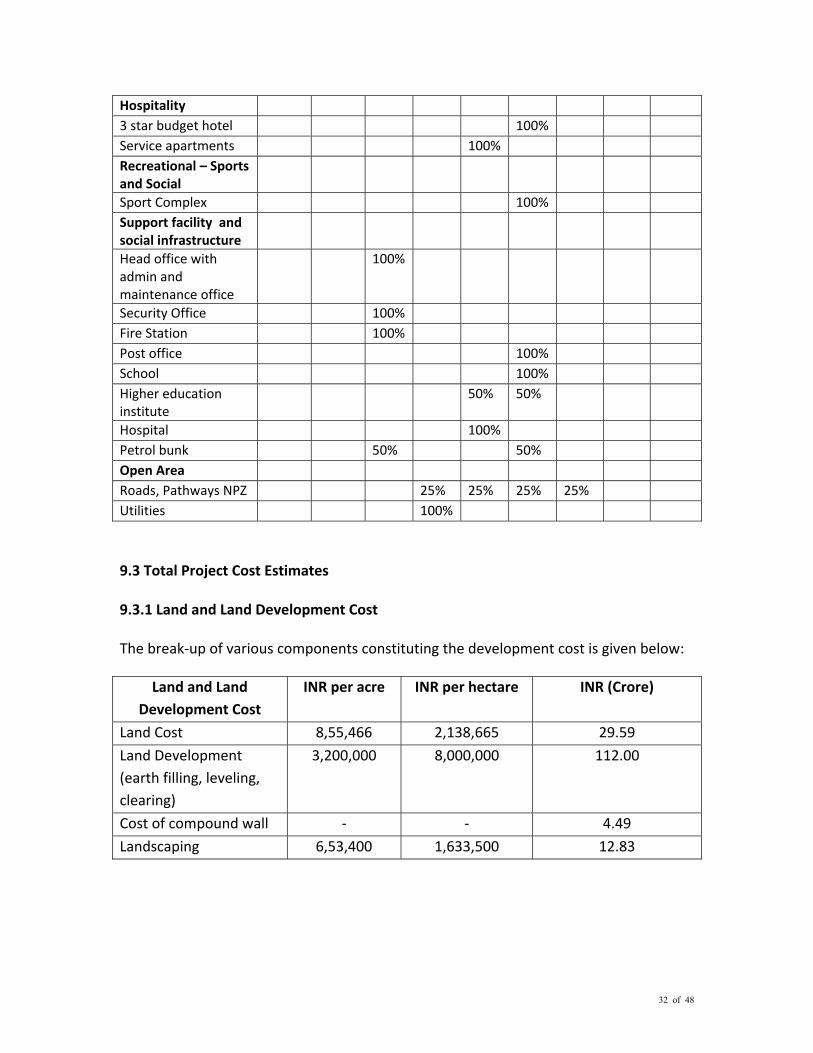
Hospital 100% Petrol bunk 50% 50% Open Area Roads, Pathways NPZ 25% 25% 25% 25% Utilities 100% 9.3 Total Project Cost Estimates 9.3.1 Land and Land Development Cost The break‐up of various components constituting the development cost is given below:
Land and Land Development Cost
INR per acre INR per hectare INR (Crore)
Land Cost 8,55,466 2,138,665 29.59
Land Development (earth filling, leveling, clearing)
3,200,000 8,000,000 112.00
Cost of compound wall ‐ ‐ 4.49
Landscaping 6,53,400 1,633,500 12.83
33 of 48
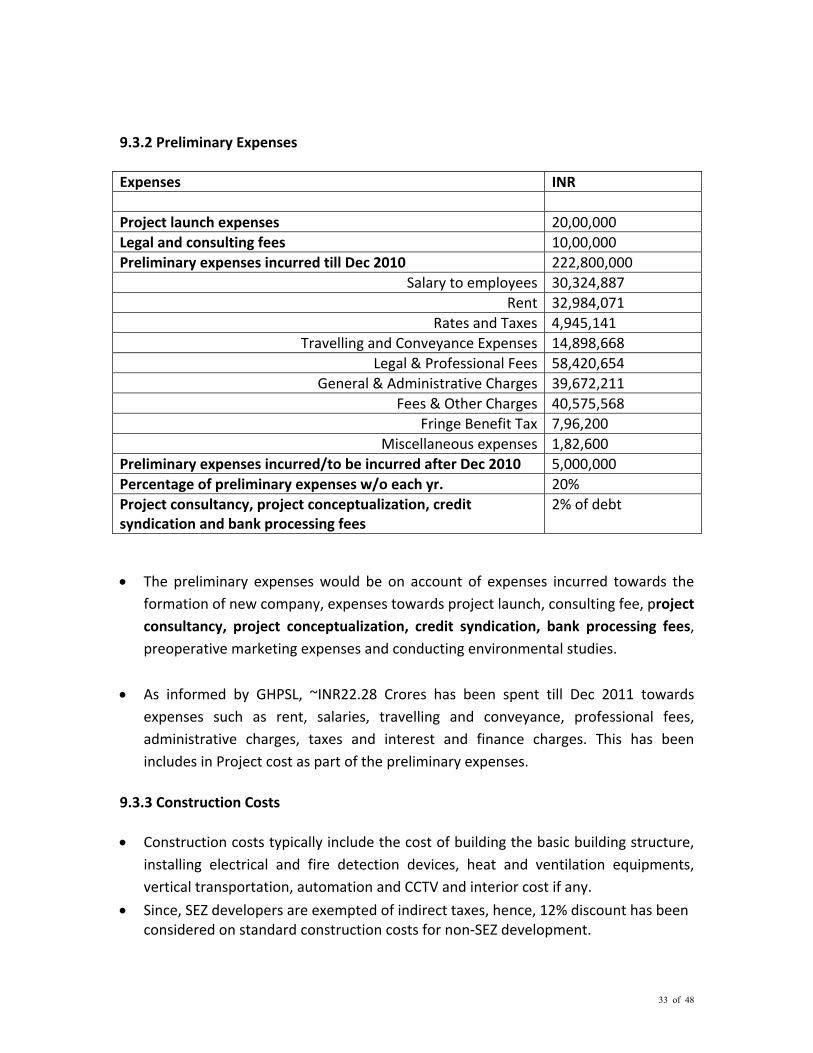
9.3.2 Preliminary Expenses Expenses INR Project launch expenses 20,00,000 Legal and consulting fees 10,00,000 Preliminary expenses incurred till Dec 2010 222,800,000
Salary to employees 30,324,887 Rent 32,984,071
Rates and Taxes 4,945,141 Travelling and Conveyance Expenses 14,898,668
Legal & Professional Fees 58,420,654 General & Administrative Charges 39,672,211
Fees & Other Charges 40,575,568 Fringe Benefit Tax 7,96,200
Miscellaneous expenses 1,82,600 Preliminary expenses incurred/to be incurred after Dec 2010 5,000,000 Percentage of preliminary expenses w/o each yr. 20% Project consultancy, project conceptualization, credit syndication and bank processing fees
2% of debt
• The preliminary expenses would be on account of expenses incurred towards the
formation of new company, expenses towards project launch, consulting fee, project consultancy, project conceptualization, credit syndication, bank processing fees, preoperative marketing expenses and conducting environmental studies.
• As informed by GHPSL, ~INR22.28 Crores has been spent till Dec 2011 towards expenses such as rent, salaries, travelling and conveyance, professional fees, administrative charges, taxes and interest and finance charges. This has been includes in Project cost as part of the preliminary expenses.
9.3.3 Construction Costs • Construction costs typically include the cost of building the basic building structure,
installing electrical and fire detection devices, heat and ventilation equipments, vertical transportation, automation and CCTV and interior cost if any.
• Since, SEZ developers are exempted of indirect taxes, hence, 12% discount has been considered on standard construction costs for non‐SEZ development.

34 of 48
• A provision has been made towards contingencies at the rate of 5%. Construction costs Component INR per Sq. ft. (w/o
discount for indirect tax) INR per Sq. ft. (with discount for indirect tax)
Residential Independent floors 1,050 924
3 BHK apartment 1,050 924 2 BHK apartment 1,050 924
Budget Apartments 925 814 Retails and Commercial
Organized retail 1,525 1,324 Neighborhood Shopping 825 726
Office Space Commercial 1,875 1,650 Hospitality
3 star budget hotel 2,675 2,354 Service apartments 1,200 1,056
Recreational – Sports and Social Sport Complex 800 704
Support facility and social infrastructure
Head office with admin and maintenance office
1,025 902
Security Office 800 704 Fire Station 825 726 Post office 800 704
School 1,050 924 Higher education institute 1,150 1,496
Hospital 1,700 862 Petrol bunk 650 572
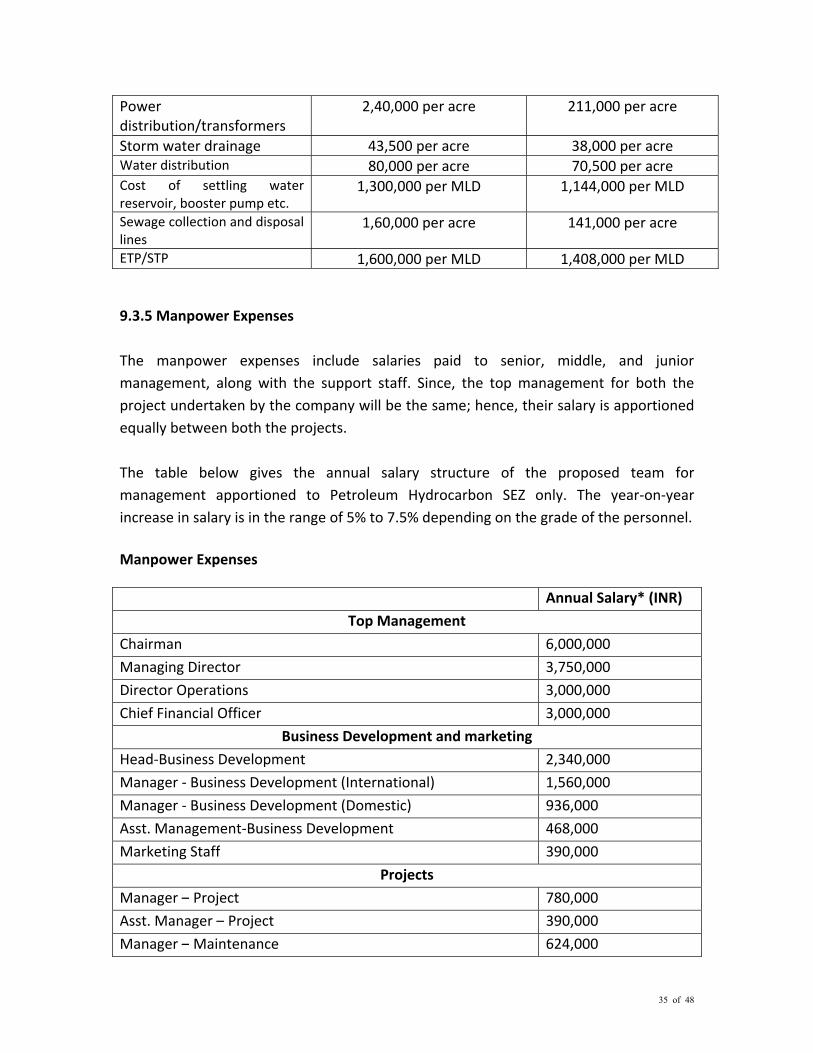
9.3.4 Utilities GHPSL proposes to provision for sufficient utilities for the SEZ, The utilities expenses would be incurred towards facilities like power substation and distribution unit, water storage tank and network, sewage treatment plant, effluent treatment plant etc. Utilities Component INR per Sq. ft. (w/o discount
for indirect tax) INR per Sq. ft. (with discount for indirect tax)
35 of 48
Power distribution/transformers
2,40,000 per acre 211,000 per acre
Storm water drainage 43,500 per acre 38,000 per acre Water distribution 80,000 per acre 70,500 per acre Cost of settling water reservoir, booster pump etc.
1,300,000 per MLD 1,144,000 per MLD
Sewage collection and disposal lines
1,60,000 per acre 141,000 per acre
ETP/STP 1,600,000 per MLD 1,408,000 per MLD 9.3.5 Manpower Expenses The manpower expenses include salaries paid to senior, middle, and junior management, along with the support staff. Since, the top management for both the project undertaken by the company will be the same; hence, their salary is apportioned equally between both the projects. The table below gives the annual salary structure of the proposed team for management apportioned to Petroleum Hydrocarbon SEZ only. The year‐on‐year increase in salary is in the range of 5% to 7.5% depending on the grade of the personnel. Manpower Expenses Annual Salary* (INR)
Top Management
Chairman 6,000,000
Managing Director 3,750,000
Director Operations 3,000,000
Chief Financial Officer 3,000,000
Business Development and marketing
Head‐Business Development 2,340,000
Manager ‐ Business Development (International) 1,560,000
Manager ‐ Business Development (Domestic) 936,000
Asst. Management‐Business Development 468,000
Marketing Staff 390,000
Projects
Manager – Project 780,000
Asst. Manager – Project 390,000
Manager – Maintenance 624,000

36 of 48
Asst. Manager – Maintenance 390,000
Support Staff 234,000
Finance
Manager – Finance 780,000
Asst. Manager – Finance 468,000 9.3.6 Administrative Expenses Administrative expenses that would be incurred during the construction of the SEZ would include conveyance expenses, employee benefit/ food and beverages, telecom expenses, printing and stationery expenses, postal and courier expenses, utilities and sundry expenses (water, etc.), security services etc. have been estimated as monthly expenses incurred per person for all the staff for the administration of GHPSL. Administrative Expenses
Components Annual Expenses (INR) Conveyance 60,000 Employee benefit/food and beverages 24,000 Telecom 24,000 Printing and stationary 18,000 Post and Courier services 12,000 Utilities and sundry expenses 60,000 9.3.7 Marketing Expenses The development shall have an expansive marketing plan. This would comprise brochures which would be of international standards and have a unique appeal. Expenses would be incurred towards road shows and seminars which shall be conducted across prominent locations, both in India and abroad. Extensive publicity of the project shall be done through the print media and through hoardings. Sales promotional activities would also be conducted to reach out to wider strata of populace. Budget for marketing expenses has been considered as INR 1 crore per annum initially and increasing gradually to INR 2 crore till Year 2016. Brokerage expenses are estimated as 1% of the revenue from long term lease*.
37 of 48
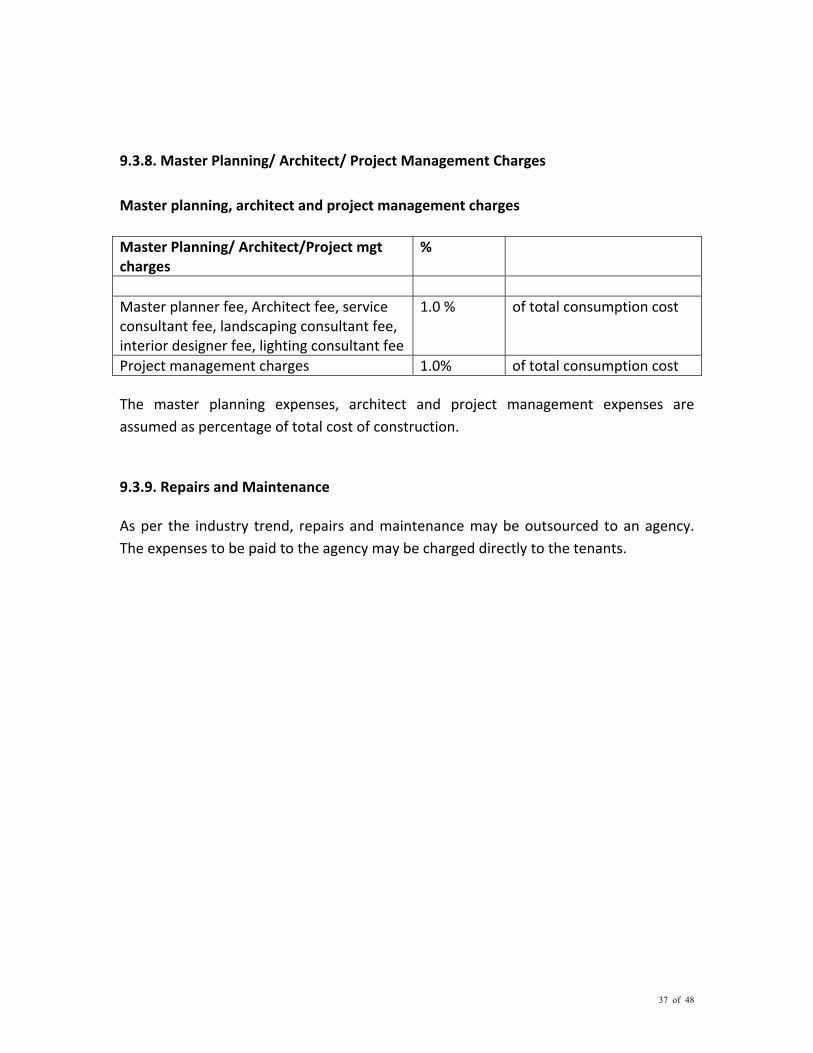
9.3.8. Master Planning/ Architect/ Project Management Charges Master planning, architect and project management charges Master Planning/ Architect/Project mgt charges
%
Master planner fee, Architect fee, service consultant fee, landscaping consultant fee, interior designer fee, lighting consultant fee
1.0 % of total consumption cost
Project management charges 1.0% of total consumption cost The master planning expenses, architect and project management expenses are assumed as percentage of total cost of construction. 9.3.9. Repairs and Maintenance As per the industry trend, repairs and maintenance may be outsourced to an agency. The expenses to be paid to the agency may be charged directly to the tenants.
38 of 48
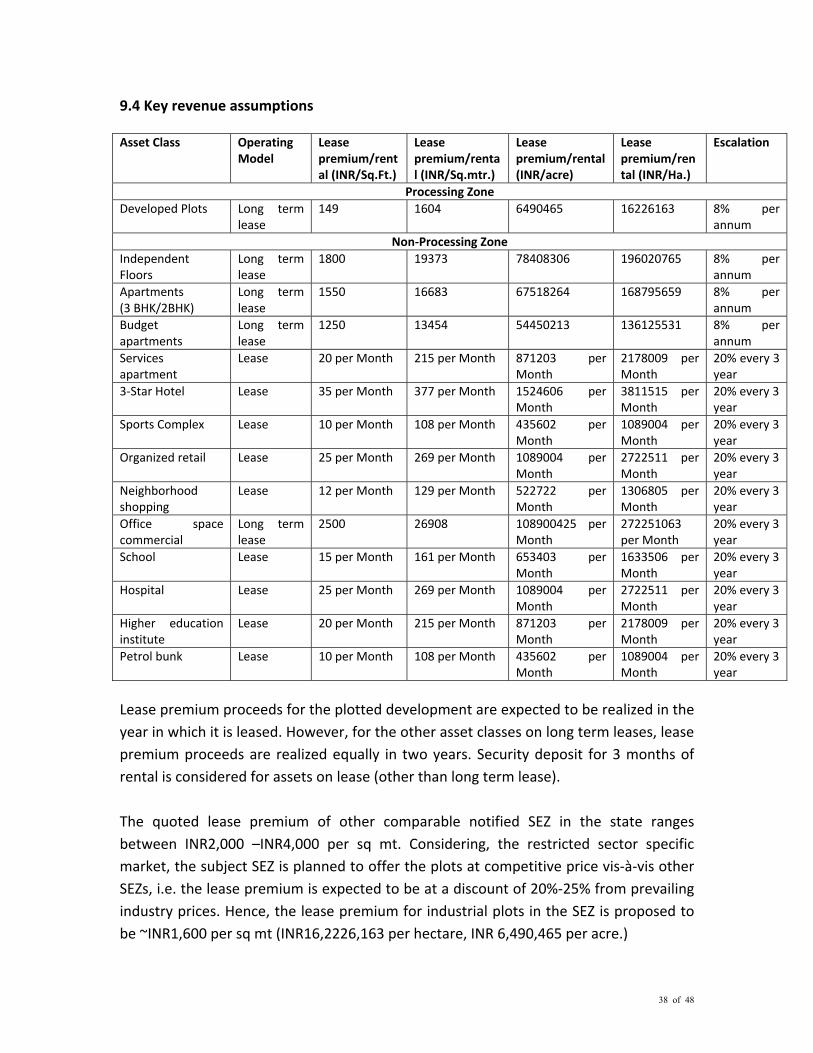
9.4 Key revenue assumptions Asset Class Operating
Model Lease premium/rental (INR/Sq.Ft.)
Lease premium/rental (INR/Sq.mtr.)
Lease premium/rental (INR/acre)
Lease premium/rental (INR/Ha.)
Escalation
Processing ZoneDeveloped Plots Long term
lease 149 1604 6490465 16226163 8% per
annum Non‐Processing Zone
Independent Floors
Long term lease
1800 19373 78408306 196020765 8% per annum
Apartments (3 BHK/2BHK)
Long term lease
1550 16683 67518264 168795659 8% per annum
Budget apartments
Long term lease
1250 13454 54450213 136125531 8% per annum
Services apartment
Lease 20 per Month 215 per Month 871203 per Month
2178009 per Month
20% every 3 year
3‐Star Hotel Lease 35 per Month 377 per Month 1524606 per Month
3811515 perMonth
20% every 3 year
Sports Complex Lease 10 per Month 108 per Month 435602 per Month
1089004 per Month
20% every 3 year
Organized retail Lease 25 per Month 269 per Month 1089004 per Month
2722511 per Month
20% every 3 year
Neighborhood shopping
Lease 12 per Month 129 per Month 522722 per Month
1306805 per Month
20% every 3 year
Office space commercial
Long term lease
2500 26908 108900425 per Month
272251063 per Month
20% every 3 year
School Lease 15 per Month 161 per Month 653403 per Month
1633506 per Month
20% every 3 year
Hospital Lease 25 per Month 269 per Month 1089004 per Month
2722511 per Month
20% every 3 year
Higher education institute
Lease 20 per Month 215 per Month 871203 per Month
2178009 per Month
20% every 3 year
Petrol bunk Lease 10 per Month 108 per Month 435602 per Month
1089004 per Month
20% every 3 year
Lease premium proceeds for the plotted development are expected to be realized in the year in which it is leased. However, for the other asset classes on long term leases, lease premium proceeds are realized equally in two years. Security deposit for 3 months of rental is considered for assets on lease (other than long term lease). The quoted lease premium of other comparable notified SEZ in the state ranges between INR2,000 –INR4,000 per sq mt. Considering, the restricted sector specific market, the subject SEZ is planned to offer the plots at competitive price vis‐à‐vis other SEZs, i.e. the lease premium is expected to be at a discount of 20%‐25% from prevailing industry prices. Hence, the lease premium for industrial plots in the SEZ is proposed to be ~INR1,600 per sq mt (INR16,2226,163 per hectare, INR 6,490,465 per acre.)
39 of 48
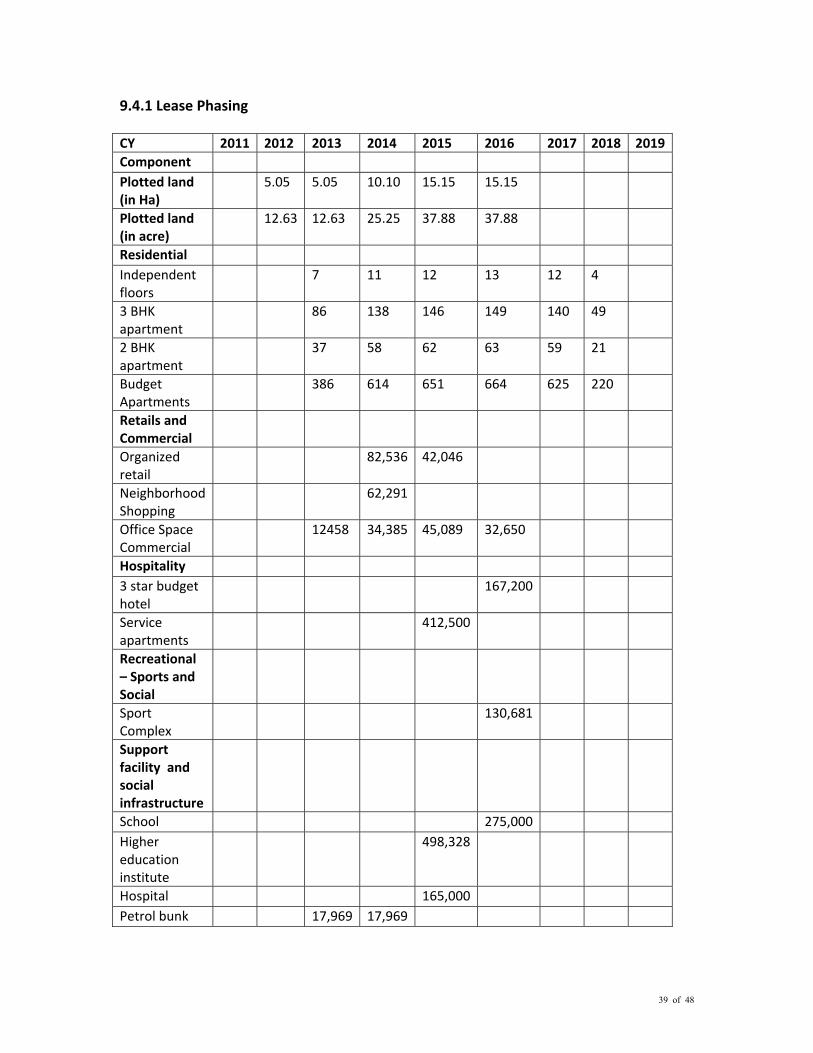
9.4.1 Lease Phasing CY 2011 2012 2013 2014 2015 2016 2017 2018 2019Component Plotted land (in Ha)
5.05 5.05 10.10 15.15 15.15
Plotted land (in acre)
12.63 12.63 25.25 37.88 37.88
Residential Independent floors
7 11 12 13 12 4
3 BHK apartment
86 138 146 149 140 49
2 BHK apartment
37 58 62 63 59 21
Budget Apartments
386 614 651 664 625 220
Retails and Commercial
Organized retail
82,536 42,046
Neighborhood Shopping
62,291
Office Space Commercial
12458 34,385 45,089 32,650
Hospitality 3 star budget hotel
167,200
Service apartments
412,500
Recreational – Sports and Social
Sport Complex
130,681
Support facility and social infrastructure
School 275,000 Higher education institute
498,328
Hospital 165,000 Petrol bunk 17,969 17,969

40 of 48
Lease of plots is spread over five year phase. It is expected that the SEZ could attract substantial prospective tenants with proposed marketing plan. The initial sale phasing is assumed to be on a conservative side, however, with strong export potential envisaged for the sector and regained stakeholder‘s momentum in the industry, the lease of plots are considered at faster rate post 2013. Leasing of NPZ components like residential and commercial units are expected to gain momentum with leasing of industrial plots. 9.4.2 Profit & Loss Account • Revenues for the assets on long term lease are recognized in the P&L account after
the construction is over.
• Approximately INR600 crores of land, land development cost and construction cost spent towards assets on the long term lease are considered as part of operating expenses.
• Deduction U/S 80 IA of the Income Tax Act is planned to be availed during 6th to 15th year i.e. from CY2014 to CY2023.
GHPSL shall be entering into long term lease for the following developments and the development scheduled for the same is presented in the table below: Total area to
be developed (in ft2)
% Completed2011 2012 2013 2014 2015 2016 2017 2018
Development Plots
5,500,357 41% 100% 100% 100% 100% 100% 100% 100%
Independent floors
90,000
Phase I 29,700 ‐ ‐ ‐ 50% 100% 100% 100% 100%Phase II 29,700 ‐ ‐ ‐ ‐ 25% 75% 100% 100%
Phase III 30,600 ‐ ‐ ‐ ‐ ‐ ‐ 50% 100%Apartments 1,303,500
Phase I 430,155 ‐ ‐ ‐ 50% 100% 100% 100% 100%Phase II 430,155 ‐ ‐ ‐ ‐ 25% 75% 100% 100%
Phase III 443,190 ‐ ‐ ‐ ‐ ‐ ‐ 50% 100%Budget Apartments
2,528,000
Phase I 834,240 ‐ ‐ ‐ 50% 100% 100% 100% 100%Phase II 834,240 ‐ ‐ ‐ ‐ 25% 75% 100% 100%
Phase III 859,520 ‐ ‐ ‐ ‐ ‐ ‐ 50% 100%Commercial office space
113,256
Phase I 56,628 ‐ ‐ ‐ 25% 75% 100% 100% 100%Phase II 56,628 ‐ ‐ ‐ ‐ 25% 75% 100% 100%

41 of 48
Total area to
be developed (in ft2)
% Lease Premium 2011 2012 2013 2014 2015 2016 2017 2018
Development Plots
5,500,357 ‐ ‐ 100% 100% 100% 100% 100% 100%
Independent floors
90,000
Phase I 29,700 ‐ ‐ ‐ 50% 100% 100% 100% 100%Phase II 29,700 ‐ ‐ ‐ ‐ 25% 75% 100% 100%
Phase III 30,600 ‐ ‐ ‐ ‐ ‐ ‐ 50% 100%Apartments 1,303,500
Phase I 430,155 ‐ ‐ ‐ 50% 100% 100% 100% 100%Phase II 430,155 ‐ ‐ ‐ ‐ 25% 75% 100% 100%
Phase III 443,190 ‐ ‐ ‐ ‐ ‐ ‐ 50% 100%Budget Apartments
2,528,000
Phase I 834,240 ‐ ‐ ‐ 50% 100% 100% 100% 100%Phase II 834,240 ‐ ‐ ‐ ‐ 25% 75% 100% 100%
Phase III 859,520 ‐ ‐ ‐ ‐ ‐ ‐ 50% 100%Commercial office space
113,256
Phase I 56,628 ‐ ‐ ‐ 25% 75% 100% 100% 100%Phase II 56,628 ‐ ‐ ‐ ‐ 25% 75% 100% 100%
• By the expiry of 2017 entire development of components on long term lease has been assumed to be completed. Leasing of all developments on longterm lease has been assumed to be completed by the end of 2018 and the revenue thereafter is by way of short term lease and other revenue (i.e interest on deposits).
• Revenue may be expected to reduce from INR255 crores in 2014 to INR90 crores in 2015. This will be primarily due to the fact that Phase I of residential apartments were completed in 2014 and the revenues were booked in 2014. However, Phase II of the residential apartments is planned to be under construction during 2015 and hence, the cash received is considered as advances and not revenue. The construction of Phase II of residential apartment is planned to be completed in 2016 and hence, the revenue for the same will be recognised later of 2016 or the year in which the unit is sold.
• For the project revenue shall be booked only in the year of execution of long term lease deed.
Company as detailed in cash flow (Piont 5.4.3) shall be receiving revenue in the following pattern:

42 of 48
Year 1 Year 2 Developed Plots 100% ‐Independent floors 50% 50%Apartments 50% 50%Budget apartments 50% 50%Commercial office space 50% 50% Profit and loss account (in INR Crores)
P & L Statement (in INR Crores)
Dec‐12
Dec‐13 Dec‐14 Dec‐15
Dec‐16 Dec‐17 Dec‐18 Dec‐19 Dec‐20 Dec‐21
Dec‐22 Dec‐23 Dec‐24 Dec‐25
Revenues 9.57 10.74 254.97 89.33 391.24 302.29 131.42 78.48 78.48 78.48 94.17 94.17 94.17 113.01Operating Expenses
13.8 15.58 176.96 54.37 197.79 144.45 41.52 3.67 ‐ ‐ ‐ ‐ ‐ ‐
EBIDTA 4.23 5.11 78.01 34.96 193.46 157.84 89.90 74.81 78.48 78.48 94.17 94.17 94.17 113.01Other Income
0.01 0.1 0.74 1.2 1.22 1.22 1.22 1.22 1.22 1.22 1.22 1.22 1.22 1.22
Depreciation
0.70 2.23 3.42 5.55 7.00 7.00 7.00 7.00 7.00 7.00 7.00 7.00 7.00 7.00
Preliminary expenses written off
‐ ‐ 6.86 6.86 6.86 6.86 6.86 ‐ ‐ ‐ ‐ ‐ ‐ ‐
EBIT 4.92 7.25 68.46 23.75 180.83 145.21 77.27 69.03 72.70 72.70 88.40 88.40 88.40 107.23Interest ‐ ‐ 24.70 19.50 14.30 9.10 3.90 ‐ ‐ ‐ ‐ ‐ ‐ ‐EBT 4.92 7.25 43.76 4.25 166.53 136.11 73.37 69.03 72.70 72.70 88.40 88.40 88.40 107.23Tax ‐ ‐ ‐ ‐ ‐ ‐ ‐ ‐ ‐ ‐ ‐ ‐ 24.38 31.65PAT 4.92 7.25 43.76 4.25 166.53 136.11 73.37 69.03 72.70 72.70 88.40 88.40 64.02 75.59Retained Earning
4.92 7.25 31.60 65.8 202.37 338.48 411.84 480.88 553.58 626.29
714.69 803.09 867.11 942.70

43 of 48
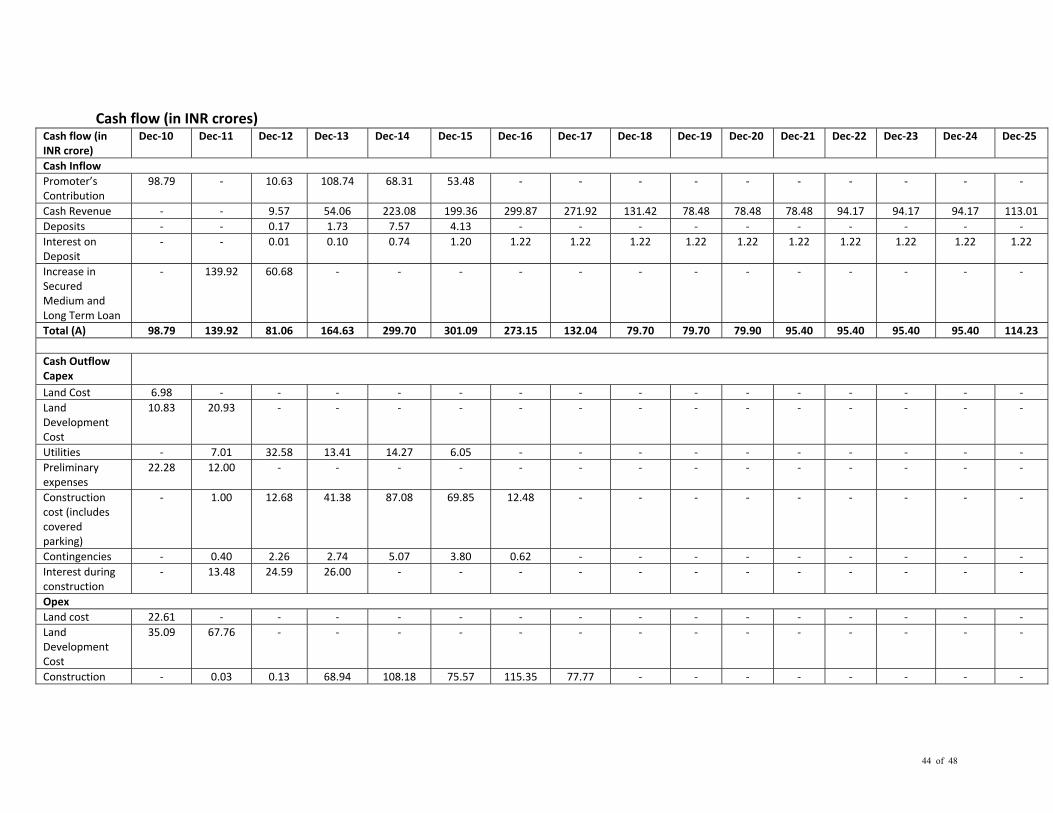
9.4.3 Cash flow statement • Cash inflow from long lease of assets may precede the revenue recognition in the P&L
account due to recognition of revenue on completion on construction. This also explains reduction in revenue during 2015 inspite of healthy cash flow during the period.
• Interest during construction is part of Capital expenditure
• Debt‐equity is considered to be 70:30.The debt is proposed to be raised at interest of 13% p.a. Repayment is planned in 5 years after moratorium of 3 years from first disbursement.
• The cash flow indicates that the cash balance after deducting expenses (capital expenditure, operating expenses, tax and pre‐operative/preliminary expenses) from revenue receipts; will be sufficient to meet the cash requirements for repayment of interest and loan.
• Promoter‘s contribution during 2013 may be infused through preferential allotment to a co‐developer/strategic partner/ financial investor.
44 of 48
Cash flow (in INR crores) Cash flow (in INR crore)
Dec‐10 Dec‐11 Dec‐12 Dec‐13 Dec‐14 Dec‐15 Dec‐16 Dec‐17 Dec‐18 Dec‐19 Dec‐20 Dec‐21 Dec‐22 Dec‐23 Dec‐24 Dec‐25
Cash Inflow Promoter’s Contribution
98.79 ‐ 10.63 108.74 68.31 53.48 ‐ ‐ ‐ ‐ ‐ ‐ ‐ ‐ ‐ ‐
Cash Revenue ‐ ‐ 9.57 54.06 223.08 199.36 299.87 271.92 131.42 78.48 78.48 78.48 94.17 94.17 94.17 113.01 Deposits ‐ ‐ 0.17 1.73 7.57 4.13 ‐ ‐ ‐ ‐ ‐ ‐ ‐ ‐ ‐ ‐ Interest on Deposit
‐ ‐ 0.01 0.10 0.74 1.20 1.22 1.22 1.22 1.22 1.22 1.22 1.22 1.22 1.22 1.22
Increase in Secured Medium and Long Term Loan
‐ 139.92 60.68 ‐ ‐ ‐ ‐ ‐ ‐ ‐ ‐ ‐ ‐ ‐ ‐ ‐
Total (A) 98.79 139.92 81.06 164.63 299.70 301.09 273.15 132.04 79.70 79.70 79.90 95.40 95.40 95.40 95.40 114.23 Cash Outflow Capex
Land Cost 6.98 ‐ ‐ ‐ ‐ ‐ ‐ ‐ ‐ ‐ ‐ ‐ ‐ ‐ ‐ ‐ Land Development Cost
10.83 20.93 ‐ ‐ ‐ ‐ ‐ ‐ ‐ ‐ ‐ ‐ ‐ ‐ ‐ ‐
Utilities ‐ 7.01 32.58 13.41 14.27 6.05 ‐ ‐ ‐ ‐ ‐ ‐ ‐ ‐ ‐ ‐ Preliminary expenses
22.28 12.00 ‐ ‐ ‐ ‐ ‐ ‐ ‐ ‐ ‐ ‐ ‐ ‐ ‐ ‐
Construction cost (includes covered parking)
‐ 1.00 12.68 41.38 87.08 69.85 12.48 ‐ ‐ ‐ ‐ ‐ ‐ ‐ ‐ ‐
Contingencies ‐ 0.40 2.26 2.74 5.07 3.80 0.62 ‐ ‐ ‐ ‐ ‐ ‐ ‐ ‐ ‐ Interest during construction
‐ 13.48 24.59 26.00 ‐ ‐ ‐ ‐ ‐ ‐ ‐ ‐ ‐ ‐ ‐ ‐
Opex Land cost 22.61 ‐ ‐ ‐ ‐ ‐ ‐ ‐ ‐ ‐ ‐ ‐ ‐ ‐ ‐ ‐ Land Development Cost
35.09 67.76 ‐ ‐ ‐ ‐ ‐ ‐ ‐ ‐ ‐ ‐ ‐ ‐ ‐ ‐
Construction ‐ 0.03 0.13 68.94 108.18 75.57 115.35 77.77 ‐ ‐ ‐ ‐ ‐ ‐ ‐ ‐

45 of 48
cost (includes covered parking) Master Planning/ Architect/ Project Mgt Charges
‐ 8.36 1.54 0.51 ‐ ‐ ‐ ‐ ‐ ‐ ‐ ‐ ‐ ‐ ‐ ‐
Manpower Expenses
‐ ‐ 3.68 3.95 4.25 5.35 5.75 5.81 3.16 3.39 ‐ ‐ ‐ ‐ ‐ ‐
Other administrative expenses
‐ ‐ 0.76 0.80 0.84 1.24 1.30 1.20 0.26 0.28 ‐ ‐ ‐ ‐ ‐ ‐
Marketing Expenses
‐ ‐ 1.00 1.50 2.00 2.00 2.00 ‐ ‐ ‐ ‐ ‐ ‐ ‐ ‐ ‐
Brokerage ‐ ‐ 0.15 1.12 4.72 3.16 2.38 2.07 0.66 ‐ ‐ ‐ ‐ ‐ ‐ ‐ Tax ‐ ‐ ‐ ‐ ‐ ‐ ‐ ‐ ‐ ‐ ‐ ‐ ‐ ‐ 24.38 31.65 Interest ‐ ‐ ‐ ‐ 24.70 19.50 14.30 9.10 3.90 ‐ ‐ ‐ ‐ ‐ ‐ ‐ Investments ‐ ‐ 0.17 1.73 7.57 4.13 ‐ ‐ ‐ ‐ ‐ ‐ ‐ ‐ ‐ ‐ Repayment of Long Term Loan
‐ ‐ ‐ ‐ 40.00 40.00 40.00 40.00 40.00 ‐ ‐ ‐ ‐ ‐ ‐ ‐
Total (B) 97.79 130.97 79.52 163.10 299.19 230.65 194.18 135.94 47.98 3.67 ‐ ‐ ‐ ‐ ‐ ‐ Opening Balance of Cash and Bank
1.00 9.36 10.89 12.43 12.94 40.45 147.36 284.57 369.23 445.26 524.96 604.67 700.07 795.46 866.49
Net Surplus\ Deficit (A‐B)
1.00 8.36 1.54 1.54 0.51 27.51 106.91 137.21 84.66 76.03 79.70 79.70 95.40 95.40 71.02 82.59
Closing Balance of Cash and Bank
1.00 9.36 10.89 12.43 12.94 40.45 147.36 284.57 369.23 445.26 524.96 604.67 700.07 795.46 866.49 949.07

46 of 48
9.4.4 Balance sheet • Land, Land development cost and construction incurred towards assets given on long term lease are included in inventory.
Balance Sheet (in INR Crores)
Dec‐10
Dec‐11 Dec‐12 Dec‐13 Dec‐14 Dec‐15 Dec‐16 Dec‐17 Dec‐18 Dec‐19 Dec‐20 Dec‐21 Dec‐22 Dec‐23 Dec‐24 Dec‐25
Liabilities Net worth 98.79 98.79 104.51 206.01 318.08 375.81 542.33 678.44 751.81 820.84 893.55 966.25 1054.65 1143.05 1207.07 1282.66Promoter’s contribution
98.79 98.79 109.43 218.17 286.48 339.96 339.96 339.96 339.96 339.96 339.96 339.96 339.96 339.96 339.96 339.96
Reserves & Surplus
‐ ‐ 4.92 12.16 31.60 35.85 202.37 338.48 411.84 480.88 553.58 626.29 714.69 803.09 867.11 942.70
Long term Loans
‐ 139.32 200.00 200.00 160.00 120.00 80.00 40.00 ‐ ‐ ‐ ‐ ‐ ‐ ‐ ‐
Total Liabilities
98.79 238.12 304.51 406.01 478.08 495.81 622.33 718.44 751.81 820.84 893.55 966.25 1054.65 1143.05 1207.07 1282.66
Assets Land 6.98 38.74 38.74 38.74 38.74 38.74 38.74 38.74 38.74 38.74 38.74 38.74 38.74 38.74 38.74 38.74Gross Block ‐ 7.36 41.95 146.32 187.83 324.34 376.74 376.74 376.74 376.74 376.74 376.74 376.74 376.74 376.74 376.74Less: Acc. Dep. ‐ ‐ 0.70 2.93 6.36 11.91 18.91 25.91 32.91 39.90 46.90 53.90 60.90 67.90 74.89 81.89
Net Block ‐ 7.36 41.25 143.99 181.47 312.43 357.83 350.83 343.83 336.84 329.84 322.84 315.84 308.84 301.85 294.85CWIP 10.83 14.53 52.04 31.19 96.11 39.30 0.00 0.00 0.00 0.00 0.00 0.00 0.00 0.00 0.00 0.00Investment ‐ ‐ 0.17 1.89 9.46 13.59 13.59 13.59 13.59 13.59 13.59 13.59 13.59 13.59 13.59 13.59Total Current Assets
58.70 143.21 138.20 202.00 146.05 206.51 242.42 322.01 369.23 445.26 524.96 604.67 700.07 795.46 866.49 949.07
Cash & Bk. Bal. s
1.00 9.36 10.89 12.43 12.94 40.45 147.36 284.57 369.23 445.26 524.96 604.67 700.07 795.46 866.49 949.07
Inventory 57.70 133.85 127.30 189.57 133.11 166.06 95.05 37.44 ‐ ‐ ‐ ‐ ‐ ‐ ‐ ‐Total Current Liabilities
‐ ‐ 0.17 45.49
21.18 135.33 43.96 13.59 13.59 13.59 13.59 13.59 13.59 13.59 13.59 13.59
Advances ‐ ‐ ‐ 43.60 11.71 121.74 30.37 ‐ ‐ ‐ ‐ ‐ ‐ ‐ ‐ ‐Security Deposit
‐ ‐ 0.17 1.89 9.46 13.59 13.59 13.59 13.59 13.59 13.59 13.59 13.59 13.59 13.59 13.59
Net Current Assets
58.70 143.21 138.03 156.51 124.87 71.18 198.46 308.42 355.64 431.67 511.37 591.08 686.47 781.87 852.89 935.48
Misc exp to be w/o
22.28 34.28 34.28 34.28 27.42 20.57 13.71 6.86 ‐ ‐ ‐ ‐ ‐ ‐ ‐ ‐
Total Assets 98.79 238.12 304.51 406.01 478.08 495.81 622.33 718.44 751.81 820.84 893.55 966.25 1054.65 1143.05 1207.07 1282.66
47 of 48
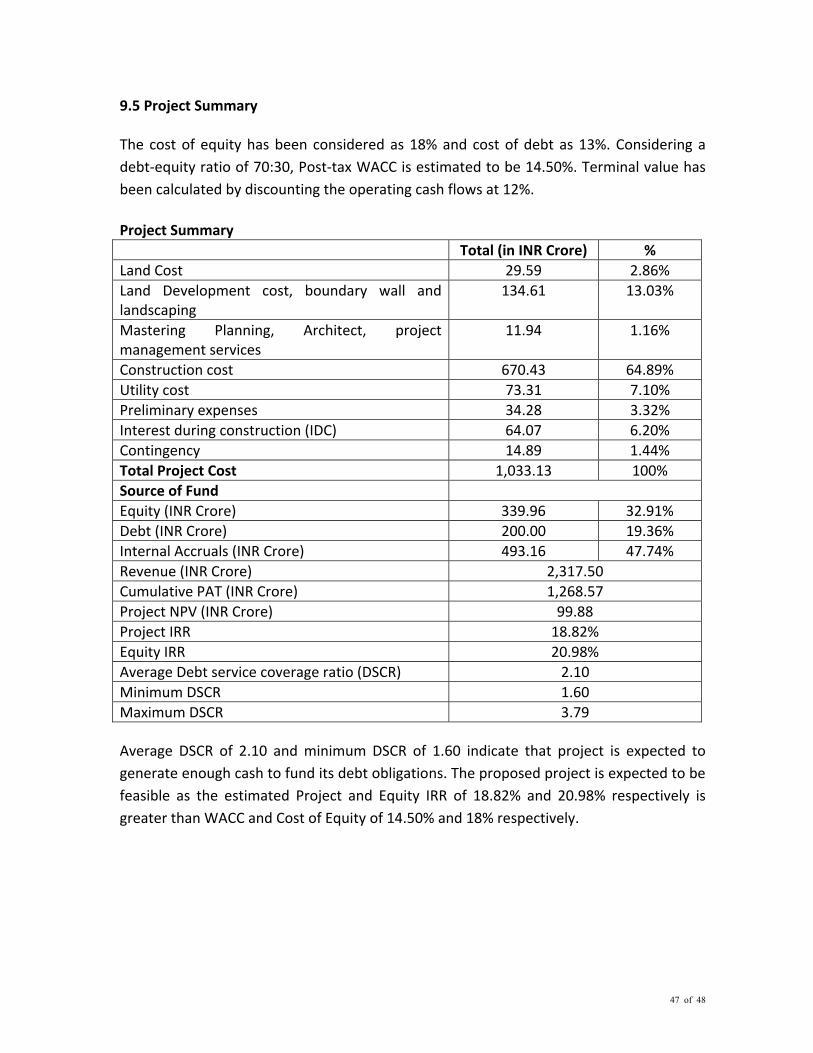
9.5 Project Summary The cost of equity has been considered as 18% and cost of debt as 13%. Considering a debt‐equity ratio of 70:30, Post‐tax WACC is estimated to be 14.50%. Terminal value has been calculated by discounting the operating cash flows at 12%. Project Summary Total (in INR Crore) % Land Cost 29.59 2.86% Land Development cost, boundary wall and landscaping
134.61 13.03%
Mastering Planning, Architect, project management services
11.94 1.16%
Construction cost 670.43 64.89% Utility cost 73.31 7.10% Preliminary expenses 34.28 3.32% Interest during construction (IDC) 64.07 6.20% Contingency 14.89 1.44% Total Project Cost 1,033.13 100% Source of Fund Equity (INR Crore) 339.96 32.91% Debt (INR Crore) 200.00 19.36% Internal Accruals (INR Crore) 493.16 47.74% Revenue (INR Crore) 2,317.50 Cumulative PAT (INR Crore) 1,268.57 Project NPV (INR Crore) 99.88 Project IRR 18.82% Equity IRR 20.98% Average Debt service coverage ratio (DSCR) 2.10 Minimum DSCR 1.60 Maximum DSCR 3.79 Average DSCR of 2.10 and minimum DSCR of 1.60 indicate that project is expected to generate enough cash to fund its debt obligations. The proposed project is expected to be feasible as the estimated Project and Equity IRR of 18.82% and 20.98% respectively is greater than WACC and Cost of Equity of 14.50% and 18% respectively.
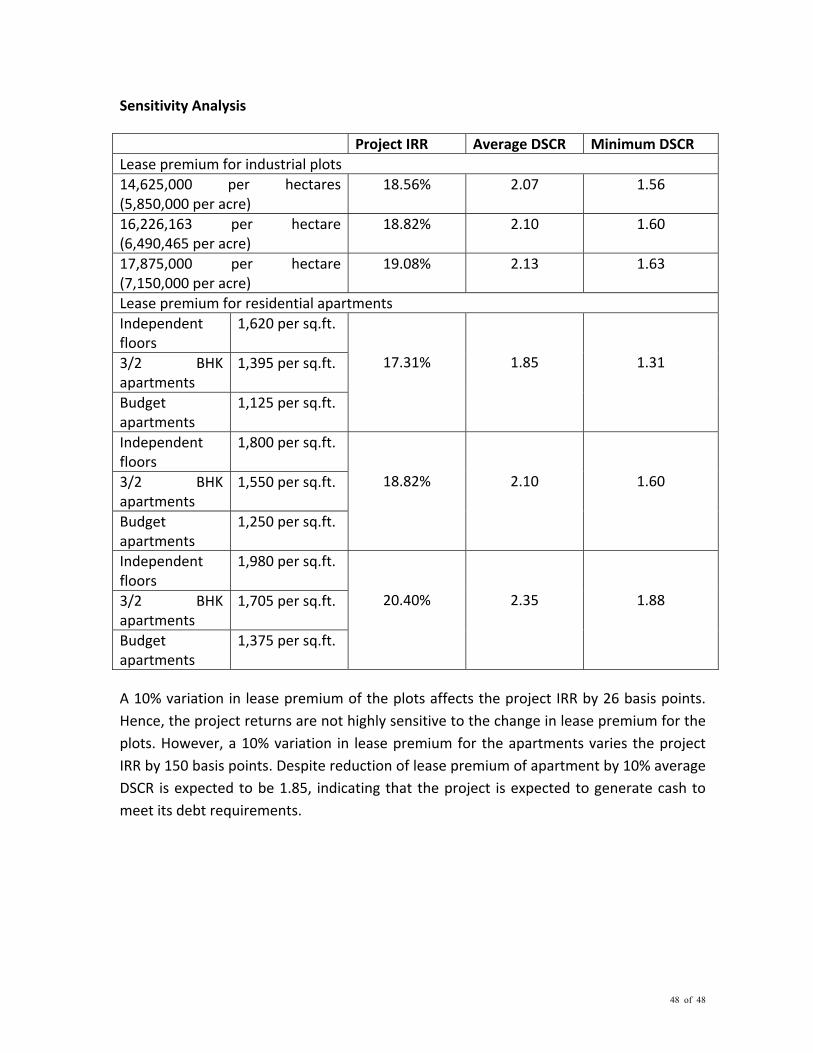
48 of 48
Sensitivity Analysis Project IRR Average DSCR Minimum DSCR Lease premium for industrial plots 14,625,000 per hectares (5,850,000 per acre)
18.56% 2.07 1.56
16,226,163 per hectare (6,490,465 per acre)
18.82% 2.10 1.60
17,875,000 per hectare (7,150,000 per acre)
19.08% 2.13 1.63
Lease premium for residential apartments Independent floors
1,620 per sq.ft.
17.31%
1.85
1.31 3/2 BHK apartments
1,395 per sq.ft.
Budget apartments
1,125 per sq.ft.
Independent floors
1,800 per sq.ft.
18.82%
2.10
1.60 3/2 BHK apartments
1,550 per sq.ft.
Budget apartments
1,250 per sq.ft.
Independent floors
1,980 per sq.ft.
20.40%
2.35
1.88 3/2 BHK apartments
1,705 per sq.ft.
Budget apartments
1,375 per sq.ft.
A 10% variation in lease premium of the plots affects the project IRR by 26 basis points. Hence, the project returns are not highly sensitive to the change in lease premium for the plots. However, a 10% variation in lease premium for the apartments varies the project IRR by 150 basis points. Despite reduction of lease premium of apartment by 10% average DSCR is expected to be 1.85, indicating that the project is expected to generate cash to meet its debt requirements.