Feasibility Household CDM Atmosfair Draft
35
Feasibility of CDM funding for household and community level projects With examples from Caucasus and Central Asia Robert Müller, Florian Zerzawy, Alexander Wirth, April 2010 atmosfair gGmbH Zossener Straße 55–58 10961 Berlin www.atmosfair.de Women in Europe for a Common Future St.-Jakobs-Platz 10 80331 Munich www.wecf.eu
-
Upload
chaitanya-shahare -
Category
Documents
-
view
219 -
download
0
Transcript of Feasibility Household CDM Atmosfair Draft

8/4/2019 Feasibility Household CDM Atmosfair Draft
http://slidepdf.com/reader/full/feasibility-household-cdm-atmosfair-draft 1/35
Feasibility of CDM funding for household and
community level projects
With examples from Caucasus and Central Asia
Robert Müller, Florian Zerzawy, Alexander Wirth, April 2010
atmosfair gGmbH
Zossener Straße 55–58
10961 Berlin
www.atmosfair.de
Women in Europe for a
Common Future
St.-Jakobs-Platz 10
80331 Munich
www.wecf.eu

8/4/2019 Feasibility Household CDM Atmosfair Draft
http://slidepdf.com/reader/full/feasibility-household-cdm-atmosfair-draft 2/35
Feasibility Study of CDM funding for household and community level projects
2
Index
1 Introduction...............................................................................................................................5 2 CDM and household and community based projects..............................................................6
2.1 The CDM Mechanism ......................................................................................................6 2.2 Current situation of the CDM ...........................................................................................7 2.3 Existing household and community level CDM projects .................................................8 2.4 Constraints in current CDM for household and community level projects ......................9 2.5 The role of women..........................................................................................................10
3 Evaluation of potential CDM projects at the household and community level ......................11 3.1 Technologies with CDM potential ..................................................................................12 3.2 Potential of CO2 reduction according to different baseline scenarios (basically baseline
fuels) 12 3.3 Combining CDM and microcredit...................................................................................15 3.4 Potential of obtaining the Gold Standard label ..............................................................16
4 Description of project ideas for HH projects ..........................................................................17 4.1 Solar water heaters ........................................................................................................17 4.2 Biomass briquettes for cooking......................................................................................20 4.3 Biogas for cooking..........................................................................................................22 4.4 Solar cooking..................................................................................................................24 4.5 Photovoltaic lamps (replacing kerosene lamps)............................................................25 4.6 Irrigation..........................................................................................................................26 4.7 CFL bulbs .......................................................................................................................26 4.8 Efficient stoves for cooking or heating ...........................................................................29 4.9 Home insulation..............................................................................................................31 4.10 Composting of organic waste.........................................................................................32
5 Proposal to improve the accessibility of the CDM for household and community level
projects ...........................................................................................................................................34 6 Acknowledgements ................................................................................................................35

8/4/2019 Feasibility Household CDM Atmosfair Draft
http://slidepdf.com/reader/full/feasibility-household-cdm-atmosfair-draft 3/35
Feasibility Study of CDM funding for household and community level projects
3
List of tables
Table 1: Expected CERs under the CDM until 2012.......................................................................7 Table 2: Countries with most issued CERs3 ....................................................................................8 Table 4: Summary of existing household and community based CDM projects3 ...........................9 Table 5: Suitable technologies for household and community based projects under the CDM...12 Table 6: Grid Emission factors for the Caucasus and Central Asia region...................................14 Table 7: Estimate of the financial contribution of CDM to Solar Water Heater projects ...............19 Table 8: Estimate of the financial contribution of CDM to biomass briquetting project ................21 Table 9: Estimate of the financial contribution of CDM to biogas projects for households ..........23 Table 10: Estimate of the financial contribution of CDM to photovoltaic lamp projects................25 Table 11: Estimate of the contribution of CDM to CFL bulb projects ............................................27 Table 11: Estimate of the contribution of CDM to efficient stove projects ....................................30 Table 12: Potential CER of a composting project under different climates ..................................33

8/4/2019 Feasibility Household CDM Atmosfair Draft
http://slidepdf.com/reader/full/feasibility-household-cdm-atmosfair-draft 4/35
4
Summary
An analysis of the current situation of household and community based projects under the
Clean Development Mechanism (CDM) reveals that CDM funding has hardly been
accessible to such projects. At the same time, they can significantly contribute to the
achievement of the sustainable development goal defined in the CDM, particularly through
improvements of energy supply for poor households. This is also of great importance to
improve the living conditions of women.
We identify projects types with potential for CDM funding and give hints for the development
of such projects under the CDM. Most important points to analyse are cost effectiveness of
the promoted technology and baseline emissions of the traditional, replaced technology.
Moreover, CDM is only applicable to household based projects if a massive dissemination of
mature technologies is put into practise.
A high potential is found for projects delivering renewable thermal energy directly tohouseholds, based on decentralized sources, mainly biogas, waste biomass and thermal
solar power. Also projects providing electric energy for lighting have good potential to
achieve funding under the CDM, particularly photovoltaic lamps. As for energy efficiency, the
highest potential is found for projects based on efficient cook stoves or efficient lighting by
using CFL bulbs. Other technologies with moderate potential for CDM funding are solar
cookers, efficient or renewable-energy based irrigation and home insulation; the latter
particularly in the region of Caucasus and Central Asia, which is focused on in this study. In
any case, factual potential of CDM funding depends on the specific circumstances in the
project area; country-specific analysis will always be needed.
Based on an analysis of constraints in the current CDM rules, we propose substantial
improvements in terms of funding conditions and methodological requirements for such
projects.

8/4/2019 Feasibility Household CDM Atmosfair Draft
http://slidepdf.com/reader/full/feasibility-household-cdm-atmosfair-draft 5/35
5
1 Introduction
Poor communities in developing and emerging countries have hardly been able to access
funding via the Clean Development Mechanism (CDM) for climate change mitigation
measures. At the same time, many low-income communities have limited access tosustainable energy which restricts their opportunities for economic development and
education.
In this study, we analyze the potential of CDM as a funding mechanism for household and
community based projects (further on called HH projects). We provide practical guidelines
on CDM for institutions working with HH projects. At the same time, we make suggestions
how CDM should be improved to be more accessible for household and community based
projects.
The study covers household and community based projects in general; for practical
examples, we focus on the Caucasus and Central Asia region (further on called CCA
region), which is the target area of the work of WECF.
Definition of HH projects
We define HH projects as projects that reduce emissions caused directly by households and
communities in activities of their daily life and where these households and communities are
actively involved in implementing the project.
Typically such HH projects bundle a huge number of small units, e.g. by distributing energy
efficient facilities or disseminating clean technologies. HH projects can consist in providing
clean and efficient energy services where no service existed before, thus providing clean
development, or in replacing old and inefficient technologies. Therefore HH projects have
high potential to improve the livelihoods of poor households and communities.
CDM as a funding source for HH projects - general aspects
HH projects in developing countries are traditionally often funded by official development aid,
mostly through NGOs or governmental development agencies. Funding is mostly provided in
the form of non-reimbursable grants with only partial contribution of beneficiaries and
implementing entities to project funding. This implies a low financial risk for project
implementation which is particularly needed for implementing pilot projects.
CDM funding is different because it is success based – carbon credits can only be obtained
after a project has proven to be operational. This implies an important limitation of CDM
funding for many potential projects. But at the same time, CDM is an opportunity for
upscaling viable projects, providing sustainable and continuous revenues by carbon credits
without dependence on grant funding.
In sum, CDM is an opportunity for upscaling pilot projects that have proven to be successful.
CDM is not suitable for pilot projects.

8/4/2019 Feasibility Household CDM Atmosfair Draft
http://slidepdf.com/reader/full/feasibility-household-cdm-atmosfair-draft 6/35
6
2 CDM and household and community based projects
2.1 The CDM Mechanism
The Clean Development Mechanism (CDM) is one of the mechanisms defined in the Kyoto
protocol to reduce emissions on a global level1
. It allows projects in Non-Annex 1 countries(developing and emerging countries without binding emission reduction targets) to generate
carbon credits called CERs (Certified Emission Reductions). CERs are traded on
international carbon markets; main buyers are Annex 1 countries or companies participating
in the European Emission Trading Scheme (EU-ETS).
CDM projects can be organized in a bilateral way (an investor from Annex-1 country invests
with the purpose to obtain CERs) or in a unilateral way (a project developer from Non-Annex
1 country sets up a project to sell CERs to any potential buyer). The objectives of the CDM
also include fostering technology transfer and sustainable development in Non-Annex 1
countries.
In order to obtain CERs, a project must pass the CDM project cycle consisting in:
1. PIN/project concept: Development of the project idea which is often presented in the
form of a PIN (Project Idea Note). A PIN is not officially required as CDM document.
2. PDD: Preparation of the official project documentation in a standardized form (called
PDD – Project Design Document), making use of approved CDM methodologies.
Main parts of the PDD are the development of the baseline scenario, the
demonstration of additionality and the description of the monitoring plan.
3. Validation: Detailed check of the PDD by an UN-approved, independent auditor called
DOE (designated operating entity).
4. Host country approval: Approval of the project by the CDM authority of the host
country, called DNA (Designated National Authority).
5. Registration: Registration of the project by the EB (Executive Board of the UNFCCC –
United Nations Framework Convention on Climate Change), upon approval of the
validation report prepared by the DOE.
6. Monitoring: Recording of emission reductions achieved after registration according to
the monitoring plan.
7. Verification: Detailed check of the monitoring report by a DOE.
8. Issuance: Reception of CERs issued by the EB upon approval of the verification
report prepared by the DOE.
Verification and issuance are repeated several times during the crediting period, which can
be chosen as fixed (duration 10 years) or renewable (up to three times 7 years, with
obligation to re-asses the baseline after 7 and 14 years). The rhythm of verifications is
defined by the project owner; it is mostly conducted annually.
For so-called small scale projects (<15MW for electricity production, <60GWh of savings for
electricity efficiency project, <180MGW of savings for thermal energy efficiency projects and
<60,000 tons of CO2 savings per year for methane reduction projects), standardized and
1See http://cdm.unfccc.int

8/4/2019 Feasibility Household CDM Atmosfair Draft
http://slidepdf.com/reader/full/feasibility-household-cdm-atmosfair-draft 7/35
7
simplified methodologies may be used and the same DOE may be contracted for validation
and verification (in large scale projects, different DOEs must be chosen).
The costs of the CDM project cycle are high: Hiring a DOE for validation costs at least
15,000 EUR; hiring a DOE for verification again costs some 10-15,000 EUR per verification.
Contracting a consultant for PDD preparation and management of the project cycle can cost
some 30,000 – 100,000 EUR, depending on the complexity of the project. It is however
possible to prepare a PDD and mange the project cycle without external consultants.
HH project have very good chances to obtain the Gold Standard label, which certifies high
social and environmental standards2. Gold Standard CERs can be sold at premium prices.
Recently, the programmatic CDM was launched as a CDM mechanism allowing for projects
with a flexible size and crediting period. After registrating a framework project (PoA –
Programme of Activities), an unlimited number of project activities can be added to this PoA,
called CPAs (CDM programme activities). The crediting period of each CPA starts at the time
it is added to the PoA. A detailed validation for each CPA is not necessary anymore.
Besides the CDM, a variety of so-called VER standards exist, permitting the generation of
carbon credits besides the context of the Kyoto protocol. VERs (Verified Emission
Reductions) are traded on the voluntary market, e.g. as voluntary offsets of for the purpose
of marketing. VER prices are considerably lower than CER prices, in the range of 3-8
EUR/ton CO2. The most demanding VER standard is the VER Gold Standard (the Gold
Standard also exists for CDM projects).
2.2 Current situation of the CDM
As a market based mechanism, CDM has mainly supported large scale projects in emerging
countries (see table 1) that are reducing greenhouse gases with a higher global warmingpotential than CO2 such as HFCs (employed in refrigerators and chillers), N2O and CH4.
Until 2010, the CDM generated carbon credits corresponding to 300 millions of tons of CO2,
equal to the 50% of the annual emissions of the United Kingdom. Only four countries account
for more than 90% of all issued emission reductions (table 2).
Expected CERs Until 2012 (%) in each category
Transport
0.2%
Afforestation &
Reforestation
0.5%
Demand-side EE
1%
Fuel switch
6%
Supply-side EE
11%
CH4 reduction &
Cement & Coal
mine/bed
20%Renewables
35%
HFCs, PFCs &N2O reduction
27%
Table 1: Expected CERs by project categories until 20123
2See: http://www.cdmgoldstandard.org/
3Based on http://cdmpipeline.org/

8/4/2019 Feasibility Household CDM Atmosfair Draft
http://slidepdf.com/reader/full/feasibility-household-cdm-atmosfair-draft 8/35
8
Top countries by
issued CERs
MCERs Share Accumulated
Share
China 153 46% 46%
India 72 22% 68% South Korea 44 13% 81%
Brazil 35 10% 91%
Table 2: Countries with most CER issued3
Within the countries of the CCA region, there are 13 registered CDM project (until April
2010); another 42 projects are at validation stage. Still no CERs have been issued to projects
in these countries. Most frequent project types here are hydropower, land fill gas
management and leak reduction in natural gas distribution. No HH projects have been
proposed until now.
Country State of CDM projects Categories of CDM projects
Armenia 4 registered, 6 in validation mainly hydropower, also cement production and biogasflaring
Azerbaijan 6 in validation efficient power plants on oil and natural gas, naturalgas flaring, hydropower
Georgia 2 registered, 4 in validation hydropower, landfill gas, gas distribution
Kazachstan specific situation - CDM not possible
Kyrgyzstan 1 in validation landfill gasTajikistan 2 in validation hydropower and afforestation
Turkmenistan still no national CDM authority established
Uzbekistan 7 registered, 9 in validation N2O abatement, gas distribution, landfill gas andhydropower
Table 3: CDM projects in Caucasus and Central Asia3
2.3 Existing household and community level CDM projects
Table 4 summarizes HH projects in the CDM pipeline as of January 2010. HH projects only
represent 1.17% of all CDM projects; more than half of them in the area of energy efficiency,
mostly replacing inefficient light bulbs. The success of HH projects in the CDM project cycleis very low. Only two projects achieved issuance of CERs until now, i.e. the Bagepalli
household biogas project in India4 and a solar cooker project in Indonesia5. Out of 20
registered HH project, seven have been registered more than four years ago without
achieving issuance of CERs.
The situation is different for PoAs: Here HH projects represent 58% of all projects in pipeline,
even the first PoA ever registered was a HH project (distribution of CFL bulbs in Mexico6). It
is too early to tell about the success of these projects in the CDM cycle, but apparently
4 http://cdm.unfccc.int/Projects/DB/DNV-CUK1131002343.1 5
http://cdm.unfccc.int/Projects/DB/TUEV-SUED1135345789.436
http://cdm.unfccc.int/ProgrammeOfActivities/registered.html

8/4/2019 Feasibility Household CDM Atmosfair Draft
http://slidepdf.com/reader/full/feasibility-household-cdm-atmosfair-draft 9/35
9
programmatic CDM has much more potential to stimulate HH projects than the conventional
CDM. However, with only 36 projects in pipeline world wide and just three registered PoAs 6
until April 2010, the impact of programmatic CDM of the reduction of greenhouse gases is
not yet significant.
Project type CDM PoA
CFL bulbs 25 4
Household biogas 8 6
Efficient stoves 7 4
Solar water heaters 3 4
Photovoltaic 5 1
Efficient room heating 5 -
Solar cookers 5 -
Efficient refrigerators 2 -Solar water desinfection 2 -
Composting - 1
Irrigation - 1
Total 62 21
% of all CDM projects in pipeline 1.17% 58.33%
Registered projects 20 2
% of all registered CDM projects 1.04% 67%
Projects with issued CERs 2 -
% of all CDM projects with issued 0.33% -
Total issued CERs 13,000 -
% Total of all issued CERs 0.004% -
Table 3: Summary of existing household and community based CDM projects in pipelin3
It must be noted that transaction costs are much higher for PoA than for conventional CDM
(see next section), which limits the accessibility for local, independent project proponents and
often implies the need for grant funding to pay transaction costs. ODA funding seems to be
involved in the majority of PoAs in pipeline.
2.4 Constraints in current CDM for household and community level
projects
Based on atmosfair’s experiences with project screening, we identify four major constraints
for HH projects under the CDM:
• Carbon credits only obtained ex-post
• High transaction costs
•
Complicated and bureaucratic procedures• General design of the CDM

8/4/2019 Feasibility Household CDM Atmosfair Draft
http://slidepdf.com/reader/full/feasibility-household-cdm-atmosfair-draft 10/35
10
Need for upfront funding
Projects funding through the CDM is obtained by selling carbon credits (CERs); these credits
are obtained ex-post, after proving that the project has been operating and thereby reducing
GHG emissions. HH projects have very limited access to lending and therefore generally
require upfront funding; this represents a significant barrier for such projects under the CDM.
High transaction costs
The transaction costs of CDM are quite independent from the project volume. For HH
projects which are typically small projects, the percentage of the project budget that has to
be spent for transaction costs is much higher than for larger projects; it can reach 50% of the
possible benefits of CDM.
Complicated and bureaucratic procedures
The CDM project cycle is a bureaucratic and time-consuming process; it is a challengeparticularly to HH projects where availability of exact data can be limited and financial
resources for contracting expensive consultants are missing. Also host country approval can
be difficult to obtain in countries without efficient administrative structures.
General design of the CDM
CDM is designed as a market based mechanism which works best for large projects in
emerging countries. HH projects consist in many small units; they are also often located in
poor developing countries with bad infrastructure. These facts make it difficult to apply the
highly formalized and bureaucratic steps of the project cycle, e.g. regarding complicatedmonitoring. An efficient stove project in Nigeria7 encountered serious difficulties to find a
DOE willing to work in the country considered as dangerous.
2.5 The role of women
In rural areas of most Non-Annex 1 countries, women are key actors in managing the
difficulties in everyday’s life. Frequently, labour migration of men further contributes to this
effect. Village people hardly see opportunities for development in their own region. At the
same time, women’s perspectives and their roles are not adequately reflected in hierarchic
village power structures, religious institutions, nor in state policies and many international
projects. Such structures can put barriers to positive developments in villages. Also
international aid programmes sometimes contribute to a passive mentality by accustoming
people to free supplies of goods and modern technologies.
HH projects offer the chance of people - particularly women - becoming their own sustainable
energy managers, based on their own needs and their skills. HH projects can be particularly
benefiting for women, by decrease their time and work-load, liberating time e.g. for
educational activities and improving health conditions with activities like floor insulation and
reduced indoor pollution.
7http://cdm.unfccc.int/Projects/DB/RWTUV1245685309.5

8/4/2019 Feasibility Household CDM Atmosfair Draft
http://slidepdf.com/reader/full/feasibility-household-cdm-atmosfair-draft 11/35
11
Within the CDM project cycle, the local stakeholder consultation is a crucial step to assure a
project design that is in line with the stakeholder’s needs. In the current CDM rules, the local
stakeholder consultation is a formality without stringent requirements. The importance of the
local stakeholder consultation is highly recognized in the Gold Standard rules (see chapter
3.4) with detailed requirements for the organization of the local stakeholder meeting,
including explanations on the participation of women.
3 Evaluation of potential CDM projects at the household
and community level
Based on many years of experience with the screening of possible HH CDM projects, we
present some guidelines to select project ideas with potential for CDM funding. The following
criteria are important since they guarantee that significant, sustainable and measurable
reductions of GHG emissions are achieved at the household level:
Technology
- The technology/activity should provide renewable energy, energy efficiency (or
composting in tropical climates).
- There should be a standardization of the technology/activity disseminating similar
installations of similar facilities.
- Facilities should be durable (lifetime minimum 5 years).
- The technology should be mature for mass production (if produced centrally).
- Infrastructure for dissemination to many households should be available.
CO 2 reduction and significance of CDM funding
- The project should lead to greenhouse gas reduction by saving fossil fuels or non
renewable biomass; or by avoiding methane.
- The financial contribution of carbon credits to project funding should be high, i.e. the
cost per energy unit should be low and the CO2 reduction per energy unit high (i.e.
combination of cheap technology and high baseline).
- CDM funding should play a crucial role for project funding (additionality).
- Infrastructure for monitoring of CO2 reductions should be available (e.g. through
centralized data bases used by micro credits systems).
Implementation and financing
- There should be an experienced and committed institution capable to implement and
coordinate the project.
- There should be possibilities to secure funding for the project (apart from CDM
funding).
- There should be a considerable contribution of beneficiaries to project funding (incash or in kind).
- CDM is particularly suitable for combination with micro credit funding (see 3.3).

8/4/2019 Feasibility Household CDM Atmosfair Draft
http://slidepdf.com/reader/full/feasibility-household-cdm-atmosfair-draft 12/35
12
3.1 Technologies with CDM potential
Based on five years of atmosfair’s experience with screening potential projects, we provide a
general list of technologies for HH projects that can be suitable for CDM funding (table 4).
The list is not complete but covers the most important potential project types. Technologies
in italics are mentioned here but not discussed below because they are not typical HHprojects. Solar cookers are not included since –after years of experience- the potential of
implementing large and successful projects seems to be quite low.
We also give a rough qualitative estimate of specific costs of different technologies, i.e. cost
per unit of energy produced or saved. The potential contribution of CDM funding to energy
generating projects must be seen in relation to the specific cost of a technology, since CDM
funding does not depend on the technology but only on the CO2 reduction achieved by
saving fossil-fuel based energy. Moreover, possible CDM funding depends on the baseline
scenario, mainly the replaced baseline fuel (see next section).
Thermal renewable
energy
Solar water heaters
– moderate cost -
Biogas for cooking
– cheap in tropical climate,
expensive in cold climate
Biomass
briquettes
- cheap
Electric renewable
energy
Photovoltaic lamps (if
replacing kerosene lamps)
– moderate cost -
Micro biomass gasifiers
–moderate cost-
Pico/micro
hydro power
- cheap-
Mechanic renewable
energy
Irrigation based on solar or
wind energy
- moderate-expensive -
Efficient use ofelectric energy
Efficient light bulbs
- cheap -
Efficient refrigerators
- expensive-
Efficient use of
thermal energy
Efficient stoves for cooking
or heating
- cheap -
Home insulation
- cheap -
Efficient use of
mechanical energy
Efficient diesel pumps for
irrigation
- cheap -
Methane reduction Composting of organic
waste- moderate cost -
Table 4: Suitable technologies for household and community based projects under the CDM
3.2 Potential of CO2 reduction according to different baseline scenarios
(basically baseline fuels)
For assessing the potential of greenhouse gas reduction, it is crucial to analyze the specific
baseline fuels that are to be replaced or reduced by a potential CDM project. Therefore, we
first provide details on possible CO2-savings for different baseline fuels. Methane reduction isexplained subsequently.

8/4/2019 Feasibility Household CDM Atmosfair Draft
http://slidepdf.com/reader/full/feasibility-household-cdm-atmosfair-draft 13/35
13
1. Firewood
For CDM projects reducing the use of firewood, two approved small scale methodologies
exist, AMS-I.E8 (renewable energy facilities) and AMSII.G8 (energy efficient facilities).
Examples for corresponding projects are efficient stoves or solar water heaters in regions
where traditional cooking and water heating occurs on wood stoves.
The baseline emissions do not only depend on the quantity of firewood used in traditional
facilities, but also on the fraction of non-renewable firewood (or non renewable biomass
broadly speaking). Where, for example, firewood stems from managed plantations and is
harvested in a sustainable way, it is deemed renewable. In such case, no CERs can be
generated by saving firewood. Where firewood collection leads to desertification, e.g. in the
Sahel zone, its consumption is probably highly unsustainable, allowing for a high CER
generation.
The CDM methodologies require to derive the fraction of non-renewable biomass by
comparing areas of sustainable biomass production, like forests under a sustainable
management, with areas that lack a sustainable management.
Examples of the CCA region:
In Caucasus and Central Asia, we mostly assume intermediate conditions – regrowth is often
fairly good but sustainable management hardly occurs.
In Georgia, regrowth is higher in the humid western and slower in arid south-eastern parts
(e.g. South Kakheti). However, management is highly unsustainable in the whole country
since concessions for timber exploitation are auctioned to private companies even though no
systematic inventories exist (Georgian Times, October 30 2009). The area covered with
forests remained relatively stable during the last years9, but all experts interviewed state thatsevere degradation is occurring in the forests. Protected areas cover ~10% of the country’s
forest area10. Most Central Asian countries have very limited forest resources since the main
ecosystem consists in natural grass lands. Generally, the few existing forests are not
managed sustainably.
We preliminarily assume that a share of 75% non-renewable biomass could be shown for
most countries of the CCA region; however, detailed studies will be needed.
Methodologies AMS-1.E and AMS-II.G offer default values to calculate CO2 emissions that
can be claimed per ton of non-renewable firewood saved, leading to a value of 1.0725t CO2 /t
firewood saved. (This value is derived from a hypothetical use of kerosene as alternativefossil fuel for applications where currently firewood is used; if LPG is more common, 0.945 t
CO2 /t firewood has to be used).
Where dung is used, there is a good chance to argue for so called “suppressed demand”, i.e.
to assume that dung would be replaced by firewood as soon as available and therefore
calculate emissions reductions as if the energy delivered by dung would be delivered by
firewood.
Charcoal is even less efficient as firewood since large amounts of wood are consumed to
produce charcoal. Therefore, the replacement of charcoal allows for even higher emission
8See: http://cdm.unfccc.int/methodologies/SSCmethodologies/approved.html
9See: http://rainforests.mongabay.com/deforestation/2000/Georgia.htm
10See: http://www.ceeweb.org/5th_bidi_in_eu/assessment/Georgia.pdf

8/4/2019 Feasibility Household CDM Atmosfair Draft
http://slidepdf.com/reader/full/feasibility-household-cdm-atmosfair-draft 14/35
14
reductions. A wood-to-charcoal factor of 6 can be used to estimate the wood input per kg of
charcoal. The calorific value of charcoal is only around two times higher in comparison to
wood.
2. Natural gas, LPG and Kerosene If gas is the baseline fuel for thermal applications, the CO2 emissions can be approximated11
by 200g CO2 /kWhtherm or 2kg CO2 /m3. In the case of LPG, the value is ~220gCO2 /kWh or 2.5
kg CO2 /kg and for kerosene 220-250g CO2 /kWh or ~2.5kg CO2 /kg.
3. Coal
Emission factors for coal vary according to the type of coal used. UNEP provides default
values according to different regions12. In the example of the CCA region, the default value is
1.73 kg CO2 per kg coal. For other countries, the factor ranges from 1.4 to 2.4 kgCO2 per kg
coal. If detailed national data are available, higher emissions factors can be claimed.
4. Electricity
National grids: The national grid factor depends on the mix of sources of electricity
generation. It is generally lower in countries with a large share of hydropower. Coal-based
electricity leads to the highest emissions, whilst electricity from gas is relatively “clean”.
There are several ways to determine the emission factor; based on an “operating margin”
(based on all power plants serving the grid excluding “low cost/must run” plants) and a “build
margin” (based on the most recently built power plants)13.
As examples, we indicate emission factors for countries of the CCA region (based on existingCDM projects):
Armenia 0.54 kg CO2 /kWh (Source: Jradzor Small Hydroelectric CDM project14
)
Azerbaidjan 0.53 kg CO2 /kWh
Georgia 0.4 kg CO2 /kWh
Kyrgyztan 0.1 kg CO2 /kWh (estimation, no reliable sources available)
Uzbekistan 0.62 kg CO2 /kWh
Tadjikistan No reliable source available
Table 5: Grid Emission factors for the Caucasus and Central Asia region
5. Off-grid facilities
The default value for decentralized grids where a diesel generator would be the baseline
scenario is generally 0.8kgCO2 /kWh (AMS-I.D)15.
11Calculated using http://www.ipcc-nggip.iges.or.jp/public/2006gl/pdf/2_Volume2/V2_2_Ch2_Stationary_Combustion.pdf
12See: http://www.unep.fr/energy/information/tools/ghg/pdf/GHG_Indicator.pdf
13
See “Tool to calculate the emission factor for an electricity system”,http://cdm.unfccc.int/methodologies/SSCmethodologies/approved.html
14See: http://cdm.unfccc.int/UserManagement/FileStorage/TJ3Y9WX6SFKLVG0C4M817HEB5NOQPZ
15See: http://cdm.unfccc.int/methodologies/SSCmethodologies/approved.html

8/4/2019 Feasibility Household CDM Atmosfair Draft
http://slidepdf.com/reader/full/feasibility-household-cdm-atmosfair-draft 15/35
15
6. Methane reduction
Methane is a powerful greenhouse gas; it is 21 times more harmful than CO 2. Methane
generation occurs where organic waste decays under anaerobic conditions, i.e. with no or
limited availability of oxygen. Carbon credits for methane reduction can be claimed
additionally to credits resulting from CO2 reduction. Composting projects have a potential of
obtaining carbon credits by reducing methane, if disposal of organic waste on large landfill is
avoided. In this case, the calculation of methane reduction due to decaying biomass is
sophisticated16; CERs are obtained at the rhythm of hypothetical decay of the biomass used,
i.e. CERs generated by avoiding the decay of biomass in a certain year are partly obtained in
subsequent years, depending on the velocity of decay which depends on climatic conditions
(see also 4.8). In hot and wet climates, decay is faster. In a composting project in tropical
climate, where organic waste is prevented from being thrown on a large landfill where waste
piles are over 5m high, approximately 0.5 CERs are generated annually if one ton of organic
waste is composted annually.
HH projects generating energy based on waste biomass (biogas from manure or briquettingof biomass) generally have less potential of methane reduction, because in the baseline
scenario, conditions tend to be rather aerobic, e.g. if manure is spread on fields. Significant
methane reduction occurs where in the baseline scenario, manure is disposed into open
lagoons17 or waste biomass is disposed on large waste piles15.
3.3 Combining CDM and microcredit
Microcredits focus on disadvantaged and low income households with no access to
conventional bank credits and financial services. Microcredits are commonly used for
financing income generating activities. To substitute unavailable traditional collateral,
microfinance institutions (MFIs) use unconventional lending methods:
- very small loans (25-1500 US$)
- soft criteria for lending (e.g. based on personal relations and social control)
- group lending and liability
- frequent repayment (weekly, monthly)
- gradually increasing loan sizes
There are several advantages of combining micro credit funding with CDM funding for HHprojects consisting in many small units:
• The need of upfront funding which is a typical barrier for poor households can be
resolved by micro credits.
16See “Tool to determine methane emissions avoided from disposal of waste at a solid waste disposal
site”, http://cdm.unfccc.int/methodologies/SSCmethodologies/approved.html17
E.g. AMS-III.D (Methane recovery in animal manure management systems,
http://cdm.unfccc.int/methodologies/SSCmethodologies/approved.html) which refers to
http://www.ipcc-nggip.iges.or.jp/public/2006gl/vol4.html

8/4/2019 Feasibility Household CDM Atmosfair Draft
http://slidepdf.com/reader/full/feasibility-household-cdm-atmosfair-draft 16/35
16
• A regional MFI network with its knowledge on local social structures, people’s habits,
market situation and probably technology dissemination can act as the CDM project
coordinator or implementing entity in the case of PoAs.
• CDM monitoring can be integrated into financial monitoring of redemptions.
• Carbon funding can be channelled to end users in the form of lowered interest rates orreduces prices for CO2-saving facilities.
• The capitalization of a micro credit fund can be leveraged by expected CER revenues;
also CER buyers can provide upfront funding to capitalize a micro credit fund.
There is a considerable difference between the typical pay back time of micro credits (<2
years) and crediting periods of CDM projects (10-21 years). After end users have repaid their
micro credits, a part of CER revenues could be channelled to them as incentives to
collaborate in CDM monitoring; another possibility is to use parts of CERs revenues a
continuous extension of the micro credit system.
3.4 Potential of obtaining the Gold Standard label
Generally all HH projects have a high potential of receiving the Gold Standard label. Only
projects producing renewable energy or reducing energy consumption on the demand-side
are eligible to the Gold Standard. Of the technologies presented here, only composting is
currently not eligible to the Gold Standard (but there are possibilities that the Gold Standard
includes it into its scope in the future).
The Gold Standard puts special emphasis on the stakeholder consultation; all stakeholders
must be given the opportunity to express their opinion on the project. Expected effects on the
following social and environmental criteria must be assessed in a so-called sustainability
matrix:
Category Environment
- Air quality
- Water quality and quantity
- Soil condition
- Other pollutants- Biodiversity
Category Social Development
- Quality of employment
- Livelihood of poor
- Access to affordable and clean energy service
- Human and institutional capacity
Category economic and technological development
- Quantitative employment and income generation- Balance of payments and investment
- Technology transfer and technological self-reliance

8/4/2019 Feasibility Household CDM Atmosfair Draft
http://slidepdf.com/reader/full/feasibility-household-cdm-atmosfair-draft 17/35
17
Each indicator must be given a score, with “–“ indicating negative impacts compared to the
baseline (which can be neutralized by mitigation measures that need to be defined), “0”
indicating neutral impacts, and “+” indicating positive impacts. For each category, scores
have to be added up. To be eligible under the Gold Standard, the total scoring for at least
two of the three categories must be positive, the third one being neutral. All indicators that
have not been scored neutral (i.e indicators that have either a negative or positive impact on
the project’s sustainability) must be monitored. (This implies an unintended incentive for
project developers not to include too many positive scores in order to simplify monitoring).
4 Description of project ideas for HH projects
In this chapter we describe possible projects based on the technologies with high CDM
potential. Where plausible, examples are given for the CCA region.
4.1 Solar water heaters
Technology
Low-tech Solar Water Heater in
Georgia (source: Rostom
Gamisonia)
Solar water heaters (further on called SWHs) are a simple and effective way to substitute
traditional fuels for water heating by making use of solar radiation. They can be applied by
households for showering or pre-heating of water for other applications such as cooking or
washing. The technology is particularly suitable in regions with high solar radiation and
relatively cold climate – conditions that characterize e.g. the CCA region.
SWHs vary in technology and price. Sophisticated SWHs e.g. using vacuum technology
achieve higher efficiencies but are relatively expensive, in the range of 1000 EUR for a 2m2
SWH suitable for an average HH. Simple SWHs can be much cheaper.
In the example of Georgia, cheap low-tech Solar Water Heaters (SWHs) with 2m 2 collector
area and a 100l tank are promoted by the Rural Communities Development Agency (RCDA),

8/4/2019 Feasibility Household CDM Atmosfair Draft
http://slidepdf.com/reader/full/feasibility-household-cdm-atmosfair-draft 18/35
18
run by Rostom Gamisonia18. The promoted model has been jointly developed by WECF, the
German solar company Solar Partner Süd18, and the French university IUT Annecy18. Water
is running through a black flat plate which is heated by the sun. The heat from the plate is
transferred to the water. To protect the SWH from freezing, anti freeze is added to the water
in the collector and a heat exchanger is used.
The promoted model is based on locally available materials and can be produced by
households themselves upon instruction; also production in small factories is thinkable, in
quantities of 100s or 1000s (information by Rostom Gamisonia). The price for materials is
around 120 EUR (for 2m2). Traditionally, in Georgia, water is heated by gas in urban areas
and by firewood in most rural areas (simply putting a pot on the stove).
CO 2 reduction and significance of CDM funding
The applicable CDM methodologies are small scale methodology AMS-1.C, “Thermal energy
for the user”, in the case of fossil fuel replacement, or AMS-I.E19, “Switch from Non-
Renewable Biomass for Thermal Applications by the User”, in the case of firewood
replacement. The baseline emissions are calculated by estimating the amount of gas or
firewood that would be needed to produce the hot water utilized from the solar collector. If
the use of the SWH leads to a greater consumption of hot water than used before, the
baseline will refer to the amount of firewood or gas needed to heat this greater quantity of
water (concept of depressed demand).
If assuming a consumption per household of 100l of 45° hot water, during 200 days of the
year, emission reductions are calculated as follows (making reference to section 3.2):
- If gas is the baseline fuel, approx. 2000kWhtherm or 200m3 of gas would be needed for
the service, corresponding to approx. 0.4t CO2 /year.- If firewood is the baseline fuel, for heating water on a traditional stove (common in
rural areas in Georgia), emission reductions depend on the share of “non renewable
biomass”. If assuming 1kg CO2 /kg firewood and a stove efficiency half of the gas
boiler efficiency, 4000kWh or 1t of firewood would be needed for the energy service
described above, resulting in approx. 0.5-1t CO2 /year, depending on the share of
non-renewable biomass.
- If coal is the baseline fuel and used under equal conditions as firewood in the
example above, emissions would sum to approx. 0.8-1t CO2 /year.
- The situation is different where electric water heating is the baseline and at the sametime, electricity is mainly produced from fossil fuels. Depending on the grid factor,
CER generation can be up to 1.5t CO2 /year. Under such circumstances, also
commercial SWHs can receive significant funding through the CDM.
The contribution of CDM to the implementation cost per low tech SWH, assuming a CER
price of 12 EUR/CER, is summarized in table 7.
18 www.rcda.ge/En/about.html, www.solar-partner-sued.de, www.iut-acy.univ-savoie.fr
19For both methodologies see: http://cdm.unfccc.int/methodologies/SSCmethodologies/approved.html

8/4/2019 Feasibility Household CDM Atmosfair Draft
http://slidepdf.com/reader/full/feasibility-household-cdm-atmosfair-draft 19/35
19
Baseline
fuel
Emission
Reduction
CER revenues per year
and SWH
CER revenues in 10 years (NPV20
,
10% discount rate)
Gas 0.4t CO2 /year 4.8 EUR 31.2 EUR
Firewood 0.5-1t CO2 /year, 6-12 EUR 37-74 EUR
Coal 0.8-1t CO2 /year. 9.6-12 59-74Electricity Up to 1.5t
CO 2 /year.
up to 18 EUR up to 111 EUR
Table 6: Estimate of the financial contribution of CDM to Solar Water Heater projects
The contribution of CDM funding is high in comparison to the price of 120 EUR for a low-tech
SWH. For commercial and rather expensive SWHs, the contribution of CDM is only attractive
where in the baseline case, water is heated by fossil-fuel based electricity. Otherwise, it
would only be in the range of a few percent.
If CDM funding is considered right from the beginning of the project, the demonstration ofadditionality should not present a problem where low-tech SWHs are implemented.
For the monitoring of CO2 reductions, all SWHs should be recorded in a database. Average
annual CO2 savings per SWH should be determined during validation phase through a
survey of a representative sample of SWHs where quantity and temperature of hot water
used are recorded. During monitoring, it must then only be shown that SWHs are functional
and in use, possibly by sampling. If combined with a micro credit system, the payment of
instalments can be used for cross-checking, assuming that a customer who pays also makes
use of his SWH.
Implementation of a potential project
Qualified instruction would be needed in case of construction by beneficiaries themselves.
Also if industrially produced SWHs are implemented, qualified workforce is required for
adequate installation. A network of para-engineers would have to be set up.
Implementation could best be financed through a micro credit network offering financial and
also technical support to the households. Households will only pay instalments if their SWH
is functional. Therefore, the combination with a micro credit system can also reduce the risk
of technical failure.
Dissemination of more than 5,000 SWHs will require a large network for promotion, delivery,
capacity building and monitoring. A lower number of installations would not justify the effort of
CDM approval. The disseminated SWHs must be technically mature and easy to use.
Damages e.g. due to freezing should be avoided without excessive need for technical
support after installation. A high rate of failures will directly lead to highly reduced CER
generation.
Since CER generation will be based on consumption of hot water, financial planning must be
based on realistic estimates of the quantities of hot water that are a) produced by SWHs and
b) really used by households. Therefore, the quality of the baseline survey is decisive.
20Net Present Value, see http://en.wikipedia.org/wiki/Net_present_value

8/4/2019 Feasibility Household CDM Atmosfair Draft
http://slidepdf.com/reader/full/feasibility-household-cdm-atmosfair-draft 20/35
20
Necessary steps would consist in:
- Conduct a baseline survey leading to a statistically sound estimate of
a) type and amount of fuel consumption for traditional water heating and
b) average annual amount of hot water that households will use from SWHs after
their installation (based on a pilot sample).- Create infrastructure for producing and disseminating some 10,000 SWHs to
households, install them in a standardized way and make sure they keep working for
at least some 10 years.
- Integrate CDM funding into the financing structure, at best in the form of partial
upfront funding contributing to capitalize a micro credit fund.
- Start the CDM registration procedure.
- Set up a system to register all households that have obtained SWHs under the
project, allowing to find these households afterwards, if necessary.
Examples of registered CDM projects
Project can be viewed by typing the reference number into the “project search” mask at
http://cdm.unfccc.int/Projects/index.html
Ref. 79 Kuyasa low-cost urban housing energy upgrade project,Khayelitsha (Cape Town; South Africa)
South Africa
4.2 Biomass briquettes for cooking
Technology
There is a potential for producing biomass briquettes or pellets where large agricultural or
timber facilities accumulate high amounts of suitable biomass with high calorific value such
as sunflower shells or saw dust. By converting biomass into briquettes or pellets, it can be
stored and transported and conditions of combustion are improved. For the evaluation of the
viability of producing biomass briquettes, the cost of energy required for compacting biomass
is an important factor.
Waste biomass can be regarded as renewable energy and can replace firewood or coal used
for cooking and heating by households. For a potential CDM project, the consumption of
biomass briquettes would be in the centre of the project since emission reductions dependon the fuel that is replaced by briquettes or pellets.
CO 2 reduction and significance of CDM funding
The applicable CDM methodology is the small scale methodology AMS-1.C21, “thermal
energy for the user”. Where decaying biomass leads to methane production in the baseline
scenario, a combination is possible with AMS-III.E21 “Avoidance of methane production from
decay of biomass through controlled combustion, gasification or mechanical/thermal
treatment”.
21See: http://cdm.unfccc.int/methodologies/SSCmethodologies/approved.html

8/4/2019 Feasibility Household CDM Atmosfair Draft
http://slidepdf.com/reader/full/feasibility-household-cdm-atmosfair-draft 21/35
21
For calculations of profitability, the cost of briquette production is decisive since the resulting
price of briquettes should be lower than the price of alternative fuels (firewood, coal, gas or
electricity):
- A 45kW press with an output of 900kg/h costs around 150,000 EUR (smaller
machines with 150kg/h output are available at around 20,000 EUR)22. Electricity
consumption of the large machine is around 40kWh per ton of briquettes (small
machines are less efficient). At a cost of 0.10EUR/kWh, electricity costs per ton of
briquettes/pellets are around 5 EUR. For pellet production, energy consumption is
around 25% higher.
- For an economically sustainable production of briquettes, these must be sold at
prices of around 25 EUR/ton. (At a price of 20 EUR/ton, the NPV becomes positive at
a discount rate of 10%, a 10 years time horizon and 3000 hours of annual operation.
But this does not include costs of dissemination and project preparation).
The result indicates that projects are viable in countries with moderate and high prices for
firewood. E.g. in Georgia, a firewood price of some 50EUR/ton can be regarded as aconservative estimate, indicating good chances of achieving financial viability. In countries
where firewood is very cheap, e.g. Bolivia, where only 15EUR/ton of firewood are common,
biomass briquettes can hardly compete with firewood.
To asses the contribution of CDM funding to project costs, it is most sensible to compare
CER revenues with the price of the produced briquettes (reference to chapter 3.2 is made):
- If coal is replaced (emission factor of 1.73t CO2 /ton assumed), and 12 EUR are
assumed as CER price, CDM would contribute some 10EUR per ton of briquettes
produced. (1 ton of briquettes could possibly replace 500kg of coal, assuming a 50%lower calorific value).
- If firewood is the replaced baseline fuel (1tCO2 /ton assumed), CDM contributes 5-10
EUR per ton of briquettes, depending on the share of non-renewable biomass.
- Additional emission reductions might be achieved in specific cases by methane
reduction (see 3.2).
CDM could thus help to reduce the price of briquettes/pellets significantly:
Replaced fuel CER revenues per ton of briquettes
Firewood 5-10 EUR
Coal 10
Table 7: Estimate of the financial contribution of CDM to biomass briquetting project
The contribution of CDM funding is very significant if the price of briquettes is in the range of
25 EUR; therefore the demonstration of additionality should not be a problem.
For the monitoring of CO2 reductions, sales of briquettes must be monitored. (Average CO2
savings per ton of briquettes should be determined during validation phase through a survey
22Information from Marco Wagner, http://www.projects-online.de/
8/4/2019 Feasibility Household CDM Atmosfair Draft
http://slidepdf.com/reader/full/feasibility-household-cdm-atmosfair-draft 22/35
22
of traditional fuels used in the target area). During the monitoring phase, only quantities of
briquettes sold in defined target areas would have to be monitored, in combination with spot
checks to confirm the replacement of the baseline fuel for cooking.
Implementation of a potential project Centrally available biomass is a precondition for project planning. Depending on the
circumstances, a briquetting machine could be run by a cooperative. The entire chain of
sales of briquettes must be integrated into the project management.
It has to be assured that there is no significant competing use of the waste biomass, such as
energetic use or use as fertilizer. It can also be a challenge to supervise the entire chain of
sales. The initial investment to implement briquetting machines is high. CDM is only
reasonable if more than 5000tons of briquettes are produced and sold annually.
The following steps would have to be taken:
- Identify places where suitable waste biomass is centrally available; assess technicalfeasibility of briquette production.
- Assess market potential of biomass briquettes.
- Conduct a baseline survey leading to a statistically sound estimate of emission
reductions per ton of briquettes, according to the replaced cooking fuel(s).
- Start the CDM registration procedure.
- Set up a system to monitor sales and final use of briquettes.
- Integrate CDM funding into the financing structure, e.g. as partial upfront funding for
the implementation of the briquetting plant or as subsidy for reduced briquette prices.
4.3 Biogas for cooking
Technology
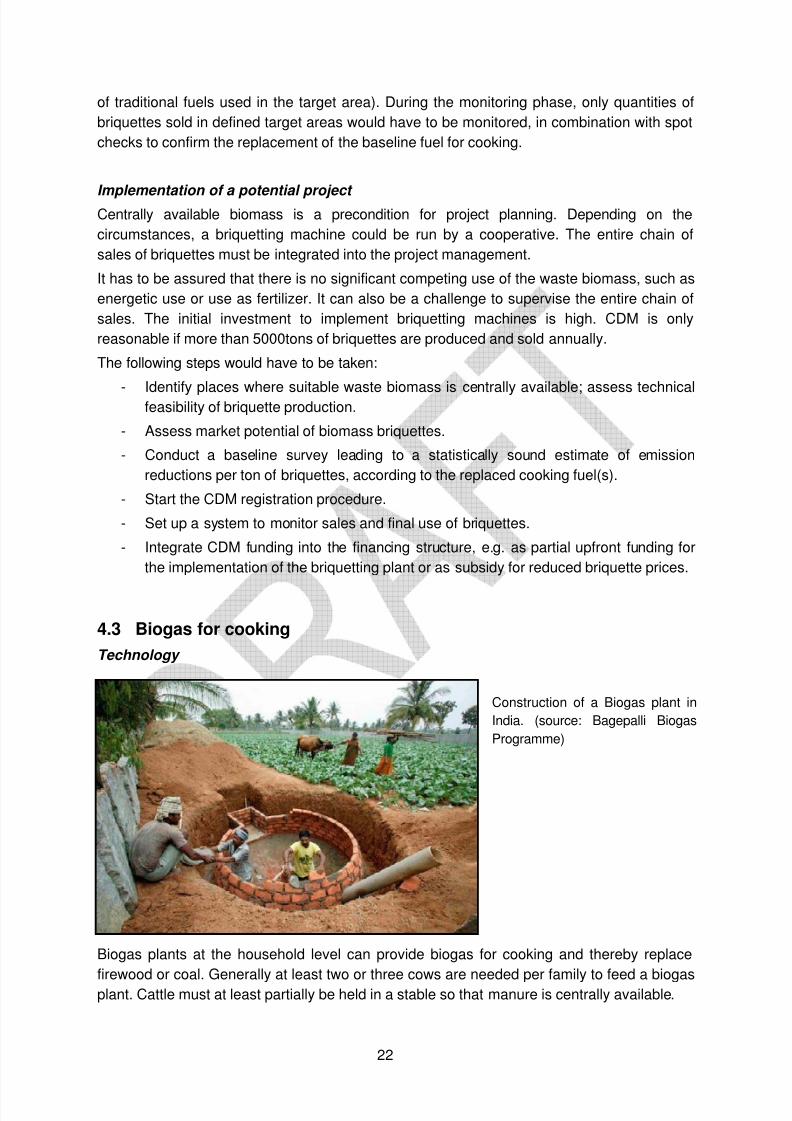
Construction of a Biogas plant in
India. (source: Bagepalli Biogas
Programme)
Biogas plants at the household level can provide biogas for cooking and thereby replace
firewood or coal. Generally at least two or three cows are needed per family to feed a biogasplant. Cattle must at least partially be held in a stable so that manure is centrally available.

8/4/2019 Feasibility Household CDM Atmosfair Draft
http://slidepdf.com/reader/full/feasibility-household-cdm-atmosfair-draft 23/35
23
Biogas production is hampered by cold temperatures, therefore, in colder climates, biogas
plants must be much larger (10-30m3 digester volume per household instead of 8-20m3 for
hot climates23) which leads to higher prices. In the tropics, low-tech systems at the household
level cost between 200 and 400 EUR. In the CCA region, the price for biogas plants is
relatively high, in the range of 1500-4000 EUR. In cold climates, biogas plants are often
equipped with heaters based on e.g. electricity.
CO 2 reduction and significance of CDM funding
The applicable CDM methodologies are small scale methodologies AMS-1.C “thermal energy
for the user”, in case fossil fuels are replaced, and AMS I.-E. “Switch from Non-Renewable
Biomass for Thermal Applications by the User” in case of firewood replacement24. At the
household level, methane reduction can only be claimed if clearly anaerobic conditions occur
in manure storage, e.g. liquid storage in tanks or lagoons (see 3.2).
Without methane recovery, CO2 reduction only occurs through the replacement of the
cooking fuel, which can be fire wood, coal, LPG or kerosene.
In order to estimate of emission reductions according to the different baseline fuels, we
assume a load factor of the biogas plant of 75% (e.g. use for cooking during approx. 270
days/year); for emissions factors, we use values given in section 3.2.
• Fire wood: We assume annual firewood consumption of 4t per household (source),
which is a typical value for simple and inefficient stoves25. Depending on a share of
non renewable biomass of 50-100%, emissions result from 1.5-3t CO2 /a
• Coal: At an assumed annual consumption of 1.5-2t, emissions are ~3t CO2 /a
• LPG: We assume an annual consumption of 200kg, resulting in CO2 emissions of
approximately 0.5t CO2 /a
• Kerosene: If Kerosene is the baseline fuel, and assuming a consumption of 1 litre per
household per day26, resulting emission reductions are ~1t CO2 /a.
The contribution of CDM to the implementation cost per biogas unit, assuming a CER price
of 12 EUR/CER, is summarized in table 9:
Baseline
fuel
Emission
Reduction
CER revenues per year
and biogas plant
CER revenues in 10 years (NPV,
10% discount rate)
LPG 0.5t CO2 /year 6 EUR 37 EUR
Kerosene 1t CO2 /a 12 EUR 74 EUR
Firewood 1.5 – 3t CO2 /year 18-36 EUR 110 - 221 EUR
Coal 3t CO2 /year 36 EUR 221 EUR
Table 8: Estimate of the financial contribution of CDM to biogas projects for households
23Confusion is possible with volume indications; in India, normally the gas generation potential is indicated, versus in most other
countries, the digester volume is given
24
See: http://cdm.unfccc.int/methodologies/SSCmethodologies/approved.html 25For examples, see ftp://ftp.fao.org/docrep/fao/009/j8227e/j8227e00.pdf
26 See energy equivalent calculation of Bagepalli Biogas Programme, http://cdm.unfccc.int/Projects/DB/DNV-
CUK1131002343.1/iProcess/DNV-CUK1193051404.74/view

8/4/2019 Feasibility Household CDM Atmosfair Draft
http://slidepdf.com/reader/full/feasibility-household-cdm-atmosfair-draft 24/35
24
CDM is an attractive funding option where cheap biogas plants are installed in the tropics (at
prices below 500 EUR). In temperate climates, CDM should not always be a viable option.
Implementation of a potential project
The implementation of a HH project based on biogas would be equivalent to the proceduredescribed for SWHs. A specific constraint is the high cost of biogas plants in cold climates.
Here, CDM will probably only be viable if carbon-intensive baseline fuels such as coal are
replaced. It is also important to assess the potential of installing biogas plants. In Georgia,
e.g., there is a limited potential, because of the limited number of household possessing
cattle in the country. It might be difficult to identify the required number of ~5,000 potential
biogas plants users.
Examples of registered CDM projects
Project can be viewed by typing the reference number into the “project search” mask athttp://cdm.unfccc.int/Projects/index.html
Ref. 2221 Hubei Eco-Farming Biogas Project Phase I China
Ref. 121 Bagepalli CDM Biogas Programme (5500 units of 2 m3) IndiaRef. 2591 Biogas CDM Project of Bagepalli Coolie Sangha India
Ref. 136 Biogas Sector Partnership Nepal (6500 units) Activity-1 Nepal
4.4 Solar cooking
Solar cookers generate heat by concentrating sunlight and can thereby provide energy forcooking. Most common types are simple and cheap box cookers as well as well as rather
expensive parabolic cookers. The latter work much faster.
Massive distribution of solar cookers has rarely proven to be sustainable, mainly due to the
need of changing cooking habits, since solar cookers can only be used during hours of
sunshine. In terms of CDM, solar cooking is very similar to cooking with biogas. We do
therefore give a detailed description here.
Examples of registered CDM projects
Project can be viewed by typing the reference number into the “project search” mask athttp://cdm.unfccc.int/Projects/index.html
CDM2750 2307 Federal Intertrade Pengyang Solar Cooker Project ChinaCDM3294 2311 Federal Intertrade Hong-Ru River Solar Cooker Project China
CDM3631 2924 Ningxia Federal Solar Cooker Project China
CDM2753 Federal Intertrade Yulin Solar Cooker Project China
CDM0256 414 Solar steam for cooking and other applications IndiaCDM0159 218 CDM Solar Cooker Project Aceh 1 Indonesia

8/4/2019 Feasibility Household CDM Atmosfair Draft
http://slidepdf.com/reader/full/feasibility-household-cdm-atmosfair-draft 25/35
25
4.5 Photovoltaic lamps (replacing kerosene lamps)
Technology
Photovoltaic lamps (PV lamps) generally consist in a small solar
panel and a low-energy-consumption lamp with a battery. Also
systems with centralized recharging stations are in use27
. Theycan provide light to poor households without grid connection or
with a very unstable electricity service. All over the world, the
common source of light in such households are kerosene lamps.
Most PV lamp sets available on the market cost around 50EUR
which is expensive for poor households.
Photovoltaic lamp
(source: d-light)
Another issue is durability since many models have a life time of less than three years.The example of the d.light project in India28 is an attempt to overcome these difficulties. The
project sells high quality LED lamps connected to solar panels that replace the traditional
kerosene based lamps. These lamps are produced in large quantities in China; the low price
is only possible due to an envisioned production of millions of lamps. The life time of these
lamps surpasses five years.
CO 2 reduction and significance of CDM funding
The applicable methodology is AMS I.A29 (“Electricity generation by the user “). The basis for
claiming carbon credits is the comparison of how much kerosene would be needed to receivethe same level of lighting (lumen output).
The average reduction per light output (lumen) is ~ 2.5 kg of CO2 per year. For example, a
typical PV lamp, with an output of 55 Lumen (see picture) replaces 54 litres of Kerosene per
year (if used 3.5 hours a day) and thus avoids 0.14 t of CO 2 per year. At a supposed CER
price of 12 EUR, the discounted CER value corresponds to approx. 10 EUR or 50% of a
lamp’s value, allowing for a significant reduction of prices. The financial contribution of CDM
is high enough to demonstrate additionality. Monitoring requires to track the number of solar
lamps in use by using sampling methods.
Baseline Emission Reduction
per lamp
CER revenues per
year
CER revenues in 10 years (NPV, 10%
discount rate)
Kerosene 0.14t CO2/year 1.68 EUR 6.37 EUR
Table 9: Estimate of the financial contribution of CDM to photovoltaic lamp projects
Implementation of a potential project
27 www.sunlabob.com28
See: http://cdm.unfccc.int/Projects/DB/TUEV-SUED1245158196.62/view 29
http://cdm.unfccc.int/methodologies/SSCmethodologies/approved.html

8/4/2019 Feasibility Household CDM Atmosfair Draft
http://slidepdf.com/reader/full/feasibility-household-cdm-atmosfair-draft 26/35
26
Since a huge number of lamps is needed to make the project viable, a system of retailers
has to be established. Micro credit financing seems not to be a priority option since the
reduced price of lamps could be affordable to households even in poor countries.
Given high CDM transaction costs, a PV lamp project would need to embrace at least 70,000
PV lamps (of the 55 lumen model) to reduce around 10.000t of CO2 per year. Even if
households acquire e.g. 3 lamps each, 24,000 households would need to participate.
The battery is a critical part of PV lamps. Batteries based on lead are cheapest; however, a
recycling system for used batteries must be in place to avoid pollution. The establishment of
such a recycling system should be arranged together with the establishment of the network
of retailers.
The steps to take would be equivalent to the steps described for SWHs.
Examples of registered CDM projects
Project can be viewed by typing the reference number into the “project search” mask athttp://cdm.unfccc.int/Projects/index.html
Ref.2279
Rural Education for Development Society (REDS) CDM PhotovoltaicLighting Project
India
Ref.2699
D.light Rural Lighting Project India
Ref.182
Photovoltaic kits to light up rural households (7,7 MW) Morocco
4.6 Irrigation
There is a considerable potential of reducing emissions caused by traditional, inefficient
diesel pumps applied for irrigation, particularly in India. Projects can replace diesel pumps by
photovoltaic pumps or wind pumps. These technologies are relatively efficient if applied for
pumping since energy can be stored in the form of lifted water; thereby inefficient storage of
electric energy in batteries is avoided. However, both technologies still require high upfront
investments. In mountainous areas, hydraulic rams are another option for renewable
pumping services.
Also the improvement of the efficiency of diesel pumps has potential for CDM funding if
applied within a large, standardized program.Detailed calculations are not presented in this study since the global potential of community
based irrigation projects is relatively low.
4.7 CFL bulbs
Technology
CFL bulbs are available from a large number of producers. They can produce the same
lighting output as incandescent bulbs whilst only consuming 15-30% of the electricity.
There are considerable differences in prices and qualities. High quality is also reflected in ahigher life time which is crucial for CDM projects since credits can theoretically be obtained
during 10 years for each CFL bulb. Typically, the lifetime of a high quality CFL bulb is at

8/4/2019 Feasibility Household CDM Atmosfair Draft
http://slidepdf.com/reader/full/feasibility-household-cdm-atmosfair-draft 27/35
27
least 8,000 hours, i.e. 8 times that of incandescent lamps. Assuming an average usage time
of 3.5 hours per day, a high quality CFL bulb can have a life time of more than 6 years. The
cost of CFL bulbs is in the range of 3 EUR/unit.
CO 2 reduction and significance of CDM funding This type of project works in countries with a relatively high grid emission factor (i.e. rather in
Armenia than in Kyrgyztan, see above). If the grid factor is above ~0.7kg CO2/ /kWh, a project
could probably be funded 100% by selling carbon credits.
There are two SSC-methodologies which can be used, AMS II.C30 (“Demand-side energy
efficiency activities for specific technologies”) and AMS II.J.30 (“Demand-side activities for
efficient lighting technologies”). The latter is more conservative but less restrictive in
monitoring since a default value of 3.5 hours of use per day may be applied. AMS II.J is thus
easier to use than AMS II.C., which requires continuous measurement of daily lighting usage
of CFL bulbs in a project sample group.
When applying methodology AMS II.J., CFL bulb projects must ensure that CFL bulbs are
either directly installed, or at least a minimal price is charged, or a maximum of six lamps per
household are distributed. These limitations are set to avoid leakage. In order to calculate the
emission reductions per light bulb, the energy savings per CFL bulb are multiplied by the grid
emission factor. For a 20 Watt CFLs bulb replacing an incandescent bulbs with a rated power
of 100 Watt, the annual energy savings are 80 Watt x 3.5 hours/day x 365 days = 102 kWh/
year. The methodology requires the use of conservative adjustment factors for lamp failure
rates and grid losses. As a result, for a crediting period of 5 years, 465 kWh of energy
savings could be claimed, i.e. 93 kWh per year. If taking Georgia as an example (emission
factor of the grid 0.4 kg CO2 /kWh), emission reductions per household are 93 kWh * 0.4 = 37kg CO2 /year. CER revenues directly depend on the grid factor in the corresponding country
(see figure below).
Assuming a CER price of 12EUR, the discounted CER revenue over 5 years covers more
than 50% of the price of a CFL light bulb.
Baseline Emission
Reduction
CER revenues per
year
CER revenues in 5 years (NPV, 10%
discount rate)
Electricity Grid
Georgia
0.037 t CO2 /year 0.45 EUR 1.69 EUR
Table 10: Estimate of the contribution of CDM to CFL bulb projects
30 http://cdm.unfccc.int/methodologies/SSCmethodologies/approved.html

8/4/2019 Feasibility Household CDM Atmosfair Draft
http://slidepdf.com/reader/full/feasibility-household-cdm-atmosfair-draft 28/35
28
CERs p.a.
Emission Factor
0
1.000
2.000
3.000
4.000
5.000
6.000
7.000
Kyrgyztan Georgia Azerbaidjan Armenia Uzbekistan
Country
C E R s p . a .
0
0,2
0,4
0,6
0,8
1
E m i s s i o n F a c t o r ( k g
C O 2 / k W h )
Correlation between Grid Emission Factor and CER Output for CFL projects (100,000 20 Watt
CFLs bulbs replacing 100 Watt incandescent light bulbs)
Monitoring includes recording of lamp distribution data, i.e. the number, date and types of
CFLs distributed, the number and power of the replaced devices and contact data of the
users to identify the beneficiaries of the CFL project. The failure rate of CFL bulbs must be
demonstrated by statistically sound samples every 3 years. The monitoring methodology also
requires that replaced incandescent bulbs are destroyed and not used in other households.
Implementation of a potential project
To achieve emission reductions of 10,000 t per year, taking the example from Georgia
described above, more than 60,000 households would need to participate. It might be easiest
to distribute CFL bulbs for free to households handing in a functional incandescent bulb in
exchange (this is done in a PoA in Mexico31). Thus no retailers would be needed but
brigades of agents visiting households directly or distributing CFLs at centralized distribution
points. Upfront funding managed by the coordinating entity will be needed to set up such
structures.
It is important to set up a recycling system for used CFL bulbs since these contain mercury.
The steps to take would be equivalent to the steps described for SWHs.
Examples of registered CDM projects
Project can be viewed by typing the reference number into the “project search” mask at
http://cdm.unfccc.int/Projects/index.html
Ref. 1754 Visakhapatnam (India) OSRAM CFL distribution CDM Project India
Ref. 2457 Yamunanagar & Sonipat (India) OSRAM CFL distribution CDM Project India
Ref. 2709 Chhattisgarh Lighting Improvement Project ( CLIP) in RajnandgoanCircle, Chhattisgarh
India
Ref. 2476 Pune (India) OSRAM CFL distribution CDM Project IndiaRef. 2535 CUIDEMOS Mexico (Campana De Uso Intelegente De Energia Mexico)
- Smart Use of Energy MexicoMexico
31See: http://cdm.unfccc.int/ProgrammeOfActivities/poa_db/17BH6AJX524TYQUZF8KGCWV3OIPSE9/view

8/4/2019 Feasibility Household CDM Atmosfair Draft
http://slidepdf.com/reader/full/feasibility-household-cdm-atmosfair-draft 29/35
29
4.8 Efficient stoves for cooking or heating
Technology
Efficient cook stove Save80
(Source: DARE Nigeria)
There are many examples of efficient stove projects in many parts of the world. Biomass
supply for cooking and also heating represents a significant expenditure for many poor
households; at the same time, unsustainably firewood harvesting leads to desertification and
inefficient stoves cause respiratory diseases.
The principle of efficient stoves consists in a rather complete combustion of firewood and
channelling of the heat to the pot; in the case of room heating, it is important that only a small
fraction of the heat is released to the air through the chimney.
Efficient stoves need to be tested to demonstrate that their efficiency is clearly better than the
efficiency of traditional stoves. If applied for CDM projects, it should be assured that alldisseminated stoves (or types of stoves) have a similar efficiency. Moreover, they should
have a lifetime of at least 5 years. Stoves must be adapted to the cooking (and heating)
habits of the target group. If a stove is used both for heating and cooking, its efficiency in
summer time when no heating is required should not be too low.
Prices and qualities of efficient stoves on the market are very different. In Africa, they range
from mud stoves with nearly no material costs to stoves imported from Germany that cost
around 100EUR (60EUR if subsidized by CDM), called Save8032. Experience shows that
consumers who pay high prices for firewood (e.g. in towns in the north of Nigeria) are ready
to pay high prices for high quality stoves that guarantee for high firewood savings.
In Georgia and Kyrgyzstan, stoves for heating and cooking are produced in pilot projects that
reduce fuel consumption by some 50%, at a price of 80-200EUR.
CO 2 reduction and significance of CDM funding
As explained in chapter 3.2, CO2 savings depend on the avoided consumption of non-
renewable biomass. It is important to evaluate if the efficient stove completely replaces the
traditional system or if only a partial replacement is achieved (which can happen in the case
of mobile cooking stoves). The methodology for efficient stoves (AMS-II.G) offers default
values for traditional cooking systems, 10% for three stone fires and comparable systems
32 see http://cdm.unfccc.int/Projects/DB/RWTUV1245685309.5/view

8/4/2019 Feasibility Household CDM Atmosfair Draft
http://slidepdf.com/reader/full/feasibility-household-cdm-atmosfair-draft 30/35

8/4/2019 Feasibility Household CDM Atmosfair Draft
http://slidepdf.com/reader/full/feasibility-household-cdm-atmosfair-draft 31/35
31
Examples of registered CDM projects
Project can be viewed by typing the reference number into the “project search” mask at
http://cdm.unfccc.int/Projects/index.html
Ref.
2711
Efficient Fuel Wood Stoves for Nigeria Nigeria
Ref.2969
CDM LUSAKA SUSTAINABLE ENERGY PROJECT 1 Zambia
4.9 Home insulation
Technology
There is a huge potential for saving CO2 emissions by better insulation of buildings especially
in the CCA region – which contains most Non-Anex 1 countries with cold winters. In Central
Asia, some 80% of household energy is used for room heating. The potential of energy
saving through simple and affordable measures can easily reach 50%.The largest energysaving potential is generally found in the replacement of old windows. However, a detailed
energy audit will necessary to define the best strategy for energy savings in each specific
case. However, it is very complicated to define baseline and monitoring plans in large CDM
projects. It would work best in the case of standardized homes such as the refugee
settlements in Georgia (IDPs). Other options are projects dealing with very large public
buildings such as schools or hospitals.
CO 2 reduction and significance of CDM funding
There is an applicable small scale methodology, AMS.II.E35, “Energy efficiency and fuel
switching measures for buildings”. Emission reductions depend on the fuel used for heating;
coal reduction offers the highest potential for emission reductions. Due to the diversity of
possible measures and related costs, no quantified costs are given here. But potential CDM
funding can be very significant where baseline emissions are high and energy standards low.
If due to the insulation measure, the mean indoor temperature gets higher due to suppressed
demand before project implementation, the baseline would be the amount of fuel needed to
reach this higher temperature, as long as it stays within reasonable limits, e.g. 19°C.
Implementation of potential projects
As mentioned above, implementation in many small units is most feasible if standardized
measures are applied to standardized buildings. Since the investment is required when
starting the project and later there is a pay-back through energy savings, financing would
best be managed by microfinance. CDM funding could be combined with a micro-financing
structure.
Examples of existing CDM projects
Project can be viewed by typing the reference number into the “project search” mask at
http://cdm.unfccc.int/Projects/index.html
Ref. 79 Kuyasa low-cost urban housing energy upgrade project,Khayelitsha (Cape Town; South Africa)
South Africa
35 http://cdm.unfccc.int/methodologies/SSCmethodologies/approved.html

8/4/2019 Feasibility Household CDM Atmosfair Draft
http://slidepdf.com/reader/full/feasibility-household-cdm-atmosfair-draft 32/35
32
4.10 Composting of organic waste
Technology
The anaerobic decomposition of organic waste from households generates methane which isan important source of green house gases. Anaerobic conditions occur on large landfills or
informal dump sites, where waste is mounted up to large piles which persist for several
years. Accordingly, composting projects are more feasible in an urban context, since in rural
areas, organic waste is rarely deposited in landfills. Moreover, methane generation is higher
in wet tropical climate where decay rates are significantly higher.
Composting of organic waste is an aerobic process, if done properly. The waste has to be
left in small piles or in boxes; in case of forming large piles, blowers must be used to
introduce oxygen.
An example for a community based composting project is the Indonesian KIPRAH project36,
where several waste recycling facilities that serve some 1,000 households each are
implemented and run by neighbourhood organizations. In these facilities, waste is collected,
separated and recycled, deposited or composted. For CDM projects, such a centralized
composting is much more suitable than household level composting.
CO 2 reduction and significance of CDM funding
CDM small scale methodology AMS-III.F37 (Avoidance of methane emissions through
controlled biological treatment of biomass) is applicable for composting projects. Achievable
emissions reductions depend on the conditions of waste decay in absence of the project.
Methane generation is highest if waste is dumped to unmanaged waste disposals with adepth of >5m. If waste is burned, only methane generation before burning occurred can be
accounted for.
For the calculation of emission reductions, a first order decay model38 has to be applied
which simulated the decomposition of waste in absence of the project. CERs are only issued
in the rhythm of simulated waste decay, i.e. for a ton of organic waste avoided in year x,
CERs are obtained during several years depending on how fast the decay would have taken
place. If the quantity of waste composted annually is constant over the project’s duration,
CER revenues will increase over the years. Potential CER revenues are highly dependent on
the climate (see table 12).
36 http://cdm.unfccc.int/UserManagement/FileStorage/3CEHJR07WGKNQY84MOVBPFTX2DZ6I5
37 http://cdm.unfccc.int/methodologies/SSCmethodologies/approved.html 38
“Tool to determine methane emissions avoided from disposal of waste at a solid waste disposal site (see:
http://cdm.unfccc.int/methodologies/SSCmethodologies/approved.html)

8/4/2019 Feasibility Household CDM Atmosfair Draft
http://slidepdf.com/reader/full/feasibility-household-cdm-atmosfair-draft 33/35
33
CER generation for project
example:
Coverage (HHs): 20,000
Ton organic waste/HH*a: 0.5
% of waste brought to final dumpsite: 50%
Tons of organic waste treated annually: 5,000
Depth of waste piles at dumpsite: >5m
year Tropical wet Temperate wet Tropical dry Temperate dry
year 1 1246 638 308 220
year 2 2082 1169 591 427
year 3 2642 1610 851 623
year 4 3017 1977 1090 807
year 5 3268 2281 1309 980
year 6 3437 2534 1510 1143
year 7 3550 2745 1695 1296
year 8 3626 2920 1865 1441
year 9 3677 3065 2021 1577
year 10 3711 3186 2164 1706
Table 12: Potential CER of a composting project under different climates39
Project costs can hardly be generalized. In the project example from Indonesia,
implementation costs ~30,000 EUR per composting facility covering 1,000 households;
operating costs are in the range of 5,000 EUR/year. CDM can just cover some 50% of
annual operating costs.
Implementation of a potential project
In tropical wet climates and where the baseline consists in landfills, a project must comprise
some 100,000 household to justify CDM.
For composting, organic waste must be separated from non-organic waste which can be
done at the household level or ex-post in waste recycling facilities. Ex-post separation is
more labour-intensive but waste separation at the household level has hardly been
implemented in CDM countries. Apart from CDM funding, financial sustainability depends on
revenues from service fees paid by households, income from selling recycled materials and
compost. CDM upfront funding could be used to cover a part of the initial investment. In theIndonesian project example, hardware is funded by local government whilst CDM is used for
funding community empowerment and operating costs.
Capacity building and permanent monitoring of communities shows to be critical for the
project in Indonesia.
In the CCA region, the potential of using CDM funding for composting projects is small since
the climate is temperate and dry, leading to low decay of biomass and therefore reduced
CER generation.
The steps to take would be equivalent to the steps described for SWHs.
39According to the tool mentioned in the footnote just above, tropical wet climate is defined by precipitation >
1000mm, temperate wet climate is defined by an evapo-transpiration lower than precipitation.

8/4/2019 Feasibility Household CDM Atmosfair Draft
http://slidepdf.com/reader/full/feasibility-household-cdm-atmosfair-draft 34/35
34
5 Proposal to improve the accessibility of the CDM for
household and community level projects
Based on experiences with developing HH CDM projects, we suggest changes of the CDMrules, in order to improve the accessibility for HH projects. WECF and atmosfair have already
presented these suggestions in several occasions to UNFCCC institutions40.
1. A funding mechanism for household and community level projects
This mechanism should:
- Provide grants for CDM project development and transaction costs, e.g. validation
- Grant upfront funding for project implementation as a soft loan to be returned by
Certified Emission Reductions (CERs)
- Buy CERs from such projects at fixed and high prices
2. Simplified approval procedures for household and community level projects
Requirements for project registration should be highly simplified, by:
- Implementation of a specialized UNFCCC working group
- Establishment of specialized Designated Operational Entities (DOEs) to
guarantee faster and cheaper validation procedures
- Establishment of extremely simplified methodologies for household and
community level projects, e.g. by defining standardized sectoral baselines and
skipping additionality demonstration.
The barriers for HH projects have not been directly discussed in the EB until now; however,
since 2006, there has been a discussion on the regional distribution of CDM projects, aiming
at increasing the share of CDM in Africa, least developed countries and small island
developing countries (EB 26, 35, 46, 50, e.g. annex 54 of EB 50). In this context, several
measures have been discussed which could help to overcome some of the barriers for HH
projects. Some of the ideas have already been put into practice such as the abortion of the
registration fee and some capacity building measures. It is also probable that the
assessment of additionality will be substantially simplified for very small HH projects (<5MWof renewable energy production or <20GWh of energy savings)41.
Some progress has also been achieved in terms of simplifying methodologies, particularly in
the case of methodologies for efficient stoves (AMS-II.G) and for the dissemination of CFL
bulbs (AMS-II.J), where default values are introduced for traditional stove efficiency and for
average hours of daily use of light bulbs. However, still no considerable improvement has
been achieved in terms of project funding and transaction costs. A funding mechanism as
40 http://unfccc.int/resource/docs/2009/awg7/eng/misc03.pdf, https://cdm.unfccc.int/public_inputs/2009/appl_meth/index.html,
http://cdm.unfccc.int/Panels/ssc_wg/workshop/091026/agenda.pdf, www.inforse.org/doc/SEN65.pdf,www.wecf.de/english/articles/2009/12/CDM-eventWECF.php 41
http://cdm.unfccc.int/Panels/ssc_wg/meetings/025/ssc_025_an14.pdf,
http://unfccc.int/files/meetings/cop_15/application/pdf/cmp5_cdm_auv.pdf

8/4/2019 Feasibility Household CDM Atmosfair Draft
http://slidepdf.com/reader/full/feasibility-household-cdm-atmosfair-draft 35/35
suggested above has been discussed in the context of regional distribution but with no
success so far.
The programmatic CDM is an important step towards improved conditions for HH projects.
However, transaction costs are currently higher than in conventional CDM and registration
procedures are more complicated.
6 Acknowledgements
We are grateful to all individuals and institutions who supported this study with information
and comments, among others: Sabine Bock, Anna Samwel and Regina Drexel (all WECF),
Rostom Gamisonia (RCDA, Georgia), Keti Kiria (Greens Movement), Ruslan Izaev (CAMP
Alatoo, Kyrgyzstan) and Nurzat Abdyrasulova (UNISON, Kyrgyzstan).