
Fear of crime in public places - Center for Problem ...€¦ · § Signal Crimes – Criminal...
55
Fear of crime in public places
Transcript of Fear of crime in public places - Center for Problem ...€¦ · § Signal Crimes – Criminal...

Fear of crime in public places
Overview “… fear of crime is an emotional response of dread or anxiety to crime or symbols that a
person associates with crime.” Kenneth F Ferraro
Fear of crime: Interpreting Victimization Risk (1995)
§ Why Transport for London? § Transport examples § Transport = public place § Interactive session

Fear of crime? § Generic label § Apprehension § Often not crime § Not always bad § Affects behaviour

What do we know about fear of crime?
§ Often a rational response § Differential impact of crime § Behavioural change § Complex relationship with actual crime § Linked to broken windows § Affects people differently
Source: UCL. Jill Dando Institute of Crime Science

“Fear of crime is a paradox…we operate in one of the most tightly controlled , heavily policed areas of public space anywhere in
the Western world...yet a significant proportion of our passengers have a sense of unease, an experience of fear travelling
on parts of the network.”
Jeroen Weimar Director, Transport Policing and Enforcement, TfL

Differential fear of crime
Fear of crime as a deterrent to using public transport more often
30%
35%
40%
45%
50%
55%
Disabled people
Women 16 24 year olds
Older people (65+)
Minority Groups
People on low incomes

Why does it concern us?
§ Affects quality of life § Can be socially exclusive § Almost as important as reducing crime itself § Can sustain crime levels § Fear/risk paradox § Political discussion and debate § Urban regeneration § Economic impact

Influences of fear § Many and varied reasons (social, environmental and personal) § Impacts on people in different ways § Theoretical models § From events, places to people § Behavioral influences § Signal crimes perspective

What drives the fear of crime?
“…..individuals’ worries about victimisation are greatly influenced by perceived (economic and social) vulnerability and perceived (lack of)
social cohesion or trust…..”
A Tseloni Fear of crime, perceived disorders and property crime
Crime Prevention Studies 21 2007

Individuals, behavior and fear
Reasons? § Social control § Vulnerability § Victimization
Responses? § Avoidance § Protective § Insurance

Key drivers of fear § Signs of crime and disorder § Have been a victim of crime or antisocial behavior § Feel vulnerable § Are poorly informed § Feel powerless and isolated § Witnessed crime § Media § Level of assistance or protection
Signal Crimes Perspective § Citizen focused approach to understanding drivers of fear § Approach based on three concepts: § Signal Crimes – Criminal offences that signal the wider presence of risk to people § Signal Disorders – forms and signs of incivility and antisocial behaviour § Control Signals – acts of social control that can impact positively or negatively on perceptions
§ Provides opportunity to target resources at things (influences) that really matter

Signal Crimes Perspective
Signal Closed ticket offices
Graffiti Ticket barrier problems
Ticket scalpers Verbal abuse
Terrorist incidents Litter/Rubbish/Dirty Drunk and disorderly
Youths hanging around 1 2 3 4 5 5 6 6 7
Signal
Highest ranking concern across all groups
Of medium concern to all groups
Lowest ranking concern to all groups

Influences in a transport environment
§ Diverse travelling public § Cleanliness of vehicle § Group disorder during pre and after school hours § Concern about the whole journey (from door to door) § Isolation when travelling at night § Sensationalized media stories
§ Enclosed environment § Close proximity to strangers

a. What might be some of the challenges to measuring fear of crime?
b. Are there places in your own towns or cities where it might be valuable to measure fear of crime?

Identifying and measuring fear of crime
§ Difficult to establish drivers of fear § Need to understand fear more specifically § Where, when and who does it most affect? § Use of community intelligence § Proxy measures § Proactive public engagement

Fear of Crime Matrix Low crime levels
High fear of crime
High crime levels
High fear of crime
Low crime levels
Low fear of crime
High crime levels
Low fear of crime
Rising crime levels
Rising fear of c
rime
Source: Home Office, UK
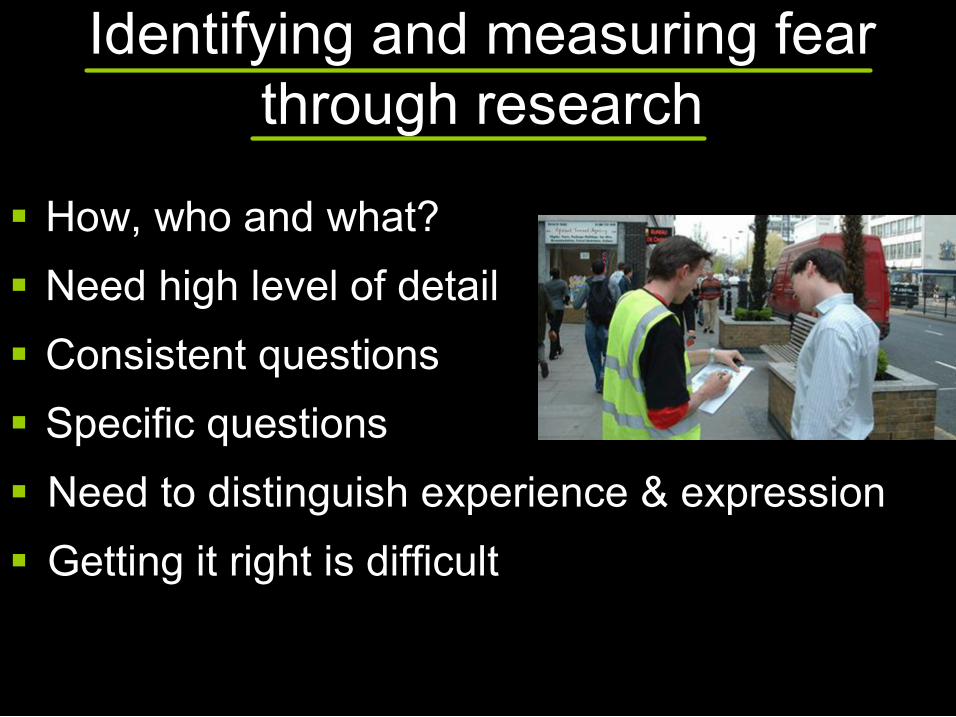
Identifying and measuring fear through research
§ How, who and what? § Need high level of detail § Consistent questions § Specific questions § Need to distinguish experience & expression § Getting it right is difficult

A London perspective § How safe do you feel walking outside in this neighborhood in the evening by yourself?
40% felt unsafe Why do you feel unsafe? % Fear of being mugged or physically attacked?
42
Fear of burglary 39 Knife crime 34 Teenagers hanging around on the street
33
Lack of police presence 31 People using and dealing drugs 25 Gun crime 22 Vandalism and other deliberate damage to property or vehicles
21
People being drunk or rowdy in the streets
21

Local concerns in London wards
Source: UCL, Jill Dando Institute of Crime Science

Identifying and measuring fear of crime
Transport for London Experience

How safe do you feel travelling around London after dark?
13
18
33
31
33
42
44
46
43
42
45
3
5
5
9
8
10
10
10
15
42
40
Bicycle
Motorbike
Walking
Tram
DLR
Bus
Tube
Train
Minicab
Black Cab
Car
Quite safe Very safe
Base: All respondents 2006 (n=1006), 2005 (n=1012) Source: SS5b How safe from crime or antisocial behaviour would you feel travelling on xxx after dark? Do you feel….
% saying Feel Safe
81%
87%
34%
50%
52%
51%
37%
52%
27%
84%
83%
41%
58%
53%
53%
48%
51%
60%
22%
24%
2004 2005
Perceived safety travelling around London – after dark
84%
85%
38%
56%
52%
54%
41%
40%
58%
16%
23%

Concerns on London’s Tube
Source: Operation Pipe, British Transport Police, Universities’ Police Science Institute 2007
Enforcement Team London Underground Staff Travelling Public Dealing with youths Terrorist incidents Closed ticket offices Station assistants Being spat at Begging Resentment of police ` Bad smells Bombings Station Cleaning Damage Overstretched enforcment Ticket scalpers Hate crime Open ticket barriers Drunk and disorderly Robbery Closed ticket offices Graffiti Delays Lighting Youths Heat problems Turn backs Verbal abuse Dirty Ticket scalpers Safety issues Old stock Youths Fare evasion Terrorist incidents Drunk and disorderly Litter Ticket scalpers Graffiti Drunk and disorderly Ticket barrier problems Graffiti Safety issues Youths Verbal abuse Litter Fare evasion
Key
Social Disorder
Crime
Service provider issues
Environmental disorder
Assaults on staff

Identifying concerns on London’s Tube
Operation Pipe, British Transport Police, Universities’ Police Science Institute 2007

Events to people
§ Terrorist attack on Madrid’s subway in 2004 had a noticeable affect on perception § Perception scores clearly affected by attack on London’s subway in 2005

Perception of safety and security on TfL services (aggregate score)
80
80
81
81
82
82
83
83
Q1 05/06 Q2 05/06 Q3 05/06 Q4 05/06 Q1 06/07 Q2 06/07 Q3 06/07 Q4 06/07
July Bombings
Impact of July’s terrorist attacks on perception of safety

Perception of safety and security on TfL services
72
74
76
78
80
82
84
86
88
Q1 05/06 Q2 05/06 Q3 05/06 Q4 05/06 Q1 06/07 Q2 06/07 Q3 06/07 Q4 06/07
At train station On train
On bus At bus stop
July bombings
Perception by transport mode
“The police have a tendency to say crime is coming down…but if the
perception of local people is of disorder and lack of control, they feel unsafe…if you tell them things are better, you
destroy your own credibility and their trust in you.”
Peter Fahy Chief Constable, Cheshire Police
20 August 2007
Problemsolving approach to fear of crime
§ Targeted and integrated approach § Based on data § Account for social, environmental and personal factors § Address the cues that people base perceptions on § Responseoriented policing on its own is insufficient to address fear of crime § Can’t be done in isolation § Reducing fear has proved difficult

What strategies can be used to address fear of crime in public
places?

Strategic Areas § Communications and media

Strategic Areas § Communications and media § Visible control and reassurance § Environmental Improvements § Application of technology § Crime reduction/prevention § Community engagement

Response strategies
Transport for London Experience

Tackling the issues that matter most to passengers and staff
§ Introduction of Safer Transport Teams in response to community intelligence and feedback
§ Local problemsolving § Data collection and engagement § Community decides the priorities of the team rather than the police setting priorities
§ Communications campaign to raise awareness of the teams and their work

Tackling antisocial behavior § Research found that passengers were mostly concerned about incivilities and ASB rather than crime
§ Marketing campaign developed to tackle these behaviors and engender respect and social cohesion
§ Demonstrates that TfL is listening to public concerns and working to address them
13
19
13
8
11
31
2
27
15
22
17
4
7
18
7
12
5
8
13
12
2
20
18
16
20
8
8
20
26
25
29
26
28
21
10
23
29
26
26
30
29
30
31
27
21
17
31
32
17
27
28
28
32
30
29
25
15
11
21
22
12
3
44
2
9
7
4
22
23
5
8
6
10
19
3
1
25
2
1
1
6
5
1
Shouting/ swearing at others
Not paying fare
Spitting
Smoking
Dropping litter
Pushing/ shoving
Drinking/ being drunk
Not giving up priority seating
Using more than one seat
Listening to loud music
Speaking on phone
Eating hot food
Travelling in large group
Carrying large bag
Morning rush hour Morning non rush Afternoon Evening rush hour Evening non rush hour Late night
Problematic behaviours for TfL Customers
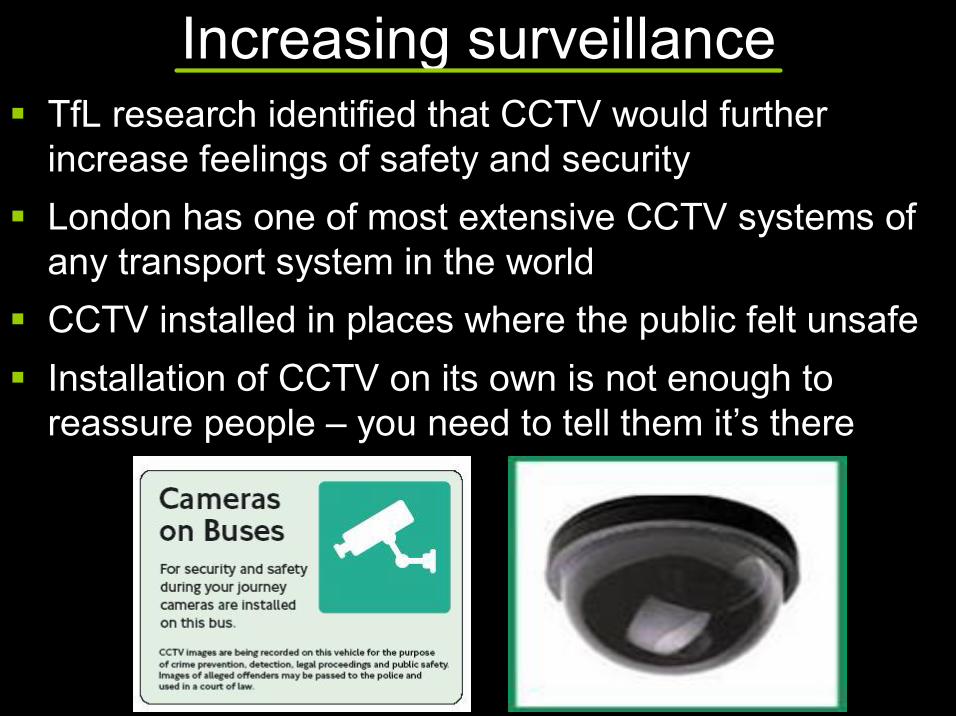
Increasing surveillance § TfL research identified that CCTV would further increase feelings of safety and security
§ London has one of most extensive CCTV systems of any transport system in the world
§ CCTV installed in places where the public felt unsafe § Installation of CCTV on its own is not enough to reassure people – you need to tell them it’s there

Raising Awareness § Multimedia communications campaign to raise awareness of the dangers of using illegal taxis § An average of 18 women a month were sexually assaulted yet 18% of women surveyed said they would use illegal taxis

Unexpected outcomes of response strategies
§ Attempts to tackle fear of crime can have unexpected outcomes § Create complacency / expose people to risk § Displacement (location and crime type) § Heighten fear of crime
§ Interventions impact groups in different ways § Strategies must take these ‘side effects’ into account § Ethical problems when attempting to challenge fear of crime without tackling the risk Source: Home Office, UK

Measuring impact § Important to measure impact and evaluate effectiveness of specific responses § Monitoring satisfaction and citizen focus § Monitoring levels is a good indicator but it also needs to be specific § Consistent questioning is helpful to monitor levels over time § Comparisons between fear of crime and experience

Measuring impact
Transport for London Experience

Monitoring perceptions on key bus routes
Passenger Perception of Safety/Security at Bus Stops/Shelters
60
65
70
75
80
85
90
Q1 2002/03
Q2 Q3 Q4 Q1 2003/04
Q2 Q3 Q4 Q1 2004/05
Q2 Q3 Q4 Q1 2005/06
Q2 Q3 Q4 Q1 2006/07
Q2 Q3 Q4
Non TOCU TOCU
§ Omnibus Survey
§ Dedicated policing capability on 20 key bus routes
§ Crime has fallen
§ Scores on routes policed by the Transport Operational Command Unit (on bus and at bus stops) have improved significantly as a result

Tackling knife crime and reassuring the public
§ Research undertaken to determine the effect of metal detectors on public safety perceptions
§ 31% of respondents avoid public transport because of fear of knife crime
§ Measured perceptions of equality groups and white Londoners
§ Awareness of antiknife initiative was likely to reduce fear of crime

Measuring impact of visible policing at major London transport interchange
§ Surveys undertaken pre, during and post initiative § Presence of uniformed officers increase feelings of security – sudden appearance of many officers has the opposite effect
– triggers concerns about crime or possible terrorist threats

Conclusions § Fear of crime versus healthy apprehension § Can be positive if it leads to increased crime prevention measures § Complex relationship between crime and fear of crime § Smart policing can have a dramatic affect on fear of crime

Conclusions § Incivilities and antisocial behaviour are key drivers § Key measures include: § making changes to physical and social environment § crime reduction activities § reassurance strategies
§ Measures need to be carefully developed to avoid complacency and increased crime levels § We need to do some things better

What we need to do better? § Understand the nature and drivers of fear § Document the extent of the problem § Identify if it is really a problem § Target fear drivers more specifically § Problemsolving approaches (Effective place management, guardianship, and control of offenders)
§ Provide the public with accurate, timely and local information
§ Better understand the use of technology (particularly CCTV)

Want to know more? § Crime Reduction, Home Office, United Kingdom
www.crimereduction.gov.uk § Jill Dando Institute of Crime Science
www.jdi.ucl.ac.uk § Universities’ Police Science Institute, Cardiff University
www.upsi.org.uk/ § Safer Hastings Partnership
www.saferhastings.co.uk § Transport for London
www.tfl.gov.uk
Steve Burton Deputy Director
Mandy McGregor Policy Support Manager
Transport Policing and Enforcement Transport for London

Practical examples in support of slide 32

Communications and Media § Communicate what action is being taken and why (targeted messages)
§ Communicate successes
§ Inform the public – accurate and timely information on crime levels, rates and risks (contextualize it)
§ Work with the media
§ Use a variety of formats to reach vulnerable and hard to reach groups

Visible control and reassurance § Visible, uniformed presence – capable guardians § Local, familiar and accessible policing § Strategic police deployments § Involve people of influence § Set behavioural standards and actively address violations – self policing § Act on community intelligence

Environmental improvements
§ Open visible spaces § Improve lighting and natural surveillance § Creation of defensible space § Design out crime § Repair damage and clean up environment § Environmentally sympathetic security

§ Closed circuit televisions in areas where people feel most vulnerable (and publicise it) § Realtime monitoring is more reassuring § Personal security systems § Help points § Public alarms § Electronic information boards § Mapping fear of crime and fuzzy intelligence
Application of technology

Crime reduction and prevention
§ Effective crime reduction and prevention measures (SARA, crime analysis triangle and situational crime prevention techniques)
§ Crime prevention advice § Tackle antisocial behaviour at its roots § Prevent repeat victimization § Positive policies to encourage crime reporting § Diversionary activities for potential offenders § Involve the community in preventative action (e.g Neighborhood Watch schemes)

Community engagement § Local collaboration with residents, businesses and neighborhoods – listening to their concerns and involving them in the solutions
§ Hold community/partnership days § Promote social cohesion / sense of community § Educate youths about the affects of their behaviour (intentional or not) has on others


