FE Modelling of Friction -...
158
LICENTIATE THESIS FE Modelling of Friction Connections in Tubular Tower for Wind Turbines Marouene Limam
Transcript of FE Modelling of Friction -...

LICENTIATE T H E S I S
Department of Civil, Environmental and Natural Resources EngineeringDivision of Structural and Construction Engineering
FE Modelling of Friction Connections in Tubular Tower
for Wind Turbines
Marouene Limam
ISSN: 1402-1757 ISBN 978-91-7439-344-6
Luleå University of Technology 2011
Marouene Lim
am FE
Modelling of Friction C
onnections in Tubular Tower for W
ind Turbines
ISSN: 1402-1757 ISBN 978-91-7439-XXX-X Se i listan och fyll i siffror där kryssen är


Division of Structural and Construction Engineering - Steel Structures Department of Civil, Environmental and Natural Resources Engineering
Luleå University of Technology SE - 971 87 LULEÅ
www.ltu.se/sbn
LICENTIATE THESIS 2011
FE MODELLING OF FRICTION CONNECTIONS IN TUBULAR TOWER FOR
WIND TURBINES
Marouene Limam
Luleå, December 2011

Printed by Universitetstryckeriet, Luleå 2011
ISSN: 1402-1757 ISBN 978-91-7439-344-6
Luleå 2011
www.ltu.se
Preface
Preface
The work presented in this thesis has been carried out at the Department of Civil, Environmental and Natural Resources Engineering at Luleå University of Technology (LTU), in the Research Group of Steel Structures at the Division of Structural and Construction Engineering, during the period September 2009- December 2011.
The thesis deals with modelling of friction connection for wind tower using Finite Element Model (FEM). Parts of the work were a part of the European project High Steel Tubular Towers for Wind Turbines (HISTWIN). The focus of my research was on the behaviour of the friction connection with long open slotted holes which has been thoroughly investigated by a large number of FE models.
For financial support thanks are given to RFSR-CT-2006-00031, the European Research Fund of Coal and to the Centre for High performance Steel (CHS) at Luleå University of Technology, Sweden.
I would like to express my gratitude to my supervisor, Professor Milan Veljkovic, for his supportive and encouraging guidance.
Further, I would like to thank my co-supervisor Lars Bernspång, for his prompt feedbacks and support.
I would also to thank my friends at the Steel Structures Research Group. You have truly shown that friends are there when they are needed. Especially, Naveed Iqbal and Tim Heistermann for their proof reading and general support.
I

FE modelling of friction connection in tubular towers for wind turbines
II
To my family: Abderrazak, Naima, Nadia, Amel, and Besma, you are far of my eyes but the closest to my heart. You have sacrificed a lot and I hope I can make it up to you. We proved to the entire world that the impossible is not TUNISIAN :-)
Luleå, October 2011
Marouene Limam

Abstract
Abstract
During the last few decades the demand for renewable energy has led to a myriad of innovative solutions. The present assembling solution between two segments of a tubular tower is accomplished by conventional ring flange connection. This connection suffers from economical and technological barriers. One possible improvement could be achieved by implementing friction connections. Performance of this connection exposed to static loading is considered in this thesis. FEM is used as the main tool to improve understanding of the friction connection behaviour for application in towers for wind turbines. This new solution consists of the upper tower segment, where normal clearance holes are made and where bolts can be pre-installed, and the lower tower segment where opened slotted holes are made. It is easier to produce and 80 % less expensive than traditional flange connection which leads to a total reduction of 10 % to 15 % of the tower costs.
The influence of the level of assembling tolerances and the loss of pretension force in the bolts has been thoroughly investigated by a large number of FE models in the search for a model that is the most successful match with regards to its comparison with test data. Experiments are performed in an international project financed by RFCS, HISTWIN.
The starting point is a small scale friction connection, best described as a single shear lap joint. This specimen represents a strip of the friction connection of a tubular tower. The ability of the FE models to capture three-dimensional contact problems, with realistic modelling of the assembling process and effects of the secondary bending during the loading are investigated. Resistance according to European codes, EN 1993-1-8, for the preloaded bolts is compared with the FE solutions.
III

FE modelling of friction connection in tubular towers for wind turbines
IV
The second type of specimen is a down-scaled bending test of the beam. The test is used to check the performance of the connection and to calibrate the FE model. A very realistic FE model is created and compared with results from experiments. Failure modes and the respective ultimate resistances are predicted by FEA. The same model is used to investigate the influence of the gap between tubular segments and the influence of residual stresses generated in the segment which contains slotted holes on the tower resistance in bending, as well as in compression and tension.
Abstract in Swedish
Abstract in Swedish
Efterfrågan på förnyelsebar energi har under de senaste decennierna drivit fram ett stort antal innovativa lösningar. Idag är flänsar den vanligaste lösningen vid skarvar i rörformade vindkraftstorn. Det är en lösning som har både ekonomiska och tekniska brister. Friktionskoppling kunde vara en möjlig förbättring. I detta arbete studeras hur en sådan koppling skulle fungera under statisk last. FEM används som det viktigaste verktyget för att skapa förståelse för hur en sådan friktionskoppling fungerar i ett rörformat vindkrafttorn. Den föreslagna friktionskopplingen består av en övre del som har hål med bultar i längs nedre kanten, och en undre del som har skåror. Det är en konstruktion som är enklare att tillverka och som kostar 80 % mindre än en traditionell flänskoppling. Det ger en total besparing för ett torn på mellan 10 % och 15 %.
Betydelsen av det extra spelrum som tillåts för att förenkla monteringen och vad förlusten av förspänning i bultarna betyder har studerats i ett antal FEM-modeller för att hitta en modell som ger så bra överensstämmelse som möjligt med mätdata från försök gjorda i projektet HISTWIN som finansierats av RFCS.
Första försöket är en liten del av hela friktionskopplingen, enklast beskriven som ett skjuvförband. FEM-modellens förmåga att beskriva den tredimensionella kontakten, en realistisk sammanfogning samt de olika böjfenomen som uppträder undersöks. De förspända bultarnas bärförmåga enligt Europakoden EN 1993-1-8 jämförs med FEM-lösningen.
Den andra modellen är ett nedskalat böjtest på en balk. Modellen används för att undersöka hur friktionskopplingen fungerar och för att kalibrera FEM-modellen. En mycket realistisk FEM-modell skapas och beräkningsresultaten
V

FE modelling of friction connection in tubular towers for wind turbines
VI
jämförs med gjorda försök. FEM-beräkningen ger både brottmod och brottlast. Samma modell används också för att studera betydelsen av glappet mellan de olika delarna i tornet samt betydelsen av spänningstillståndet i delen med skårorna när den belastas i både tryck och drag.

Contents
Contents
PREFACE ............................................................................................................I
ABSTRACT...................................................................................................... III
ABSTRACT IN SWEDISH...............................................................................V
CONTENTS.................................................................................................... VII
ABBREVIATIONS ..........................................................................................IX
1 .....................................................................................1 INTRODUCTION1.1 ...........................................................................1 Wind energy in EU1.2 .........................................................................2 Tubular steel towers1.3 .............................................................................................4 General1.4 .........................................................................5 Outline of the thesis
2 ...............................................................................7 STATE OF THE ART2.1 ...........................................................7 Design of flange connections2.2 .......................................................10 Design of friction connections2.3 .....................................................12 Friction connection mechanism
3 ..........21 MODELLING OF SINGLE SHEAR LAP JOINT IN TENSION3.1 ....................................................................................21 Introduction3.2 ...........................................................................................21 General
3.2.1 ..........................................22 Geometric details of the model3.2.2 .............................................................24 Material modelling3.2.3 ............................................................27 Finite element mesh3.2.4 .......................................29 Boundary conditions and loading3.2.5 .............................................................31 Contact description
VII

FE modelling of friction connection in tubular towers for wind turbines
VIII
3.3 ....................................... 33 FE analysis results and parametric study3.3.1 .............................................. 33 Results from the base model3.3.2 ........................ 34 Parametric study of assembling tolerances3.3.3
........................................................................... 47 Tower connection behaviour using modified boundary conditions
3.3.4 ....... 59 Secondary bending in the "Tower connection" model3.4 ....................................................... 67 Summary of the main findings
4 .......................... 69 TOWER CONNECTION IN PURE COMPRESSION4.1 ............................................. 69 Description of finite element models4.2 ............................................................................................ 70 Results
4.2.1 ................. 72 Parametric study of the assembling tolerances4.2.2
............................................................................. 76 Parametric study varying material properties of the segments
4.3 ....................................................... 79 Summary of the main findings
5 ....................................................................................... 81
DOWN SCALED BENDING TESTS OF THE FRICTION CONNECTION5.1 ................................................................................... 81 Experiments5.2 .................................................................................. 83 FE modelling
5.2.1 ............................................................. 83 Material modelling5.2.2 .............................. 86 Geometry and simplification of model5.2.3 ........................................................... 86 Finite element mesh5.2.4 ...................................... 88 Boundary conditions and loading
5.3 ....................................... 89 FE analysis results and parametric study5.3.1 ........................................................... 89 Experimental results5.3.2 .............................................. 90 Results from the base model5.3.3 .................. 91 Parametric study to improve model behaviour
5.4 ..................................................... 100 Summary of the main findings
6 ......................................... 101 CONCLUSIONS AND FUTURE WORKS
REFERENCES ............................................................................................... 105
ANNEX .......................................................................................................... 109

Abbreviations
Abbreviations
Latin capital letters
A Area [mm2]
grossA Area of the gross cross section [mm2]
netA Area of the net cross section [mm2]
oA Initial cross section area [mm2]
sA Tensile stress area of the bolt [mm2]
E Modulus of elasticity [N/mm2]
*E Effective Young modulus [N/mm2]
maxF Maximum load [kN]
actualpF , Actual preload at certain time [kN]
CpF , Characteristic pretension [kN]
RdSF , Static design slip resistance [kN]
IX

FE modelling of friction connection in tubular towers for wind turbines
tF Actual preload at a certain state [kN]
RdtF , Design resistance in tension [kN]
I Moment of inertia of the cross section [mm4]
xiM Bending moment [N.mm]
RnetN ,Characteristic plastic resistance of the net cross section [kN]
P Applied load [kN]
Latin small letters
d Nominal bolt diameter, diameter of circular tubular sections [mm]
dH Bolt hole diameter [mm]
dW Washer diameter [mm]
ubf Bolt ultimate strength [N/mm2]
yf Plate yield strength [N/mm2]
ybf Bolt yield strength [N/mm2]
sk Correction factor or reduction factor [-]
l Length of the part [mm]
ol Initial length of the part [-]
n Number of friction surfaces [-]
boltsn Number of bolts [-]
rowsn Number of rows [-]
X
Abbreviations
XI
t Flange thickness or plate thickness, thickness of circular tubular sections [mm]
Greek capital letters
BF Bolt force variation [kN]
l Elongation of the length [mm]
Greek small letters
FfPartial safety factor for equivalent constant amplitude stress ranges [-]
3M
Partial safety factor for joints, taking the slip resistance at the ultimate limit state ( Category C) into account
[-]
7MPartial safety factor for joints, taking the preload of high strength bolts into account [-]
nom Nominal strains [-]
true True strains [-]
Slip factor [-]
c Measured slip factor [-]
friction Apparent friction coefficient [-]
slip Apparent slip factor [-]
eq Equivalent stress [N/mm2]
nom Nominal stress [N/mm2]
true True stress [N/mm2]
FE modelling of friction connection in tubular towers for wind turbines
maxtrue Maximum true stress [N/mm2]
gross Stress in the gross cross section area [N/mm2]
Poisson's ratio [-]
y Out of plane displacement [mm]
XII

Introduction
1 INTRODUCTION
Wind power is becoming an increasingly popular source for generation of electrical energy and since it is renewable and has no direct pollution related environmental effects, makes it attractive in terms of the Kyoto agreement to reduce production. Also, the fact that the total wind energy costs are becoming comparable to coal and nuclear on average kWh costs today as shown in
2CO
[1]. The total generation from renewable resources is predicted to increase by 3 % annually and the renewable share of the electricity generation will grow to 23 % until 2035 [2].
The growth in the wind industry necessitated related investigations. Since the costs of supporting structure for wind turbines (tower and foundation) have a large impact on the total investment costs, it is therefore necessary to minimise the construction cost of wind towers. Cost depends heavily on the hub heights of the towers, which allows the tower to reach higher zones with comparatively constant wind speeds. Designing for tower's hub height implies structural requirements. In the following chapters a special focus will be on the behaviour of tubular steel towers and an innovative design of the assembly joint will be considered.
1.1 Wind energy in EU
The EU market for renewable energies is continuously growing. In particular, the wind energy market where the annual installations of wind power have increased over the last 15 years from 0,8 GW in 1995 to 9,3 GW in 2010, an annual average market growth of 17,6 %. The investment in wind capacity within EU is about 19% of the total world investment. This investment is estimated to 66,5 billion Euros in 2010 according to [3].
1

FE modelling of friction connection in tubular towers for wind turbines
If one looks at the situation in EU (Figure 1.1-1) it becomes obvious that the wind power installations are not directly correlated with the natural resources, but rather with the policy support for renewable energies. Germany remains the EU country with the largest installed capacity. According to their pledges, Germany would have more than 50 % of wind generated electricity in 2020 than the whole EU in 2010 [4].
Figure 1.1-1: Wind power installations in the EU, end 2010 [5]
The investment which belongs to the tower costs could be up to 25 % of the total wind energy investments which means 70 billion Euros will be required for tower producers in the period 2008-2030 according to EWEA [5].
1.2 Tubular steel towers
Several types of towers for wind turbines made of steel exist; they can be classified into two main categories: lattice and tubular towers.
Lattice towers become an increasingly interesting alternative for the hub height over 100 m, they require only about one half of the material as would a corresponding tubular tower with a similar stiffness, thus lowering the costs of the tower and foundation.
2

Introduction
Tubular steel towers (see Figure 1.2-1-a) are the most common solution for onshore wind farms; they have shown a good combination of aesthetical, economical and safety behaviours. The most common material for tubular tower is steel although there are tubular towers made of concrete and hybrid towers (steel-concrete towers).
Currently the sections of tubular steel towers are assembled with bolted ring flange connections (see Figure 1.2-1-b). This type of connection suffers from many drawbacks: The fabrication process is laborious and costly, the fatigue resistance is rather low (fatigue class between 36 and 71) and the design is based on a rather complex model.
a) Tubular tower with assembling joint
b) Ring flange connection
c) A new slip resistant connection, HISTWIN
connection
Circular vs. polygonal section
d) Two segments of modularized tower, HISTWIN2 project
Figure 1.2-1: Innovations for improved competitiveness of steel tubular towers [6].
3

FE modelling of friction connection in tubular towers for wind turbines
As an innovative solution for the assembling of the tubular sections, the lower section has long open slotted holes. The fasteners can be preinstalled in the normal holes of the upper section and they can be used for the angular alignment while it is being slid down in the correct position (see Figure 1.2-1.c). Note that this innovative solution is suitable for towers up to 80-90 m hub height [7].
For higher tubular towers, which require larger diameter than 3,7 m at the base, it becomes necessary to modularize the segments (see Figure 1.2-1-d). This diameter is limiting factor for economical land transport in many EU countries. A recently started RFCS project 2010-2013, called HISTWIN2, High Steel Tubular Towers for Wind Turbines, will investigate use of a lap slip resistant connection for longitudinal connections [8].
1.3 General
The main objectives of this licentiate thesis are to propose tolerances of fabrications and to improve understanding of the assembling joint for tubular steel towers by the use of FEA. It is important to understand the mechanisms of friction connection with slotted holes and cover plates in small scale such as a single shear lap joint and full scale such as tubular tower section.
The influence of the level of assembling tolerances and the loss of pretension force in the bolts will be thoroughly investigated by a large number of FE models.
The finite element investigation will be the main source of information in this thesis where a wide range of parametric studies are carried out and compared with design codes.
The following questions are studied:
- What is the agreement between existing hand calculation models and a feasible FE model for prediction of the ultimate load on a tower with the friction connection using opened long slotted holes?
- Is the single shear lap joint (the connection segment test) a satisfactory representation of the assembling connection in a tower for wind turbines?
4

Introduction
5
- What is the influence of gaps between segments with normal clearance holes and between segments with opened slotted holes on the resistance of the connection in tension, compression and bending?
- Is it necessary to make any addition in existing European Standards, in particular EN-1993-1-8 for design of the HISTWIN friction connection?
1.4 Outline of the thesis
This thesis started with general information about the wind energy within the EU, then a short introduction to the topic of wind towers is presented with a special focus on the assembling connection of tubular steel towers.
A basic information concerning the connection between tower's sections is presented under the state of art, Chapter 2. Here, the main failure modes of the flange connection are shown.
In Chapters 3 and 4, Finite Element models of small scale friction connection are presented, they are used to provide better understanding of friction connections. The influence of different levels of assembling tolerances and the loss of pretension force in the bolts are thoroughly investigated by FEA. The resistance of the connection is compared with EN 1993-1-8 predictions when the model is loaded in tension and compression.
In Chapter 5, a down-scaled bending test of the beam carried out at Aachen University (RWTH) is briefly presented; it is followed by a detailed description of a rather realistic FE model to compare the failure modes and the ultimate resistance predicted by FEA with experimental results.
Main conclusions, answers to the questions raised at the beginning of the thesis and comments indicating further works are given.
Finally, the thesis is completed with five Annexes where additional information on geometry of specimens, the calculation procedure according to EN 1993-1-6, hand calculation model for secondary bending stresses and a short review of the characteristic ABAQUS input file are given.


State of the art
2 STATE OF THE ART
In this chapter, a basic design background of the assembling joints for tubular steel towers is presented. The first solution to joint tubular segments is made using flange connection based on Petersen method [10]. The second solution consists of using the friction connection with opened slotted holes. Here various series of finite element simulations are performed in order to get better understanding of the behaviour of this connection under different load cases.
2.1 Design of flange connections
The most common connection between tower sections is the bolted L-flange connection where pairs of heavy steel flanges are welded on the inside of the tubes and bolted together with pre-tensioned bolts. The main principle of the conventional ring flange connections is shown in Figure 2.1-1.
Figure 2.1-1: Bolted ring flange connection [9].
7

FE modelling of friction connection in tubular towers for wind turbines
However, due to the high number of contact-surfaces needed, such simulations are too labour-intensive for the usual tower design. Common practice for design purpose is to use L connection models.
The flange segment dimensions are shown in Figure 2.1-2.
Figure 2.1-2: A possible L-flange connection detail which belongs to failure mode A [9].
Petersen method [10] is one of the most used methods to design the flange connection. The relationship between load in the shell and bolt force is not linear as can be seen on Figure 2.1-3.
8

State of the art
Figure 2.1-3: Relationship between bolt force, and applied load, Z, for two levels of production tolerances shown as a function of flange
flatness
tF
[11].
The general behaviour of a pre-tensioned bolt in L-shaped ring-flange connections can be described as follows:
For segment forces Z = 0 the bolt loads Ft keeps constant at the level of Fp,C, thus Ft Fp,C constant, where Fp,C is the pre-tension force in the bolt
1. With increasing segment force Z Z1 the clamp solid begins to move in the direction of the flange edge and the bolt load Ft slightly increases.
2. At a certain segment force Z1, the shifting of the clamp solid develops faster and the flange connection begins to open, which leads to an expeditious increase of bolt load Ft.
3. When the segment force reaches Z2 the interface of the flanges stays only in contact at the flange edges and the structural behaviour of the connection corresponds to the pure edge bearing model. The bolt load Ft increases linearly as a function of the tension force Z in the shell.
9

FE modelling of friction connection in tubular towers for wind turbines
Figure 2.1-4 illustrates three different failure modes that can be captured at the ultimate limit state according to Petersen, either by exceeding the resistance in the bolt (Failure mode A), in the flange and shell (Failure mode B) or both at the same time (Failure mode C). It must be noted that these illustrations of FE simulations are here meant only to show the different expected failure modes and not any numerical results. A bit more detailed overview of the flange connection is given in [12].
Figure 2.1-4: Finite element mesh of the middle part of the specimen. Failure mode B Failure mode A Failure mode C
2.2 Design of friction connections
Overview of previous work
An extended literature exists on various aspects of friction connection. Many studies related to the faying surfaces and bolt types were made and long-term tests to estimate the loss of pretension force during the life time were performed [31]. The use of friction connection in tubular steel towers for wind turbines has been investigated by RFCS projects HISTWIN [7] and HISTWIN2 [8].
In spite of the advances in computing, attempts to achieve a realistic FE models have been made in [12] in order to compare the results of a small scale lap joint friction connection with FE predictions. The main limitation with this work has
10
State of the art
been the small number of experimental tests available. Moreover, the results were not too accurate, since they were affected by test conditions.
Failure modes
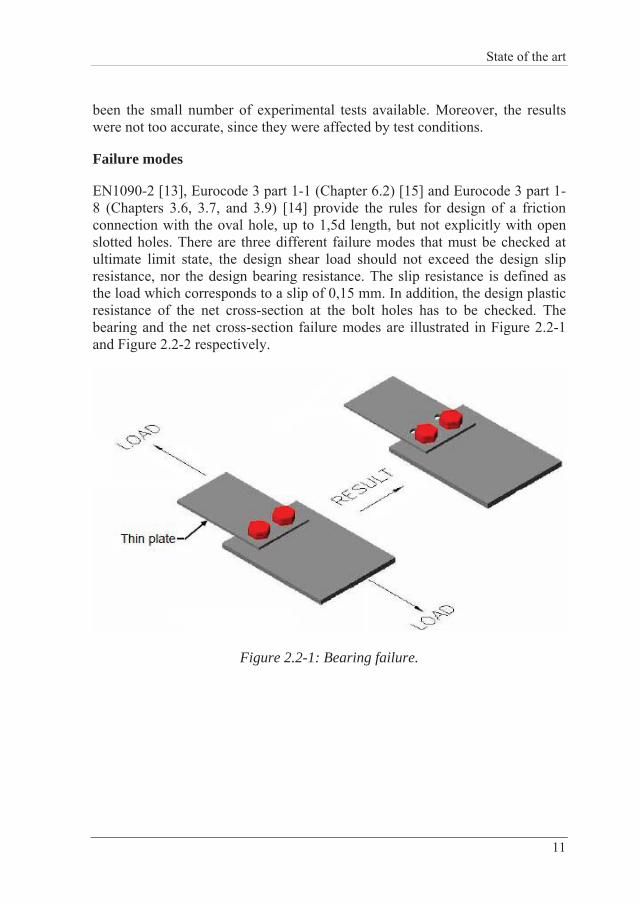
EN1090-2 [13], Eurocode 3 part 1-1 (Chapter 6.2) [15] and Eurocode 3 part 1-8 (Chapters 3.6, 3.7, and 3.9) [14] provide the rules for design of a friction connection with the oval hole, up to 1,5d length, but not explicitly with open slotted holes. There are three different failure modes that must be checked at ultimate limit state, the design shear load should not exceed the design slip resistance, nor the design bearing resistance. The slip resistance is defined as the load which corresponds to a slip of 0,15 mm. In addition, the design plastic resistance of the net cross-section at the bolt holes has to be checked. The bearing and the net cross-section failure modes are illustrated in Figure 2.2-1 and Figure 2.2-2 respectively.
Figure 2.2-1: Bearing failure.
11

FE modelling of friction connection in tubular towers for wind turbines
Figure 2.2-2: Net cross-section failure.
2.3 Friction connection mechanism
High Strength Friction Grip bolts (HSFG)
High Strength Friction Grip bolts (HSFG) are made from quenched and tempered alloy steels with grades from 8.8 to 10.9. The most common are, the so-called, general grade of 8.8 and have medium carbon content, which makes them less ductile. The 10.9 grade have a much higher tensile strength, but lower ductility and the margin between the 0,2 % yield strength and the ultimate strength is also lower [16].
Since HSFG bolts such as Tension Control Bolt (TCB) and Huck BobTail, see Figure 2.3-1-a and Figure 2.3-1-b respectively, do not rely on resistance from bearing under working loads, holes larger than usual can be provided to ease erection and take care of lack-of-fit. Typical hole types that can be used are standard, extra large and short or long slotted. These are shown in Figure 2.3-2. However the type of hole will govern the strength of the connection.
12

State of the art
Figure 2.3-1: High Strength Friction Grip bolts.
a) Tension Control Bolt b) Huck BobTail bolt
Figure 2.3-2: Hole types for HSFG bolts.
Load transmission in friction connection
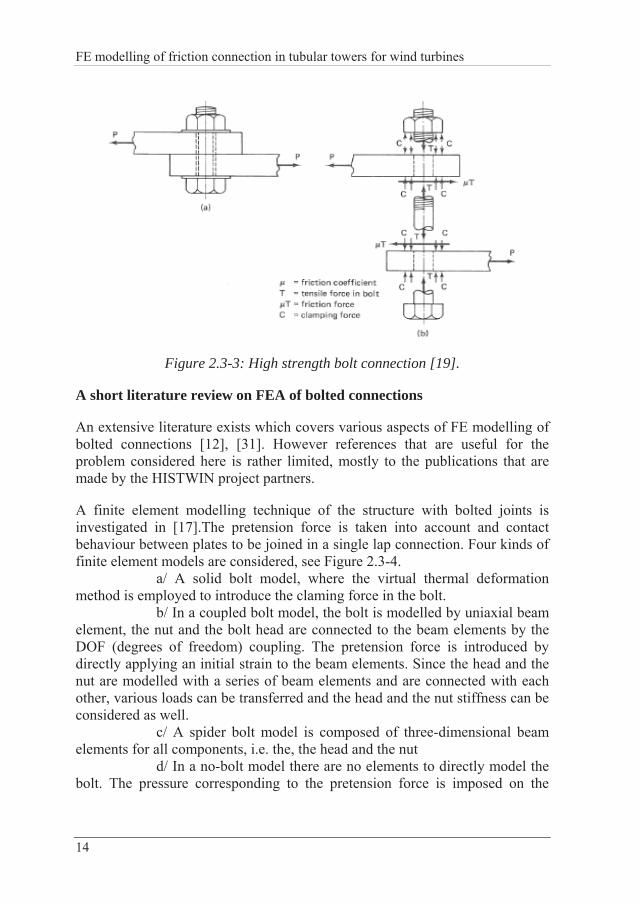
Figure 2.3-3-a shows a single high-strength bolt connection transmitting a tensile force P and Figure 2.3-3-b shows its free body diagram. It can be seen that the pretension in the bolt causes clamping compressive forces C between the plates before the external load is applied.
When the external load is applied, the tendency of two plates to slip against one another is resisted by the friction force T between the plates. The frictional resistance is equal to the coefficient of friction multiplied by the tensile force in bolt T. Until the externally applied force exceeds this frictional resistance the relative slip between the plates is prevented. The HSFG connections are designed such that under service load the force does not exceed the frictional resistance so that the relative slip is avoided during service.
13
FE modelling of friction connection in tubular towers for wind turbines
Figure 2.3-3: High strength bolt connection [19].
A short literature review on FEA of bolted connections
An extensive literature exists which covers various aspects of FE modelling of bolted connections [12], [31]. However references that are useful for the problem considered here is rather limited, mostly to the publications that are made by the HISTWIN project partners.
A finite element modelling technique of the structure with bolted joints is investigated in [17].The pretension force is taken into account and contact behaviour between plates to be joined in a single lap connection. Four kinds of finite element models are considered, see Figure 2.3-4. a/ A solid bolt model, where the virtual thermal deformation method is employed to introduce the claming force in the bolt. b/ In a coupled bolt model, the bolt is modelled by uniaxial beam element, the nut and the bolt head are connected to the beam elements by the DOF (degrees of freedom) coupling. The pretension force is introduced by directly applying an initial strain to the beam elements. Since the head and the nut are modelled with a series of beam elements and are connected with each other, various loads can be transferred and the head and the nut stiffness can be considered as well. c/ A spider bolt model is composed of three-dimensional beam elements for all components, i.e. the, the head and the nut d/ In a no-bolt model there are no elements to directly model the bolt. The pressure corresponding to the pretension force is imposed on the
14

State of the art
washer surface. The conclusion is that the no-bolt simulation is the easiest way among the bolt models proposed in this study. However, the no-bolt model cannot consider the influence of the bolt stiffness on simulation, neither the account of the change of the pretension force is possible. All models mentioned above are performed by ANSYS but similar options are available in ABAQUS as well. The pretension force is taken into account and contact behaviour between plates to be joined in a single lap connection is also considered. The main conclusion based on comparison with experimental data is that the solid bolt model, which is modelled by using three-dimensional brick elements and surface-to-surface contact elements between the head/nut and the plate interfaces, provides the most accurate response.
Figure 2.3-4: Four different alternatives to model a bolted single shear lap joint [17].
Thorough FEA, well documented experimental study and a complete state of the art on the connection behaviour of the double shear lap joint exist in [18]. One of the specimens considered is shown in Figure 2.3-5
Analysis of the stress states during the loading, the slip-load relationship and the friction stress distribution are studied in detail. The most advanced interaction model is used, as implemented in ANSYS where contact elements are used that allows four different contact states on the contact surface, as shown below:
15

FE modelling of friction connection in tubular towers for wind turbines
- Open and not near contact - Open but near contact - Closed and sliding - Closed and sticking.
Both FEA results and experimental results show that the loads resisted by bolts in the edge rows are larger than the ones by bolts in the middle rows. The stress distributions in the connected plate and cover plate are wave-like with large stress and small stress alternate in different locations. Good agreements are obtained between the test results and the FEA results which verified the accuracy of the FEA.
Figure 2.3-5: A typical FE model considered with the load slip diagram [18].
A specimen similar to the one shown in Figure 2.3-5 is considered in [31] but using a simpler interaction model considering the tangential behaviour by Coulomb’s basic friction model in which two surfaces in contact can withstand a small shearing stress at their interface before one starts to slide over the other. The same model is considered here mostly because of the experimental evidences shown in Figure 2.3-6. The load-slip curves of specimens, series Z-1x3 and WS-1x3 for specimens with zinc rich paint and weathering steel faying surface respectively are shown for the sake of illustration.
16

State of the art
The initial behaviour is quasi-linear with similar slopes but the on-set of nonlinearity occurred at relatively low loads, about 60 % of the resistance. At the failure load, the average slip measured at the connection’s side is about 50 μm and 300 μm with zinc rich paint and weathering steel respectively.
Figure 2.3-6: Slip measured at the connection’s sides [12], results obtained on
3 specimens are shown for each type of the specimen.
Friction connection in towers for wind turbines
In order to investigate the behaviour of a friction connection with opened slotted holes, different series of finite element simulations are performed.
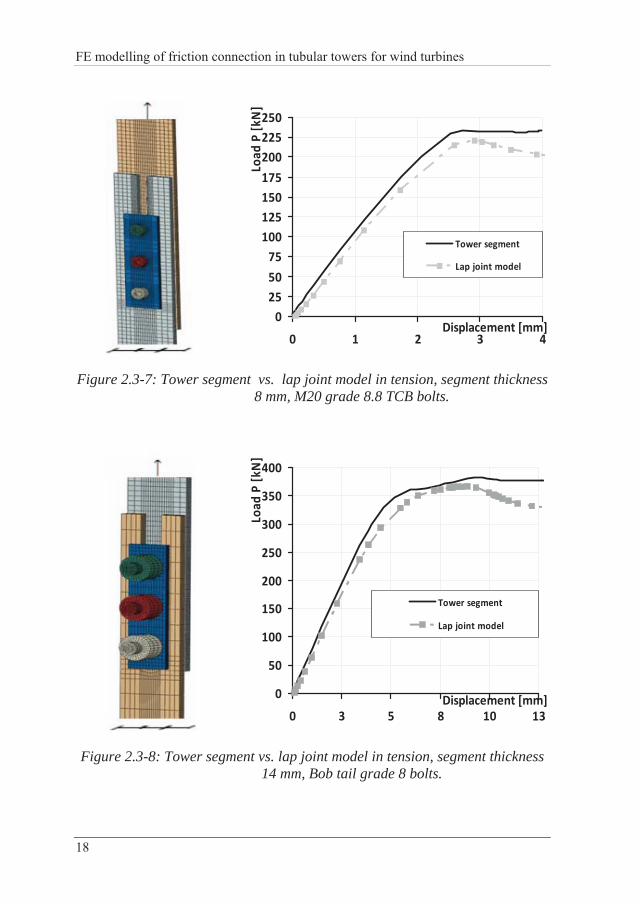
As a starting point, a simulation of a small scale friction connection called a single shear lap joint is performed and compared with one strip "one segment” of a tubular tower. The width of these two specimens corresponds to the distance between two rows of bolts. Although, this model has an eccentricity, it can give a clear picture of the complete tower cross section under various applied loads as shown in Figure 2.3-7 and Figure 2.3-8. More details about the behaviour of tower segment and single shear lap joint will be given in Chapters 3 and 4.
17
FE modelling of friction connection in tubular towers for wind turbines
18
02550
75100125150175
200225250
0 1 2 3 4Displacement [mm]
Load
P[kN]
Tower segment
Lap joint model
Figure 2.3-7: Tower segment vs. lap joint model in tension, segment thickness 8 mm, M20 grade 8.8 TCB bolts.
0
50
100
150
200
250
300
350
400
0 3 5 8 10Displacement [mm]
Load
P[kN]
13
Tower segment
Lap joint model
Figure 2.3-8: Tower segment vs. lap joint model in tension, segment thickness 14 mm, Bob tail grade 8 bolts.

State of the art
The second step was to perform down-scaled bending tests to check the performance of the connection, due to the symmetry only half of the cross section is modelled as shown in Figure 2.3-9. The complete evaluation of the tests will be discussed in more details in Chapter 5.
Figure 2.3-9: Geometry of down-scaled bending test (only half geometry of the specimen was modelled).
The final step is to model the complete geometry in order to test the feasibility of the assembly process (Figure 2.3-10) and the influence of unavoidable tolerances such as the starting gap between the cylinders.
Figure 2.3-10: Assembling during the first feasibility test of the HISTWIN connection, performed in Martifer's workshop.
19


Modelling of single shear lap joint in tension
3 MODELLING OF SINGLE SHEAR LAP JOINT IN TENSION
This chapter describes a method based on a three-dimensional finite element model of a single shear lap joint connection. A finite element (FE) model is developed using the non-linear code ABAQUS and a number of FE simulations are made by varying the most significant parameters which can affect the accuracy and efficiency of the model: boundary conditions, mesh density, fabrication tolerances…
The ability of the models to give a satisfactory representation of the assembling connection in a tower for wind turbines is evaluated. Secondary bending, which occurs because of the geometric eccentricities when the element is loaded in tension, is studied by simplified analytical model and by ABAQUS.
3.1 Introduction
In general, bolted connections are critical elements overall in a structure; they are the weak point of the structure because of the high stress concentrations, geometric discontinuities due to some factors such as bolt bending and secondary bending…
3.2 General
In this research, the ABAQUS (Version 6.10-2) FE package, installed on a cluster computer of the steel structures research group at the Department of Civil, Environmental and Natural Resources Engineering, has been used.
21

FE modelling of friction connection in tubular towers for wind turbines
The creation of a reliable FE model is the main aim of the study, Therefore, the FE model would be the main source of information which can provide a relatively inexpensive and time efficient alternative compared with a laboratory environment by allowing a wide ranging parametric study. These parametric studies offer the possibility to analyse the model response through a series of mesh refinements, increases in element order and material modelling. In the following sections, main details of a FE model using ABAQUS software are described.
3.2.1 Geometric details of the model
The 3D FE segment model consists of a lap joint connection composed of a cover plate, "upper" and "lower" segments. These plates were connected using 3 Bob Tail bolts [20]. The main advantage of this connection is the ease with which it can be assembled. The cover plate was used instead of the conventional washers to make the assembly faster. The plate or the tower segment, which contains the opened slotted holes, is called the lower segment.
Figure 3.2-1: The single shear lap joint connection.
22
Modelling of single shear lap joint in tension
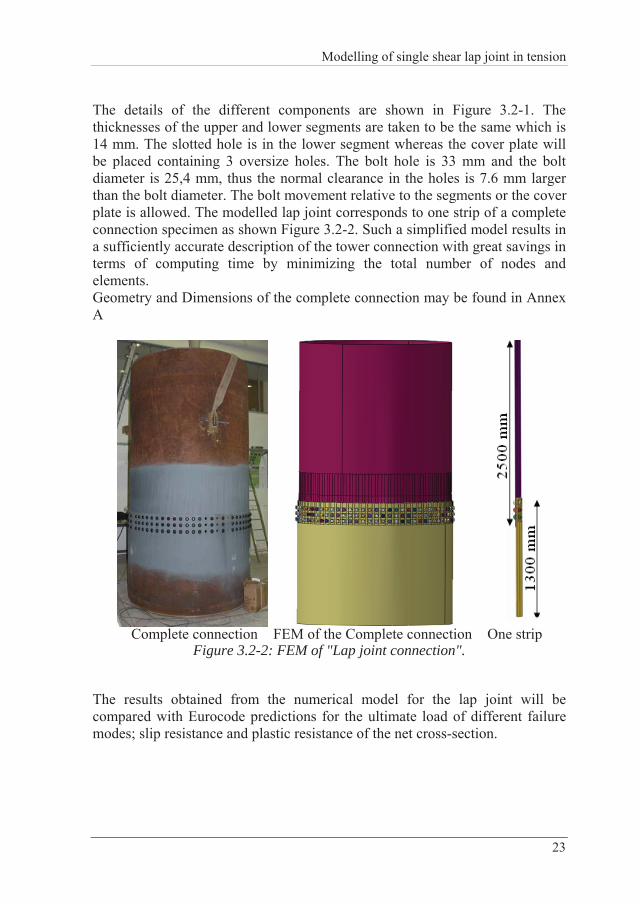
The details of the different components are shown in Figure 3.2-1. The thicknesses of the upper and lower segments are taken to be the same which is 14 mm. The slotted hole is in the lower segment whereas the cover plate will be placed containing 3 oversize holes. The bolt hole is 33 mm and the bolt diameter is 25,4 mm, thus the normal clearance in the holes is 7.6 mm larger than the bolt diameter. The bolt movement relative to the segments or the cover plate is allowed. The modelled lap joint corresponds to one strip of a complete connection specimen as shown Figure 3.2-2. Such a simplified model results in a sufficiently accurate description of the tower connection with great savings in terms of computing time by minimizing the total number of nodes and elements. Geometry and Dimensions of the complete connection may be found in Annex A
Figure 3.2-2: FEM of "Lap joint connection". Complete connection FEM of the Complete connection One strip
The results obtained from the numerical model for the lap joint will be compared with Eurocode predictions for the ultimate load of different failure modes; slip resistance and plastic resistance of the net cross-section.
23

FE modelling of friction connection in tubular towers for wind turbines
3.2.2 Material modelling
The nominal stress ( 0/ AFnom ) versus nominal strain ( 0/ llnom ) curve obtained from conventional coupon tests does not provide the deformed state of the material during the test. It does not give a real indication of the deformation characteristics of a material at higher strain as it is based entirely on the original dimensions of the specimens which varies continually throughout the test. Therefore, it is required to replace the nominal stress versus nominal strain ( nomnom
true
) by the true stress versus true strain, which are the stress and strain ( true ) that account for the constant change of cross section dimension. The material properties are introduced into the ABAQUS model as a set of points on the true stress versus true strain curve, and hence the values of nominal stress and nominal strain must be converted to true stress and true strain as the plastic material data using the following Equations ([21], [22]):
ln(1 )true nom (3.2.1)
(1 )true nom nom (3.2.2)
Figure 3.2-3 and Figure 3.2-4 show the stress–strain curves of steel S355 and Bob tail grade 8 bolts materials. Table 3-1 summarizes the material properties of each segment of the connection.
The material behaviour provided by ABAQUS allows a multilinear stress–strain curve to be used. The first part of the multilinear curve represents the elastic part up to the proportional limit stress (yield strength) measured by Young’s modulus ( ) and Poisson‘s ratio (GPa210 3.0 ).
Von Mises failure criterion is used in the analysis. The material is considered to have reached its maximum strength and fracture begins to occur when the equivalent stresses ( eq ) exceed the maximum true stress ( maxtrue ). Equation 3.2.3 establishes the condition of the failure [23].
.0.1maxtrue
eq (3.2.3)
24

Modelling of single shear lap joint in tension
0
100
200
300
400
500
600
700
0,00 0,05 0,10 0,15 0,20Strain [ ]
Stress[M
Pa]
Nominal S355
True S355
Figure 3.2-3: Nominal engineering and true stress – strain relationship of steel S355.
25

FE modelling of friction connection in tubular towers for wind turbines
0
200
400
600
800
1000
1200
0,00 0,02 0,04 0,06Strain [ ]
Stress[M
Pa]
Nominal, Bob Tail grade 8
True, Bob Tail grade 8
Figure 3.2-4: Nominal engineering and true stress – strain relationship of bolt material.
Table 3-1: Material properties.
Segment Steel grade Yield strength [MPa]
Ultimate strength [MPa]
Upper segment S355 355 510
Lower segment S355 355 510
Cover plate S355 355 510
Bob tail bolt Bob tail grade 8 900 1000
26
Modelling of single shear lap joint in tension
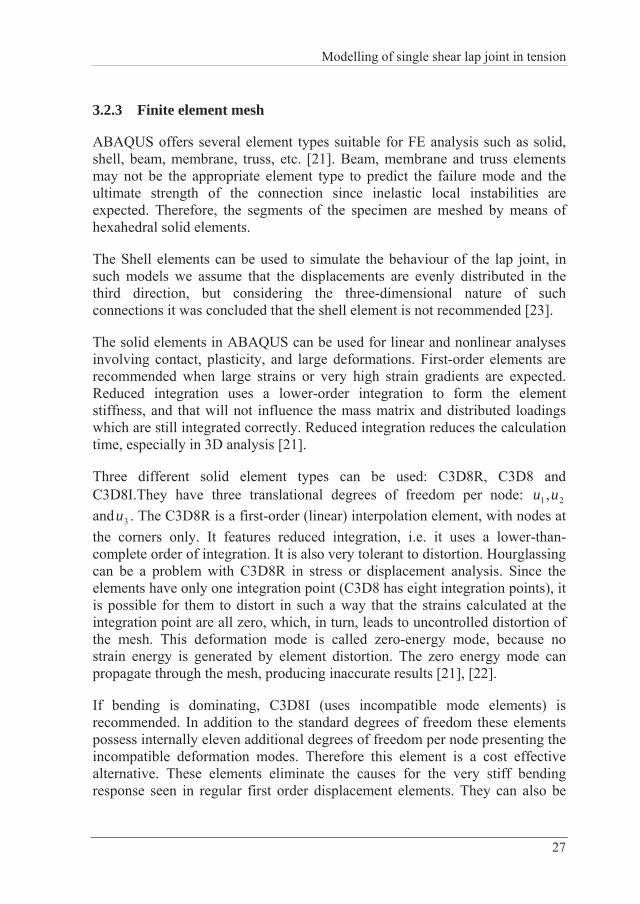
3.2.3 Finite element mesh
ABAQUS offers several element types suitable for FE analysis such as solid, shell, beam, membrane, truss, etc. [21]. Beam, membrane and truss elements may not be the appropriate element type to predict the failure mode and the ultimate strength of the connection since inelastic local instabilities are expected. Therefore, the segments of the specimen are meshed by means of hexahedral solid elements.
The Shell elements can be used to simulate the behaviour of the lap joint, in such models we assume that the displacements are evenly distributed in the third direction, but considering the three-dimensional nature of such connections it was concluded that the shell element is not recommended [23].
The solid elements in ABAQUS can be used for linear and nonlinear analyses involving contact, plasticity, and large deformations. First-order elements are recommended when large strains or very high strain gradients are expected. Reduced integration uses a lower-order integration to form the element stiffness, and that will not influence the mass matrix and distributed loadings which are still integrated correctly. Reduced integration reduces the calculation time, especially in 3D analysis [21].
Three different solid element types can be used: C3D8R, C3D8 and C3D8I.They have three translational degrees of freedom per node: and . The C3D8R is a first-order (linear) interpolation element, with nodes at the corners only. It features reduced integration, i.e. it uses a lower-than-complete order of integration. It is also very tolerant to distortion. Hourglassing can be a problem with C3D8R in stress or displacement analysis. Since the elements have only one integration point (C3D8 has eight integration points), it is possible for them to distort in such a way that the strains calculated at the integration point are all zero, which, in turn, leads to uncontrolled distortion of the mesh. This deformation mode is called zero-energy mode, because no strain energy is generated by element distortion. The zero energy mode can propagate through the mesh, producing inaccurate results
21 ,uu
3u
[21], [22].
If bending is dominating, C3D8I (uses incompatible mode elements) is recommended. In addition to the standard degrees of freedom these elements possess internally eleven additional degrees of freedom per node presenting the incompatible deformation modes. Therefore this element is a cost effective alternative. These elements eliminate the causes for the very stiff bending response seen in regular first order displacement elements. They can also be
27

FE modelling of friction connection in tubular towers for wind turbines
used to model bending with only one element through the thickness without hourglassing [21].
Figure 3.2-5 shows finite element mesh of the middle of the specimen. For the upper segment and the cover plate the mesh area is divided into two parts; one part around the bolt holes (24mm area from the centre of bolt hole) and the other part (the remaining part). The mesh is refined locally in the vicinity of the bolt hole for improved resolution of stress and strain due to the presence of the stress concentrations and contact problems [24]. It is difficult to get reasonable stress and strain around the holes. Thus, consideration about the accuracy of final results and the total computing time should be carefully taken into account according to the difference of mesh size in each element type (C3D8R, C3D8 and C3D8I), especially for non-linear FE analysis.
Since the connection is loaded in tension (Figure 3.2-1), it is good to use C3D8I elements in the contact zones and for the bolts, and C3D8R elements outside of the connection region which can be used to decrease the computational time [25].
Figure 3.2-5: Finite element mesh of the middle part of the specimen. Upper segment Cover plate Bob tail bolt Lower segment
28

Modelling of single shear lap joint in tension
3.2.4 Boundary conditions and loading
The analysis has been performed in the following two sequential steps: one pretension force step; and the second modelling the tension of the specimen.
Pretension
During the first step all three translational degrees of freedom (DOF) at both top and bottom of the specimen were restrained as can be seen in Figure 3.2-6.
The preloading of the bolt is an important point in reproducing the behaviour of the connection. To reproduce this effect, a pretension force is applied in all bolts. This is done by applying a concentrated bolt-load, which is a self-equilibrating force carried across the pretension section in the shank, to the pretension node
kNF Cp 284,
[21]. This internal section was defined at the middle of the bolt-shank (see Figure 3.2-7).
Figure 3.2-6: Boundary conditions – pretension of bolts step.
Lower support
Upper support
29

FE modelling of friction connection in tubular towers for wind turbines
Figure 3.2-7: Application of preload in the bolt.
Tensile load step
After the pretension forces in the bolts have been successfully reached, their length is fixed at their current position. The DOF in longitudinal direction at the top of the lower segment were released thus modelling the tensile load which acts on the friction connection.
Two loading patterns such as the force control and the displacement control are commonly used in FE analysis. In this case, loading in the FE model is applied through the displacement control pattern that enforces the prescribed displacement at the top of the lower segment (see Figure 3.2-8) to reflect on the sudden strength reduction during analysis. In addition, the displacement-controlled pattern provides a higher numerical stability to the system [26].
30

Modelling of single shear lap joint in tension
Lower support
Figure 3.2-8: Boundary conditions – tensile load step.
Upper support
3.2.5 Contact description
Contact was modelled using the “contact pairs” option (surface-based contact) in ABAQUS. The method requires the definition of “distance of required contact”, for bodies that potentially may come in contact with each other. The “contact pairs” option consists of a table that defines which bodies are likely to be in contact with each other during an analysis step and where less checking for contact is required. For example, it was known a priori that the head and the nut of the bolt would never come into contact, so the contact table was set to eliminate checking for this possibility. The contact table used here is shown in
31

FE modelling of friction connection in tubular towers for wind turbines
Figure 3.2-9. Seventeen contact surfaces are defined in this table. The contact surfaces comprise the bolt shanks-to-bolt holes, bolt heads-to-Upper segment, nuts-to-cover plate, cover plate to lower segment, and upper segment to lower segment. The “contact pairs” option uses a formula known as “finite sliding”, which allows arbitrary separation between, sliding and rotation of surfaces. It is designed to simulate highly non-linear processes such as the one tackled here. The definition and the allocation of “Master” and “Slave” surfaces are done automatically using “contact pairs”, nevertheless it is crucial to choose appropriate master and slave surfaces. According to ABAQUS manual, the master surface should be the surface of the stiffer body or should have a coarser mesh than the slave surface. If this is not followed the solution may become quite time consuming [21].
Tangential behaviour is modelled by Coulomb's basic friction model, in which two surfaces in contact can withstand shearing stresses of a certain magnitude at their interface before one starts to slide over the other. The friction coefficient adopted for this model is 0,5. For normal behaviour “Hard contact” is introduced, which means that contact pressure can be transmitted if surfaces are in contact, but also a separation of contact surfaces is allowed. Finite Element models including contact problems are very sensitive to any applied load and may have problems of numerical convergence in the first step of the calculation. The reason is that the contact is not fully established as long as there is zero force in the model and therefore, stabilizing the model by activating damping in normal and/or tangential direction is necessary and highly recommended [25].
32

Modelling of single shear lap joint in tension
Figure 3.2-9: Contact table defined in ABAQUS, “contact pairs” option.
3.3 FE analysis results and parametric study
In this section, results from the three-dimensional finite element model developed in the previous section are presented. Following that a parametric study to improve model behaviour is discussed, and finally a comparison is made between the models in order to check the influence on the finite element results.
3.3.1 Results from the base model
This section presents the load-displacement curves from the lap joint developed in Section 3.2. The displacement is measured at the extremity of the upper segment. The base model had 5mm existing gap between upper and lower segments which corresponds to assembling tolerances.
Figure 3.3-1 shows the load displacement curve of the single shear lap joint connection.
33

FE modelling of friction connection in tubular towers for wind turbines
34
0
50
100
150
200
250
300
350
400
0 2 4 6 8Displacement [mm]
Load
P[kN]
10
Lap joint 5mm gap
Figure 3.3-1: Load displacement curve.
3.3.2 Parametric study of assembling tolerances
The assembling tolerances are defined as the gap between diameters of two parts of tubular sections that are connected by pre-tensioned bolts as shown in Figure 3.3-2. This gap will be closed after the first step by introducing a pretension force of in all bolts. This pretension force per bolt
is calculated according to the following formula taken from Eurocode 3 kNF Cp 284,
CpF ,
part 1-8 [14]:
subCp AfF ..7,0, (3.3.1)
Where
ubf is the ultimate strength of the bolt, here 1000 MPa,
sA is the tensile stress area of the bolt, here 405,37 mm2
Modelling of single shear lap joint in tension
35
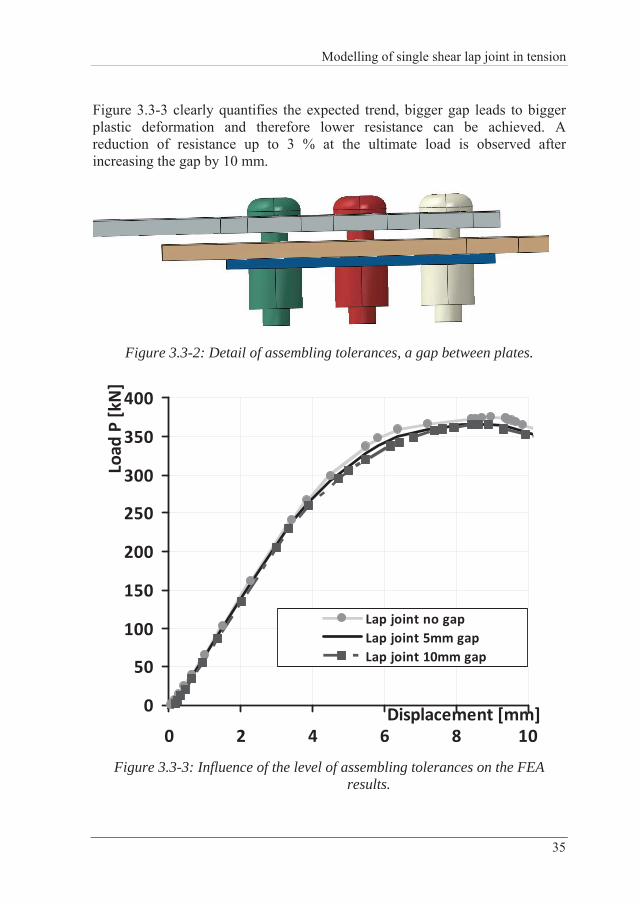
Figure 3.3-3 clearly quantifies the expected trend, bigger gap leads to bigger plastic deformation and therefore lower resistance can be achieved. A reduction of resistance up to 3 % at the ultimate load is observed after increasing the gap by 10 mm.
Figure 3.3-2: Detail of assembling tolerances, a gap between plates.
0
50
100
150
200
250
300
350
400
0 2 4 6 8Displacement [mm]
Load
P[kN]
10
Lap joint no gapLap joint 5mm gapLap joint 10mm gap
Figure 3.3-3: Influence of the level of assembling tolerances on the FEA
results.
FE modelling of friction connection in tubular towers for wind turbines
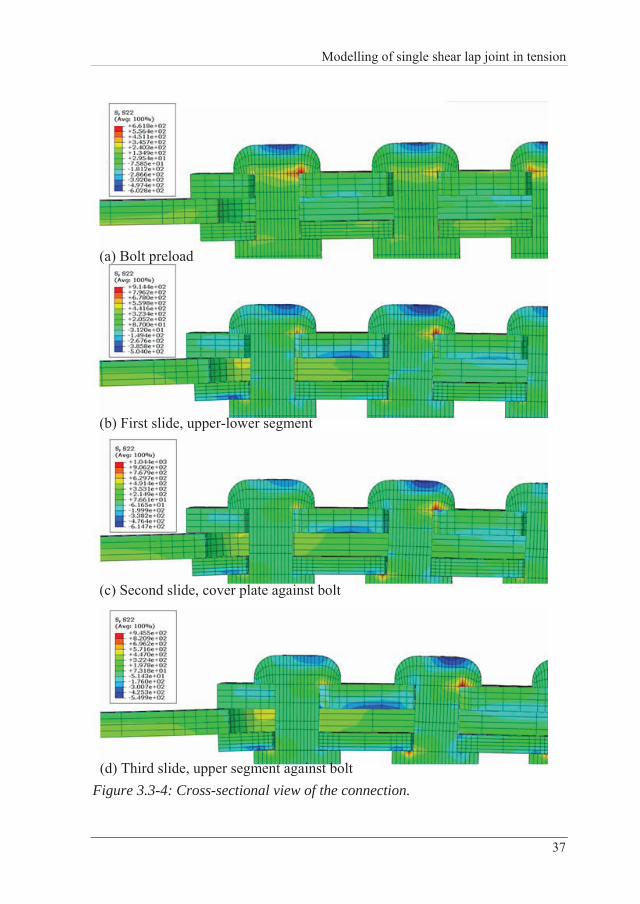
Relative slip between upper and lower segments
During the increase of the tensile force, a relative displacement between the upper and the lower segments is increasing. Once the friction force that holds the upper and the lower segments together is exceeded, the first displacement of the lower segment against the upper segment and cover plate is observed; the tensile force continues to increase in the connection until there is a second displacement of cover plate against the shank of the bolt starts and continues until there is a third displacement of the bolt shank against the upper segment.
Figure 3.3-4 shows a cross section cut at the middle of the connection where four stages of the process can be seen through.
36
Modelling of single shear lap joint in tension
(a) Bolt preload
(b) First slide, upper-lower segment
(c) Second slide, cover plate against bolt
(d) Third slide, upper segment against bolt Figure 3.3-4: Cross-sectional view of the connection.
37

FE modelling of friction connection in tubular towers for wind turbines
The characteristic slip resistance is calculated according to Eurocode 3 RsF ,
[14]:
CpsRs FnkF ,, (3.3.2)
Where
RsF , is the static characteristic resistance of the joint,
sk is the correction factor depending on the type of hole, this factor is related to the friction test set-up [7] and the slip factor, here assumed to be 0,64
n is the number of friction surfaces, here taken as 1,
is the slip factor of the faying surfaces, here assumed to be 0,5,
CpF , is the pretension force for the sum of all the bolts in the joint.
The characteristic plastic resistance of the net cross-section at the bolt holes is also calculated according to the following formula taken from RnetN .
Eurocode 3 part 1-8 [14]:
kNAfN netyRnet 14,30814)3395(10.355 3, (3.3.3)
Where
is the characteristic plastic resistance of the net cross-section, RnetN ,
yf is the yield strength of the segment material,
netA is the net cross-section of the clamping package
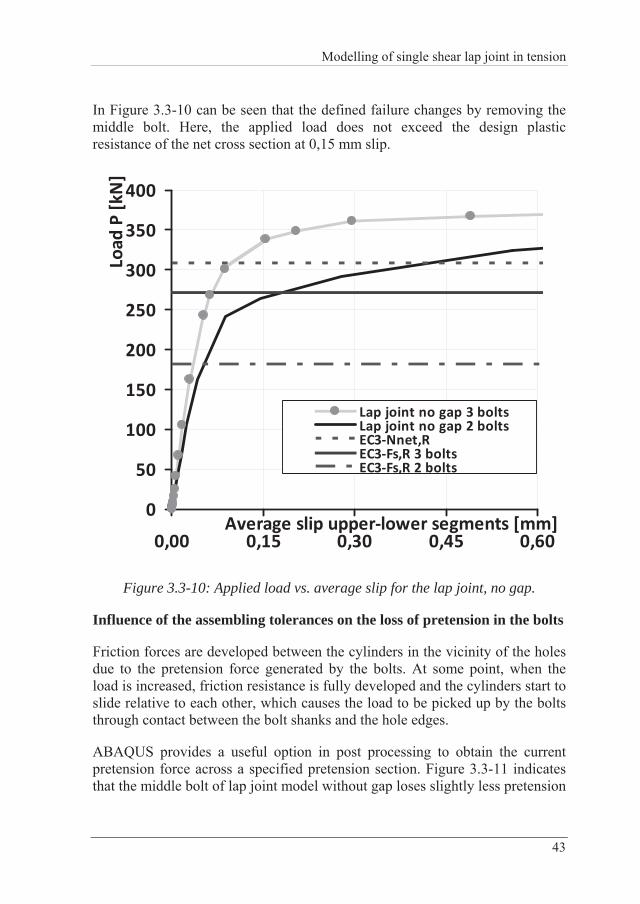
Figure 3.3-5 shows a comparison of the applied load and the average slip in the lap joint models. At 0,15 mm slip, only the lap joint with no gap exceeds both the design plastic resistance and the design slip resistance according to [14]. A look on the behaviour of the upper and lower segments demonstrates that the area where the yielding occurs is bigger for the model without gap compared to the models with 5 mm and 10 mm gaps as shown in Figure 3.3-6, Figure 3.3-7 and Figure 3.3-8.
38

Modelling of single shear lap joint in tension
As a conclusion, the design plastic resistance, a criterion of the net cross-section, is not applicable in the case of unsymmetrical cross section as it is the case for the present lap joint connection. The yielding of the segments does not occur due to the tensile applied load only; it is a mix of tensile stress and secondary bending stress due to eccentricity.
0
50
100
150
200
250
300
350
400
0,00 0,15 0,30 0,45 0,60Average slip upper lower segments [mm]
Load
P[kN]
Lap joint no gapLap joint 5mm gapLap joint 10mm gapEC3 Nnet,REC3 Fs,R
Figure 3.3-5: Applied load vs. average slip for the Lap joint models.
39

FE modelling of friction connection in tubular towers for wind turbines
The results of the comparison between the "Lap joint" models are summarized in Table 3-2.
Table 3-2: Results obtained for the "Lap joint” model with different gaps.
Gap 0 mm Gap 5 mm Gap 10 mm
Max Load (kN) 378,1 371,1 376,5
Displacement at the maximum load (mm) 8,9 8,8 8,6
Slip at the max load (mm) 1,1 1,8 1,8
Load at 0,15 mm slip (kN) 339 241 240
Tangent stiffness of the connection (kN/mm) 5275 1959 1761
Secant stiffness of the connection at 0,15 mm
slip (kN/mm) 2259 1846 1509
Secant stiffness of the connection at the maximum load
(kN/mm)
347 210 207
40

Modelling of single shear lap joint in tension
Figure 3.3-6: Stresses at longitudinal direction at 0,15 mm slip, Lap joint model, no gap.
Figure 3.3-7: Stresses at longitudinal direction at 0,15 mm slip, Lap joint model, 5 mm gap.
41

FE modelling of friction connection in tubular towers for wind turbines
Figure 3.3-8: Stresses at longitudinal direction at 0,15 mm slip, Lap joint model, 10 mm gap.
Due to the fact, that the yielding of the segments is noted as the failure mode for the lap joint model without gap, the middle bolt is removed now from the previous assembly (Figure 3.3-9) in order to re-evaluate the failure mode of the model.
Figure 3.3-9: Finite Element model of the lap joint no gap, 2 bolts.
42
Modelling of single shear lap joint in tension
In Figure 3.3-10 can be seen that the defined failure changes by removing the middle bolt. Here, the applied load does not exceed the design plastic resistance of the net cross section at 0,15 mm slip.
0
50
100
150
200
250
300
350
400
0,00 0,15 0,30 0,45 0,60Average slip upper lower segments [mm]
Load
P[kN]
Lap joint no gap 3 boltsLap joint no gap 2 boltsEC3 Nnet,REC3 Fs,R 3 boltsEC3 Fs,R 2 bolts
Figure 3.3-10: Applied load vs. average slip for the lap joint, no gap.
Influence of the assembling tolerances on the loss of pretension in the bolts
Friction forces are developed between the cylinders in the vicinity of the holes due to the pretension force generated by the bolts. At some point, when the load is increased, friction resistance is fully developed and the cylinders start to slide relative to each other, which causes the load to be picked up by the bolts through contact between the bolt shanks and the hole edges.
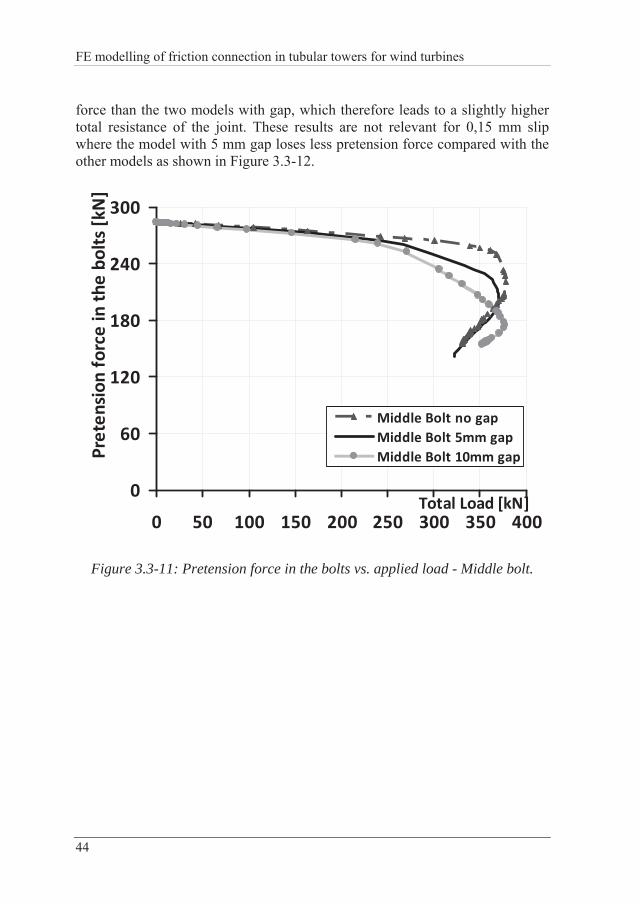
ABAQUS provides a useful option in post processing to obtain the current pretension force across a specified pretension section. Figure 3.3-11 indicates that the middle bolt of lap joint model without gap loses slightly less pretension
43
FE modelling of friction connection in tubular towers for wind turbines
force than the two models with gap, which therefore leads to a slightly higher total resistance of the joint. These results are not relevant for 0,15 mm slip where the model with 5 mm gap loses less pretension force compared with the other models as shown in Figure 3.3-12.
0
60
120
180
240
300
0 50 100 150 200 250 300 350 400Total Load [kN]
Preten
sion
forceinthebo
lts[kN]
Middle Bolt no gapMiddle Bolt 5mm gapMiddle Bolt 10mm gap
Figure 3.3-11: Pretension force in the bolts vs. applied load - Middle bolt.
44
Modelling of single shear lap joint in tension
0
50
100
150
200
250
300
0,00 0,15 0,30 0,45 0,60Average slip upper lower segments [mm]
Preten
sion
forceinthebo
lts[kN]
Middle Bolt no gapMiddle Bolt 5mm gapMiddle Bolt 10mm gap
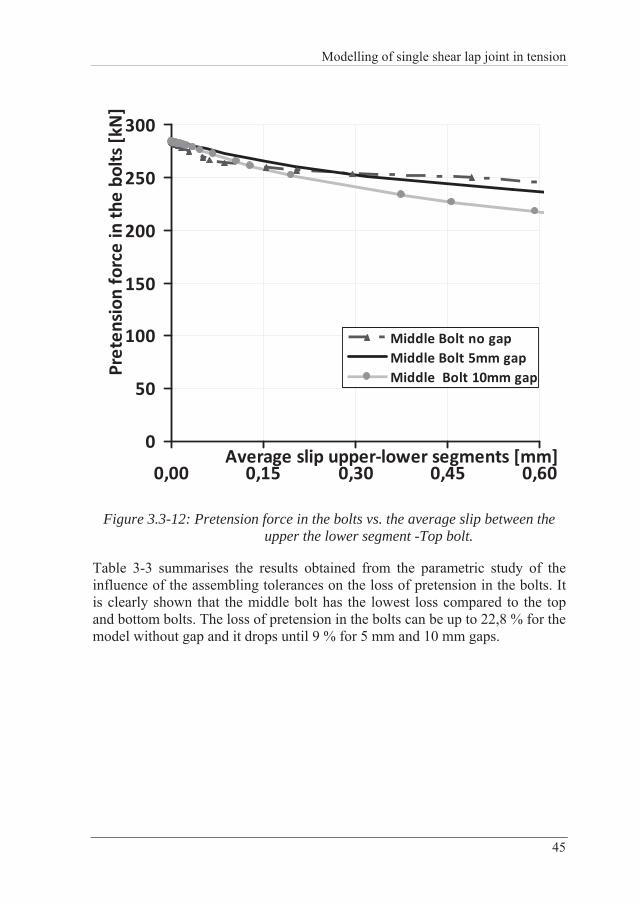
Figure 3.3-12: Pretension force in the bolts vs. the average slip between the upper the lower segment -Top bolt.
Table 3-3 summarises the results obtained from the parametric study of the influence of the assembling tolerances on the loss of pretension in the bolts. It is clearly shown that the middle bolt has the lowest loss compared to the top and bottom bolts. The loss of pretension in the bolts can be up to 22,8 % for the model without gap and it drops until 9 % for 5 mm and 10 mm gaps.
45

FE modelling of friction connection in tubular towers for wind turbines
Table 3-3: Results of the parametric study on the assembling tolerances at 0,15 mm slip.
Pretension force at 0,15 mm slip
[kN]
Loss of pretension
[%]
Average loss [%]
Top bolt 183,6 35,3
Middle bolt 259,1 8,7 No gap
Bottom bolt 214,6 24,4
22,8
Top bolt 256,2 9,7
Middle bolt 264,9 6,7 5 mm gap
Bottom bolt 253,6 10,7
9
Top bolt 256,3 9,7
Middle bolt 261,6 7,8 10 mm gap
Bottom bolt 257,2 9,4
9
46

Modelling of single shear lap joint in tension
3.3.3 Tower connection behaviour using modified boundary conditions
The lap joint model presented previously does not have any boundary conditions based on the axi-symmetric considerations of the specimen; therefore "Tower connection" model is created by introducing modified boundary conditions. These extra boundary conditions are applied to both longitudinal edges as shown in Figure 3.3-13. These additional boundary conditions account for the influence of circumferential stress and allow analysis of a tower connection behaviour showed in Figure 3.2-2 under a tensile load.
Figure 3.3-13: Symmetric Boundary condition for modelling of a tower connection.
Figure 3.3-14 shows the load displacement curves of the "Tower connection" with three different levels of assembling tolerances.
47

FE modelling of friction connection in tubular towers for wind turbines
48
0
50
100
150
200
250
300
350
400
0 3 5 8 10Displacement [mm]
Load
P[kN]
13
Tower connection no gap
Tower connection 5 mm gap
Tower connection 10 mm gap
Figure 3.3-14: Load displacement curve of the tower connection, with three different levels of assembling tolerances.

Modelling of single shear lap joint in tension
49
The "Tower connection" has the same geometry, connection detail, friction coefficient and material properties as the single shear lap joint; therefore a comparison is made between these two models. The main difference is that the "Tower connection" has an additional boundary condition caused by the symmetry.
As might be expected, the additional boundary condition influences the overall behaviour especially in terms of stiffness and the ultimate load. Figure 3.3-15 shows a comparison between the lap joint explained in section 3.2 and the "Tower connection" model. It appears that the "Tower connection" is stiffer than the lap joint with a 2 % higher ultimate load but at 0,15 mm slip the lap join could reach 21 % higher load as shown in Figure 3.3-16.
0
50
100
150
200
250
300
350
400
0 2 4 6 8Displacement [mm]
Load
P[kN]
10
Lap joint no gap
Tower connection no gap
Figure 3.3-15: Comparison between the lap joint and "Tower connection", at ultimate load.

FE modelling of friction connection in tubular towers for wind turbines
0
50
100
150
200
250
300
350
400
0,00 0,15 0,30 0,45 0,60Average slip upper lower segments [mm]
Load
P[kN]
Lap joint no gapTower connection no gapEC3 Nnet,REC3 Fs,R
Figure 3.3-16: Comparison between the lap joint and "Tower connection", at 0,15 mm slip.
50

Modelling of single shear lap joint in tension
The results of the comparison between the two models are summarized in Table 3-4.
Table 3-4: Comparison between "Lap joint” and "Tower connection” models, no gap.
Lap joint Tower connection
Max Load (kN) 378,1 390,1
Displacement at the maximum load (mm) 8,9 8,4
Slip at the max load (mm) 1,1 3,1
Load at 0,15 mm slip (kN) 339 267
Tangent stiffness of the connection (kN/mm) 5275 2910
Secant stiffness of the connection at 0,15 mm
slip (kN/mm) 2259 1794
Secant stiffness of the connection at the maximum load
(kN/mm)
347 127
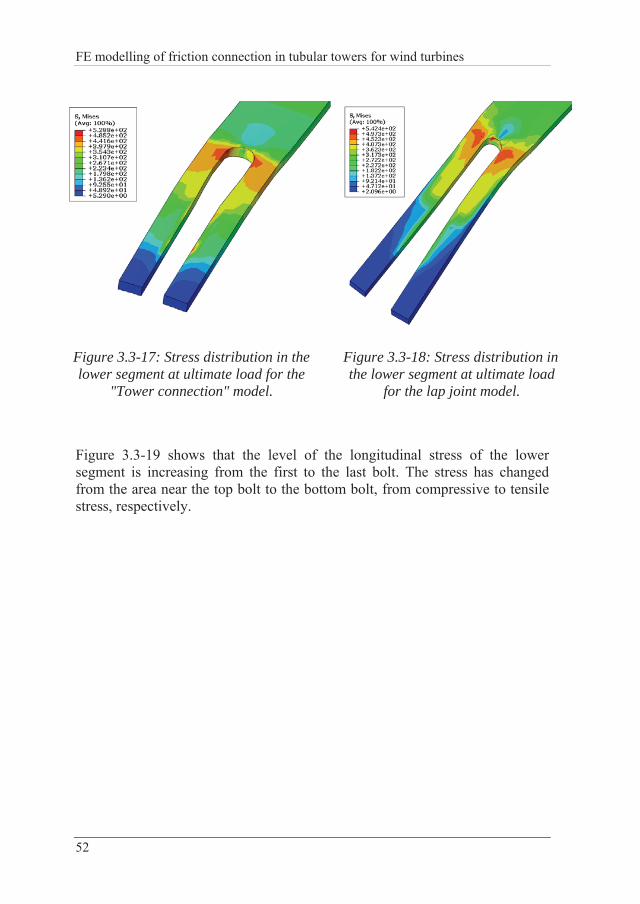
Very obvious from this discrepancy is, a significant opening of the slotted hole "fingers" for the lower segment of the lap joint model (Figure 3.3-18) compared to the "Tower connection" (Figure 3.3-17 )
51
FE modelling of friction connection in tubular towers for wind turbines
Figure 3.3-17: Stress distribution in the lower segment at ultimate load for the
"Tower connection" model.
Figure 3.3-18: Stress distribution in the lower segment at ultimate load
for the lap joint model.
Figure 3.3-19 shows that the level of the longitudinal stress of the lower segment is increasing from the first to the last bolt. The stress has changed from the area near the top bolt to the bottom bolt, from compressive to tensile stress, respectively.
52

Modelling of single shear lap joint in tension
Figure 3.3-19: Stress distribution in the inner plate for the "Tower connection” at ultimate load.
Relative slip between upper and lower segments
Figure 3.3-20 shows a comparison of the applied load and the average slip in the "Tower connection" model. The FE model shows a good agreement with Eurocode 3 [27] in terms of estimation of the failure mode for the model without gap. The slip resistance obtained by ABAQUS is 267 kN compared to the characteristic slip resistance = 272,6 kN, this leads to a difference of about 2 %.
RdsF ,
53

FE modelling of friction connection in tubular towers for wind turbines
0
50
100
150
200
250
300
350
0,00 0,05 0,10 0,15 0,20 0,25 0,30Slip upper lower segments [mm]
Load
P[kN]
Tower connection no gapTower connection 5 mm gapTower connection 10 mm gap"EC3 Nnet,REC3 Fs,R
Figure 3.3-20: Applied load vs. average slip for the”Tower connection” models.
54

Modelling of single shear lap joint in tension
The results of the comparison between the "Tower connection" models are summarized in Table 3-5.
Table 3-5: Results obtained for the "Tower connection” model with different gaps.
Gap 0 mm Gap 5 mm Gap 10 mm
Max Load (kN) 390,1 383 365,6
Displacement at the maximum load (mm) 8,4 9,4 10,3
Slip at the max load (mm) 3,1 3,6 3,9
Load at 0,15 mm slip (kN) 267 179 175
Tangent stiffness of the connection (kN/mm) 2910 1977 1900
Secant stiffness of the connection at 0,15 mm
slip (kN/mm) 1794 1693 1623
Secant stiffness of the connection at the maximum load
(kN/mm)
127 106 94
55

FE modelling of friction connection in tubular towers for wind turbines
Bending stress distribution
The overall deformation shape of the "Tower connection" model is shown in Figure 3.3-21. As predicted an out of plane displacement is clearly shown, it is obvious that the so called "secondary bending" occurs in the model due to the geometric eccentricities when the element is loaded in tension.
Figure 3.3-21: Deformed and un-deformed shape of the "Tower connection" specimen - magnification factor 3 for displacement.
Figure 3.3-22 shows the bending stress along the longitudinal direction (Y axis) of the upper and lower segments of the "Tower connection" no gap model on the surfaces of the connected segments. The calculation steps in which these stresses are recorded are: before applying the external load which means after the pretension bolt step; after 0,15 mm slip between the upper and the lower segments is reached; and at the ultimate load. The maximum stress reached is 300 MPa recorded at ultimate load, this value does not exceed the yield strength of the considered material S355 and yielding does not occur. In comparison with "Tower connection" 10 mm gap specimen (Figure 3.3-23) a higher stress is observed mainly close to the holes of the upper segment which lead to the yielding of the segment.
56

Modelling of single shear lap joint in tension
300
150
0
150
300
1000 800 600 400 200 0 200 400 600 800 1000
Length [mm]
Bend
ingstressdistrib
ution[M
Pa]
After pret., upper segmentAt 0,15mm slip, upper segmentAt max load, upper segmentAfter pret., lower segmentAt 0,15mm slip, lower segmentAt max load, lower segment
Figure 3.3-22: Bending stress distribution along the upper and the lower segments of the "Tower connection" no gap, between tower segments
450
300
150
0
150
300
1000 800 600 400 200 0 200 400 600 800 1000
Length [mm]
Bend
ingstressdistrib
ution[M
Pa]
After pret.,upper segmentAt 0,15mm slip, upper segmentAt max load, upper segmentAfter pret., lower segmentAt 0,15mm slip, lower segmentAt max load, lower segment
Figure 3.3-23: Bending stress distribution along the upper and the lower segments of the "Tower connection" 10mm gap, between tower segments.
Influence of a gap between upper and lower segments on longitudinal stress distribution along the shell is shown in Figure 3.3-24. It is clear that the
57

FE modelling of friction connection in tubular towers for wind turbines
longitudinal stresses are closely distributed at the connection independent of the size of the gap.
350
200
50
100
1000 800 600 400 200 0 200 400 600 800 1000
Length [mm]
Ben
ding
stress
distrib
ution[M
Pa]
No gap upper segment5mm gap upper segment10mm gap upper segmentNo gap lower segment5mm gap lower segment10mm gap lower segment
Figure 3.3-24: Longitudinal stress distribution at the upper and lower segments after the pretension step.
The holes with normal clearance are in the upper segment and the open slotted holes are in the lower segment, respectively. Therefore the upper segment is always more loaded as it is the stiffer part of the connection as shown in Figure 3.3-25.
58
Modelling of single shear lap joint in tension
350
250
150
50
50
150
250
350
1000 800 600 400 200 0 200 400 600 800 1000
Length [mm]
Bend
ingstress
distrib
ution[M
Pa]
No gap upper segment5mm gap upper segment10mm gap upper segmentNo gap lower segment5mm gap lower segment10mm gap lower segment
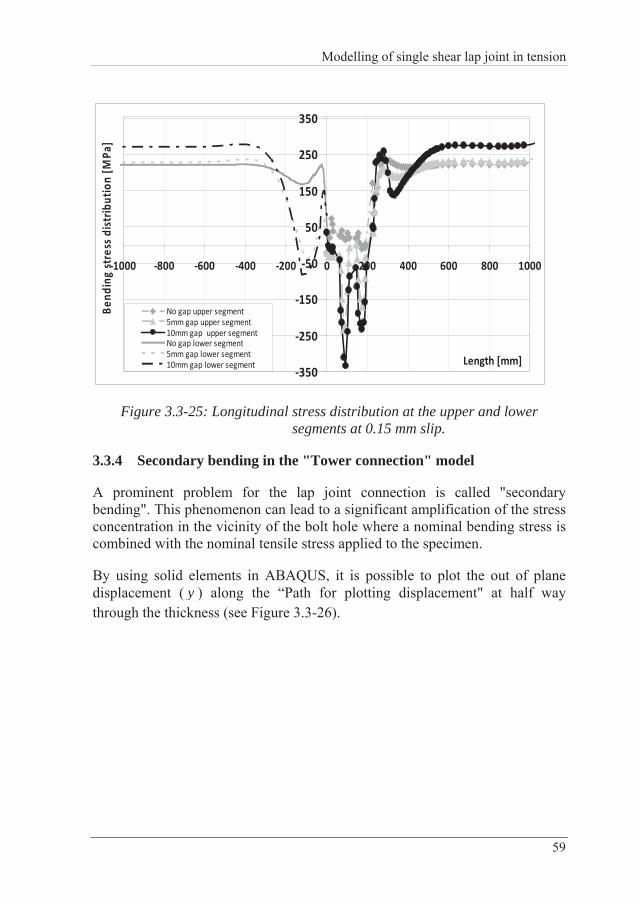
Figure 3.3-25: Longitudinal stress distribution at the upper and lower segments at 0.15 mm slip.
3.3.4 Secondary bending in the "Tower connection" model
A prominent problem for the lap joint connection is called "secondary bending". This phenomenon can lead to a significant amplification of the stress concentration in the vicinity of the bolt hole where a nominal bending stress is combined with the nominal tensile stress applied to the specimen.
By using solid elements in ABAQUS, it is possible to plot the out of plane displacement ( y ) along the “Path for plotting displacement" at half way through the thickness (see Figure 3.3-26).
59

FE modelling of friction connection in tubular towers for wind turbines
Figure 3.3-26: Path for the plotting displacement along one side of the upper segment.
The secondary bending occurs in the model with geometric eccentricities when the specimen is loaded in tension. Due to the eccentricities out of plane displacements occur with local bending as a result (see Figure 3.3-27)
7
5
3
1
1
0 100 200 300 400 500 600
Y direction [mm]
Displacem
entalon
gXdirection[m
m]
No gap upper segment
5mm gap upper segment
10mm gap upper segment
Figure 3.3-27: Out of plane displacement ( y ) according to X-direction at one side of the upper segment, at ultimate load.
60

Modelling of single shear lap joint in tension
Analytical procedure
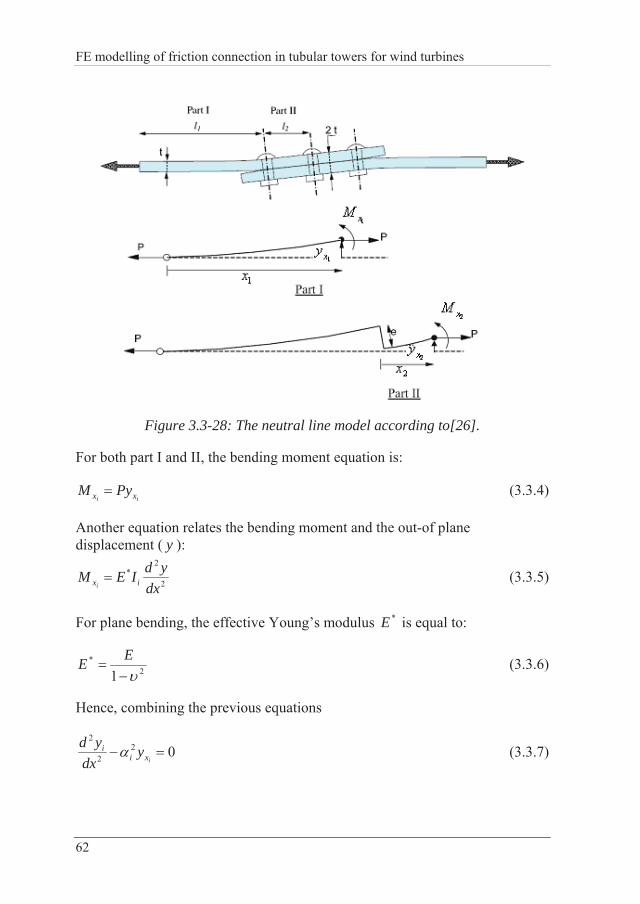
The secondary bending phenomena has not received due attention in standards for design of the single shear lap joints although it can increase the level of the stress in the connection, This section starts with basics of the calculations of secondary bending using the neutral line model (NLM) based on [28] applied for the "Tower connection" model. Then it is followed by results of the FEA and continued with discussion of the results.
The method consists of considering the "Tower connection" as composed of two parts: Part I is a beam under tension and plane bending (caused by eccentricity) and part II, which is the overlapping part between the upper and lower segments, is a beam with double thickness as shown in Figure 3.3-28. Some notations will be used through these calculations which are listed below:
i indicates part I and II;
*E is the effective Young modulus;
I is the moment of inertia of the cross section;
P is the applied load;
t is the thickness of the plate;
1l and are respectively the length of part I and II. 2l
61
FE modelling of friction connection in tubular towers for wind turbines
Figure 3.3-28: The neutral line model according to[26].
For both part I and II, the bending moment equation is:
ii xx PyM (3.3.4)
Another equation relates the bending moment and the out-of plane displacement ( ): y
2
2*
dxydIEM ixi
(3.3.5)
For plane bending, the effective Young’s modulus *E is equal to:
2*
1EE (3.3.6)
Hence, combining the previous equations
022
2
ixii y
dxyd (3.3.7)
62

Modelling of single shear lap joint in tension
With
3**2 12
iii tE
PIE
P (3.3.8)
The solution of the ordinary differential Equation (3.3.7) is obtained with hyperbolic functions:
)cosh()sinh( iiiiiix xBxAyi
(3.3.9)
Where and ( ) are the four constants which depends on the load level and the geometry, see Annex
iA iB 2,1iB. The differential equation is solved in
[26] by introducing the boundary conditions as shown in Figure 3.3-28:
For : 01x 01xy
For and : 11 lx 02x21 xx yey and
dxdy
dxdy xx 21
For : 22 lx 02xy
The results are:
01B (3.3.10)
eBSA 211 (3.3.11)
022111 ACA (3.3.12)
02222 CBSA (3.3.13)
With the hyperbolic functions:
)sinh( iii lS And )cosh( iii lC (3.3.14)
Putting equations (3.3.10) to (3.3.13) in a matrix format:
63

FE modelling of friction connection in tubular towers for wind turbines
00
0
.
0000.100
0010
2
2
1
1
22
211
1 e
BABA
CSC
S (3.3.15)
The maximum bending moment occurs at 11 lx . When solving equations (3.3.7), (3.3.8) and (3.3.9) and deriving the result with respect to x, the bending moment is:
)()( 111111max CBSAPlxM (3.3.16)
The bending stress is:
211max )(6
tlxM
bending (3.3.17)
Note that the width of the specimen is set to be 1 for plane bending.
64

Modelling of single shear lap joint in tension
Comparison between the neutral line model (NLM) and FE results
As part of the investigation, only the elastic range of the finite element calculations is considered and compared with results of the neutral line model. The main drawback using NLM is that it can only be applied for plane bending of 2-dimensional problems which means that it can not give any indication of the existing stress concentrations. Such restrictions are not applicable to the FE calculations. Good agreement is observed between the NLM and ABAQUS in terms of locating the maximum bending stress as shown in Figure 3.3-29. Secondary bending was indicated by the FE analysis with the mean values of the longitudinal stress taken along the width as demonstrated in Figure 3.3-30. Table 3-6 summarizes the results of both NLM and FEA for "Tower connection" model. As said earlier, the neutral line model does not take into consideration the concentration of stress. However, bending stress was in good agreement with results of FE calculations.
Path for plotting longitudinal stresses
Figure 3.3-29: Stress in longitudinal direction, "Tower connection" model no gap.
65

FE modelling of friction connection in tubular towers for wind turbines
66
100
50
0
50
100
150
200
250
300
350
400
450
0 20 40 60 80
Path alon the width [mm]
Stresses
alon
glongitu
dinaldire
ction
[MPa]
100
Figure 3.3-30: Longitudinal stress distribution for "Tower connection" model no gap; the mean value is presented by the grey line.
Table 3-6: Comparison between NLM and FE results.
Gap [mm]
0 5 10
FE [MPa] 165,95 226,26 226
Bending [MPa] 36,13 67,67 100,97
alNoBending min [MPa]
172,27 216,39 257,61
FE /( alNoBending min ) 0,96 1,04 0,86
The nominal stresses are defined as the applied force divided by net cross section of the upper segment. It is worth noting here that the secondary bending is observed only for the segment model and for the tower with friction connection no secondary bending occurred [25].
The hole in the plate
Modelling of single shear lap joint in tension
67
3.4 Summary of the main findings
In this chapter, a finite element model of a single shear lap joint has been developed to study the effects of the assembling tolerances at the maximum load and at the serviceability limit state at 0,15 mm of the slip.
The model is created using ABAQUS software. Efficiency is achieved by defining surface to surface contact, and using a “Contact pairs” table to define which bodies could come into contact. Also the mesh had to be refined locally in the vicinity of the bolt holes for improved resolution of stress and strain due to the presence of the stress concentrations and contact problems.
The assembling tolerances do not affect the total resistance of the lap joint. However, it has been shown that they have a negative effect on the resistance at 0,15 mm slip. It is clearly shown that the onset of elastic slip is increased by the increase of the "the assembling gap". Additionally, it is illustrated that the plastic resistance of the net cross-section according to [14] is not applicable in the case of the lap joint connection where the yielding of the segments do not occur due to the tensile applied load only; it is a mix of tensile stress and secondary bending stress due to eccentricity. Therefore, new recommendation for the design of plastic resistance lap joints is needed.
Comparisons between the lap joint and "Tower connection" models are made. The only difference between these models is the additional boundary condition caused by taking into account circumferential stresses for a tower.
"Tower connection" loaded in tension is also subjected to a significant bending as a result of eccentricities. Out of plane displacements can be observed. The external surface of the lap joint is in compression, although the tensile loading is applied to the specimen. This effect is called "secondary bending".
The neutral line model (NLM) based on [28] assuming plane bending of the beam element of the joint is developed and compared with FE results. Good agreement is found despite the fact that stress concentration is not considered on the NLM. The achieved accuracy is equal to 4 % for the models both without gap and with 5 mm gap.

Tower Connection in pure compression
4 TOWER CONNECTION IN PURE COMPRESSION
In chapter 3 a finite element model has been presented and parametric studies that have been carried out based on a single shear lap joint connection have also been presented. This simplified model can present a circular tubular tower segment under a tensile load by taking into consideration the BC’s due to circumferential stresses. The present chapter focuses on the behaviour of tower segment under pure compression. The same model "Tower connection" is used and a comparison between the two load cases based on the loss of pretension will be shown.
4.1 Description of finite element models
The "Tower connection" model described previously is now loaded under a pure compressive force as shown in Figure 4.1-1. Dimensions and properties such as material, friction coefficient, magnitude of pretension force etc remain the same and will not be specified in detail again.
69
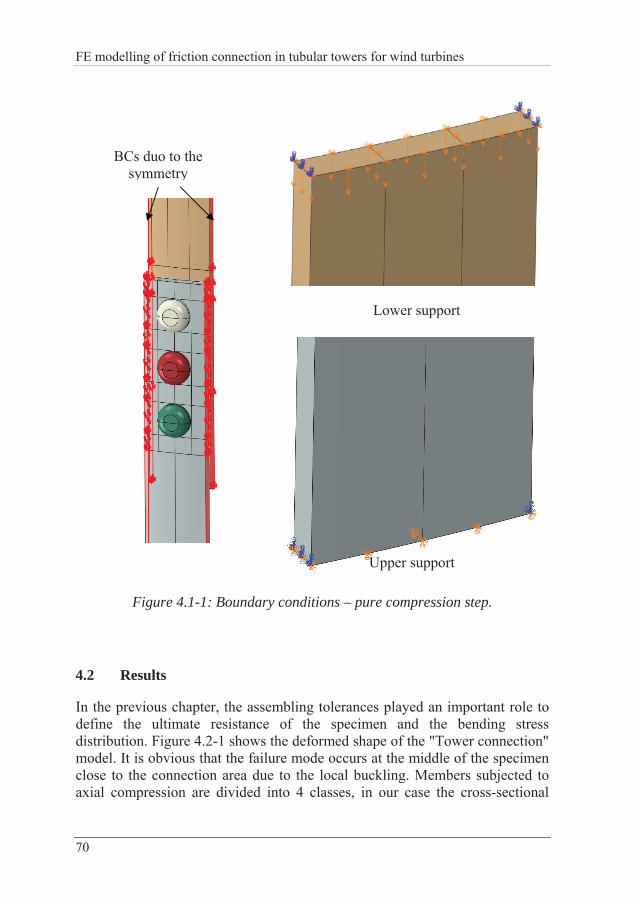
FE modelling of friction connection in tubular towers for wind turbines
Lower support
Figure 4.1-1: Boundary conditions – pure compression step.
BCs duo to the symmetry
Upper support
4.2 Results
In the previous chapter, the assembling tolerances played an important role to define the ultimate resistance of the specimen and the bending stress distribution. Figure 4.2-1 shows the deformed shape of the "Tower connection" model. It is obvious that the failure mode occurs at the middle of the specimen close to the connection area due to the local buckling. Members subjected to axial compression are divided into 4 classes, in our case the cross-sectional
70
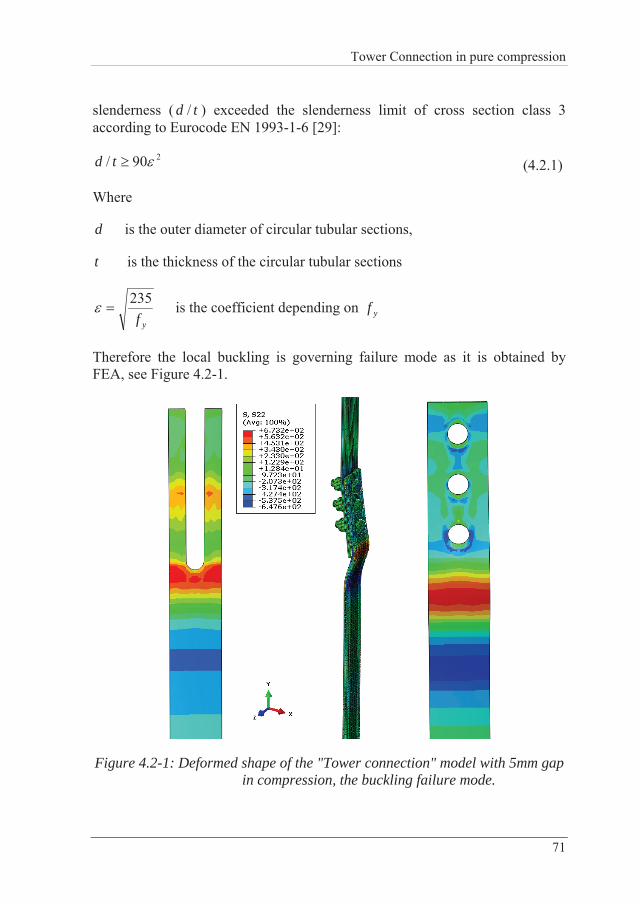
Tower Connection in pure compression
slenderness ( ) exceeded the slenderness limit of cross section class 3 according to Eurocode EN 1993-1-6
td /[29]:
290/ td (4.2.1)
Where
d is the outer diameter of circular tubular sections,
t is the thickness of the circular tubular sections
yf235 is the coefficient depending on yf
Therefore the local buckling is governing failure mode as it is obtained by FEA, see Figure 4.2-1.
Figure 4.2-1: Deformed shape of the "Tower connection" model with 5mm gap in compression, the buckling failure mode.
71
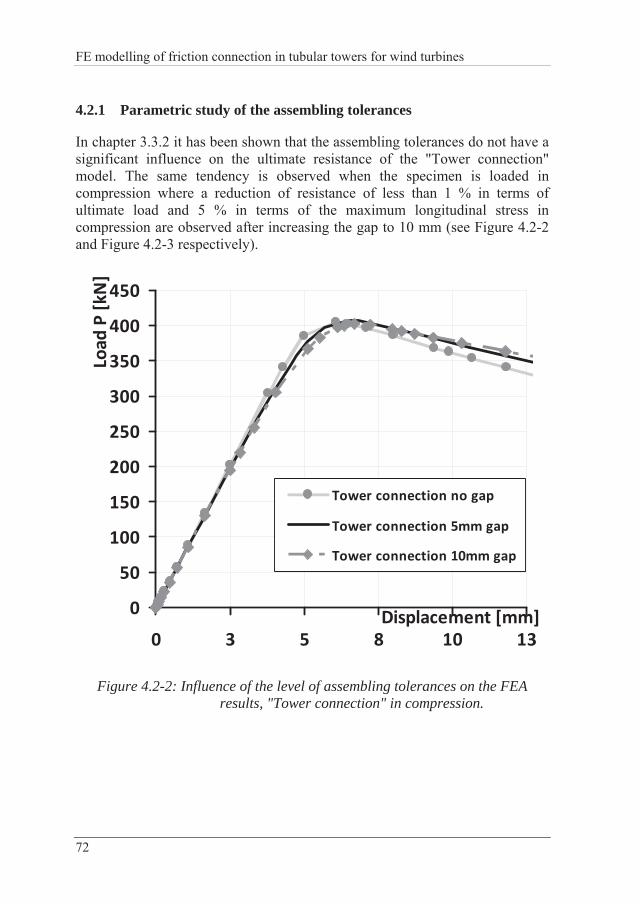
FE modelling of friction connection in tubular towers for wind turbines
72
4.2.1 Parametric study of the assembling tolerances
In chapter 3.3.2 it has been shown that the assembling tolerances do not have a significant influence on the ultimate resistance of the "Tower connection" model. The same tendency is observed when the specimen is loaded in compression where a reduction of resistance of less than 1 % in terms of ultimate load and 5 % in terms of the maximum longitudinal stress in compression are observed after increasing the gap to 10 mm (see Figure 4.2-2 and Figure 4.2-3 respectively).
0
50
100
150
200
250
300
350
400
450
0 3 5 8 10Displacement [mm]
Load
P[kN]
13
Tower connection no gap
Tower connection 5mm gap
Tower connection 10mm gap
Figure 4.2-2: Influence of the level of assembling tolerances on the FEA results, "Tower connection" in compression.

Tower Connection in pure compression
450
375
300
225
150
75
0
75
150
225
1000 800 600 400 200 0 200 400 600 800 1000
Length [mm]
Bend
ingstressdistrib
ution[M
Pa]
No gap upper segment5mm gap upper segment10mm gap upper segmentNo gap lower segment5mm gap lower segment10mm gap lower segment
Figure 4.2-3: Longitudinal stress distribution at the upper and lower segments at 0,15 mm slip, "Tower connection" in compression.
Figure 4.2-4 shows that all the runs are on the safe side when compared with the plastic resistance of the net cross section and the characteristic slip resistance calculated according to
RnetN ,
RdsF , [14]. A reduction of resistance up to 20 % at the slip level of 0,15 mm is identified. It is also shown that the prediction of the local buckling failure by FEA is in really good agreement with [29]. The achieved accuracy is equal to 0,25 % for the "Tower connection" 5 mm gap. The complete procedure for the design check of the cylinder against buckling failure can be found in Annex C.
Figure 4.2-6 indicates that the pretension force in the bolts remains almost the same until the maximum load is reached. After that, the top bolt starts to lose more pretension force compared to the other two bolts because it is closest to the applied load.
73

FE modelling of friction connection in tubular towers for wind turbines
0
75
150
225
300
375
450
0,00 0,15 0,30 0,45 0,60Average slip upper lower segments [mm]
Load
P[kN]
Tower connection no gapTower connection 5mm gapTower connection 10mm gapEC3 Nnet,REC3 Fs,REC3 Buckling resistance, class A
Figure 4.2-4: Comparison of load vs. slip curves for different assembling tolerances.
74

Tower Connection in pure compression
Figure 4.2-5: Stresses in longitudinal direction at the ultimate load, magnification factor 3.
Gap 5mm Gap 10mm No gap
030
6090
120150
180210240
270300
0 50 100 150 200 250 300 350 400 450Total Load [kN]
Pretension
forceinthebolts[kN]
Top BoltMiddle BoltBottom Bolt
Figure 4.2-6: Pretension forces in the bolt vs. the total applied load, "Tower connection" in compression no gap, at ultimate load.
75

FE modelling of friction connection in tubular towers for wind turbines
76
4.2.2 Parametric study varying material properties of the segments
This chapter deals with the influence of the material properties of the connected segments on the resistance of the specimen and on the loss of pretension force in the bolts. Note that the results presented below belong to the "Tower connection" model with 5 mm gap.
Figure 4.2-7 illustrates the scattering in the resistance for three different nominal steel grades (S355, S460 and S690), varying from 406 kN for S355 to 711 kN for S690. It shows the dependence of scatter on the yield stresses of the plates. Figure 4.2-8 and Figure 4.2-9 emphasize that yielding around the upper segment hole occurs. This yielding increases by increasing from S355 to S690 steel grades.
0
100
200
300
400
500
600
700
800
0 4 8 12 16Displacement [mm]
Load
P[kN]
20
S355S460S690EC3 Buckling resistance, class A, S355EC3 Buckling resistance, class A, S460EC3 Buckling resistance, class A, S690
Figure 4.2-7: Comparison of load-displacement curves for different materials.

Tower Connection in pure compression
Figure 4.2-8: Stresses in longitudinal direction - 0,15 mm slip, S355.
Figure 4.2-9: Stresses in longitudinal direction - 0,15 mm slip, S690.
77

FE modelling of friction connection in tubular towers for wind turbines
From Figure 4.2-10 the scattering in the slip resistance is observed depending on the yield strength of the connected segments. A decrease from 0,84 of the normalised gross stress for S355 to 0,47 for S690. The normalized gross stress is defined as the applied load divided by the plastic resistance of the gross area. The materials have neither reached their complete yielding (normalised gross stress equal to 1) at 0,15 mm slip between segments, nor the ultimate load of the connection. This indicates that as a failure model the local buckling in this case plays an important role where higher yield strength leads to a lower slenderness limit according to [29] ( ). Therefore, the FE model experiences local buckling failure prior to slip failure for higher yield strength which is in good agreement with the code predictions, see
290/ td
Figure 4.2-7.
0,00
0,20
0,40
0,60
0,80
1,00
0,00 0,15 0,30 0,45 0,60 0,75Average slip upper lower segments [mm]
Normalised
grossstress
S355
S460
S690
Figure 4.2-10: Comparison of normalised gross stress vs. slip curves for different materials.
Table 4-1 summarizes the results obtained from the parametric study with regards to the normalised gross stress and the loss of pretension. The loss of
78

Tower Connection in pure compression
pretension up to 16,4 % may be expected and it decreases by increasing the yield strength of the segments.
Table 4-1: Results of parametric study on material properties of plate - at 0,15 mm slip.
Material ygross
grossfA
P.
Loss of pretension Top bolt [%]
S355 0,84 16,4
S460 0,73 3,2
S690 0,47 0
4.3 Summary of the main findings
The assembling tolerances do not affect the total resistance of the specimen. However, the specimen sustains a lower load with bigger gap for a certain slip at the ascending load curve and the onset of the elastic slip is decreased with increasing the gap. Different governing failure modes are observed. Whereas according to [14] and [29] the plastic resistance of the net cross section and the local buckling are governing failure for S355, S460 and S690 respectively.
The FEA shows that the slip resistance and the failure modes depend on the steel grade of the connected segments. Higher steel grade reduces the yielding around the holes and leads to lower losses of pretension in the bolts. Therefore it increases the slip resistance and reduces the slenderness limit of the segments which prioritizes the local buckling as failure mode compared to slip failure for higher steel grades, S460 and S690.
79
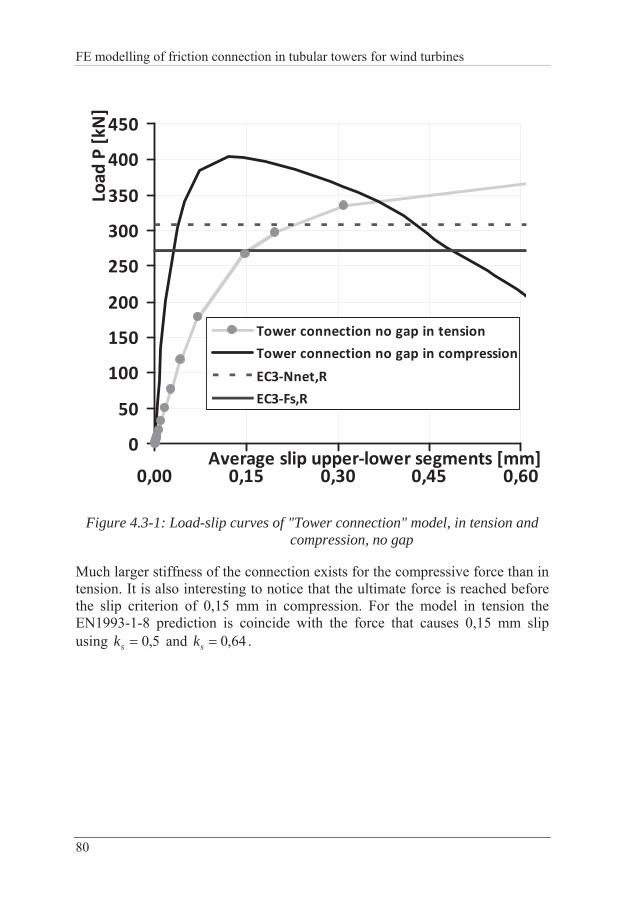
FE modelling of friction connection in tubular towers for wind turbines
0
50
100
150
200
250
300
350
400
450
0,00 0,15 0,30 0,45 0,60Average slip upper lower segments [mm]
Load
P[kN]
Tower connection no gap in tension
Tower connection no gap in compression
EC3 Nnet,R
EC3 Fs,R
Figure 4.3-1: Load-slip curves of "Tower connection" model, in tension and compression, no gap
Much larger stiffness of the connection exists for the compressive force than in tension. It is also interesting to notice that the ultimate force is reached before the slip criterion of 0,15 mm in compression. For the model in tension the EN1993-1-8 prediction is coincide with the force that causes 0,15 mm slip using and . 5,0sk 64,0sk
80

Down scaled bending tests of the friction connection
5 DOWN SCALED BENDING TESTS OF THE FRICTION CONNECTION
In order to study the behaviour of the friction connection joint in bending, four "Four point bending tests" of down-scaled tubular tower section were performed at Aachen University (RWTH). A short summary of the experimental study is presented, it is followed by results from FEA which can provide a relatively inexpensive and time efficient alternative compared with the tests by allowing a wide ranging parametric study. It is then continued with discussion of the results and completed with a number of summarizing conclusions.
5.1 Experiments
The test set-up of the experiments is shown in Figure 5.1-1. The main objective of the experiments was to investigate the behaviour of the connection in bending and to test the feasibility of the assembling.
Four quasi-static 4-point bending tests have been performed on down-scaled wind tower connections with friction joints (FJ), two of which had TCB M20 bolts and other two specimens had Friedberg M20-10.9HV-Rändel bolts. Results obtained from the specimen using TCB are discussed in this chapter.
81

FE modelling of friction connection in tubular towers for wind turbines
Figure 5.1-1: Test on friction connection performed at RWTH [26].
Each test specimen consists of four tubular segments. Two segments (Part A) with a length of 2570 mm are rather stiff (14mm thickness) and two middle segments (Part B and Part C) with a length of 1130 mm each and 8mm thickness. Part B has 24 long open slotted holes and Part C has 72 equidistant and corresponding normal clearance holes (see Figure 5.1-2). The contact surfaces of the inner and outer segments, Part B and C, respectively, and cover plates are painted with zinc shop-primer, providing the friction coefficient of 56,0c after 14 days. For each specimen, 15 bolts are equipped with BTM- 6C strain gauges (monitoring bolts). This type of strain gauge is glued into the bolt in a 2 mm diameter hole. Tension Control Bolts (TCB) M20 10.9 are used in specimens FJ3 and FJ4. The TCBs have a break neck which is cut off when the bolt force has achieved a calibrated level of . kNF Cp 160,
The specimens were designed so that the ultimate load of the connection would be governing. This prediction is based on the formulae 3.3.2 assuming the correction factor for the oval hole 0,64 [12] and the friction coefficient of 0,56. The total shear force taken by 3 pre-tensioned bolts would be 172 kN which could be assumed to be uniformly distributed on the 1/24 area of the cylinder (Part C) leading to the stresses of 165 MPa. From this max stress in Part C, the maximum applied load is about 740 kN. If the effect of oversized holes is neglected the expected total force would be about 1150 kN.
82

Down scaled bending tests of the friction connection
Figure 5.1-2: Test specimen of 4-point bending test and detail of friction connection [30].
5.2 FE modelling
In this chapter a finite element model with non-linear properties is described and results are presented from several attempts that were made to validate it by comparing results with experiments. Issues in modelling the contact between the joint parts and the material properties are used as in the single shear lap joint and will not be specified in detail again. Parametric studies such as mesh density, element type, level of assembling tolerances analysis type and material modelling were preformed in order to establish the FE analysis model.
5.2.1 Material modelling
Figure 5.2-1 and Figure 5.2-2 show the stress–strain curves of S355J2+N and S460ML steel grade materials respectively. Table 5-1 summarizes the
83

FE modelling of friction connection in tubular towers for wind turbines
measured material properties of the actual test segments Part A, Part B and Part C
0
100
200
300
400
500
600
700
0,00 0,05 0,10 0,15 0,20Strain [ ]
Stress[M
Pa]
Nominal, S355J2+N
True, S355J2+N
Figure 5.2-1: Uniaxial material model of the measured engineering and true stress – strain relationship of steel S355J2+N.
84

Down scaled bending tests of the friction connection
0
100
200
300
400
500
600
700
800
0,00 0,05 0,10 0,15 0,20Strain [ ]
Stress[M
Pa]
Nominal, S460ML
True, S460ML
Figure 5.2-2: Uniaxial material model of the measured engineering and true stress – strain relationship of steel S460ML.
Table 5-1: Measured material properties of S355 and S460 steel.
Segment Steel grade Yield strength [MPa]
Ultimate strength [MPa]
Part A S460ML 536 604
Part B S355J2+N 415 534
Part C S355J2+N 415 534
85
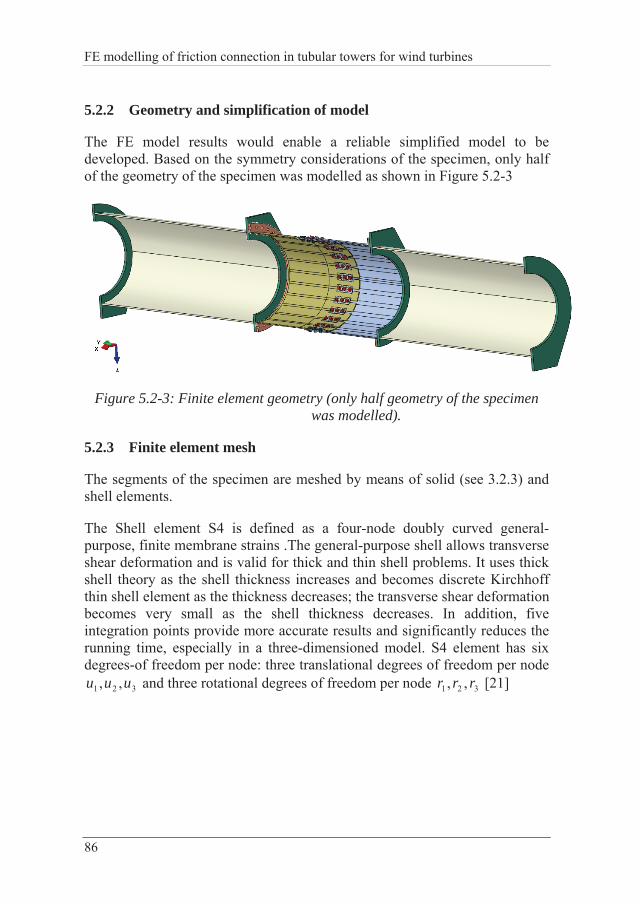
FE modelling of friction connection in tubular towers for wind turbines
5.2.2 Geometry and simplification of model
The FE model results would enable a reliable simplified model to be developed. Based on the symmetry considerations of the specimen, only half of the geometry of the specimen was modelled as shown in Figure 5.2-3
Figure 5.2-3: Finite element geometry (only half geometry of the specimen was modelled).
5.2.3 Finite element mesh
The segments of the specimen are meshed by means of solid (see 3.2.3) and shell elements.
The Shell element S4 is defined as a four-node doubly curved general-purpose, finite membrane strains .The general-purpose shell allows transverse shear deformation and is valid for thick and thin shell problems. It uses thick shell theory as the shell thickness increases and becomes discrete Kirchhoff thin shell element as the thickness decreases; the transverse shear deformation becomes very small as the shell thickness decreases. In addition, five integration points provide more accurate results and significantly reduces the running time, especially in a three-dimensioned model. S4 element has six degrees-of freedom per node: three translational degrees of freedom per node
and three rotational degrees of freedom per node 321 ,, uuu 321 ,, rrr [21]
86

Down scaled bending tests of the friction connection
Figure 5.2-4 shows finite element mesh of the middle of the specimen.
Figure 5.2-4: Finite element mesh of the middle part of the specimen.
Part C BoltPart B
Figure 5.2-5 shows finite element mesh of the middle Part A using shell and solid elements.
Figure 5.2-5: Finite element mesh of the middle Part A. left: Shell element mesh and right Solid element mesh.
Solid elementShell element
87

FE modelling of friction connection in tubular towers for wind turbines
88
5.2.4 Boundary conditions and loading
The boundary conditions for the model are established taking into account the symmetry (Y-Z plane). Thus, only half of the model is simulated. Symmetric condition was applied to all nodes of the middle section of the plane ( ) 0,, 321 rru
The analysis has been performed in the following two sequential steps: first a pretension force step; and the second step modelling bending of the specimen.
Pretension
During the first step all three translational degrees of freedom (DOF) at the bottom of the right and left of Part A segments were restrained as can be seen in Figure 5.2-6 and a pretension force kNF Cp 160, is applied in all bolts, until Part B and Part C are in contact. It is the same level of pretension force as the beginning of the test.
Figure 5.2-6: Boundary conditions – pretension of bolts step.
Bending step
The DOF in the longitudinal direction at the bottom of the right of Part A was released thus modelling the simply supported boundary condition and a displacement control is applied at tops of both Part A segments (see Figure 5.2-7).

Down scaled bending tests of the friction connection
Figure 5.2-7: Boundary conditions – bending loading step.
5.3 FE analysis results and parametric study
In this section, results from the three-dimensional finite element model, developed in the previous section, are compared with results from experiments. The relevant experimental results are first presented, and then results from the Base Model are given. Following that a parametric study to improve model behaviour is discussed, and finally a comparison is made between the improved model and the finite element results.
5.3.1 Experimental results
As mentioned in chapter 5.1, only results obtained using TCB bolts are discussed in this evaluation by means of two quasi-static 4-point bending tests (FJ3 and FJ4).
The load deflection curves of the friction connection tests after a loading history of more than 1500 load cycles are shown in Figure 5.3-1.
89

FE modelling of friction connection in tubular towers for wind turbines
0
250
500
750
1000
1250
1500
1750
2000
0 5 10 15 20 25 30 35 40 45 50Displacement z [mm]
Load
P[kN]
FJ3FJ4Prediction for the connection failure
Figure 5.3-1: Load deflection curves of friction-joint tests FJ3 to FJ4 (TCB) [7], and prediction for the connection failure using 56,0c and 0,1sk .
5.3.2 Results from the base model
This section presents the load-displacement curves from the base model developed in Section 2.2. The base model had 5 mm existing gap between Part B and Part C segments which corresponds to “assembling” tolerances. For the model C3D8I element type is employed and friction coefficient of 0,6 is used.
Figure 5.3-2 shows a comparison between the FE base model and experimental results. The overall behaviour appeared to show quite a reasonable agreement, but the model was stiffer in FE than the experiment with 108 kN/mm for FE than 83 kN/mm for J3 test which is 24,5 % higher than the experimentally measured stiffness. The FE model gives really good agreement in terms of ultimate load and the difference is less than 2 % compared to FJ3 experimental test.
90

Down scaled bending tests of the friction connection
0
250
500
750
1000
1250
1500
1750
2000
2250
0 5 10 15 20 25 30 35 40 45 50Displacement z [mm]
Load
P[kN]
FJ3FJ4FE base modelEC3 Ultimate elastic limitEC3 Buckling resistance, class AEC3 Connection failure,mi=0,6 and ks=1,0
Figure 5.3-2: Comparison between FE base model, code predictions and experimental results.
5.3.3 Parametric study to improve model behaviour
To try and improve the base model a parametric study, which involved varying the element order, mesh density, level of assembling tolerances, material modelling and friction coefficient, was carried out. The first parameter examined was the number of degrees of freedom. Three variations were examined:
1. Decreasing the element type order for the hall model (C3D8 and C3D8R) except the bolts which remain C3D8I to keep the bending performance.
2. Coarsening the non-overlap region (Part A segment) see Figure 5.3-3
3. Influence of element type in the non-overlap region (shell S4 element) as shown in Figure 5.2-5
91
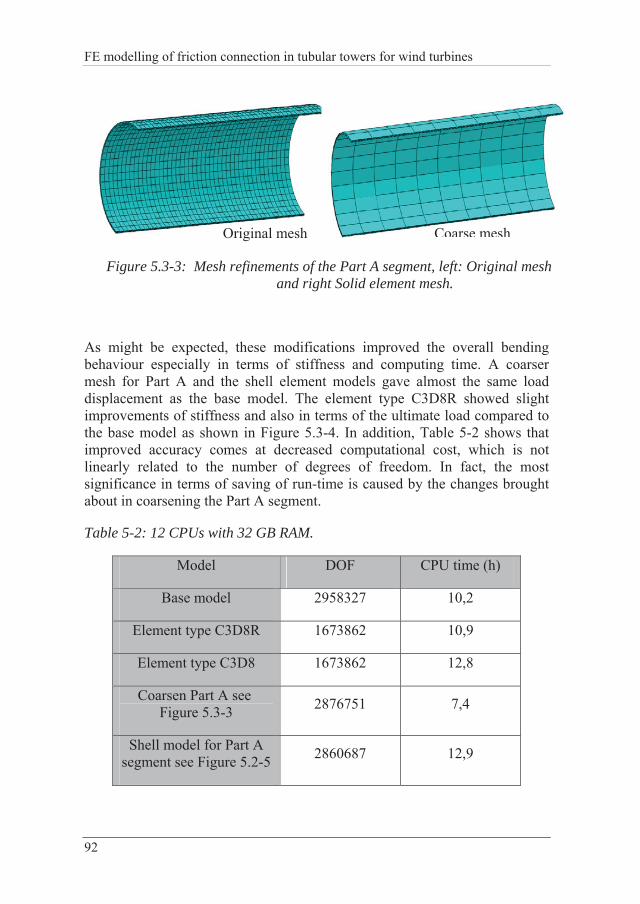
FE modelling of friction connection in tubular towers for wind turbines
Figure 5.3-3: Mesh refinements of the Part A segment, left: Original mesh and right Solid element mesh.
Original mesh Coarse mesh
As might be expected, these modifications improved the overall bending behaviour especially in terms of stiffness and computing time. A coarser mesh for Part A and the shell element models gave almost the same load displacement as the base model. The element type C3D8R showed slight improvements of stiffness and also in terms of the ultimate load compared to the base model as shown in Figure 5.3-4. In addition, Table 5-2 shows that improved accuracy comes at decreased computational cost, which is not linearly related to the number of degrees of freedom. In fact, the most significance in terms of saving of run-time is caused by the changes brought about in coarsening the Part A segment.
Table 5-2: 12 CPUs with 32 GB RAM.
Model DOF CPU time (h)
Base model 2958327 10,2
Element type C3D8R 1673862 10,9
Element type C3D8 1673862 12,8
Coarsen Part A see Figure 5.3-3 2876751 7,4
Shell model for Part A segment see Figure 5.2-5 2860687 12,9
92

Down scaled bending tests of the friction connection
0
200
400
600
800
1000
1200
1400
1600
1800
2000
0 5 10 15 20 25 30 35 40 45 50
Displacement z [mm]
Load
P[kN]
FJ3FJ4FE element type C3D8RFE element type C3D8FE base model
Figure 5.3-4: Influence of the element type on the FEA results.
Other variables studied in the parametric analysis are shown below. Influence of the level of friction coefficient
The measured contact surfaces of the inner and outer segments, Part B and Part C, respectively, and cover plates providing a friction coefficient of 56,0c .
The friction coefficient in the connection is established using standardized procedure in [12] and the single value is obtained. In fact, the behaviour of the friction connection is much more complicated. In all numerical analysis used in this work it is assumed that the friction coefficient is constant.
The introduced friction coefficient does not reflect any non-linearity of the friction coefficient depending on the slip, which may be present. Such nonlinearity may be caused by the state of the contact surfaces, in particular the size of asperities and level of changes of the roughness due to contact pressure. Thus, it is very likely in an experiment that the friction coefficient
93

FE modelling of friction connection in tubular towers for wind turbines
varies. This micro mechanism is not further investigated because it is related to very specific issues of mechanical engineering than structural analysis. The simplification of the friction behaviour between surfaces may be one of major reasons of the discrepancy between FEA results and experiments [31].
Therefore three different friction coefficients have been investigated (0,35, 0,5 and 0,6) and results are shown in Figure 5.3-5. It is clearly shown that the friction coefficient 5,0c gave almost the same load-displacement curve as the base model where 6,0c . When the friction coefficient 35,0c is used, the results from ABAQUS predict resistance of 1532,15 kN which is 16 % below the experimental results.
If the simple hand-calculation model is used to predict influence of the friction coefficient on the total load applied than the reduction from 5,0c to 35,0c should lead to the linear reduction of the total load of about 30 %.
0
250
500
750
1000
1250
1500
1750
2000
0 5 10 15 20 25 30 35 40 45 50Displacement z [mm]
Load
P[kN]
FJ3FJ4FE base modelFE friction coefficient 0,35FE friction coefficient 0,5EC3 friction coefficient 0.35EC3 friction coefficient 0.6
Figure 5.3-5: Influence of the level of friction coefficient on the FEA results,
predictions are calculated with 0,1sk , the gap 5 mm.
94
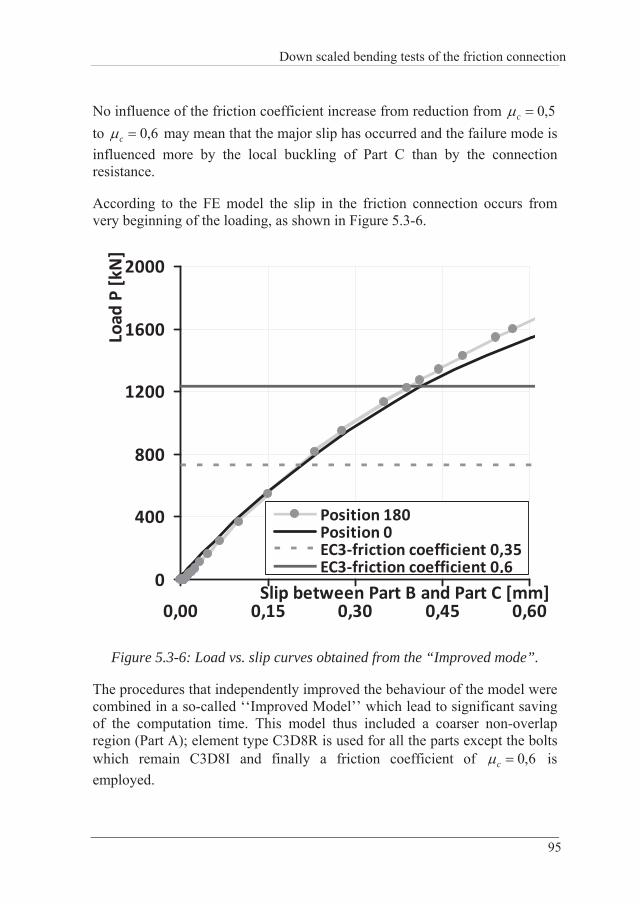
Down scaled bending tests of the friction connection
No influence of the friction coefficient increase from reduction from 5,0c to 6,0c may mean that the major slip has occurred and the failure mode is influenced more by the local buckling of Part C than by the connection resistance.
According to the FE model the slip in the friction connection occurs from very beginning of the loading, as shown in Figure 5.3-6.
0
400
800
1200
1600
2000
0,00 0,15 0,30 0,45 0,60Slip between Part B and Part C [mm]
Load
P[kN]
Position 180Position 0EC3 friction coefficient 0,35EC3 friction coefficient 0,6
Figure 5.3-6: Load vs. slip curves obtained from the “Improved mode”.
The procedures that independently improved the behaviour of the model were combined in a so-called ‘‘Improved Model’’ which lead to significant saving of the computation time. This model thus included a coarser non-overlap region (Part A); element type C3D8R is used for all the parts except the bolts which remain C3D8I and finally a friction coefficient of 6,0c is employed.
95
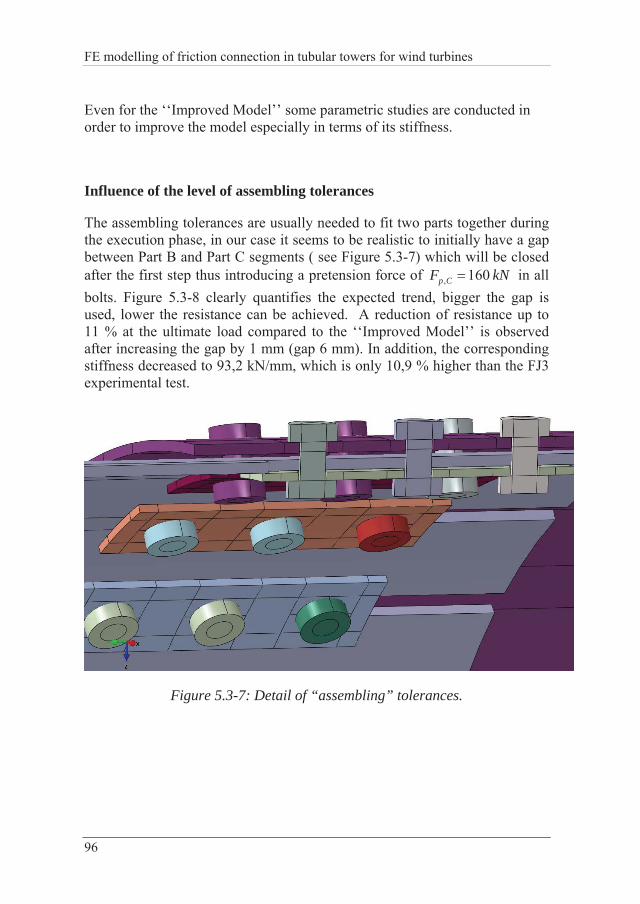
FE modelling of friction connection in tubular towers for wind turbines
Even for the ‘‘Improved Model’’ some parametric studies are conducted in order to improve the model especially in terms of its stiffness.
Influence of the level of assembling tolerances
The assembling tolerances are usually needed to fit two parts together during the execution phase, in our case it seems to be realistic to initially have a gap between Part B and Part C segments ( see Figure 5.3-7) which will be closed after the first step thus introducing a pretension force of kNF Cp 160, in all bolts. Figure 5.3-8 clearly quantifies the expected trend, bigger the gap is used, lower the resistance can be achieved. A reduction of resistance up to 11 % at the ultimate load compared to the ‘‘Improved Model’’ is observed after increasing the gap by 1 mm (gap 6 mm). In addition, the corresponding stiffness decreased to 93,2 kN/mm, which is only 10,9 % higher than the FJ3 experimental test.
Figure 5.3-7: Detail of “assembling” tolerances.
96
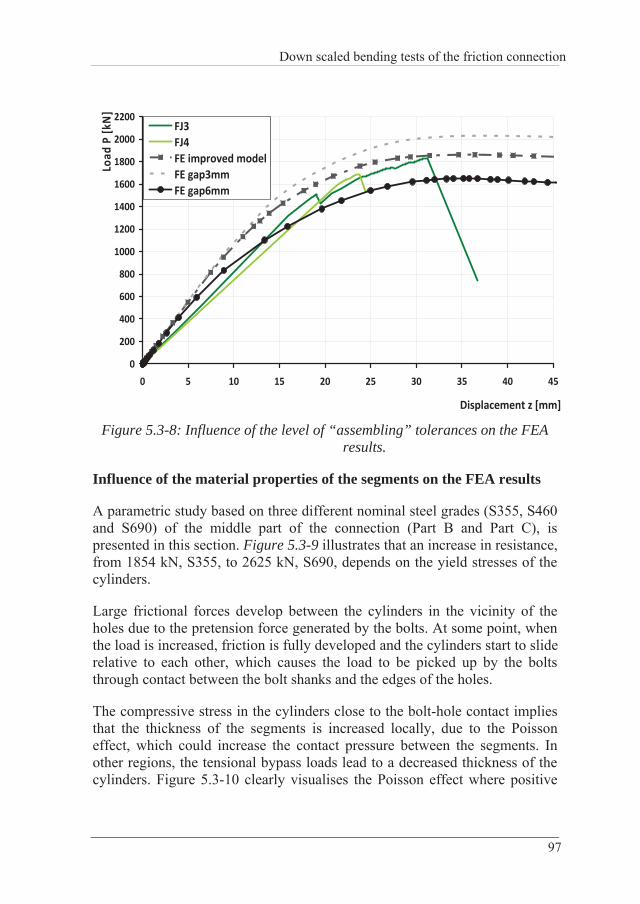
Down scaled bending tests of the friction connection
0
200
400
600
800
1000
1200
1400
1600
1800
2000
2200
0 5 10 15 20 25 30 35 40 45
Displacement z [mm]
Load
P[kN]
FJ3FJ4FE improved modelFE gap3mmFE gap6mm
Figure 5.3-8: Influence of the level of “assembling” tolerances on the FEA
results.
Influence of the material properties of the segments on the FEA results
A parametric study based on three different nominal steel grades (S355, S460 and S690) of the middle part of the connection (Part B and Part C), is presented in this section. Figure 5.3-9 illustrates that an increase in resistance, from 1854 kN, S355, to 2625 kN, S690, depends on the yield stresses of the cylinders.
Large frictional forces develop between the cylinders in the vicinity of the holes due to the pretension force generated by the bolts. At some point, when the load is increased, friction is fully developed and the cylinders start to slide relative to each other, which causes the load to be picked up by the bolts through contact between the bolt shanks and the edges of the holes.
The compressive stress in the cylinders close to the bolt-hole contact implies that the thickness of the segments is increased locally, due to the Poisson effect, which could increase the contact pressure between the segments. In other regions, the tensional bypass loads lead to a decreased thickness of the cylinders. Figure 5.3-10 clearly visualises the Poisson effect where positive
97

FE modelling of friction connection in tubular towers for wind turbines
and negative values describe a decrease and increase of the total thickness clamping package respectively. The reduction of the total segment thickness is measured at each hole as the relative change of the two outermost segments.
0
250
500
750
1000
1250
1500
1750
2000
2250
2500
2750
0 5 10 15 20 25 30 35 40 45 50Displacement z [mm]
Load
P[kN]
FJ3FJ4FE improved modelFE S460FE S690EC3 Buckling resistance, fy=415, class AEC3 Buckling resistance, fy=460, class AEC3 Buckling resistance, fy=690, class A
Figure 5.3-9: Influence of the material properties of the segments on the FEA results.
Table 5-3: Buckling resistances from parametric study on material properties of the cylinders.
Yield strength [MPa]
Buckling resistance
ClassA [kN]
ABAQUS [kN] ABAQUS/EC Elastic limit
[kN]
415 1768 1862 1,05 1980 460 1923 2034 1,05 2194 690 2635 2625 0,99 3292
98
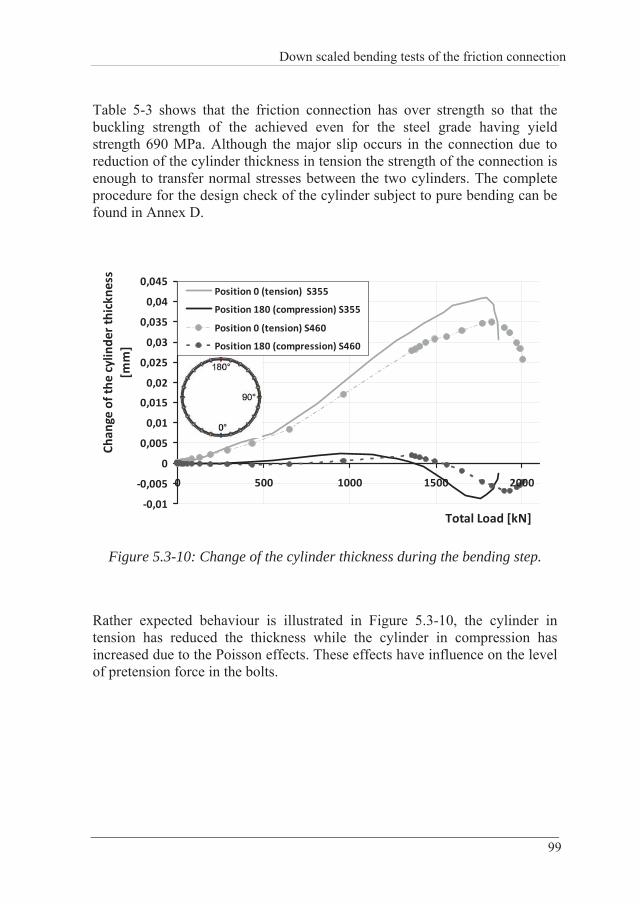
Down scaled bending tests of the friction connection
Table 5-3 shows that the friction connection has over strength so that the buckling strength of the achieved even for the steel grade having yield strength 690 MPa. Although the major slip occurs in the connection due to reduction of the cylinder thickness in tension the strength of the connection is enough to transfer normal stresses between the two cylinders. The complete procedure for the design check of the cylinder subject to pure bending can be found in Annex D.
0,01
0,005
0
0,005
0,01
0,015
0,02
0,025
0,03
0,035
0,04
0,045
0 500 1000 1500 2000
Total Load [kN]
Chan
geof
thecylin
derthickn
ess
[mm]
Position 0 (tension) S355
Position 180 (compression) S355
Position 0 (tension) S460
Position 180 (compression) S460
Figure 5.3-10: Change of the cylinder thickness during the bending step.
Rather expected behaviour is illustrated in Figure 5.3-10, the cylinder in tension has reduced the thickness while the cylinder in compression has increased due to the Poisson effects. These effects have influence on the level of pretension force in the bolts.
99

FE modelling of friction connection in tubular towers for wind turbines
100
5.4 Summary of the main findings
In this chapter, a finite element model of four point bending test using friction connection has been created, and the results of its validation against experimental results are presented. The model has been developed for a study of the effects of the “assembling” tolerances and the influence of high strength steel grade of the segments on the failure mode and the ultimate strength.
A number of factors were found to affect the accuracy and efficiency of the solution such as the element type and the friction coefficient. The model was created using ABAQUS software.
Comparisons between the ‘‘Base Model’’ and the experiments revealed good agreement for the ultimate strength where the difference is less than 2 % when compared to the experimental test., but an overestimation of the stiffness by the model was found. A parametric study was carried out in an effort to improve the correlation with experiment, without incurring an excessive penalty in computational cost. The factors that most improved the model were a coarser non-overlap region using C3D8R element for all the parts except the Bolts where C3D8I element is employed.
These factors were incorporated into an ‘‘Improved Model’’, and significant improvement in correlation with experimental stiffness was obtained where the scattering reduced from 25 % to 11 %. The computational cost of these improvements was relatively small. The most detrimental effect on computational cost occurred when the number of elements in contact was increased.

Conclusions and future works
6 CONCLUSIONS AND FUTURE WORKS
Quality of the FE model is evaluated by a comparison of the down-scale bending experiments and hand calculation models, according the EN 1993-1-8 and EN 1993-1-6. It is shown that the global behaviour, the load-displacement curves, and the failure mode obtained from FE models are in very good agreement with experimental results. The friction connection with open long slotted holes is modelled by the most realistic 3D elements using contact elements that allow:
1. Closing of the gap between two tower segments, during the assembling.
2. Sliding between them during loading.
Based on the FE model the following conclusions are derived:
1. The longitudinal normal stress distribution which appears during the closing of the gap between two tower segments is localized in a narrow region of the connection. These stresses are studied, by “the segment specimens”, are below 355 MPa, the yield strength of the steel grade used, for the 10 mm gap of the tower 2 m in diameter and 14 mm thick. This means that design of the slotted holes is successful and can accommodate rather large assembling tolerances. It is expected that this would be the general conclusion even for any tower with the same design of the slotted hole.
101

FE modelling of friction connection in tubular towers for wind turbines
2. Influence of the assembling tolerances, the gap between segments of the tower 2 m in diameter and 14 mm thick, is not linear on the ultimate resistance in tension of the connection. For example, for three levels of tolerances, the ultimate load is as follows 390 kN, 383 kN and 365 kN. However, the load that corresponds to a slip of 0,15 mm is as follows 267 kN, 179 kN and 175 kN for the gap of 0 mm, 5 mm and 10 mm, respectively.
3. The connection stiffness of the friction connection in compression is larger than the stiffness in tension. For the same tower as above the compression connection's tangent stiffness is 3 times higher than in tension.
4. Results of the 4P bending experiments are thoroughly studied. Prediction of the connection strength is possible to make which was not done in the experiments because of the difficulties to measure the slip. These results shows that the strength of the connection predicted by the EN 1993-1-8 is rather close to the load at the slip of about 0,15 mm. The ultimate load is closely predicted by the buckling strength of the tower according to EN1993-1-6 Class A. The buckling strength is achieved even if higher steel grades are used indicating that the connection has over strength.
5. Finite element analysis has shown that the longitudinal stresses due to the eccentric loading of the single shear lap joint are rather realistically predicted, in the elastic stage, by the analytical method called the neutral line model (NLM).
Answers to the questions raised at the beginning of the thesis and indication of the future work are:
1. Agreement between existing hand calculation models for the prediction of the connections strength and FE models for towers is rather good if the criterion of 0,15 mm slip is used. However, this criterion is often associated with the elastic behaviour of the connection and certain reserve strength until the maximum load is achieved exists.
102

Conclusions and future works
The factor sk value is experimentally established for the hand calculation
model and this value is not possible to take into account in FEA. Numerical improvements of the contact element options may be necessary to have more robust FEA analysis.
2. The connection segment test is a satisfactory model for the prediction of the tower connection behaviour.
3. The gap between segments reduces the connection strength at the level of 0,15 mm slip. This reduction is not linear and it looks as it converges to a certain reduction level.
A more intensive parametric study would be necessary to establish the reduction level for the most convenient production requirements.
4. The FEA has indicated that due attentions should be given to the design of the single shear lap joints. The strength criterion of 0,15 mm slip gives a rather pessimistic value for the strength if the level of assembling tolerances is well known, especially for the connection in compression.
In addition to the parametric study mentioned above experiments would be necessary to allow benchmarking of FE results.
103


References
References
[1] Krohn S. Danish wind turbines: An industrial success story, http://www.nordex-online.com; 2002 [2] U.S. Energy Information Administration, International Energy Outlook 2010, Office of Integrated Analysis and Forecasting, DOE/EIA-0484 (2010), http://www.eia.gov; 2010 [3] Bloomberg and Frankfurt School, Global trends in Renewable Energy Investment 2011, Analysis of Trends and Issues in the Financing of Renewable Energy, UN Environmental Programme, ISBN: 978-92-807-3183-5 [4] Fulton, M., Mellquist, N. : " The German feed-in tariff for PV, Managing volume success with price responce", Deutsche bank group, DB climate change advisors, March 23,2011 [5] http://ewea.org/fileadmin/ewea_documents/documents/statistics/EWEA_Annual_Statistics_2010.pdf, visited on October 2011, Wind in power, 2010 European statistics, February 2011 [6] Veljkovic, M.: " Steel tower is good for wind energy and wind energy for steel", Proc. of 7th National Conference on Steel Structures, pp. 39-54, Athens, Greece [7] High strength steel tower for wind turbine (HISTWIN), final report to be published in 2011 [8] High strength steel tower for wind turbine (HISTWIN2) - Grant Agreement No RFSR-CT-2010-00031 [9] Seidel, M.: "Zur Bemessung geschraubter Ringflanschverbindungen von Windenergieanlagen", Universität Hannover, Institut für Stahlbau. 2001 [10] Peteresen, C: "Nachweis der Betriebsfestigkeit exzentrisch beanspruchter Ringflanschverbindungen", Stahlbau, Vol.67, pp. 191-203, Enrst & Sohn, 1998
105

FE modelling of friction connection in tubular towers for wind turbines
[11] Seidel, M.: "Measuring fatigue loads of bolts in ring flange connections", European Wind Energy Conference, Copenhagen, 2001 [12] Husson, W.: " Friction connections with slotted holes for wind towers", Licentiate Thesis, Luleå, Sweden 2008 [13] EN 1090-2:2008: E, "Execution of steel structures and aluminium structures- Part 2: Technical requirements for steel Structures", European Committee for standardization. Brussels, Belgium, 2008 [14] EN 1993-1-8:2005: E, "Eurocode 3 - Design of steel structures - Part 1-8: Design of joints", European Committee for standardization. Brussels, Belgium, 2005 [15] EN 1993-1-1:2005: E, "Eurocode 3 - Design of steel structures - Part 1-1: General rules and rules for buildings", European Committee for standardization. Brussels, Belgium, 2005 [16] Bjorhovde, R., Colson. A., Zandonini, R.: "Connections in steel structures 3", Italy, 1996 [17] Kim, J., Yoon, J-C, Kang, B-S.: " Finite element analysis and modelling of structure with bolted joints", Proc. Applied Mathematical Modelling, 2007;31; pp. 895-911 [18] Huang, Y-H., Wang, R-H, Zou J-H, Gan, Q.: " Finite element analysis and experimental study on high strength bolted friction grip connections in steel bridges", Proc. Journal of Constructional Steel Research, 2010;66; pp. 803-815 [19] Kuzmanovic, BO., Willems, N..: " Steel design for structural engineers", Proc.of civil engineering and engineering mechanics series, second edition pp. 320 [20] Alcoa Fastening Systems, "Bobtail - Huck's next generation lockbolt. No pintail, fast installation, vibration resistance. 12mm-20mm", AF1032 0410 2.5M.2010. [21] ABAQUS Analysis User's manual version 6.10, Dassault Systemes Simulia Corp., Providence, 2010 [22] Bursi, OS., Jaspart, JP.: "Basic issues in the finite element simulation of extended end plate", Proc. Computers & Structures, 1998;69; pp. 361-82 [23] Fernandez, J., Martinez-de-pison, FJ, Lostade, R.: "Prediction models for calculating bolted connections using data mining techniques and the finite element method", Proc. Engineering Structures, 2010;32; pp. 3018-3027 [24] Chung, KF., Ip, KH.: "Finite element modeling of bolted connections between cold-formed steel strips and hot rolled steel plates under static shear", Poc.Engineering Structures, 2001;22; pp.1271-84 [25] Limam, M., Veljkovic, M., Bernspång, L., Rebelo, C., Simoes da Silva, L.: " Modelling of friction connection for wind towers", Proc. of 6th European Conference on Steel and Composite Structures, pp. 411-416, Budapest, Hungary
106
References
107
[26] Limam, M., Veljkovic, M., Pak, D., Naumes, J.," Towards Better Understanding of a Friction Connection in Tubular Towers for Wind Turbines", Proc .of Steel & Composite Structures : Proceedings of the 4th International, pp. 507-512, Sydney, Australia [27] EN 1993 (E).: " Eurocode - Design of steel structures", CEN, European Committee for standardization. Brussels, Belgium, 2005 [28] Schijve, J., Campoli, G., and Monaco, A.: "Fatigue of structures and secondary bending in structural elements," Proc. of International Journal of Fatigue, vol. 31, pp. 11111123, 2009 [29] EN 1993-1-6:2005: E, "Eurocode 3 - Design of steel structures - Part 1-6: Strength and Stability of Shell Structures", European Committee for standardization. Brussels, Belgium, 2005 [30] Veljkovic, M., Feldman, M., Naumes, J., Pak, D., Rebelo, C, Simoes da Silva, L.: " Friction connection in tubular towers for wind turbines", Proc. of Stahlbau, pp. 660-668, September 2010 [31] Heistermann, C.: "Behaviour of pretensioned bolts in friction connections", Licentiate Thesis, Luleå, Sweden, June 2011 [32] Rotter, JM., Schmidt, H.:"Buckling of steel shells. European design recommendationa", 5th edition


Annex
109
Annex
A. Data sheets about Bob Tail bolts, cover plate, inner and outer
B. Mathematica file for secondary bending calculation
C. Design check of cylindrical shells subject to axial compression
D. Design check of cylindrical shells subject to pure Bending
E. Input data from ABAQUS calculation

Data sheets about Bob Tail bolts, cover plate, inner and outer cylinders
A. DATA SHEETS ABOUT BOB TAIL BOLTS, COVER PLATE, INNER AND OUTER CYLINDERS
The following figures give information about dimensions and the specific details of Bob Tail bolts, cover plate, inner and outer cylinders, which have been used in the numerical simulations described in Chapters 3 and 4.
A-1

FE modelling of friction connection in tubular towers for wind turbines
Figure A- 1: Table of dimensions for Bob Tail bolt M25,4
A-2
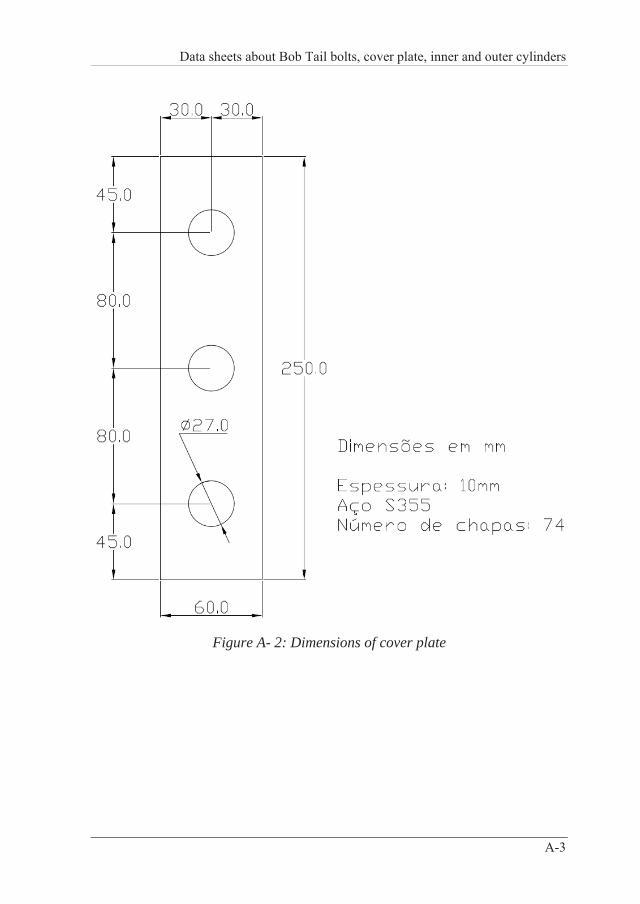
Data sheets about Bob Tail bolts, cover plate, inner and outer cylinders
Figure A- 2: Dimensions of cover plate
A-3

FE modelling of friction connection in tubular towers for wind turbines
Figure A- 3: Table of dimensions for inner cylinder, part 1
A-4
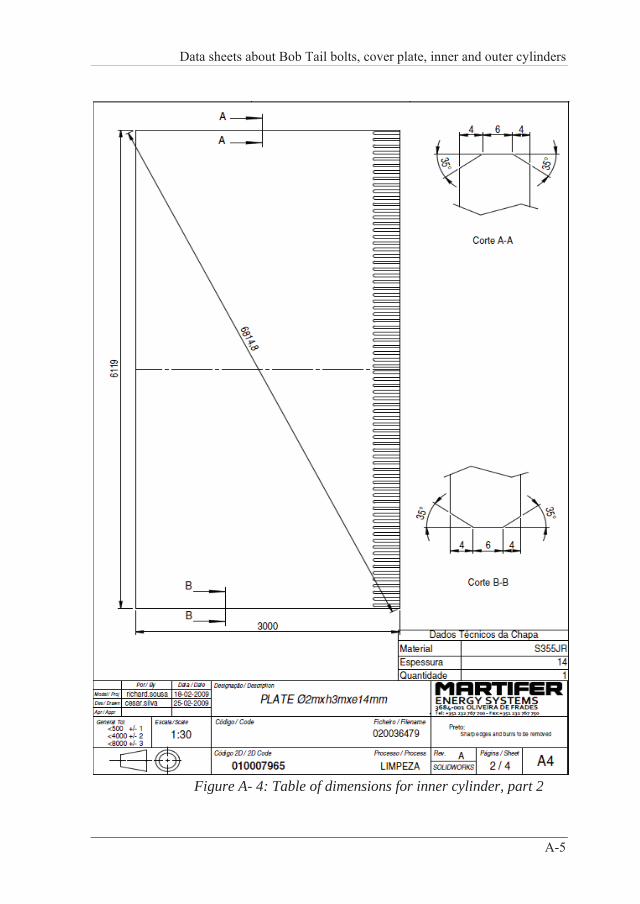
Data sheets about Bob Tail bolts, cover plate, inner and outer cylinders
Figure A- 4: Table of dimensions for inner cylinder, part 2
A-5
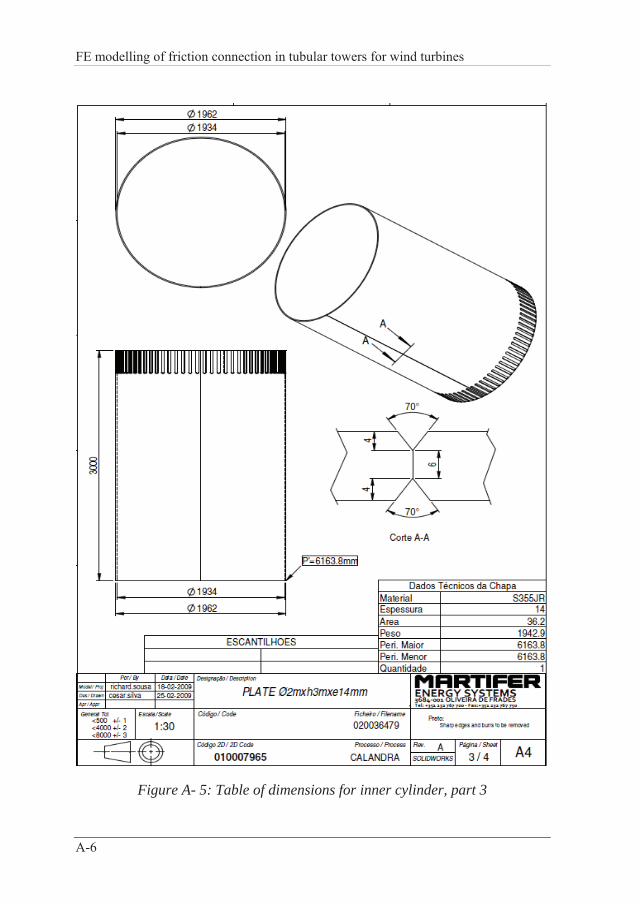
FE modelling of friction connection in tubular towers for wind turbines
Figure A- 5: Table of dimensions for inner cylinder, part 3
A-6
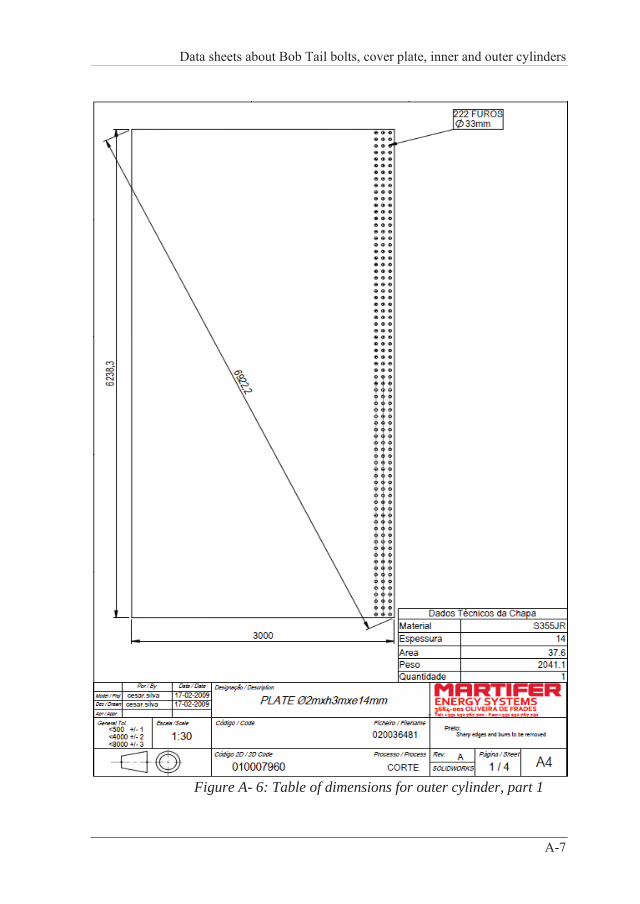
Data sheets about Bob Tail bolts, cover plate, inner and outer cylinders
Figure A- 6: Table of dimensions for outer cylinder, part 1
A-7

FE modelling of friction connection in tubular towers for wind turbines
Figure A- 7: Table of dimensions for outer cylinder, part 2
A-8

Data sheets about Bob Tail bolts, cover plate, inner and outer cylinders
Figure A- 8: Table of dimensions for outer cylinder, part 3
A-9


Mathematica file for secondary bending calculation
B. MATHEMATICA FILE FOR SECONDARY BENDING CALCULATION
Figure B-1 shows the Mathematica file for the secondary bending calculation
B-1

FE modelling of friction connection in tubular towers for wind turbines
Figure B-1: Mathematica file for secondary bending calculation
B-2

Design check of cylindrical shells subject to axial compression
C. DESIGN CHECK OF CYLINDRICAL SHELLS SUBJECT TO AXIAL COMPRESSION
This part of the annex provides rules how to make the design check of cylindrical profile subject to axial compression. Stress design according to [29], is used to check the cylindrical steel shells against buckling failure.
C-1
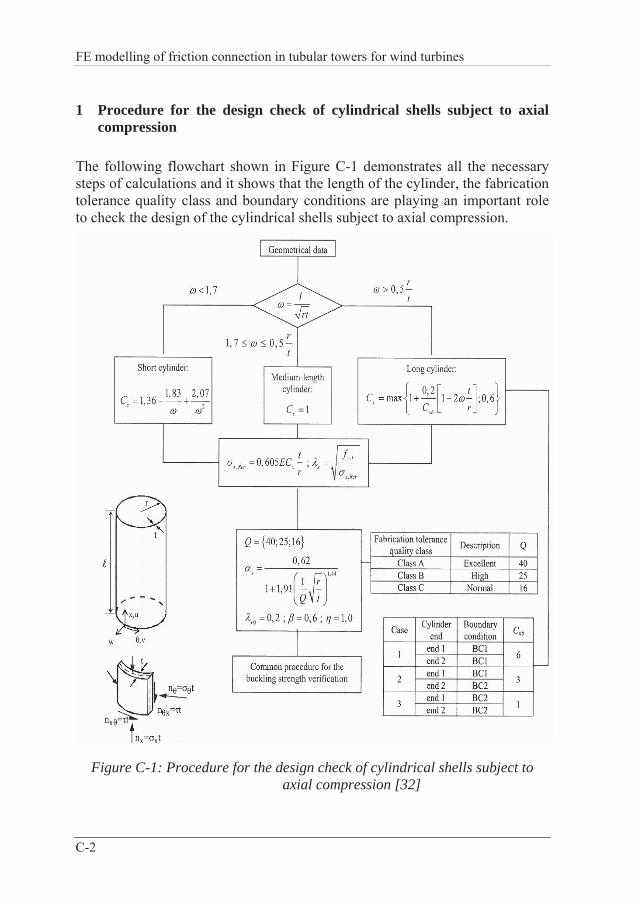
FE modelling of friction connection in tubular towers for wind turbines
1 Procedure for the design check of cylindrical shells subject to axial compression
The following flowchart shown in Figure C-1 demonstrates all the necessary steps of calculations and it shows that the length of the cylinder, the fabrication tolerance quality class and boundary conditions are playing an important role to check the design of the cylindrical shells subject to axial compression.
Figure C-1: Procedure for the design check of cylindrical shells subject to axial compression [32]
C-2
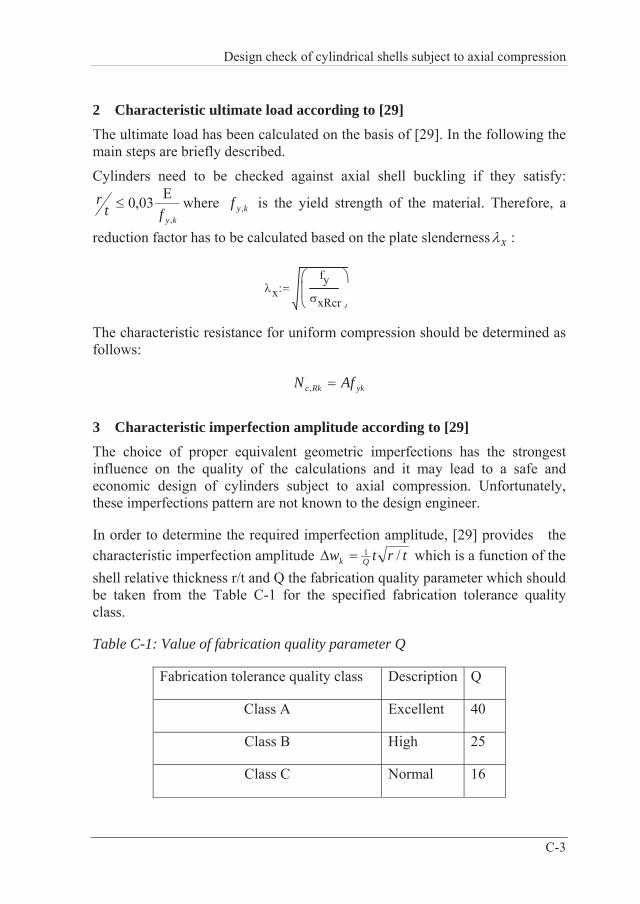
Design check of cylindrical shells subject to axial compression
2 Characteristic ultimate load according to [29]The ultimate load has been calculated on the basis of [29]. In the following the main steps are briefly described.
Cylinders need to be checked against axial shell buckling if they satisfy:
kyftr
,
03,0 where is the yield strength of the material. Therefore, a
reduction factor has to be calculated based on the plate slenderness
kyf ,
X :
xfy
xRcr
The characteristic resistance for uniform compression should be determined as follows:
ykRkc AfN ,
3 Characteristic imperfection amplitude according to [29]The choice of proper equivalent geometric imperfections has the strongest influence on the quality of the calculations and it may lead to a safe and economic design of cylinders subject to axial compression. Unfortunately, these imperfections pattern are not known to the design engineer.
In order to determine the required imperfection amplitude, [29] provides the characteristic imperfection amplitude trtw Qk /1 which is a function of the shell relative thickness r/t and Q the fabrication quality parameter which should be taken from the Table C-1 for the specified fabrication tolerance quality class.
Table C-1: Value of fabrication quality parameter Q
Fabrication tolerance quality class Description Q
Class A Excellent 40
Class B High 25
Class C Normal 16
C-3

FE modelling of friction connection in tubular towers for wind turbines
Using the relative slenderness x and an imperfection amplitude , the reduction factor
kw for the buckling resistance can be calculated as:
0
01p
x when px0
with :is the plastic range factor
p : is the plastic limit relative slenderness
0 : is the squash limit relative slenderness
: is the interaction exponent
Figure C-2 depicts the relationship between characteristic buckling stress and the relative shell slenderness for three different fabrication tolerance quality classes.
0 0.5 1 1.5 20
0.5
1
Relative slendeness
Rel
ativ
e bu
cklin
g st
reng
th
classB ( )
classC ( )
classA ( )
Figure C-2: Reduction factors for cylinder under axial compression (steel grade S355) Geometry: r/t=71, l/r=3.5, imperfection pattern
according to Table 4.
C-4

Design check of cylindrical shells subject to axial compression
The characteristic buckling stresses which are obtained by multiplying the characteristic yield strength by the buckling reduction factor (formula (2.9), [29]):
kyxRkx f ,,
This leads to a characteristic buckling resistance of RkcxRkx NN ,,
Table C-2 shows the characteristic ultimate loads, carried out with the procedure described above.
Table C-2: Characteristic ultimate load acc. to EN1993-1-6 [2]
Fabrication tolerance quality class
Ultimate load
[kN]
Class A 29904
Class B 29362
Class C 28417
The design check of the cylinder used in Chapter 3 and 4 is performed using Mathcad file as shown in Figure C-3, Figure C-4, Figure C-5 and Figure C-6. In order to compare the results of Mathcad file with the FE results, we have to multiply the ultimate load found in chapter 4 by 74 since our strip present 1/74 of the complete connection.
C-5
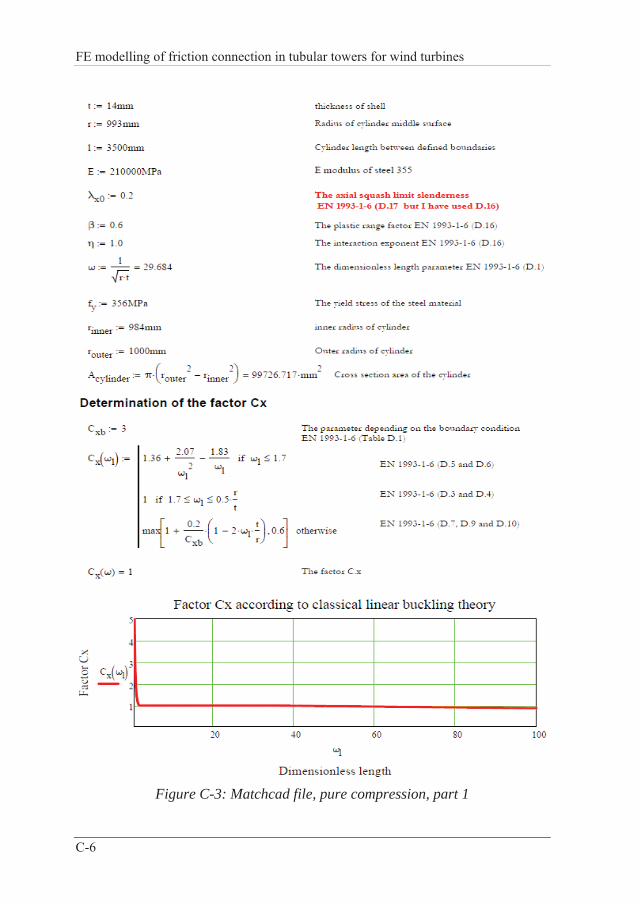
FE modelling of friction connection in tubular towers for wind turbines
Figure C-3: Matchcad file, pure compression, part 1
C-6
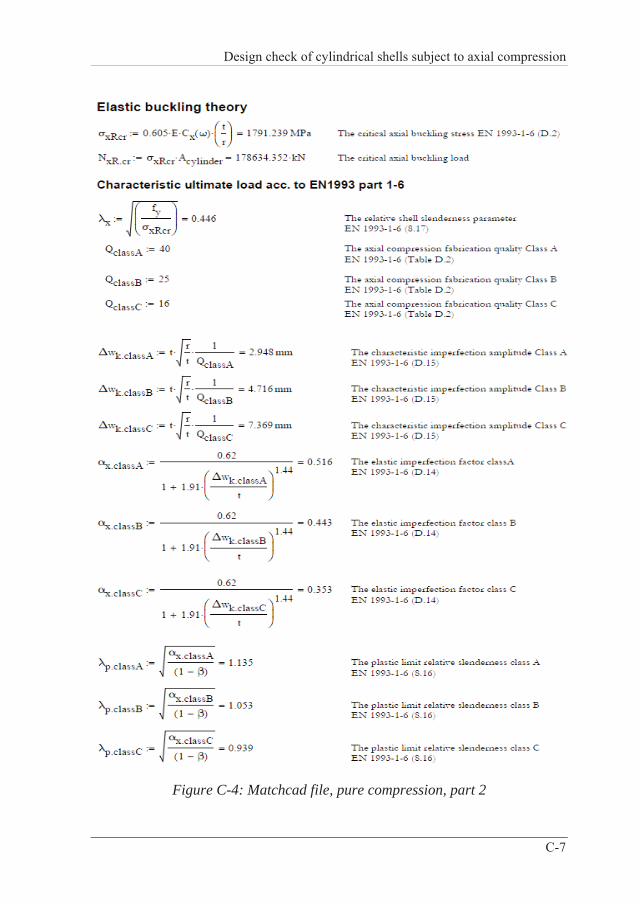
Design check of cylindrical shells subject to axial compression
Figure C-4: Matchcad file, pure compression, part 2
C-7
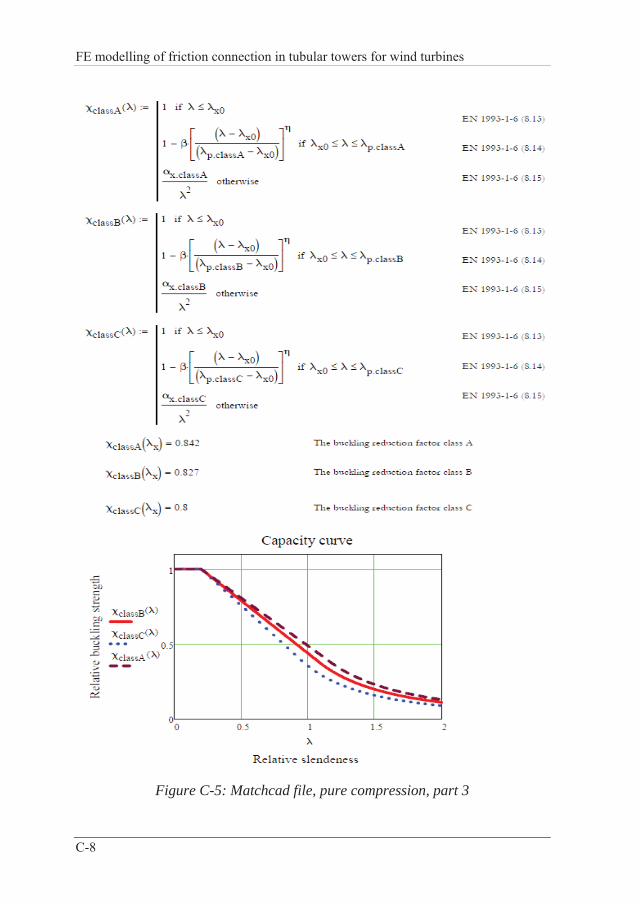
FE modelling of friction connection in tubular towers for wind turbines
Figure C-5: Matchcad file, pure compression, part 3
C-8

Design check of cylindrical shells subject to axial compression
Figure C-6: Matchcad file, pure compression, part 4
C-9


Design check of cylindrical shells subject to pure Bending
D. DESIGN CHECK OF CYLINDRICAL SHELLS SUBJECT TO PURE BENDING
The design check of cylindrical profile subject to pure bending described in Chapter 5 is presented under Matchcad file according to [29].
D-1

FE modelling of friction connection in tubular towers for wind turbines
Figure D-1: Matchcad file, pure bending, part 1
D-2
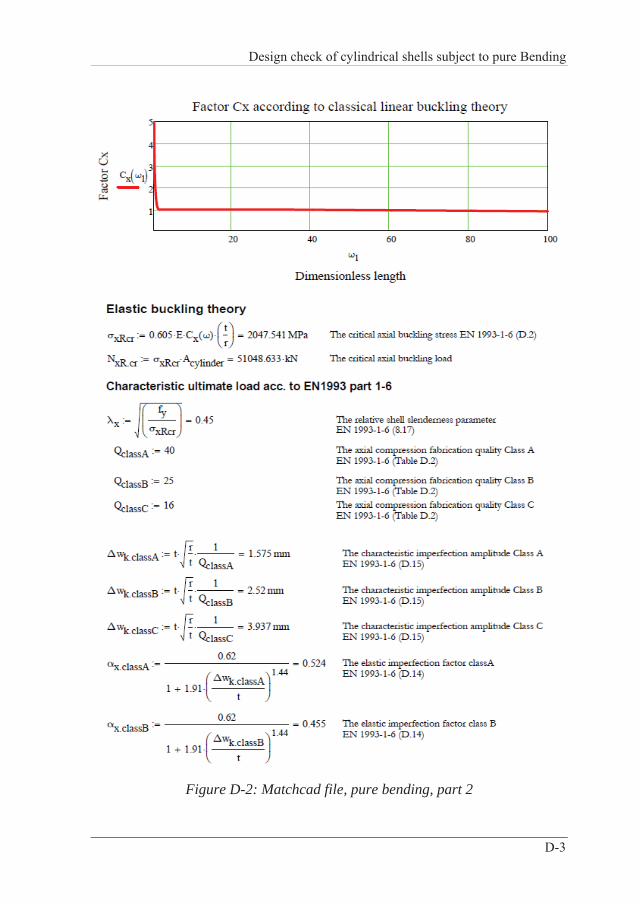
Design check of cylindrical shells subject to pure Bending
Figure D-2: Matchcad file, pure bending, part 2
D-3

FE modelling of friction connection in tubular towers for wind turbines
Figure D-3: Matchcad file, pure bending, part 3
D-4
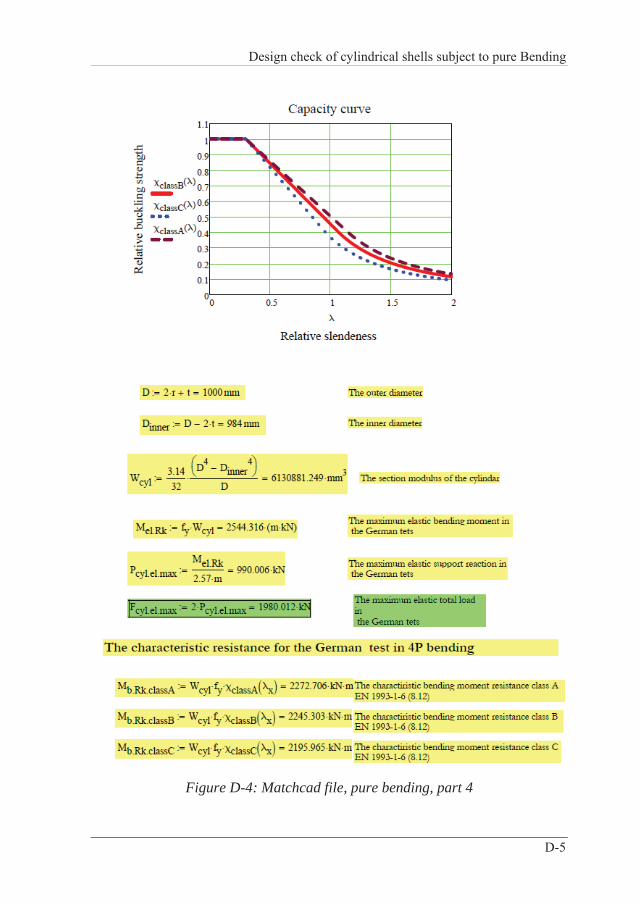
Design check of cylindrical shells subject to pure Bending
Figure D-4: Matchcad file, pure bending, part 4
D-5

FE modelling of friction connection in tubular towers for wind turbines
Figure D-5: Matchcad file, pure bending, part 5
D-6

Input data from ABAQUS calculation
E. INPUT DATA FROM ABAQUS CALCULATION
Table E-1 shows an excerpts of an input file for the numerical calculations in Chapters 3 and 4 with the most important keywords, which are needed to model pretension forces and contact problems in ABAQUS.
E-1

FE modelling of friction connection in tubular towers for wind turbines
E-2
Table E-1: Extract from an ABAQUS input file (tensile test, S355)
** MATERIALS *Material, name=S355 *Elastic 210000., 0.3 *Plastic 355.6, 0. 359.564, 0.0111 539.021, 0.0528 612., 0.1794 *Material, name="bolt Bob Tail grade 8" *Elastic 210000., 0.3 *Plastic 900.832, 0. 1089.71, 0.0463 1242., 0.1764
** INTERACTION PROPERTIES *Surface Interaction, name=contact 1., *Friction, slip tolerance=0.005 0.5, ** INTERACTIONS **Interaction: contact pair *Contact *Type= Surface to Surface *Contact Property Assignment , , contact ** STEP: pretensioning *Step, name="pretension bolt step", nlgeom=YES *Static 1e-05, 1., 1e-08, 1. ** LOADS ** Name: top_bolt Type: Bolt load *Cload _top_bolt_blrn_, 1, 284000.
** Name: middle_bolt Type: Bolt load *Cload _middle_bolt_blrn_, 1, 284000. ** Name: bottom_bolt Type: Bolt load *Cload _bottom_bolt_blrn_, 1, 284000. ** STEP: load_step *Step, name="tensile step", nlgeom=YES, inc=500 *Static, riks 0.001, 1., 1e-08, 1. ** BOUNDARY CONDITIONS ** Name: top_bolt Type: Bolt load *Boundary, op=NEW, fixed _top_bolt_blrn_, 1, 1 ** Name: middle_bolt Type: Bolt load *Boundary, op=NEW, fixed _middle_bolt_blrn_, 1, 1 ** Name: bottom_bolt Type: Bolt load *Boundary, op=NEW, fixed _bottom_bolt_blrn_, 1, 1 ** OUTPUT REQUESTS ** HISTORY OUTPUT: top_bolt *Output, history *Node Output, nset=_top_bolt_blrn_ TF1, ** HISTORY OUTPUT: middle_bolt *Output, history *Node Output, nset=_middle_bolt_blrn_ TF1, ** HISTORY OUTPUT: bottom_bolt *Node Output, nset=_bottom_bolt_blrn_ TF1, *End Step