FDOT TOOLS FOR ACCESSIBILITY AND TITLE VI … TOOLS FOR ACCESSIBILITY AND TITLE VI ... Streamline...
27
FDOT TOOLS FOR ACCESSIBILITY AND TITLE VI ANALYSIS 2015 FPTA/FDOT/CUTR Professional Development Workshop June 2, 2015
Transcript of FDOT TOOLS FOR ACCESSIBILITY AND TITLE VI … TOOLS FOR ACCESSIBILITY AND TITLE VI ... Streamline...

FDOT TOOLS FOR
ACCESSIBILITY AND TITLE VI
ANALYSIS
2015 FPTA/FDOT/CUTR Professional
Development Workshop
June 2, 2015

AGENDA
1. TBEST Origin and Purpose
2. TBEST Framework Features
3. TBEST Title VI
4. TBEST Accessibility Measures
5. Q&A
TBEST = Transit
Boardings Estimation
and Simulation Tool

TBEST ORIGINS
FDOT Public Transit Office sponsorship for past 10+
years
FDOT wanted a software tool for short-term transit
service and strategic planning
FDOT provides state-wide TBEST support through
software improvements, training and data updates
Community Software
No software fees for TBEST (www.tbest.org)

WHY TBEST?
Software Gap
Operations
Hastus
Trapeze
Others…
Short and mid-term
TBEST
Long Range
TransCad
CUBE
FTA STOPS
Others…

TBEST PURPOSE
Support ridership estimation TDP requirement
Utilization as an in-house service and strategic planning tool
Streamline reporting to be consistent with federal, state, and
local requirements
Provide flexible data input options
Provide reporting options which communicate complex
planning scenarios to internal and external customers
Provide agencies with a tool which preserves institutional
knowledge

TBEST SCENARIO FRAMEWORKPRETTY SIMPLE!
1. Users develop alternative scenarios using Support Data and Automation Tools
2. Scenarios input into core TBEST application and analysis tools
3. Summarize results
Ridership Estimation
Socio-Economic
Market Analysis
Land Use Market Analysis
FTA Title VI Reporting
Network Accessibility
Analysis
Strategic Plan
Analysis
COA
Auto-mation
Tools
Support Data
Tech Founda
tion
TBESTScenarios
Accessibility Measures
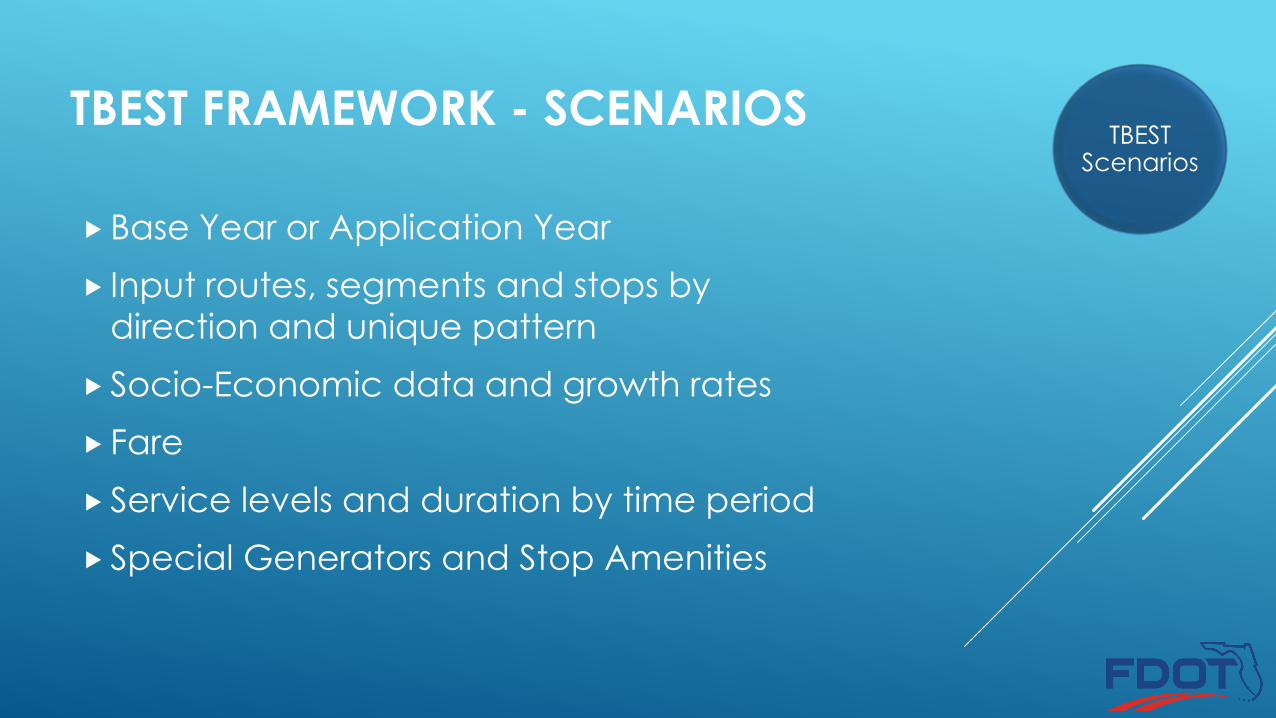
TBEST FRAMEWORK - SCENARIOS
Base Year or Application Year
Input routes, segments and stops by
direction and unique pattern
Socio-Economic data and growth rates
Fare
Service levels and duration by time period
Special Generators and Stop Amenities
TBESTScenarios
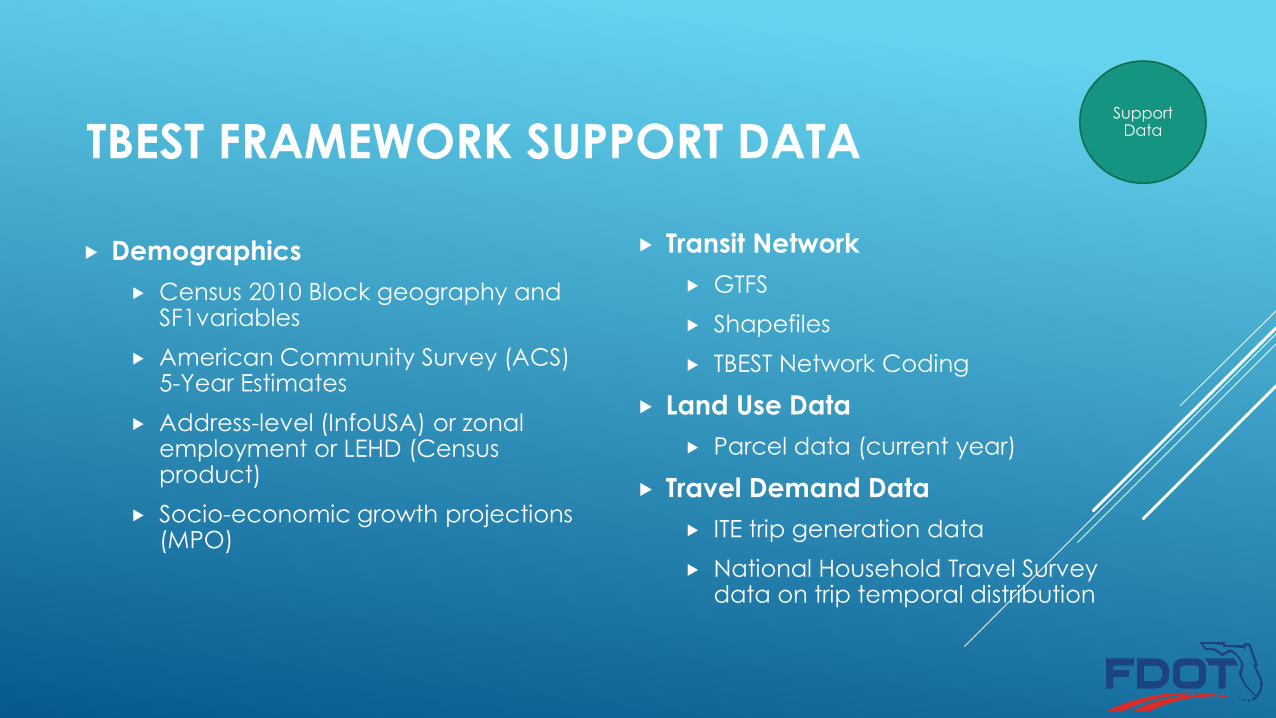
TBEST FRAMEWORK SUPPORT DATA
Demographics
Census 2010 Block geography and SF1variables
American Community Survey (ACS) 5-Year Estimates
Address-level (InfoUSA) or zonal employment or LEHD (Census product)
Socio-economic growth projections (MPO)
Transit Network
GTFS
Shapefiles
TBEST Network Coding
Land Use Data
Parcel data (current year)
Travel Demand Data
ITE trip generation data
National Household Travel Survey data on trip temporal distribution
Support Data
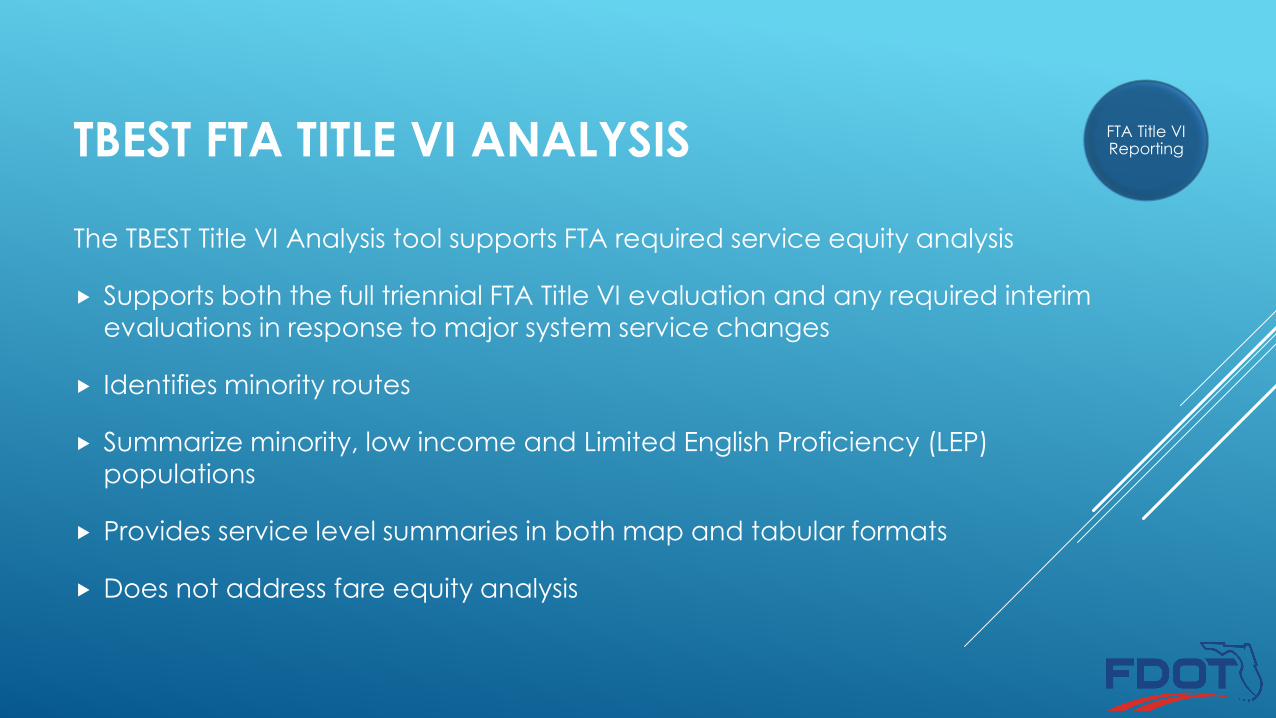
TBEST FTA TITLE VI ANALYSIS
The TBEST Title VI Analysis tool supports FTA required service equity analysis
Supports both the full triennial FTA Title VI evaluation and any required interim
evaluations in response to major system service changes
Identifies minority routes
Summarize minority, low income and Limited English Proficiency (LEP)
populations
Provides service level summaries in both map and tabular formats
Does not address fare equity analysis
FTA Title VI Reporting
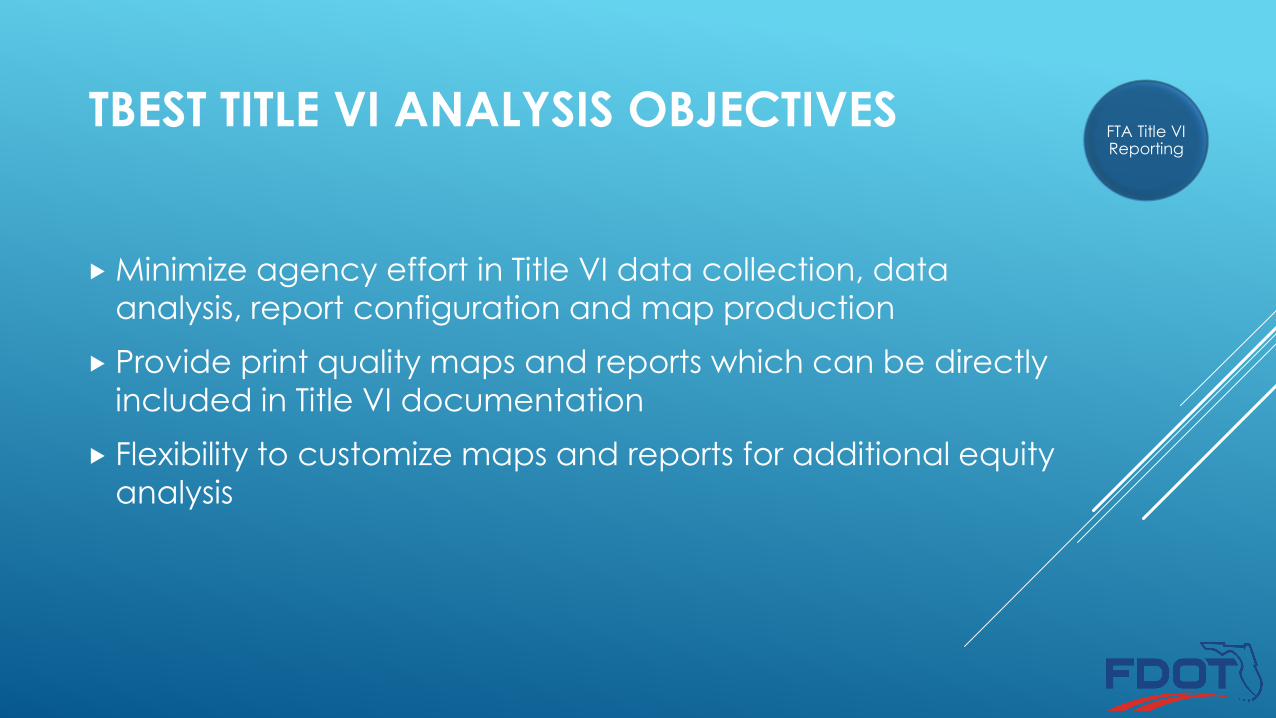
Minimize agency effort in Title VI data collection, data
analysis, report configuration and map production
Provide print quality maps and reports which can be directly
included in Title VI documentation
Flexibility to customize maps and reports for additional equity
analysis
TBEST TITLE VI ANALYSIS OBJECTIVESFTA Title VI Reporting

TBEST TITLE VI OUTPUT REPORTS
System Evaluation
Route Evaluation (Route Type)
Route Evaluation (Mode)
LEP System Evaluation
LEP Route Evaluation
Minority Route Designations
Service Availability (Minority Routes)
Service Availability (Route Type)
Service Availability (Mode)
Revenue Service Miles by County
Poverty Income Levels
FTA Title VI Reporting

TBEST TITLE VI MAP SERIES
Provides a composite view of the minority population, poverty-level households, and Limited English Proficiency (LEP) population distributions within the agency service area
Consistent with the FTA Circular map samples
Opens in ArcMap layout view with a print ready map layout which includes a title, legend, scale bar, and the transit agency logo.
The ArcMap environment allows for additional user data and symbol modifications prior to map publishing. User edits to map content can be saved within the ArcMap document.
FTA Title VI Reporting

TITLE VI OUTPUT MAPS Route Map
Land Use
Minority Population Distribution
Minority Population Above System Average
Minority Routes
Low Income Households Distribution
Low Income Households Above System Average
Population + Employment per Acre
Limited English Proficiency (LEP) Distribution
LEP – Spanish Above System Average
LEP – Creole Above System Average
LEP – French Above System Average
LEP – Chinese Above System Average
LEP – Korean Above System Average
LEP – No High School Diploma
FTA Title VI Reporting

SUPPORTED WORKFLOWSService Equity Analysis
Most agencies will have unique variations on desired reporting and
mapping to support Title VI analysis. TBEST supports the
individualized approach by providing base reports and maps which
can be customized to address unique equity analysis issues
Analyzing Disparate Changes for a Proposed New Service
Supports interim analysis of “major” service changes
Create pre and post scenarios
Run Title VI Analysis on both scenarios
Socio-Economic Market Analysis
Use TBEST SE Analysis tools to perform segment or stop level equity
analysis
FTA Title VI Reporting
TBEST ACCESSIBILITY MEASURES
On-going FDOT project to develop enhanced accessibility measures within TBEST
TBEST Accessibility Project Goals:
Provide a standardized feature set of aggregate accessibility measures
Produce easy to understand and disseminate reports/maps/charts
Summarize access to transit and access via transit for transit agencies, MPO’s and other interested agencies
Integrate with existing TBEST features (Scenarios, GTFS Import, Workflow Tools)
Produce measures on existing or proposed transit networks
Accessibility
Measures
ACCESS TO TRANSIT VIA GEOGRAPHIC
PROXIMITY
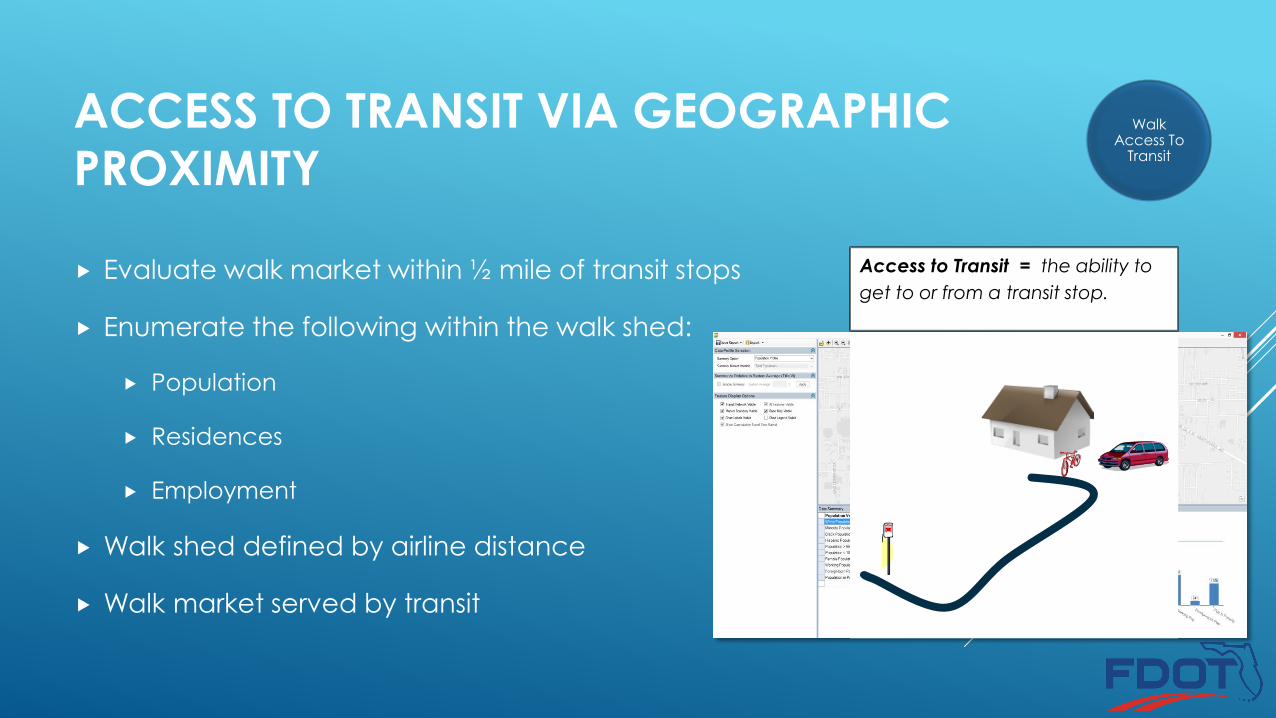
Evaluate walk market within ½ mile of transit stops
Enumerate the following within the walk shed:
Population
Residences
Employment
Walk shed defined by airline distance
Walk market served by transit
Walk Access To
Transit
Access to Transit = the ability to
get to or from a transit stop.
ACCESS TO TRANSIT BASED ON SERVICE
FREQUENCY
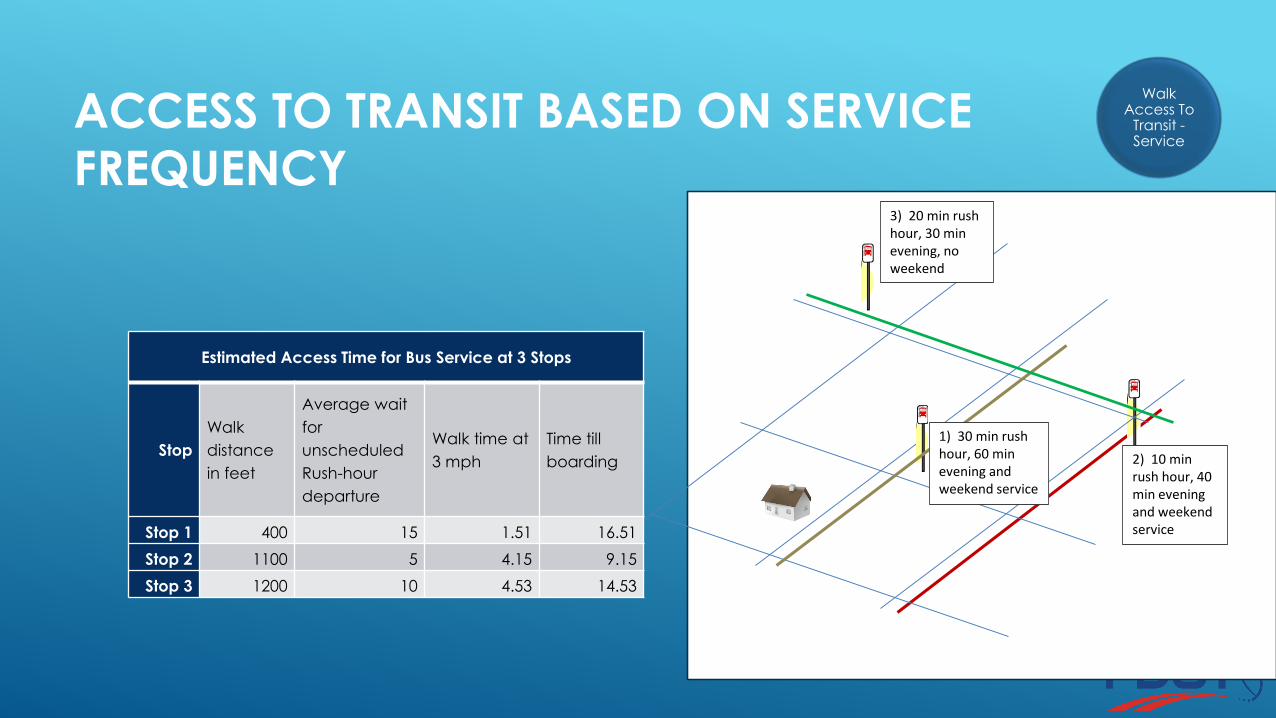
2) 10 min rush hour, 40 min evening and weekend service
1) 30 min rush hour, 60 min evening and weekend service
3) 20 min rush hour, 30 min evening, no weekend
Estimated Access Time for Bus Service at 3 Stops
Stop
Walk
distance
in feet
Average wait
for
unscheduled
Rush-hour
departure
Walk time at
3 mph
Time till
boarding
Stop 1 400 15 1.51 16.51
Stop 2 1100 5 4.15 9.15
Stop 3 1200 10 4.53 14.53
Walk Access To
Transit -Service
ACCESS TO TRANSIT BASED ON SERVICE
FREQUENCY
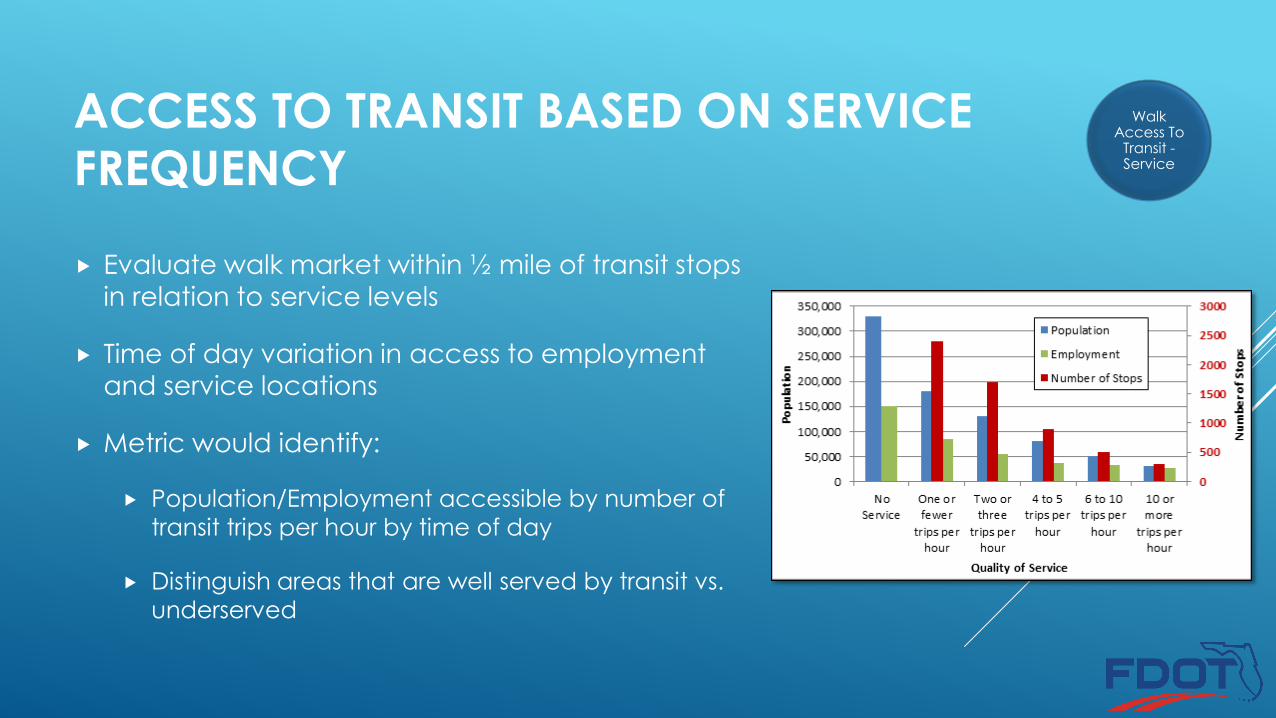
Evaluate walk market within ½ mile of transit stops
in relation to service levels
Time of day variation in access to employment
and service locations
Metric would identify:
Population/Employment accessible by number of
transit trips per hour by time of day
Distinguish areas that are well served by transit vs.
underserved
Walk Access To
Transit -Service
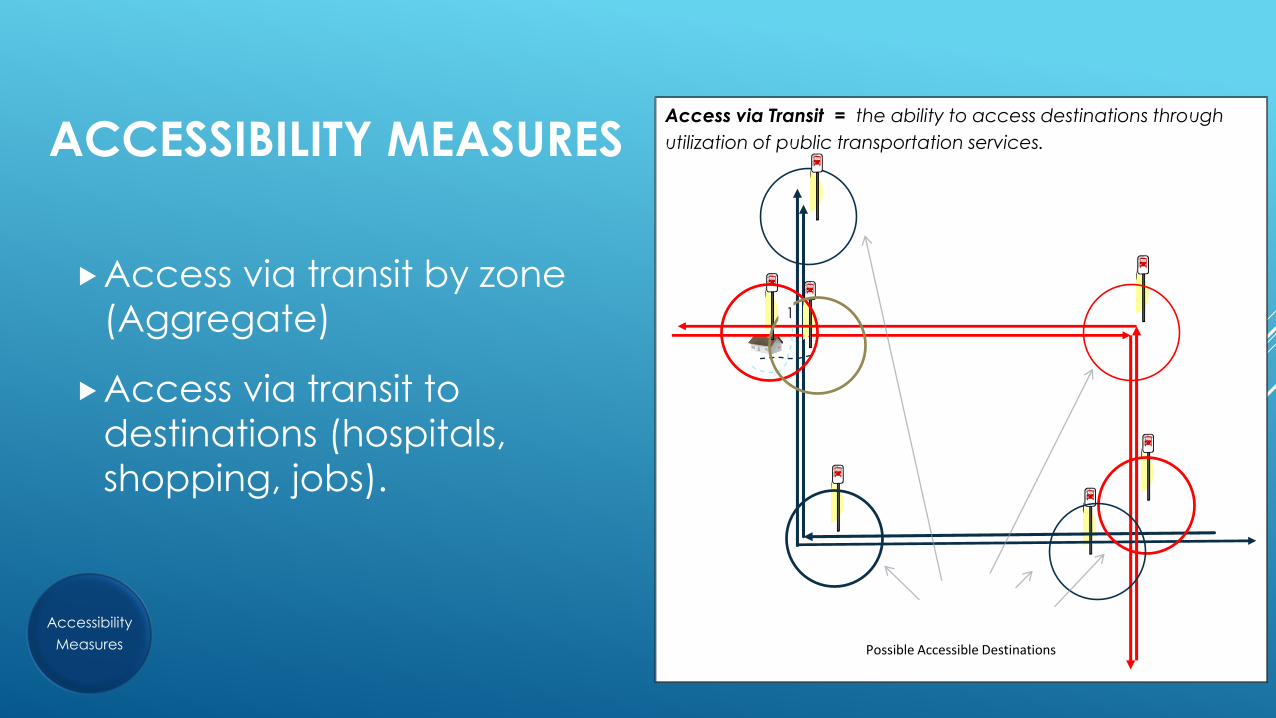
ACCESSIBILITY MEASURES
Access via transit by zone
(Aggregate)
Access via transit to
destinations (hospitals,
shopping, jobs).
Accessibility
Measures
Access via Transit = the ability to access destinations through
utilization of public transportation services.
1
2
Possible Accessible DestinationsPossible Accessible Destinations

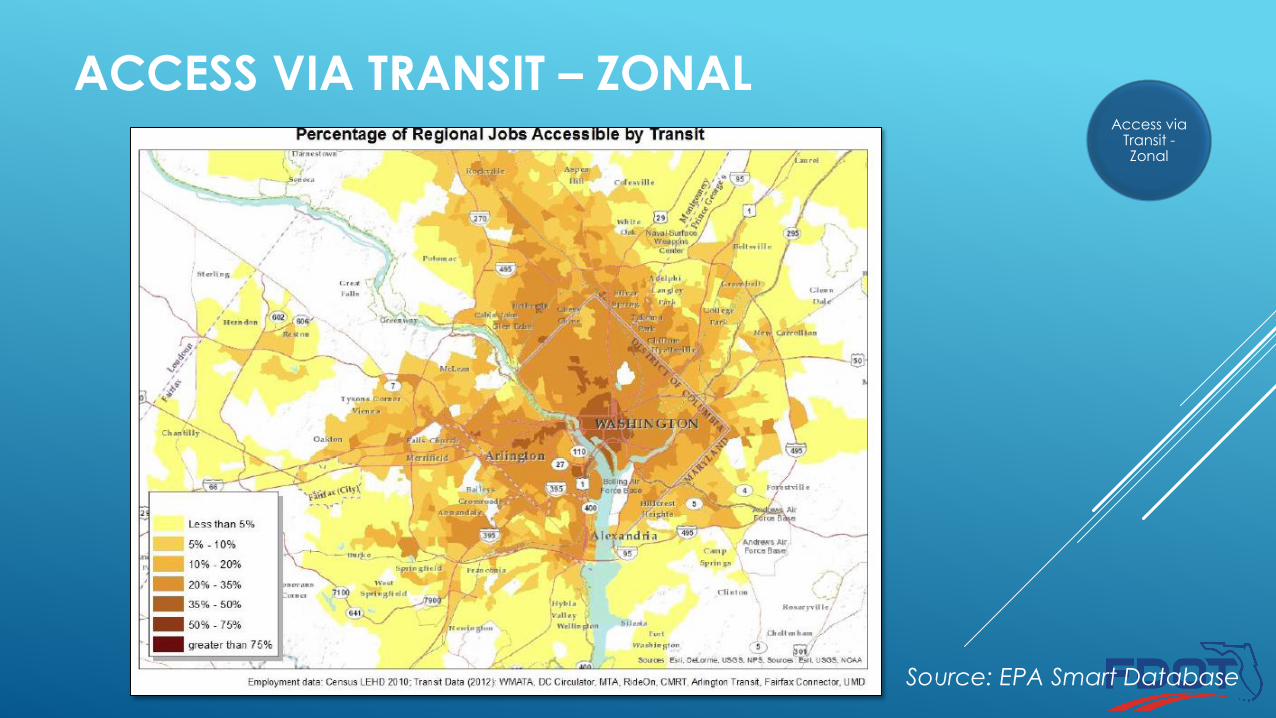
ACCESS VIA TRANSIT – ZONAL
Provide metrics on access to employment and households via transit from each zone to all accessible zones
Zones will be either Census Blocks or Block Groups
Determine zone to zone transit travel times by time of day
Determine zone to zone walk time
Aggregate Employment data to the zone level
Metrics would identify:
Destination market accessibility via walk or transit (shortest path) from each zone
Determine the share of the service area population/employment served each zone
Access via Transit -Zonal
ACCESS VIA TRANSIT – ZONAL Access via
Transit -Zonal
Source: EPA Smart Database

ACCESS VIA TRANSIT – TO DESTINATIONS
Summarizes the intensity and distribution of land use, socio-economic, and employment data for a given network accessible market
Summarizes accessible market conditions by trip travel time and number of transfers
Ability to determine accessibility to/from more than one location
Summarizes destination markets relative to the service area (% service area)
Determine market segments which have access to transit destinations such as hospitals, shopping, etc.
Access via Transit -
Destinations
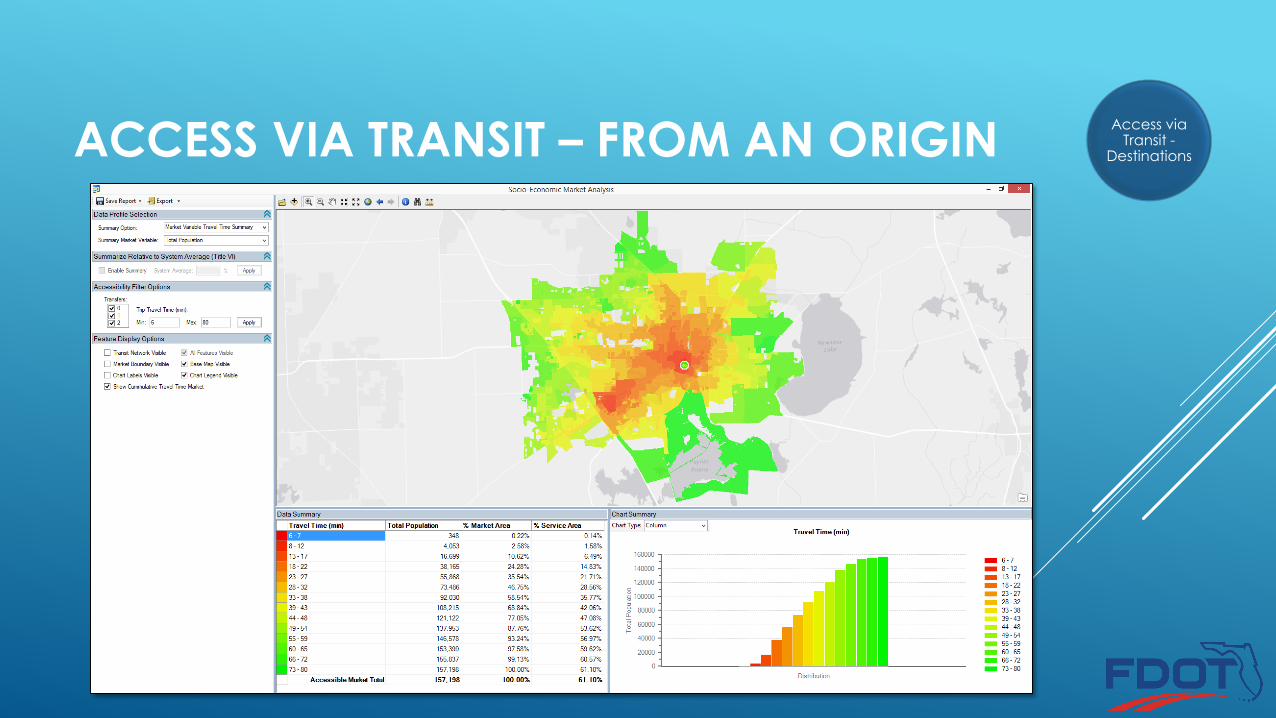
ACCESS VIA TRANSIT – FROM AN ORIGINAccess via
Transit -Destinations

ACCESS VIA TRANSIT – TO DESTINATIONSAccess via
Transit -Destinations

ACCESSIBILITY OUTPUT Accessibility Measures
Reports and Maps formatted to
concisely define the measures
Easy to understand
Contain few numbers and more
graphics
Source: Brookings Institute

UPCOMING FDOT SPONSORED TRAINING
2-Day Seminar Training Sessions
Developing Ridership Forecasts for TDP
Performing Title VI Analysis
Introduce the new Parcel Editing and Comprehensive Operational Analysis COA Tools
Training Sites/Dates:
FDOT District 3 Office – Chipley
July 15-16, 2015
Computer Training Room
1074 Highway 90
Chipley, FL 32428-0607
FDOT District 5 Office -Deland
July 21-22, 2015
PC Training Lab
719 South Woodland Blvd.
DeLand, FL 32720

THANKS FOR YOUR TIME
Rodney Bunner
Email: [email protected]
Phone: (727) 455-4059
Chris Wiglesworth
Email: [email protected]
Phone: (850)414-4532
Steve Polzin
Email: [email protected]
Phone: 813-974-9849