
FDI Qualities Assessment of Ireland
98
FDI Qualities Assessment of Ireland
Transcript of FDI Qualities Assessment of Ireland

FDI Qualities Assessment of Ireland


FDI Qualities Assessment of Ireland
PUBE

2
FDI QUALITIES ASSESSMENT OF IRELAND © OECD 2020
Please cite this publication as:
OECD (2020), FDI Qualities Assessment of Ireland, www.oecd.org/investment/FDI-Qualities-Assessment-
of-Ireland.pdf.
This work is published under the responsibility of the Secretary-General of the OECD. The opinions expressed and
arguments employed herein do not necessarily reflect the official views of OECD member countries.
This document, as well as any data and map included herein, are without prejudice to the status of or sovereignty over
any territory, to the delimitation of international frontiers and boundaries and to the name of any territory, city or area.
The statistical data for Israel are supplied by and under the responsibility of the relevant Israeli authorities. The use of
such data by the OECD is without prejudice to the status of the Golan Heights, East Jerusalem and Israeli settlements
in the West Bank under the terms of international law.
© OECD 2020
3
FDI QUALITIES ASSESSMENT OF IRELAND © OECD 2020
Foreword
This report examines the impact of foreign direct investment (FDI) attracted to Ireland over the period 2006-
16 and provides an overview of the direct contribution and spillover effects of this investment on the local
economy. The analysis pre-dates the COVID-19 pandemic and does not take account of the impact of this
phenomenon on foreign investment in Ireland. The report has provided important background research
and analysis as input to the development of IDA Ireland’s new strategy.
The report finds that Ireland is one of the most open economies in the world and that the FDI base deeply
integrates Ireland’s economy into global value chains (GVCs). The sectors in which IDA supported foreign
firms are concentrated have exhibited rapid growth in recent years and are associated with higher
productivity, research and development (R&D) expenditures and wages than sectors with less foreign firm
activity. The report also identifies a lack of diversification among Ireland’s FDI base, which is concentrated
in manufacturing, information and communications and the finance and insurance sectors. This could
expose the Irish economy to risks related to macroeconomic trends in trade and investment and to policy
changes in partner countries. In response, the report recommends a continued focus by IDA on diversifying
the sectors and foreign sources of investment in Ireland.
Despite the fact that the report was prepared before the COVID-19 crisis, preliminary observations in 2020
showed that sectors in which IDA supported foreign firms are concentrated exhibited a remarkable level of
resilience during the crisis. The OECD Economic Outlook in December 2020 highlights that Ireland’s
important position in trade of COVID-19-related medical goods provided a bulwark against the precipitous
drop in international trade experienced elsewhere. Foreign firms in Ireland were not unaffected by the
pandemic, the full impact of which continues to unfold. However, the overall resilience of these firms in the
face of an unprecedented global economic shock in 2020 suggests that the sectoral mix of FDI in Ireland,
while concentrated, is aligned with sectors that drive economic growth in the 21st century.
Ireland’s consistent success in attracting investment from firms in these sectors is the result of a strategic
approach to the targeting of inward investment by IDA. In turn, the success of this approach by IDA is only
possible due to the policy choices and support of successive Irish Governments and the actions of other
key stakeholders, including reinvestment by existing investors. These have fostered an environment
conducive to attracting further investment that is strongly aligned with Ireland’s key strengths in areas such
as an educated workforce, the availability of skills, Return on Investment (ROI), ease of doing business
and the consistency of relevant public policies such as support for R&D and training.
The report has been jointly developed by the OECD and IDA Ireland and builds on OECD work under the
FDI Qualities initiative. A first steering group meeting was held in December 2018 to agree on the scope
and outline of the report. An interim report was submitted in February 2019 and a second meeting to
discuss preliminary results was held at IDA Ireland. The final report includes four chapters of analysis.
Chapter 1 examines the role of FDI in Ireland’s trade and GVC integration. Chapter 2 examines the role of
FDI for productivity and labour market outcomes. Chapter 3 analyses foreign MNEs’ productivity dynamics
from 2006 to 2016. Chapter 4 focuses on the factors driving spillovers from FDI in Ireland.
4
FDI QUALITIES ASSESSMENT OF IRELAND © OECD 2020
The report was prepared by Maria Borga, Cecilia Caliandro, Letizia Montinari, and Martin Wermelinger,
under the general guidance of Ana Novik, Head of the OECD Investment Division. Alexandre de
Crombrugghe provided substantive inputs and enabled this work, responding to IDA Ireland’s request to
study investment impacts, as a follow up to recent work on mapping the activities of OECD Investment
Promotion Agencies. Niamh Roddy, Chief Economist at IDA Ireland, and Tim Costello were instrumental
in providing guidance and feedback to the OECD team. Francesco di Lorenzo from Copenhagen Business
School provided substantive inputs. The report benefited from discussions with and comments from
Stephen Thomsen, Mike Pfister and Fares Al Hussami, OECD Investment Division, and members of the
steering group of this project; namely, Kieran Donoghue, Chair of the Steering Committee and Head of
International Financial Services, Strategy, and Public Policy at IDA Ireland; Breda O’Sullivan and Niamh
Roddy, IDA Ireland; John Newham and Aine Maher, Department of Business, Enterprise, and Innovation;
and Peter Clinch, Professor University College Dublin, Chair of Science Foundation Ireland, and Adviser
to IDA Ireland.
The report draws on analysis based on OECD data (TiVA indicators, FDI database, National Accounts
Database, and Analytical AMNE database), IDA’s Annual Business Survey and Annual Employment
Survey, and other data sources (Eurostat, Financial Times’ fDi Markets database, PatStat and ILO). The
study builds on expertise developed through OECD frameworks, notably the OECD Policy Framework for
Investment (PFI), lessons from Investment Policy Reviews (IPR), new work on FDI qualities, and the OECD
Benchmark Definition of Foreign Direct Investment, 4th edition.
5
Table of contents
Foreword 3
Acronyms and abbreviations 8
Executive summary 9
1. The role of FDI in trade and integration in GVCs in Ireland 13
1.1. Summary 14
1.2. Ireland is one of the most highly globalised economies in the OECD 15
1.3. MNEs’ contribution to GVC integration 17
1.4. Identifying buy and sell linkages between foreign affiliates and domestic firms 20
1.5. Ireland is located towards the customer end of GVCs 26
1.6. Role of MNEs in exporting 26
1.7. The US and the UK are the most important trade and investment partners 30
References 34
Annex 1.A. Methodology and data 35
Exports by ownership and industry 35
Statistics and definitions 36
Notes 37
2. The role of FDI for productivity and labour market outcomes 39
2.1. Summary 40
2.2. FDI is highly concentrated in terms of sectors and geography 40
2.3. FDI goes to high-value added, innovative and well paid activities 42
2.4. FDI-intensive sectors contributed to the economic recovery from the financial crisis 47
References 49
Annex 2.A. Methodology and data 50
Indicators in Figures 2.3, 2.5, and 2.6 50
Notes 51
3. Productivity and job dynamics of foreign MNEs in Ireland 53
3.1. Summary 54
3.2. Strong MNE productivity performance in Ireland: official statistics and IDA microdata 55
3.3. Growing differences in relative labour productivity among foreign MNEs in Ireland 57
3.4. How transition matrices help describe productivity mobility across foreign firms 60
3.5. Defining features along the productivity distribution 64
References 68
Annex 3.A. Methodology and data 70
6
FDI QUALITIES ASSESSMENT OF IRELAND © OECD 2020
Glossary of statistical terms used in this chapter 70
Methodology and data 70
Overview 70
A focus on Labour Productivity 71
Outlier checks 71
Quintiles of relative productivity – methodological issues 72
Transition matrices 73
Notes 75
4. Factors driving FDI spillovers in Ireland 77
4.1. Summary 78
4.2. Identifying domestic firms’ productive capacities 79
4.3. Role of FDI on patenting and inventor mobility 84
References 88
Annex 4.A. Methodology and data 90
Indicators in Figures 4.1, 4.2, and 4.3 90
Notes 90
5. Key conclusions and policy implications 93
Tables
Table 3.1. Industry patterns in percentiles of relative productivity, by year 58 Table 3.2. ABSEI firms and employment by quintile 58 Table 3.3. Components of the transition matrix – an example: 60 Table 3.4. Transition matrix for jobs in manufacturing 61 Table 3.5. Transition matrix for jobs in information and communication 62 Table 4.1. Depending on technology type, intellectual property is protected elsewhere 85 Table 4.2. Irish firms are patenting in similar technology classes as foreign MNEs 85 Table 4.3. Inventors working for foreign MNEs in Ireland are more productive than those in Irish firms 86 Annex Table 3.A.1. Transition matrix for jobs in Manufacture of computer, electronic and optical products 73 Annex Table 3.A.2. Transition matrix for jobs in Manufacture of basic pharmaceutical products and
pharmaceutical preparations; manufacture of medical and dental instruments and supplies 73 Annex Table 3.A.3. Transition matrix for jobs in Computer programming, consultancy and related activities 73 Annex Table 3.A.4. Transition matrix for firm counts in Manufacturing 74 Annex Table 3.A.5. Transition matrix for firm counts in Information and Communication 74 Annex Table 3.A.6. Transition matrix for firm counts in Manufacture of computer, electronic and optical
products 74 Annex Table 3.A.7. Transition matrix for firm counts in Manufacture of basic pharmaceutical products and
pharmaceutical preparations; manufacture of medical and dental instruments and supplies 75 Annex Table 3.A.8. Transition matrix for firm counts in Computer programming, consultancy and related
activities 75
Figures
Figure 1.1. Inward and outward FDI stocks and income receipts and payments, 2012 to 2017 15 Figure 1.2. Foreign-owned firms’ share of value added and employment, 2015 16 Figure 1.3. Trade openness, 2016 16 Figure 1.4. Exports and imports of value added and the trade balance, 2006 to 2015 17 Figure 1.5. Export orientation, foreign-owned firm value added, and the import content of exports, 2014 18 Figure 1.6. Exports of value added by sector, 2014 18 Figure 1.7. Share of foreign value added in exports, 2005 to 2016 19 Figure 1.8. The domestic sourcing of domestic firms and foreign affiliates 21
7
FDI QUALITIES ASSESSMENT OF IRELAND © OECD 2020
Figure 1.9. Services accounted for the highest share of inputs sourced domestically by foreign affiliates 21 Figure 1.10. Foreign affiliates in Ireland source less domestically and their domestic sourcing benefits less
domestic companies relative to foreign affiliates in the OECD 23 Figure 1.11. Ireland has one of the highest shares of linkages developed among foreign affiliates established
locally 23 Figure 1.12. The domestic forward effects of foreign affiliates benefit largely Irish firms 24 Figure 1.13. In Ireland, the production of foreign affiliates is more destined to international markets 25 Figure 1.14. The output of foreign affiliates established in Ireland and in other small open OECD economies is
mainly exported 25 Figure 1.15. Exports of value added by ownership, 2008 to 2015 27 Figure 1.16. Share of value added that is exported by sector, 2014 28 Figure 1.17. Services content in exports from manufacturing, 2015 28 Figure 1.18. Exports by ownership and their contribution to income as a share of GDP, 2014 29 Figure 1.19. Exports and imports: gross and value added terms, by partner country, 2014 31 Figure 1.20. Inward FDI position by immediate investing country, 2017 31 Figure 1.21. Inward FDI position by ultimate investing country, 2017 32 Figure 1.22. Value added, profits, employment, and employee compensation of foreign-owned firms by
country of the ultimate investor, 2015 33 Figure 2.1. About 80% of foreign value added is concentrated in three sectors 41 Figure 2.2. FDI is highly concentrated in Dublin 42 Figure 2.3. In Ireland, FDI is concentrated in sectors that are more productive and R&D-intensive 43 Figure 2.4. Productivity contribution of FDI remained broadly constant over time 45 Figure 2.5. In Ireland FDI is channelled to sectors with higher employment growth between 2009 and 2016 46 Figure 2.6. FDI is concentrated in higher paid sectors, mostly services 47 Figure 3.1. Labour productivity trends, 2006-16 56 Figure 3.2. Selected percentiles of labour productivity based on ABSEI 57 Figure 3.3. Quintiles of relative productivity in manufacturing, 2006 and 2016 59 Figure 3.4. Quintiles of relative productivity in Information and Communication, 2006 and 2016 59 Figure 3.5. Enterprises by productivity quintile in 2006: Where did they end up? 63 Figure 3.6. Regional distributions of relative productivity, 2006-16 64 Figure 3.7. Average salaries by year and quintile, stable and upwardly mobile firms, 2006 and 2016 65 Figure 3.8. Relative productivity by sector and region of investor, 2006-16 66 Figure 3.9. R&D intensity by quintile and sector, 2006-16 67 Figure 3.10. R&D intensity of stable and upwardly mobile firms, 2006-16 68 Figure 4.1. Foreign firms have a productivity premium in most sectors and regions 81 Figure 4.2. The share of Irish firms investing in R&D tends to be higher than that of foreign firms, both across
sectors and regions 82 Figure 4.3. The share of foreign firms with expenditure in formal training is higher in almost every sector 83 Figure 4.4. Most inventors are based outside Ireland 87 Figure 4.5. About 60%% of inventors that are changing employer remain in Ireland 87 Annex Figure 3.A.1. Impact of removal of outliers in labour productivity, pre and post, by year 72
Boxes
Box 2.1. Contract manufacturing in Ireland 48 Box 3.1. Recent findings from the literature 55 Box 4.1. Role of domestic firm’s characteristics and absorptive capacity 80
8
FDI QUALITIES ASSESSMENT OF IRELAND © OECD 2020
Acronyms and abbreviations
ABSEI Annual Business Survey of Economic Impact
AMNE Activities of Multinational Enterprises
BEA Bureau of Economic Analysis
BMW Border, Midland, and Western Region
CSO Central Statistical Office
EU European Union
FATS Foreign Affiliate Statistics
FDI Foreign Direct Investment
GDP Gross Domestic Product
GNP Gross National Product
GVC Global Value Chain
ICT Information and Communication Technology
IDA IDA Ireland (investment promotion agency)
ILO International Labour Organization
IP Intellectual Property
IT Information Technology
MNE Multinational Enterprises
OECD Organisation for Economic Cooperation and Development
R&D Research and Development
SME Small and Medium-Sized Enterprise
SPE Special Purpose Entities
TiVA Trade in Value-Added
UIC Ultimate Investing Country
UK United Kingdom
UNCTAD United Nations Conference on Trade and Development
UNIDO United Nations Industrial Development Organization
US United States
WTO World Trade Organization
9
Executive summary
Ireland is an open and internationally engaged economy, the second most open economy to trade in the
OECD and a significant destination for FDI. Ireland has enjoyed positive impacts of this outward orientation
over many years, with the FDI sector providing crucial support to the economy during the COVID-19
pandemic in 2020. FDI was also central to Ireland’s recovery from the financial crisis, which is the time
period studied in this report. The report is the product of a collaboration between the OECD and IDA
Ireland, which was completed in advance of the pandemic. The findings have been an important input into
the development of IDA’s new 2021-2024 organisational strategy. In this new strategy, IDA will partner
with foreign firms to drive recovery and sustainable growth in the context of a challenging, changed and
uncertain global economic environment.
The study examines the following questions: the role of FDI in trade and integration in global value chains
(GVCs); how foreign investment contributes to productivity and labour market outcomes; labour
productivity dynamics of foreign affiliates in two important sectors in the Irish economy (manufacturing and
information and communications); and the indirect impacts of foreign affiliates – by examining potential
factors driving spillovers to domestic firms, with a special focus on labour mobility as a key channel for
spillovers.
Overall, the study shows that foreign affiliates made a considerable contribution to the Irish economy in
terms of trade, productivity, innovation, and employment between 2006 and 2016, both directly and
indirectly. As IDA Ireland implements the key pillars of its strategy for 2021 to 2024, which include
objectives aimed at maximising the impact of FDI in Ireland, the findings of this study suggest it should
continue to diversify the investor base, to focus on attracting technology-intensive and R&D intensive
investments in different sectors, and to encourage expansions and reinvestments by existing investors. It
could enhance the opportunities for domestic firms to benefit from FDI by working with other government
agencies to develop domestic firms’ capabilities and linkages with foreign affiliates. The OECD will
continue to engage and collaborate with IDA, through the IPA Network and the OECD FDI Qualities
Initiative, on best practices related to maximising the impact of FDI, including those related to strengthening
the linkages between foreign and domestic firms.
Foreign affiliates’ contribution to trade and integration in GVCs
FDI has deeply embedded Ireland in the modern global economy, and positioned Ireland at latter stages
of global value chains, i.e. post-production services. Foreign affiliates accounted for the growing trade
surplus following the financial crisis and enabled Ireland to increase its integration in GVCs: foreign
affiliates’ exports of value added were 23% of GDP in 2008, which increased to 39% by 2015. This greater
integration ran counter to the trend in the OECD overall, which saw a retrenchment in GVCs during this
time. Integration in GVCs is important for smaller economies because it enables them to produce and
export more by specialising in selected stages of production. Ireland is generally located at the customer
end of GVCs, as are most OECD economies. Ireland has a comparative advantage in marketing,
10
FDI QUALITIES ASSESSMENT OF IRELAND © OECD 2020
distribution, and after-sales services and in publishing. The share of value added at the customer end of
GVCs grew between 2005 and 2015, supporting high-paying jobs in Ireland.
Given the competitive corporate tax regime in Ireland, profits make a significant contribution to foreign
affiliates’ value added due in part to MNEs shifting intangible assets to Ireland. These high profits accrue
to the foreign investor and, thus, may not remain in the domestic economy. As such, Ireland may not
benefit as much from the value added exports of foreign affiliates as the data initially indicate. Efforts to
identify reinvestment and expansion projects, including through IDA Ireland’s aftercare services, increase
the share of these profits reinvested and thereby also increase the benefits to Ireland from these foreign
affiliates.
Ireland’s close business ties to the US and proximity to the EU facilitated its greater integration in GVCs.
FDI in Ireland is dominated by the US, which accounts for 70% of the inward FDI stock. Because smaller
economies are vulnerable to macroeconomic developments and changes in policy in their major partner
countries, this reliance on the one dominant source country could pose risks. IDA Ireland has made
progress in diversifying the investor base. There were strong increases in employment at Chinese- and
Indian-owned firms between 2006 and 2016, albeit from very low levels, as well as expansions and new
investments from countries that already had a presence in Ireland, including Japan, France, and Italy.
These efforts to diversify the investor base should continue.
Direct contributions to production, employment and innovation
FDI is concentrated in sectors with higher productivity, R&D expenditure and better employment outcomes.
Foreign affiliates in Ireland accounted for 59% of value added (the highest share among EU countries) but
only 18% of persons employed (Ireland ranks 14th in the EU) in 2015. While the Irish economy contracted
sharply during the global financial crisis, foreign affiliates provided support to the economy during this time,
especially in the Information and Communications sector as production and employment in this sector
grew throughout the great recession. FDI also helped shift the economy to higher value added, and higher
paying, services. This occurred not just in the Information and Communication sector, but also in
Manufacturing and in Finance and Insurance. In Manufacturing, there was a shift away from physical
production in Ireland to manufacturing abroad that was arranged and contracted for by foreign affiliates in
Ireland. Together, these three FDI-intensive sectors accounted for 52% of Irish GDP in 2016, up from 39%
in 2006. This shift to services helped the economy grow and increased labour productivity and wages.
Foreign affiliates also contributed to the growth and increasing sophistication of the Irish economy through
their contributions to productivity growth, R&D expenditures, and employment. FDI is concentrated in
sectors that are more productive and in industries with higher expenditures on R&D, and higher
employment growth. Finally, foreign affiliates received 80% of all patents granted in Ireland between 2006
and 2016. These findings underscore that IDA Ireland’s strategy to attract foreign investments in R&D-
intensive sectors has been successful. Foreign affiliates are however less likely to engage in R&D activities
in Ireland compared to domestic firms, which also explains that more than half of all researchers associated
with patents granted to firms based in Ireland, are themselves located outside Ireland. Continuing to seek
new investments in technology-intensive activities, and enhancing R&D activities in Ireland, is likely to be
successful in the future and to contribute to economic and productivity growth in Ireland.
Productivity dynamics of foreign affiliates
There is a wide variety in productivity performance among IDA clients. Growth in relative productivity
among these firms is linked to higher salaries and R&D intensity. Between 2006 and 2016, foreign firms
had much higher productivity growth than domestic firms, but this aggregate growth resulted from complex
dynamics at the firm level. Some large, resilient foreign affiliates can maintain high levels of productivity
11
FDI QUALITIES ASSESSMENT OF IRELAND © OECD 2020
and support employment for extended periods of time, playing an important role in improving living
standards. At the same time, entries and exits of firms provide a channel to reallocate resources among
firms, also crucially affecting aggregate productivity trends. Using IDA Ireland’s data to examine the
productivity dynamics of foreign firms in the manufacturing and Information and Communications sectors
reveals that the range of productivity levels among foreign affiliates operating between 2006 and 2016 is
very wide, with some stellar performers. These ‘frontier firms’ are almost ten times as productive as the
median foreign affiliates.
In manufacturing, the best performers tended to remain at the top of the productivity distribution. These
‘resilient’ top performers supported the largest share of jobs overall. Exits more than new entrants
supported dynamism within manufacturing, with exits concentrated in the lower productivity levels. In the
Information and Communications sector, there was also a group of large resilient foreign affiliates at the
top of the productivity distribution that support high productivity jobs, but there was more dynamism than
in manufacturing, with 55% of lower productivity foreign affiliates moving up the productivity distribution
between 2006 and 2016. New entrants also played an important role in the dynamics in the Information
and Communications sector and accounted for a significant share of jobs, indicating that Ireland has been
successful in attracting firms at the productivity frontier in this industry.
Overall, the most productive and resilient foreign affiliates were the ones exporting more and paying, on
average, higher salaries. Higher wages were also found in foreign affiliates that were the most upwardly
mobile (i.e. firms that ‘climbed’ the productivity distribution). In manufacturing, foreign affiliates that made
the biggest improvements in productivity had also invested intensively in R&D, but this correlation was not
found in the Information and Communications sector. Finally, the origin country of foreign investors matters;
affiliates with owners from the United States, Denmark, Japan, and France had the highest relative
productivity over the period 2006-16.
Factors driving spillovers from foreign affiliates to domestic firms
So far the focus has been on the direct impacts of foreign firms on the Irish economy, but they can also
have indirect impacts on the outcomes of domestic firms through buy/sell linkages as well as through
competition/imitation effects. Research has shown that the extent of spillovers is affected by several
factors, including: the capabilities gap between domestic and foreign firms; the ‘proximity’ to foreign firms,
such as through business linkages; and the movement of labour from foreign to domestic firms.
The capabilities gap reflects the ability of domestic firms to adopt foreign technology and to benefit from
positive FDI spillovers. There are significant productivity gaps between domestic and foreign firms, but the
size of the gaps varies across sectors. Foreign firms in chemicals where almost ten times as productive
as the few domestic firms in this industry, but only 50% more productive than domestic firms in transport
equipment manufacturing. Foreign firms are also more productive than domestic firms in all regions, with
the largest gap in the South and East where foreign firms were five times more productive.
While capacity gaps as measured in this report are not precise enough to provide concrete guidance, the
assessment shows in which sectors and regions gaps are higher and catching up efforts may be more
warranted. Gaps are particularly high in some sectors and regions where domestic firms might be less
present (e.g. chemicals) or where global frontier firms are responsible for disproportionate performance
gaps and for productivity disparities even within the group of foreign affiliates (e.g. in manufacturing in the
rest of South and East, or in information and communications in Dublin). As such, it might prove useful to
target policy efforts to ‘secondary’ foreign affiliates with which domestic firms have lower capacity gaps,
are more likely to engage in business linkages, and from which they are more likely to learn. Recent
research shows that innovation spillovers on domestic firms from ‘secondary’ foreign firms are more likely
to materialise than those from the global frontier innovators. Finally, and importantly, one needs to recall
that higher performance of foreign firms across sectors and regions directly and positively contributes to
12
FDI QUALITIES ASSESSMENT OF IRELAND © OECD 2020
the Irish economy. This finding underpins a conclusion made earlier that foreign firms are not only
concentrated in higher productivity sectors but they are also outperforming domestic peers within those
sectors.
Business linkages can increase domestic firms’ productivity by enabling domestic firms to reduce costs
and innovate. Linkages with locally established foreign firms can further strengthen domestic firms’
participation in GVCs. In Ireland, foreign firms are important gateways for domestic firms’ integration in
GVCs by enabling them to export indirectly by having their output embodied in the exports of foreign
affiliates. While foreign affiliates in Ireland source less domestically compared to the OECD overall
(domestic sourcing accounts for 24% of foreign affiliates’ output in Ireland, much lower than the OECD
average of 41%), the share is similar to other small, advanced economies. In addition to a declining share
of domestic sourcing by foreign affiliates, the absolute value of sourcing from domestic firms dropped by
40% over 2008-16. The absolute value of domestic sourcing also decreased in other small OECD
countries, such as the Netherlands and Switzerland, although to a lesser degree. IDA data show that in
2008 43% of its clients were engaged in manufacturing, and by 2016 this had fallen to 34%, partly
explaining a shift in the types of inputs used by foreign affiliates.
Strengthening the capabilities of domestic firms is essential to enhancing spillovers from FDI. A
collaborative approach between IDA and other government agencies in charge of enterprise development,
trade, innovation, and skills development is important to design and implement policies that support the
development of domestic firms’ capabilities and linkages. Capabilities in services are particularly and
increasingly important in Ireland. Services accounted for the highest share of inputs sourced domestically
in the OECD. Domestic firms can also benefit by purchasing higher quality or lower cost intermediate inputs
from foreign firms; in 2016, 30% of foreign affiliates’ output was used as an input by domestic companies.
Another important channel for spillovers between foreign and domestic firms is the movement of workers.
When workers move from foreign firms to domestic firms, they can bring knowledge and skills that can
enhance the domestic firms’ performance. Between 2009 and 2015, more than one out of every four
employees at foreign firms either moved to a domestic firm or became self-employed. In addition, more
than one in three start up founders previously worked at a foreign firm. Labour mobility within Ireland is
also very likely among highly skilled researchers that have been associated with patents in Ireland. One
out of two inventors changed employer at least once over 2006-16. As most inventors are based in foreign
MNEs, the FDI spillovers related to inventor mobility also play an important role in Ireland.
13
This chapter explores the degree of globalisation in the Irish economy. It
examines the role of MNEs in trade and in the integration of Ireland in GVCs.
It then looks at trade and investment relationships by industry. The chapter
also derives improved measures of the impact of trade on the Irish economy
by taking account of the profits earned by foreign MNEs on exports from
Ireland. Finally, it examines Ireland’s bilateral trade and investment
relationships with a special focus on the United States, Ireland’s most
important trade and investment partner.
1. The role of FDI in trade and
integration in GVCs in Ireland
14
FDI QUALITIES ASSESSMENT OF IRELAND © OECD 2020
1.1. Summary
Ireland has one of the most globalised economies in the OECD. It ranks among the highest in openness
to both trade and investment. Strategic planning to attract foreign direct investment (FDI) is central to
Ireland’s success in this regard. Since much of the FDI it attracts is export-oriented, multinational
enterprises (MNEs) account for a sizable share of Ireland’s trade and integration in global value chains
(GVCs), which has increased since 2006, unlike in many other OECD countries. Following the global
financial crisis, MNEs played a key role in Ireland’s growing trade surplus through increased exports. They
also supported the recovery in value added, employment growth and R&D spending.
MNEs in Ireland account for almost 60% of value added, a higher share than in other countries, and almost
20% of jobs. Yet the gap between the share of value added and employment accounted for by MNEs is
bigger in Ireland than in other countries, partly due to the very high profits that MNEs earn in Ireland. These
profits result from highly profitable MNEs choosing to locate in Ireland in part due to its low statutory tax
rate. However, these high profits accrue to the foreign investor and may not remain in the domestic
economy, indicating that, despite the high returns, Ireland may not benefit as much from FDI as the data
might initially suggest.
The relationship of Ireland with its key investment partners reveals that they benefit from their investment
not only through the income they receive from their Irish operations but also as a channel through which
their products reach other export destinations, making Ireland an important GVC hub. However, FDI in
Ireland lacks diversification: FDI is concentrated in a few sectors (manufacturing, information and
communications, finance and insurance) and is dominated by FDI from the United States. In addition, a
small number of very large MNEs in Ireland account for most FDI.
Ireland has successfully attracted FDI into targeted sectors and in support of its GVC integration, but this
lack of diversification could pose risks for the economy. While small economies are expected to have some
specialisation, they are also highly sensitive to macroeconomic trends in trade and investment and to policy
changes in partner countries. By diversifying sectors and origins of investment, Ireland would be better
placed to respond to these challenges as well as to changes in technology and in the nature of work.
Indeed, there is evidence that IDA Ireland is attracting investments from some countries that have not
invested as much in the past, including China and India, as well as expanding investments from some
long-time investors, including Japan, France, and Italy.1
Furthermore, sell and buy linkages between affiliates of foreign MNEs established locally and domestic
firms have the potential to strengthen domestic firms’ participation in GVCs. Domestic buy linkages exist if
foreign MNEs source intermediate inputs and services from domestic firms. Foreign MNEs operate not
only as customers in host economies but also supply intermediates that are further processed by domestic
firms, as well as final products New OECD evidence shows the increasing importance of foreign affiliates
in domestic value chains not only as buyers of locally produced intermediate goods but also as suppliers
of inputs to domestic companies. The OECD findings confirm that foreign affiliates are important gateways
to international markets and connect the domestic and international parts of GVCs. Accordingly, the
chapter also examines the extent of linkages between foreign affiliates established in Ireland and domestic
firms, distinguishing between Irish non-MNEs (which include many SMEs), Irish MNEs and other foreign
affiliates located in Ireland.2
Foreign affiliates established in Ireland source relatively more internationally than from the domestic
market, but their domestic sourcing also benefits Irish firms. These affiliates source less domestically and
their domestic sourcing benefits less domestic companies compared to foreign affiliates in the OECD
overall. Similar results hold for other small open economies such as Luxembourg, Belgium and the
Netherlands. This is unsurprising given the small size of their respective domestic markets. Services
account for the largest share of inputs sourced domestically in Ireland. Production of foreign affiliates in
Ireland is mainly exported reflecting Ireland’s small domestic market, its attractiveness as a location from
15
FDI QUALITIES ASSESSMENT OF IRELAND © OECD 2020
which to serve the EU Single Market, and IDA’s focus on attracting export-oriented FDI. Similarly, the
production of foreign affiliates in other small open economies such as Luxembourg, Belgium and the
Netherlands is also mostly exported.
1.2. Ireland is one of the most highly globalised economies in the OECD
This chapter examines the role of foreign MNEs in Ireland’s trade and integration in GVCs. It will take a
sectoral approach when possible given not only that FDI is concentrated in a few specific industries and
sectors in Ireland but also trends in these sectors differ. In addition, it will focus on net impacts when
warranted given that not all of the value added of foreign-owned firms remains in the host economy, in
particular the profits earned from their operations in Ireland accrue to the foreign investors.
Ireland is among the most open economies to FDI in the OECD
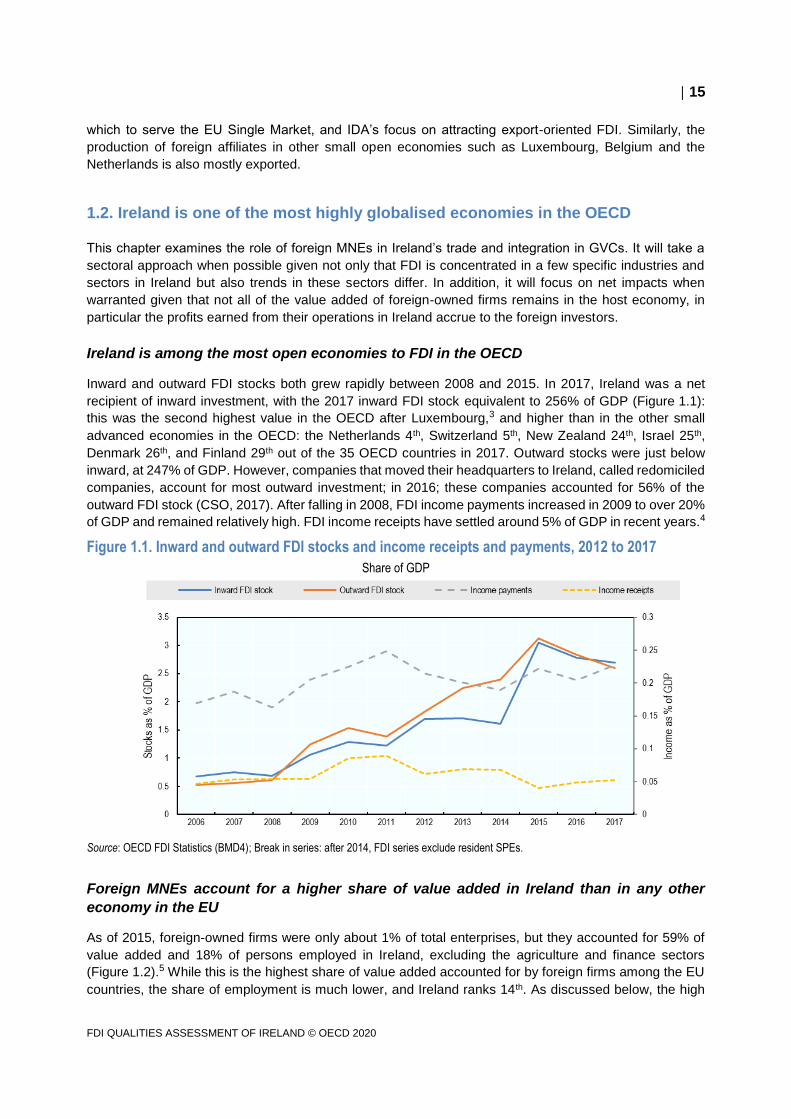
Inward and outward FDI stocks both grew rapidly between 2008 and 2015. In 2017, Ireland was a net
recipient of inward investment, with the 2017 inward FDI stock equivalent to 256% of GDP (Figure 1.1):
this was the second highest value in the OECD after Luxembourg,3 and higher than in the other small
advanced economies in the OECD: the Netherlands 4th, Switzerland 5th, New Zealand 24th, Israel 25th,
Denmark 26th, and Finland 29th out of the 35 OECD countries in 2017. Outward stocks were just below
inward, at 247% of GDP. However, companies that moved their headquarters to Ireland, called redomiciled
companies, account for most outward investment; in 2016; these companies accounted for 56% of the
outward FDI stock (CSO, 2017). After falling in 2008, FDI income payments increased in 2009 to over 20%
of GDP and remained relatively high. FDI income receipts have settled around 5% of GDP in recent years.4
Figure 1.1. Inward and outward FDI stocks and income receipts and payments, 2012 to 2017
Share of GDP
Source: OECD FDI Statistics (BMD4); Break in series: after 2014, FDI series exclude resident SPEs.
Foreign MNEs account for a higher share of value added in Ireland than in any other
economy in the EU
As of 2015, foreign-owned firms were only about 1% of total enterprises, but they accounted for 59% of
value added and 18% of persons employed in Ireland, excluding the agriculture and finance sectors
(Figure 1.2).5 While this is the highest share of value added accounted for by foreign firms among the EU
countries, the share of employment is much lower, and Ireland ranks 14th. As discussed below, the high
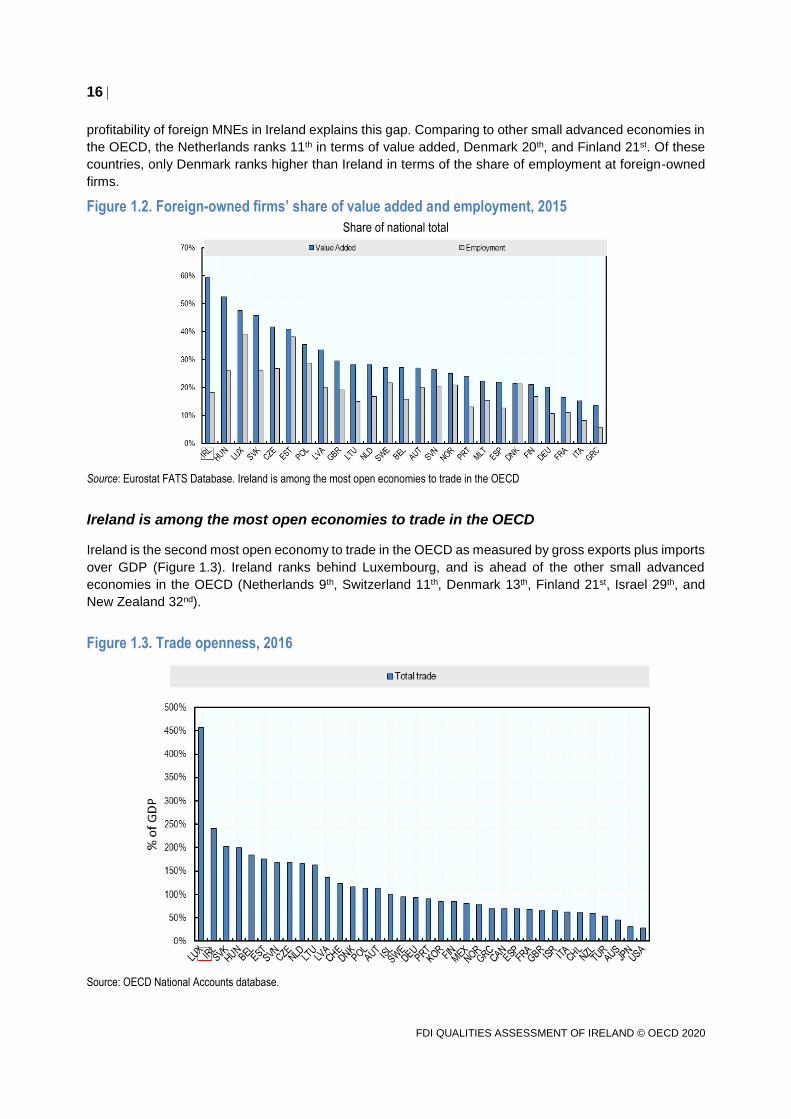
16
FDI QUALITIES ASSESSMENT OF IRELAND © OECD 2020
profitability of foreign MNEs in Ireland explains this gap. Comparing to other small advanced economies in
the OECD, the Netherlands ranks 11th in terms of value added, Denmark 20th, and Finland 21st. Of these
countries, only Denmark ranks higher than Ireland in terms of the share of employment at foreign-owned
firms.
Figure 1.2. Foreign-owned firms’ share of value added and employment, 2015
Share of national total
Source: Eurostat FATS Database. Ireland is among the most open economies to trade in the OECD
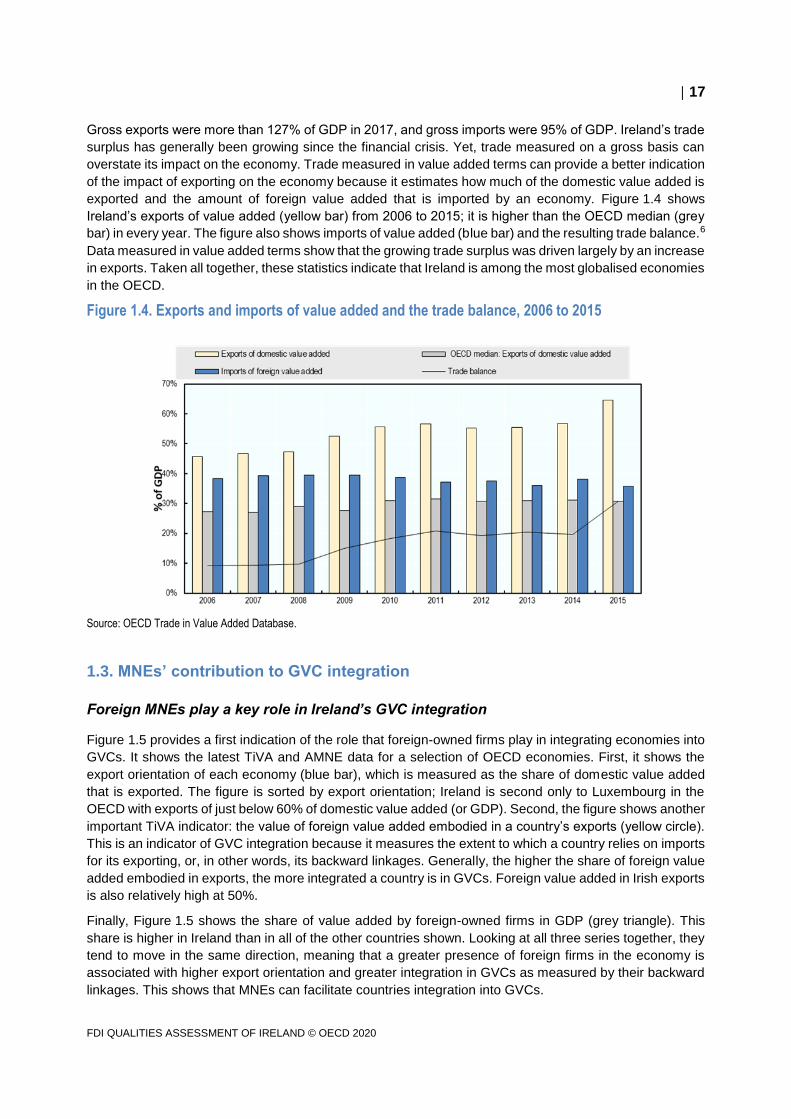
Ireland is among the most open economies to trade in the OECD
Ireland is the second most open economy to trade in the OECD as measured by gross exports plus imports
over GDP (Figure 1.3). Ireland ranks behind Luxembourg, and is ahead of the other small advanced
economies in the OECD (Netherlands 9th, Switzerland 11th, Denmark 13th, Finland 21st, Israel 29th, and
New Zealand 32nd).
Figure 1.3. Trade openness, 2016
Source: OECD National Accounts database.
17
FDI QUALITIES ASSESSMENT OF IRELAND © OECD 2020
Gross exports were more than 127% of GDP in 2017, and gross imports were 95% of GDP. Ireland’s trade
surplus has generally been growing since the financial crisis. Yet, trade measured on a gross basis can
overstate its impact on the economy. Trade measured in value added terms can provide a better indication
of the impact of exporting on the economy because it estimates how much of the domestic value added is
exported and the amount of foreign value added that is imported by an economy. Figure 1.4 shows
Ireland’s exports of value added (yellow bar) from 2006 to 2015; it is higher than the OECD median (grey
bar) in every year. The figure also shows imports of value added (blue bar) and the resulting trade balance.6
Data measured in value added terms show that the growing trade surplus was driven largely by an increase
in exports. Taken all together, these statistics indicate that Ireland is among the most globalised economies
in the OECD.
Figure 1.4. Exports and imports of value added and the trade balance, 2006 to 2015
Source: OECD Trade in Value Added Database.
1.3. MNEs’ contribution to GVC integration
Foreign MNEs play a key role in Ireland’s GVC integration
Figure 1.5 provides a first indication of the role that foreign-owned firms play in integrating economies into
GVCs. It shows the latest TiVA and AMNE data for a selection of OECD economies. First, it shows the
export orientation of each economy (blue bar), which is measured as the share of domestic value added
that is exported. The figure is sorted by export orientation; Ireland is second only to Luxembourg in the
OECD with exports of just below 60% of domestic value added (or GDP). Second, the figure shows another
important TiVA indicator: the value of foreign value added embodied in a country’s exports (yellow circle).
This is an indicator of GVC integration because it measures the extent to which a country relies on imports
for its exporting, or, in other words, its backward linkages. Generally, the higher the share of foreign value
added embodied in exports, the more integrated a country is in GVCs. Foreign value added in Irish exports
is also relatively high at 50%.
Finally, Figure 1.5 shows the share of value added by foreign-owned firms in GDP (grey triangle). This
share is higher in Ireland than in all of the other countries shown. Looking at all three series together, they
tend to move in the same direction, meaning that a greater presence of foreign firms in the economy is
associated with higher export orientation and greater integration in GVCs as measured by their backward
linkages. This shows that MNEs can facilitate countries integration into GVCs.
18
FDI QUALITIES ASSESSMENT OF IRELAND © OECD 2020
Figure 1.5. Export orientation, foreign-owned firm value added, and the import content of exports, 2014
Source: OECD-WTO Trade in Value Added Data and OECD AMNE statistics – data for 2014
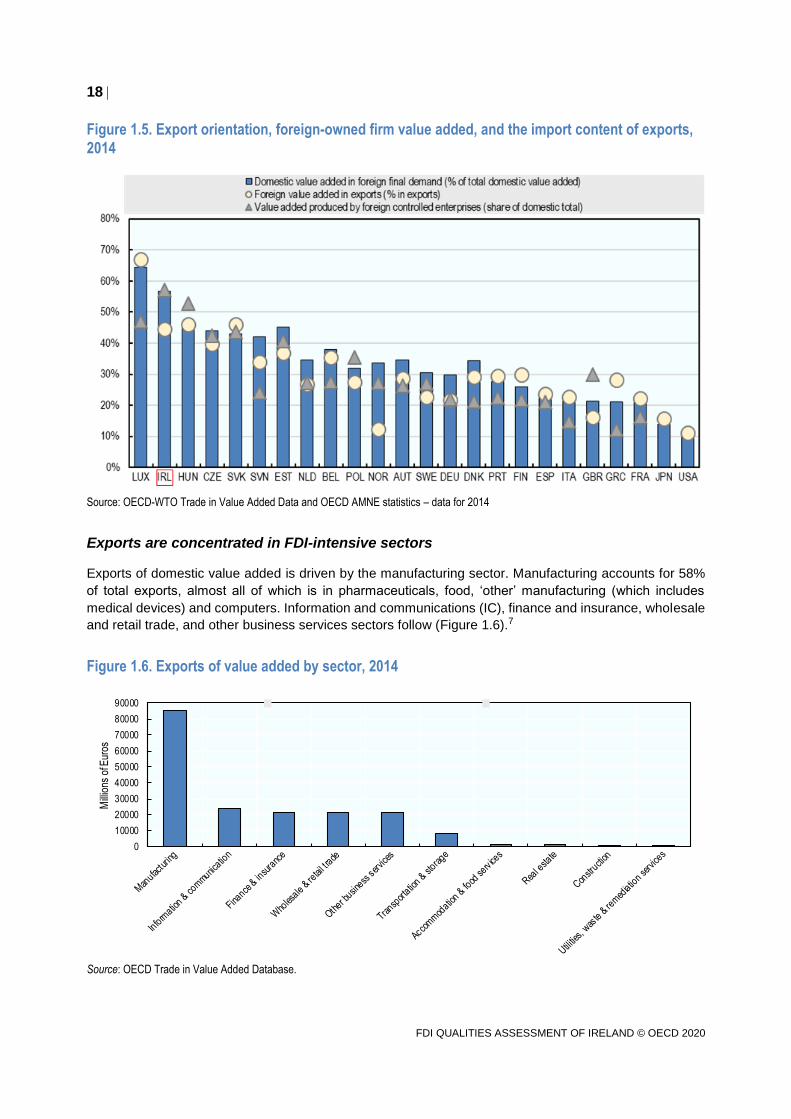
Exports are concentrated in FDI-intensive sectors
Exports of domestic value added is driven by the manufacturing sector. Manufacturing accounts for 58%
of total exports, almost all of which is in pharmaceuticals, food, ‘other’ manufacturing (which includes
medical devices) and computers. Information and communications (IC), finance and insurance, wholesale
and retail trade, and other business services sectors follow (Figure 1.6).7
Figure 1.6. Exports of value added by sector, 2014
0
10000
20000
30000
40000
50000
60000
70000
80000
90000
Mill
ions
of E
uros
Source: OECD Trade in Value Added Database.

19
FDI QUALITIES ASSESSMENT OF IRELAND © OECD 2020
Ireland increased its GVC integration after the financial crisis
Integration in GVCs is especially important for small economies like Ireland because it enables them to
export by developing comparative advantages in selected stages of the production processes rather than
having to master the production of entire products (OECD, 2013). This integration relies not only on foreign
demand but also on importing foreign value added to enable exports because they have specialised in one
or more specific stages of production.
One of the key findings from the most recent TiVA release is a hint of a slowdown in the global
fragmentation of production as evidenced by a fall in backward linkages (OECD, 2018). Figure 1.7 shows
the share of foreign value added content in exports for the OECD as a whole and for Ireland from 2005 to
2016. For the OECD as a whole, there was a drop during the financial crisis followed by a recovery, but,
since 2011, there has been a downward trend. By 2016, the share of foreign value added is virtually
unchanged from 2005, which is interpreted as a retrenchment in GVC integration. However, Ireland has
not followed this trend. There was a general upward trend in the foreign content of exports until 2014; even
with a drop in 2015, the backward linkages in 2016 were higher than in 2005.8 In 2015, Ireland ranked
fourth highest in foreign content of exports among OECD countries after Luxembourg, the Slovak Republic,
and Hungary.
Figure 1.7. Share of foreign value added in exports, 2005 to 2016
Source: OECD Trade in Value Added Database.
The ABSEI data from IDA Ireland suggest that foreign-owned firms have played a role in increasing
Ireland’s integration in GVCs. According to these data, the total purchases of materials and services
increased by 85% between 2006 and 2016, but the amount sourced in Ireland only increased by 6%. This
indicates that these firms, which are very export intensive, increased their use of imported content during
this period. It is important to note that while the more intensive use of imported content in exports means
that the share of domestic content in exports falls, the absolute level of exports can still increase; this is
important because it is the absolute level, rather than the share, that affects economic growth and
employment. In fact, the domestic content of Irish exports fell from 64% in 2005 to 60% in 2015, but the
value of exports of domestic value added increased by almost 75% from EUR 114.8 billion to EUR 200.3
billion. While it may have been a smaller share, it was a smaller share of a bigger pie.
The sectoral distribution also played a role in Ireland’s growing backward linkages. While GVC integration
in computer manufacturing fell, it actually increased in chemicals and pharmaceuticals manufacturing and
in the information and communications and finance and insurance sectors. Finally, Ireland’s close business
20
FDI QUALITIES ASSESSMENT OF IRELAND © OECD 2020
relationship with the United States appears to have helped. While GVCs centred on the United States as
a supply hub retrenched (World Bank, 2019), Ireland actually increased the US value added content of its
exports, especially those going to the rest of the EU.
1.4. Identifying buy and sell linkages between foreign affiliates and domestic firms
Domestic Irish firms may benefit from the presence of affiliates of foreign MNEs through buy and sell
linkages. Such linkages help domestic companies extend their market for selling and raise the quality and
competitiveness of their outputs. They can also generate spillovers, as discussed further in Chapter 4.
Finally, having strong buy and sell linkages with domestic firms can embed foreign affiliates more deeply
into the economy, making it less likely that foreign MNEs will move operations (OECD, 2013).
Domestic backward linkages are formed when foreign affiliates source inputs from domestic companies.
Foreign affiliates can also sell intermediates to local companies. These linkages are referred to as domestic
forward linkages. This section examines the extent of domestic backward and forward linkages between
foreign affiliates and domestic companies in Ireland. The analysis identifies the main beneficiaries of
domestic sourcing and buying of foreign affiliates (Irish non-MNEs, Irish MNEs and other foreign affiliates
established locally) and shows the evolution of such linkages from 2008 to 2016.
Foreign affiliates source more internationally, but their domestic sourcing also benefits
Irish firms
Foreign affiliates in host countries can import their intermediates or source them from the local market. In
the latter case, they establish backward linkages with domestic companies or with other foreign affiliates
established locally. New indicators based on the OECD Analytical AMNE database enables the
comparison of the sourcing structure of foreign affiliates established in Ireland with that of domestic firms.
It should be noted that unlike the ABSEI data used elsewhere in this report, this OECD data captures the
activities of all foreign affiliates in Ireland, including those not supported by IDA Ireland such as companies
in the wholesale and retail sector that serve the domestic market.
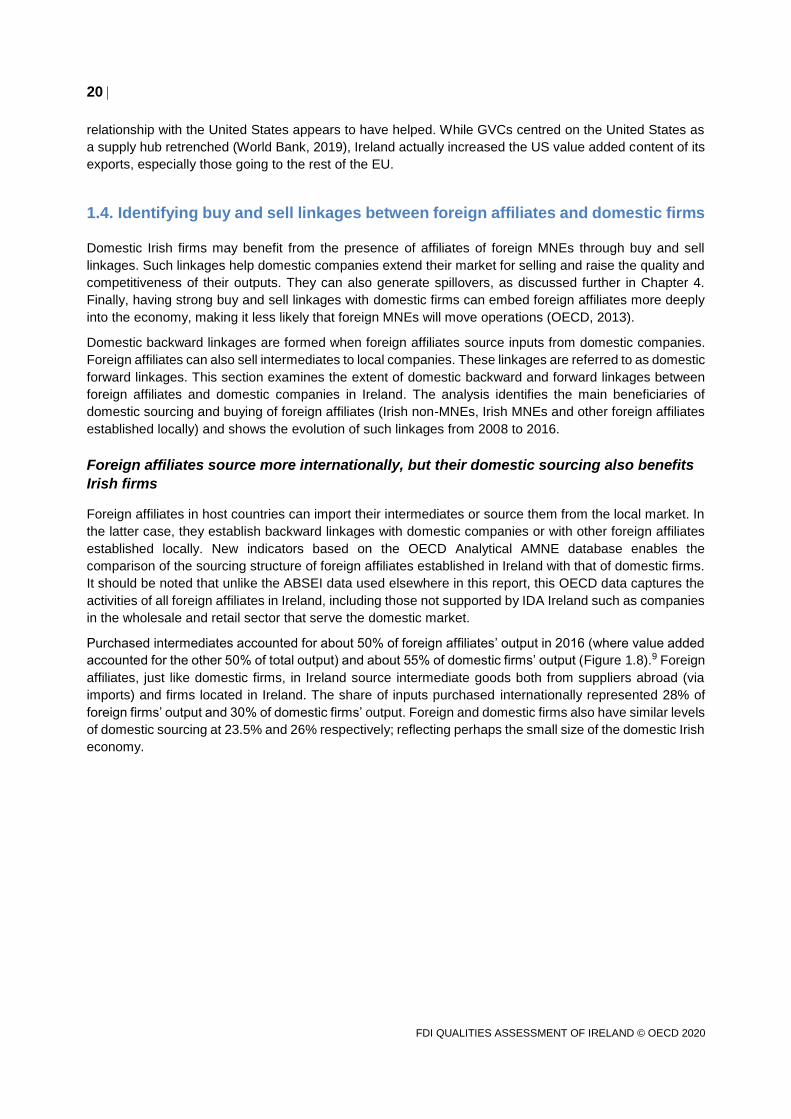
Purchased intermediates accounted for about 50% of foreign affiliates’ output in 2016 (where value added
accounted for the other 50% of total output) and about 55% of domestic firms’ output (Figure 1.8).9 Foreign
affiliates, just like domestic firms, in Ireland source intermediate goods both from suppliers abroad (via
imports) and firms located in Ireland. The share of inputs purchased internationally represented 28% of
foreign firms’ output and 30% of domestic firms’ output. Foreign and domestic firms also have similar levels
of domestic sourcing at 23.5% and 26% respectively; reflecting perhaps the small size of the domestic Irish
economy.
21
FDI QUALITIES ASSESSMENT OF IRELAND © OECD 2020
Figure 1.8. The domestic sourcing of domestic firms and foreign affiliates
Sourcing structure of foreign affiliates and domestic firms in Ireland, 2016
Source: OECD elaborations based on the OECD Analytical AMNE database
Domestic sourcing of foreign affiliates benefits both foreign affiliates established in Ireland as well as Irish
firms: in 2016, 36% of domestically sourced inputs were purchased from Irish companies (29% from Irish
non-MNEs and 7% from Irish MNEs) while the remaining 64% were from other foreign affiliates established
in Ireland. This demonstrates the linkages between clusters of MNEs in Ireland, including those within the
same group (e.g. those with second sites in regional locations)
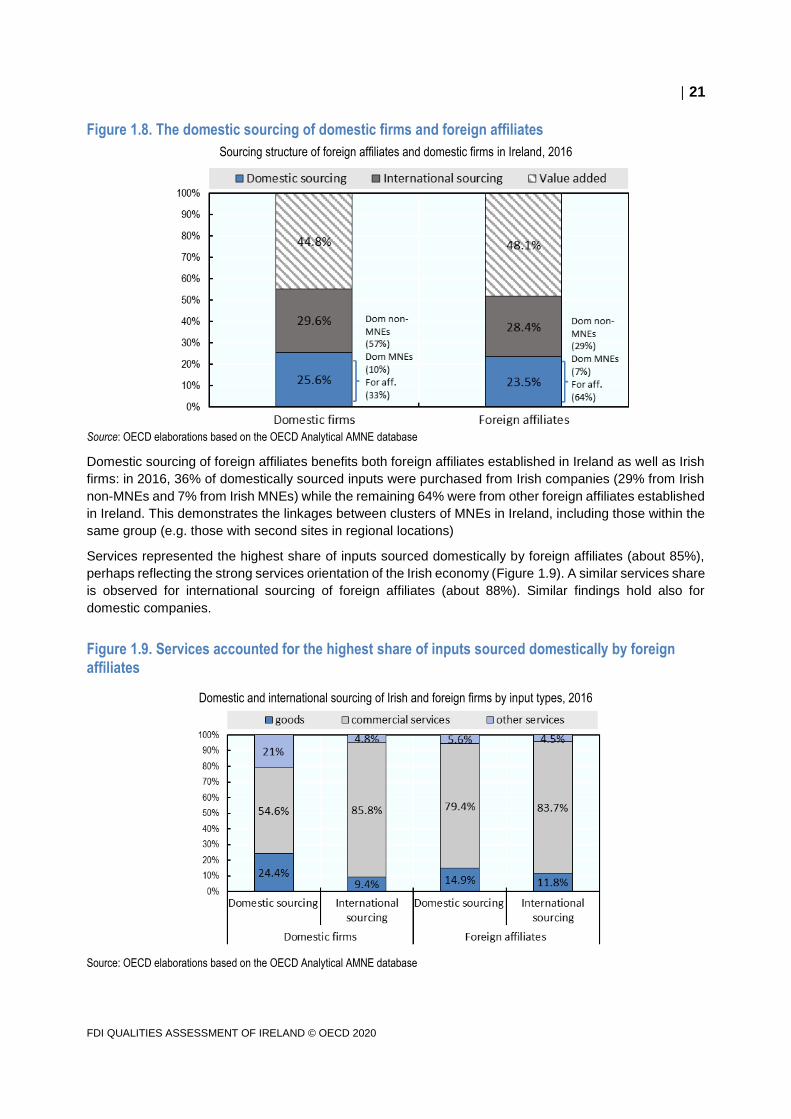
Services represented the highest share of inputs sourced domestically by foreign affiliates (about 85%),
perhaps reflecting the strong services orientation of the Irish economy (Figure 1.9). A similar services share
is observed for international sourcing of foreign affiliates (about 88%). Similar findings hold also for
domestic companies.
Figure 1.9. Services accounted for the highest share of inputs sourced domestically by foreign affiliates
Domestic and international sourcing of Irish and foreign firms by input types, 2016
Source: OECD elaborations based on the OECD Analytical AMNE database
22
FDI QUALITIES ASSESSMENT OF IRELAND © OECD 2020
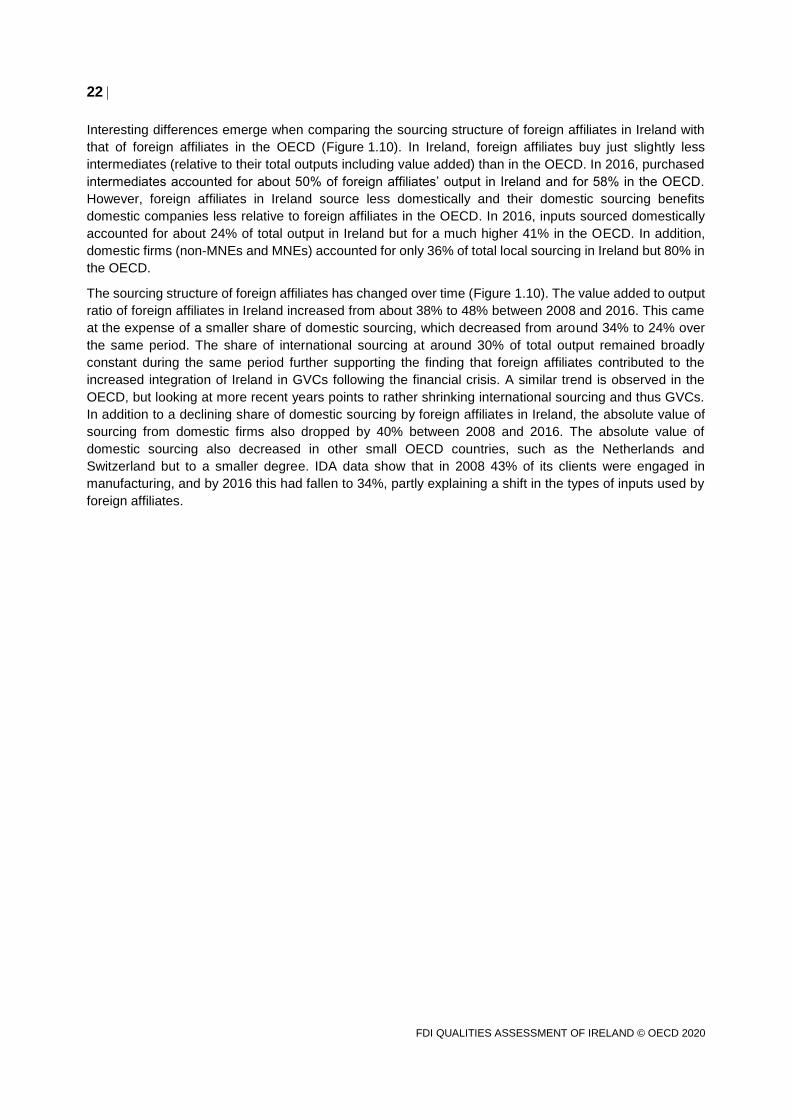
Interesting differences emerge when comparing the sourcing structure of foreign affiliates in Ireland with
that of foreign affiliates in the OECD (Figure 1.10). In Ireland, foreign affiliates buy just slightly less
intermediates (relative to their total outputs including value added) than in the OECD. In 2016, purchased
intermediates accounted for about 50% of foreign affiliates’ output in Ireland and for 58% in the OECD.
However, foreign affiliates in Ireland source less domestically and their domestic sourcing benefits
domestic companies less relative to foreign affiliates in the OECD. In 2016, inputs sourced domestically
accounted for about 24% of total output in Ireland but for a much higher 41% in the OECD. In addition,
domestic firms (non-MNEs and MNEs) accounted for only 36% of total local sourcing in Ireland but 80% in
the OECD.
The sourcing structure of foreign affiliates has changed over time (Figure 1.10). The value added to output
ratio of foreign affiliates in Ireland increased from about 38% to 48% between 2008 and 2016. This came
at the expense of a smaller share of domestic sourcing, which decreased from around 34% to 24% over
the same period. The share of international sourcing at around 30% of total output remained broadly
constant during the same period further supporting the finding that foreign affiliates contributed to the
increased integration of Ireland in GVCs following the financial crisis. A similar trend is observed in the
OECD, but looking at more recent years points to rather shrinking international sourcing and thus GVCs.
In addition to a declining share of domestic sourcing by foreign affiliates in Ireland, the absolute value of
sourcing from domestic firms also dropped by 40% between 2008 and 2016. The absolute value of
domestic sourcing also decreased in other small OECD countries, such as the Netherlands and
Switzerland but to a smaller degree. IDA data show that in 2008 43% of its clients were engaged in
manufacturing, and by 2016 this had fallen to 34%, partly explaining a shift in the types of inputs used by
foreign affiliates.
23
FDI QUALITIES ASSESSMENT OF IRELAND © OECD 2020
Figure 1.10. Foreign affiliates in Ireland source less domestically and their domestic sourcing benefits less domestic companies relative to foreign affiliates in the OECD
Sourcing structure of foreign affiliates, Ireland versus OECD, 2008 and 2016
Source: OECD elaborations based on the OECD Analytical AMNE database
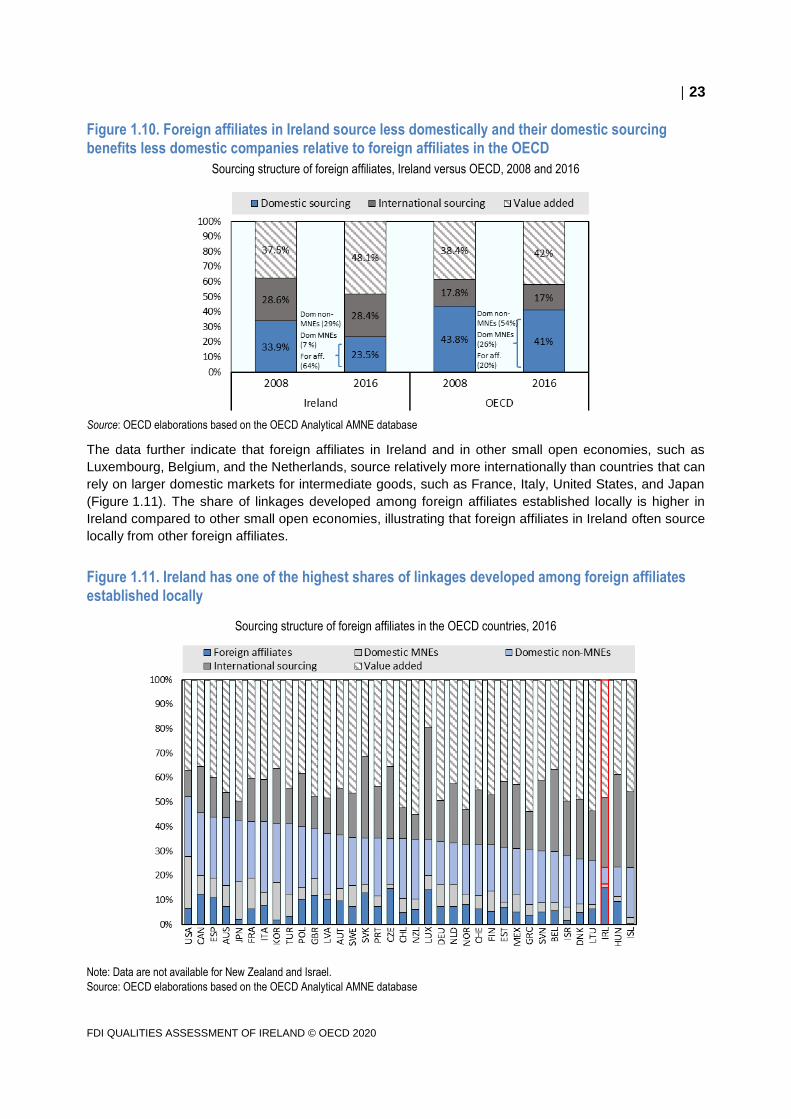
The data further indicate that foreign affiliates in Ireland and in other small open economies, such as
Luxembourg, Belgium, and the Netherlands, source relatively more internationally than countries that can
rely on larger domestic markets for intermediate goods, such as France, Italy, United States, and Japan
(Figure 1.11). The share of linkages developed among foreign affiliates established locally is higher in
Ireland compared to other small open economies, illustrating that foreign affiliates in Ireland often source
locally from other foreign affiliates.
Figure 1.11. Ireland has one of the highest shares of linkages developed among foreign affiliates established locally
Sourcing structure of foreign affiliates in the OECD countries, 2016
Note: Data are not available for New Zealand and Israel.
Source: OECD elaborations based on the OECD Analytical AMNE database
24
FDI QUALITIES ASSESSMENT OF IRELAND © OECD 2020
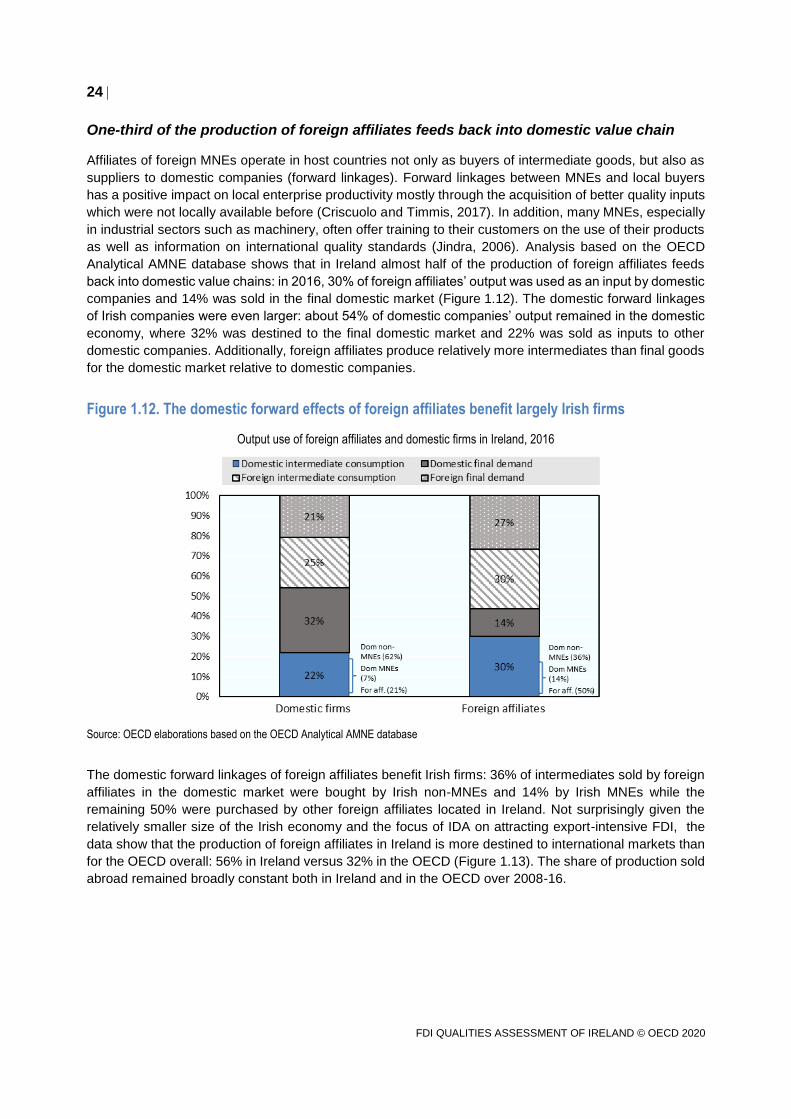
One-third of the production of foreign affiliates feeds back into domestic value chain
Affiliates of foreign MNEs operate in host countries not only as buyers of intermediate goods, but also as
suppliers to domestic companies (forward linkages). Forward linkages between MNEs and local buyers
has a positive impact on local enterprise productivity mostly through the acquisition of better quality inputs
which were not locally available before (Criscuolo and Timmis, 2017). In addition, many MNEs, especially
in industrial sectors such as machinery, often offer training to their customers on the use of their products
as well as information on international quality standards (Jindra, 2006). Analysis based on the OECD
Analytical AMNE database shows that in Ireland almost half of the production of foreign affiliates feeds
back into domestic value chains: in 2016, 30% of foreign affiliates’ output was used as an input by domestic
companies and 14% was sold in the final domestic market (Figure 1.12). The domestic forward linkages
of Irish companies were even larger: about 54% of domestic companies’ output remained in the domestic
economy, where 32% was destined to the final domestic market and 22% was sold as inputs to other
domestic companies. Additionally, foreign affiliates produce relatively more intermediates than final goods
for the domestic market relative to domestic companies.
Figure 1.12. The domestic forward effects of foreign affiliates benefit largely Irish firms
Output use of foreign affiliates and domestic firms in Ireland, 2016
Source: OECD elaborations based on the OECD Analytical AMNE database
The domestic forward linkages of foreign affiliates benefit Irish firms: 36% of intermediates sold by foreign
affiliates in the domestic market were bought by Irish non-MNEs and 14% by Irish MNEs while the
remaining 50% were purchased by other foreign affiliates located in Ireland. Not surprisingly given the
relatively smaller size of the Irish economy and the focus of IDA on attracting export-intensive FDI, the
data show that the production of foreign affiliates in Ireland is more destined to international markets than
for the OECD overall: 56% in Ireland versus 32% in the OECD (Figure 1.13). The share of production sold
abroad remained broadly constant both in Ireland and in the OECD over 2008-16.
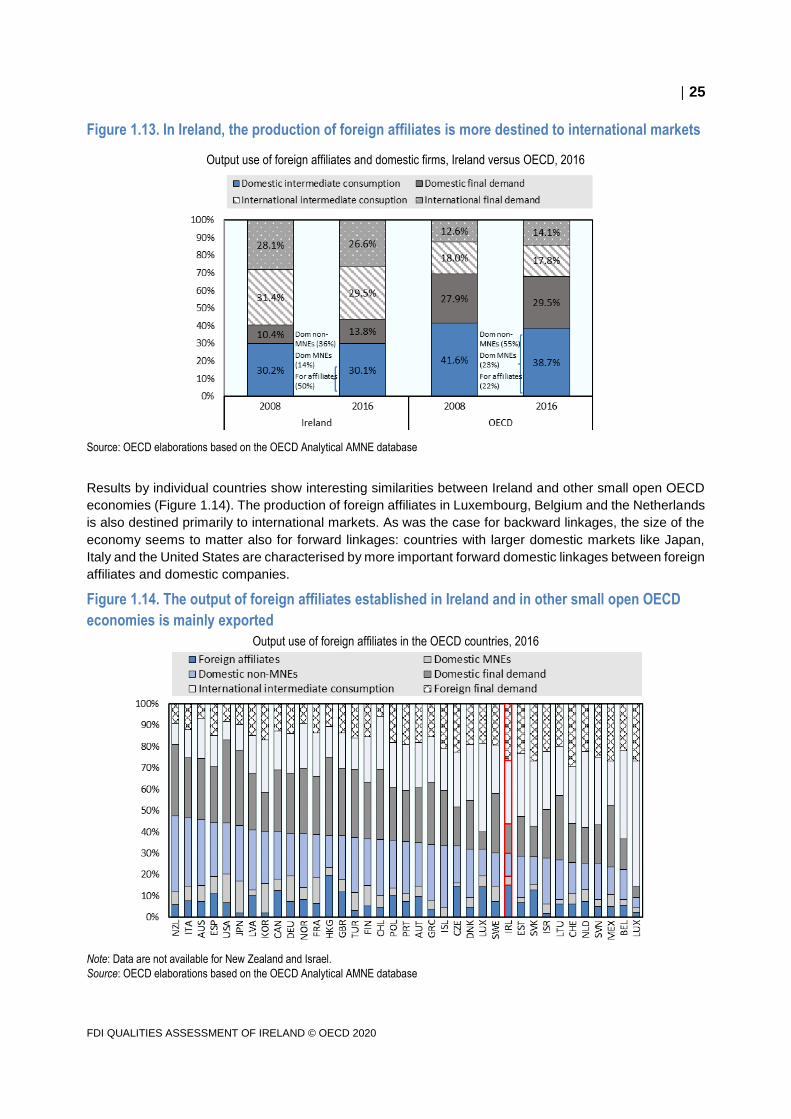
25
FDI QUALITIES ASSESSMENT OF IRELAND © OECD 2020
Figure 1.13. In Ireland, the production of foreign affiliates is more destined to international markets
Output use of foreign affiliates and domestic firms, Ireland versus OECD, 2016
Source: OECD elaborations based on the OECD Analytical AMNE database
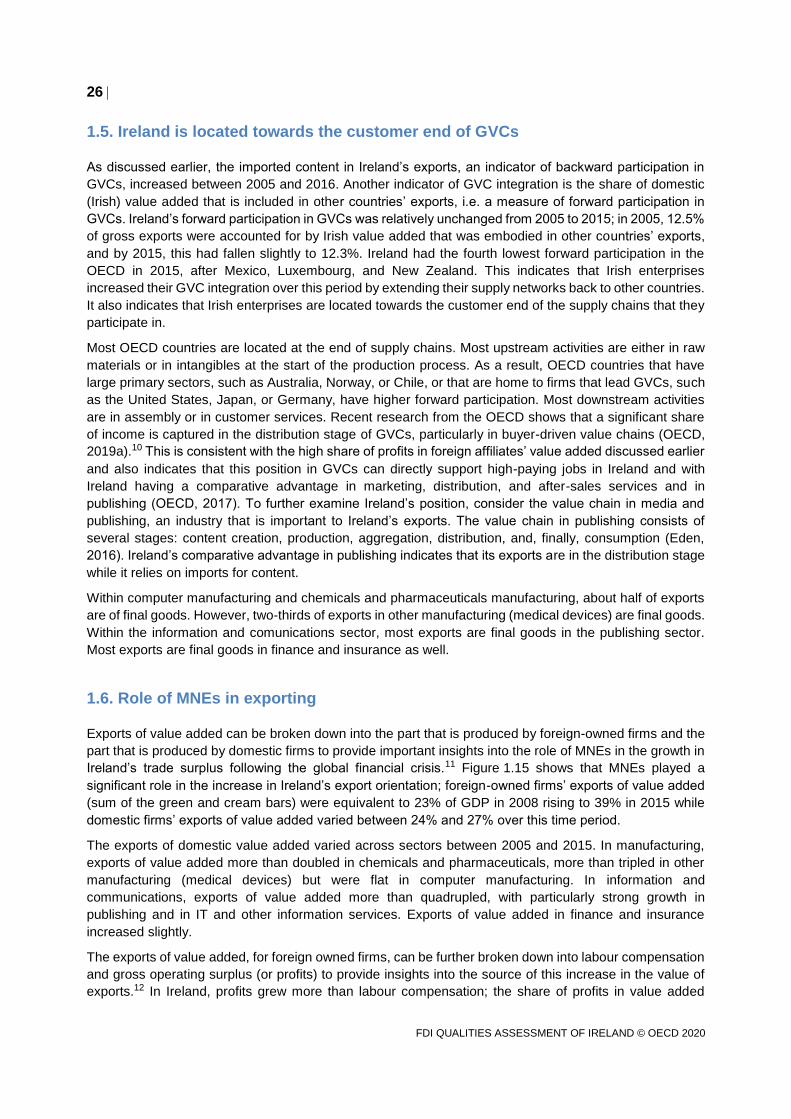
Results by individual countries show interesting similarities between Ireland and other small open OECD
economies (Figure 1.14). The production of foreign affiliates in Luxembourg, Belgium and the Netherlands
is also destined primarily to international markets. As was the case for backward linkages, the size of the
economy seems to matter also for forward linkages: countries with larger domestic markets like Japan,
Italy and the United States are characterised by more important forward domestic linkages between foreign
affiliates and domestic companies.
Figure 1.14. The output of foreign affiliates established in Ireland and in other small open OECD
economies is mainly exported
Output use of foreign affiliates in the OECD countries, 2016
Note: Data are not available for New Zealand and Israel.
Source: OECD elaborations based on the OECD Analytical AMNE database
26
FDI QUALITIES ASSESSMENT OF IRELAND © OECD 2020
1.5. Ireland is located towards the customer end of GVCs
As discussed earlier, the imported content in Ireland’s exports, an indicator of backward participation in
GVCs, increased between 2005 and 2016. Another indicator of GVC integration is the share of domestic
(Irish) value added that is included in other countries’ exports, i.e. a measure of forward participation in
GVCs. Ireland’s forward participation in GVCs was relatively unchanged from 2005 to 2015; in 2005, 12.5%
of gross exports were accounted for by Irish value added that was embodied in other countries’ exports,
and by 2015, this had fallen slightly to 12.3%. Ireland had the fourth lowest forward participation in the
OECD in 2015, after Mexico, Luxembourg, and New Zealand. This indicates that Irish enterprises
increased their GVC integration over this period by extending their supply networks back to other countries.
It also indicates that Irish enterprises are located towards the customer end of the supply chains that they
participate in.
Most OECD countries are located at the end of supply chains. Most upstream activities are either in raw
materials or in intangibles at the start of the production process. As a result, OECD countries that have
large primary sectors, such as Australia, Norway, or Chile, or that are home to firms that lead GVCs, such
as the United States, Japan, or Germany, have higher forward participation. Most downstream activities
are in assembly or in customer services. Recent research from the OECD shows that a significant share
of income is captured in the distribution stage of GVCs, particularly in buyer-driven value chains (OECD,
2019a).10 This is consistent with the high share of profits in foreign affiliates’ value added discussed earlier
and also indicates that this position in GVCs can directly support high-paying jobs in Ireland and with
Ireland having a comparative advantage in marketing, distribution, and after-sales services and in
publishing (OECD, 2017). To further examine Ireland’s position, consider the value chain in media and
publishing, an industry that is important to Ireland’s exports. The value chain in publishing consists of
several stages: content creation, production, aggregation, distribution, and, finally, consumption (Eden,
2016). Ireland’s comparative advantage in publishing indicates that its exports are in the distribution stage
while it relies on imports for content.
Within computer manufacturing and chemicals and pharmaceuticals manufacturing, about half of exports
are of final goods. However, two-thirds of exports in other manufacturing (medical devices) are final goods.
Within the information and comunications sector, most exports are final goods in the publishing sector.
Most exports are final goods in finance and insurance as well.
1.6. Role of MNEs in exporting
Exports of value added can be broken down into the part that is produced by foreign-owned firms and the
part that is produced by domestic firms to provide important insights into the role of MNEs in the growth in
Ireland’s trade surplus following the global financial crisis.11 Figure 1.15 shows that MNEs played a
significant role in the increase in Ireland’s export orientation; foreign-owned firms’ exports of value added
(sum of the green and cream bars) were equivalent to 23% of GDP in 2008 rising to 39% in 2015 while
domestic firms’ exports of value added varied between 24% and 27% over this time period.
The exports of domestic value added varied across sectors between 2005 and 2015. In manufacturing,
exports of value added more than doubled in chemicals and pharmaceuticals, more than tripled in other
manufacturing (medical devices) but were flat in computer manufacturing. In information and
communications, exports of value added more than quadrupled, with particularly strong growth in
publishing and in IT and other information services. Exports of value added in finance and insurance
increased slightly.
The exports of value added, for foreign owned firms, can be further broken down into labour compensation
and gross operating surplus (or profits) to provide insights into the source of this increase in the value of
exports.12 In Ireland, profits grew more than labour compensation; the share of profits in value added
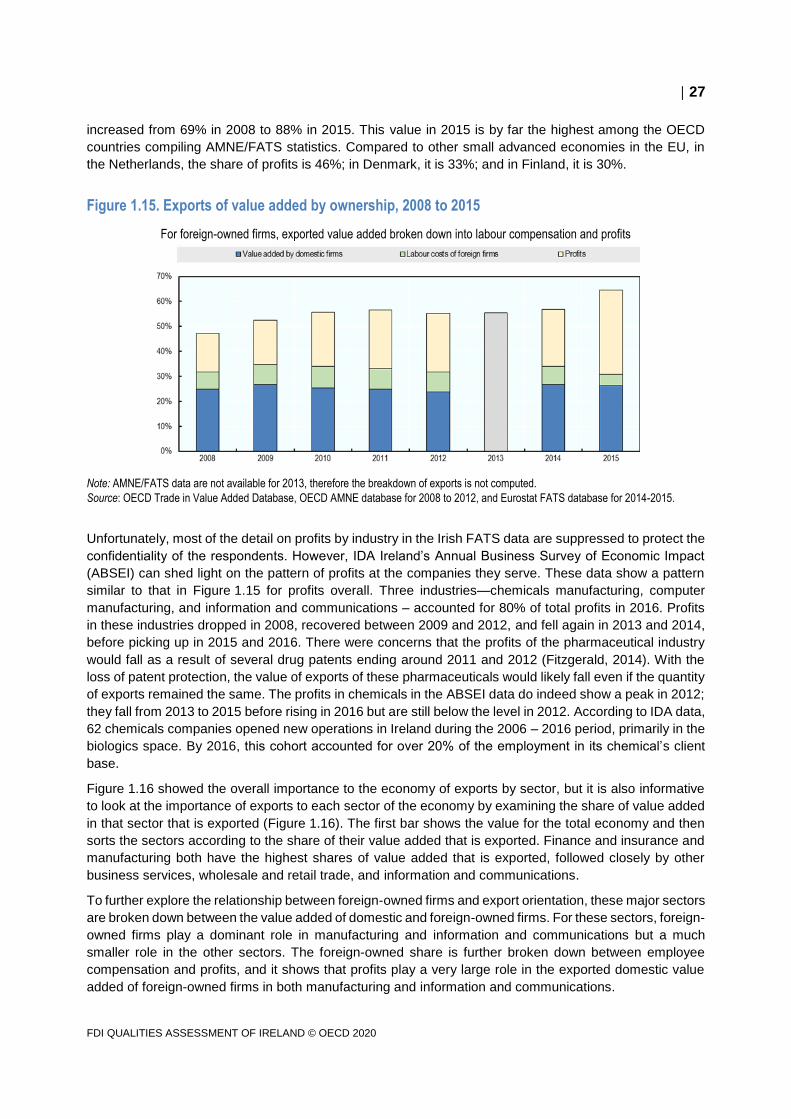
27
FDI QUALITIES ASSESSMENT OF IRELAND © OECD 2020
increased from 69% in 2008 to 88% in 2015. This value in 2015 is by far the highest among the OECD
countries compiling AMNE/FATS statistics. Compared to other small advanced economies in the EU, in
the Netherlands, the share of profits is 46%; in Denmark, it is 33%; and in Finland, it is 30%.
Figure 1.15. Exports of value added by ownership, 2008 to 2015
For foreign-owned firms, exported value added broken down into labour compensation and profits
Note: AMNE/FATS data are not available for 2013, therefore the breakdown of exports is not computed.
Source: OECD Trade in Value Added Database, OECD AMNE database for 2008 to 2012, and Eurostat FATS database for 2014-2015.
Unfortunately, most of the detail on profits by industry in the Irish FATS data are suppressed to protect the
confidentiality of the respondents. However, IDA Ireland’s Annual Business Survey of Economic Impact
(ABSEI) can shed light on the pattern of profits at the companies they serve. These data show a pattern
similar to that in Figure 1.15 for profits overall. Three industries—chemicals manufacturing, computer
manufacturing, and information and communications – accounted for 80% of total profits in 2016. Profits
in these industries dropped in 2008, recovered between 2009 and 2012, and fell again in 2013 and 2014,
before picking up in 2015 and 2016. There were concerns that the profits of the pharmaceutical industry
would fall as a result of several drug patents ending around 2011 and 2012 (Fitzgerald, 2014). With the
loss of patent protection, the value of exports of these pharmaceuticals would likely fall even if the quantity
of exports remained the same. The profits in chemicals in the ABSEI data do indeed show a peak in 2012;
they fall from 2013 to 2015 before rising in 2016 but are still below the level in 2012. According to IDA data,
62 chemicals companies opened new operations in Ireland during the 2006 – 2016 period, primarily in the
biologics space. By 2016, this cohort accounted for over 20% of the employment in its chemical’s client
base.
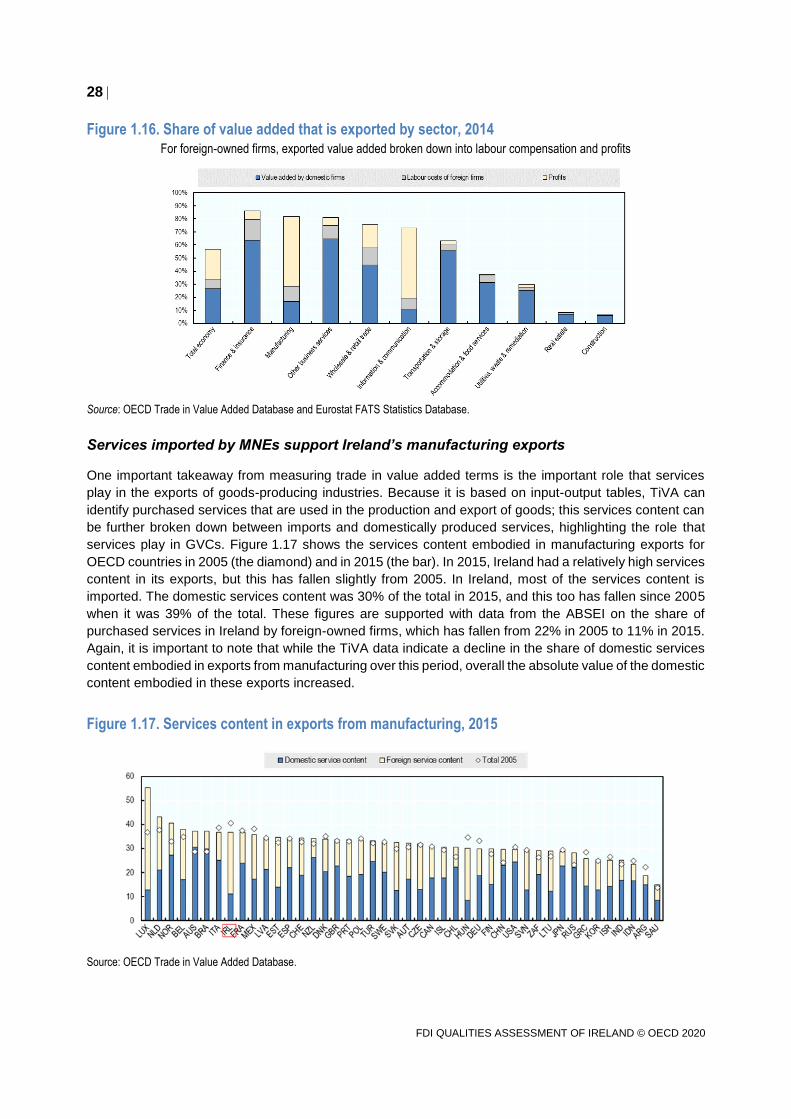
Figure 1.16 showed the overall importance to the economy of exports by sector, but it is also informative
to look at the importance of exports to each sector of the economy by examining the share of value added
in that sector that is exported (Figure 1.16). The first bar shows the value for the total economy and then
sorts the sectors according to the share of their value added that is exported. Finance and insurance and
manufacturing both have the highest shares of value added that is exported, followed closely by other
business services, wholesale and retail trade, and information and communications.
To further explore the relationship between foreign-owned firms and export orientation, these major sectors
are broken down between the value added of domestic and foreign-owned firms. For these sectors, foreign-
owned firms play a dominant role in manufacturing and information and communications but a much
smaller role in the other sectors. The foreign-owned share is further broken down between employee
compensation and profits, and it shows that profits play a very large role in the exported domestic value
added of foreign-owned firms in both manufacturing and information and communications.
28
FDI QUALITIES ASSESSMENT OF IRELAND © OECD 2020
Figure 1.16. Share of value added that is exported by sector, 2014 For foreign-owned firms, exported value added broken down into labour compensation and profits
Source: OECD Trade in Value Added Database and Eurostat FATS Statistics Database.
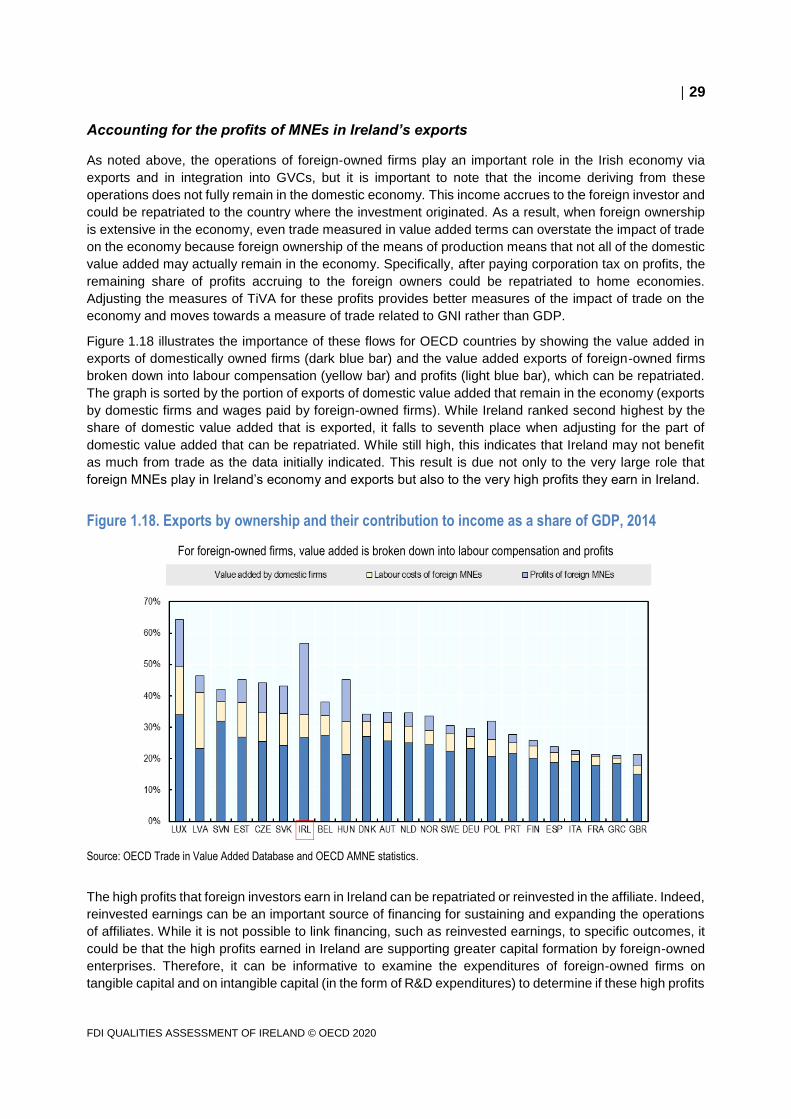
Services imported by MNEs support Ireland’s manufacturing exports
One important takeaway from measuring trade in value added terms is the important role that services
play in the exports of goods-producing industries. Because it is based on input-output tables, TiVA can
identify purchased services that are used in the production and export of goods; this services content can
be further broken down between imports and domestically produced services, highlighting the role that
services play in GVCs. Figure 1.17 shows the services content embodied in manufacturing exports for
OECD countries in 2005 (the diamond) and in 2015 (the bar). In 2015, Ireland had a relatively high services
content in its exports, but this has fallen slightly from 2005. In Ireland, most of the services content is
imported. The domestic services content was 30% of the total in 2015, and this too has fallen since 2005
when it was 39% of the total. These figures are supported with data from the ABSEI on the share of
purchased services in Ireland by foreign-owned firms, which has fallen from 22% in 2005 to 11% in 2015.
Again, it is important to note that while the TiVA data indicate a decline in the share of domestic services
content embodied in exports from manufacturing over this period, overall the absolute value of the domestic
content embodied in these exports increased.
Figure 1.17. Services content in exports from manufacturing, 2015
Source: OECD Trade in Value Added Database.
29
FDI QUALITIES ASSESSMENT OF IRELAND © OECD 2020
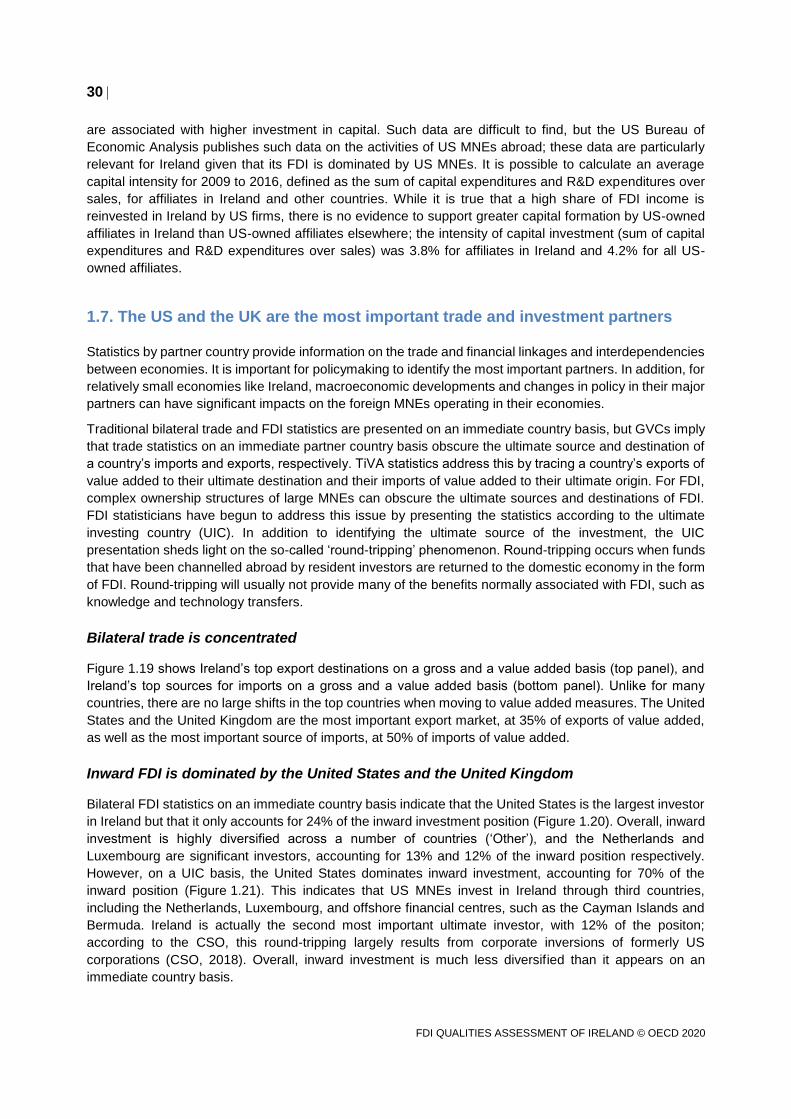
Accounting for the profits of MNEs in Ireland’s exports
As noted above, the operations of foreign-owned firms play an important role in the Irish economy via
exports and in integration into GVCs, but it is important to note that the income deriving from these
operations does not fully remain in the domestic economy. This income accrues to the foreign investor and
could be repatriated to the country where the investment originated. As a result, when foreign ownership
is extensive in the economy, even trade measured in value added terms can overstate the impact of trade
on the economy because foreign ownership of the means of production means that not all of the domestic
value added may actually remain in the economy. Specifically, after paying corporation tax on profits, the
remaining share of profits accruing to the foreign owners could be repatriated to home economies.
Adjusting the measures of TiVA for these profits provides better measures of the impact of trade on the
economy and moves towards a measure of trade related to GNI rather than GDP.
Figure 1.18 illustrates the importance of these flows for OECD countries by showing the value added in
exports of domestically owned firms (dark blue bar) and the value added exports of foreign-owned firms
broken down into labour compensation (yellow bar) and profits (light blue bar), which can be repatriated.
The graph is sorted by the portion of exports of domestic value added that remain in the economy (exports
by domestic firms and wages paid by foreign-owned firms). While Ireland ranked second highest by the
share of domestic value added that is exported, it falls to seventh place when adjusting for the part of
domestic value added that can be repatriated. While still high, this indicates that Ireland may not benefit
as much from trade as the data initially indicated. This result is due not only to the very large role that
foreign MNEs play in Ireland’s economy and exports but also to the very high profits they earn in Ireland.
Figure 1.18. Exports by ownership and their contribution to income as a share of GDP, 2014
For foreign-owned firms, value added is broken down into labour compensation and profits
Source: OECD Trade in Value Added Database and OECD AMNE statistics.
The high profits that foreign investors earn in Ireland can be repatriated or reinvested in the affiliate. Indeed,
reinvested earnings can be an important source of financing for sustaining and expanding the operations
of affiliates. While it is not possible to link financing, such as reinvested earnings, to specific outcomes, it
could be that the high profits earned in Ireland are supporting greater capital formation by foreign-owned
enterprises. Therefore, it can be informative to examine the expenditures of foreign-owned firms on
tangible capital and on intangible capital (in the form of R&D expenditures) to determine if these high profits
30
FDI QUALITIES ASSESSMENT OF IRELAND © OECD 2020
are associated with higher investment in capital. Such data are difficult to find, but the US Bureau of
Economic Analysis publishes such data on the activities of US MNEs abroad; these data are particularly
relevant for Ireland given that its FDI is dominated by US MNEs. It is possible to calculate an average
capital intensity for 2009 to 2016, defined as the sum of capital expenditures and R&D expenditures over
sales, for affiliates in Ireland and other countries. While it is true that a high share of FDI income is
reinvested in Ireland by US firms, there is no evidence to support greater capital formation by US-owned
affiliates in Ireland than US-owned affiliates elsewhere; the intensity of capital investment (sum of capital
expenditures and R&D expenditures over sales) was 3.8% for affiliates in Ireland and 4.2% for all US-
owned affiliates.
1.7. The US and the UK are the most important trade and investment partners
Statistics by partner country provide information on the trade and financial linkages and interdependencies
between economies. It is important for policymaking to identify the most important partners. In addition, for
relatively small economies like Ireland, macroeconomic developments and changes in policy in their major
partners can have significant impacts on the foreign MNEs operating in their economies.
Traditional bilateral trade and FDI statistics are presented on an immediate country basis, but GVCs imply
that trade statistics on an immediate partner country basis obscure the ultimate source and destination of
a country’s imports and exports, respectively. TiVA statistics address this by tracing a country’s exports of
value added to their ultimate destination and their imports of value added to their ultimate origin. For FDI,
complex ownership structures of large MNEs can obscure the ultimate sources and destinations of FDI.
FDI statisticians have begun to address this issue by presenting the statistics according to the ultimate
investing country (UIC). In addition to identifying the ultimate source of the investment, the UIC
presentation sheds light on the so-called ‘round-tripping’ phenomenon. Round-tripping occurs when funds
that have been channelled abroad by resident investors are returned to the domestic economy in the form
of FDI. Round-tripping will usually not provide many of the benefits normally associated with FDI, such as
knowledge and technology transfers.
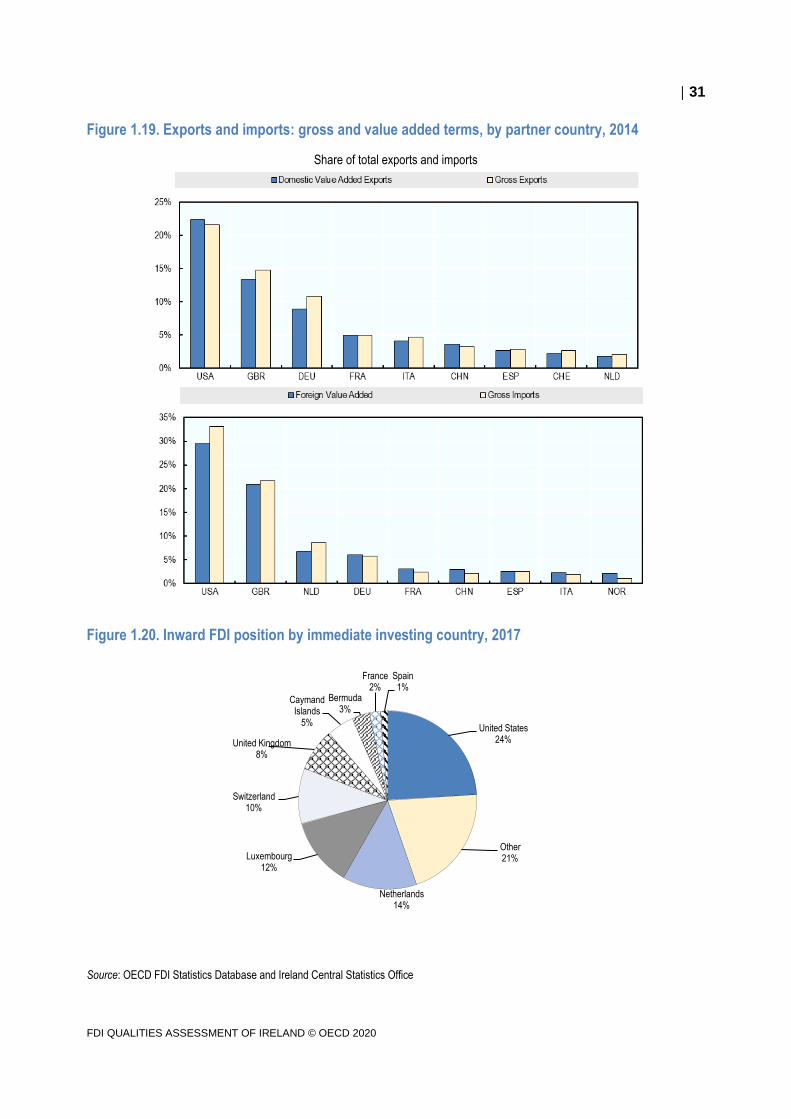
Bilateral trade is concentrated
Figure 1.19 shows Ireland’s top export destinations on a gross and a value added basis (top panel), and
Ireland’s top sources for imports on a gross and a value added basis (bottom panel). Unlike for many
countries, there are no large shifts in the top countries when moving to value added measures. The United
States and the United Kingdom are the most important export market, at 35% of exports of value added,
as well as the most important source of imports, at 50% of imports of value added.
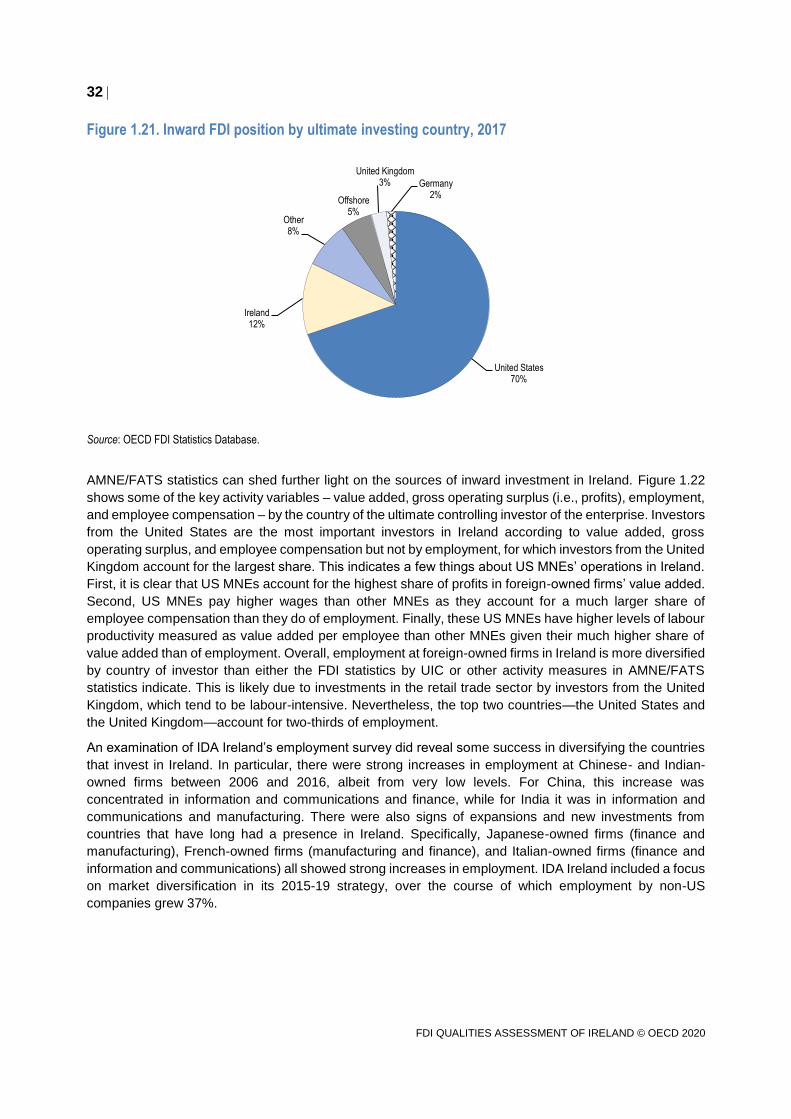
Inward FDI is dominated by the United States and the United Kingdom
Bilateral FDI statistics on an immediate country basis indicate that the United States is the largest investor
in Ireland but that it only accounts for 24% of the inward investment position (Figure 1.20). Overall, inward
investment is highly diversified across a number of countries (‘Other’), and the Netherlands and
Luxembourg are significant investors, accounting for 13% and 12% of the inward position respectively.
However, on a UIC basis, the United States dominates inward investment, accounting for 70% of the
inward position (Figure 1.21). This indicates that US MNEs invest in Ireland through third countries,
including the Netherlands, Luxembourg, and offshore financial centres, such as the Cayman Islands and
Bermuda. Ireland is actually the second most important ultimate investor, with 12% of the positon;
according to the CSO, this round-tripping largely results from corporate inversions of formerly US
corporations (CSO, 2018). Overall, inward investment is much less diversified than it appears on an
immediate country basis.
31
FDI QUALITIES ASSESSMENT OF IRELAND © OECD 2020
Figure 1.19. Exports and imports: gross and value added terms, by partner country, 2014
Share of total exports and imports
Figure 1.20. Inward FDI position by immediate investing country, 2017
Source: OECD FDI Statistics Database and Ireland Central Statistics Office
United States24%
Other21%
Netherlands14%
Luxembourg12%
Switzerland10%
United Kingdom8%
Caymand Islands
5%
Bermuda3%
France2%
Spain1%
32
FDI QUALITIES ASSESSMENT OF IRELAND © OECD 2020
Figure 1.21. Inward FDI position by ultimate investing country, 2017
Source: OECD FDI Statistics Database.
AMNE/FATS statistics can shed further light on the sources of inward investment in Ireland. Figure 1.22
shows some of the key activity variables – value added, gross operating surplus (i.e., profits), employment,
and employee compensation – by the country of the ultimate controlling investor of the enterprise. Investors
from the United States are the most important investors in Ireland according to value added, gross
operating surplus, and employee compensation but not by employment, for which investors from the United
Kingdom account for the largest share. This indicates a few things about US MNEs’ operations in Ireland.
First, it is clear that US MNEs account for the highest share of profits in foreign-owned firms’ value added.
Second, US MNEs pay higher wages than other MNEs as they account for a much larger share of
employee compensation than they do of employment. Finally, these US MNEs have higher levels of labour
productivity measured as value added per employee than other MNEs given their much higher share of
value added than of employment. Overall, employment at foreign-owned firms in Ireland is more diversified
by country of investor than either the FDI statistics by UIC or other activity measures in AMNE/FATS
statistics indicate. This is likely due to investments in the retail trade sector by investors from the United
Kingdom, which tend to be labour-intensive. Nevertheless, the top two countries—the United States and
the United Kingdom—account for two-thirds of employment.
An examination of IDA Ireland’s employment survey did reveal some success in diversifying the countries
that invest in Ireland. In particular, there were strong increases in employment at Chinese- and Indian-
owned firms between 2006 and 2016, albeit from very low levels. For China, this increase was
concentrated in information and communications and finance, while for India it was in information and
communications and manufacturing. There were also signs of expansions and new investments from
countries that have long had a presence in Ireland. Specifically, Japanese-owned firms (finance and
manufacturing), French-owned firms (manufacturing and finance), and Italian-owned firms (finance and
information and communications) all showed strong increases in employment. IDA Ireland included a focus
on market diversification in its 2015-19 strategy, over the course of which employment by non-US
companies grew 37%.
United States70%
Ireland12%
Other8%
Offshore5%
United Kingdom3% Germany
2%
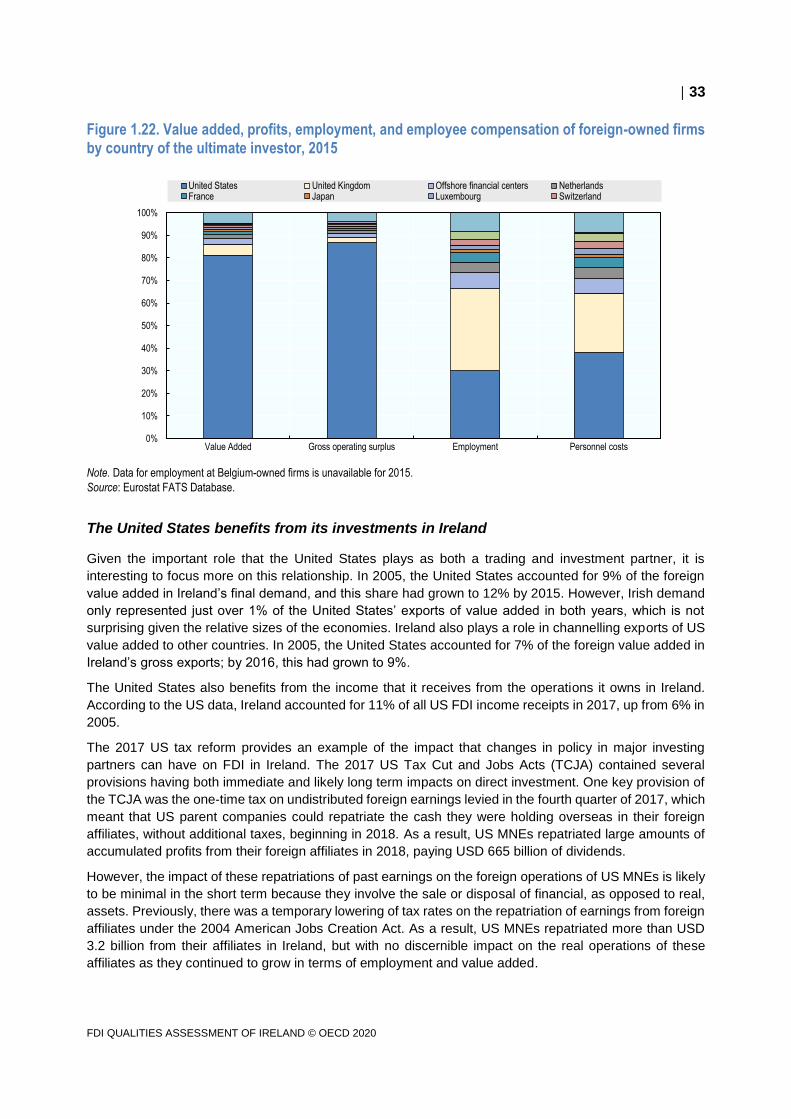
33
FDI QUALITIES ASSESSMENT OF IRELAND © OECD 2020
Figure 1.22. Value added, profits, employment, and employee compensation of foreign-owned firms by country of the ultimate investor, 2015
Note. Data for employment at Belgium-owned firms is unavailable for 2015.
Source: Eurostat FATS Database.
The United States benefits from its investments in Ireland
Given the important role that the United States plays as both a trading and investment partner, it is
interesting to focus more on this relationship. In 2005, the United States accounted for 9% of the foreign
value added in Ireland’s final demand, and this share had grown to 12% by 2015. However, Irish demand
only represented just over 1% of the United States’ exports of value added in both years, which is not
surprising given the relative sizes of the economies. Ireland also plays a role in channelling exports of US
value added to other countries. In 2005, the United States accounted for 7% of the foreign value added in
Ireland’s gross exports; by 2016, this had grown to 9%.
The United States also benefits from the income that it receives from the operations it owns in Ireland.
According to the US data, Ireland accounted for 11% of all US FDI income receipts in 2017, up from 6% in
2005.
The 2017 US tax reform provides an example of the impact that changes in policy in major investing
partners can have on FDI in Ireland. The 2017 US Tax Cut and Jobs Acts (TCJA) contained several
provisions having both immediate and likely long term impacts on direct investment. One key provision of
the TCJA was the one-time tax on undistributed foreign earnings levied in the fourth quarter of 2017, which
meant that US parent companies could repatriate the cash they were holding overseas in their foreign
affiliates, without additional taxes, beginning in 2018. As a result, US MNEs repatriated large amounts of
accumulated profits from their foreign affiliates in 2018, paying USD 665 billion of dividends.
However, the impact of these repatriations of past earnings on the foreign operations of US MNEs is likely
to be minimal in the short term because they involve the sale or disposal of financial, as opposed to real,
assets. Previously, there was a temporary lowering of tax rates on the repatriation of earnings from foreign
affiliates under the 2004 American Jobs Creation Act. As a result, US MNEs repatriated more than USD
3.2 billion from their affiliates in Ireland, but with no discernible impact on the real operations of these
affiliates as they continued to grow in terms of employment and value added.
0%
10%
20%
30%
40%
50%
60%
70%
80%
90%
100%
Value Added Gross operating surplus Employment Personnel costs
United States United Kingdom Offshore financial centers NetherlandsFrance Japan Luxembourg Switzerland
34
FDI QUALITIES ASSESSMENT OF IRELAND © OECD 2020
References
Alsamawi, A., et al. (2020), "Returns to intangible capital in global value chains: New evidence on trends and
policy determinants", OECD Trade Policy Papers, No. 240, OECD Publishing, Paris,
https://doi.org/10.1787/4cd06f19-en.
Cadestin, C., et al. (2019), "Multinational enterprises in domestic value chains", OECD Science, Technology
and Industry Policy Papers, No. 63, OECD Publishing, Paris, https://doi.org/10.1787/9abfa931-en.
Central Statistics Office (CSO) (2017), “Redomiciled PLCs in the Irish Balance of Payments”,
https://www.cso.ie/en/releasesandpublications/in/rpibp/redomiciledplcsintheirishbalanceofpayments/
Central Statistics Office (CSO) (2018), “Foreign Direct Investment Annual 2017”,
https://www.cso.ie/en/releasesandpublications/er/fdi/foreigndirectinvestmentannual2017/
Criscuolo, C. and Timmis, J. (2017), “The relationship between global value chains and productivity”,
International Productivity Monitor, vol. 32.
De Backer, K. and D. Flaig (2017), "The future of global value chains: Business as usual or “a new normal”?",
OECD Science, Technology and Industry Policy Papers, No. 41, OECD Publishing, Paris,
https://doi.org/10.1787/d8da8760-en.
De Backer, K. and S. Miroudot (2013), "Mapping Global Value Chains", OECD Trade Policy Papers, No. 159,
OECD Publishing, Paris, https://doi.org/10.1787/5k3v1trgnbr4-en.
Eden, Lorraine (2016), “Multinational and Foreign Investment Policies in a Digital World,” The E15 Initiative:
Strengthening the Global Trade and Investment System for Sustainable Development, February,
http://e15initiative.org/publications/multinationals-and-foreign-investment-policies-in-a-digital-world/.
Fitzgerald, J. (2014), “Ireland’s Recovery from Crisis“, CESifo Forum, ifo Institut – Leibniz-Institut fur
Wirtschaftsforschung an der Universitat Munchen, Vol. 15/2, pp. 8-13.
International Monetary Fund (2017), “IMF Country Report for Ireland”, IMF Country Report No. 17/172,
Washington, DC.
Jindra, B. (2006), “The theoretical framework: FDI and technology transfer”, in: Technology transfer via foreign
direct investment in Central and Eastern Europe, Palgrave.
Miroudot, S. and C. Cadestin (2017), "Services in Global Value Chains: Trade patterns and gains from
specialisation", OECD Trade Policy Papers, No. 208, OECD Publishing, Paris,
https://doi.org/10.1787/06420077-en.
OECD (2018), “The Changing Nature of International Production: Insights from the Trade in Value Added and
Related Indicators”, https://www.oecd.org/industry/ind/tiva-2018-flyer.pdf
OECD (2013), “Interconnected Economies: Benefiting from Global Value Chains”, OECD Publishing, Paris,
https://doi.org/10.1787/9789264189560-en.
OECD-UNIDO (2019), “Integrating Southeast Asian SMEs in Global Value Chains. Enabling Linkages with
Foreign Investors”, Paris. http://www.oecd.org/investment/Integrating-Southeast-Asian-SMEs-in-global-
value-chains.pdf
PricewaterhouseCoopers (2013), “Game Changer: A new kind of value chain for entertainment and media
companies”, https://www.pwc.fr/fr/assets/files/pdf/2014/01/pwc_value_chain.pdf
World Bank (2019), “Global Value Chain Development Report: Technological Innovation Supply Chain Trade,
and Workers in a Globalised World”, Washington, DC.
https://www.worldbank.org/en/topic/trade/publication/global-value-chain-development-report-2019
World Economic Forum (2019), “Global Future Council on International Trade and Investment, Four Scenarios for
the Future of Trade and Investment,”
www3.weforum.org/docs/WEF_Global_Future_Council_on_Trade_and_Investment_Crisis_Brief_2019.pdf
35
FDI QUALITIES ASSESSMENT OF IRELAND © OECD 2020
Annex 1.A. Methodology and data
Chapter 1 provides a macro-level analysis combining a number of data sources including IDA ABSEI, CSO
Ireland, Eurostat FATS, OECD TiVA, OECD FDI Statistics, OECD AMNE statistics, US Bureau of
Economic Analysis, and OECD National Accounts. Specifically, the estimations employ the following
variables from each source:
Exports, sales, value added, Irish- and non Irish- sourced materials, Irish- and non Irish- sourced
services by sector, from ABSEI;
Inward investment positions by Ultimate Investing Country, from several statistical releases13 from
the CSO;
Value added and Gross Operating Surplus from FATS (Eurostat)14;
Share of domestic value added embodied in foreign final demand (Indicator ‘VALU FFDDVA’) and
gross exports (EXGR) from the OECD TiVA 2018 release;
FDI Income payments and receipts by partner country and FDI positions by partner country, from
OECD FDI Statistics;
Value Added by industry of the affiliate in Ireland, from US BEA AMNE statistics; and
Gross value added and income by industry breakdowns, from OECD national accounts.
Some of the data required conversions using OECD annual period-average exchange rates. This annex
describes the different calculations required for the estimates and charts presented throughout the report.
All statistics were as of June 2019 unless otherwise indicated.
Exports by ownership and industry
Chapter 1 decomposes exports in value added terms into elements that ‘stick’ in the Irish economy and
elements that could be repatriated to the parent countries of foreign parents. In particular, wages paid by
foreign MNEs in Ireland stay in the Irish economy, as does the value added in exports by domestic firms.
On the other hand, profits from exports by MNEs could be repatriated to the home country if they are not
reinvested. This decomposition requires a number of estimation steps, as discussed in the following
sections.
Exports by ownership in value added terms
The methodology to estimate exports by foreign-owned and domestic firms in terms of value added. It
refers to data for the year 2014, the latest year with full data availability. The amount of foreign value added
in the Irish economy is assumed to apply also to exports of value added from the Irish economy. In this
sense, this method is an underestimation because foreign-owned firms are known to be more export
intensive than domestic firms.
These lower bound estimates are computed using inward FATS statistics for MNEs operating in Ireland,
by industry. Specifically, the method uses the ratio of value added controlled by ‘World total except for the
reporting country’ to ‘All countries of the world’. The estimates range from 10% in construction to 80% in
manufacturing. Then, this percentage is multiplied by the corresponding TiVA industry share of domestic
value added embodied in foreign final demand, to obtain a split of the value added by foreign and domestic
firms embodied in foreign demand.
36
FDI QUALITIES ASSESSMENT OF IRELAND © OECD 2020
These estimates, referred to as ‘value added by foreign firms embodied in foreign demand’, range from
1% in construction to 65% in manufacturing. The domestic counterpart – the part of value added in exports
that remains in the Irish economy – is obtained by subtraction. As FATS do not include data for the financial
sector, the estimate for this industry is imputed from other sources, namely CSO positions by Ultimate
Investing Country, US BEA data, and National Accounts.
The CSO data on inward FDI positions is used to calculate the proportion of stock that is controlled by the
United States as Ultimate Investing Country. Then, this percentage (~70% for 2015) is combined with the
BEA value added estimates for majority owned US affiliates operating in Ireland in the finance sector. This
is done to rescale the level of value added to obtain total value added by foreign-owned firms in the finance
sector. This number amounts to 26% of financial sector value added in the Irish national accounts data for
2015. Therefore, it is assumed that 26% of value added exports in the financial sector are by foreign-owned
firms. It should be remarked that for finance, an alternative approach was also tested, using IDA data for
value added. However, this estimate represented only 10% of national accounts financial value added and
was considered too low.
Profits
The first step is to tale the ratio of FATS (foreign firms) gross operating surplus to FATS (foreign firms)
value added by industry in Ireland. The results range from 22% for accommodation and food service
activities to 86% for IC. Then, this percentage is multiplied by the percentage estimate of value added by
foreign firms embodied in foreign demand by industry (described earlier). The resulting estimate represents
how much profit MNEs derive from their exporting activities in each sector. These shares range from 6%
in construction to 54% in IC.
Labour costs
Wages paid by foreign firms make up a component that sticks in the Irish economy. Labour costs by foreign
firms (embedded in exports, in value added terms) are calculated residually by subtracting profits from
value added by foreign firms embodied in foreign final demand.
Statistics and definitions
Several different sets of macroeconomic statistics are used in this chapter to understand the role that
MNEs play in the Irish economy.
Gross domestic product (GDP) is the market value of all the final goods and services produced in a country
in a given time period, typically a quarter or a year. GDP by industry are classified according to Statistical
Classification of Economic Activities in the European Community (NACE) Rev.2.
Gross national income (GNI) is GDP less income payments to the rest of the world plus income receipts
from the rest of the world. It used to be called gross national product (GNP) and represents the total
domestic and foreign output claimed by residents on a country.
Foreign direct investment (FDI) is defined as the establishment of a lasting interest in and significant degree
of influence over the operations of an enterprise in one economy by an investor in another economy. FDI
statistics consist of financial flows, income, and positions. FDI financial flows capture debt and equity
investments between related parties in a specific period. Income represents the return on equity and debt
investment to the direct investor in a specific period. Positions are the value of the accumulated direct
investment at a specific point in time—it is also referred to as the stock of FDI. The most recent aggregate
statistics are available through 2018 while the most recent detail by partner country and by industry is for
2017. The industry classification is based on International Standard Industry Classification (ISIC) Rev. 4.
37
FDI QUALITIES ASSESSMENT OF IRELAND © OECD 2020
AMNE/FATS statistics cover the operations of majority-owned foreign affiliates, including turnover, value
added, employment, employee compensation, and gross operating surplus. Inward data cover the
operations of foreign-controlled firms in the reporting economy, and outward data cover foreign firms
controlled by residents of the reporting economy. These statistics are not available for all members of the
OECD, and the most recent data are only available for EU countries. The most recent year available is
2015 as the 2016 inward FATS data published by the CSO only covered the 50 largest MNEs operating in
Ireland. Due to significant suppressions to the industry detail to protect the confidentiality of respondents,
2014 is often the latest year for which industry detail is available. The statistics are classified by industry
according to NACE Rev. 2.
Gross trade statistics from the Balance of Payments are defined as change in ownership of material
resources and services between one economy and another. Data are available through the end of 2018
and are classified by product.
Trade in Value Added (TiVA) measures the value added by each country in the production of goods and
services that are consumed worldwide. TiVA indicators are designed to better inform policy makers by
providing new insights into the commercial relations between nations. Two key TiVA indicators discussed
in this report measure the export orientation of an economy and its participation in GVCs. Export orientation
is the share of a country’s GDP that is exported. GVC participation is measured as the foreign value added
embodied in a country’s exports (that is, its backward linkages) plus its value added embodied in partners’
exports and final demand (that is forward linkages). A full set of TiVA indicators is available from 2005 to
2015; a few indicators are available for 2016. The industry classification is based on ISIC Rev. 4.
Differences in classifications, coverage, and definitions can make it difficult to use these sets of statistics
together, so assumptions have been made. This chapter uses conservative assumptions and looks for
multiple pieces of evidence to support the conclusions.
Notes
1 This uses a suite of official statistics, including GDP, trade, and FDI statistics, as well as statistics that
have been developed to better understand the impact of MNEs on economies, including Activities of
Multinational Enterprises/Foreign Affiliate Statistics (AMNE/FATS) and trade in value added (TiVA)
statistics (see Annex 1.A for a description of the statistics). It also uses data that IDA Ireland collects from
the firms that it serves.
2 Domestic MNEs are MNEs headquartered in the domestic economy and domestic plants of these groups.
Domestic non-MNEs are domestic firms that do not fall in this category. As in Ireland, SMEs account for
the bulk of domestic companies, and, so, non-MNEs include mostly SMEs.
3 The comparison of FDI stocks to GDP is a useful lens to gauge the importance of FDI to an economy.
The measure excludes FDI into special purpose entities (SPEs). SPEs are entities with little physical
presence in their host economy but that play an important role in the financing structures of MNEs.
Excluding SPEs provides a better measure of the FDI into an economy that is having a real impact on that
economy.

38
FDI QUALITIES ASSESSMENT OF IRELAND © OECD 2020
4 FDI income receipts are the earnings and net interest direct investors in the reporting economy receive
from their foreign direct investment enterprises; FDI income payments are the earnings and net interest
direct investment enterprises in the reporting economy pay their foreign investors.
5 Authors’ calculations using the latest inward FATS data for Ireland from Eurostat. Figures exclude the
agriculture and finance sectors as these are not covered by AMNE/FATS statistics.
6 By definition, the balance on trade measured in value added terms is equal to the balance on trade
measured in gross terms.
7 In standard trade statistics, the margins wholesalers and retailers earn on exports are included
indistinguishably in the value of goods exported. However, because TiVA relies on input output tables, it
identifies these margins in the value of exports and attributes these margins to the wholesale and retail
trade industries. As a result, the value of services exports in TiVA is higher than in traditional trade statistics
while the value of goods exports is lower as these margins are recognised as distributive services. It also
highlights the role that wholesalers and retailers play in the exporting of goods.
8 The decline in 2015 for Ireland reflects the impact of contract manufacturing (see Box 2.1)
9 Part of foreign affiliates’ value added is used to pay salaries of their (mostly local) employees and
therefore ‘stays’ in the domestic economy. The remaining part, including earnings, may or may not leave
the host economy.
10 Buyer-driven GVCs are those in which the lead firm is either a large retailer or a branded merchandiser
that has outsourced the production process and captures value in the distribution stage.
11 The method for breaking down trade in value added into the parts accounted for by foreign-owned firms
and that by domestic firms is explained in Annex 1.A
12 Value added can be measured from the production side as output less purchased inputs or from the
cost side as the sum of labour compensation, depreciation costs, and profits. The latter two elements,
called gross operating surplus, represent the income from capital; for ease of understanding, this is referred
to as profits in the text.
13 See for example: https://www.cso.ie/en/releasesandpublications/er/fdi/foreigndirectinvestment
annual2016/
14 OECD AMNE also include statistics for Ireland, however, Eurostat reports the most recent data.
39
FDI QUALITIES ASSESSMENT OF IRELAND © OECD 2020
This chapter examines the role of FDI on productivity, R&D expenditures and
labour market outcomes such as employment growth and wages in Ireland.
It first clarifies the distribution of FDI across sectors, also mentioning how FDI
concentrates geographically within Ireland. The chapter then compares
economic outcomes in FDI-intensive sectors with those in sectors exposed
to less foreign firm activity. It shows that sectors dominated by foreign firms
have higher productivity, R&D expenditures and employment growth and pay
better wages. The chapter also examines how FDI-intensive sectors have
contributed to the economic recovery from the financial crisis – in terms of
value added, innovation capacity and employment.
2. The role of FDI for productivity and
labour market outcomes
40
FDI QUALITIES ASSESSMENT OF IRELAND © OECD 2020
2.1. Summary
Foreign MNEs are highly concentrated in just a few sectors in Ireland, regardless of the data used to
conduct the analysis (FATS, official FDI data, IDA’s Annual Business Survey of Economic Impact).
According to IDA’s Annual Business Survey, for example, almost 80% of total value added by foreign firms
is concentrated in only three sectors: information and communications (IC) services, chemicals and
electronics. Firms in these sectors strongly rely on agglomeration and urban centres, resulting in a high
concentration of foreign firm activity in Dublin which attracts 40% of foreign firm value added in Ireland.
Although the 60% of foreign firm value added outside of Dublin is also notable considering the lack of major
urban centres of scale in the country other than the capital city.
Sectors dominated by foreign firms in Ireland are also those that involve higher value added activities and
engage more in R&D activities relative to those sectors with less FDI. Similarly, FDI is concentrated in
sectors with higher employment growth and wages, where the latter also reflects higher skill intensity in
generally more sophisticated sectors such as information and communications and manufacturing
activities, as physical production has shifted abroad, leaving foreign affiliates in Ireland to manage supply
chains. FDI, thus, plays an important role for Ireland’s economic sophistication and productivity.
Foreign affiliates also provided important support to the economic recovery from the financial crisis,
especially in the information and communications sector, as production and employment in this sector
grew throughout the recession. FDI also helped shift the economy to higher value added and higher paying
services, not only in the information and communications sector, but also in services related to contract
manufacturing and in finance and insurance. Together, these three FDI-intensive sectors accounted for
52% of Irish GDP in 2006, up from 39% in 2006. This shift to services boosted economic growth and labour
productivity.
2.2. FDI is highly concentrated in terms of sectors and geography
Before explaining how FDI relates to outcomes such as productivity, innovation, jobs and wages, it is
important to clarify the distribution of FDI across sectors and geography in Ireland. The analysis using
Eurostat’s FATS, official FDI data and IDA’s Annual Business Survey shows that FDI is concentrated in
just a few sectors, and Dublin and the rest of South and East, where the majority of the workforce is located,
host the majority of foreign affiliates in Ireland.
According to the FATS data, foreign MNEs in manufacturing, information and communications, and
wholesale and retail trade account for 90% of value added, 95% of profits, and 66% of employment of
foreign-owned firms in Ireland. In 2016, the CSO published inward FATS data for the 50 largest MNEs,
allowing a comparison with the aggregate data for 2015 to get an idea of how much of FDI activity is
concentrated in these 50 largest MNEs. The 2016 value added for these 50 largest MNEs was equal to
77% of the value added of all foreign MNEs in 2015, and their profits were equal to 80% of the profits of
all MNEs. Employment appears to be somewhat less concentrated in these largest firms as their 2016
employment was only equal to 50% of the 2015 employment of all MNEs. Thus, the labour productivity of
these large MNEs is higher than the rest of the MNEs, and they include those foreign MNEs operating at
the global productivity frontier as discussed in Chapter 3.
FDI data are somewhat more diversified by industry. For 2017, the manufacturing sector accounted for
37% of the total inward position, with chemicals the largest manufacturing industry. Manufacturing was
closely followed by the finance and insurance sector, accounting for 30% of the position. The next largest
industries were professional, scientific, and technical services (13%); administrative and support services
(8%); wholesale and retail trade (6%); and the information and communications sector (5%).
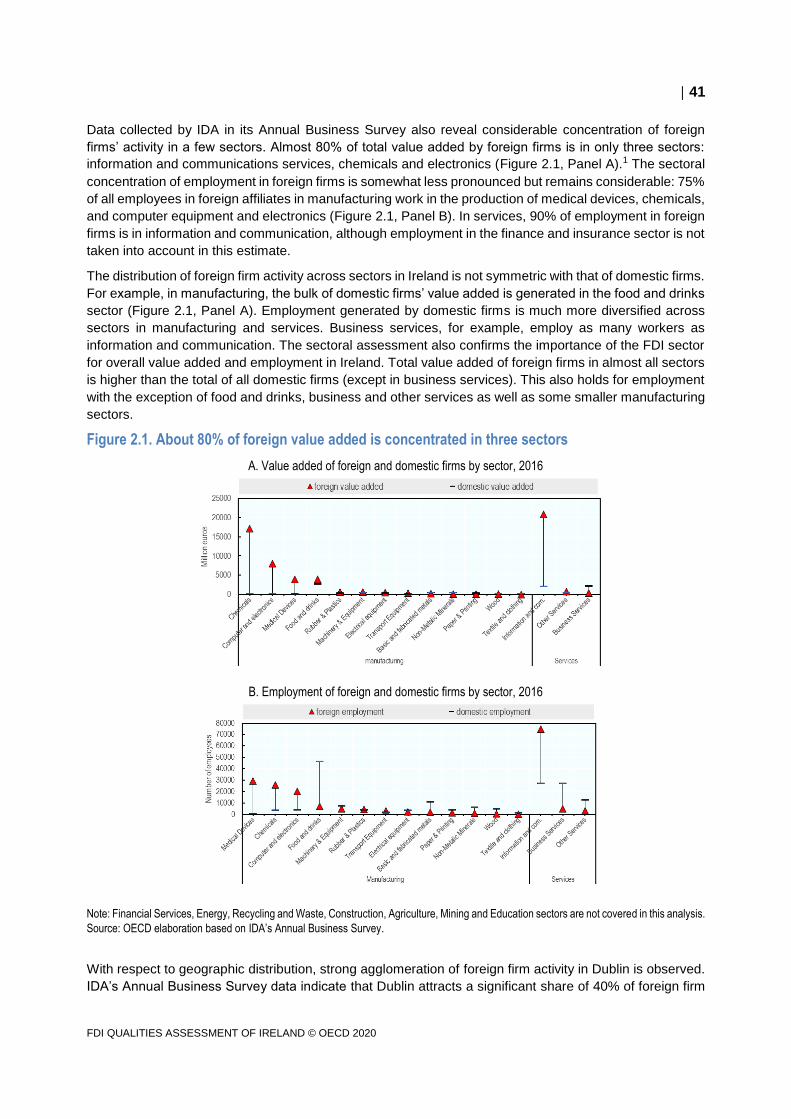
41
FDI QUALITIES ASSESSMENT OF IRELAND © OECD 2020
Data collected by IDA in its Annual Business Survey also reveal considerable concentration of foreign
firms’ activity in a few sectors. Almost 80% of total value added by foreign firms is in only three sectors:
information and communications services, chemicals and electronics (Figure 2.1, Panel A).1 The sectoral
concentration of employment in foreign firms is somewhat less pronounced but remains considerable: 75%
of all employees in foreign affiliates in manufacturing work in the production of medical devices, chemicals,
and computer equipment and electronics (Figure 2.1, Panel B). In services, 90% of employment in foreign
firms is in information and communication, although employment in the finance and insurance sector is not
taken into account in this estimate.
The distribution of foreign firm activity across sectors in Ireland is not symmetric with that of domestic firms.
For example, in manufacturing, the bulk of domestic firms’ value added is generated in the food and drinks
sector (Figure 2.1, Panel A). Employment generated by domestic firms is much more diversified across
sectors in manufacturing and services. Business services, for example, employ as many workers as
information and communication. The sectoral assessment also confirms the importance of the FDI sector
for overall value added and employment in Ireland. Total value added of foreign firms in almost all sectors
is higher than the total of all domestic firms (except in business services). This also holds for employment
with the exception of food and drinks, business and other services as well as some smaller manufacturing
sectors.
Figure 2.1. About 80% of foreign value added is concentrated in three sectors
A. Value added of foreign and domestic firms by sector, 2016
B. Employment of foreign and domestic firms by sector, 2016
Note: Financial Services, Energy, Recycling and Waste, Construction, Agriculture, Mining and Education sectors are not covered in this analysis.
Source: OECD elaboration based on IDA’s Annual Business Survey.
With respect to geographic distribution, strong agglomeration of foreign firm activity in Dublin is observed.
IDA’s Annual Business Survey data indicate that Dublin attracts a significant share of 40% of foreign firm
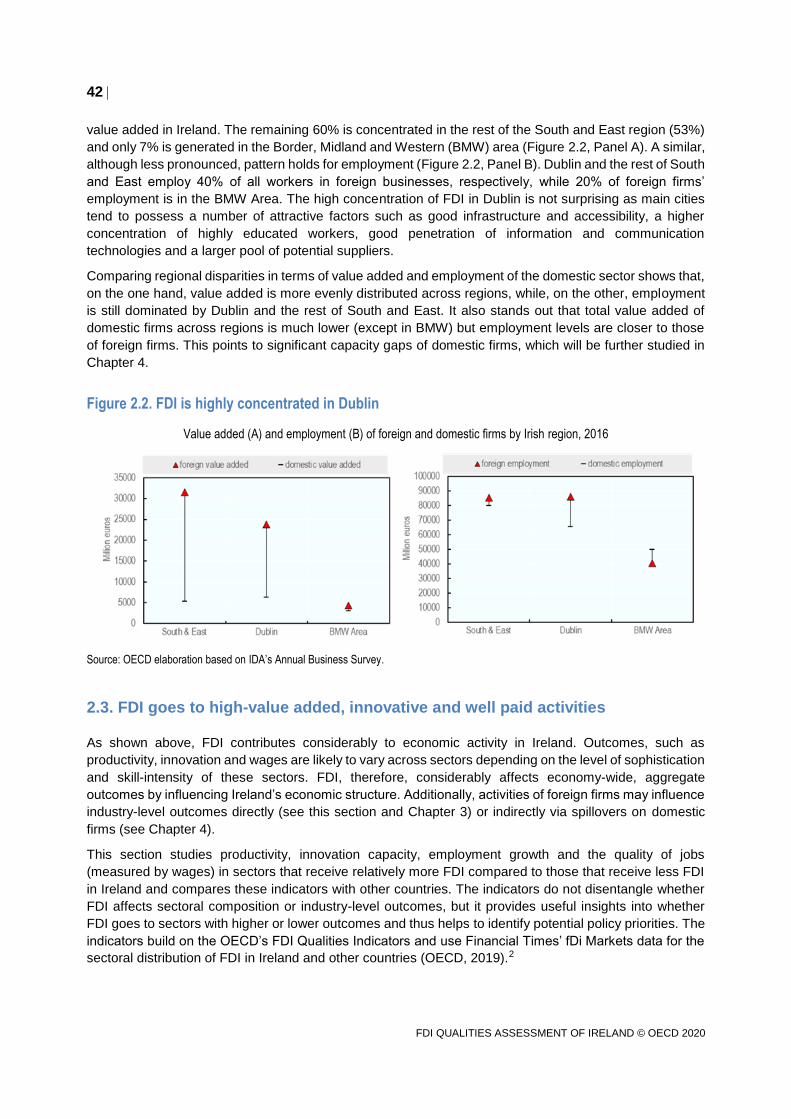
42
FDI QUALITIES ASSESSMENT OF IRELAND © OECD 2020
value added in Ireland. The remaining 60% is concentrated in the rest of the South and East region (53%)
and only 7% is generated in the Border, Midland and Western (BMW) area (Figure 2.2, Panel A). A similar,
although less pronounced, pattern holds for employment (Figure 2.2, Panel B). Dublin and the rest of South
and East employ 40% of all workers in foreign businesses, respectively, while 20% of foreign firms’
employment is in the BMW Area. The high concentration of FDI in Dublin is not surprising as main cities
tend to possess a number of attractive factors such as good infrastructure and accessibility, a higher
concentration of highly educated workers, good penetration of information and communication
technologies and a larger pool of potential suppliers.
Comparing regional disparities in terms of value added and employment of the domestic sector shows that,
on the one hand, value added is more evenly distributed across regions, while, on the other, employment
is still dominated by Dublin and the rest of South and East. It also stands out that total value added of
domestic firms across regions is much lower (except in BMW) but employment levels are closer to those
of foreign firms. This points to significant capacity gaps of domestic firms, which will be further studied in
Chapter 4.
Figure 2.2. FDI is highly concentrated in Dublin
Value added (A) and employment (B) of foreign and domestic firms by Irish region, 2016
Source: OECD elaboration based on IDA’s Annual Business Survey.
2.3. FDI goes to high-value added, innovative and well paid activities
As shown above, FDI contributes considerably to economic activity in Ireland. Outcomes, such as
productivity, innovation and wages are likely to vary across sectors depending on the level of sophistication
and skill-intensity of these sectors. FDI, therefore, considerably affects economy-wide, aggregate
outcomes by influencing Ireland’s economic structure. Additionally, activities of foreign firms may influence
industry-level outcomes directly (see this section and Chapter 3) or indirectly via spillovers on domestic
firms (see Chapter 4).
This section studies productivity, innovation capacity, employment growth and the quality of jobs
(measured by wages) in sectors that receive relatively more FDI compared to those that receive less FDI
in Ireland and compares these indicators with other countries. The indicators do not disentangle whether
FDI affects sectoral composition or industry-level outcomes, but it provides useful insights into whether
FDI goes to sectors with higher or lower outcomes and thus helps to identify potential policy priorities. The
indicators build on the OECD’s FDI Qualities Indicators and use Financial Times’ fDi Markets data for the
sectoral distribution of FDI in Ireland and other countries (OECD, 2019).2
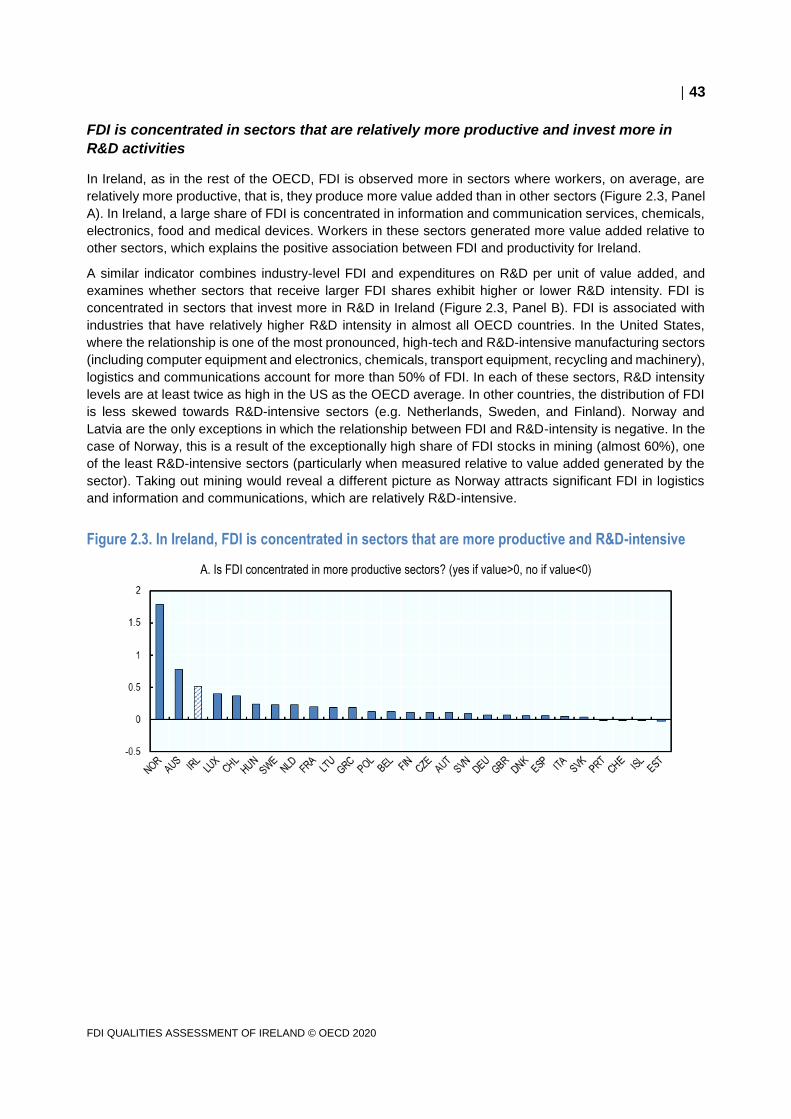
43
FDI QUALITIES ASSESSMENT OF IRELAND © OECD 2020
FDI is concentrated in sectors that are relatively more productive and invest more in
R&D activities
In Ireland, as in the rest of the OECD, FDI is observed more in sectors where workers, on average, are
relatively more productive, that is, they produce more value added than in other sectors (Figure 2.3, Panel
A). In Ireland, a large share of FDI is concentrated in information and communication services, chemicals,
electronics, food and medical devices. Workers in these sectors generated more value added relative to
other sectors, which explains the positive association between FDI and productivity for Ireland.
A similar indicator combines industry-level FDI and expenditures on R&D per unit of value added, and
examines whether sectors that receive larger FDI shares exhibit higher or lower R&D intensity. FDI is
concentrated in sectors that invest more in R&D in Ireland (Figure 2.3, Panel B). FDI is associated with
industries that have relatively higher R&D intensity in almost all OECD countries. In the United States,
where the relationship is one of the most pronounced, high-tech and R&D-intensive manufacturing sectors
(including computer equipment and electronics, chemicals, transport equipment, recycling and machinery),
logistics and communications account for more than 50% of FDI. In each of these sectors, R&D intensity
levels are at least twice as high in the US as the OECD average. In other countries, the distribution of FDI
is less skewed towards R&D-intensive sectors (e.g. Netherlands, Sweden, and Finland). Norway and
Latvia are the only exceptions in which the relationship between FDI and R&D-intensity is negative. In the
case of Norway, this is a result of the exceptionally high share of FDI stocks in mining (almost 60%), one
of the least R&D-intensive sectors (particularly when measured relative to value added generated by the
sector). Taking out mining would reveal a different picture as Norway attracts significant FDI in logistics
and information and communications, which are relatively R&D-intensive.
Figure 2.3. In Ireland, FDI is concentrated in sectors that are more productive and R&D-intensive
A. Is FDI concentrated in more productive sectors? (yes if value>0, no if value<0)
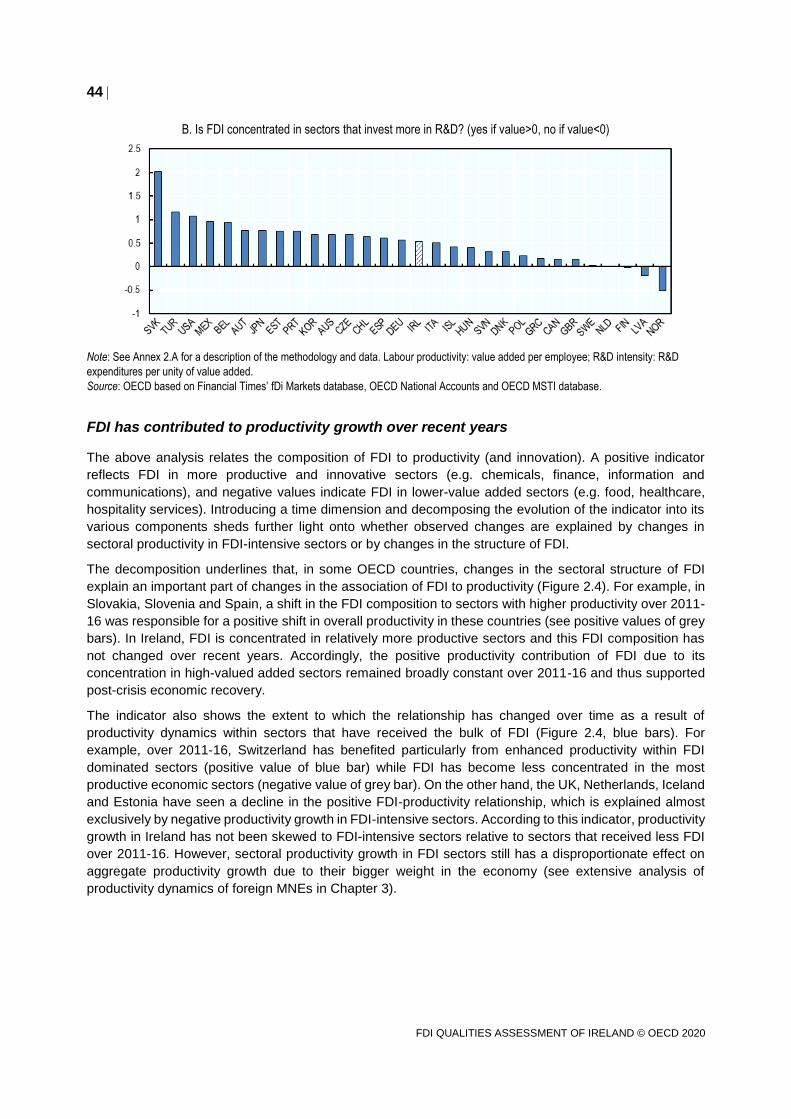
44
FDI QUALITIES ASSESSMENT OF IRELAND © OECD 2020
B. Is FDI concentrated in sectors that invest more in R&D? (yes if value>0, no if value<0)
Note: See Annex 2.A for a description of the methodology and data. Labour productivity: value added per employee; R&D intensity: R&D
expenditures per unity of value added.
Source: OECD based on Financial Times’ fDi Markets database, OECD National Accounts and OECD MSTI database.
FDI has contributed to productivity growth over recent years
The above analysis relates the composition of FDI to productivity (and innovation). A positive indicator
reflects FDI in more productive and innovative sectors (e.g. chemicals, finance, information and
communications), and negative values indicate FDI in lower-value added sectors (e.g. food, healthcare,
hospitality services). Introducing a time dimension and decomposing the evolution of the indicator into its
various components sheds further light onto whether observed changes are explained by changes in
sectoral productivity in FDI-intensive sectors or by changes in the structure of FDI.
The decomposition underlines that, in some OECD countries, changes in the sectoral structure of FDI
explain an important part of changes in the association of FDI to productivity (Figure 2.4). For example, in
Slovakia, Slovenia and Spain, a shift in the FDI composition to sectors with higher productivity over 2011-
16 was responsible for a positive shift in overall productivity in these countries (see positive values of grey
bars). In Ireland, FDI is concentrated in relatively more productive sectors and this FDI composition has
not changed over recent years. Accordingly, the positive productivity contribution of FDI due to its
concentration in high-valued added sectors remained broadly constant over 2011-16 and thus supported
post-crisis economic recovery.
The indicator also shows the extent to which the relationship has changed over time as a result of
productivity dynamics within sectors that have received the bulk of FDI (Figure 2.4, blue bars). For
example, over 2011-16, Switzerland has benefited particularly from enhanced productivity within FDI
dominated sectors (positive value of blue bar) while FDI has become less concentrated in the most
productive economic sectors (negative value of grey bar). On the other hand, the UK, Netherlands, Iceland
and Estonia have seen a decline in the positive FDI-productivity relationship, which is explained almost
exclusively by negative productivity growth in FDI-intensive sectors. According to this indicator, productivity
growth in Ireland has not been skewed to FDI-intensive sectors relative to sectors that received less FDI
over 2011-16. However, sectoral productivity growth in FDI sectors still has a disproportionate effect on
aggregate productivity growth due to their bigger weight in the economy (see extensive analysis of
productivity dynamics of foreign MNEs in Chapter 3).
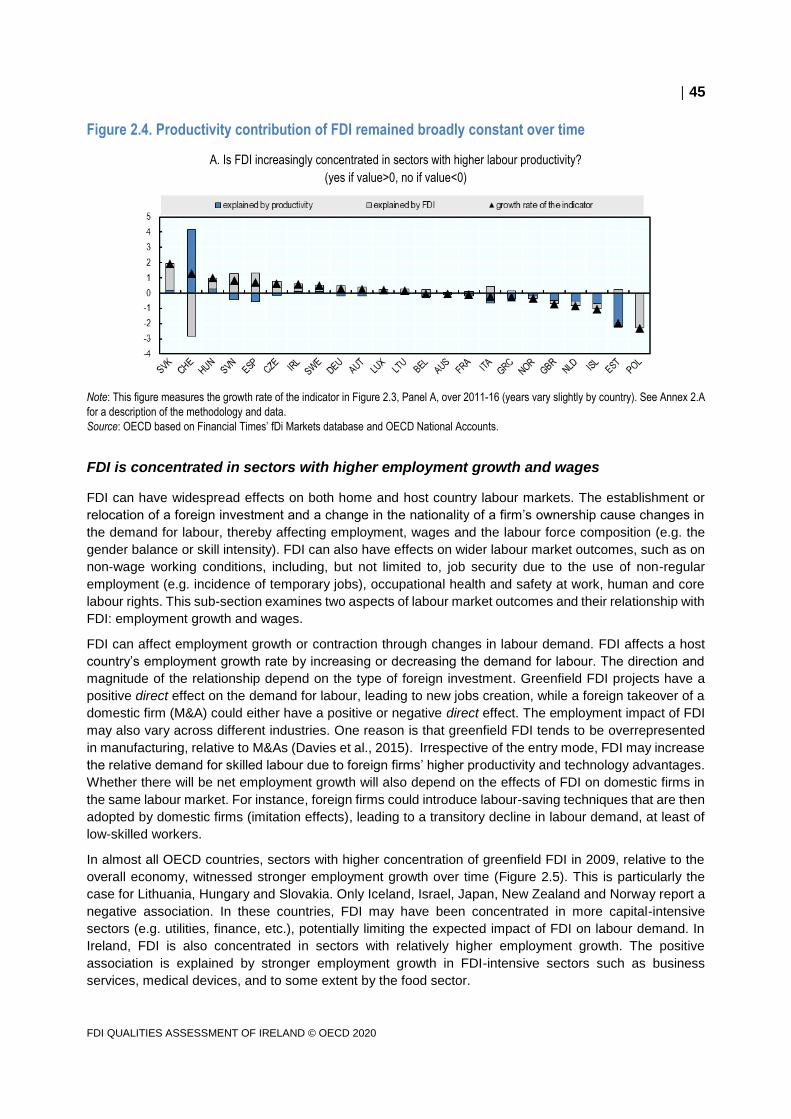
45
FDI QUALITIES ASSESSMENT OF IRELAND © OECD 2020
Figure 2.4. Productivity contribution of FDI remained broadly constant over time
A. Is FDI increasingly concentrated in sectors with higher labour productivity?
(yes if value>0, no if value<0)
Note: This figure measures the growth rate of the indicator in Figure 2.3, Panel A, over 2011-16 (years vary slightly by country). See Annex 2.A
for a description of the methodology and data.
Source: OECD based on Financial Times’ fDi Markets database and OECD National Accounts.
FDI is concentrated in sectors with higher employment growth and wages
FDI can have widespread effects on both home and host country labour markets. The establishment or
relocation of a foreign investment and a change in the nationality of a firm’s ownership cause changes in
the demand for labour, thereby affecting employment, wages and the labour force composition (e.g. the
gender balance or skill intensity). FDI can also have effects on wider labour market outcomes, such as on
non-wage working conditions, including, but not limited to, job security due to the use of non-regular
employment (e.g. incidence of temporary jobs), occupational health and safety at work, human and core
labour rights. This sub-section examines two aspects of labour market outcomes and their relationship with
FDI: employment growth and wages.
FDI can affect employment growth or contraction through changes in labour demand. FDI affects a host
country’s employment growth rate by increasing or decreasing the demand for labour. The direction and
magnitude of the relationship depend on the type of foreign investment. Greenfield FDI projects have a
positive direct effect on the demand for labour, leading to new jobs creation, while a foreign takeover of a
domestic firm (M&A) could either have a positive or negative direct effect. The employment impact of FDI
may also vary across different industries. One reason is that greenfield FDI tends to be overrepresented
in manufacturing, relative to M&As (Davies et al., 2015). Irrespective of the entry mode, FDI may increase
the relative demand for skilled labour due to foreign firms’ higher productivity and technology advantages.
Whether there will be net employment growth will also depend on the effects of FDI on domestic firms in
the same labour market. For instance, foreign firms could introduce labour-saving techniques that are then
adopted by domestic firms (imitation effects), leading to a transitory decline in labour demand, at least of
low-skilled workers.
In almost all OECD countries, sectors with higher concentration of greenfield FDI in 2009, relative to the
overall economy, witnessed stronger employment growth over time (Figure 2.5). This is particularly the
case for Lithuania, Hungary and Slovakia. Only Iceland, Israel, Japan, New Zealand and Norway report a
negative association. In these countries, FDI may have been concentrated in more capital-intensive
sectors (e.g. utilities, finance, etc.), potentially limiting the expected impact of FDI on labour demand. In
Ireland, FDI is also concentrated in sectors with relatively higher employment growth. The positive
association is explained by stronger employment growth in FDI-intensive sectors such as business
services, medical devices, and to some extent by the food sector.
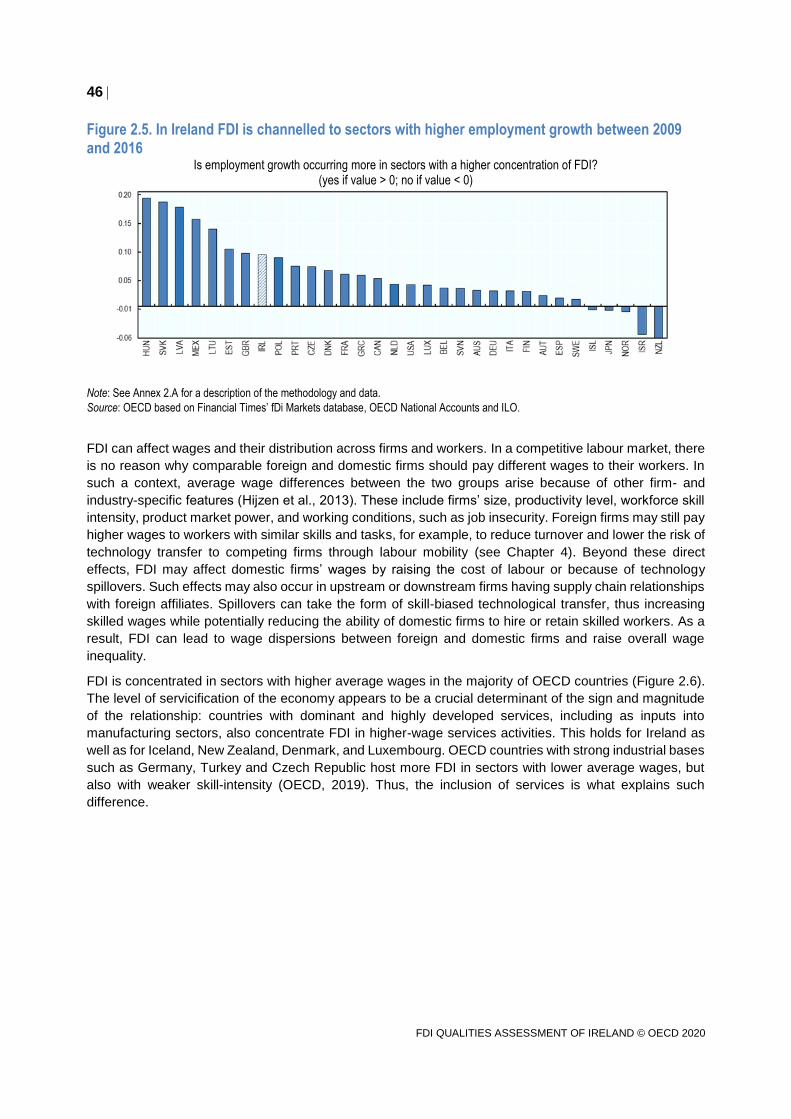
46
FDI QUALITIES ASSESSMENT OF IRELAND © OECD 2020
Figure 2.5. In Ireland FDI is channelled to sectors with higher employment growth between 2009 and 2016
Is employment growth occurring more in sectors with a higher concentration of FDI? (yes if value > 0; no if value < 0)
Note: See Annex 2.A for a description of the methodology and data.
Source: OECD based on Financial Times’ fDi Markets database, OECD National Accounts and ILO.
FDI can affect wages and their distribution across firms and workers. In a competitive labour market, there
is no reason why comparable foreign and domestic firms should pay different wages to their workers. In
such a context, average wage differences between the two groups arise because of other firm- and
industry-specific features (Hijzen et al., 2013). These include firms’ size, productivity level, workforce skill
intensity, product market power, and working conditions, such as job insecurity. Foreign firms may still pay
higher wages to workers with similar skills and tasks, for example, to reduce turnover and lower the risk of
technology transfer to competing firms through labour mobility (see Chapter 4). Beyond these direct
effects, FDI may affect domestic firms’ wages by raising the cost of labour or because of technology
spillovers. Such effects may also occur in upstream or downstream firms having supply chain relationships
with foreign affiliates. Spillovers can take the form of skill-biased technological transfer, thus increasing
skilled wages while potentially reducing the ability of domestic firms to hire or retain skilled workers. As a
result, FDI can lead to wage dispersions between foreign and domestic firms and raise overall wage
inequality.
FDI is concentrated in sectors with higher average wages in the majority of OECD countries (Figure 2.6).
The level of servicification of the economy appears to be a crucial determinant of the sign and magnitude
of the relationship: countries with dominant and highly developed services, including as inputs into
manufacturing sectors, also concentrate FDI in higher-wage services activities. This holds for Ireland as
well as for Iceland, New Zealand, Denmark, and Luxembourg. OECD countries with strong industrial bases
such as Germany, Turkey and Czech Republic host more FDI in sectors with lower average wages, but
also with weaker skill-intensity (OECD, 2019). Thus, the inclusion of services is what explains such
difference.
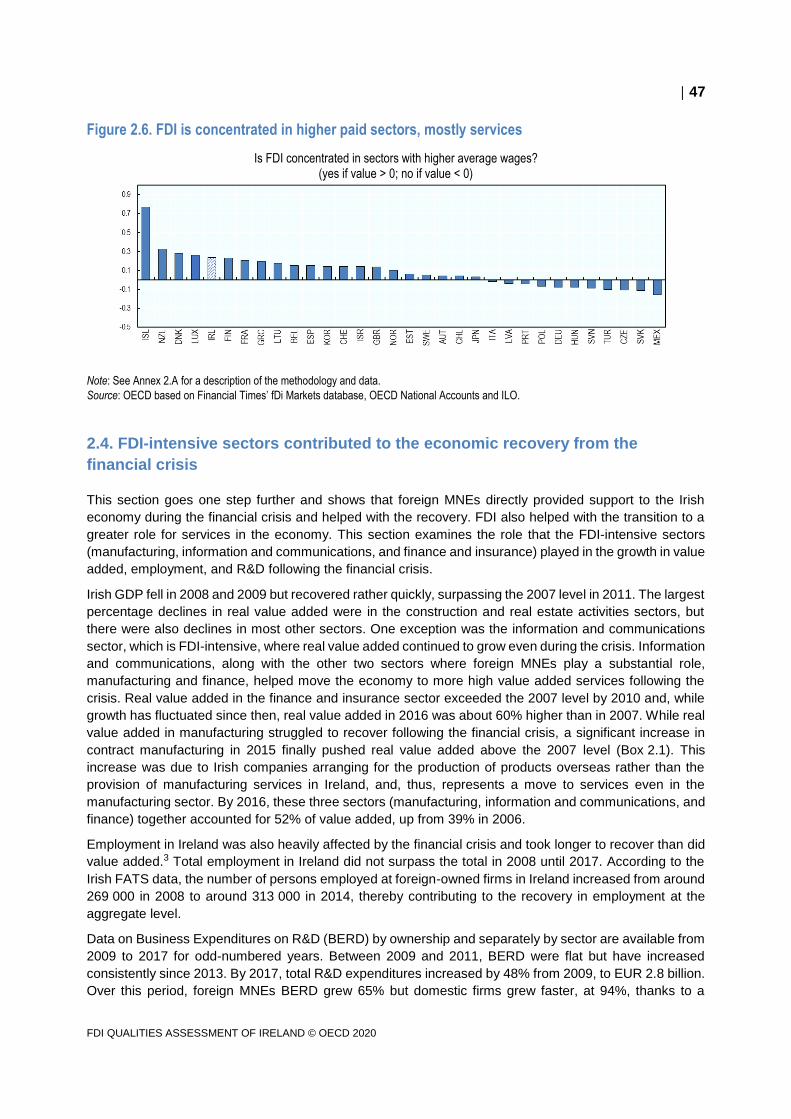
47
FDI QUALITIES ASSESSMENT OF IRELAND © OECD 2020
Figure 2.6. FDI is concentrated in higher paid sectors, mostly services
Is FDI concentrated in sectors with higher average wages? (yes if value > 0; no if value < 0)
Note: See Annex 2.A for a description of the methodology and data.
Source: OECD based on Financial Times’ fDi Markets database, OECD National Accounts and ILO.
2.4. FDI-intensive sectors contributed to the economic recovery from the
financial crisis
This section goes one step further and shows that foreign MNEs directly provided support to the Irish
economy during the financial crisis and helped with the recovery. FDI also helped with the transition to a
greater role for services in the economy. This section examines the role that the FDI-intensive sectors
(manufacturing, information and communications, and finance and insurance) played in the growth in value
added, employment, and R&D following the financial crisis.
Irish GDP fell in 2008 and 2009 but recovered rather quickly, surpassing the 2007 level in 2011. The largest
percentage declines in real value added were in the construction and real estate activities sectors, but
there were also declines in most other sectors. One exception was the information and communications
sector, which is FDI-intensive, where real value added continued to grow even during the crisis. Information
and communications, along with the other two sectors where foreign MNEs play a substantial role,
manufacturing and finance, helped move the economy to more high value added services following the
crisis. Real value added in the finance and insurance sector exceeded the 2007 level by 2010 and, while
growth has fluctuated since then, real value added in 2016 was about 60% higher than in 2007. While real
value added in manufacturing struggled to recover following the financial crisis, a significant increase in
contract manufacturing in 2015 finally pushed real value added above the 2007 level (Box 2.1). This
increase was due to Irish companies arranging for the production of products overseas rather than the
provision of manufacturing services in Ireland, and, thus, represents a move to services even in the
manufacturing sector. By 2016, these three sectors (manufacturing, information and communications, and
finance) together accounted for 52% of value added, up from 39% in 2006.
Employment in Ireland was also heavily affected by the financial crisis and took longer to recover than did
value added.3 Total employment in Ireland did not surpass the total in 2008 until 2017. According to the
Irish FATS data, the number of persons employed at foreign-owned firms in Ireland increased from around
269 000 in 2008 to around 313 000 in 2014, thereby contributing to the recovery in employment at the
aggregate level.
Data on Business Expenditures on R&D (BERD) by ownership and separately by sector are available from
2009 to 2017 for odd-numbered years. Between 2009 and 2011, BERD were flat but have increased
consistently since 2013. By 2017, total R&D expenditures increased by 48% from 2009, to EUR 2.8 billion.
Over this period, foreign MNEs BERD grew 65% but domestic firms grew faster, at 94%, thanks to a
48
FDI QUALITIES ASSESSMENT OF IRELAND © OECD 2020
particularly large increase in 2013. As a result, the share of BERD accounted for by foreign MNEs fell from
72% in 2009 to a still very high 69% in 2017. Between 2015 and 2017, BERD of foreign MNEs increased
32% while that of domestic MNEs increased by only 6%.
The manufacturing and information and communications sectors account for most R&D expenditures, and
it is likely that foreign MNEs account for most of the R&D expenditures in these sectors. From 2009 to
2017, BERD in manufacturing increased 68% and in information and communications, 57%. Foreign MNEs
played an important role in these increases according to the ABSEI data. R&D expenditures by IDA clients
in computer and medical device manufacturing both increased; in contrast, R&D expenditures in
pharmaceutical manufacturing fell 28% but were still higher than other industries in manufacturing. There
was also strong growth in R&D expenditures in information and communications; while R&D expenditures
in all industries increased, there were particularly large increases in other IT and computer services and in
computer programming.
Overall, the three FDI-intensive sectors—manufacturing, information and communications, and finance
and insurance—played a significant role in the recovery following the financial crisis. Information and
communications played a very important role and supported the recovery in value added and jobs, while
manufacturing and finance and insurance contributed more to the recovery in value added. Information
and communications and manufacturing are the most important sectors for R&D expenditures, particularly
in industries where foreign MNEs predominate.
Box 2.1. Contract manufacturing in Ireland
One example of the fragmentation of production that has led to the creation of GVCs is contract
manufacturing arrangements. Contract manufacturing occurs when a company arranges for a product
to be manufactured by another company; it is key that the contracting company supplies some of the
inputs to the manufacturing company. The contracting company is the owner of the product once
manufacturing is completed, and sells it.
When the companies and customers are in different countries, it leads to international transactions. In
the case where the contracting company is Irish, the following transactions would be recorded.
1. An import of manufacturing services from the country where the company manufacturing the
good is located.
2. Any inputs, including the use of intangible assets, sourced from abroad that are used in the
production of the good would be recorded as imports to Ireland.
3. If the good is sold to a customer abroad, it is recorded as an export by Ireland. In trade statistics,
contract manufacturing arrangements are recorded as goods for processing.
Irish companies have long been involved in contract manufacturing arrangements as both contracting
companies and manufacturing service providers. Through 2014, these arrangements resulted in nearly
offsetting imports and exports (CSO, 2017). In Ireland, these imports included royalty payments for the
use of intangible assets and management service fee payments as well as the processing fee. However,
this changed in 2015 when the goods exported under contract manufacturing arrangements were no
longer offset by imports leading to a large increase in the trade surplus. In addition, there was a
relocation of a large value of intangible assets to Ireland by a foreign MNE in 2015 to support contract
manufacturing being arranged by Irish firms. Taken together, these events resulted in a large increase
in GDP between 2014 and 2015. It should be noted that, while these intangible assets are located in
Ireland, they are used in conjunction with foreign labour in the production of the goods. As a result,
there was no increase in employment in Ireland associated with either these increased exports of goods
or the increase in GDP.
49
FDI QUALITIES ASSESSMENT OF IRELAND © OECD 2020
These events are reflected in the macroeconomic statistics used in this report. For example, the
increase in exports is reflected in the trade measured in both gross and value added terms. Both sets
of statistics record a large increase in the trade surplus in 2015. Specifically for TiVA, the increase in
exports without an accompanying increase in imports is reflected in the decline in the foreign content
of exports in 2015. Many of the figures in this chapter scale trade by GDP so the large increase in
exports 2015 is not as visible because GDP also increased due, in part, to the increase in contract
manufacturing exports. Further, the relocation of intangible assets is visible in the increase in the FDI
position in 2015. The increase in GDP is evident in the labour productivity measures published by the
CSO for 2015 (Chapter 3).
In response to the large increase in GDP with little accompanying impact on employment, the Irish
Central Statistics Office convened the Economic Statistics Review Group (ESRG) to make
recommendations for how to better meet the needs of domestic users of national statistics. The ESRG
noted that GNI has long been considered superior to GDP as a measure of the size of the Irish economy
and, indeed, for any highly globalised economy because it excludes profits generated in the domestic
economy that accrue to foreign investors (while also recording the income receipts that domestic
residents earn from abroad). The ESRG recommended a measure, called GNI*, that adjusted GNI for
the impacts of cross-border movements in assets and companies redomiciled in Ireland as well as other
aspects of globalisation.
References
Cazes, S., A. Hijzen and A. Saint-Martin (2015), "Measuring and Assessing Job Quality: The OECD Job
Quality Framework", OECD Social, Employment and Migration Working Papers, No. 174, OECD
Publishing, Paris, https://doi.org/10.1787/5jrp02kjw1mr-en.
Central Statistics Office (CSO) (2017), “Explaining Goods Imports and Exports 2012-2016”,
https://www.cso.ie/en/releasesandpublications/in/geid/explaininggoodsexportsandimports2012-2016/
Davies, R. B., Desbordes, R., and Ray, A. (2015), “Greenfield versus Merger & Acquisition FDI: Same
Wine, Different Bottles?” Canadian Journal of Economics, Vol. 51/4, Canadian Economics
Association, Canada, pp. 1151–1190
OECD (2019), FDI Qualities Indicators: Measuring the sustainable development impacts of investment,
Paris. www.oecd.org/fr/investissement/fdi-qualities-indicators.htm
50
FDI QUALITIES ASSESSMENT OF IRELAND © OECD 2020
Annex 2.A. Methodology and data
Chapter 2 examines the distribution of FDI across sectors and Irish regions and the aggregated and
sectoral contribution of FDI to selected development outcomes (productivity, employment growth, etc.)
using a number of data sources including Eurostat FATS, IDA’s Annual Business Survey and Annual
Employment Survey, Financial Times’ fDi Markets database, OECD National Accounts. Specifically, the
analysis employs the following variables from each source:
Value added, profits and employment from Eurostat FATS
Value added and employment by sector, region and firm type from IDA’s Annual Business
Survey and Annual Employment Survey
Value added and number of hours worked from OECD national accounts
Business expenditure on R&D from the OECD MSTI database
Number of employees and mean nominal monthly earnings by sector from ILO
Greenfield FDI project from the Financial Times’ fDi Markets database
Indicators in Figures 2.3, 2.5, and 2.6
The indicators in Figure 2.3, Figure 2.5 and Figure 2.6 show whether FDI is concentrated in sectors with
higher or lower sustainable development outcomes (e.g. productivity), while controlling for the economic
size of each sector.
These indicators requires sector-level information on FDI, GDP, and the development outcome considered
(e.g. labour productivity), and compare two sector-weighted averages. The first weighted average (the
“FDI-weighted” outcome) is a function of sector-level GDP and FDI. The second weighted average (the
“baseline” outcome) only uses sector-level GDP shares as weights. The indicators are constructed as the
proportional difference between the FDI-weighted and baseline outcomes:
𝑇𝑦𝑝𝑒 2 =∑ 𝜔𝑠𝑌𝑠𝑠 − ∑ 𝛿𝑠𝑌𝑠𝑠
∑ 𝛿𝑠𝑌𝑠𝑠
,
𝜔𝑠 =1
∑𝐹𝐷𝐼𝑠
𝐹𝐷𝐼𝑇𝑂𝑇
𝐺𝐷𝑃𝑠
𝐺𝐷𝑃𝑇𝑂𝑇𝑠
(𝐹𝐷𝐼𝑠
𝐹𝐷𝐼𝑇𝑂𝑇
𝐺𝐷𝑃𝑠
𝐺𝐷𝑃𝑇𝑂𝑇
) ,
𝛿𝑠 = (𝐺𝐷𝑃𝑠
𝐺𝐷𝑃𝑇𝑂𝑇
)
where 𝑌𝑠 is the average outcome of sector s; 𝜔𝑠 is the weight corresponding to sector s constructed using
the product of the GDP share and the FDI share of sector s; 𝛿𝑠 is the GDP share of sector s. By controlling
for sector-level GDP, the indicators provide information on the extent to which the relative distribution of
FDI across sectors relates to economy-wide outcomes. The indicators take positive value if the FDI-
weighted outcome is higher than the baseline; and vice versa.
The indicator based on growth rates in Figure 2.5 is constructed as level differences to avoid confusion
with signs:
𝑇𝑦𝑝𝑒 2𝐺𝑟 = ∑ 𝜔𝑠𝑌𝑠𝑠
− ∑ 𝛿𝑠𝑌𝑠𝑠
51
FDI QUALITIES ASSESSMENT OF IRELAND © OECD 2020
Decomposition of the growth rate of the indicator in Figure 2.3 Panel A
The indicator in Figure 2.3 Panel A is decomposed into two driving factors in Figure 2.4: the outcome
variable (productivity) and FDI (for simplicity sector value added shares are kept constant during this
exercise). This decomposition disentangles the extent to which the indicator changes (1) as a result of
changes in outcomes (labour productivity) in sectors that have received the bulk of FDI, or (2) as a result
of shifts in FDI to sectors with different outcomes. In the first case, the outcome variable is changing in
sectors that receive significant FDI, potentially as a result of FDI. In the second case, FDI may or may not
influence sector-level outcomes, but affects the structure of the economy by expanding activity in certain
sectors relative to others.
Mathematically, this implies totally differentiating the indicator in figure 2.3 Panel A (𝑌) with respect to FDI
(𝐹𝐷𝐼) and the outcome under analysis (𝑂𝑈𝑇).
𝑌 = 𝐹(𝐹𝐷𝐼, 𝑂𝑈𝑇)
𝑑𝑌 = 𝐹𝐹𝐷𝐼𝑑𝐹𝐷𝐼 + 𝐹𝑂𝑈𝑇𝑑𝑂𝑈𝑇
where 𝐹𝑖 corresponds to the partial derivative of 𝑌 with respect to variable 𝑖 = {𝐹𝐷𝐼, 𝑂𝑈𝑇}. The equation
is then divided by 𝑌 and each change is converted into a growth rate:
𝑑𝑌
𝑌= (
𝐹𝐹𝐷𝐼𝐹𝐷𝐼
𝑌)
𝑑𝐹𝐷𝐼
𝐹𝐷𝐼+ (
𝐹𝑂𝑈𝑇𝑂𝑈𝑇
𝑌)
𝑑𝑂𝑈𝑇
𝑂𝑈𝑇= 𝛽
𝑑𝐹𝐷𝐼
𝐹𝐷𝐼+ 𝛾
𝑑𝑂𝑈𝑇
𝑂𝑈𝑇
where 𝛽 measures the change in the indicator explained by FDI, and 𝛾 denotes the variation in the indicator
explained by the outcome variable.
Notes
1 Financial Services, Energy, Recycling and Waste, Construction, Agriculture, Mining and Education
sectors are not covered in this analysis.
2 The Financial Times’ fDi Markets database includes announced greenfield cross-border investment
projects. The measure of FDI used in the OECD FDI Qualities Indicators is based on industry-level
aggregates of these announced investment projects covering 39 sectors, and is available for all countries
considered over 2003-2017. For each year between 2011 and 2017, FDI stock is calculated as the sum of
annual investment flows and previous year capital stock (i.e. zero depreciation is assumed), where initial
stock is approximated as the sum of investment flows over 2003 to 2010.
3 Data are from the OECD’s National Accounts database, which covers 2008 to 2017.

53
FDI QUALITIES ASSESSMENT OF IRELAND © OECD 2020
This chapter studies productivity and employment of foreign MNEs operating
in Ireland between 2006 and 2016. Specifically, the productivity dynamics of
foreign owned firms are followed over time, and the role of firm entry and exit
in terms of employment are analysed, using transition matrices. Focus is put
on two strategic sectors: manufacturing and information and communication.
3. Productivity and job dynamics of
foreign MNEs in Ireland
54
FDI QUALITIES ASSESSMENT OF IRELAND © OECD 2020
3.1. Summary
In the years from 2000 to 2016, the foreign sector in Ireland had an average annual labour productivity
growth of 10.9% while the domestic (and other) sector grew at a 2.5% rate (CSO, 2018). Underlying the
remarkable trends in the foreign MNE sector at the aggregate level are complex dynamics at the firm level.
A firms’ productivity can rise or fall relative to the industry in which it operates. Some large, resilient firms
can maintain high levels of productivity and support employment for extended periods of time. Entries and
exits, by providing a channel to reallocate resources among firms, also crucially affect aggregate
productivity trends. In turn, increases in (labour) productivity can have important implications for the
improvement of living standards. The extent to which firm dynamics create and support jobs at high
productivity levels is thus worth investigating and is the focus of this chapter.
The work uses the Annual Business Survey of Economic Impact (ABSEI) and the Employment Survey,
and focuses on two sectors that are key to the Irish economy: manufacturing, and information and
communications (IC). The analysis employs transition matrices to answer the following questions: Are the
incumbents at the top of the productivity ranking always the same, and what proportion of jobs do they
account for? What proportion of jobs were at low-productivity firms that exited? Do high productivity firms
exit? To what extent are low performing foreign firms able to ‘climb the productivity ladder’, and if so, how
many jobs do they generate? Do firms enter at the top of the productivity distribution and, if so, what
proportion of jobs do they account for?
Wide disparities in productivity, and uneven job creation across sectors
The range of productivity levels among foreign firms operating between 2006 and 2016 is very wide, with
some stellar performers. A first glance at the overall distribution1 of productivity levels reveals that the top
95th percentile2 firms (‘frontier firms’) are almost ten times as productive as the median firms. Over 2006-
16, there was a net job gain of more than 10 000 jobs, from a starting point of approximately 97 000 in
2006. Most of these gains were realised in the information and communications sector, across all levels of
productivity. In manufacturing, the gains were all at the most productive firms.
Incumbents tend to remain at the top in manufacturing
The best performers in manufacturing, i.e. those at the top of the productivity distribution, held their
positions throughout the years with little chance for other firms to climb upwards. In fact, 73% of jobs in the
highest quintile in 2016 were at firms from that same quintile in 2006. These ‘resilient’ top performers were
21% of the total number of firms and also happened to be supporting the largest share of jobs overall
(35%).
In manufacturing, dynamism is supported more by exits than entries. Exits happened at all levels of
productivity, but for the most part, at the lower productivity segments (36% of total firms exiting came from
the bottom quintile). A lower, 11% share of exits were from the highest quintile (most productive) firms and
they accounted for 18% of jobs of exiting firms (around 2 000 jobs).
Up or out in information and communication
The information and communications sector is similar to manufacturing at the top end of the distribution,
where a group of resilient firms supports high productivity jobs. For the firms starting at the top performance
quintile, 74% of the jobs remained in the same quintile, but 20% dropped down to the 3rd quintile. It is new
entrants that play an important role in the information and communications sector. Of the jobs at the middle
quintile in 2016, for example, a fifth came from new establishments that entered in the years after 2006.
55
FDI QUALITIES ASSESSMENT OF IRELAND © OECD 2020
Resilient and climbing firms supported higher salaries
Overall, the most productive and resilient firms, i.e. those that maintained very high productivity throughout
the years, exported more and paid, on average, higher salaries. The most upwardly mobile firms (i.e. firms
that ‘climbed’ from the lowest quintile to the two highest quintiles) were those paying the highest wages at
the end of the period.
The country of foreign investors matters, particularly in manufacturing
The United States, Denmark, Japan, followed at some distance by France, are the countries whose
investments had the highest relative productivity over the period 2006-16.
3.2. Strong MNE productivity performance in Ireland: official statistics and IDA
microdata
In the years from 2000 to 2016, the foreign sector in Ireland had an average annual labour productivity
growth of 10.9% while the domestic (and other) sector grew at a 2.5% rate (CSO, 2018). The National
Competitiveness Council3 argues that this gap in performance was (for the most part) driven by some
highly productive foreign firms that pushed the productivity frontier of their industries. While these high-
level estimates are helpful to set the scene, they do not address key patterns and potential dynamism
within the group of foreign firms. The analysis on productivity in section 3.3 provides a much more detailed
perspective by using IDA (ABSEI) microdata.
Prior to presenting the results based on the IDA microdata, it is worth assessing whether the data present
similar trends as those disseminated by the CSO. Weighted labour productivity of foreign firms based on
ABSEI appears to be aligned with official CSO estimates in the first 5 years of the period from 2006 to
2016 (Figure 3.1).4 After 2010, the estimates start to diverge although they maintain similar trends until
2015.
In 2015, the CSO data show a marked increase leading to labour productivity three times as high as the
2006 level, mainly due to relocations to Ireland of substantial intellectual property by foreign MNEs (see
Box 3.1). The trends in ABSEI data are qualitatively similar to the official CSO estimates, with the difference
that they do not show the same dramatic changes.5 This suggests that the IDA data provide a valid
estimate of foreign firms’ labour productivity trends for the period under study, and that this study can cover
the period 2006-16, while many other studies stop at 2014 due to the discontinuity in 2015.
Box 3.1. Recent findings from the literature
A number of studies have analysed productivity trends in Ireland at various levels of detail, including
breakdowns between domestic and foreign-owned firms, by sectors and size classes, and between
frontier and lagging firms. Recent publications in this area have all pointed to a significant and growing
productivity gap between foreign-owned and domestic firms (CSO, National Competitiveness Council,
ESRI, and OECD).
The 2018 CSO Productivity report (CSO, 2018) highlights that from 2000 to 2016, the foreign sector in
Ireland had an average annual labour productivity growth of 10.9%. At the same time, the domestic
(and other) sector grew at a 2.5% rate. The last two years of the period (2015-16) were characterised
by the relocation of ‘entire balance sheets dominated by intellectual property products’, which led to a
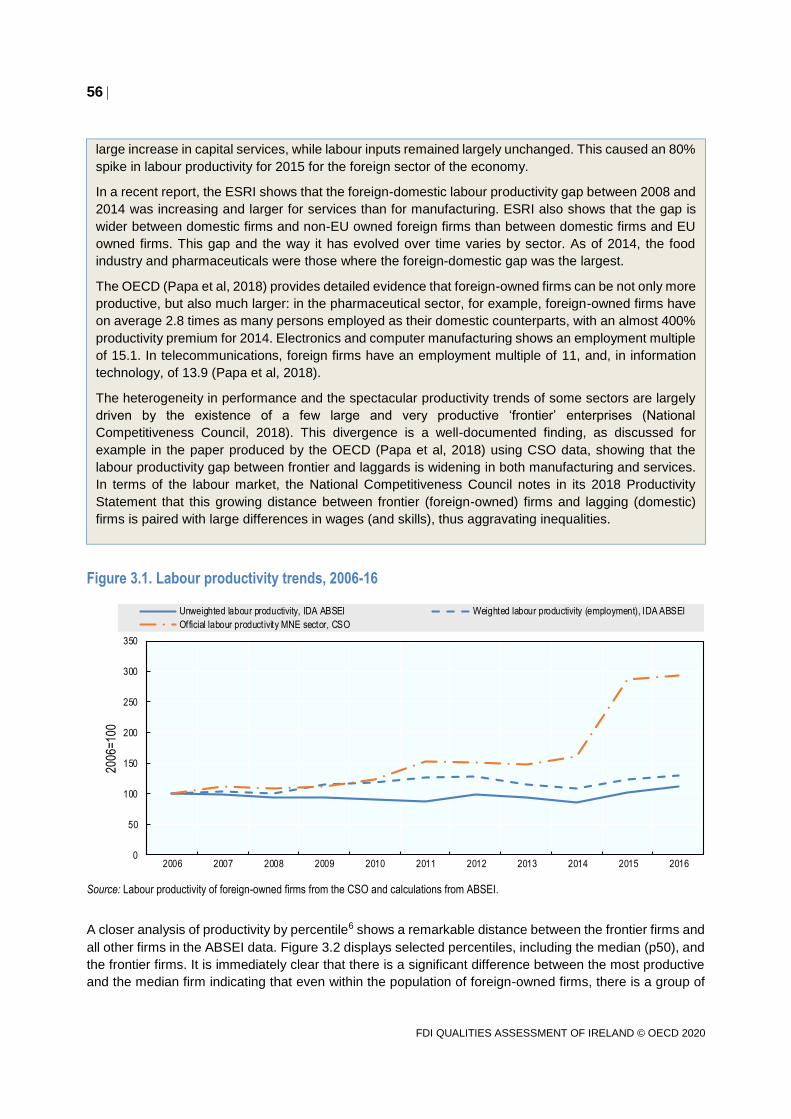
56
FDI QUALITIES ASSESSMENT OF IRELAND © OECD 2020
large increase in capital services, while labour inputs remained largely unchanged. This caused an 80%
spike in labour productivity for 2015 for the foreign sector of the economy.
In a recent report, the ESRI shows that the foreign-domestic labour productivity gap between 2008 and
2014 was increasing and larger for services than for manufacturing. ESRI also shows that the gap is
wider between domestic firms and non-EU owned foreign firms than between domestic firms and EU
owned firms. This gap and the way it has evolved over time varies by sector. As of 2014, the food
industry and pharmaceuticals were those where the foreign-domestic gap was the largest.
The OECD (Papa et al, 2018) provides detailed evidence that foreign-owned firms can be not only more
productive, but also much larger: in the pharmaceutical sector, for example, foreign-owned firms have
on average 2.8 times as many persons employed as their domestic counterparts, with an almost 400%
productivity premium for 2014. Electronics and computer manufacturing shows an employment multiple
of 15.1. In telecommunications, foreign firms have an employment multiple of 11, and, in information
technology, of 13.9 (Papa et al, 2018).
The heterogeneity in performance and the spectacular productivity trends of some sectors are largely
driven by the existence of a few large and very productive ‘frontier’ enterprises (National
Competitiveness Council, 2018). This divergence is a well-documented finding, as discussed for
example in the paper produced by the OECD (Papa et al, 2018) using CSO data, showing that the
labour productivity gap between frontier and laggards is widening in both manufacturing and services.
In terms of the labour market, the National Competitiveness Council notes in its 2018 Productivity
Statement that this growing distance between frontier (foreign-owned) firms and lagging (domestic)
firms is paired with large differences in wages (and skills), thus aggravating inequalities.
Figure 3.1. Labour productivity trends, 2006-16
0
50
100
150
200
250
300
350
2006 2007 2008 2009 2010 2011 2012 2013 2014 2015 2016
2006
=100
Unweighted labour productivity, IDA ABSEI Weighted labour productivity (employment), IDA ABSEI
Official labour productivity MNE sector, CSO
Source: Labour productivity of foreign-owned firms from the CSO and calculations from ABSEI.
A closer analysis of productivity by percentile6 shows a remarkable distance between the frontier firms and
all other firms in the ABSEI data. Figure 3.2 displays selected percentiles, including the median (p50), and
the frontier firms. It is immediately clear that there is a significant difference between the most productive
and the median firm indicating that even within the population of foreign-owned firms, there is a group of
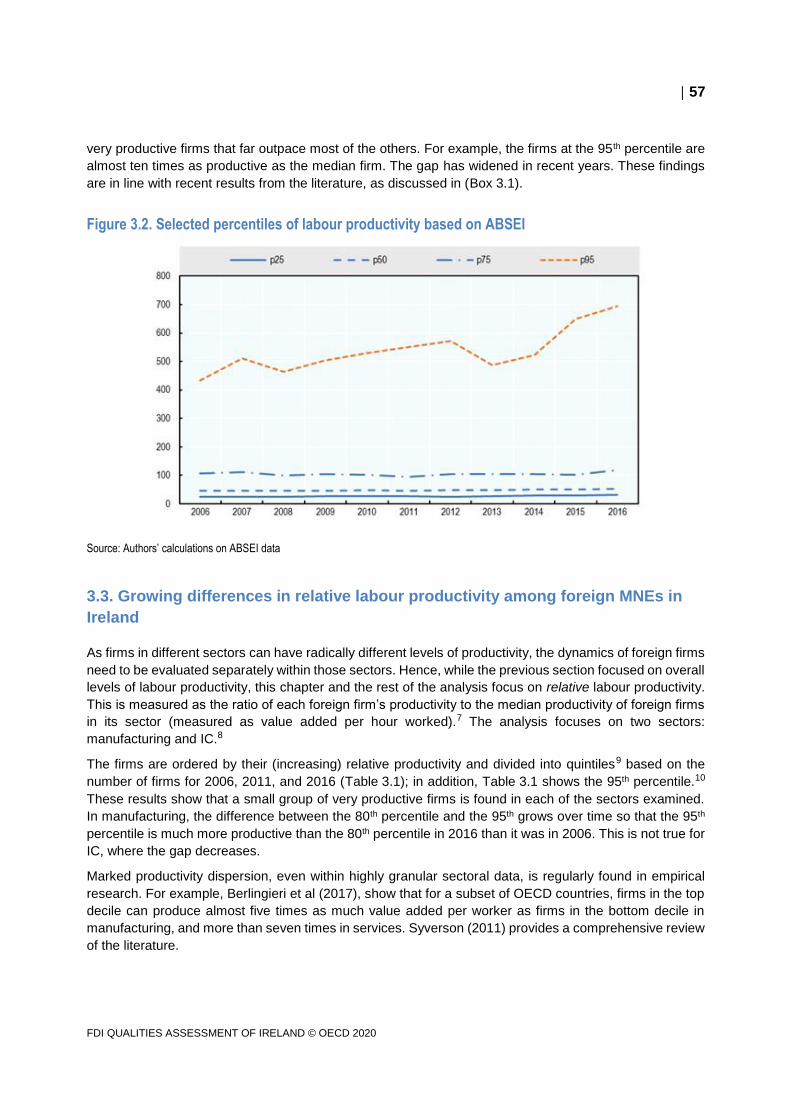
57
FDI QUALITIES ASSESSMENT OF IRELAND © OECD 2020
very productive firms that far outpace most of the others. For example, the firms at the 95th percentile are
almost ten times as productive as the median firm. The gap has widened in recent years. These findings
are in line with recent results from the literature, as discussed in (Box 3.1).
Figure 3.2. Selected percentiles of labour productivity based on ABSEI
Source: Authors’ calculations on ABSEI data
3.3. Growing differences in relative labour productivity among foreign MNEs in
Ireland
As firms in different sectors can have radically different levels of productivity, the dynamics of foreign firms
need to be evaluated separately within those sectors. Hence, while the previous section focused on overall
levels of labour productivity, this chapter and the rest of the analysis focus on relative labour productivity.
This is measured as the ratio of each foreign firm’s productivity to the median productivity of foreign firms
in its sector (measured as value added per hour worked).7 The analysis focuses on two sectors:
manufacturing and IC.8
The firms are ordered by their (increasing) relative productivity and divided into quintiles9 based on the
number of firms for 2006, 2011, and 2016 (Table 3.1); in addition, Table 3.1 shows the 95th percentile.10
These results show that a small group of very productive firms is found in each of the sectors examined.
In manufacturing, the difference between the 80th percentile and the 95th grows over time so that the 95th
percentile is much more productive than the 80th percentile in 2016 than it was in 2006. This is not true for
IC, where the gap decreases.
Marked productivity dispersion, even within highly granular sectoral data, is regularly found in empirical
research. For example, Berlingieri et al (2017), show that for a subset of OECD countries, firms in the top
decile can produce almost five times as much value added per worker as firms in the bottom decile in
manufacturing, and more than seven times in services. Syverson (2011) provides a comprehensive review
of the literature.
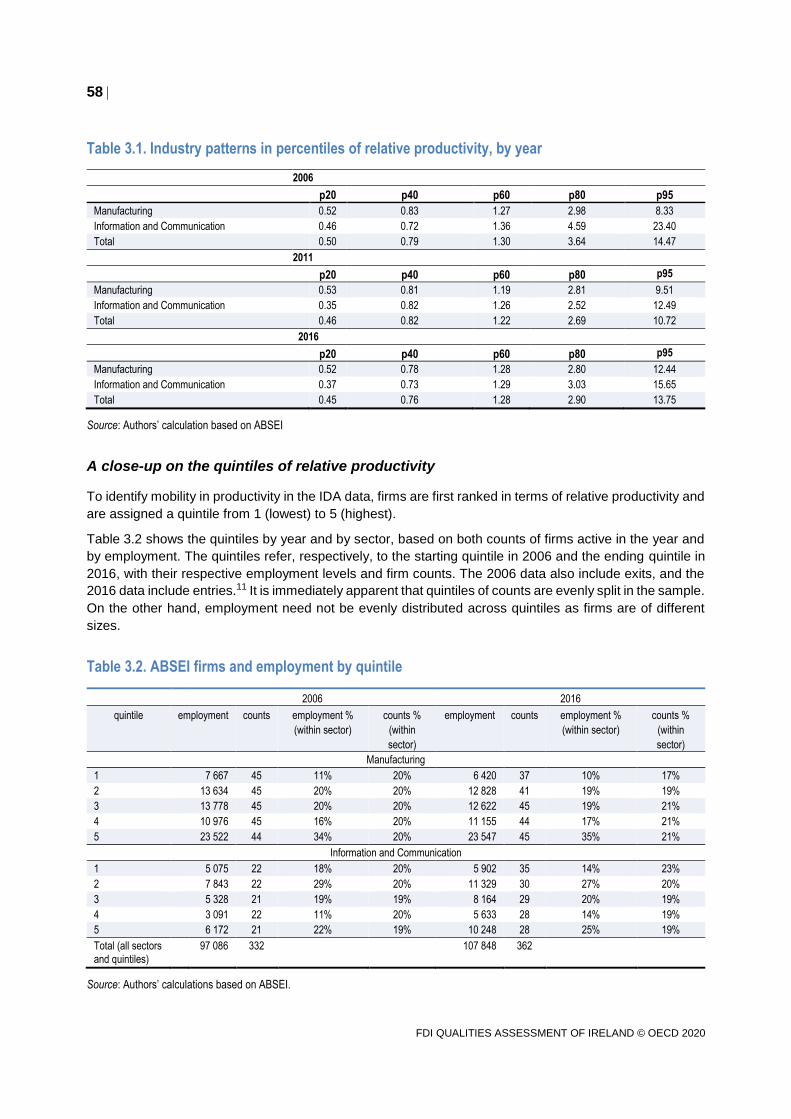
58
FDI QUALITIES ASSESSMENT OF IRELAND © OECD 2020
Table 3.1. Industry patterns in percentiles of relative productivity, by year
2006
p20 p40 p60 p80 p95
Manufacturing 0.52 0.83 1.27 2.98 8.33
Information and Communication 0.46 0.72 1.36 4.59 23.40
Total 0.50 0.79 1.30 3.64 14.47 2011
p20 p40 p60 p80 p95
Manufacturing 0.53 0.81 1.19 2.81 9.51
Information and Communication 0.35 0.82 1.26 2.52 12.49
Total 0.46 0.82 1.22 2.69 10.72 2016
p20 p40 p60 p80 p95
Manufacturing 0.52 0.78 1.28 2.80 12.44
Information and Communication 0.37 0.73 1.29 3.03 15.65
Total 0.45 0.76 1.28 2.90 13.75
Source: Authors’ calculation based on ABSEI
A close-up on the quintiles of relative productivity
To identify mobility in productivity in the IDA data, firms are first ranked in terms of relative productivity and
are assigned a quintile from 1 (lowest) to 5 (highest).
Table 3.2 shows the quintiles by year and by sector, based on both counts of firms active in the year and
by employment. The quintiles refer, respectively, to the starting quintile in 2006 and the ending quintile in
2016, with their respective employment levels and firm counts. The 2006 data also include exits, and the
2016 data include entries.11 It is immediately apparent that quintiles of counts are evenly split in the sample.
On the other hand, employment need not be evenly distributed across quintiles as firms are of different
sizes.
Table 3.2. ABSEI firms and employment by quintile
2006 2016
quintile employment counts employment %
(within sector)
counts %
(within
sector)
employment counts employment %
(within sector)
counts %
(within
sector)
Manufacturing
1 7 667 45 11% 20% 6 420 37 10% 17%
2 13 634 45 20% 20% 12 828 41 19% 19%
3 13 778 45 20% 20% 12 622 45 19% 21%
4 10 976 45 16% 20% 11 155 44 17% 21%
5 23 522 44 34% 20% 23 547 45 35% 21%
Information and Communication
1 5 075 22 18% 20% 5 902 35 14% 23%
2 7 843 22 29% 20% 11 329 30 27% 20%
3 5 328 21 19% 19% 8 164 29 20% 19%
4 3 091 22 11% 20% 5 633 28 14% 19%
5 6 172 21 22% 19% 10 248 28 25% 19%
Total (all sectors
and quintiles)
97 086 332
107 848 362
Source: Authors’ calculations based on ABSEI.
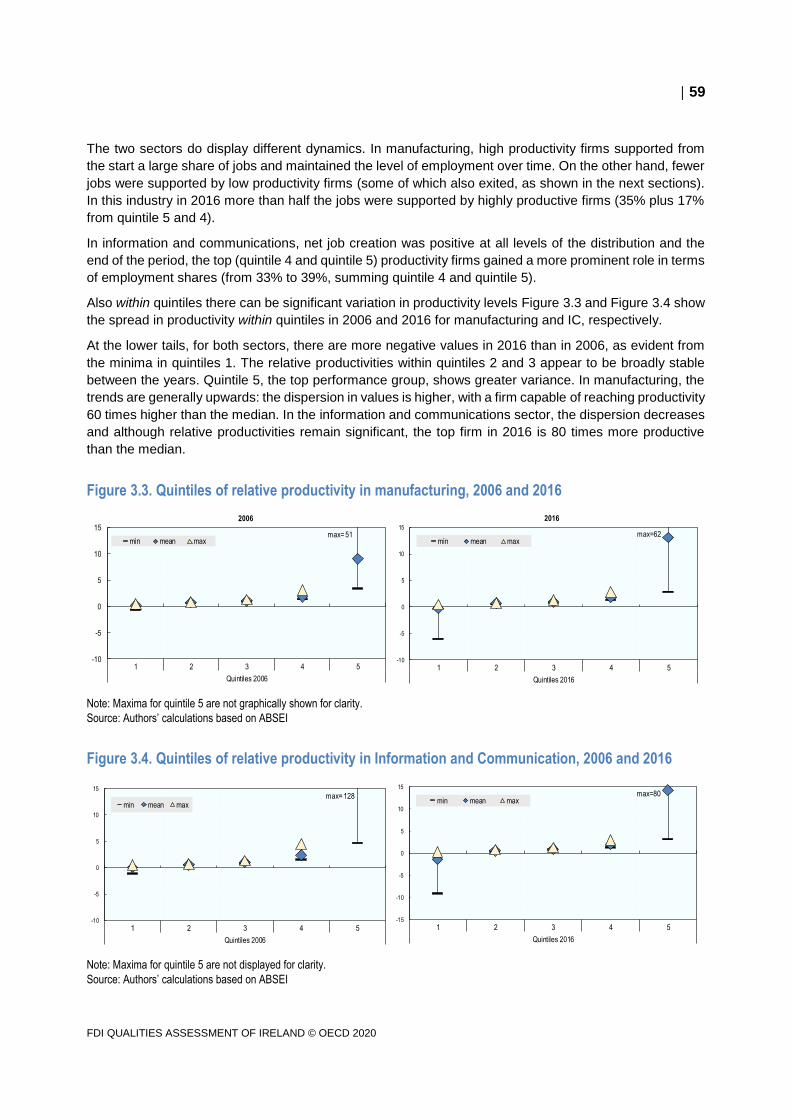
59
FDI QUALITIES ASSESSMENT OF IRELAND © OECD 2020
The two sectors do display different dynamics. In manufacturing, high productivity firms supported from
the start a large share of jobs and maintained the level of employment over time. On the other hand, fewer
jobs were supported by low productivity firms (some of which also exited, as shown in the next sections).
In this industry in 2016 more than half the jobs were supported by highly productive firms (35% plus 17%
from quintile 5 and 4).
In information and communications, net job creation was positive at all levels of the distribution and the
end of the period, the top (quintile 4 and quintile 5) productivity firms gained a more prominent role in terms
of employment shares (from 33% to 39%, summing quintile 4 and quintile 5).
Also within quintiles there can be significant variation in productivity levels Figure 3.3 and Figure 3.4 show
the spread in productivity within quintiles in 2006 and 2016 for manufacturing and IC, respectively.
At the lower tails, for both sectors, there are more negative values in 2016 than in 2006, as evident from
the minima in quintiles 1. The relative productivities within quintiles 2 and 3 appear to be broadly stable
between the years. Quintile 5, the top performance group, shows greater variance. In manufacturing, the
trends are generally upwards: the dispersion in values is higher, with a firm capable of reaching productivity
60 times higher than the median. In the information and communications sector, the dispersion decreases
and although relative productivities remain significant, the top firm in 2016 is 80 times more productive
than the median.
Figure 3.3. Quintiles of relative productivity in manufacturing, 2006 and 2016
Note: Maxima for quintile 5 are not graphically shown for clarity.
Source: Authors’ calculations based on ABSEI
Figure 3.4. Quintiles of relative productivity in Information and Communication, 2006 and 2016
Note: Maxima for quintile 5 are not displayed for clarity.
Source: Authors’ calculations based on ABSEI
-10
-5
0
5
10
15
1 2 3 4 5
Quintiles 2006
min mean maxmax= 51
-10
-5
0
5
10
15
1 2 3 4 5
Quintiles 2016
min mean maxmax=62
2006 2016
-10
-5
0
5
10
15
1 2 3 4 5
Quintiles 2006
min mean maxmax= 128
-15
-10
-5
0
5
10
15
1 2 3 4 5
Quintiles 2016
min mean maxmax=80
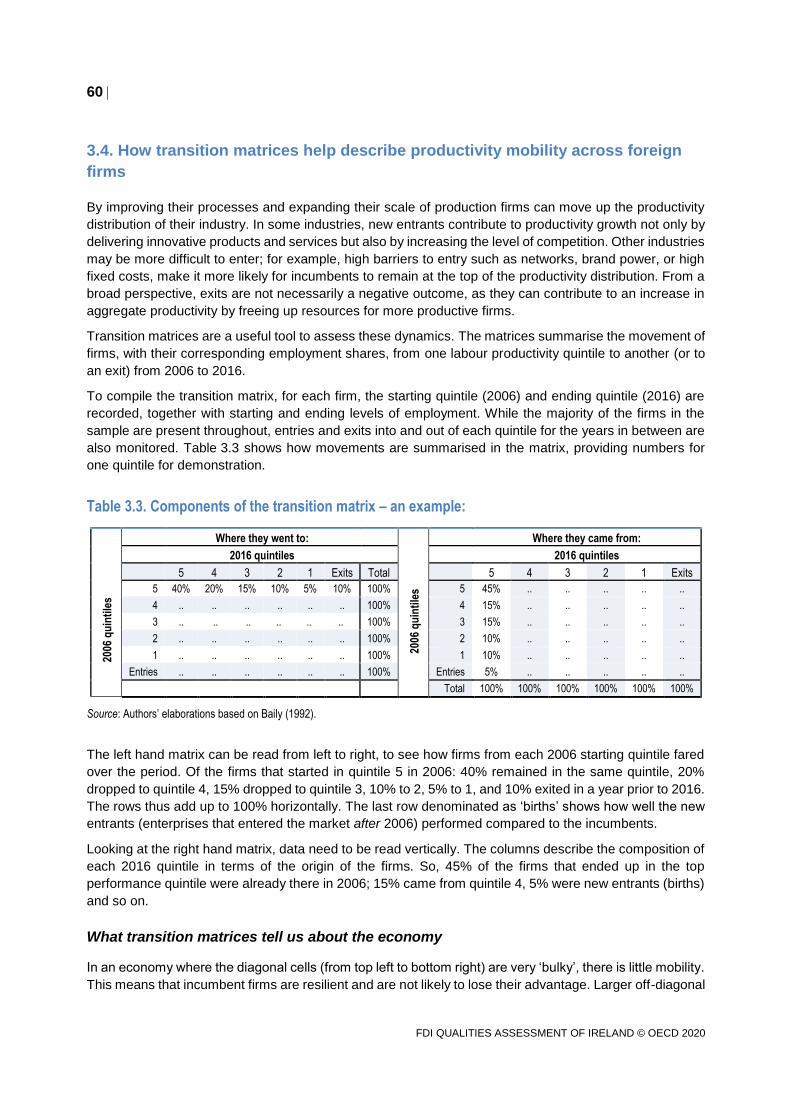
60
FDI QUALITIES ASSESSMENT OF IRELAND © OECD 2020
3.4. How transition matrices help describe productivity mobility across foreign
firms
By improving their processes and expanding their scale of production firms can move up the productivity
distribution of their industry. In some industries, new entrants contribute to productivity growth not only by
delivering innovative products and services but also by increasing the level of competition. Other industries
may be more difficult to enter; for example, high barriers to entry such as networks, brand power, or high
fixed costs, make it more likely for incumbents to remain at the top of the productivity distribution. From a
broad perspective, exits are not necessarily a negative outcome, as they can contribute to an increase in
aggregate productivity by freeing up resources for more productive firms.
Transition matrices are a useful tool to assess these dynamics. The matrices summarise the movement of
firms, with their corresponding employment shares, from one labour productivity quintile to another (or to
an exit) from 2006 to 2016.
To compile the transition matrix, for each firm, the starting quintile (2006) and ending quintile (2016) are
recorded, together with starting and ending levels of employment. While the majority of the firms in the
sample are present throughout, entries and exits into and out of each quintile for the years in between are
also monitored. Table 3.3 shows how movements are summarised in the matrix, providing numbers for
one quintile for demonstration.
Table 3.3. Components of the transition matrix – an example:
Where they went to: Where they came from:
2016 quintiles
2006
qu
inti
les
2016 quintiles
2006
qu
inti
les
5 4 3 2 1 Exits Total 5 4 3 2 1 Exits
5 40% 20% 15% 10% 5% 10% 100% 5 45% .. .. .. .. ..
4 .. .. .. .. .. .. 100% 4 15% .. .. .. .. ..
3 .. .. .. .. .. .. 100% 3 15% .. .. .. .. ..
2 .. .. .. .. .. .. 100% 2 10% .. .. .. .. ..
1 .. .. .. .. .. .. 100% 1 10% .. .. .. .. ..
Entries .. .. .. .. .. .. 100% Entries 5% .. .. .. .. ..
Total 100% 100% 100% 100% 100% 100%
Source: Authors’ elaborations based on Baily (1992).
The left hand matrix can be read from left to right, to see how firms from each 2006 starting quintile fared
over the period. Of the firms that started in quintile 5 in 2006: 40% remained in the same quintile, 20%
dropped to quintile 4, 15% dropped to quintile 3, 10% to 2, 5% to 1, and 10% exited in a year prior to 2016.
The rows thus add up to 100% horizontally. The last row denominated as ‘births’ shows how well the new
entrants (enterprises that entered the market after 2006) performed compared to the incumbents.
Looking at the right hand matrix, data need to be read vertically. The columns describe the composition of
each 2016 quintile in terms of the origin of the firms. So, 45% of the firms that ended up in the top
performance quintile were already there in 2006; 15% came from quintile 4, 5% were new entrants (births)
and so on.
What transition matrices tell us about the economy
In an economy where the diagonal cells (from top left to bottom right) are very ‘bulky’, there is little mobility.
This means that incumbent firms are resilient and are not likely to lose their advantage. Larger off-diagonal
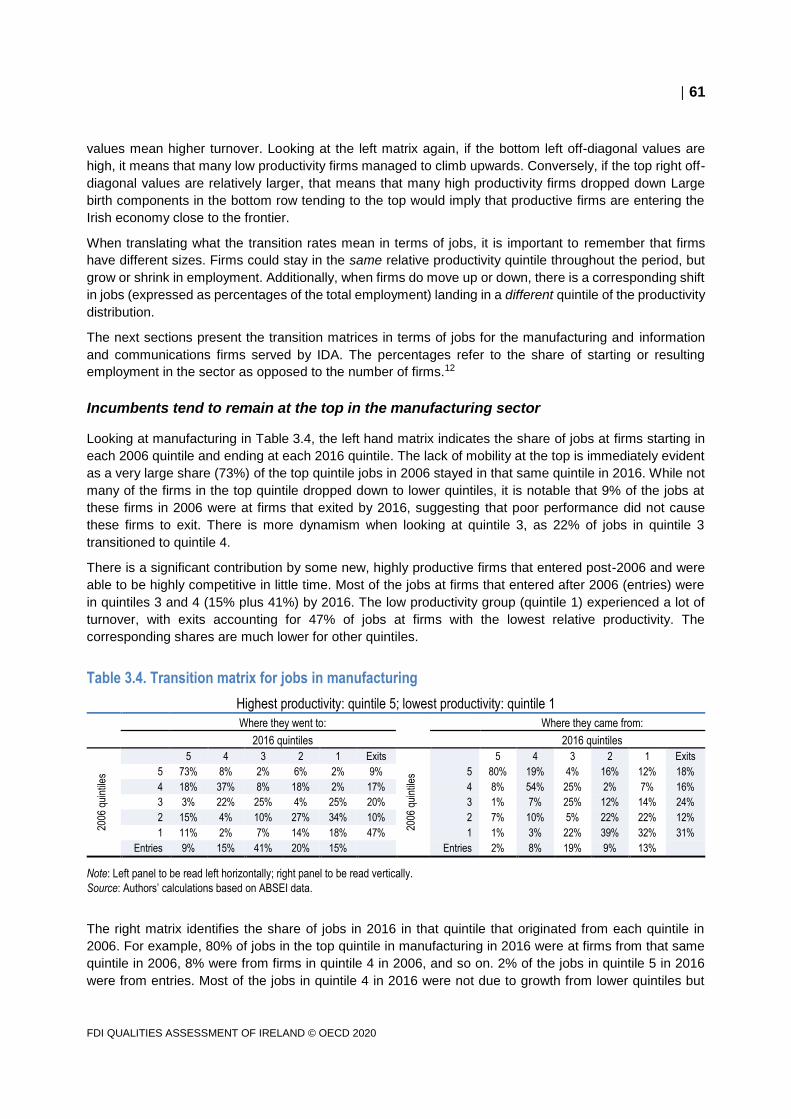
61
FDI QUALITIES ASSESSMENT OF IRELAND © OECD 2020
values mean higher turnover. Looking at the left matrix again, if the bottom left off-diagonal values are
high, it means that many low productivity firms managed to climb upwards. Conversely, if the top right off-
diagonal values are relatively larger, that means that many high productivity firms dropped down Large
birth components in the bottom row tending to the top would imply that productive firms are entering the
Irish economy close to the frontier.
When translating what the transition rates mean in terms of jobs, it is important to remember that firms
have different sizes. Firms could stay in the same relative productivity quintile throughout the period, but
grow or shrink in employment. Additionally, when firms do move up or down, there is a corresponding shift
in jobs (expressed as percentages of the total employment) landing in a different quintile of the productivity
distribution.
The next sections present the transition matrices in terms of jobs for the manufacturing and information
and communications firms served by IDA. The percentages refer to the share of starting or resulting
employment in the sector as opposed to the number of firms.12
Incumbents tend to remain at the top in the manufacturing sector
Looking at manufacturing in Table 3.4, the left hand matrix indicates the share of jobs at firms starting in
each 2006 quintile and ending at each 2016 quintile. The lack of mobility at the top is immediately evident
as a very large share (73%) of the top quintile jobs in 2006 stayed in that same quintile in 2016. While not
many of the firms in the top quintile dropped down to lower quintiles, it is notable that 9% of the jobs at
these firms in 2006 were at firms that exited by 2016, suggesting that poor performance did not cause
these firms to exit. There is more dynamism when looking at quintile 3, as 22% of jobs in quintile 3
transitioned to quintile 4.
There is a significant contribution by some new, highly productive firms that entered post-2006 and were
able to be highly competitive in little time. Most of the jobs at firms that entered after 2006 (entries) were
in quintiles 3 and 4 (15% plus 41%) by 2016. The low productivity group (quintile 1) experienced a lot of
turnover, with exits accounting for 47% of jobs at firms with the lowest relative productivity. The
corresponding shares are much lower for other quintiles.
Table 3.4. Transition matrix for jobs in manufacturing
Highest productivity: quintile 5; lowest productivity: quintile 1
Where they went to:
Where they came from:
2016 quintiles 2016 quintiles
2006
qui
ntile
s
5 4 3 2 1 Exits
2006
qui
ntile
s
5 4 3 2 1 Exits
5 73% 8% 2% 6% 2% 9% 5 80% 19% 4% 16% 12% 18%
4 18% 37% 8% 18% 2% 17% 4 8% 54% 25% 2% 7% 16%
3 3% 22% 25% 4% 25% 20% 3 1% 7% 25% 12% 14% 24%
2 15% 4% 10% 27% 34% 10% 2 7% 10% 5% 22% 22% 12%
1 11% 2% 7% 14% 18% 47% 1 1% 3% 22% 39% 32% 31%
Entries 9% 15% 41% 20% 15%
Entries 2% 8% 19% 9% 13%
Note: Left panel to be read left horizontally; right panel to be read vertically.
Source: Authors’ calculations based on ABSEI data.
The right matrix identifies the share of jobs in 2016 in that quintile that originated from each quintile in
2006. For example, 80% of jobs in the top quintile in manufacturing in 2016 were at firms from that same
quintile in 2006, 8% were from firms in quintile 4 in 2006, and so on. 2% of the jobs in quintile 5 in 2016
were from entries. Most of the jobs in quintile 4 in 2016 were not due to growth from lower quintiles but
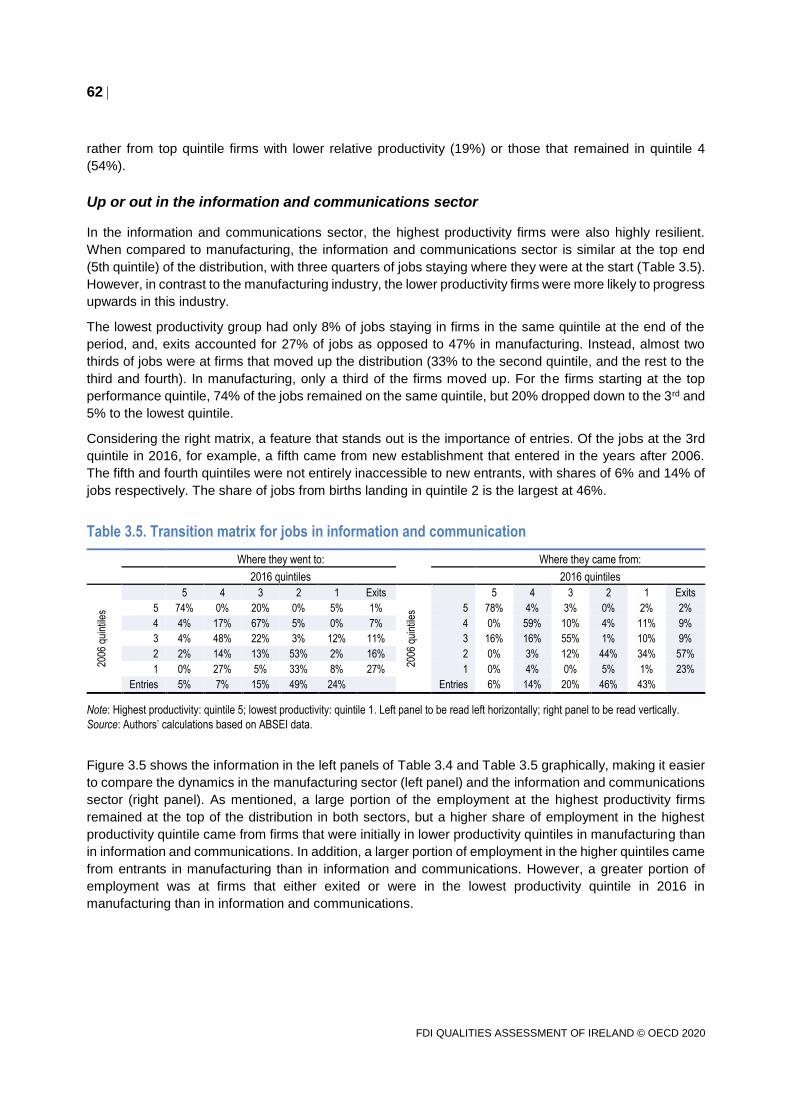
62
FDI QUALITIES ASSESSMENT OF IRELAND © OECD 2020
rather from top quintile firms with lower relative productivity (19%) or those that remained in quintile 4
(54%).
Up or out in the information and communications sector
In the information and communications sector, the highest productivity firms were also highly resilient.
When compared to manufacturing, the information and communications sector is similar at the top end
(5th quintile) of the distribution, with three quarters of jobs staying where they were at the start (Table 3.5).
However, in contrast to the manufacturing industry, the lower productivity firms were more likely to progress
upwards in this industry.
The lowest productivity group had only 8% of jobs staying in firms in the same quintile at the end of the
period, and, exits accounted for 27% of jobs as opposed to 47% in manufacturing. Instead, almost two
thirds of jobs were at firms that moved up the distribution (33% to the second quintile, and the rest to the
third and fourth). In manufacturing, only a third of the firms moved up. For the firms starting at the top
performance quintile, 74% of the jobs remained on the same quintile, but 20% dropped down to the 3rd and
5% to the lowest quintile.
Considering the right matrix, a feature that stands out is the importance of entries. Of the jobs at the 3rd
quintile in 2016, for example, a fifth came from new establishment that entered in the years after 2006.
The fifth and fourth quintiles were not entirely inaccessible to new entrants, with shares of 6% and 14% of
jobs respectively. The share of jobs from births landing in quintile 2 is the largest at 46%.
Table 3.5. Transition matrix for jobs in information and communication
Where they went to:
Where they came from:
2016 quintiles 2016 quintiles
2006
qui
ntile
s
5 4 3 2 1 Exits
2006
qui
ntile
s
5 4 3 2 1 Exits
5 74% 0% 20% 0% 5% 1% 5 78% 4% 3% 0% 2% 2%
4 4% 17% 67% 5% 0% 7% 4 0% 59% 10% 4% 11% 9%
3 4% 48% 22% 3% 12% 11% 3 16% 16% 55% 1% 10% 9%
2 2% 14% 13% 53% 2% 16% 2 0% 3% 12% 44% 34% 57%
1 0% 27% 5% 33% 8% 27% 1 0% 4% 0% 5% 1% 23%
Entries 5% 7% 15% 49% 24%
Entries 6% 14% 20% 46% 43%
Note: Highest productivity: quintile 5; lowest productivity: quintile 1. Left panel to be read left horizontally; right panel to be read vertically.
Source: Authors’ calculations based on ABSEI data.
Figure 3.5 shows the information in the left panels of Table 3.4 and Table 3.5 graphically, making it easier
to compare the dynamics in the manufacturing sector (left panel) and the information and communications
sector (right panel). As mentioned, a large portion of the employment at the highest productivity firms
remained at the top of the distribution in both sectors, but a higher share of employment in the highest
productivity quintile came from firms that were initially in lower productivity quintiles in manufacturing than
in information and communications. In addition, a larger portion of employment in the higher quintiles came
from entrants in manufacturing than in information and communications. However, a greater portion of
employment was at firms that either exited or were in the lowest productivity quintile in 2016 in
manufacturing than in information and communications.
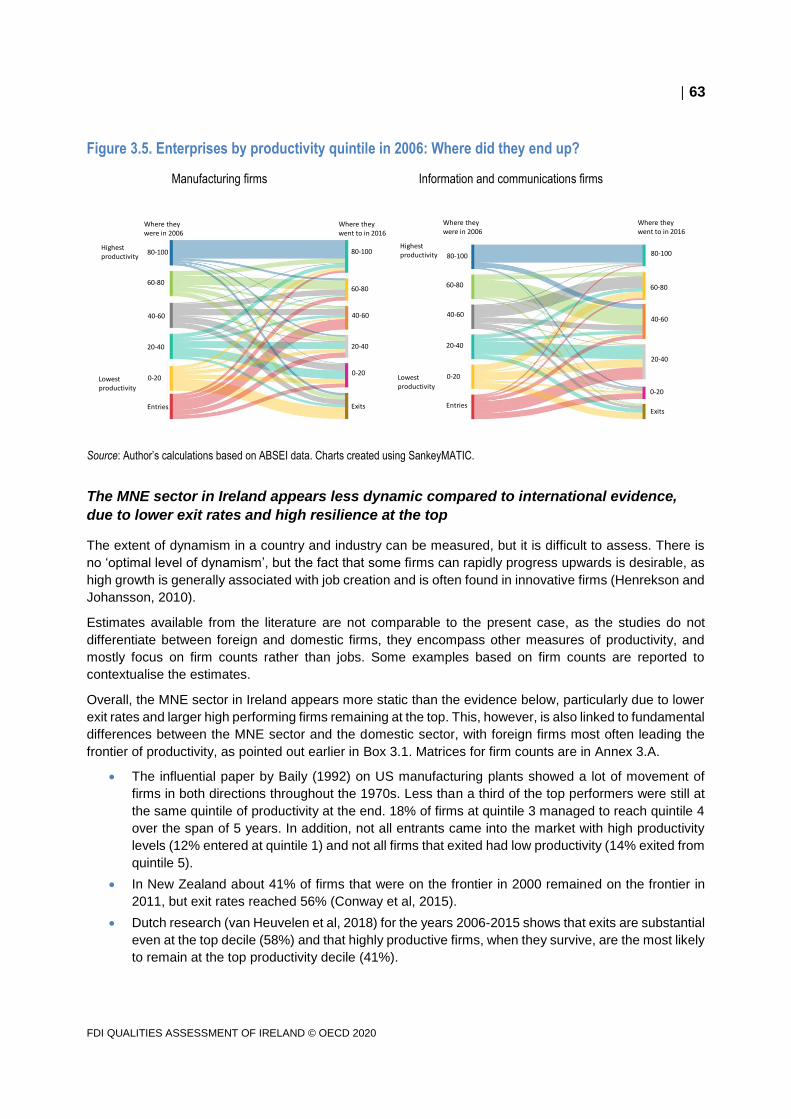
63
FDI QUALITIES ASSESSMENT OF IRELAND © OECD 2020
Figure 3.5. Enterprises by productivity quintile in 2006: Where did they end up?
Manufacturing firms Information and communications firms
Source: Author’s calculations based on ABSEI data. Charts created using SankeyMATIC.
The MNE sector in Ireland appears less dynamic compared to international evidence,
due to lower exit rates and high resilience at the top
The extent of dynamism in a country and industry can be measured, but it is difficult to assess. There is
no ‘optimal level of dynamism’, but the fact that some firms can rapidly progress upwards is desirable, as
high growth is generally associated with job creation and is often found in innovative firms (Henrekson and
Johansson, 2010).
Estimates available from the literature are not comparable to the present case, as the studies do not
differentiate between foreign and domestic firms, they encompass other measures of productivity, and
mostly focus on firm counts rather than jobs. Some examples based on firm counts are reported to
contextualise the estimates.
Overall, the MNE sector in Ireland appears more static than the evidence below, particularly due to lower
exit rates and larger high performing firms remaining at the top. This, however, is also linked to fundamental
differences between the MNE sector and the domestic sector, with foreign firms most often leading the
frontier of productivity, as pointed out earlier in Box 3.1. Matrices for firm counts are in Annex 3.A.
The influential paper by Baily (1992) on US manufacturing plants showed a lot of movement of
firms in both directions throughout the 1970s. Less than a third of the top performers were still at
the same quintile of productivity at the end. 18% of firms at quintile 3 managed to reach quintile 4
over the span of 5 years. In addition, not all entrants came into the market with high productivity
levels (12% entered at quintile 1) and not all firms that exited had low productivity (14% exited from
quintile 5).
In New Zealand about 41% of firms that were on the frontier in 2000 remained on the frontier in
2011, but exit rates reached 56% (Conway et al, 2015).
Dutch research (van Heuvelen et al, 2018) for the years 2006-2015 shows that exits are substantial
even at the top decile (58%) and that highly productive firms, when they survive, are the most likely
to remain at the top productivity decile (41%).
Entries
0-20
20-40
40-60
60-80
80-100
Exits
0-20
20-40
40-60
60-80
80-100
Where theywere in 2006
Where theywent to in 2016
Highestproductivity
Lowestproductivity
Entries
0-20
20-40
40-60
60-80
80-100
Exits
0-20
20-40
40-60
60-80
80-100
Where theywere in 2006
Where theywent to in 2016
Highestproductivity
Lowestproductivity
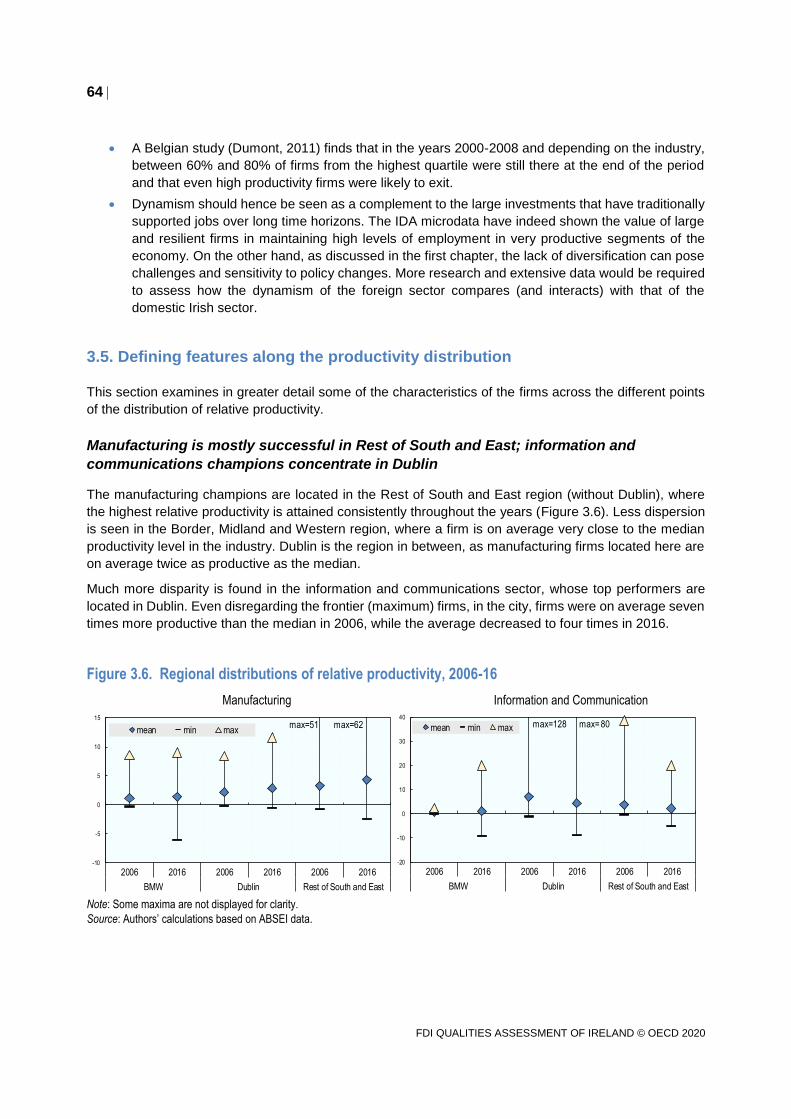
64
FDI QUALITIES ASSESSMENT OF IRELAND © OECD 2020
A Belgian study (Dumont, 2011) finds that in the years 2000-2008 and depending on the industry,
between 60% and 80% of firms from the highest quartile were still there at the end of the period
and that even high productivity firms were likely to exit.
Dynamism should hence be seen as a complement to the large investments that have traditionally
supported jobs over long time horizons. The IDA microdata have indeed shown the value of large
and resilient firms in maintaining high levels of employment in very productive segments of the
economy. On the other hand, as discussed in the first chapter, the lack of diversification can pose
challenges and sensitivity to policy changes. More research and extensive data would be required
to assess how the dynamism of the foreign sector compares (and interacts) with that of the
domestic Irish sector.
3.5. Defining features along the productivity distribution
This section examines in greater detail some of the characteristics of the firms across the different points
of the distribution of relative productivity.
Manufacturing is mostly successful in Rest of South and East; information and
communications champions concentrate in Dublin
The manufacturing champions are located in the Rest of South and East region (without Dublin), where
the highest relative productivity is attained consistently throughout the years (Figure 3.6). Less dispersion
is seen in the Border, Midland and Western region, where a firm is on average very close to the median
productivity level in the industry. Dublin is the region in between, as manufacturing firms located here are
on average twice as productive as the median.
Much more disparity is found in the information and communications sector, whose top performers are
located in Dublin. Even disregarding the frontier (maximum) firms, in the city, firms were on average seven
times more productive than the median in 2006, while the average decreased to four times in 2016.
Figure 3.6. Regional distributions of relative productivity, 2006-16
Manufacturing Information and Communication
Note: Some maxima are not displayed for clarity.
Source: Authors’ calculations based on ABSEI data.
-10
-5
0
5
10
15
2006 2016 2006 2016 2006 2016
BMW Dublin Rest of South and East
mean min maxmax=62max=51
-20
-10
0
10
20
30
40
2006 2016 2006 2016 2006 2016
BMW Dublin Rest of South and East
mean min max max=128 max= 80
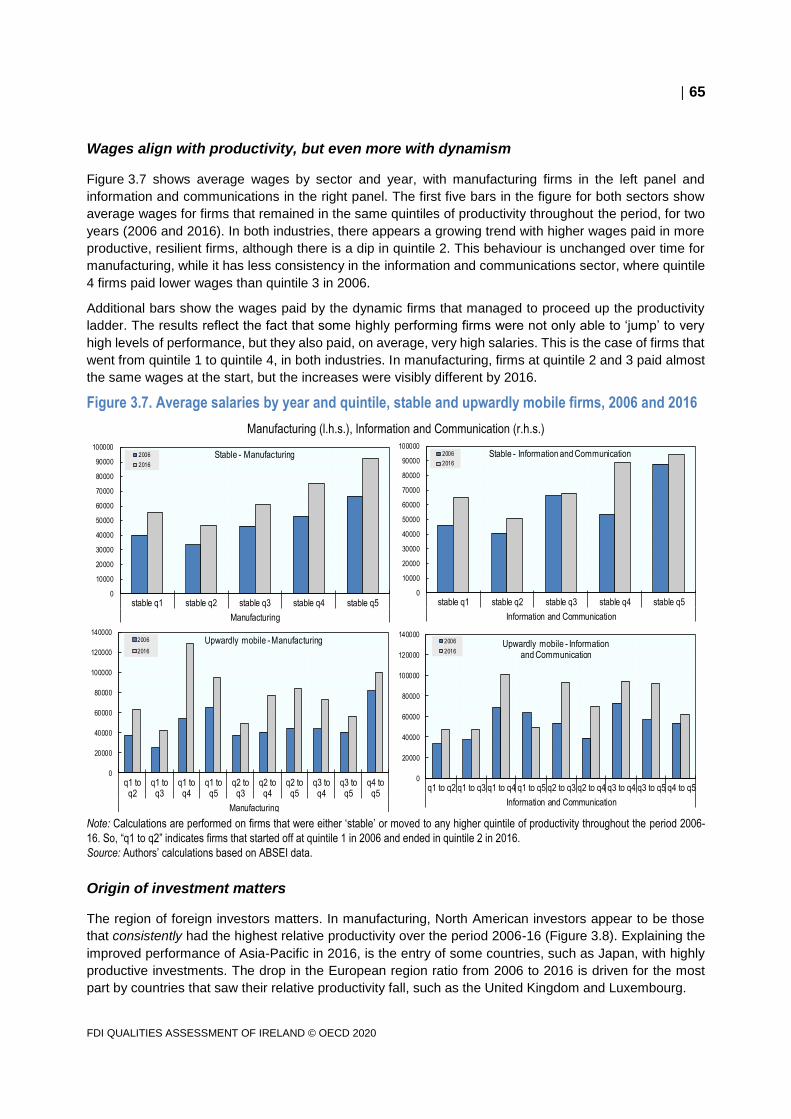
65
FDI QUALITIES ASSESSMENT OF IRELAND © OECD 2020
Wages align with productivity, but even more with dynamism
Figure 3.7 shows average wages by sector and year, with manufacturing firms in the left panel and
information and communications in the right panel. The first five bars in the figure for both sectors show
average wages for firms that remained in the same quintiles of productivity throughout the period, for two
years (2006 and 2016). In both industries, there appears a growing trend with higher wages paid in more
productive, resilient firms, although there is a dip in quintile 2. This behaviour is unchanged over time for
manufacturing, while it has less consistency in the information and communications sector, where quintile
4 firms paid lower wages than quintile 3 in 2006.
Additional bars show the wages paid by the dynamic firms that managed to proceed up the productivity
ladder. The results reflect the fact that some highly performing firms were not only able to ‘jump’ to very
high levels of performance, but they also paid, on average, very high salaries. This is the case of firms that
went from quintile 1 to quintile 4, in both industries. In manufacturing, firms at quintile 2 and 3 paid almost
the same wages at the start, but the increases were visibly different by 2016.
Figure 3.7. Average salaries by year and quintile, stable and upwardly mobile firms, 2006 and 2016
Manufacturing (l.h.s.), Information and Communication (r.h.s.)
Note: Calculations are performed on firms that were either ‘stable’ or moved to any higher quintile of productivity throughout the period 2006-
16. So, “q1 to q2” indicates firms that started off at quintile 1 in 2006 and ended in quintile 2 in 2016.
Source: Authors’ calculations based on ABSEI data.
Origin of investment matters
The region of foreign investors matters. In manufacturing, North American investors appear to be those
that consistently had the highest relative productivity over the period 2006-16 (Figure 3.8). Explaining the
improved performance of Asia-Pacific in 2016, is the entry of some countries, such as Japan, with highly
productive investments. The drop in the European region ratio from 2006 to 2016 is driven for the most
part by countries that saw their relative productivity fall, such as the United Kingdom and Luxembourg.
0
10000
20000
30000
40000
50000
60000
70000
80000
90000
100000
stable q1 stable q2 stable q3 stable q4 stable q5
Manufacturing
2006
2016
Stable - Manufacturing
0
10000
20000
30000
40000
50000
60000
70000
80000
90000
100000
stable q1 stable q2 stable q3 stable q4 stable q5
Information and Communication
2006
2016
Stable - Information and Communication
0
20000
40000
60000
80000
100000
120000
140000
q1 toq2
q1 toq3
q1 toq4
q1 toq5
q2 toq3
q2 toq4
q2 toq5
q3 toq4
q3 toq5
q4 toq5
Manufacturing
2006
2016
0
20000
40000
60000
80000
100000
120000
140000
q1 to q2 q1 to q3 q1 to q4 q1 to q5 q2 to q3 q2 to q4 q3 to q4 q3 to q5 q4 to q5
Information and Communication
2006
2016
Upwardly mobile - Manufacturing Upwardly mobile - Informationand Communication
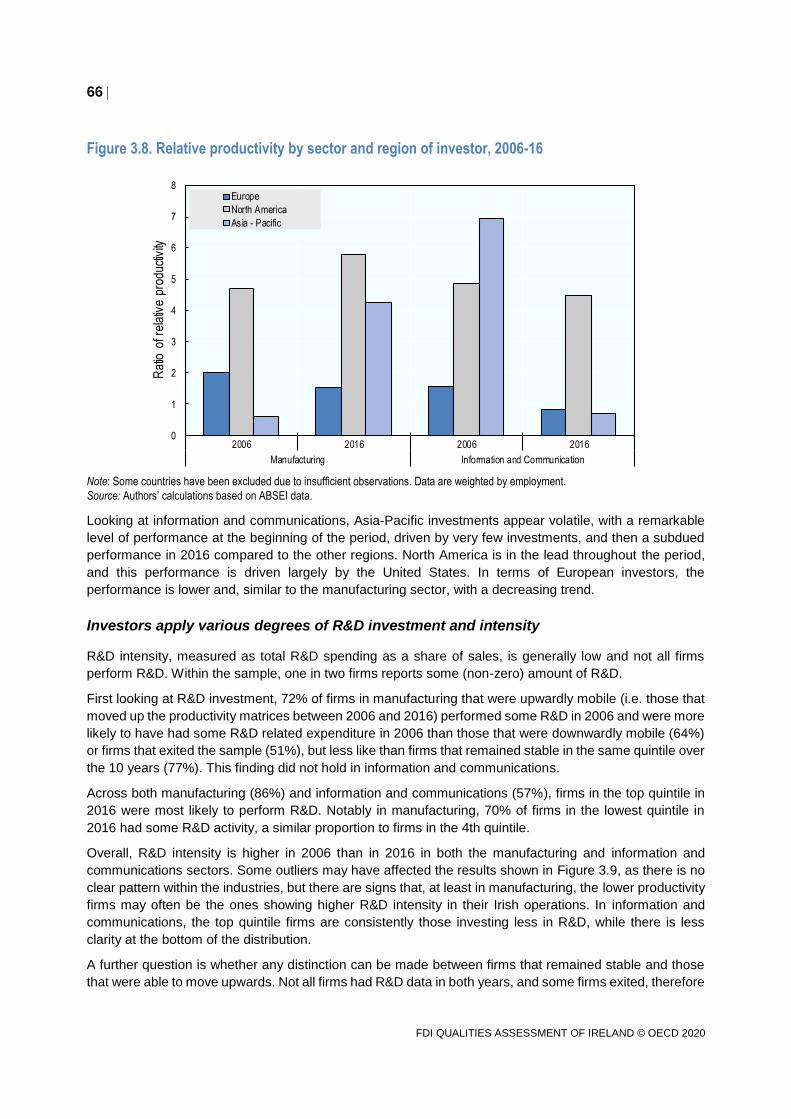
66
FDI QUALITIES ASSESSMENT OF IRELAND © OECD 2020
Figure 3.8. Relative productivity by sector and region of investor, 2006-16
0
1
2
3
4
5
6
7
8
2006 2016 2006 2016
Manufacturing Information and Communication
Rat
io o
f rel
ativ
e pr
oduc
tivity
Europe
North America
Asia - Pacific
Note: Some countries have been excluded due to insufficient observations. Data are weighted by employment.
Source: Authors’ calculations based on ABSEI data.
Looking at information and communications, Asia-Pacific investments appear volatile, with a remarkable
level of performance at the beginning of the period, driven by very few investments, and then a subdued
performance in 2016 compared to the other regions. North America is in the lead throughout the period,
and this performance is driven largely by the United States. In terms of European investors, the
performance is lower and, similar to the manufacturing sector, with a decreasing trend.
Investors apply various degrees of R&D investment and intensity
R&D intensity, measured as total R&D spending as a share of sales, is generally low and not all firms
perform R&D. Within the sample, one in two firms reports some (non-zero) amount of R&D.
First looking at R&D investment, 72% of firms in manufacturing that were upwardly mobile (i.e. those that
moved up the productivity matrices between 2006 and 2016) performed some R&D in 2006 and were more
likely to have had some R&D related expenditure in 2006 than those that were downwardly mobile (64%)
or firms that exited the sample (51%), but less like than firms that remained stable in the same quintile over
the 10 years (77%). This finding did not hold in information and communications.
Across both manufacturing (86%) and information and communications (57%), firms in the top quintile in
2016 were most likely to perform R&D. Notably in manufacturing, 70% of firms in the lowest quintile in
2016 had some R&D activity, a similar proportion to firms in the 4th quintile.
Overall, R&D intensity is higher in 2006 than in 2016 in both the manufacturing and information and
communications sectors. Some outliers may have affected the results shown in Figure 3.9, as there is no
clear pattern within the industries, but there are signs that, at least in manufacturing, the lower productivity
firms may often be the ones showing higher R&D intensity in their Irish operations. In information and
communications, the top quintile firms are consistently those investing less in R&D, while there is less
clarity at the bottom of the distribution.
A further question is whether any distinction can be made between firms that remained stable and those
that were able to move upwards. Not all firms had R&D data in both years, and some firms exited, therefore
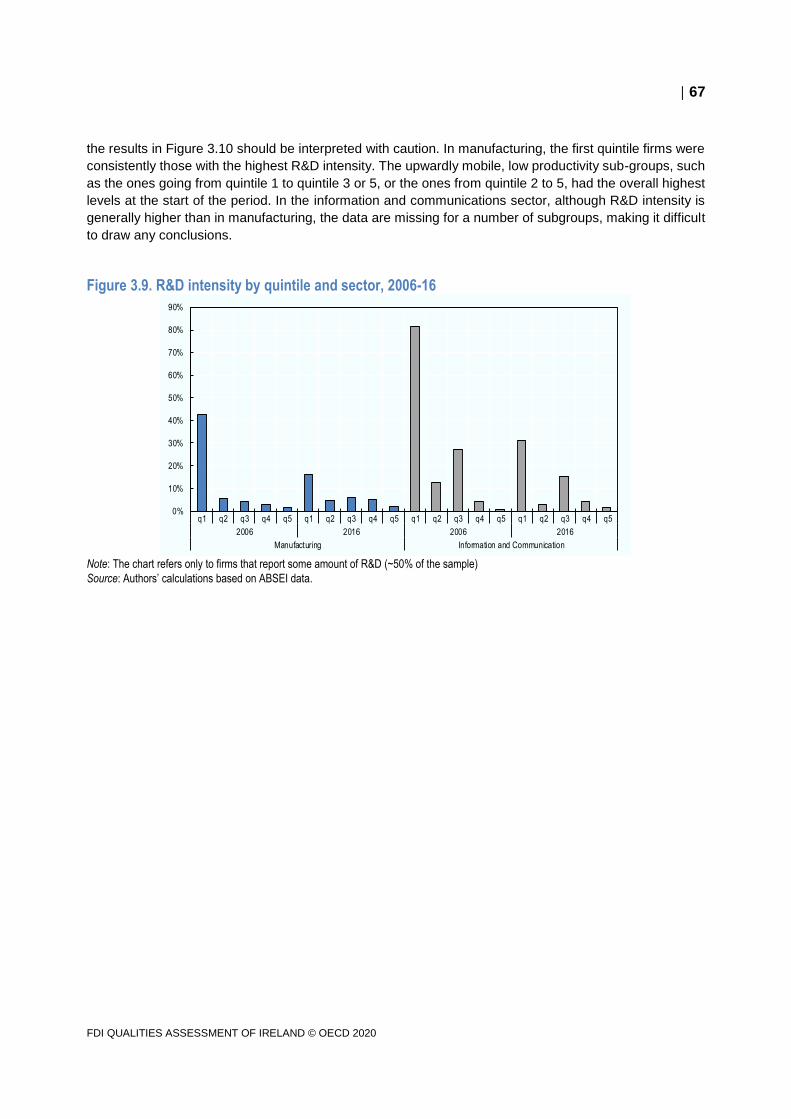
67
FDI QUALITIES ASSESSMENT OF IRELAND © OECD 2020
the results in Figure 3.10 should be interpreted with caution. In manufacturing, the first quintile firms were
consistently those with the highest R&D intensity. The upwardly mobile, low productivity sub-groups, such
as the ones going from quintile 1 to quintile 3 or 5, or the ones from quintile 2 to 5, had the overall highest
levels at the start of the period. In the information and communications sector, although R&D intensity is
generally higher than in manufacturing, the data are missing for a number of subgroups, making it difficult
to draw any conclusions.
Figure 3.9. R&D intensity by quintile and sector, 2006-16
0%
10%
20%
30%
40%
50%
60%
70%
80%
90%
q1 q2 q3 q4 q5 q1 q2 q3 q4 q5 q1 q2 q3 q4 q5 q1 q2 q3 q4 q5
2006 2016 2006 2016
Manufacturing Information and Communication
Note: The chart refers only to firms that report some amount of R&D (~50% of the sample)
Source: Authors’ calculations based on ABSEI data.
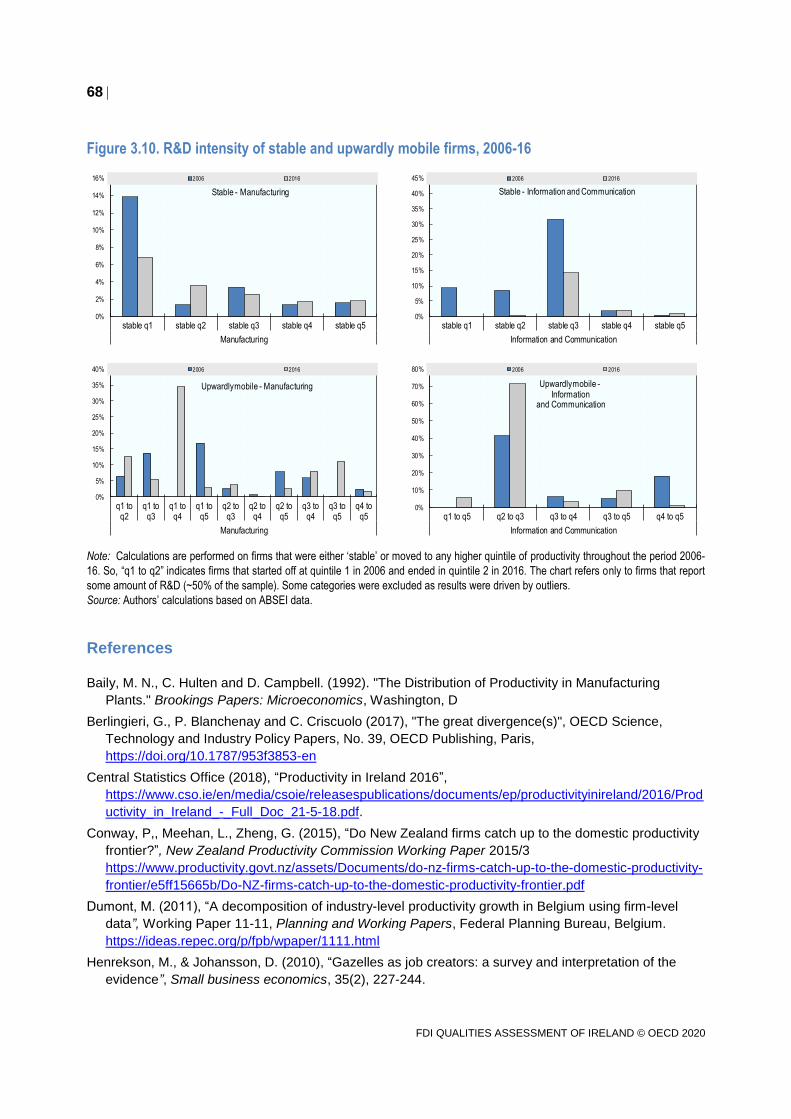
68
FDI QUALITIES ASSESSMENT OF IRELAND © OECD 2020
Figure 3.10. R&D intensity of stable and upwardly mobile firms, 2006-16
Note: Calculations are performed on firms that were either ‘stable’ or moved to any higher quintile of productivity throughout the period 2006-
16. So, “q1 to q2” indicates firms that started off at quintile 1 in 2006 and ended in quintile 2 in 2016. The chart refers only to firms that report
some amount of R&D (~50% of the sample). Some categories were excluded as results were driven by outliers.
Source: Authors’ calculations based on ABSEI data.
References
Baily, M. N., C. Hulten and D. Campbell. (1992). "The Distribution of Productivity in Manufacturing
Plants." Brookings Papers: Microeconomics, Washington, D
Berlingieri, G., P. Blanchenay and C. Criscuolo (2017), "The great divergence(s)", OECD Science,
Technology and Industry Policy Papers, No. 39, OECD Publishing, Paris,
https://doi.org/10.1787/953f3853-en
Central Statistics Office (2018), “Productivity in Ireland 2016”,
https://www.cso.ie/en/media/csoie/releasespublications/documents/ep/productivityinireland/2016/Prod
uctivity_in_Ireland_-_Full_Doc_21-5-18.pdf.
Conway, P,, Meehan, L., Zheng, G. (2015), “Do New Zealand firms catch up to the domestic productivity
frontier?”, New Zealand Productivity Commission Working Paper 2015/3
https://www.productivity.govt.nz/assets/Documents/do-nz-firms-catch-up-to-the-domestic-productivity-
frontier/e5ff15665b/Do-NZ-firms-catch-up-to-the-domestic-productivity-frontier.pdf
Dumont, M. (2011), “A decomposition of industry-level productivity growth in Belgium using firm-level
data”, Working Paper 11-11, Planning and Working Papers, Federal Planning Bureau, Belgium.
https://ideas.repec.org/p/fpb/wpaper/1111.html
Henrekson, M., & Johansson, D. (2010), “Gazelles as job creators: a survey and interpretation of the
evidence”, Small business economics, 35(2), 227-244.
0%
2%
4%
6%
8%
10%
12%
14%
16%
stable q1 stable q2 stable q3 stable q4 stable q5
Manufacturing
2006 2016
Stable - Manufacturing
0%
5%
10%
15%
20%
25%
30%
35%
40%
45%
stable q1 stable q2 stable q3 stable q4 stable q5
Information and Communication
2006 2016
Stable - Information and Communication
0%
5%
10%
15%
20%
25%
30%
35%
40%
q1 toq2
q1 toq3
q1 toq4
q1 toq5
q2 toq3
q2 toq4
q2 toq5
q3 toq4
q3 toq5
q4 toq5
Manufacturing
2006 2016
Upwardly mobile - Manufacturing
0%
10%
20%
30%
40%
50%
60%
70%
80%
q1 to q5 q2 to q3 q3 to q4 q3 to q5 q4 to q5
Information and Communication
2006 2016
Upwardly mobile -Information
and Communication

69
FDI QUALITIES ASSESSMENT OF IRELAND © OECD 2020
van Heuvelen, G.H, Bettendorf, L., and Meijerink, G.(2018), “Frontier firms and followers in the
Netherlands - Estimating productivity and identifying the frontier”, CPB Background Document,
https://www.cpb.nl/sites/default/files/omnidownload/CPB-Background-Document-July2018-Frontier-
firms-and-followers-in-the-Netherlands.pdf
National Competitiveness Council (2018), “Productivity Statement”,
http://www.competitiveness.ie/Publications/2018/NCC-Productivity-Statement-2018.pdf
Papa, J., L. Rehill and B. O’Connor (2018), Patterns of firm level productivity in Ireland, OECD
Productivity Working Papers, No. 15, OECD Publishing, Paris, https://dx.doi.org/10.1787/1a04730d-
en.
Syverson, C. (2011). “What determines productivity?”, Journal of Economic Literature, Vol 49(2), pp.
326-65.
70
FDI QUALITIES ASSESSMENT OF IRELAND © OECD 2020
Annex 3.A. Methodology and data
Glossary of statistical terms used in this chapter
Median: The median is that value which divides the total frequency of a variable into two halves.
Percentiles: The set of partition values which divide the total frequency into one hundred equal parts
Quantiles: The class (n-1) partition values of a variate which divide the total frequency of a population or
a sample into a given number n of equal proportions. For example, if n=4 the n-1 values are the quartiles
although the central variate value is generally termed the median.
Quintiles: The set of four values which divide the total frequency of a variable into five equal parts.
Relative productivity: the ratio between an enterprise’s labour productivity and the median, calculated at
the sector level.
Methodology and data
Much of the methodology for this chapter draws from an influential paper by Baily et al (1992) that applied
different decompositions, including transition matrices, to determine the contribution of ‘stayers’, ‘entries’
and ‘exits’ to labour productivity growth of US manufacturing plants.
The analysis in this report used IDA data from the Annual Business Survey of Economic Impact (ABSEI)
and the Annual Employment Survey (AES). The ABSEI covers firms served by IDA Ireland with more than
10 employees and has a response rate of about 60%. A relatively simple cleaning routine was applied to
the data, combining checks for outliers and consistency with the IDA Employment survey. The AES is
broader in scope as it includes not only companies under the remit of IDA Ireland (of any size), but also
Enterprise Ireland and Údarás na Gaeltachta.
Overview
The analysis covers the years from 2006 to 2016. All data were anonymised and accessed solely at IDA
secured premises.
Two sectors were the focus of the study
Manufacturing includes all section C industries (NACE codes from C10 to C33)
Information and Communication (IC) includes all section J industries (NACE codes from J58 to
J63)
Then, for the analysis at a more granular level which is shown in this annex, the key industries were:
C21 - manufacture of basic pharmaceutical products and pharmaceutical preparations, combined
with C32.5 - manufacture of medical and dental instruments and supplies
C26 - manufacture of computer, electronic and optical products
J62 - computer programming, consultancy and related activities
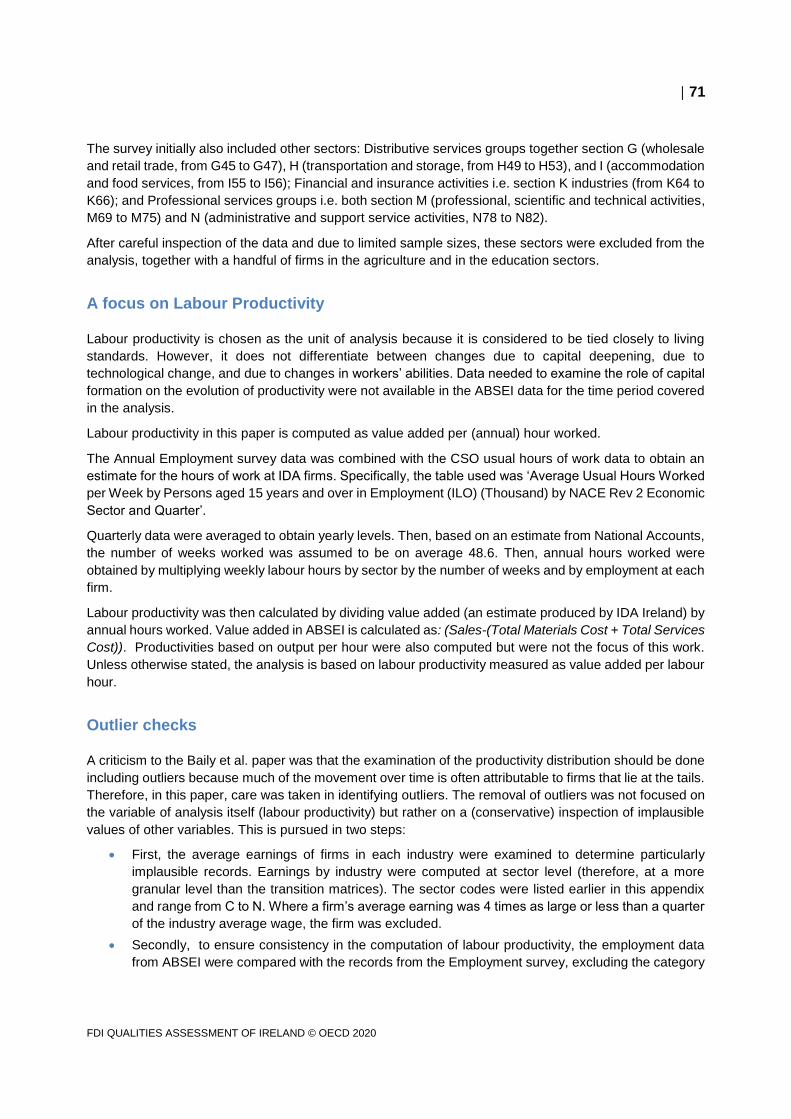
71
FDI QUALITIES ASSESSMENT OF IRELAND © OECD 2020
The survey initially also included other sectors: Distributive services groups together section G (wholesale
and retail trade, from G45 to G47), H (transportation and storage, from H49 to H53), and I (accommodation
and food services, from I55 to I56); Financial and insurance activities i.e. section K industries (from K64 to
K66); and Professional services groups i.e. both section M (professional, scientific and technical activities,
M69 to M75) and N (administrative and support service activities, N78 to N82).
After careful inspection of the data and due to limited sample sizes, these sectors were excluded from the
analysis, together with a handful of firms in the agriculture and in the education sectors.
A focus on Labour Productivity
Labour productivity is chosen as the unit of analysis because it is considered to be tied closely to living
standards. However, it does not differentiate between changes due to capital deepening, due to
technological change, and due to changes in workers’ abilities. Data needed to examine the role of capital
formation on the evolution of productivity were not available in the ABSEI data for the time period covered
in the analysis.
Labour productivity in this paper is computed as value added per (annual) hour worked.
The Annual Employment survey data was combined with the CSO usual hours of work data to obtain an
estimate for the hours of work at IDA firms. Specifically, the table used was ‘Average Usual Hours Worked
per Week by Persons aged 15 years and over in Employment (ILO) (Thousand) by NACE Rev 2 Economic
Sector and Quarter’.
Quarterly data were averaged to obtain yearly levels. Then, based on an estimate from National Accounts,
the number of weeks worked was assumed to be on average 48.6. Then, annual hours worked were
obtained by multiplying weekly labour hours by sector by the number of weeks and by employment at each
firm.
Labour productivity was then calculated by dividing value added (an estimate produced by IDA Ireland) by
annual hours worked. Value added in ABSEI is calculated as: (Sales-(Total Materials Cost + Total Services
Cost)). Productivities based on output per hour were also computed but were not the focus of this work.
Unless otherwise stated, the analysis is based on labour productivity measured as value added per labour
hour.
Outlier checks
A criticism to the Baily et al. paper was that the examination of the productivity distribution should be done
including outliers because much of the movement over time is often attributable to firms that lie at the tails.
Therefore, in this paper, care was taken in identifying outliers. The removal of outliers was not focused on
the variable of analysis itself (labour productivity) but rather on a (conservative) inspection of implausible
values of other variables. This is pursued in two steps:
First, the average earnings of firms in each industry were examined to determine particularly
implausible records. Earnings by industry were computed at sector level (therefore, at a more
granular level than the transition matrices). The sector codes were listed earlier in this appendix
and range from C to N. Where a firm’s average earning was 4 times as large or less than a quarter
of the industry average wage, the firm was excluded.
Secondly, to ensure consistency in the computation of labour productivity, the employment data
from ABSEI were compared with the records from the Employment survey, excluding the category
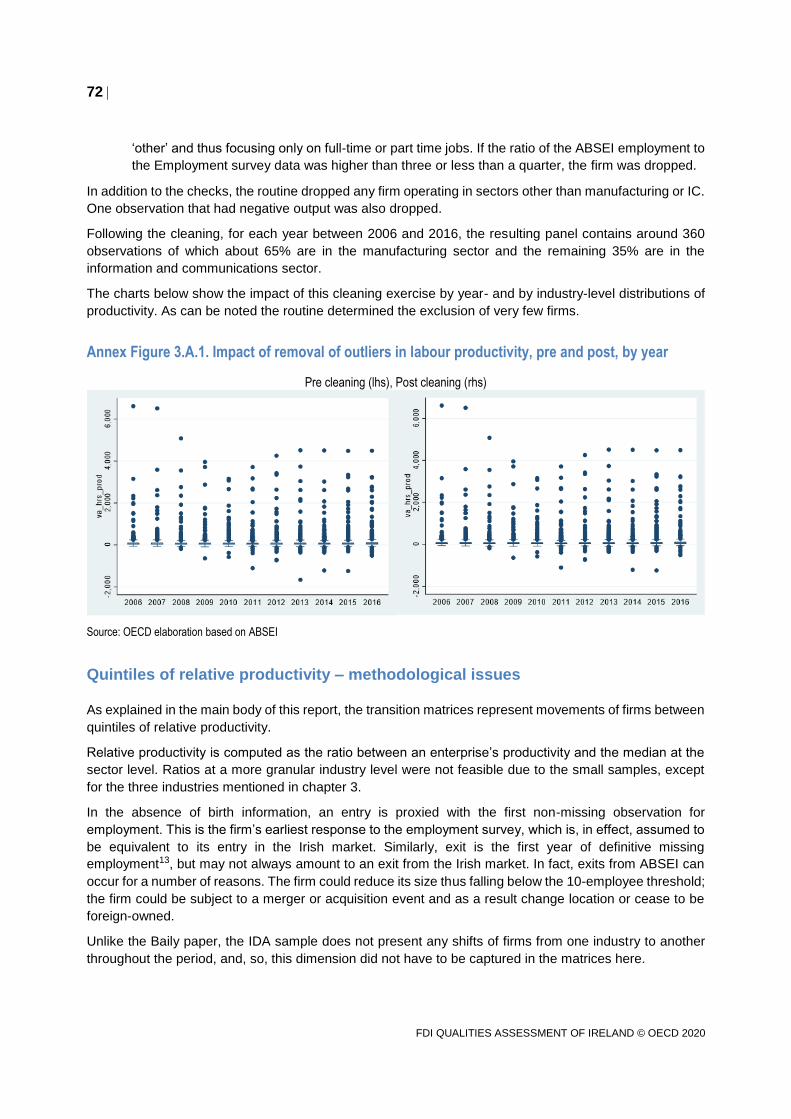
72
FDI QUALITIES ASSESSMENT OF IRELAND © OECD 2020
‘other’ and thus focusing only on full-time or part time jobs. If the ratio of the ABSEI employment to
the Employment survey data was higher than three or less than a quarter, the firm was dropped.
In addition to the checks, the routine dropped any firm operating in sectors other than manufacturing or IC.
One observation that had negative output was also dropped.
Following the cleaning, for each year between 2006 and 2016, the resulting panel contains around 360
observations of which about 65% are in the manufacturing sector and the remaining 35% are in the
information and communications sector.
The charts below show the impact of this cleaning exercise by year- and by industry-level distributions of
productivity. As can be noted the routine determined the exclusion of very few firms.
Annex Figure 3.A.1. Impact of removal of outliers in labour productivity, pre and post, by year
Pre cleaning (lhs), Post cleaning (rhs)
Source: OECD elaboration based on ABSEI
Quintiles of relative productivity – methodological issues
As explained in the main body of this report, the transition matrices represent movements of firms between
quintiles of relative productivity.
Relative productivity is computed as the ratio between an enterprise’s productivity and the median at the
sector level. Ratios at a more granular industry level were not feasible due to the small samples, except
for the three industries mentioned in chapter 3.
In the absence of birth information, an entry is proxied with the first non-missing observation for
employment. This is the firm’s earliest response to the employment survey, which is, in effect, assumed to
be equivalent to its entry in the Irish market. Similarly, exit is the first year of definitive missing
employment13, but may not always amount to an exit from the Irish market. In fact, exits from ABSEI can
occur for a number of reasons. The firm could reduce its size thus falling below the 10-employee threshold;
the firm could be subject to a merger or acquisition event and as a result change location or cease to be
foreign-owned.
Unlike the Baily paper, the IDA sample does not present any shifts of firms from one industry to another
throughout the period, and, so, this dimension did not have to be captured in the matrices here.
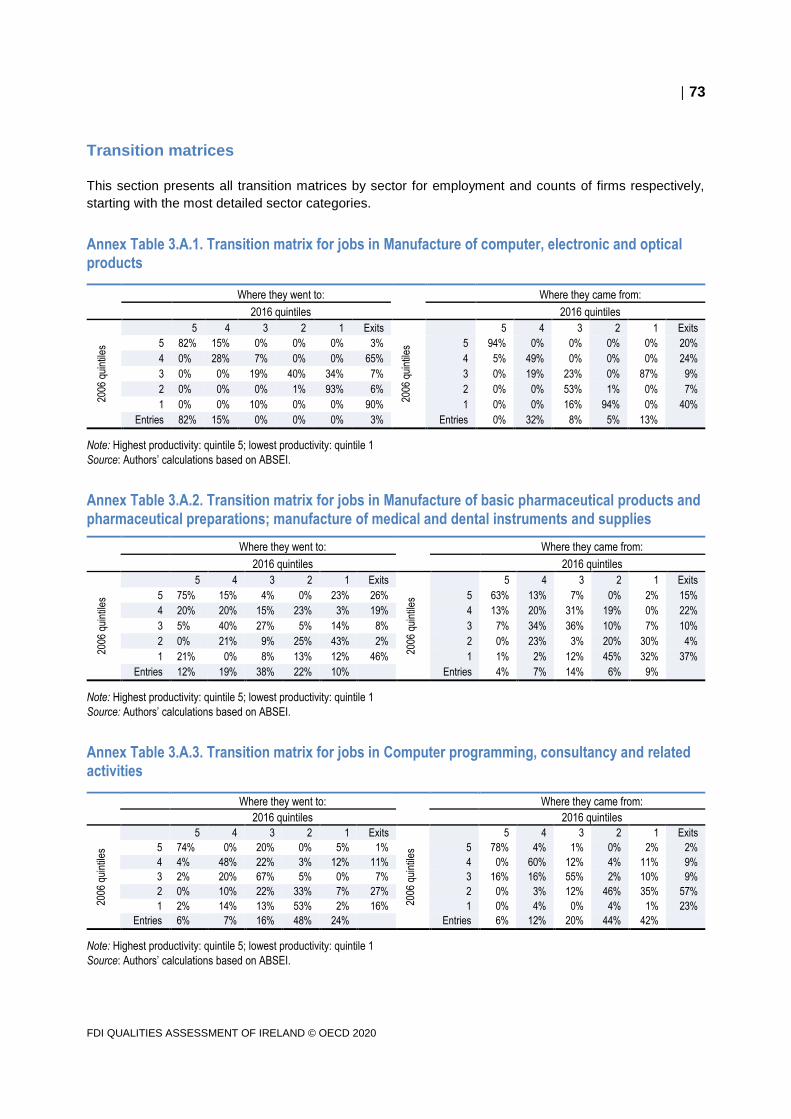
73
FDI QUALITIES ASSESSMENT OF IRELAND © OECD 2020
Transition matrices
This section presents all transition matrices by sector for employment and counts of firms respectively,
starting with the most detailed sector categories.
Annex Table 3.A.1. Transition matrix for jobs in Manufacture of computer, electronic and optical products
Where they went to:
Where they came from:
2016 quintiles 2016 quintiles
2006
qui
ntile
s
5 4 3 2 1 Exits
2006
qui
ntile
s
5 4 3 2 1 Exits
5 82% 15% 0% 0% 0% 3% 5 94% 0% 0% 0% 0% 20%
4 0% 28% 7% 0% 0% 65% 4 5% 49% 0% 0% 0% 24%
3 0% 0% 19% 40% 34% 7% 3 0% 19% 23% 0% 87% 9%
2 0% 0% 0% 1% 93% 6% 2 0% 0% 53% 1% 0% 7%
1 0% 0% 10% 0% 0% 90% 1 0% 0% 16% 94% 0% 40%
Entries 82% 15% 0% 0% 0% 3% Entries 0% 32% 8% 5% 13%
Note: Highest productivity: quintile 5; lowest productivity: quintile 1
Source: Authors’ calculations based on ABSEI.
Annex Table 3.A.2. Transition matrix for jobs in Manufacture of basic pharmaceutical products and pharmaceutical preparations; manufacture of medical and dental instruments and supplies
Where they went to:
Where they came from:
2016 quintiles 2016 quintiles
2006
qui
ntile
s
5 4 3 2 1 Exits
2006
qui
ntile
s
5 4 3 2 1 Exits
5 75% 15% 4% 0% 23% 26% 5 63% 13% 7% 0% 2% 15%
4 20% 20% 15% 23% 3% 19% 4 13% 20% 31% 19% 0% 22%
3 5% 40% 27% 5% 14% 8% 3 7% 34% 36% 10% 7% 10%
2 0% 21% 9% 25% 43% 2% 2 0% 23% 3% 20% 30% 4%
1 21% 0% 8% 13% 12% 46% 1 1% 2% 12% 45% 32% 37%
Entries 12% 19% 38% 22% 10% Entries 4% 7% 14% 6% 9%
Note: Highest productivity: quintile 5; lowest productivity: quintile 1
Source: Authors’ calculations based on ABSEI.
Annex Table 3.A.3. Transition matrix for jobs in Computer programming, consultancy and related activities
Where they went to:
Where they came from:
2016 quintiles 2016 quintiles
2006
qui
ntile
s
5 4 3 2 1 Exits
2006
qui
ntile
s
5 4 3 2 1 Exits
5 74% 0% 20% 0% 5% 1% 5 78% 4% 1% 0% 2% 2%
4 4% 48% 22% 3% 12% 11% 4 0% 60% 12% 4% 11% 9%
3 2% 20% 67% 5% 0% 7% 3 16% 16% 55% 2% 10% 9%
2 0% 10% 22% 33% 7% 27% 2 0% 3% 12% 46% 35% 57%
1 2% 14% 13% 53% 2% 16% 1 0% 4% 0% 4% 1% 23%
Entries 6% 7% 16% 48% 24% Entries 6% 12% 20% 44% 42%
Note: Highest productivity: quintile 5; lowest productivity: quintile 1
Source: Authors’ calculations based on ABSEI.
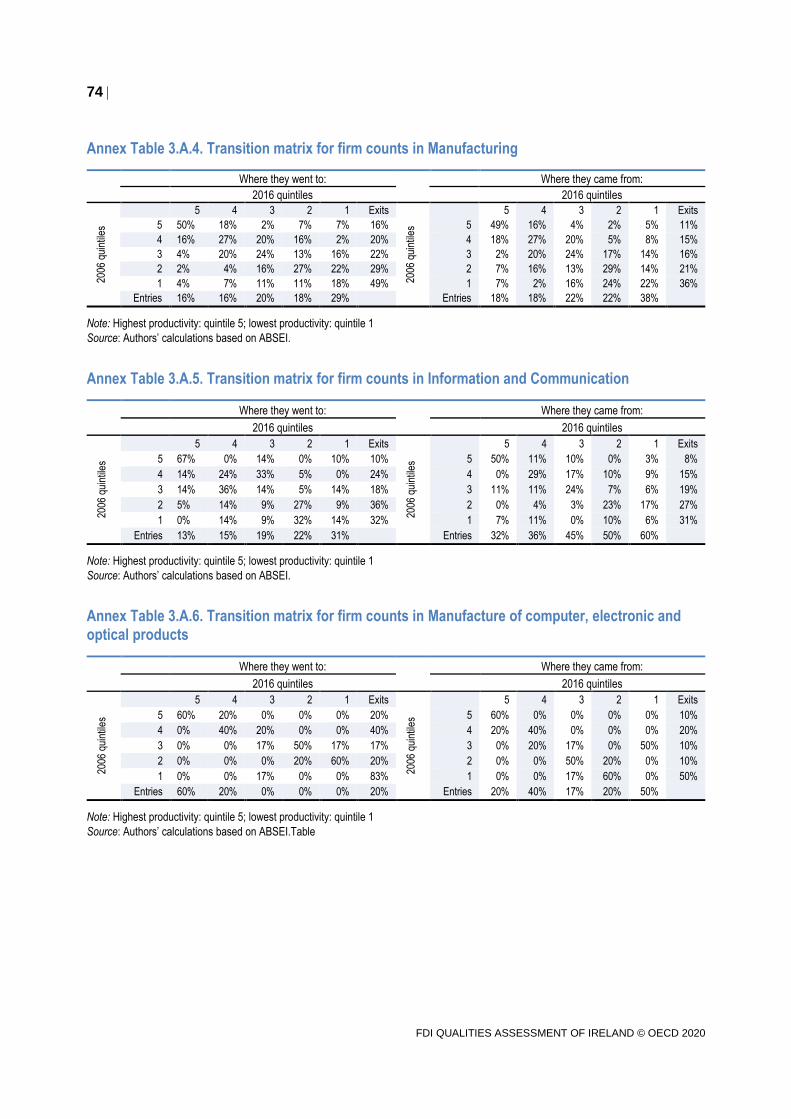
74
FDI QUALITIES ASSESSMENT OF IRELAND © OECD 2020
Annex Table 3.A.4. Transition matrix for firm counts in Manufacturing
Where they went to:
Where they came from:
2016 quintiles 2016 quintiles
2006
qui
ntile
s
5 4 3 2 1 Exits
2006
qui
ntile
s
5 4 3 2 1 Exits
5 50% 18% 2% 7% 7% 16% 5 49% 16% 4% 2% 5% 11%
4 16% 27% 20% 16% 2% 20% 4 18% 27% 20% 5% 8% 15%
3 4% 20% 24% 13% 16% 22% 3 2% 20% 24% 17% 14% 16%
2 2% 4% 16% 27% 22% 29% 2 7% 16% 13% 29% 14% 21%
1 4% 7% 11% 11% 18% 49% 1 7% 2% 16% 24% 22% 36%
Entries 16% 16% 20% 18% 29%
Entries 18% 18% 22% 22% 38%
Note: Highest productivity: quintile 5; lowest productivity: quintile 1
Source: Authors’ calculations based on ABSEI.
Annex Table 3.A.5. Transition matrix for firm counts in Information and Communication
Where they went to:
Where they came from:
2016 quintiles 2016 quintiles
2006
qui
ntile
s
5 4 3 2 1 Exits
2006
qui
ntile
s
5 4 3 2 1 Exits
5 67% 0% 14% 0% 10% 10% 5 50% 11% 10% 0% 3% 8%
4 14% 24% 33% 5% 0% 24% 4 0% 29% 17% 10% 9% 15%
3 14% 36% 14% 5% 14% 18% 3 11% 11% 24% 7% 6% 19%
2 5% 14% 9% 27% 9% 36% 2 0% 4% 3% 23% 17% 27%
1 0% 14% 9% 32% 14% 32% 1 7% 11% 0% 10% 6% 31%
Entries 13% 15% 19% 22% 31%
Entries 32% 36% 45% 50% 60%
Note: Highest productivity: quintile 5; lowest productivity: quintile 1
Source: Authors’ calculations based on ABSEI.
Annex Table 3.A.6. Transition matrix for firm counts in Manufacture of computer, electronic and optical products
Where they went to:
Where they came from:
2016 quintiles 2016 quintiles
2006
qui
ntile
s
5 4 3 2 1 Exits
2006
qui
ntile
s
5 4 3 2 1 Exits
5 60% 20% 0% 0% 0% 20% 5 60% 0% 0% 0% 0% 10%
4 0% 40% 20% 0% 0% 40% 4 20% 40% 0% 0% 0% 20%
3 0% 0% 17% 50% 17% 17% 3 0% 20% 17% 0% 50% 10%
2 0% 0% 0% 20% 60% 20% 2 0% 0% 50% 20% 0% 10%
1 0% 0% 17% 0% 0% 83% 1 0% 0% 17% 60% 0% 50%
Entries 60% 20% 0% 0% 0% 20% Entries 20% 40% 17% 20% 50%
Note: Highest productivity: quintile 5; lowest productivity: quintile 1
Source: Authors’ calculations based on ABSEI.Table
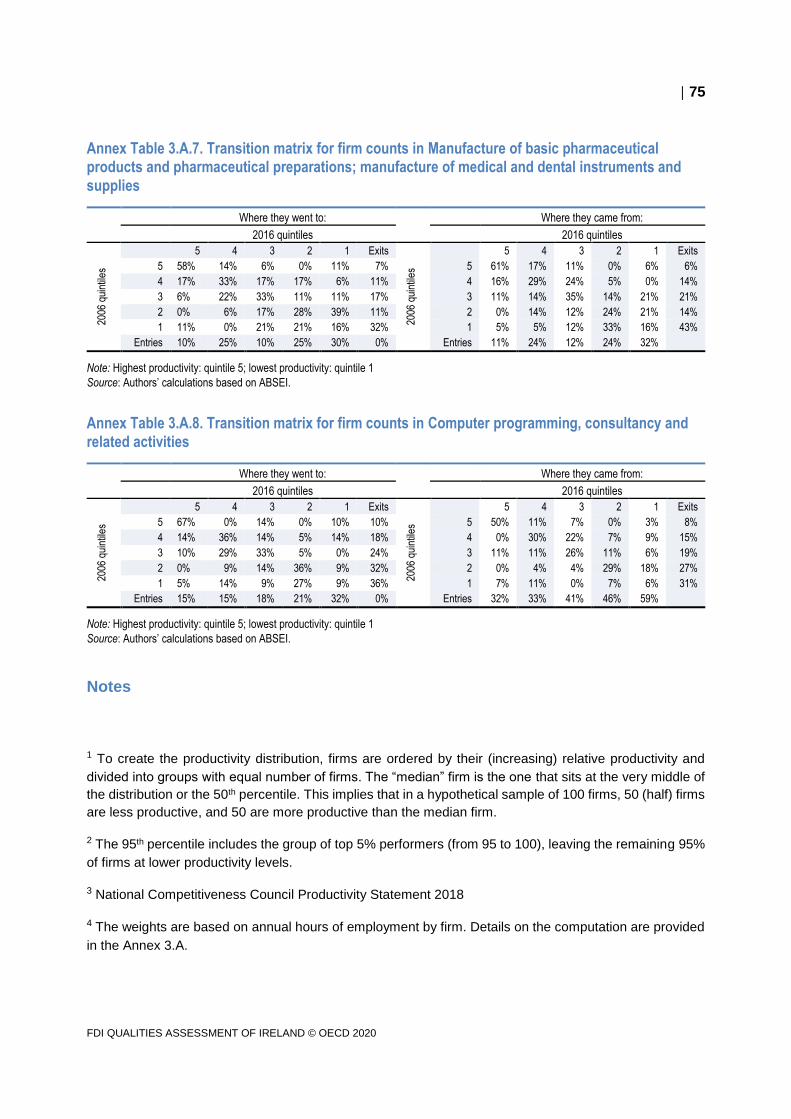
75
FDI QUALITIES ASSESSMENT OF IRELAND © OECD 2020
Annex Table 3.A.7. Transition matrix for firm counts in Manufacture of basic pharmaceutical products and pharmaceutical preparations; manufacture of medical and dental instruments and supplies
Where they went to:
Where they came from:
2016 quintiles 2016 quintiles
2006
qui
ntile
s
5 4 3 2 1 Exits
2006
qui
ntile
s
5 4 3 2 1 Exits
5 58% 14% 6% 0% 11% 7% 5 61% 17% 11% 0% 6% 6%
4 17% 33% 17% 17% 6% 11% 4 16% 29% 24% 5% 0% 14%
3 6% 22% 33% 11% 11% 17% 3 11% 14% 35% 14% 21% 21%
2 0% 6% 17% 28% 39% 11% 2 0% 14% 12% 24% 21% 14%
1 11% 0% 21% 21% 16% 32% 1 5% 5% 12% 33% 16% 43%
Entries 10% 25% 10% 25% 30% 0% Entries 11% 24% 12% 24% 32%
Note: Highest productivity: quintile 5; lowest productivity: quintile 1
Source: Authors’ calculations based on ABSEI.
Annex Table 3.A.8. Transition matrix for firm counts in Computer programming, consultancy and related activities
Where they went to:
Where they came from:
2016 quintiles 2016 quintiles
2006
qui
ntile
s
5 4 3 2 1 Exits
2006
qui
ntile
s
5 4 3 2 1 Exits
5 67% 0% 14% 0% 10% 10% 5 50% 11% 7% 0% 3% 8%
4 14% 36% 14% 5% 14% 18% 4 0% 30% 22% 7% 9% 15%
3 10% 29% 33% 5% 0% 24% 3 11% 11% 26% 11% 6% 19%
2 0% 9% 14% 36% 9% 32% 2 0% 4% 4% 29% 18% 27%
1 5% 14% 9% 27% 9% 36% 1 7% 11% 0% 7% 6% 31%
Entries 15% 15% 18% 21% 32% 0% Entries 32% 33% 41% 46% 59%
Note: Highest productivity: quintile 5; lowest productivity: quintile 1
Source: Authors’ calculations based on ABSEI.
Notes
1 To create the productivity distribution, firms are ordered by their (increasing) relative productivity and
divided into groups with equal number of firms. The “median” firm is the one that sits at the very middle of
the distribution or the 50th percentile. This implies that in a hypothetical sample of 100 firms, 50 (half) firms
are less productive, and 50 are more productive than the median firm.
2 The 95th percentile includes the group of top 5% performers (from 95 to 100), leaving the remaining 95%
of firms at lower productivity levels.
3 National Competitiveness Council Productivity Statement 2018
4 The weights are based on annual hours of employment by firm. Details on the computation are provided
in the Annex 3.A.
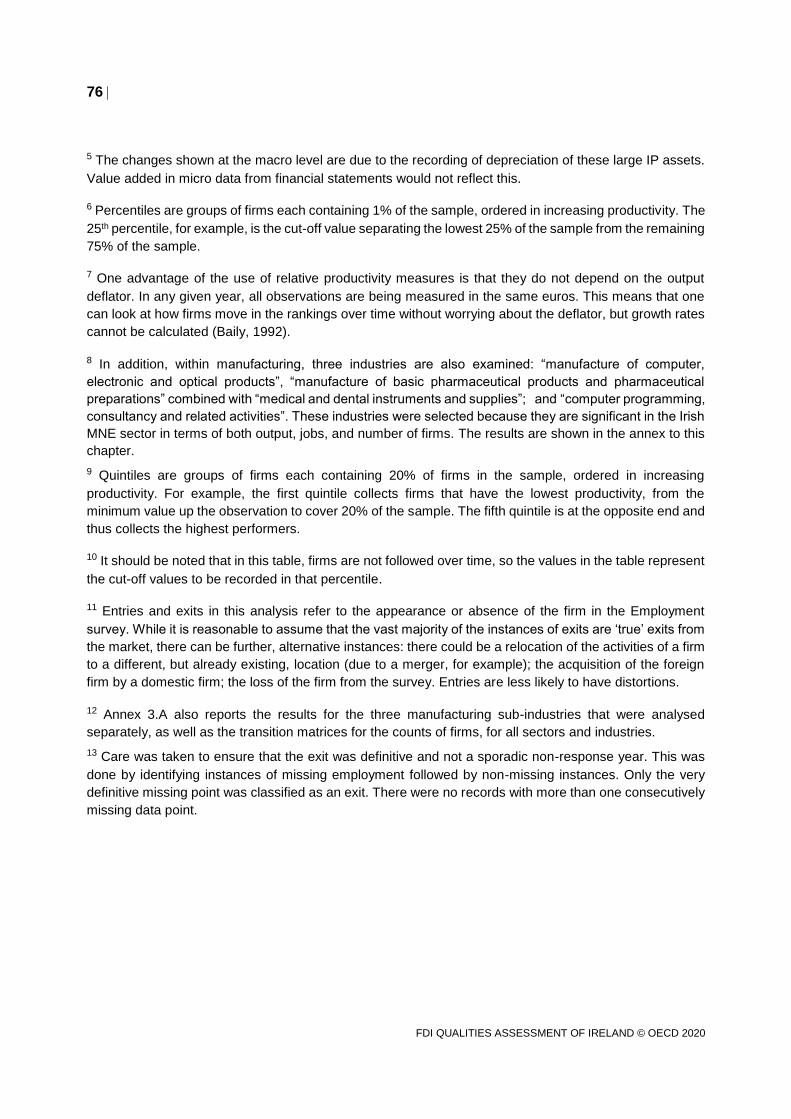
76
FDI QUALITIES ASSESSMENT OF IRELAND © OECD 2020
5 The changes shown at the macro level are due to the recording of depreciation of these large IP assets.
Value added in micro data from financial statements would not reflect this.
6 Percentiles are groups of firms each containing 1% of the sample, ordered in increasing productivity. The
25th percentile, for example, is the cut-off value separating the lowest 25% of the sample from the remaining
75% of the sample.
7 One advantage of the use of relative productivity measures is that they do not depend on the output
deflator. In any given year, all observations are being measured in the same euros. This means that one
can look at how firms move in the rankings over time without worrying about the deflator, but growth rates
cannot be calculated (Baily, 1992).
8 In addition, within manufacturing, three industries are also examined: “manufacture of computer,
electronic and optical products”, “manufacture of basic pharmaceutical products and pharmaceutical
preparations” combined with “medical and dental instruments and supplies”; and “computer programming,
consultancy and related activities”. These industries were selected because they are significant in the Irish
MNE sector in terms of both output, jobs, and number of firms. The results are shown in the annex to this
chapter.
9 Quintiles are groups of firms each containing 20% of firms in the sample, ordered in increasing
productivity. For example, the first quintile collects firms that have the lowest productivity, from the
minimum value up the observation to cover 20% of the sample. The fifth quintile is at the opposite end and
thus collects the highest performers.
10 It should be noted that in this table, firms are not followed over time, so the values in the table represent
the cut-off values to be recorded in that percentile.
11 Entries and exits in this analysis refer to the appearance or absence of the firm in the Employment
survey. While it is reasonable to assume that the vast majority of the instances of exits are ‘true’ exits from
the market, there can be further, alternative instances: there could be a relocation of the activities of a firm
to a different, but already existing, location (due to a merger, for example); the acquisition of the foreign
firm by a domestic firm; the loss of the firm from the survey. Entries are less likely to have distortions.
12 Annex 3.A also reports the results for the three manufacturing sub-industries that were analysed
separately, as well as the transition matrices for the counts of firms, for all sectors and industries.
13 Care was taken to ensure that the exit was definitive and not a sporadic non-response year. This was
done by identifying instances of missing employment followed by non-missing instances. Only the very
definitive missing point was classified as an exit. There were no records with more than one consecutively
missing data point.
77
FDI QUALITIES ASSESSMENT OF IRELAND © OECD 2020
The potential for spillovers of FDI on productivity and innovation in host
economies, and particularly on domestic firms, is determined by a variety of
factors. While spillovers are not directly measured in this chapter, it examines
a few indicators to study factors often associated with the extent and potential
for spillovers, including: the capabilities gap between domestic and foreign
firms; the ‘proximity’ to foreign firms, such as through business linkages; and
the movement of labour from foreign to domestic firms. The chapter also
examines a specific type of labour mobility, namely the mobility of patent
inventors, and associated FDI spillovers in Ireland.
4. Factors driving FDI spillovers in
Ireland
78
FDI QUALITIES ASSESSMENT OF IRELAND © OECD 2020
4.1. Summary
The potential for spillovers of FDI on productivity and innovation in host economies, and particularly on
domestic firms, is determined by a variety of factors. While spillovers are not directly measured in this
chapter, a few indicators shed some light on the potential for productivity and innovation spillovers.1
Research has shown that the extent of spillovers is affected by several factors, including: the capabilities
gap between domestic and foreign firms; the ‘proximity’ to foreign firms, such as through business linkages;
and the movement of labour from foreign to domestic firms.
The capabilities gap reflects the ability of domestic firms to adopt foreign technology and to benefit from
FDI spillovers. There are significant productivity gaps between domestic and foreign firms, but the size of
the gaps varies across sectors. Foreign firms in chemicals were ten times more productive than the few
domestic firms in this industry, but only 1.5 times more productive than domestic firms in transport
equipment manufacturing. Foreign firms are also more productive than domestic firms in all regions, with
the largest gap in the South and East where foreign firms were five times more productive.
While capacity gaps as measured in this report are not precise enough to provide concrete guidance, the
assessment shows in which sectors and regions gaps are higher and catching up efforts may be more
warranted. Gaps are particularly high in some sectors and regions where domestic firms might be less
present (e.g. chemicals) or where global frontier firms are responsible for disproportionate performance
gaps and for productivity disparities even within the group of foreign affiliates (e.g. in manufacturing in the
rest of South and East, or in information and communications in Dublin). As such, it might prove useful to
target policy efforts to ‘secondary’ foreign affiliates with which domestic firms have lower capacity gaps,
are more likely to engage in business linkages, and from which they are more likely to learn. Recent
research shows that innovation spillovers on domestic firms from ‘secondary’ foreign firms are more likely
to materialise than those from the global frontier innovators (Crescenzi, 2017). Finally, and importantly,
one needs to recall that higher performance of foreign firms across sectors and regions directly and
positively contributes to the Irish economy. This finding underpins a conclusion made in Chapter 2 that
foreign firms are not only concentrated in higher productivity sectors but they are also outperforming
domestic peers within sectors.
Business linkages can increase domestic firms’ productivity by enabling domestic firms to reduce costs
and innovate. Foreign affiliates’ sourcing from domestic firms is discussed in Chapter 1 (Section 1.4) in the
context of Ireland’s integration in global value chains (GVCs). It shows that foreign affiliates source less
domestically and their domestic sourcing benefits less domestic companies compared to foreign affiliates
in the OECD overall. Similar results hold for other small open economies such as Luxembourg, Belgium
and the Netherlands. Therefore, strengthening the capabilities of domestic firms is essential to enhance
spillovers from FDI. A collaborative approach between IDA and other government agencies in charge of
enterprise development, trade, innovation, and skills development is important to design and implement
policies that support the development of domestic firms’ capabilities and linkages.
Another important channel for spillovers between foreign and domestic firms is the movement of workers.
When workers move from foreign firms to domestic firms, they can bring knowledge and skills that can
enhance the domestic firms’ performance. Between 2009 and 2015, more than one out of every four
employees at foreign firms either moved to a domestic firm or became self-employed. In addition, more
than one in three start up founders previously worked at a foreign firm. This movement of workers between
foreign and domestic firms promotes knowledge spillovers.
The chapter includes a dedicated section on the role of FDI on patents, and relatedly on mobility of
researchers associated with patents. Foreign MNEs are responsible for the bulk of patenting in Ireland:
about 80% of all patents granted in Ireland were filed by foreign MNEs. Inventors in foreign affiliates are
on average 20% more likely to file a patent than inventors in domestic firms, even though domestic firms,
79
FDI QUALITIES ASSESSMENT OF IRELAND © OECD 2020
in general, are more likely to engage in R&D activities. Beyond the important role of FDI for innovation
outputs (in the form of patents) in Ireland, it is shown that Irish-based inventors are very likely to move
corporate affiliations. One out of two inventors changed employer at least once over 2006-16 and they
thereby enable knowledge spillovers across organisations. As most inventors are based in foreign MNEs,
FDI spillovers related to inventor mobility also play an important role in Ireland.
4.2. Identifying domestic firms’ productive capacities
Spillovers from MNEs to the host economy do not occur automatically and might not materialise at all
(Smeets, 2008). An important factor determining whether FDI spillovers take place is the extent of
capabilities of domestic firms – involving quality standards, human capital, etc. – to capture and absorb
knowledge from foreign affiliates and interact with them through business linkages (see Chapter 1, Section
1.4). Absorptive capacities are often measured in terms of performance gaps between foreign and
domestic firms, including with respect to differences in labour productivity, R&D activities and human
capital development (Box 4.1).
Productivity premia of foreign firms are high in some sectors and regions
Building on the OECD’s FDI Qualities Indicators (OECD, 2019), an estimate of the productivity gap
between foreign firms and Irish companies is produced across sectors and regions. In most sectors, foreign
firms have a productivity premium over Irish firms (Figure 4.1, Panel A). This productivity gap varies widely
across sectors. For instance, in chemicals where few domestic firms operate, foreign firms are almost 10
times more productive than domestic firms, while in transport equipment manufacturing the gap is much
lower. In both sectors, value added produced by domestic firms is relatively low compared to other sectors
(indicated by dotted bars in the figure) and thus illustrates that the contribution of domestic firms and their
capabilities are rather limited in these industries, potentially explaining productivity gaps with foreign firms.
This gap analysis also shows that foreign firms have higher productivity levels relative to Irish companies
in all regions (Figure 4.1, Panel B). The gap is considerably higher in the rest of the South and East region
where workers employed by foreign firms are almost five times as productive as those in Irish firms. This
gap is still significant but lower in Dublin and the Border, Midland and Western region.
80
FDI QUALITIES ASSESSMENT OF IRELAND © OECD 2020
Box 4.1. Role of domestic firm’s characteristics and absorptive capacity
Several studies suggest that the transfer of technology is more effective when firms possess previously
accumulated knowledge and innovative capacities. This set of knowledge and skills is identified by the
literature as absorptive capacity. Specifically, absorptive capacity is the ability to utilise available
information or knowledge that is transferred from other firms (Cohen and Levinthal, 1990). It involves
the capacity to acquire, assimilate and exploit the value of the information and knowledge (Todorova
and Durisin, 2007). Absorptive capacity is determined by firm-specific factors and is a function of the
technology gap between domestic and foreign firms.
A number of studies show that FDI is more likely to generate positive productivity spillovers when the
technology gap between foreign and domestic firms is not too large and domestic firms have enough
absorptive capacity (Halpern and Murakozy, 2007; Hamida and Gugler, 2009; Abraham et al., 2010;
Girma et al., 2006). The technology gap between foreign and domestic companies is often measured
by the gap between their respective productivity levels. Several studies show that relatively high
productivity is needed for domestic firms to reap FDI related spillovers (Keller and Yeaple, 2009, Nicolini
and Resmini, 2006). However, other studies argue that less productive firms have the potential to
benefit more from FDI spillovers (Castellani and Zanfei 2003).
The literature identifies a number of characteristics that seem to affect the absorptive capacity of
domestic firms. Several studies highlight positive FDI spillovers in companies that invest in human
capital and invest in research and development as opposed to companies that do not (Meyer and
Sinani, 2005; Ben Hamida and Gugler, 2009; Girma et al., 2006). An additional determinant of
absorptive capacity identified by the literature is company size (Knell and Rojec, 2007). Bigger firms
tend to have higher level of absorptive capacity (Ornaghi, 2006, Tusha et al. 2017) and are also more
innovative (Veugelers and Cassiman, 1999).
Another key factor which affects the ability of domestic firms to reap the benefits of foreign spillovers is
their geographical distance from foreign affiliates. Domestic firms located near foreign firms are more likely
to benefit from knowledge spillovers than other firms (Görg and Greenaway, 2004; Girma and Wakelin,
2002; Halpern and Murakozy, 2007; San Filippo and Seric, 2016). Geographical proximity is required to
facilitate knowledge spillovers, especially as far as tacit knowledge is concerned (Jacobs, 1993).
81
FDI QUALITIES ASSESSMENT OF IRELAND © OECD 2020
Figure 4.1. Foreign firms have a productivity premium in most sectors and regions
A. Are foreign firms more productive than Irish firms?
(yes if value>0, no if value <0)
B. Are foreign firms more productive than Irish firms?
(yes if value>0, no if value <0)
Note: The chart shows the proportional difference between average foreign productivity and average domestic productivity by sector and region.
Data refer to 2016. In Panel A, bars with dots (stripes) indicate that domestic (foreign) value added in those sectors is below EUR 250 million.
Less than 3 foreign companies operate in Food; Textile and clothing; and Paper and printing. Agriculture, mining, construction, energy,
miscellaneous manufacturing and financial services are excluded. Labour productivity is defined as value added per employee.
Source: OECD elaboration based on IDA’s Annual Employment Survey and Annual Business Survey.
Irish firms are more likely to invest in R&D than foreign affiliates…
The capacity gaps of Irish firms in terms of labour productivity stand in contrast with more extensive R&D
activities of domestic firms compared to foreign affiliates across sectors and sub-national regions. In all
sectors with the exception of textiles/clothing and wood, the share of Irish firms investing in R&D is higher
compared to the share of foreign firms (Figure 4.2, Panel A). These differences are rather small in sectors
like medical devices, electronic equipment, chemicals, business sectors, rubber and plastic, transport
equipment, and basic metals, while they are more pronounced in electrical equipment, computer activities,
financial services, and machinery and equipment. The share of Irish firms investing in R&D is also higher
in a regional comparison (Figure 4.2, Panel B). The gap appears to be larger in Dublin and the rest of
South and East region compared to the Border, Midland and Western region.
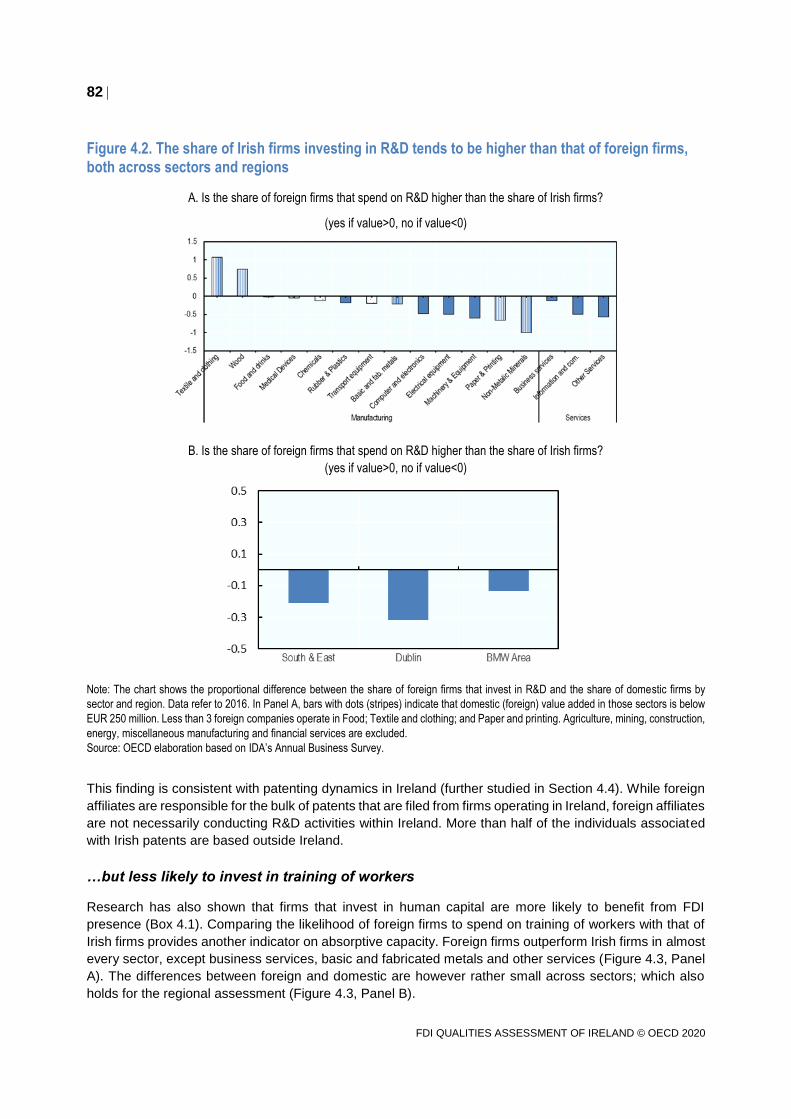
82
FDI QUALITIES ASSESSMENT OF IRELAND © OECD 2020
Figure 4.2. The share of Irish firms investing in R&D tends to be higher than that of foreign firms, both across sectors and regions
A. Is the share of foreign firms that spend on R&D higher than the share of Irish firms?
(yes if value>0, no if value<0)
B. Is the share of foreign firms that spend on R&D higher than the share of Irish firms?
(yes if value>0, no if value<0)
Note: The chart shows the proportional difference between the share of foreign firms that invest in R&D and the share of domestic firms by
sector and region. Data refer to 2016. In Panel A, bars with dots (stripes) indicate that domestic (foreign) value added in those sectors is below
EUR 250 million. Less than 3 foreign companies operate in Food; Textile and clothing; and Paper and printing. Agriculture, mining, construction,
energy, miscellaneous manufacturing and financial services are excluded.
Source: OECD elaboration based on IDA’s Annual Business Survey.
This finding is consistent with patenting dynamics in Ireland (further studied in Section 4.4). While foreign
affiliates are responsible for the bulk of patents that are filed from firms operating in Ireland, foreign affiliates
are not necessarily conducting R&D activities within Ireland. More than half of the individuals associated
with Irish patents are based outside Ireland.
…but less likely to invest in training of workers
Research has also shown that firms that invest in human capital are more likely to benefit from FDI
presence (Box 4.1). Comparing the likelihood of foreign firms to spend on training of workers with that of
Irish firms provides another indicator on absorptive capacity. Foreign firms outperform Irish firms in almost
every sector, except business services, basic and fabricated metals and other services (Figure 4.3, Panel
A). The differences between foreign and domestic are however rather small across sectors; which also
holds for the regional assessment (Figure 4.3, Panel B).
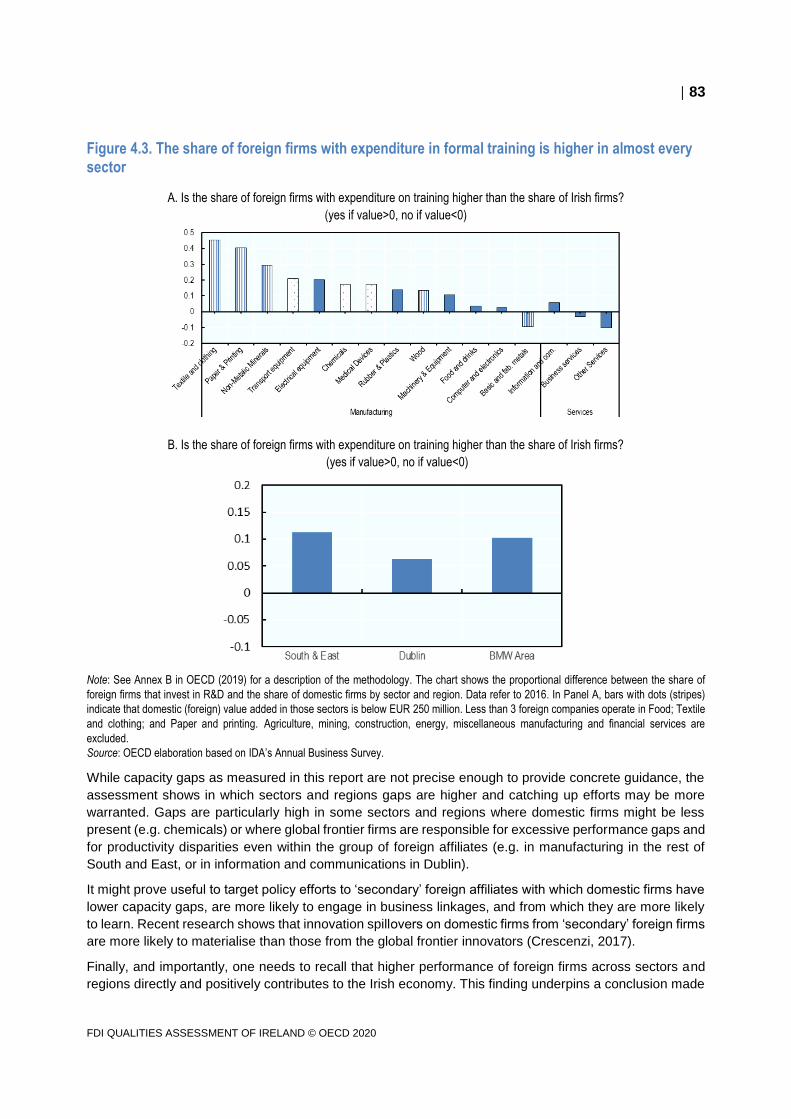
83
FDI QUALITIES ASSESSMENT OF IRELAND © OECD 2020
Figure 4.3. The share of foreign firms with expenditure in formal training is higher in almost every sector
A. Is the share of foreign firms with expenditure on training higher than the share of Irish firms?
(yes if value>0, no if value<0)
B. Is the share of foreign firms with expenditure on training higher than the share of Irish firms?
(yes if value>0, no if value<0)
Note: See Annex B in OECD (2019) for a description of the methodology. The chart shows the proportional difference between the share of
foreign firms that invest in R&D and the share of domestic firms by sector and region. Data refer to 2016. In Panel A, bars with dots (stripes)
indicate that domestic (foreign) value added in those sectors is below EUR 250 million. Less than 3 foreign companies operate in Food; Textile
and clothing; and Paper and printing. Agriculture, mining, construction, energy, miscellaneous manufacturing and financial services are
excluded.
Source: OECD elaboration based on IDA’s Annual Business Survey.
While capacity gaps as measured in this report are not precise enough to provide concrete guidance, the
assessment shows in which sectors and regions gaps are higher and catching up efforts may be more
warranted. Gaps are particularly high in some sectors and regions where domestic firms might be less
present (e.g. chemicals) or where global frontier firms are responsible for excessive performance gaps and
for productivity disparities even within the group of foreign affiliates (e.g. in manufacturing in the rest of
South and East, or in information and communications in Dublin).
It might prove useful to target policy efforts to ‘secondary’ foreign affiliates with which domestic firms have
lower capacity gaps, are more likely to engage in business linkages, and from which they are more likely
to learn. Recent research shows that innovation spillovers on domestic firms from ‘secondary’ foreign firms
are more likely to materialise than those from the global frontier innovators (Crescenzi, 2017).
Finally, and importantly, one needs to recall that higher performance of foreign firms across sectors and
regions directly and positively contributes to the Irish economy. This finding underpins a conclusion made
84
FDI QUALITIES ASSESSMENT OF IRELAND © OECD 2020
in Chapter 2 that foreign firms are not only concentrated in higher productivity sectors but they are also
outperforming domestic peers within sectors.
Labour mobility from foreign MNEs to Irish companies
Another important channel for spillovers between foreign and domestic firms is the movement of workers.
When workers move from foreign firms to domestic firms, they can bring knowledge and skills that can
enhance the domestic firms’ performance. Workers at foreign firms can also use the knowledge and skills
they have gained to found new businesses.
Data from the Irish Revenue Commissioners indicates that movement of labour from foreign MNEs to
domestic companies can be significant. The Irish Revenue Commissioners tracked 426 000 employments
from foreign MNEs in 2009 over the subsequent six years. They found that 247 000, or 58%, of these
workers remained employed by foreign MNEs in 2015, with three-quarters remaining with the same
employer. However, there was significant movement to domestic firms as 81 000, or 19%, were employed
by a domestic company.
The employees of foreign MNEs can also support the creation of new businesses. The Irish Revenue
Commissioners’ study found that more than 23 700, or 6%, of these employees had become self-employed
by 2015, and a further 5 900, or 1%, were registered as proprietary directors (Irish Revenue
Commissioners, 2018). Enterprise Ireland confirms the potential for employees of MNEs to start new
businesses; they estimated that 37% of the high potential start-up founders that they supported between
2002 and 2017 had previously worked at an MNE.2
4.3. Role of FDI on patenting and inventor mobility
This section builds on the gap analysis and labour mobility analysis discussed above by focusing on one
specific type of potential FDI spillover on the Irish economy; namely technology innovation in the form of
patents. This is done both by comparing foreign and Irish firms in terms of patenting outputs, but also, by
examining (labour) mobility of inventors which may enhance spillover effects. The analysis is based on the
PATSTAT database. PATSTAT is administered by the European Patent Office (EPO) and provides
detailed information on patents granted by various patent offices around the world.3
Firms that are operating in Ireland and engaging in R&D can apply for patents either in Ireland at the Irish
Patent Office (IPO), or elsewhere in the world to protect their intellectual property in respective markets.
Typically, firms would patent their inventions in large markets for selling, such as in the United States (US
Patent Trademark Office, USPTO) and in the European Union (European Patent Office, EPO): from 2006
to 2016, 60% of all patents granted to firms in Ireland (Irish-owned and foreign-owned) were applied at
USPTO, 30% at EPO and just 10% at IPO.4 The FDI stock in Ireland is dominated by investments from
the United States and to some extent the United Kingdom (see Chapter 1). Given the origins of FDI and
assuming that foreign affiliates remain connected with their home countries and therefore seek protection
of intellectual property in those markets, this patent distribution is not surprising.
Each patent is assigned to a World Intellectual Property Organization (WIPO) technological class. WIPO
uses 35 fields of technologies. Table 4.1 reports shares of patents in the top 10 technological classes that
are applied to IPO, USPTO and EPO, respectively. It reveals significant differences as to what technologies
are relatively more often protected at a given patent offices. Computer technologies, medical technologies
and pharmaceuticals are classes that are often protected in all the three patent offices.
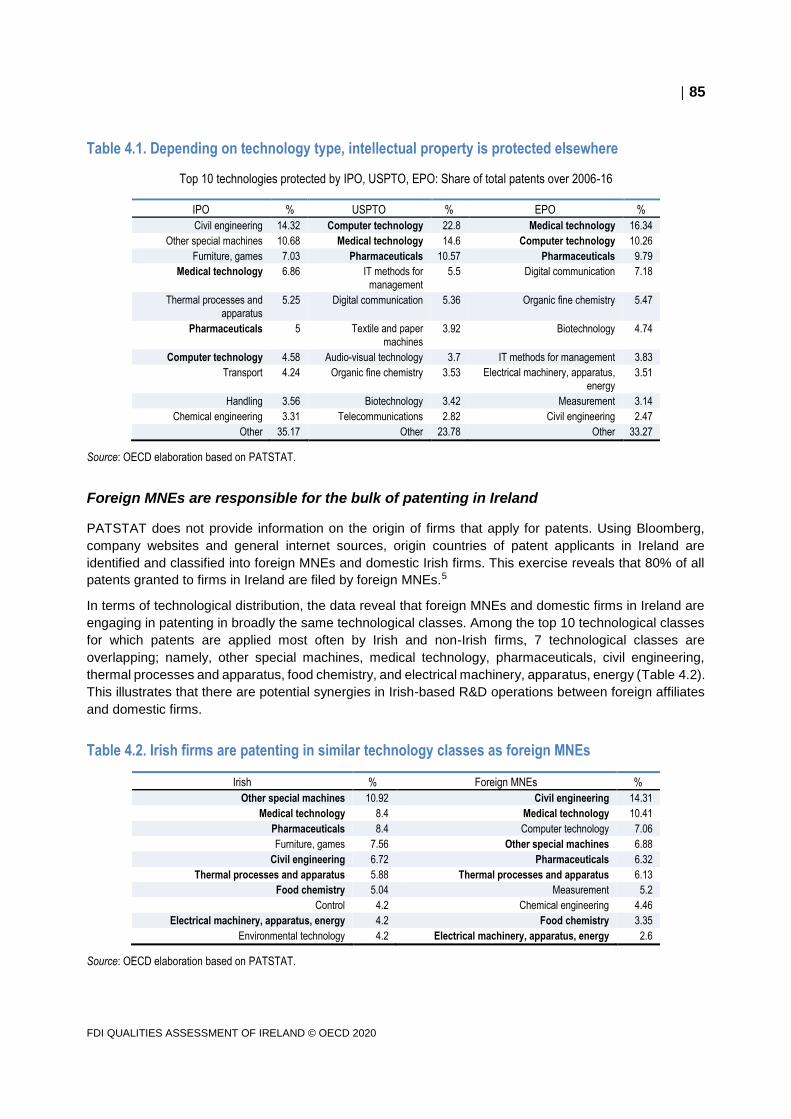
85
FDI QUALITIES ASSESSMENT OF IRELAND © OECD 2020
Table 4.1. Depending on technology type, intellectual property is protected elsewhere
Top 10 technologies protected by IPO, USPTO, EPO: Share of total patents over 2006-16
IPO % USPTO % EPO %
Civil engineering 14.32 Computer technology 22.8 Medical technology 16.34
Other special machines 10.68 Medical technology 14.6 Computer technology 10.26
Furniture, games 7.03 Pharmaceuticals 10.57 Pharmaceuticals 9.79
Medical technology 6.86 IT methods for
management
5.5 Digital communication 7.18
Thermal processes and
apparatus 5.25 Digital communication 5.36 Organic fine chemistry 5.47
Pharmaceuticals 5 Textile and paper
machines 3.92 Biotechnology 4.74
Computer technology 4.58 Audio-visual technology 3.7 IT methods for management 3.83
Transport 4.24 Organic fine chemistry 3.53 Electrical machinery, apparatus,
energy 3.51
Handling 3.56 Biotechnology 3.42 Measurement 3.14
Chemical engineering 3.31 Telecommunications 2.82 Civil engineering 2.47
Other 35.17 Other 23.78 Other 33.27
Source: OECD elaboration based on PATSTAT.
Foreign MNEs are responsible for the bulk of patenting in Ireland
PATSTAT does not provide information on the origin of firms that apply for patents. Using Bloomberg,
company websites and general internet sources, origin countries of patent applicants in Ireland are
identified and classified into foreign MNEs and domestic Irish firms. This exercise reveals that 80% of all
patents granted to firms in Ireland are filed by foreign MNEs.5
In terms of technological distribution, the data reveal that foreign MNEs and domestic firms in Ireland are
engaging in patenting in broadly the same technological classes. Among the top 10 technological classes
for which patents are applied most often by Irish and non-Irish firms, 7 technological classes are
overlapping; namely, other special machines, medical technology, pharmaceuticals, civil engineering,
thermal processes and apparatus, food chemistry, and electrical machinery, apparatus, energy (Table 4.2).
This illustrates that there are potential synergies in Irish-based R&D operations between foreign affiliates
and domestic firms.
Table 4.2. Irish firms are patenting in similar technology classes as foreign MNEs
Irish % Foreign MNEs %
Other special machines 10.92 Civil engineering 14.31
Medical technology 8.4 Medical technology 10.41
Pharmaceuticals 8.4 Computer technology 7.06
Furniture, games 7.56 Other special machines 6.88
Civil engineering 6.72 Pharmaceuticals 6.32
Thermal processes and apparatus 5.88 Thermal processes and apparatus 6.13
Food chemistry 5.04 Measurement 5.2
Control 4.2 Chemical engineering 4.46
Electrical machinery, apparatus, energy 4.2 Food chemistry 3.35
Environmental technology 4.2 Electrical machinery, apparatus, energy 2.6
Source: OECD elaboration based on PATSTAT.
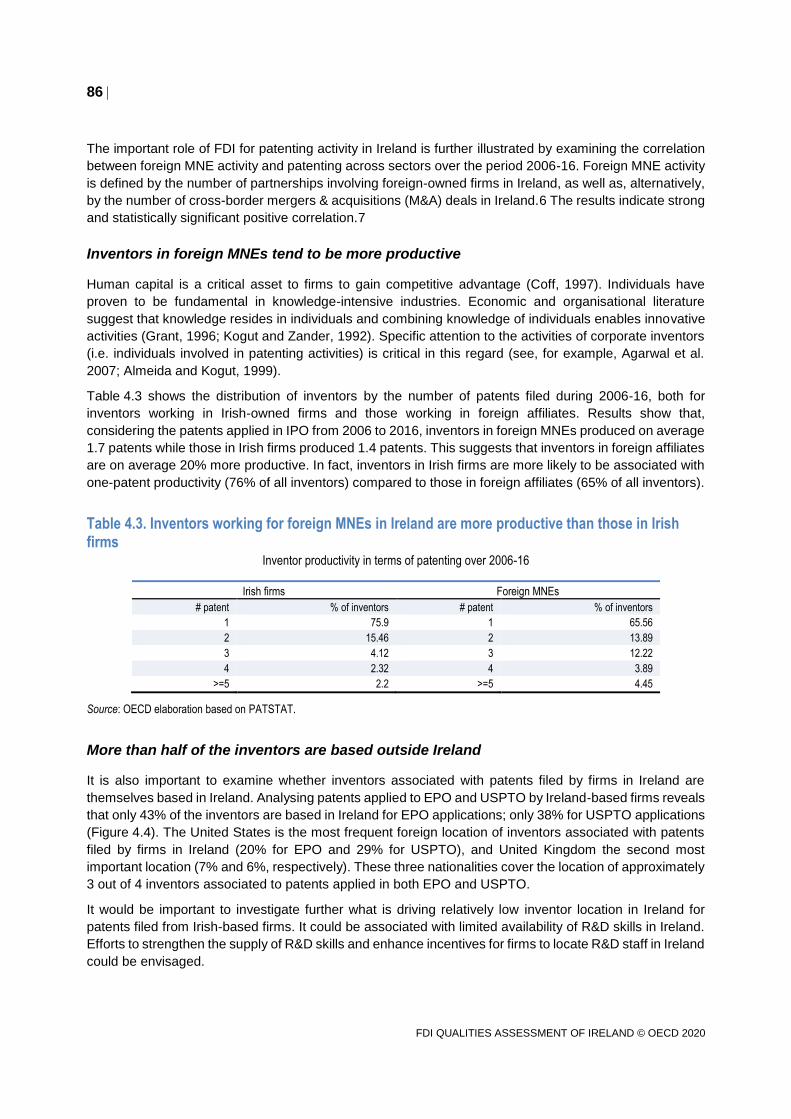
86
FDI QUALITIES ASSESSMENT OF IRELAND © OECD 2020
The important role of FDI for patenting activity in Ireland is further illustrated by examining the correlation
between foreign MNE activity and patenting across sectors over the period 2006-16. Foreign MNE activity
is defined by the number of partnerships involving foreign-owned firms in Ireland, as well as, alternatively,
by the number of cross-border mergers & acquisitions (M&A) deals in Ireland.6 The results indicate strong
and statistically significant positive correlation.7
Inventors in foreign MNEs tend to be more productive
Human capital is a critical asset to firms to gain competitive advantage (Coff, 1997). Individuals have
proven to be fundamental in knowledge-intensive industries. Economic and organisational literature
suggest that knowledge resides in individuals and combining knowledge of individuals enables innovative
activities (Grant, 1996; Kogut and Zander, 1992). Specific attention to the activities of corporate inventors
(i.e. individuals involved in patenting activities) is critical in this regard (see, for example, Agarwal et al.
2007; Almeida and Kogut, 1999).
Table 4.3 shows the distribution of inventors by the number of patents filed during 2006-16, both for
inventors working in Irish-owned firms and those working in foreign affiliates. Results show that,
considering the patents applied in IPO from 2006 to 2016, inventors in foreign MNEs produced on average
1.7 patents while those in Irish firms produced 1.4 patents. This suggests that inventors in foreign affiliates
are on average 20% more productive. In fact, inventors in Irish firms are more likely to be associated with
one-patent productivity (76% of all inventors) compared to those in foreign affiliates (65% of all inventors).
Table 4.3. Inventors working for foreign MNEs in Ireland are more productive than those in Irish firms
Inventor productivity in terms of patenting over 2006-16
Irish firms Foreign MNEs
# patent % of inventors # patent % of inventors
1 75.9 1 65.56
2 15.46 2 13.89
3 4.12 3 12.22
4 2.32 4 3.89
>=5 2.2 >=5 4.45
Source: OECD elaboration based on PATSTAT.
More than half of the inventors are based outside Ireland
It is also important to examine whether inventors associated with patents filed by firms in Ireland are
themselves based in Ireland. Analysing patents applied to EPO and USPTO by Ireland-based firms reveals
that only 43% of the inventors are based in Ireland for EPO applications; only 38% for USPTO applications
(Figure 4.4). The United States is the most frequent foreign location of inventors associated with patents
filed by firms in Ireland (20% for EPO and 29% for USPTO), and United Kingdom the second most
important location (7% and 6%, respectively). These three nationalities cover the location of approximately
3 out of 4 inventors associated to patents applied in both EPO and USPTO.
It would be important to investigate further what is driving relatively low inventor location in Ireland for
patents filed from Irish-based firms. It could be associated with limited availability of R&D skills in Ireland.
Efforts to strengthen the supply of R&D skills and enhance incentives for firms to locate R&D staff in Ireland
could be envisaged.
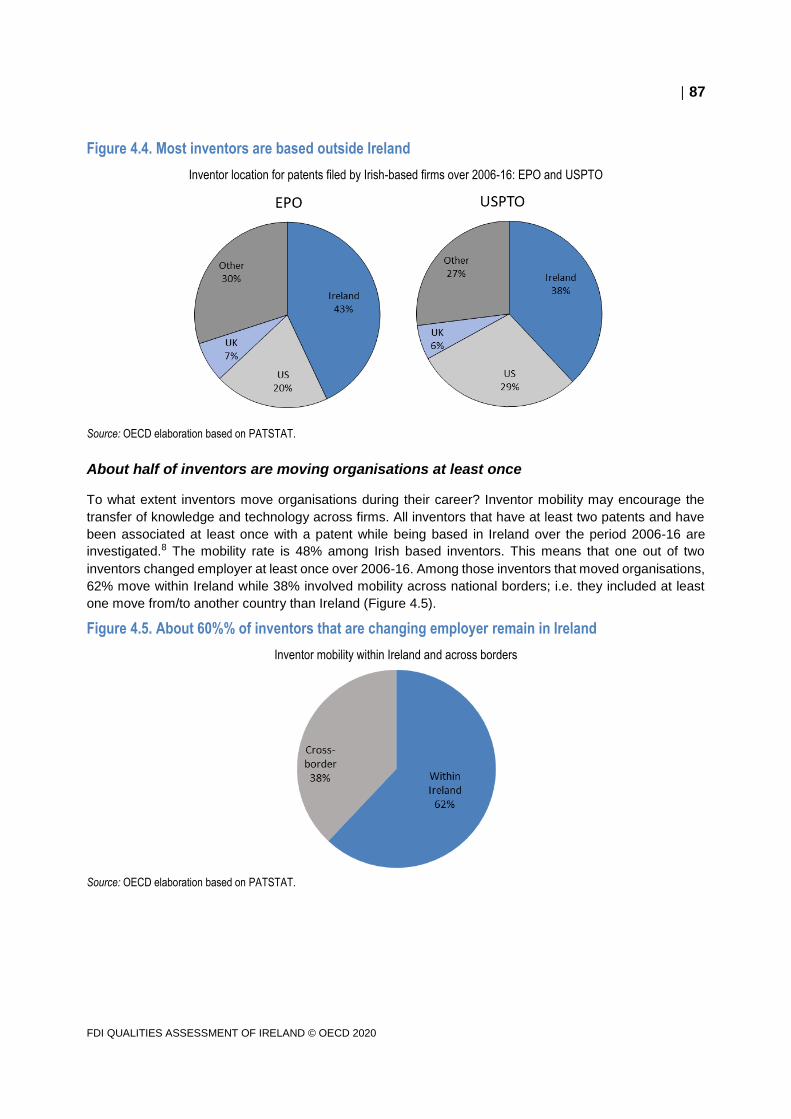
87
FDI QUALITIES ASSESSMENT OF IRELAND © OECD 2020
Figure 4.4. Most inventors are based outside Ireland
Inventor location for patents filed by Irish-based firms over 2006-16: EPO and USPTO
Source: OECD elaboration based on PATSTAT.
About half of inventors are moving organisations at least once
To what extent inventors move organisations during their career? Inventor mobility may encourage the
transfer of knowledge and technology across firms. All inventors that have at least two patents and have
been associated at least once with a patent while being based in Ireland over the period 2006-16 are
investigated.8 The mobility rate is 48% among Irish based inventors. This means that one out of two
inventors changed employer at least once over 2006-16. Among those inventors that moved organisations,
62% move within Ireland while 38% involved mobility across national borders; i.e. they included at least
one move from/to another country than Ireland (Figure 4.5).
Figure 4.5. About 60%% of inventors that are changing employer remain in Ireland
Inventor mobility within Ireland and across borders
Source: OECD elaboration based on PATSTAT.

88
FDI QUALITIES ASSESSMENT OF IRELAND © OECD 2020
Cross-border mobility of inventors (38% of all moves) can be decomposed further into the following
patterns:
Pattern 1: moving from Ireland to another country (13%)
Pattern 2: moving to Ireland from another country (8%)
Pattern 3: moving to Ireland, stay in Ireland, then move to another country (11%)
Pattern 4: moving from Ireland to another country, then move back to Ireland (6%)
Exploring the source and recipient countries of the mobility events reveals that the United Kingdom is both
the primary recipient for Pattern 1 (63%) and the primary source for Pattern 2 (52%), followed by United
States with 24% and 31% of the mobility instances, respectively. Similar results are found also for Pattern
3. For Pattern 4, the United States is the primary recipient of temporary moves from and back to Ireland
(51%), followed by the United Kingdom (34%).
The results point to a fairly dynamic inventor environment in Ireland: The majority of inventors move within
Ireland; much of the cross-border mobility actually involves mobility to Ireland. This finding is encouraging
and could be a trigger for efforts to attract additional inventors.
References
Abraham, F., Koning, J. and Slootmaekers, V., (2010), “FDI spillovers in the Chinese manufacturing
sector: Evidence of firm heterogeneity”, Economics of Transition, Vol. 18(1), 143-182.
Almeida P. and Kogut B., (1999), “Localization of Knowledge and the Mobility of Engineers in Regional
Networks”, Management Science, Vol. 45, No. 7, pp. 905-917
Agarwal S., Ashwani G. and Dayal R., (2007), “Technology transfer perspectives in globalising India
(drugs and pharmaceuticals and biotechnology)”, The Journal of Technology Transfer, Springer, vol.
32(4), pages 397-423.
Ben Hamida, L. and Gugler, P., (2009), “Are there demonstration-related spillovers from FDI? Evidence
from Switzerland”, International Business Review, Vol.18(5), 494-508.
Castellani, D. and Zanfei, A., (2003), “Technology gaps, absorptive capacity and the impact of inward
investments on productivity of European firms”, Economics of Innovation and New Technology, Vol.
12(6), 555-576.
Caves, (1996), Multinational Enterprises and Economic Analysis, MIT Press, Cambridge, MA, United
States
Coff R. (1997), “Human Assets and Management Dilemmas: Coping with Hazards on the Road to
Resource-Based Theory”, The Academy of Management Review, Vol. 22(2):374-402
Cohen, W. and Levinthal, D., (1990), “Absorptive Capacity: A New Perspective on Learning and
Innovation”, Administrative Science Quarterly, 35(1), 128-152.
Crescenzi, R. (2018), “Foreign Investment and innovation in regions across the globe”, LSE,
http://www.lse.ac.uk/iga/assets/documents/Foreign-Investment-and-Innovation-in-Regions-Across-
the-Globe.pdf
Di Lorenzo, F. and Almeida, P., (2017), “The role of relative performance in inter-firm mobility of
inventors”, Research Policy, Elsevier, vol. 46(6), pp. 1162-1174.
Di Ubaldo, M., M. Lawless and I. Siedschlag (2018), "Productivity spillovers from multinational activity to
local firms in Ireland", OECD Productivity Working Papers, No. 16, OECD Publishing, Paris,
https://doi.org/10.1787/58619717-en.
Girma, S., Görg, H. and Pisu, M., (2008), “Exporting, Linkages and Productivity Spillovers from Foreign
89
FDI QUALITIES ASSESSMENT OF IRELAND © OECD 2020
Direct Investment”, Canadian Journal of Economics, Vol. 41(1), 320-340.
Girma, S. and Wakelin K., (2002), “Are there Regional Spillovers from FDI in the UK?”, in Trade,
Investment, Migration and Labour Markets. Basingstoke: Macmillan
Görg H., and Greenaway D., (2004), “Much Ado about Nothing? Do Domestic Firms Really Benefit from
Foreign Direct Investment?”, World Bank Research Observer, World Bank Group, vol. 19(2), pp. 171-
197. http://ftp.iza.org/dp944.pdf
Halpern, L. and Murakozy, B., (2007), “Does distance matter in spill-over?”, Economics of Transition, Vol.
15(4), 781-805.
Hoisl K. (2007), “Tracing mobile inventors--The causality between inventor mobility and inventor
productivity”, Research Policy, Vol. 36/ 5, pp. 619-636.
Irish Revenue Commissioners (2018), “Corporation Tax: 2017 Payments and 2016 Returns,” Dublin,
Ireland https://revenue.ie/en/corporate/documents/research/ct-analysis-2018.pdf.
Jacobs, J., (1969), The Economy of Cities, New York: Random House.
Keller W. and Yeaple S. R., (2009), “Multinational Enterprises, International Trade, and Productivity
Growth: Firm-Level Evidence from the United States”, The Review of Economics and Statistics, MIT
Press, Vol. 91(4), pp. 821-831, https://www.nber.org/papers/w9504
Knell, M. and Rojec, M., (2007), “The economics of knowledge and knowledge accumulation: A literature
survey”, Mimeo, NIFU-STEP and University of Ljubljana, https://nifu.brage.unit.no/nifu-
xmlui/bitstream/handle/11250/2590277/KnellM_2018_Why.pdf?sequence=2
Meyer, K. and Sinani, E., (2005), “Spillovers from Foreign Direct Investment: A Meta-Analysis”, SSRN
Electronic Journal, http://dx.doi.org/10.2139/ssrn.899525.
Ornaghi, C., (2006), “Spillovers in product and process innovation: Evidence from manufacturing firms”,
International Journal of Industrial Organization, Elsevier, Vol. 24(2), pp/ 349-380.
Palomeras N. and Melero E. (2010), “Markets for Inventors: Learning-by-Hiring as a Driver of Mobility”,
Management Science, Vol. 56/ 5, pp. 881-895.
Resmini, L. and Nicolini, M., (2007). “Productivity Spillovers from Foreign Investment: The Role of
Neglected Conditionalities”, Papers DYNREG11, Economic and Social Research Institute (ESRI).
https://ideas.repec.org/p/esr/wpaper/dynreg11.html
Sanfilippo M. and Seric A., (2016), “Spillovers from agglomerations and inward FDI: a multilevel analysis
on sub-Saharan African firms”, Review of World Economics, Vol. 152(1), pp. 147-176.
Smeets, R., (2008), “Collecting the Pieces of the FDI Knowledge Spillovers Puzzle”, World Bank
Research Observer, Vol. 23/2, pp. 107-138.
Todorova, G. and Durisin, B., (2007), “Absorptive Capacity: Valuing a Reconceptualization”, Academy of
Management Review, Vol. 32, pp. 774-786
Tusha, D., Jordaan, J.A. and Seric, A., (2017), “Vertical linkages with foreign firms in a GVC perspective:
Evidence from Viet Nam”, a background paper for OECD-UNIDO (2019)
Veugelers, R. and Cassiman, B., (2004), “Foreign subsidiaries as a channel of international technology
diffusion: Some direct firm level evidence from Belgium”, European Economic Review, 48(2), 455–476.
90
FDI QUALITIES ASSESSMENT OF IRELAND © OECD 2020
Annex 4.A. Methodology and data
Chapter 4 studies performance gaps between foreign and domestic firms and the mobility of patent
inventors and associated FDI spillovers in Ireland. It combines several data sources, namely IDA’s Annual
Business Survey and Annual Employment Survey and PATSAT. Specifically, the chapter employs the
following variables from each source:
Value added, share of firms investing in R&D, share of firms with expenditure on training by sector,
region and firm type from the Annual Business Survey.
Employment by sector, region and firm type from IDA’s Annual Employment Survey.
Number of patents by technology class and patent office; number of inventors by technology class
and location from PATSTAT
Indicators in Figures 4.1, 4.2, and 4.3
Indicators in Figures 41, 4.2 and 4.3 measure how foreign firms perform relative to domestic firms for a
given outcome (e.g. productivity). They take positive value if foreign firms have higher outcomes than
domestic firms and negative value if foreign firms have lower outcomes, on average. The indicators are
constructed as the proportional difference between average outcomes of foreign firms and average
outcome of domestic firms:
𝑇𝑦𝑝𝑒 1 = (�̅�𝐹 − �̅�𝐷)/ �̅�𝐷
where �̅�𝐹 is the average outcome of foreign firms and �̅�𝐷 is the average outcome of domestic firms.
Notes
1 The identification of spillovers is often not possible as it requires large firm-level datasets, both on foreign
and domestic firms, which have not been available for the purpose of this study. These datasets would
further require information on supply chain and other linkages of domestic firms with foreign affiliates as
well as information to disentangle how domestic firms, even without explicit FDI linkages, are affected by
the presence of foreign affiliates.
2 High potential startups are internationally focused companies with the potential to employ at least 10
people and generate at least €1 million in revenues within 3 years of starting.
3 This section is based on a background note by Francesco Di Lorenzo from Copenhagen Business School.
Technical details are available upon request.
4 The total number of patents is the sum of patents applied to USPTO, EPO and IPO. Firms in Ireland may
also apply to patent offices elsewhere in the world.
91
FDI QUALITIES ASSESSMENT OF IRELAND © OECD 2020
5 This number is based on the total number of patents granted by IPO. The distribution of patents owned
by foreign MNEs and domestic firms in Ireland is likely to be similarly skewed towards foreign MNEs if one
considered patents from USPTO and EPO.
6 Data on partnerships and M&A deals are taken from Thomson Reuters.
7 Correlation coefficients are above 0.65 in both estimates and statistically significant at the 95% level.
8 This analysis is based on the methodology developed and previously applied in Di Lorenzo and Almeida
(2017); Hoisl, (2007); and Palomeras and Melero, (2010).

93
FDI QUALITIES ASSESSMENT OF IRELAND © OECD 2020
This study of the impact of foreign investment in Ireland between 2006 and 2016 has been finalised in the
midst of the COVID-19 pandemic. The study shows that foreign investment played a key role in assisting
Ireland to recover from another event with similarly negative consequences for the global economy – the
financial crisis and subsequent “great recession” of 2007-2009.
Despite the fact that the report was prepared before the COVID-19 crisis, observing trends in 2020, the
foreign-owned sector in Ireland has demonstrated a remarkable resilience in the face of the pandemic and
all the indications are that the portfolio of foreign investors managed by IDA Ireland will register positive
net employment growth for 2020. This growth will be lower than that experienced in 2019 but will still
exceed the expectations of many knowledgeable observers who were expecting a net loss or at best a
neutral outcome. Some of the reasons for this performance undoubtedly relate to various aspects of the
character, structure and performance of the foreign sector in Ireland that have been analysed in this report.
This study has highlighted that foreign investment in Ireland is deeply integrated into Global Value Chains
(GVCs) and is a major contributor to trade, productivity, innovation, value-added and employment.
Multinational Enterprises (MNEs) operating in Ireland are one of the principal reasons why the country is
among the most globalised and export-oriented economies in the world. That said, many of the linkages
between MNEs operating in Ireland and both import and export markets during the study period are
strongly Anglo-American. The bilateral trade of the foreign sector is quite concentrated.
The analysis also makes clear that the MNEs operating in Ireland are a heterogeneous group comprising
a sub-group of “frontier firms” whose performance across a range of variables is a multiple of that of the
median foreign affiliate. The foreign sector is an important source of knowledge and other spillovers to the
domestic economy, while the links between MNEs and domestic firms are in line with the experience of
other small open economies. Significantly, entrepreneurs who once worked in the foreign-owned sector
are an important source of new firm formation in the domestic SME sector. Limitations on the “absorptive
capacity” of domestic enterprises, the very high export orientation of MNEs and the practical consequences
of participation in global value chains arguably acts as a constraint on further “embeddedness” within the
domestic economy.
While the study identifies and acknowledges the numerous benefits of foreign investment in Ireland, it also
highlights the presence of a degree of “concentration risk”. Many of the benefits of foreign investment are
derived from a small number of sectors especially Information and Communications and
Biopharmaceuticals and a small number of home countries particularly the United States. In this context,
IDA Ireland should continue its commitment to portfolio diversification in terms of the sectoral and
geographical sources of future investment. In addition, concentration risk can also be diluted by continuing
to expand and broaden the number and types of foreign firms establishing in the jurisdiction, undertaking
R&D, staff training, building more linkages in the domestic economy and moving up the productivity
performance ladder. In this way, the multinational sector will be able to maximise its contribution to Ireland’s
recovery from the negative impact of the pandemic and play a role not dissimilar to the one it performed
more than a decade ago. Continuing and strengthening a collaborative approach between IDA Ireland and
5. Key conclusions and policy
implications

94
FDI QUALITIES ASSESSMENT OF IRELAND © OECD 2020
other government agencies in charge of enterprise development, trade, innovation, and skills development
is important to design and implement policies that support the development of domestic firms’ capabilities
and linkages.