FDA Labeling Cost Model -
133
Revised January 2003 FDA Labeling Cost Model Final Report Prepared for Dr. Amber Jessup DHHS/PHS/FDA/CFSAN/OSAS/DMST 200 C Street, SW Mail Stop HFS0726 Washington, DC 20204 Prepared by Mary K. Muth Erica C. Gledhill Shawn A. Karns RTI Health, Social, and Economics Research Research Triangle Park, NC 27709 RTI Project Number 06673.010
Transcript of FDA Labeling Cost Model -
Revised January 2003
FDA Labeling Cost Model
Final Report
Prepared for
Dr. Amber Jessup DHHS/PHS/FDA/CFSAN/OSAS/DMST
200 C Street, SW Mail Stop HFS0726
Washington, DC 20204
Prepared by
Mary K. Muth Erica C. Gledhill Shawn A. Karns
RTI Health, Social, and Economics Research
Research Triangle Park, NC 27709
RTI Project Number 06673.010
cannada
cannada
cannada

RTI Project Number 06673.010
FDA Labeling Cost Model
Final Report
Revised January 2003
Prepared for
Dr. Amber Jessup DHHS/PHS/FDA/CFSAN/OSAS/DMST
200 C Street, SW Mail Stop HFS0726
Washington, DC 20204
Prepared by
Mary K. Muth Erica C. Gledhill Shawn A. Karns
RTI Health, Social, and Economics Research
Research Triangle Park, NC 27709

iii
Contents
1. Introduction 1-1
1.1 Project Objectives ............................................................. 1-1
1.2 Overview of the Report ..................................................... 1-2
2. Overview of Packaging and Label Types and Printing Methods 2-1
2.1 Packaging and Label Types................................................ 2-1
2.1.1 Directly Printed Food Packaging ............................ 2-2
2.1.2 Preprinted Labels ................................................... 2-4
2.2 Printing Methods............................................................... 2-7
2.2.1 Rotogravure........................................................... 2-7
2.2.2 Offset Lithography ................................................. 2-8
2.2.3 Flexography........................................................... 2-9
2.3 Label Contents ................................................................ 2-10
2.4 References ...................................................................... 2-11
3. The Process of Changing Food and Dietary Supplement Labeling 3-1
3.1 Overview of the Change Process ....................................... 3-1
3.1.1 Administrative Activities ........................................ 3-4
3.1.2 Analytical Testing .................................................. 3-4
3.1.3 Graphic Design ..................................................... 3-5
3.1.4 Market Testing....................................................... 3-6
3.1.5 Prepress Activities.................................................. 3-7
3.1.6 Cylinder and Plate Engraving ................................. 3-8
3.1.7 Color Matching...................................................... 3-9

iv
3.1.8 Label and Package Printing .................................... 3-9
3.2 Effects of Differences in the Compliance Period ............... 3-10
3.2.1 Differences for 12-, 24-, and 36-Month Compliance Periods............................................. 3-10
3.2.2 Responses to Very Short Compliance Periods ....... 3-12
3.3 References ...................................................................... 3-14
4. Labeling Cost Model Assumptions, Data, and Calculations 4-1
4.1 Labeling Cost Model Assumptions ..................................... 4-1
4.2 Labeling Cost Model Data ................................................. 4-4
4.2.1 Product Categories and Types ................................ 4-4
4.2.2 Parts of the Label and the Associated Number of Colors.............................................................. 4-19
4.2.3 Costs Incurred on an SKU Basis............................ 4-27
4.2.4 Costs Incurred on a Per-Formula Basis.................. 4-29
4.2.5 Discarded Inventory Costs ................................... 4-31
4.3 Labeling Cost Model Calculations.................................... 4-41
4.4 References ...................................................................... 4-44
5. Instructions for Using the Labeling Cost Model 5-1
5.1 Preparing to Run the Model............................................... 5-1
5.2 Selecting Model Inputs ...................................................... 5-2
5.3 Outputs of the Model ...................................................... 5-10
Appendix
A Additional Product-Level Tables ........................................A-1
B Stata Data Sets and Programming Code ............................. B-1
v
Figures
Figure 2-1 Examples of Parts of Food Labels that May Change as a Result of a Regulation .............................................................. 2-10
Figure 3-1 Overview of the Label Change Process in Response to Regulation ................................................................................. 3-2
Figure 5-1 The Main Menu Screen for the Labeling Cost Model................... 5-3
Figure 5-2 The Product Selection Screen for Choosing Product Categories by IRI-Based Product Types ....................................... 5-4
Figure 5-3 The Product Selection Screen for Choosing Product Categories by NAICS Codes ....................................................... 5-5
Figure 5-4 The Affected Parts of Label Screen.............................................. 5-7
Figure 5-5 The Analytical Test and Market Test Screen................................ 5-8
Figure 5-6 The Compliance Period Screen .................................................. 5-9
Figure 5-7 The Inputs Sheet of the Labeling Cost Model Output................. 5-11
Figure 5-8 The Aggregate Cost Sheet of the Labeling Cost Model Output ... 5-12
Figure 5-9 The All Costs Sheet of the Labeling Cost Model Output............. 5-13
Figure 5-10 The Totals by Cost Type Sheet of the Labeling Cost Model Output..................................................................................... 5-14
vi
Tables
Table 4-1 Proportion of SKUs that Could Be Coordinated with a Scheduled Labeling Change (default values) ............................... 4-3
Table 4-2 Products Included in the Labeling Cost Model (revised April 2002)......................................................................................... 4-5
Table 4-3 Numbers of Formulas and SKUs per Formula for Food Product Categories................................................................... 4-20
Table 4-4 Number of Colors Typically Affected by Changes to Various Parts of the Label ..................................................................... 4-26
Table 4-5 Administrative and Graphic Design Cost Estimates ................... 4-27
Table 4-6 Prepress and Etching/Engraving Cost Estimates.......................... 4-29
Table 4-7 Analytical Testing Cost Estimates.............................................. 4-30
Table 4-8 Market Testing Costs ................................................................ 4-32
Table 4-9 Remaining Inventory Assumptions by Type of Package ............. 4-33
Table 4-10 Costs of Label or Package for Each Product Category Based on a Representative Product ..................................................... 4-34
Table 4-11 Sticker Application Cost Estimates for the 6-Month Compliance Period .................................................................. 4-41
Table 4-12 Descriptions of Variables Used in the Labeling Cost Model Calculations............................................................................. 4-42
1-1
1 Introduction
Many of the food safety and nutrition regulations proposed by the Food and Drug Administration (FDA) require labeling changes for the affected products. In some cases, the labeling change is the purpose of the regulation, while in other cases, it is an indirect effect of the regulation. These labeling changes are part of the costs of complying with regulations and thus are included in the cost-benefit analyses conducted by FDA.
FDA contracted with RTI to update RTI’s 1990 labeling cost model to make the model more relevant for the types of analyses currently conducted by FDA. This report provides background information on the process of changing the labeling information on food packaging, a description of the revised cost estimates used in the model, a description of the underlying assumptions and calculations used in developing the model, and instructions for working with the model to obtain specific cost estimates. In this section, we describe the project objectives and provide an overview of the report.
1.1 PROJECT OBJECTIVES The objective of this project was to update RTI’s 1990 labeling cost model to reflect FDA’s current needs in estimating the costs of labeling changes associated with proposed food safety, nutrition, and dietary supplement regulations. In revising the labeling cost model, RTI
RTI updated the FDA labeling cost model to reflect FDA’s current needs in estimating the costs of labeling food and dietary supplement products.
FDA Labeling Cost Model
1-2
Z developed the model in Stata for Windows with an interface in Microsoft Excel;
Z updated the parameter estimates used to generate labeling cost estimates and provided a range of parameter estimates when appropriate;
Z added dietary supplements, which have different labeling requirements than packaged food products, to the model;
Z based the model on product or stockkeeping units (SKUs) rather than Standard Industrial Classification (SIC) codes; and
Z updated SIC code designations to the corresponding North American Industry Classification System (NAICS) codes.
These changes make the model more current and more useful for analyzing the frequent small label changes that affect specific groups of food or supplement products.
1.2 OVERVIEW OF THE REPORT This report is organized as follows. Section 2 provides an overview of the types of labels and packaging used on food and dietary supplement products, the printing methods used for both label and package printing, and the contents of labeling information that may be changed as a result of a regulation. Section 3 describes the process by which companies change the label information on their labels or packaging. While Section 2 is based primarily on secondary sources of information, Section 3 is based on information RTI collected while visiting packaging converters and interviewing food manufacturers. Section 4 describes the assumptions on which the model was developed, the cost estimates used in the model, and the equations for calculating the total costs of a labeling change. Section 5 provides instructions for using and updating the model. Appendix A presents a table listing product categories by NAICS codes and a table listing the individual Information Resources, Inc. (IRI) product types included in each product category. Finally, Appendix B includes the Stata program used to calculate the cost estimates and instructions for revising the Stata data files.
2-1
Overview of Packaging and Label Types and 2 Printing Methods
In this section, we describe packaging and label types for food and dietary supplement products, the most commonly used printing methods, and the contents of food labeling. This information provides the background for describing the process of changing labeling information in Section 3.
2.1 PACKAGING AND LABEL TYPES Labeling information can be displayed on a food or dietary supplement package in two ways—it can be printed directly onto the package or it can be printed on a label, which is then applied to the food package. Furthermore, some food and dietary supplement products use inner and outer packaging to enclose one product. Most of the time, the inner packaging will not contain labeling information, particularly if it is not packaged for individual sale. However, sometimes the inner packaging does have labeling information that must also be changed when a new labeling regulation occurs.
Packaging converters and food or dietary supplement manufacturers determine which printing method to use based on whether the labeling information is directly printed on the packaging or is preprinted on a label and on which material is used
Labeling information may be printed directly on packaging or on labels and on both inner and outer packaging.

FDA Labeling Cost Model
2-2
for the packaging or label. We describe the types of food and dietary supplement packaging and labeling below.
2.1.1 Directly Printed Food Packaging
The advantages to printing labeling information directly onto the package are that the cost of paper and the two-step process of printing and applying are eliminated (Bruno, 1995). Direct printing also results in more attractive packaging, and the graphics will not inadvertently be removed during the process of manufacturing and shipping (NPES, 2000). However, direct printing may only be cost-effective with highly automated printing systems because of the high cost of packaging waste when an error occurs. Throwing away an entire package is much more costly than throwing away a preprinted label (Bruno, 1995).
Three basic types of packages that are directly printed are cartons, flexible packages, and metal cans. Other directly printed packages include rigid plastic containers, gable top cartons, and aseptic boxes (which are also known as drink boxes). All cartons and flexible packages are directly printed, but metal cans and rigid plastic containers can either be directly printed or have a label applied. We describe each of the major types of directly printed packaging below.
Cartons
Cartons made up 7.9 percent of the overall packaging market in 1993, but its share was expected to fall to 7.3 percent in 2000 (NPES, 2000). Cartons are made of either bleached or unbleached paperboard.1 Cartons also differ in the method that they are cut and glued together before shipment to the manufacturer. Knockdown cartons are cartons for which the sides are already glued but not the tops and bottom so that the carton can be collapsed. The food or dietary supplement manufacturer pops open the carton, fills it, and glues the top and bottom closed. Although this type of packaging is easy for the manufacturer to fill, it is bulky; therefore, large amounts of inventory are usually not stored. In contrast to knockdown cartons, flat blank cartons are cut so that they are shipped as one flat piece of paperboard. The food
1Recycled unbleached cartons are not used if they would come into contact with
the food.
The types of packages that are directly printed include cartons, flexible packaging, cans, rigid plastic containers, gable top cartons, and aseptic boxes.
Section 2 — Overview of Packaging, Labels, and Printing Methods
2-3
manufacturer forms the cartons by folding and gluing all sides. Flat blank cartons are much less bulky than knockdown cartons; therefore, larger amounts of inventory can be stored.
The graphic designs on cartons usually have four colors but could have five or six. Because they are made of a paperboard material, 75 percent of cartons are printed with offset lithography. Rotogravure is used for many of the long-run items and is used to print approximately 15 percent of all cartons. Approximately 8 percent of all cartons are printed with flexography (NPES, 2000).
Flexible Packages
Flexible packages are single-walled units or laminations of several materials, usually paper, plastic film, and/or foil in various combinations. Flexible packages made up 16.2 percent of the overall packaging market in 1993, and their share was expected to rise to 16.5 percent in 2000. However, for food product packaging, Aaron Brody (2001) estimates that as much as 50 percent are packaged with flexible packaging. The reason for this is because more food manufacturers are eliminating the outer box in bag-in-the-box packaging and are relying entirely on the inner flexible package for complete packaging. Approximately 60 percent of flexible packages are printed with flexography, because of its low cost and ability to conform to the irregular shape of many flexible packages. Rotogravure is the print type for 20 percent of flexible packages, and the remaining 20 percent are unprinted, such as what is generally used for the inner bag in bag-in-the-box packaging (NPES, 2000).
Metal Cans
Metals cans used for food and beverage packaging are formed by using either two or three pieces of aluminum or steel. Two-piece cans have a base that is formed into a cup whereas three-piece cans have three distinct pieces: the base, the side (which is formed into a cylinder), and the top. All aluminum cans are two-piece cans and are usually used for packaging beverages. Steel cans are almost always used for food packaging, and approximately two-thirds of them are three-piece cans, while the remaining one-third are two-piece cans (Can Manufacturers Institute, 2001). Of all steel cans, only 20 percent are printed directly, while the other 80 percent are

FDA Labeling Cost Model
2-4
unprinted and attached with a label (NPES, 2000). All two-piece aluminum beverage cans are directly printed in the round with special dry offset printing units that are built into the post can-forming machinery, while two- and three-piece steel cans are printed in the flat using offset. In 1993, 74 percent of all cans were two-piece aluminum cans and 26 percent were composed of steel. Overall, for all types of cans, 82 percent are printed with dry offset, 14 percent are left unprinted and attached with a label, and 4 percent are printed using standard offset (NPES, 2000).
Other Types of Packaging
Other types of directly printed packaging include rigid plastic packages, gable top cartons, and aseptic boxes. Rigid plastic packaging can be formed into many shapes including bottles, jars, and tubs. Plastic bottles and jars usually have a preprinted label attached, but many plastic tubs are printed directly. When a rigid plastic container is printed directly, it is usually done with offset. Gable top cartons are made of a plastic coated paperboard material that is sealed with a heat-sealed closure system to protect the product, usually juice or milk, from external factors that would cause it to deteriorate rapidly (Brody, 2000b). They are printed directly and are usually printed with flexography. Aseptic boxes are also generally used to hold fruit juices and milk. Aseptic processing involves heating liquids quickly to a high temperature to sterilize the liquid. The liquid is then cooled and placed into a sterile container. Aseptic boxes are made up of three layered materials—paper to provide stiffness and strength, layered polyethylene plastic to seal the package, and aluminum foil as a barrier against air and light (University of California at Davis, 2001). These containers are commonly printed with offset and rotogravure.
2.1.2 Preprinted Labels
Food packages that are not printed directly have a preprinted label applied instead. Typical packages that have preprinted labels include glass bottles and jars, plastic bottles and jars, and steel metal cans (NPES, 2000). Using preprinted labels lowers inventory costs and has advantages for products with shorter production runs (NPES, 2000). Of all preprinted labels, 40 percent are printed with offset, 33 percent with flexography, and 7 percent with rotogravure
The types of labels used on food and dietary supplement packages include glue-applied, pressure sensitive, heat-sealed, in-mold, heat transfer, and sleeve labels.
Section 2 — Overview of Packaging, Labels, and Printing Methods
2-5
(NPES, 2000). A variety of substrates and application methods are used for printed labels. These include glue-applied labels, pressure-sensitive labels, heat-sealed and in-mold labels, heat transfer labels, and sleeve labels. Approximately 60 percent of all preprinted labels are paper, and 40 percent are plastic, foil, or laminates of plastic/foil/paper in various combinations (NPES, 2000). We describe each of the types of labels in more detail below.
Glue-Applied
Glue-applied labels, which are also known as “cut and stack” labels, are generally made of a paper substrate to which glue or adhesive is applied just before the label is attached to the container (Bruno, 1995). This type of label makes up approximately 45 percent of labels in the packaging market and is usually printed with offset (Bruno, 1995). This application technique is the cheapest process on a per-label basis (Freedonia Group, 1999) and has the highest speed of all labeling systems (Bruno, 1995).
Pressure-Sensitive
Pressure-sensitive labels are sticker-like labels with adhesive that is tacky at room temperature. They attach to a variety of different substrates with hand pressure. Pressure-sensitive labels are more expensive than glue-applied labels because they are pre-die cut and individually attached to a protective backing, which is thrown away after the label is applied (Hall, 1999). Although pressure-sensitive labels are one of the more expensive types of labels, they are the easiest to apply and make up approximately 45 percent of all labels (Bruno, 1995). They are the fastest growing segment of the label market (Bruno, 1995) and are expected to grow in the drug packaging market at the expense of heat-sealed systems because of their simplicity and efficiency (Jenkins and Osborn, 1993). Pressure-sensitive labels are composed of either plastic or paper and are usually printed with flexography (Bruno, 1995).
Heat-Sealed and In-Mold
Heat-sealed labels are printed on a special type of paper, then coated with a latent adhesive. When the label is to be applied to the package, a heated platen activates the adhesive just before it is attached. Two types of heat-sealed labels are currently used—an
FDA Labeling Cost Model
2-6
instant form that becomes tacky immediately upon contact with the heated platen and a delayed heat-sealed form that has a few seconds’ delay between contact with the platen and activation of the adhesive. Instant heat-sealed labels take longer to apply and are generally used for packaging perishable goods such as meats, cheeses, and bakery goods (Bruno, 1995). Delayed heat-sealed labels are used for heat-sensitive products like food and drugs so the heating equipment does not come near the product (Jenkins and Osborn, 1993). Heat-sealed labels are cleaner to apply than other types of labels and therefore are attractive for industries concerned with sanitary and hygienic processing, such as pharmaceuticals (Bruno, 1995). Heat-sealed labels are also more securely attached to the package than other labeling types because they have a strong bond to the container wall (Jenkins and Osborn, 1993). However, heat-sealed labels cannot be stored for more than 6 months because premature activation of the adhesive could occur (Bruno, 1995).
In-mold labels are a type of heat-sealed label for blow-molded plastic bottles. These types of labels become part of the bottle during the molding operation (Bruno, 1995). Because rotogravure is used to print in-mold labels, they tend to be more costly than other types of labels. They also tend to be more costly to apply because, if an error occurs in the label application process, the whole container must be scrapped (Freedonia Group, 1999).
Heat-Transfer
Heat-transfer labels are printed on a lacquer film rather than a paper or plastic substrate (Bruno, 1995). In the application process, a heated platen presses the printed ink area against a heated container, transferring the entire lacquer/ink image to another surface (Bruno, 1995). This is a very costly process because of the slow speed and high operating costs. Also, if there is any printing mistake, the whole container must be scrapped (Freedonia Group, 1999). Heat-transfer labels are usually printed with rotogravure and are typically used on squeeze bottles and tubes, like toothpaste and frosting (Bruno, 1995).
Section 2 — Overview of Packaging, Labels, and Printing Methods
2-7
Sleeve (or Shrink)
Sleeve labels are made from plastic that is formed into a continuous tube that slips over a container. No adhesive is used because the label clings by its elastic nature. A more common type of sleeve labeling is the PVC or PP (types of plastic) sleeve that is slipped over the container and passed through a heat tunnel to shrink it. This type of label is often referred to as a shrink label. Often the sleeve label is applied to soft drink bottles and other irregular shaped containers. Flexography or rotogravure is usually used to print plastic sleeve labels (Bruno, 1995).
2.2 PRINTING METHODS We describe each of the three main printing methods (rotogravure, offset, flexography) used on food and beverage packaging below. Each method has advantages and disadvantages for certain types of printing based on run lengths, cost, printing substrate, and image quality.
2.2.1 Rotogravure
Rotogravure is an intaglio printing process in which the image area is below the nonimage area (Bruno, 1995). Rotogravure printing can be done using traditional printing methods or by direct digital-to-plate. In a traditional rotogravure process, proofs of the images for each printing plate are generated for use in the engraving process. In a digital-to-plate rotogravure process, the images are transmitted digitally for use in the engraving process.
From the proofs or a digital file, an engraving machine cuts cells into a copper cylinder using either electromechanical (diamond) engraving or chemical etching. Chemical etching, or conventional rotogravure, creates cells with equal areas but varying depths, while diamond engraving creates cells with varying areas as well as depths. The cylinder is then coated with chrome for durability. Rotogravure plates are the longest lasting of all of the printing methods and are capable of printing runs that go for millions of impressions (Bruno, 1995).
During the printing process, rotogravure cylinders are dipped in ink and a doctor blade scrapes off the excess ink. Rotogravure has unyielding plates that come in direct contact with the label or
The rotogravure printing method is used for long print runs and is the most costly printing method.

FDA Labeling Cost Model
2-8
package (Hawley, 2000). Rotogravure is the most expensive of the printing processes because of the costly copper cylinders, the required solvent recovery systems, the time required for engraving the cylinders, and a longer downtime during changeover from one printing run to the next. Because of the expensive cost and unyielding plates, rotogravure is ideally suited for long runs using inexpensive paper, but it is also used for approximately 10 percent of the flexible packaging market (Mykytiuk, 1999). Many manufacturers prefer rotogravure because it can reproduce high quality graphics.
2.2.2 Offset Lithography
Offset lithography, which is commonly referred to as offset, is a planographic process in which the image and nonimage areas exist on the same plane. Offset plates are easier to produce and less costly than rotogravure (Bruno, 1995). Offset plates are mostly created using a photographic process from film, but the use of digital-to-plate methods is on the rise (Hawley, 2000).
In making offset plates, a water-receptive solution is coated on the nonimage area of the plate, and an ink-receptive solution is coated onto the image area of the plate (Bruno, 1995). These coatings are applied to ensure that, when the plate is dipped into the ink, only the image areas will pick up the ink and the ink will be repelled from the water-receptive nonimage areas. During the printing process, the plate is first dipped into the ink and then the image is transferred to a rubber blanket wrapped around a cylinder. The blanket, in turn, transfers the image to the substrate. The rubber cylinder allows the image to be printed on a wide range of substrates (Speirs, 1998). However, the one-dimensional blanket does not conform to unusual substrates as well as a two-dimensional flexographic plate (Hawley, 2000).
Another type of offset called dry (or waterless) offset is used for direct printing of two-piece aluminum cans. In the dry offset process, instead of coating the image and nonimage areas of the plate with special solutions, silicone rubber is placed in the nonprinting areas. The silicone rubber material is not ink-receptive so only the area not coated with the rubber material picks up the ink.
The offset printing method is typically used on cartons, aluminum cans, and paper labels.
Section 2 — Overview of Packaging, Labels, and Printing Methods
2-9
Offset is commonly used for printing paper materials, such as paperboard cartons and paper labels. Although the offset process is not able to print on many of the new packaging films, it is still the most common printing method today (Hawley, 2000). It is the most common printing method for glue-applied labels, paperboard cartons, metal cans, and paper labels (Bruno, 1995; Brody, 2000a).
2.2.3 Flexography
Flexography is a relief printing process where the image area is raised above the nonimage area (Bruno, 1995). The plates are made from soft rubber-like sheets, which are then wrapped around a cylinder (Hawley, 2000). Flexographic plates are less expensive than both offset and rotogravure plates (Mykytiuk, 1999). The flexibility of the plates allows them to print on a variety of substrates, but it can also cause shifting during printing, which lowers the quality of the image. Flexography is used on substrates to which the one-dimensional blanket used in the offset printing process cannot conform (Hawley, 2000). These substrates include pressure-sensitive nonpaper labels and flexible packages (Bruno, 1995). However, flexography is also increasingly being used for printing paperboard cartons (Demetrician, 1996).
In the flexography process, a graphic image is burned onto a thin rubber-like sheet by placing the film, which is created from the proofs generated in the prepress process, on top of the rubber sheet and exposing it to a light source. The rubber sheet is washed in a machine with brushes that wipe away the nonimage areas. Because the image areas had been hardened by the light source, they remain. The sheet is then dried with heat. Creating plates for designs with process color is more complicated than with line colors because process color requires small cells to be burned into the rubber rather than solid areas. Therefore, the brushes need to wipe away small areas between the cells, which is more difficult than brushing away a large solid area as with designs using line colors.
Color separation is different for flexography than any other type of print. If the same color is going to be used in a design as both line color and process color, then they need to have separate plates, even though it is the same color. This is done to achieve better color-saturation of line colors without bleeding. Sometimes a
The flexography printing method is the least costly printing method.
FDA Labeling Cost Model
2-10
combination plate can be created for a color that is going to be used for both line and process, but the area of the images must be very small.
Flexography normally prints six to eight colors on a label or package. After printing, the printed substrate may be laminated with up to five layers of materials. The packages or labels are then slit and rolled or are made into preformed packages for delivery to the manufacturer.
2.3 LABEL CONTENTS The two sections of the labeling information on a food or dietary supplement package are the Principal Display Panel (PDP) and the information panel (IP). As indicated in an example of a food product label in Figure 2-1, the PDP is the portion of the package label that faces the consumer when the package sits on a store shelf. The IP is the panel located immediately to the right of the PDP. Each panel must contain specific information about the product.
Figure 2-1. Examples of Parts of Food Labels that May Change as a Result of a Regulation Which part of the label is affected determines the number of colors that must be changed and thus the complexity of making the change.
Section 2 — Overview of Packaging, Labels, and Printing Methods
2-11
In the example product in Figure 2-1, a labeling regulation may affect the following parts of the PDP: the name of the food (the statement of identity or fanciful name), the form of the food or dietary supplement, the net quantity statement, or a nutrient content or health claim. Other parts of the PDP such as the brand name or vignette are unlikely to be affected by a labeling regulation. On the IP, a labeling regulation may affect, for example, the Nutrition Facts label or the ingredient list. If the product had or was required to have a caution statement or health claim on the PDP or IP, it might also be affected by a labeling regulation. Other parts of the IP such as the manufacturer information or the universal product code (UPC) are unlikely to be affected by a labeling regulation.
As discussed in more detail in Sections 3 and 4, the component(s) of the labeling that are changed determines how many colors on the labeling will have to be changed. Depending on the method of packaging and labeling and on the method of printing, as discussed in this section, the cost of making the change to each component of the labeling varies substantially. In particular, the cost of discarded inventory varies among the methods of packaging and labeling, and the cost of cutting or engraving new printing plates varies among the printing methods.
2.4 REFERENCES Brody, Aaron L. 2000a. Offset on Plastic Yields High-Quality
Short Runs. Brand Packaging (May/June). <http://www.packaginginfo.com>
Brody, Aaron L. 2000b. “Gable-Top Paperboard Cartons Move to the Food Aisles.” Food Technology 54(10):101-103.
Brody, Aaron L. October 3, 2001. Personal communication with Mary Muth, RTI.
Bruno, Michael H., ed. 1995. Label Industry Facts & Guidelines, 2nd edition. Arlington, VA: Label Printing Industries of America.
Can Manufacturers Institute. Metal Can Shipments 1995: Material/Technology. <http://www.cancentral.com/ mcsmt.cfm>. As obtained October 18, 2001.
FDA Labeling Cost Model
2-12
Demetrician, Robert. 1996. Label and Package Graphic Design. Plainview, NY: Jelmar Publishing Co., Inc.
Freedonia Group. 1999. World Labels to 2003—Market Share, 1.5.1 Cost Considerations. <http://www.profound.com>.
Hall, Ian H. 1999. Labels and Labelling, 2nd edition. Surrey, U.K.: Pira International.
Hawley, R. Printbid Tutorial: Pre-Press. <http://www.printbid.com/styles/resources-tutorialprepress.htm>. As obtained on September 22, 2000.
Jenkins, Wilmer A., and Kenton R. Osborn. 1993. Packaging Drugs and Pharmaceuticals. Basel, Switzerland: Technomic Publishing Company, Inc.
Mykytiuk, Andrew. October 1999. Printing for Flexible Packaging. Flexible Packaging. <http://www.packaginginfo.com>.
NPES—The Association for Suppliers of Printing, Publishing, and Converting Technologies. The Packaging Study, Executive Summary. <http://www.npes.org/research/index.htm>. As obtained on December 11, 2000.
Speirs, Hugh M. 1998. Introduction to Printing and Finishing Surrey, U.K.: Pira International.
University of California at Davis. Reduce. <http://r4.ucdavis.edu/aboutR4/reduce/Reduce.htm>. As obtained August 2001.

3-1
The Process of Changing Food and Dietary Supplement 3 Labeling
To understand the process by which labeling information is changed, RTI visited packaging converters that use the rotogravure, offset lithography, and flexography printing methods; interviewed several food manufacturers about the steps in the process; and obtained detailed information from an industry packaging consultant. Based on our site visits and interviews, we developed a brief overview of the process of making changes to food and dietary supplement packaging. In general, the process is similar for all three primary printing methods. In this section, we describe the process step-by-step and discuss how the process differs depending on the compliance period.
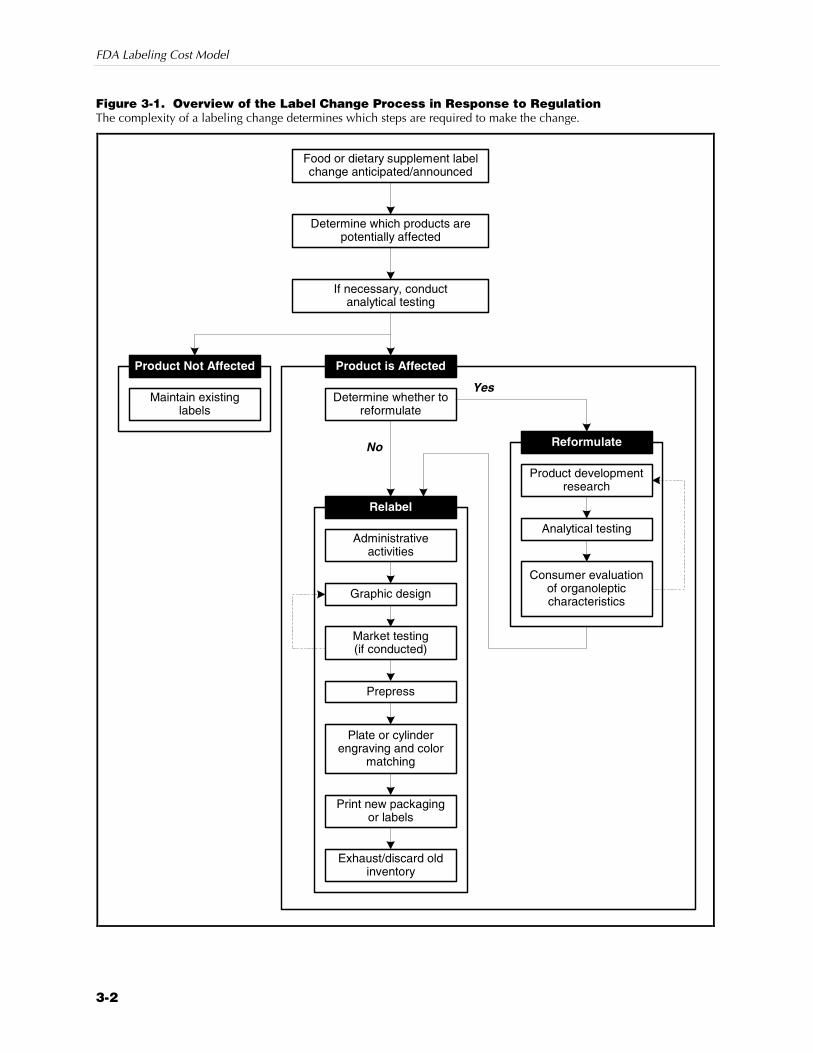
3.1 OVERVIEW OF THE CHANGE PROCESS Figure 3-1 provides an overview of the process by which the labeling information and graphics on food and dietary supplement products may be changed as a result of regulation. Once a food or dietary supplement manufacturer has determined that a product may be affected, the manufacturer may conduct analytical testing of the product. Results of the analytical tests would then influence the manufacturer’s decision to reformulate the product. However, in many cases, reformulation would not be a likely response to the regulatory requirements, or the company may choose not to
The overview of the process of changing labeling information provides the framework for understanding the cost estimates in Section 4.
FDA Labeling Cost Model
3-2
Figure 3-1. Overview of the Label Change Process in Response to Regulation The complexity of a labeling change determines which steps are required to make the change.
Determine which products arepotentially affected
Food or dietary supplement labelchange anticipated/announced
Exhaust/discard oldinventory
Analytical testing
Consumer evaluationof organolepticcharacteristics
Reformulate
If necessary, conductanalytical testing
Determine whether toreformulate
Product is Affected
Maintain existinglabels
Product Not Affected
Market testing(if conducted)
Graphic design
Prepress
Print new packagingor labels
Product developmentresearch
Plate or cylinderengraving and color
matching
Administrativeactivities
Relabel
Yes
No
Section 3 — The Process of Changing Food and Dietary Supplement Labeling
3-3
reformulate. Estimating the costs of reformulation is beyond the scope of the labeling costs model; thus, we focus on the process that occurs assuming either no reformulation or that the reformulation has already occurred. In either case, the manufacturer would change the labeling information on the product.
Whether or not the manufacturer conducts analytical testing, it will follow a number of steps to initiate the change process. In general, the steps are as follows:
Z conduct administrative activities,
Z conduct analytical testing (in some cases),
Z alter the graphic design,
Z conduct market testing (in some cases),
Z conduct prepress activities,
Z conduct color matching (in some cases),
Z engrave plates or cylinders, and
Z print and manufacture (convert) labels and packaging material.
Several departments within the manufacturing firm (e.g., purchasing, marketing, legal, and regulatory) are involved in the process of making a labeling change. In this report, we refer to the combined set of activities conducted by these departments as administrative activities.
In addition to the departments within the manufacturing firm, several outside entities may be involved. In some cases, the food manufacturer may handle one or more of the steps in the process internally; however, it is more likely that these activities are outsourced to the following entities:
Z a graphic designer,
Z a prepress company,
Z a plate or cylinder engraver, and
Z a packaging converter (the company that manufactures and prints labels and/or packaging material).
In some cases, the packaging converter may do all of the above activities.
Labeling changes involve several internal departments within the company and as many as four outside entities.
FDA Labeling Cost Model
3-4
3.1.1 Administrative Activities
Throughout the process of making a change, several administrative activities on the part of the food or dietary supplement manufacturer must occur. Whether manufacturers devote separate departments to each of these activities depends on the size of the company. These departments might include the following:
Z purchasing—work with outside vendors to supply graphic design, prepress and engraving, and package printing and conversion services;
Z marketing—develop initial redesigned graphics and, if conducted, conduct or contract out market testing;
Z legal—approve labeling information from a viewpoint of limiting liability;
Z regulatory—approve labeling information from a viewpoint of satisfying FDA requirements;
Z environmental—if changed, approve packaging materials from an environmental standpoint; and
Z test kitchen—verify information corresponds to a reformulated product recipe.
Manufacturers have a routing sheet for each department to sign-off on the changed labeling as it is approved. In the other steps of the process described below, the departments listed above are involved in working with outside vendors to complete each activity.
3.1.2 Analytical Testing
As mentioned above, prior to initiating a labeling change, a food or dietary supplement manufacturer may conduct analytical testing of affected or potentially affected food products. For example, the manufacturer may test for total or specific nutrients, caffeine, allergens, pathogens, genetic modification, and botanical content (in the case of dietary supplements). To conduct analytical testing, a manufacturer will usually prepare a composite sample made up of several samples of the product. Based on information provided by the manufacturers we contacted, they usually test one composite sample but may test up to three samples. Many manufacturers already have some idea of the levels of the particular substance in their product from their routine quality control checks. In particular, some manufacturers told us they test products approximately every 2 years to verify initial test results. However, even if the manufacturer has data on a particular substance, if a
A food or dietary supplement manufacturer may conduct analytical testing prior to changing its labeling.
Section 3 — The Process of Changing Food and Dietary Supplement Labeling
3-5
regulation involves that substance, the manufacturer would generally retest to confirm its data.
Testing may be done in-house, or samples may be sent to outside labs. Although larger food and dietary supplement manufacturers may have in-house labs, smaller manufacturers would rarely have in-house labs. To submit samples to an outside lab, manufacturers first notify the lab that the samples are coming. In the package, manufacturers label and identify the samples and, if the product is perishable, pack the product with ice packs. They also include specific written instructions for the tests to be performed and in some cases the expected levels of the substance for which they are testing. Once the tests are performed, the results are delivered to the manufacturer, who then can use the information in determining its method of compliance with a regulation.
3.1.3 Graphic Design
Once the food or dietary supplement manufacturer has determined that the information on a product’s labeling must be changed, it develops its specifications for the change. Larger manufacturers may develop a mock-up of the changed design in-house prior to initiating contact with a graphic design company. Smaller manufacturers are more likely to rely entirely on the graphic design company for making a change according to its specifications. In either case, a representative from the marketing or purchasing department will initiate contact with the graphic design company. If the change requires changes in the colors used in the design, the manufacturer may include color swatches from the PANTONE® system of colors or another type of color sample.
If the graphic design company has digital files of the original labeling design, a required change can be made directly to the existing digital file. However, many graphic design companies still work with hand-prepared designs that must be redrawn to incorporate a change. If a required change is minor, the manufacturer may bypass the graphic design company and make the change directly at the prepress stage discussed below. Also, in some cases, the packaging converter may conduct the graphic design and prepress activities all in one shop.
In most cases, an external graphic design firm creates the labeling design.
FDA Labeling Cost Model
3-6
3.1.4 Market Testing
Once the preliminary new graphic design and labeling information have been created, manufacturers may conduct market testing of the new design. Most manufacturers do not conduct market testing; however, if they do, what they do is fairly limited.1 The two general types of market testing that might be conducted include “qualitative studies,” which are generally focus group studies, and “quantitative studies” in which individuals assess and rank attributes (also referred to as “controlled location studies”). For manufacturers that do conduct market testing, the type of market testing conducted and the number of studies conducted depend on whether they consider the change to be minor or major.
Food and dietary supplement manufacturers would generally consider a change to the information on the label’s IP (e.g., Nutrition Facts panel or ingredients list) to be a minor change. For these types of minor changes, the graphic designer, if one is involved, would submit a proof to the manufacturer for approval by the various departments within the company. In this case, the reviews are primarily conducted internally, and the food manufacturer would almost never conduct an external market evaluation.
In comparison, food and dietary supplement manufacturers would generally consider most changes to the label’s PDP as a major change requiring a redesign. In addition, any additions or changes to a health claim or caution statement, whether on the IP or PDP, might in some cases be considered a major change requiring a redesign. If food manufacturers redesign the label, they are more likely to conduct qualitative or quantitative market testing.
Prior to conducting market testing, the graphic designer may create several design options from which the food manufacturer chooses. After conducting an internal evaluation, the food manufacturer narrows the choices and may have the graphic designer create “dummy” packages by printing the redesigned labeling on a printer with good color reproducibility and manually mounting the labeling on a shape that is approximately the same dimensions of the final packaging. Using either the labeling design by itself or the
1Market testing is more often done when the form of the packaging itself is
changing rather than just the graphic design or labeling information.
Food and dietary supplement manufacturers only rarely conduct market testing for labeling purposes.
Section 3 — The Process of Changing Food and Dietary Supplement Labeling
3-7
“dummy” packages, the food manufacturer then conducts or contracts out the market testing activities. The manufacturers we interviewed reported conducting between two and eight focus groups, some with regional dispersion, and conducting quantitative studies with approximately 150 individuals.
Once market testing has been conducted, the manufacturer selects its final choice and then routes the final design through the various departments discussed in Section 3.1.1 for internal approvals.
3.1.5 Prepress Activities
Once the various departments within the manufacturing company have approved the labeling design, the manufacturer contracts with a prepress trade shop or directly with the converter to conduct prepress activities. The role of prepress operations is to convert the design created by the designer into the film or files that are used to engrave or etch the printing plates or cylinders. In converting the design, the prepress operator separates the colors of the design into each of the colors that will be printed by each individual plate or cylinder. Depending on the design, the colors may be generated by the four-color process (also called “screen”) that combines yellow, magenta, cyan, and black in the combinations necessary to achieve a particular shade, or the colors may be special or “line” colors that are premixed ink colors. Photographic images on packages or labels are usually generated by the four-color process, while brand-specific colors are usually line colors. Many labels and packages will have a combination of process color and line colors. The total number of colors is limited by the actual printing press that is used for printing the packaging or labeling with the maximum number generally ranging from six to nine colors.2
The operator then “traps” the design so that, as each color is printed onto the packaging or labeling substrate, the colors overlap slightly. This step is necessary because, as each color is printed individually, some slippage may occur in the printing process; thus, trapping prevents white or blank spaces from occurring between the colors.
At this stage, the designer will generate proofs, which are also sometimes referred to as color keys. The proofs are sent to the food
2At least one color station on a printing press is usually used for finishing varnishes.
Thus, a 10-station press can print a maximum of nine colors.
During prepress operations, the design created by the graphic designer is converted into the film or files used to prepare the printing cylinders or plates.
FDA Labeling Cost Model
3-8
manufacturer for final approval prior to engraving or etching the printing plates or cylinders. The proofs may also be used later in the process for verifying the actual printed packaging and labeling materials as they are generated. In some types of printing processes, the proofs are used to create the films that are used to etch the printing plates or cylinders. In comparison, in the digital-to-plate printing process, the proofs are used only for approval and verification of the process, and the actual engraving of the cylinders is directed by a computer program.
Once the proofs have been generated, all changes in the graphic design must be made manually or the graphic design and prepress operations must be repeated. If the films are used for etching the printing plates or cylinders, a new film would have to be generated to make a change. In the digital-to-plate process, the computer file used to engrave the plate or cylinder must be manually altered. However, at this stage, all of the text in the computer file is captured as “graphical elements” rather than commonly used fonts on the computer. Thus, even minor changes to the graphic design at this stage are difficult, if not impractical, to make.
3.1.6 Cylinder and Plate Engraving
Once the film or computer file of the image has been generated, the plates or cylinders are engraved or etched. The engraving or etching may be done by an outside engraving shop or in-house by the packaging converter. As described in Section 2.2, each printing type has a different method of engraving. In the rotogravure process, small ink cells are cut into copper-plated cylinders using either mechanical engraving or acid etching, and then the cylinders are chrome-plated. In the offset lithography process, the image area of the plate is coated with an ink-receptive liquid and the nonimage area is coated with a liquid that will repel ink. Finally, in the flexography process, a rubber-like sheet is etched by exposing the nonimage areas to a light source to harden the material. The exposed sheet is washed with a solution that removes the nonimage areas, and then it is attached to a cylinder for mounting on the printing machine.
The cylinders or plates are engraved using the film or files prepared during prepress.

Section 3 — The Process of Changing Food and Dietary Supplement Labeling
3-9
3.1.7 Color Matching
Food manufacturers may specify that certain color inks used to print the packaging and labeling match the specific colors in the graphic design, especially if the colors are associated with a particular well-known brand. (For process color, color matching is not necessary because industry standard colors are used for cyan, magenta, yellow, and black.) The color-matching process is performed either by an outside ink supplier or by the converter. In general, it takes a color specialist about 1 to 2 hours to match a color. The food manufacturer receives a sample of the matched color to approve prior to printing. Once approved, the specifications for the color match are then used to prepare the ink to be used in the printing process.
3.1.8 Label and Package Printing
Once the cylinders or plates have been engraved or etched, color matching has been completed, and the label or packaging material has been delivered, the packaging converter can begin the label or package printing job. If the job is the first run using new cylinders or plates, a representative from the food manufacturer may be present to observe the initial run.
To prepare for the job, the cylinders or plates are mounted sequentially on the printing machine, and the printing inks are connected to the associated cylinder or plate. The substrate may be either sheet fed, where the substrate moves through the machine in individual sheets, or web-fed where it moves as one long sheet to be cut into individual sheets at the end. Whether sheet-fed or web-fed is used depends on the type of substrate.
Once the substrate enters the machine, each color is printed individually as the substrate passes through each cylinder or plate. Between each color, the substrate passes through an oven that dries the ink before the next color is applied. While the substrate is moving through the printing machine, a worker continually verifies that the colors are printing within the tolerances of the design traps. After all of the colors have been printed on the substrate, varnishes may be applied to provide glossiness and protection from moisture. Following the printing process, flexible packaging and labels may be laminated with other substrates such as plastic or metallic inner and outer coatings.
Color matching is necessary to match ink colors to specific brand or product colors.
The final step in the process is printing the labels and packaging and, depending on the intended use, coating application, laminating, creasing, folding, and cutting.
FDA Labeling Cost Model
3-10
Once packaging or labels have been printed, coated with varnishes, and laminated, they are cut and formed to the manufacturer’s specifications. In the case of flexible packaging, the roll of packaging material is run through a cutter to cut it into single rolls of packaging. The material may then be rolled onto a smaller cylinder to fit on the machinery used by the manufacturers to package food, or the packaging converter may form the material into preformed pouches. For cartons, each carton is cut, creased for folds, and then stacked for delivery to the manufacturer. Depending on the type, labels may either be delivered on rolls or banded together for delivery to the manufacturer.
The plates or cylinders used in the printing process are then stored for later use. Because they are plated with chrome, rotogravure cylinders are the most durable and can print millions of impressions. In comparison, offset plates are less durable. Finally, because of the rubber-like material used in flexography cylinders, they are the least durable.
3.2 EFFECTS OF DIFFERENCES IN THE COMPLIANCE PERIOD Because of the number of steps involved in changing the information on food and dietary supplement packaging and labeling, the entire process generally takes several months. Although some food manufacturers of branded products may change their labeling information several times a year, other food manufacturers, particularly for private label products, may change their labeling information every few years. In this section, we discuss differences in the process for 12-, 24-, and 36-month compliance periods and what food manufacturers might do if the compliance period were extremely short.
3.2.1 Differences for 12-, 24-, and 36-Month Compliance Periods
FDA periodically announces uniform compliance dates for new food labeling requirements (FDA, 2000).3 The purpose of the uniform compliance date is to allow sufficient lead time for food
3The uniform compliance date applies only to food products and not to dietary
supplement products.
Section 3 — The Process of Changing Food and Dietary Supplement Labeling
3-11
manufacturers to develop new labeling materials, deplete existing inventories, and coordinate multiple labeling changes. For labeling regulations issued between January 1, 2001, and December 31, 2002, the next uniform compliance date is January 1, 2004. Thus, food manufacturers have a minimum of 12 months to comply with a regulation but may have as much as 36 months to comply.
In developing the labeling cost model, we assessed the differences in the effects of regulations with 12-, 24-, and 36-month compliance periods. The compliance period affects the following:
Z whether food manufacturers can coordinate a change required by a regulation with a scheduled change,
Z whether food manufacturers would likely incur overtime or rush charges, and
Z the volume of packaging or labeling inventory that must be discarded.
Depending on when the required labeling change is announced, food manufacturers may or may not be able to coordinate the change with a scheduled labeling change. If they can coordinate, then the incremental costs of making the required change would be less than if they made the change separately. In many cases, the incremental costs may be zero. However, if the required change affects a key part of the labeling design, the incremental costs may be substantial. Because food manufacturers redesign labeling for branded products on a more frequent basis than for private label products, they can coordinate a greater percentage of required changes with scheduled changes. In Section 4.2.1, we describe our specific assumptions for branded and private label products under each of the compliance period scenarios.
Differences in the effects of 12-, 24-, and 36-month compliance periods also occur because of the length of time it takes to coordinate the various steps in the process of changing labeling information (e.g., graphic design, prepress services, plate and cylinder engraving). Some of the companies we interviewed said that they cannot coordinate all of these activities in 1 year, particularly if a large number of products are affected. They also indicated that they might incur overtime or upcharges for rushing the steps in the process. One company we interviewed cited expected upcharges of 5 to 10 percent with a compliance period of 12 months. In addition, in the comments submitted to FDA on
Compliance costs decrease as the length of the compliance period increases primarily because more manufacturers can coordinate required changes with scheduled changes.
FDA Labeling Cost Model
3-12
trans fatty acid labeling, one company said that overtime charges alone would increase the costs of producing new labels by 20 percent if the compliance period were only 1 year (Angele, 2000). To account for upcharges and overtime charges for the 12-month compliance period, we increased the costs of administrative, graphic design, prepress, and engraving activities by 10 percent relative to the 24-month and 36-month compliance periods.
Finally, differences in the effects of the compliance period occur because of differences in the volume of packaging or labeling inventory that must be discarded. Manufacturers of private label products may order more than 1 year’s inventory and potentially up to 3 years’ inventory of packaging or labels at a time. Manufacturers of branded products, in comparison, generally do not order more than 1 year’s inventory of packaging or labels at a time because they frequently update the labeling information for marketing reasons. Both private label and branded manufacturers using the bulkiest packaging materials such as egg cartons and coffee cans are unlikely to have more than a few months’ inventory at a time. In Section 4.2.5, we discuss the assumptions we used for 12-, 24-, and 36-month compliance periods to calculate the costs of discarded inventory. The percentages of remaining inventory for each of the compliance periods depend on the bulkiness of the packaging and whether the product is branded or private label.
3.2.2 Responses to Very Short Compliance Periods
A compliance period of less than 1 year would be generally considered a very short compliance period by most food and dietary supplement manufacturers. In these situations, some manufacturers may respond by placing a preprinted, pressure-sensitive sticker on each package. The pressure-sensitive stickers that would be used would likely be printed in one or two colors and cost between 1 and 2 cents each (Brody, 2001). Some manufacturers already use stickers on promotional and imported items, but they generally do so on very few products. For some types of products, such as case-ready meats, manufacturers already routinely apply stickers to every product. However, most other types of manufacturers are unlikely to have the type of equipment necessary to apply stickers.
In reaction to a very short compliance period, manufacturers might comply by applying a pressure-sensitive sticker.

Section 3 — The Process of Changing Food and Dietary Supplement Labeling
3-13
The difficulty in using stickers as a short-term solution for a very short compliance period arises because of the logistics of applying a sticker and because of the time involved in applying the sticker, which may cause bottlenecks and thus delay shipments. In addition to the logistical issues, the manufacturer may incur upcharges in the process of changing its permanent packaging and labeling information. If manufacturers speed up this process, the costs of graphic design, prepress, and conversion would likely be escalated, particularly if a lot of their own products are affected or a lot of other manufacturers’ products are affected. Furthermore, if they do not apply a sticker to all of their existing packaging or labeling, they may have substantial discarded inventory costs (both the value of the material and the cost of landfill disposal).
To apply a sticker on each package, manufacturers may choose to buy a piece of machinery that applies pressure-sensitive stickers, or they may choose to hire workers to apply the stickers manually. If they choose to purchase the machinery, they would need to purchase one machine for each line and would need the necessary floor space to install and operate the machine. At a cost of approximately $10,000 for a machine that can apply approximately 200 stickers in an hour, most manufacturers would need between one and five machines and thus incur costs in the range of $10,000 to $50,000 (Brody, 2001). The line operator would usually be responsible for manning the sticker applicator; thus, the manufacturer would not incur substantially increased labor costs.
Alternatively, as we assumed in the labeling cost model, the manufacturer may choose to apply a sticker using manual labor. A worker would remove each sticker from its backing and apply it to each individual package. In addition, the manufacturer would need to set up a quality control check to ensure that each package has a sticker. If the packages are on a conveyor belt, a worker would take approximately 1 second to apply each sticker (Brody, 2001). If the packages are not on a conveyer belt, a worker would take 2 to 4 seconds to apply a sticker (Brody, 2001). In either case, the process of applying the sticker would create bottlenecks prior to the shipping process, and the manufacturer would incur substantially increased labor costs. Some manufacturers reported that they would not be able to meet their orders in this situation and would likely lose sales.
FDA Labeling Cost Model
3-14
3.3 REFERENCES Angele, S.M., Nabisco, Inc. April 17, 2000. “Re: (Docket No.
94P-0036) Food Labeling: Trans Fatty Acids in Nutrition Labeling, Nutrient Content Claims and Health Claims.” Dockets Management Branch, Food and Drug Administration, Rockville, Maryland.
Brody, A., Rubbright-Brody, Inc. August 1, 2001. Personal communication with Mary Muth, RTI.
Food and Drug Administration, Department of Health and Human Services. November 20, 2000. “Uniform Compliance Data for Food Labeling Regulations.” Federal Register 65(224):69666-69667.

4-1
Labeling Cost Model Assumptions, Data, 4 and Calculations
In this section, we describe the assumptions used in developing the labeling cost model, present the data for the model, and explain the calculations that underlie the cost estimates. This information provides the background that a user of the model may need to select the model inputs (as described in Section 5).
4.1 LABELING COST MODEL ASSUMPTIONS The labeling cost model provides estimates of the costs of making labeling changes for the range of food and dietary supplement products under FDA’s jurisdiction. Thus, the model explicitly excludes alcoholic beverages and meat and poultry products. In addition, some types of products are excluded because the products do not have scannable UPC codes. Because they do not have UPC codes, they are not part of the scanner data available from IRI, which is the source of the product information in the model. These products include, for example, bulk cheeses cut and packaged in the store, bulk foods put into bags by the consumer, and fresh produce. However, in general, the labeling information for these products is provided at point-of-sale and is currently voluntary.
The key assumptions used in developing the labeling cost model are as follows:
The labeling cost model includes food and dietary supplement products under FDA’s jurisdiction.

FDA Labeling Cost Model
4-2
Z Depending on the compliance period, some food and dietary supplement manufacturers will be able to coordinate a labeling change required as a result of an FDA regulation with a scheduled labeling change. If the labeling change could be coordinated with a scheduled labeling change, it is unlikely the regulatory requirements would result in additional incremental costs. According to our industry contacts, the pricing for graphic design services does not differ substantially if additional changes are made because of a regulatory requirement at the same time as a scheduled labeling change. Costs for activities other than graphic design would similarly not be affected. Our assumptions about the proportion of SKUs that could be changed with a scheduled label change are presented in Table 4-1. Because these estimates are based on limited information from manufacturers and because the true proportions vary by product category, the labeling cost model allows the user to alter these values.1
Z Manufacturers make the labeling change required as a result of an FDA regulation by itself and do not at the same time make changes unrelated to the regulatory requirements. In selecting the model inputs, the user chooses which parts of the labeling information will likely be affected. Thus, the cost estimates are generated based on these inputs and do not account for the fact that some manufacturers may take the opportunity to make other changes that would normally be part of the next scheduled labeling change.
Z The administrative costs associated with making a labeling change are on an SKU basis rather than a product-level or company-level basis.2 Each individual product may have several SKUs associated with different sizes or types of packaging. The administrative costs of making a labeling change include the costs associated with contracting out aspects of the labeling change work and then approving the changes in the various manufacturing departments (described in Section 3.1). We assumed that the costs depend on the number of SKUs affected rather than a fixed amount per company because each individual SKU must go through the same contracting and approval process.
1We recommend that, when FDA requests comments on a proposed rule that
requires a labeling change, it specifically asks what proportion of private label and branded labeling changes could be coordinated with a scheduled labeling change for the minimum expected compliance period.
2This assumption differs from the 1990 labeling cost model in which administrative costs were calculated on a per-company basis.
Section 4 — Labeling Cost Model Assumptions, Data, and Calculations (Revised October 2002)
4-3
Proportion of SKUs
Compliance Period Branded Private Label
6-month 5% 0%
12-month 33% 5%
24-month 67% 33%
36-month 100% 67%
Z The costs associated with redesigning a label, conducting prepress operations, and engraving or etching the plates or cylinders are on an SKU basis. Manufacturers incur the costs associated with all of the activities for preparing to print new labels or packaging on an SKU basis because each is treated separately throughout the process.
Z The costs of administrative, redesign, prepress, and engraving or etching activities are 10 percent higher under the 6- or 12-month compliance period than under the 24- or 36-month compliance period. When manufacturers must coordinate labeling changes to many products at once, they may incur overtime charges internally or rush charges for design, prepress, and engraving or etching activities conducted by outside companies.
Z The costs associated with analytical testing and market testing are on a product basis. The composite sample submitted for analytical testing is the same regardless of how the product is packaged and sold; thus, manufacturers incur costs on a product (or formula) basis. Similarly, manufacturers conduct market testing on a product (or formula) basis.
Z The differences in the costs of making changes to private label and branded products occur primarily because of differences in the frequency for redesigning labels and the amount of inventory typically held. We assumed that the other costs associated with making changes are the same for both private label and branded products.
Z Manufacturers are, on average, halfway through their order of packaging or label inventory at the time the labeling change is required to be completed. Although some manufacturers may have recently ordered new packaging or label material, an equal number will be nearing the end of their existing inventories.
Table 4-1. Proportion of SKUs that Could Be Coordinated with a Scheduled Labeling Change (default values) The user of the model may accept these default values or change them based on other information.
FDA Labeling Cost Model
4-4
Additional specific assumptions were required for particular data elements in the model. These assumptions are described as part of the discussion of the model data in Section 4.2.
4.2 LABELING COST MODEL DATA In this section, we present the data that underlie the cost calculations for the model. These include the product categories and types, the number of colors associated with each part of the label affected by a regulation, the SKU-level costs, the product-level costs, and discarded inventory costs.
4.2.1 Product Categories and Types
Using scanner data obtained through FDA from IRI, we collapsed and reorganized approximately 700 food and dietary supplement product categories into approximately 140 product categories based on similarity of use of the products and storage requirements (e.g., shelf stable, refrigerated, and frozen). These 140 product categories form the core of the labeling cost model and are the product categories that the user chooses while executing the model. Table 4-2 lists each of the product categories, organized by type of product, with a description of a representative product for the product category and the number of SKUs and annual units sold.3 These 140 product categories represent approximately 354,000 SKUs and $192.5 billion dollars in sales in grocery stores, drug stores, and mass merchandise stores in 1999.
Because of the complexity of determining the costs of changing the labeling on each individual product, we based our cost estimates on a representative product within each category. We determined the representative product indicated in Table 4-2 using a three-step process. First, within each product category, we sorted the individual IRI SKU-level records by annual sales volume and then
3Appendix Table A-1 categorizes these product categories by NAICS code.
Appendix Table A-2 lists the IRI categories included in each product category.

Section 4 — Labeling Cost Model Assumptions, Data, and Calculations (Revised October 2002)
4-5
Ta
ble
4-2
. P
rod
uc
ts I
nc
lud
ed
in
th
e L
ab
elin
g C
ost
Mo
de
l (r
evi
sed
Ap
ril 2
00
2)
The
cost
est
imat
es fo
r m
akin
g a
labe
ling
chan
ge a
re b
ased
on
the
prin
ting
and
pack
agin
g m
etho
d fo
r a
repr
esen
tativ
e pr
oduc
t.
R
epre
sent
ativ
e Pr
oduc
t N
o. o
f SK
Us
Ann
ual U
nits
Sol
d (m
illio
ns)
Prod
uct
Cat
egor
y D
escr
ipti
on
Prod
uct
Size
Pa
ckag
e/La
bel
Prin
ting
Met
hod
Bra
nded
Pr
ivat
ea
Bra
nded
Pr
ivat
e
Bak
ed G
oods
Bak
ery
Snac
ks—
Non
-R
fg
Littl
e D
ebbi
e Sw
iss
Cak
e R
olls
13
oz
Kno
ck d
own
cart
on
Offs
et L
ithog
raph
y 4,
988
2,81
7 1,
098.
4 17
2.9
Bak
ery
Snac
ks—
Rfg
En
tenm
ann’
s U
ltim
ate
Cru
mb
Cak
e 1
lb 3
oz
Flat
bla
nk c
arto
n O
ffset
Lith
ogra
phy
43
65
1.3
1.2
Bre
ad/R
olls
—N
on-R
fg
Sunb
eam
Bre
ad
24 o
z
Plas
tic b
ag/p
ouch
Fl
exog
raph
y 13
,822
9,
245
3,07
6.0
2,05
7.3
Bre
ad/R
olls
—R
fg &
Fz
Lend
er’s
Bag
els
12 o
z Pl
astic
bag
/pou
ch
Flex
ogra
phy
1,23
6 19
8 35
4.9
47.9
Bre
adcr
umbs
/Bat
ters
/ C
rout
ons
Shak
e n’
Bak
e 6
oz
Kno
ck d
own
cart
on
Offs
et L
ithog
raph
y 1,
013
147
204.
5 29
.7
Coo
kies
O
reos
Coo
kies
1
lb 4
oz
Plas
tic b
ag/p
ouch
Fl
exog
raph
y 7,
383
1,41
5 2,
148.
2 34
8.0
Cra
cker
s R
itz
1 lb
K
nock
dow
n ca
rton
R
otog
ravu
re
2,89
8 62
2 1,
676.
9 21
0.4
Snac
k &
Gra
nola
Bar
s Su
nbel
t Gra
nola
Bar
10
oz
Kno
ck d
own
cart
on
Offs
et L
ithog
raph
y 1,
184
109
600.
8 34
.9
Bak
ing
Ingr
edie
nts
Bak
ing
Ingr
edie
nts
Nes
tle T
ollh
ouse
M
orse
ls
12 o
z Pl
astic
bag
/pou
ch
Flex
ogra
phy
1,49
5 30
3 61
3.3
121.
4
Bak
ing
Ingr
edie
nts—
Pow
ders
A
rm &
Ham
mer
B
akin
g So
da
1 lb
K
nock
dow
n ca
rton
R
otog
ravu
re
149
24
151.
8 17
.9
Bak
ing
Mix
es
Dun
can
Hin
es C
ake
Mix
18
.25
oz
Kno
ck d
own
cart
on
Offs
et L
ithog
raph
y 1,
612
313
1,11
5.1
55.5
Dou
gh—
Rfg
& F
z Pi
llsbu
ry C
resc
ent
Rol
ls
8 oz
Sp
iral
wou
nd
cont
aine
r R
otog
ravu
re
507
220
777.
3 23
0.4
Flou
r/M
eal
Gol
d M
edal
Flo
ur
5 lb
Pa
per
bag
Flex
ogra
phy
1,46
8 27
8 33
0.8
62.6
(c
ontin
ued)
FDA Labeling Cost Model
4-6
Ta
ble
4-2
. P
rod
uc
ts I
nc
lud
ed
in
th
e L
ab
elin
g C
ost
Mo
de
l (r
evi
sed
Ap
ril 2
00
2)
(co
nti
nu
ed
)
R
epre
sent
ativ
e Pr
oduc
t N
o. o
f SK
Us
Ann
ual U
nits
Sol
d (m
illio
ns)
Prod
uct
Cat
egor
y D
escr
ipti
on
Prod
uct
Size
Pa
ckag
e/La
bel
Prin
ting
Met
hod
Bra
nded
Pr
ivat
ea
Bra
nded
Pr
ivat
e
Bak
ing
Ingr
edie
nts
(con
tinu
ed)
Nut
s—B
akin
g N
uts
Dia
mon
d C
hopp
ed
Wal
nuts
8
oz
Plas
tic b
ag/p
ouch
Fl
exog
raph
y 1,
113
228
109.
5 22
.4
Pizz
a—C
rust
/Dou
gh
Pills
bury
Piz
za C
rust
10
oz
Spir
al w
ound
co
ntai
ner
Rot
ogra
vure
13
2 40
38
.5
6.4
Bev
erag
es
Bot
tled
Wat
er
Pola
nd W
ater
1
gallo
n La
bel—
pres
sure
se
nsiti
ve
Flex
ogra
phy
2,85
0 1,
465
1,09
5.5
563.
1
Car
bona
ted
Bev
erag
es—
Reg
ular
b C
oca-
Col
a 2
liter
La
bel—
cut &
sta
ck
Flex
ogra
phy
2,18
8 44
0 3,
207.
2 47
6.0
Car
bona
ted
Bev
erag
es—
Reg
ular
c C
oca-
Col
a 12
pac
k ca
rton
K
nock
dow
n ca
rton
O
ffset
Lith
ogra
phy
1,63
3 32
9 2,
394.
9 35
5.5
12 o
z ca
n M
etal
can
O
ffset
Lith
ogra
phy
Car
bona
ted
Bev
erag
es—
Suga
r Su
bstit
uteb
D
iet C
oke
2 lit
er
Labe
l—cu
t & s
tack
Fl
exog
raph
y 46
1 10
8 1,
129.
7 10
0.4
Car
bona
ted
Bev
erag
es—
Suga
r Su
bstit
utec
D
iet C
oke
12 p
ack
cart
on
Kno
ck d
own
cart
on
Offs
et L
ithog
raph
y 41
9 99
1,
025.
8 91
.2
12 o
z ca
n M
etal
can
O
ffset
Lith
ogra
phy
Car
bona
ted
Bev
erag
es—
Wat
er/C
lub
Soda
C
anad
a D
ry C
lub
Soda
1
liter
La
bel—
cut &
sta
ck
Flex
ogra
phy
1,08
3 72
0 36
0.5
239.
8
Cof
fee—
Gro
und
Folg
ers
Cla
ssic
Roa
st
Gro
und
Cof
fee
13 o
z La
bel—
shri
nk w
rap
Flex
ogra
phy
2,18
3 33
8 56
7.7
63.7
Cof
fee—
Inst
ant
Folg
ers
Cla
ssic
Roa
st
Inst
ant C
offe
e 8
oz
Labe
l—cu
t & s
tack
R
otog
ravu
re
486
139
189.
8 14
.7
(con
tinue
d)
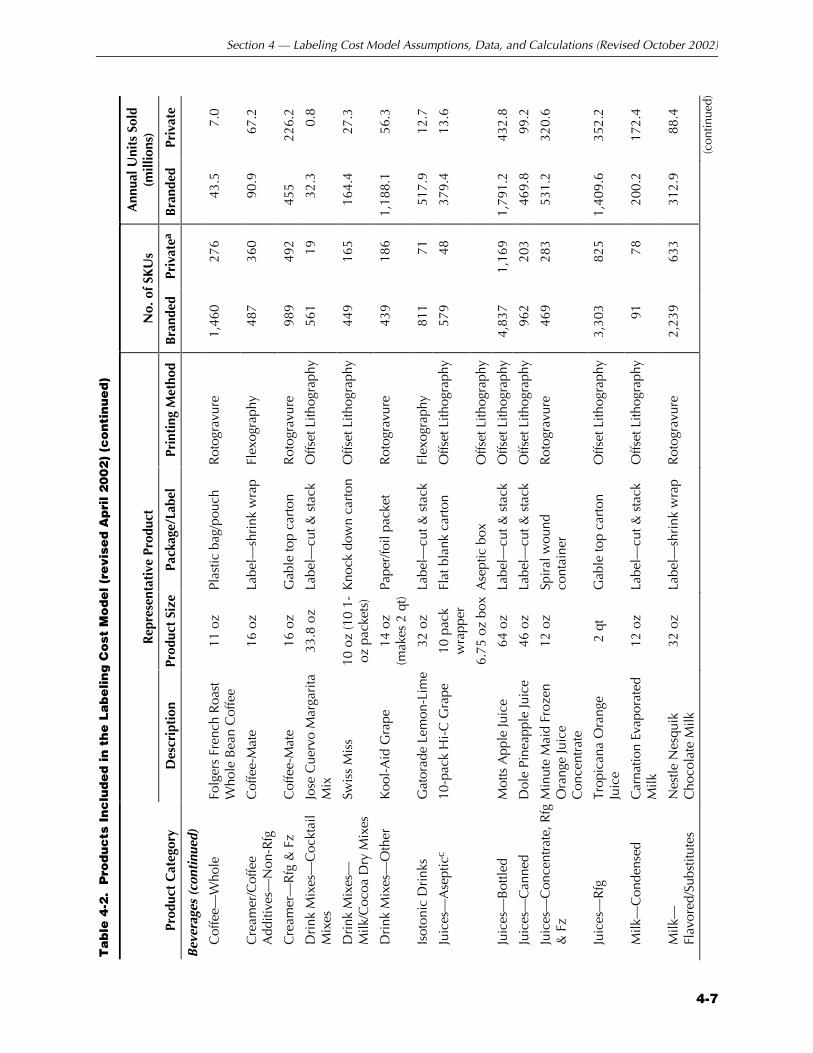
Section 4 — Labeling Cost Model Assumptions, Data, and Calculations (Revised October 2002)
4-7
Ta
ble
4-2
. P
rod
uc
ts I
nc
lud
ed
in
th
e L
ab
elin
g C
ost
Mo
de
l (r
evi
sed
Ap
ril 2
00
2)
(co
nti
nu
ed
)
R
epre
sent
ativ
e Pr
oduc
t N
o. o
f SK
Us
Ann
ual U
nits
Sol
d (m
illio
ns)
Prod
uct
Cat
egor
y D
escr
ipti
on
Prod
uct
Size
Pa
ckag
e/La
bel
Prin
ting
Met
hod
Bra
nded
Pr
ivat
ea
Bra
nded
Pr
ivat
e
Bev
erag
es (
cont
inue
d)
Cof
fee—
Who
le
Folg
ers
Fren
ch R
oast
W
hole
Bea
n C
offe
e 11
oz
Plas
tic b
ag/p
ouch
R
otog
ravu
re
1,46
0 27
6 43
.5
7.0
Cre
amer
/Cof
fee
Add
itive
s—N
on-R
fg
Cof
fee-
Mat
e 16
oz
Labe
l—sh
rink
wra
p Fl
exog
raph
y 48
7 36
0 90
.9
67.2
Cre
amer
—R
fg &
Fz
Cof
fee-
Mat
e 16
oz
Gab
le to
p ca
rton
R
otog
ravu
re
989
492
455
226.
2
Dri
nk M
ixes
—C
ockt
ail
Mix
es
Jose
Cue
rvo
Mar
gari
ta
Mix
33
.8 o
z
Labe
l—cu
t & s
tack
O
ffset
Lith
ogra
phy
561
19
32.3
0.
8
Dri
nk M
ixes
—M
ilk/C
ocoa
Dry
Mix
es
Swis
s M
iss
10 o
z (1
0 1-
oz p
acke
ts)
Kno
ck d
own
cart
on
Offs
et L
ithog
raph
y 44
9 16
5 16
4.4
27.3
Dri
nk M
ixes
—O
ther
K
ool-
Aid
Gra
pe
14 o
z (m
akes
2 q
t) Pa
per/
foil
pack
et
Rot
ogra
vure
43
9 18
6 1,
188.
1 56
.3
Isot
onic
Dri
nks
Gat
orad
e Le
mon
-Lim
e 32
oz
Labe
l—cu
t & s
tack
Fl
exog
raph
y 81
1 71
51
7.9
12.7
Juic
es—
Ase
ptic
c 10
-pac
k H
i-C
Gra
pe
10 p
ack
wra
pper
Fl
at b
lank
car
ton
Offs
et L
ithog
raph
y 57
9 48
37
9.4
13.6
6.75
oz
box
Ase
ptic
box
O
ffset
Lith
ogra
phy
Juic
es—
Bot
tled
Mot
ts A
pple
Juic
e 64
oz
Labe
l—cu
t & s
tack
O
ffset
Lith
ogra
phy
4,83
7 1,
169
1,79
1.2
432.
8
Juic
es—
Can
ned
Dol
e Pi
neap
ple
Juic
e 46
oz
Labe
l—cu
t & s
tack
O
ffset
Lith
ogra
phy
962
203
469.
8 99
.2
Juic
es—
Con
cent
rate
, Rfg
&
Fz
Min
ute
Mai
d Fr
ozen
O
rang
e Ju
ice
Con
cent
rate
12 o
z Sp
iral
wou
nd
cont
aine
r R
otog
ravu
re
469
283
531.
2 32
0.6
Juic
es—
Rfg
Tr
opic
ana
Ora
nge
Juic
e 2
qt
Gab
le to
p ca
rton
O
ffset
Lith
ogra
phy
3,30
3 82
5 1,
409.
6 35
2.2
Milk
—C
onde
nsed
C
arna
tion
Evap
orat
ed
Milk
12
oz
Labe
l—cu
t & s
tack
O
ffset
Lith
ogra
phy
91
78
200.
2 17
2.4
Milk
—Fl
avor
ed/S
ubst
itute
s N
estle
Nes
quik
C
hoco
late
Milk
32
oz
Labe
l—sh
rink
wra
p R
otog
ravu
re
2,23
9 63
3 31
2.9
88.4
(con
tinue
d)
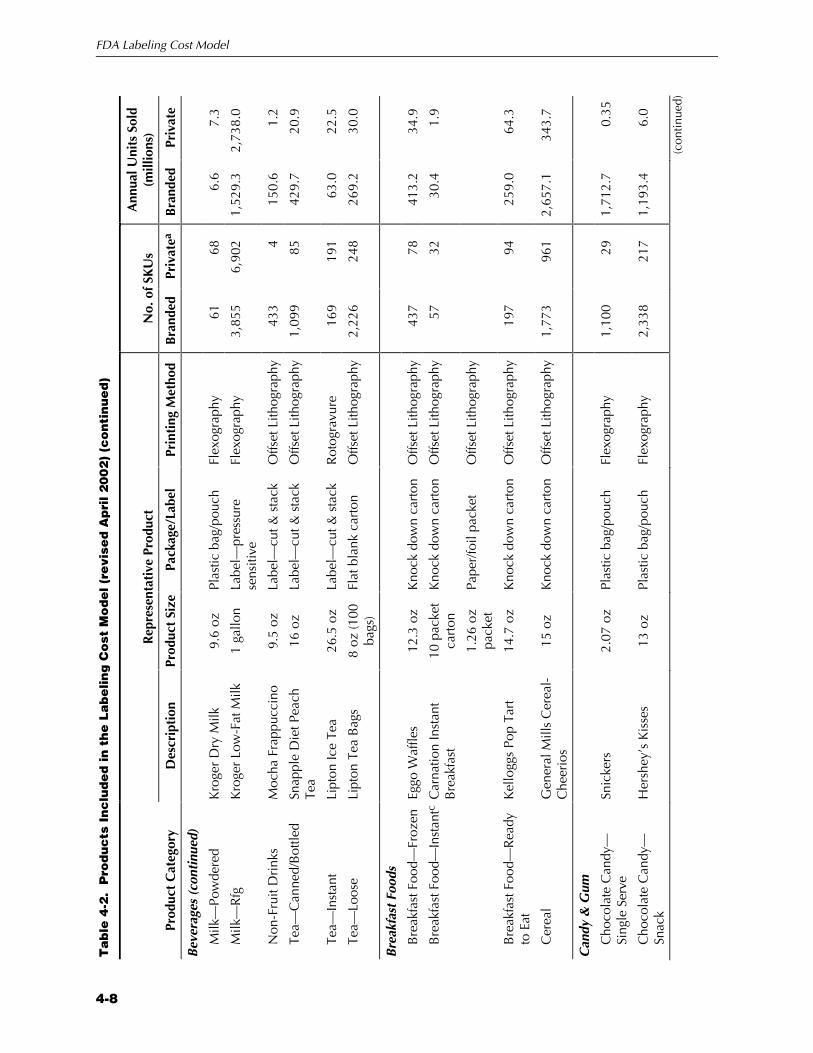
FDA Labeling Cost Model
4-8
Ta
ble
4-2
. P
rod
uc
ts I
nc
lud
ed
in
th
e L
ab
elin
g C
ost
Mo
de
l (r
evi
sed
Ap
ril 2
00
2)
(co
nti
nu
ed
)
R
epre
sent
ativ
e Pr
oduc
t N
o. o
f SK
Us
Ann
ual U
nits
Sol
d (m
illio
ns)
Prod
uct
Cat
egor
y D
escr
ipti
on
Prod
uct
Size
Pa
ckag
e/La
bel
Prin
ting
Met
hod
Bra
nded
Pr
ivat
ea
Bra
nded
Pr
ivat
e
Bev
erag
es (
cont
inue
d)
Milk
—Po
wde
red
Kro
ger
Dry
Milk
9.
6 oz
Pl
astic
bag
/pou
ch
Flex
ogra
phy
61
68
6.6
7.3
Milk
—R
fg
Kro
ger
Low
-Fat
Milk
1
gallo
n La
bel—
pres
sure
se
nsiti
ve
Flex
ogra
phy
3,85
5 6,
902
1,52
9.3
2,73
8.0
Non
-Fru
it D
rink
s M
ocha
Fra
ppuc
cino
9.
5 oz
La
bel—
cut &
sta
ck
Offs
et L
ithog
raph
y 43
3 4
150.
6 1.
2
Tea—
Can
ned/
Bot
tled
Snap
ple
Die
t Pea
ch
Tea
16 o
z La
bel—
cut &
sta
ck
Offs
et L
ithog
raph
y 1,
099
85
429.
7 20
.9
Tea—
Inst
ant
Lipt
on Ic
e Te
a 26
.5 o
z La
bel—
cut &
sta
ck
Rot
ogra
vure
16
9 19
1 63
.0
22.5
Tea—
Loos
e Li
pton
Tea
Bag
s 8
oz (1
00
bags
) Fl
at b
lank
car
ton
Offs
et L
ithog
raph
y 2,
226
248
269.
2 30
.0
Bre
akfa
st F
oods
Bre
akfa
st F
ood—
Froz
en
Eggo
Waf
fles
12.3
oz
Kno
ck d
own
cart
on
Offs
et L
ithog
raph
y 43
7 78
41
3.2
34.9
Bre
akfa
st F
ood—
Inst
antc
Car
natio
n In
stan
t B
reak
fast
10
pac
ket
cart
on
Kno
ck d
own
cart
on
Offs
et L
ithog
raph
y 57
32
30
.4
1.9
1.26
oz
pack
et
Pape
r/fo
il pa
cket
O
ffset
Lith
ogra
phy
Bre
akfa
st F
ood—
Rea
dy
to E
at
Kel
logg
s Po
p Ta
rt
14.7
oz
Kno
ck d
own
cart
on
Offs
et L
ithog
raph
y 19
7 94
25
9.0
64.3
Cer
eal
Gen
eral
Mill
s C
erea
l-C
heer
ios
15 o
z K
nock
dow
n ca
rton
O
ffset
Lith
ogra
phy
1,77
3 96
1 2,
657.
1 34
3.7
Can
dy &
Gum
Cho
cola
te C
andy
—Si
ngle
Ser
ve
Snic
kers
2.
07 o
z Pl
astic
bag
/pou
ch
Flex
ogra
phy
1,10
0 29
1,
712.
7 0.
35
Cho
cola
te C
andy
—Sn
ack
Her
shey
’s K
isse
s 13
oz
Plas
tic b
ag/p
ouch
Fl
exog
raph
y 2,
338
217
1,19
3.4
6.0
(con
tinue
d)
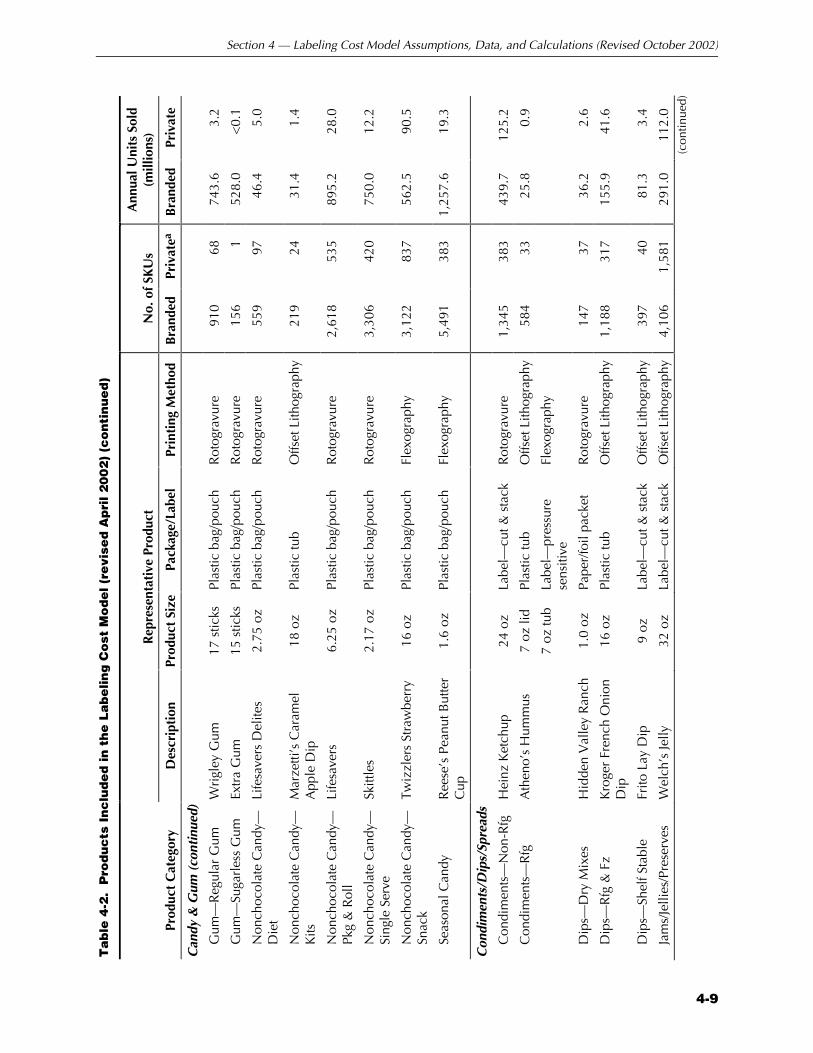
Section 4 — Labeling Cost Model Assumptions, Data, and Calculations (Revised October 2002)
4-9
Ta
ble
4-2
. P
rod
uc
ts I
nc
lud
ed
in
th
e L
ab
elin
g C
ost
Mo
de
l (r
evi
sed
Ap
ril 2
00
2)
(co
nti
nu
ed
)
R
epre
sent
ativ
e Pr
oduc
t N
o. o
f SK
Us
Ann
ual U
nits
Sol
d (m
illio
ns)
Prod
uct
Cat
egor
y D
escr
ipti
on
Prod
uct
Size
Pa
ckag
e/La
bel
Prin
ting
Met
hod
Bra
nded
Pr
ivat
ea
Bra
nded
Pr
ivat
e
Can
dy &
Gum
(co
ntin
ued)
Gum
—R
egul
ar G
um
Wri
gley
Gum
17
stic
ks
Plas
tic b
ag/p
ouch
R
otog
ravu
re
910
68
743.
6 3.
2
Gum
—Su
garl
ess
Gum
Ex
tra
Gum
15
stic
ks
Plas
tic b
ag/p
ouch
R
otog
ravu
re
156
1 52
8.0
<0.
1
Non
choc
olat
e C
andy
—D
iet
Life
save
rs D
elite
s 2.
75 o
z Pl
astic
bag
/pou
ch
Rot
ogra
vure
55
9 97
46
.4
5.0
Non
choc
olat
e C
andy
—K
its
Mar
zetti
’s C
aram
el
App
le D
ip
18 o
z Pl
astic
tub
Offs
et L
ithog
raph
y 21
9 24
31
.4
1.4
Non
choc
olat
e C
andy
—Pk
g &
Rol
l Li
fesa
vers
6.
25 o
z Pl
astic
bag
/pou
ch
Rot
ogra
vure
2,
618
535
895.
2 28
.0
Non
choc
olat
e C
andy
—Si
ngle
Ser
ve
Skitt
les
2.17
oz
Plas
tic b
ag/p
ouch
R
otog
ravu
re
3,30
6 42
0 75
0.0
12.2
Non
choc
olat
e C
andy
—Sn
ack
Twiz
zler
s St
raw
berr
y 16
oz
Plas
tic b
ag/p
ouch
Fl
exog
raph
y 3,
122
837
562.
5 90
.5
Seas
onal
Can
dy
Ree
se’s
Pea
nut B
utte
r C
up
1.6
oz
Plas
tic b
ag/p
ouch
Fl
exog
raph
y 5,
491
383
1,25
7.6
19.3
Con
dim
ents
/Dip
s/Sp
read
s
Con
dim
ents
—N
on-R
fg
Hei
nz K
etch
up
24 o
z La
bel—
cut &
sta
ck
Rot
ogra
vure
1,
345
383
439.
7 12
5.2
Con
dim
ents
—R
fg
Ath
eno’
s H
umm
us
7 oz
lid
Plas
tic tu
b O
ffset
Lith
ogra
phy
584
33
25.8
0.
9
7 oz
tub
Labe
l—pr
essu
re
sens
itive
Fl
exog
raph
y
Dip
s—D
ry M
ixes
H
idde
n V
alle
y R
anch
1.
0 oz
Pa
per/
foil
pack
et
Rot
ogra
vure
14
7 37
36
.2
2.6
Dip
s—R
fg &
Fz
Kro
ger
Fren
ch O
nion
D
ip
16 o
z Pl
astic
tub
Offs
et L
ithog
raph
y 1,
188
317
155.
9 41
.6
Dip
s—Sh
elf S
tabl
e Fr
ito L
ay D
ip
9 oz
La
bel—
cut &
sta
ck
Offs
et L
ithog
raph
y 39
7 40
81
.3
3.4
Jam
s/Je
llies
/Pre
serv
es
Wel
ch’s
Jelly
32
oz
Labe
l—cu
t & s
tack
O
ffset
Lith
ogra
phy
4,10
6 1,
581
291.
0 11
2.0
(con
tinue
d)
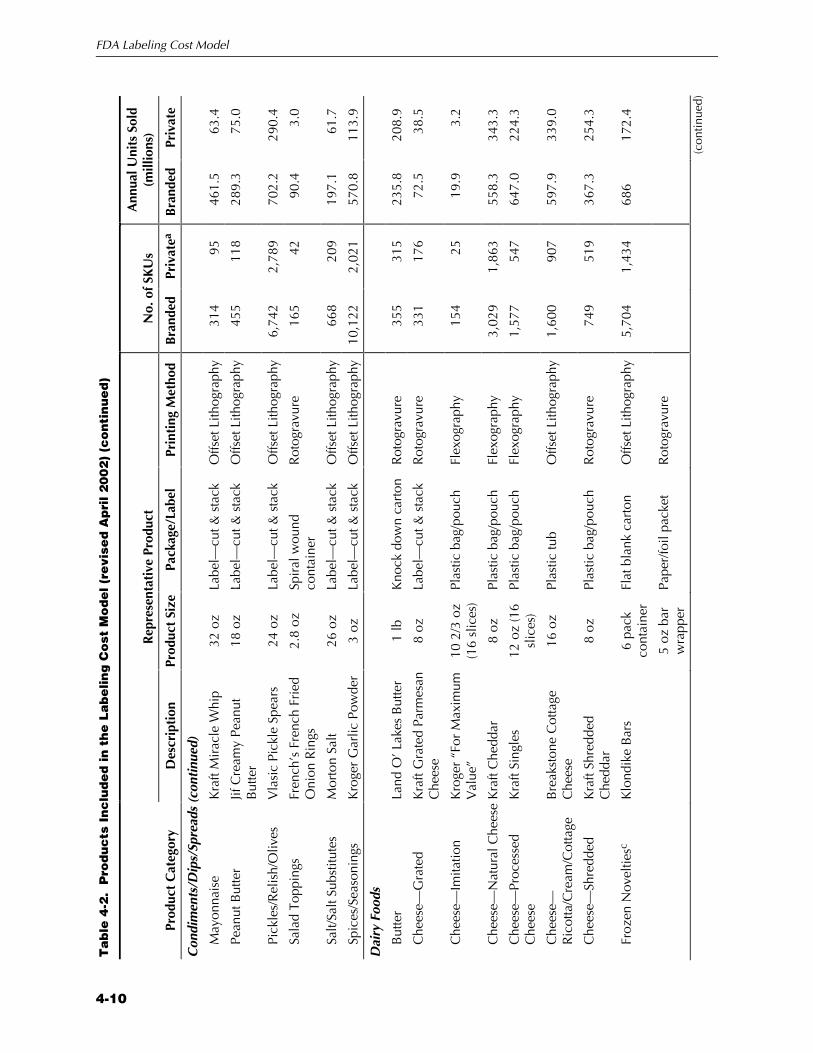
FDA Labeling Cost Model
4-10
Ta
ble
4-2
. P
rod
uc
ts I
nc
lud
ed
in
th
e L
ab
elin
g C
ost
Mo
de
l (r
evi
sed
Ap
ril 2
00
2)
(co
nti
nu
ed
)
R
epre
sent
ativ
e Pr
oduc
t N
o. o
f SK
Us
Ann
ual U
nits
Sol
d (m
illio
ns)
Prod
uct
Cat
egor
y D
escr
ipti
on
Prod
uct
Size
Pa
ckag
e/La
bel
Prin
ting
Met
hod
Bra
nded
Pr
ivat
ea
Bra
nded
Pr
ivat
e
Con
dim
ents
/Dip
s/Sp
read
s (c
onti
nued
)
May
onna
ise
Kra
ft M
irac
le W
hip
32 o
z La
bel—
cut &
sta
ck
Offs
et L
ithog
raph
y 31
4 95
46
1.5
63.4
Pean
ut B
utte
r Jif
Cre
amy
Pean
ut
But
ter
18 o
z La
bel—
cut &
sta
ck
Offs
et L
ithog
raph
y 45
5 11
8 28
9.3
75.0
Pick
les/
Rel
ish/
Oliv
es
Vla
sic
Pick
le S
pear
s 24
oz
Labe
l—cu
t & s
tack
O
ffset
Lith
ogra
phy
6,74
2 2,
789
702.
2 29
0.4
Sala
d To
ppin
gs
Fren
ch’s
Fre
nch
Frie
d O
nion
Rin
gs
2.8
oz
Spir
al w
ound
co
ntai
ner
Rot
ogra
vure
16
5 42
90
.4
3.0
Salt/
Salt
Subs
titut
es
Mor
ton
Salt
26 o
z La
bel—
cut &
sta
ck
Offs
et L
ithog
raph
y 66
8 20
9 19
7.1
61.7
Spic
es/S
easo
ning
s K
roge
r G
arlic
Pow
der
3 oz
La
bel—
cut &
sta
ck
Offs
et L
ithog
raph
y 10
,122
2,
021
570.
8 11
3.9
Dai
ry F
oods
But
ter
Land
O’ L
akes
But
ter
1 lb
K
nock
dow
n ca
rton
R
otog
ravu
re
355
315
235.
8 20
8.9
Che
ese—
Gra
ted
K
raft
Gra
ted
Parm
esan
C
hees
e 8
oz
Labe
l—cu
t & s
tack
R
otog
ravu
re
331
176
72.5
38
.5
Che
ese—
Imita
tion
Kro
ger
“For
Max
imum
V
alue
” 10
2/3
oz
(16
slic
es)
Plas
tic b
ag/p
ouch
Fl
exog
raph
y 15
4 25
19
.9
3.2
Che
ese—
Nat
ural
Che
ese
Kra
ft C
hedd
ar
8 oz
Pl
astic
bag
/pou
ch
Flex
ogra
phy
3,02
9 1,
863
558.
3 34
3.3
Che
ese—
Proc
esse
d C
hees
e K
raft
Sing
les
12 o
z (1
6 sl
ices
) Pl
astic
bag
/pou
ch
Flex
ogra
phy
1,57
7 54
7 64
7.0
224.
3
Che
ese—
Ric
otta
/Cre
am/C
otta
ge
Bre
akst
one
Cot
tage
C
hees
e 16
oz
Plas
tic tu
b O
ffset
Lith
ogra
phy
1,60
0 90
7 59
7.9
339.
0
Che
ese—
Shre
dded
K
raft
Shre
dded
C
hedd
ar
8 oz
Pl
astic
bag
/pou
ch
Rot
ogra
vure
74
9 51
9 36
7.3
254.
3
Froz
en N
ovel
tiesc
K
lond
ike
Bar
s 6
pack
co
ntai
ner
Flat
bla
nk c
arto
n O
ffset
Lith
ogra
phy
5,70
4 1,
434
686
172.
4
5 oz
bar
w
rapp
er
Pape
r/fo
il pa
cket
R
otog
ravu
re
(con
tinue
d)
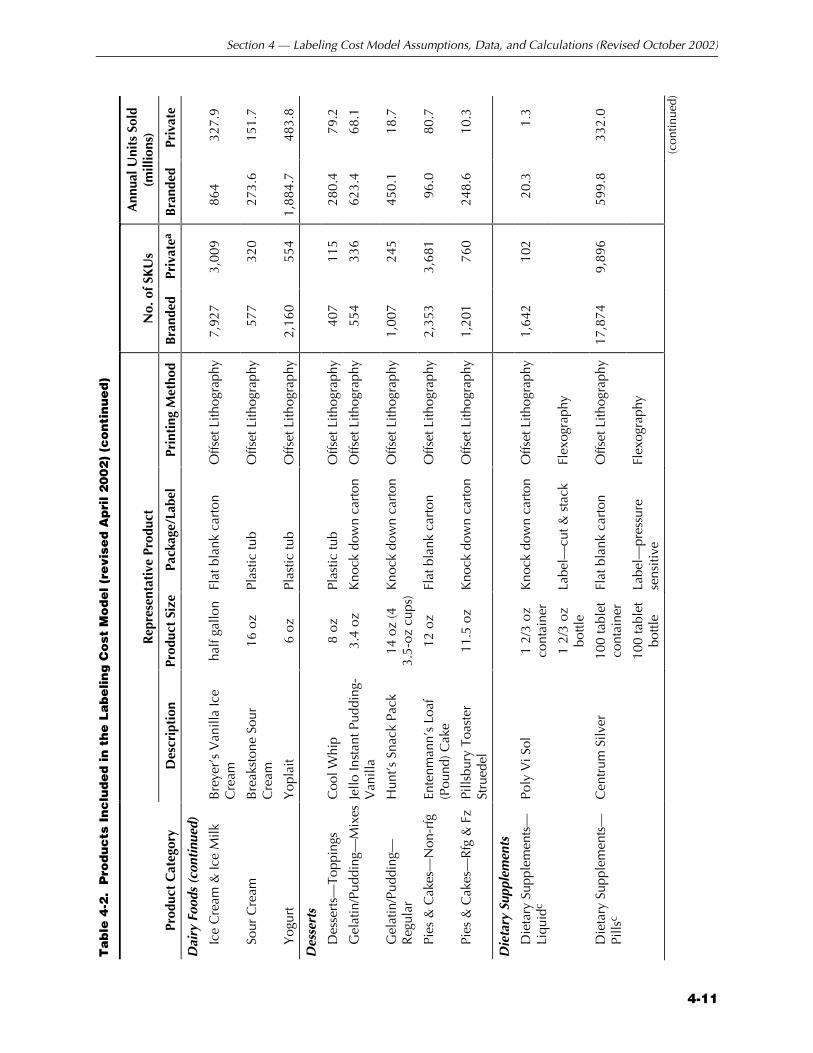
Section 4 — Labeling Cost Model Assumptions, Data, and Calculations (Revised October 2002)
4-11
Ta
ble
4-2
. P
rod
uc
ts I
nc
lud
ed
in
th
e L
ab
elin
g C
ost
Mo
de
l (r
evi
sed
Ap
ril 2
00
2)
(co
nti
nu
ed
)
R
epre
sent
ativ
e Pr
oduc
t N
o. o
f SK
Us
Ann
ual U
nits
Sol
d (m
illio
ns)
Prod
uct
Cat
egor
y D
escr
ipti
on
Prod
uct
Size
Pa
ckag
e/La
bel
Prin
ting
Met
hod
Bra
nded
Pr
ivat
ea
Bra
nded
Pr
ivat
e
Dai
ry F
oods
(co
ntin
ued)
Ice
Cre
am &
Ice
Milk
B
reye
r’s
Van
illa
Ice
Cre
am
half
gallo
n Fl
at b
lank
car
ton
Offs
et L
ithog
raph
y 7,
927
3,00
9 86
4 32
7.9
Sour
Cre
am
Bre
akst
one
Sour
C
ream
16
oz
Plas
tic tu
b O
ffset
Lith
ogra
phy
577
320
273.
6 15
1.7
Yog
urt
Yop
lait
6 oz
Pl
astic
tub
Offs
et L
ithog
raph
y 2,
160
554
1,88
4.7
483.
8
Des
sert
s
Des
sert
s—To
ppin
gs
Coo
l Whi
p 8
oz
Plas
tic tu
b O
ffset
Lith
ogra
phy
407
115
280.
4 79
.2
Gel
atin
/Pud
ding
—M
ixes
Jel
lo In
stan
t Pud
ding
-V
anill
a 3.
4 oz
K
nock
dow
n ca
rton
O
ffset
Lith
ogra
phy
554
336
623.
4 68
.1
Gel
atin
/Pud
ding
—R
egul
ar
Hun
t’s S
nack
Pac
k 14
oz
(4
3.5-
oz c
ups)
Kno
ck d
own
cart
on
Offs
et L
ithog
raph
y 1,
007
245
450.
1 18
.7
Pies
& C
akes
—N
on-r
fg
Ente
nman
n’s
Loaf
(P
ound
) Cak
e 12
oz
Flat
bla
nk c
arto
n O
ffset
Lith
ogra
phy
2,35
3 3,
681
96.0
80
.7
Pies
& C
akes
—R
fg &
Fz
Pills
bury
Toa
ster
St
rued
el
11.5
oz
Kno
ck d
own
cart
on
Offs
et L
ithog
raph
y 1,
201
760
248.
6 10
.3
Die
tary
Sup
plem
ents
Die
tary
Sup
plem
ents
—Li
quid
c Po
ly V
i Sol
1
2/3
oz
cont
aine
r K
nock
dow
n ca
rton
O
ffset
Lith
ogra
phy
1,64
2 10
2 20
.3
1.3
1 2/
3 oz
bo
ttle
Labe
l—cu
t & s
tack
Fl
exog
raph
y
Die
tary
Sup
plem
ents
—Pi
llsc
Cen
trum
Silv
er
100
tabl
et
cont
aine
r Fl
at b
lank
car
ton
Offs
et L
ithog
raph
y 17
,874
9,
896
599.
8 33
2.0
100
tabl
et
bottl
e La
bel—
pres
sure
se
nsiti
ve
Flex
ogra
phy
(con
tinue
d)

FDA Labeling Cost Model
4-12
Ta
ble
4-2
. P
rod
uc
ts I
nc
lud
ed
in
th
e L
ab
elin
g C
ost
Mo
de
l (r
evi
sed
Ap
ril 2
00
2)
(co
nti
nu
ed
)
R
epre
sent
ativ
e Pr
oduc
t N
o. o
f SK
Us
Ann
ual U
nits
Sol
d (m
illio
ns)
Prod
uct
Cat
egor
y D
escr
ipti
on
Prod
uct
Size
Pa
ckag
e/La
bel
Prin
ting
Met
hod
Bra
nded
Pr
ivat
ea
Bra
nded
Pr
ivat
e
Dre
ssin
gs &
Sau
ces
Gra
vy/S
auce
—C
anne
d/B
ottle
d K
raft
BB
Q S
auce
18
oz
Labe
l—cu
t & s
tack
O
ffset
Lith
ogra
phy
7,34
4 67
3 1,
312.
6 12
0.3
Gra
vy/S
auce
—M
ixes
Ta
co B
ell T
aco
Seas
onin
g 1.
25 o
z Pa
per/
foil
pack
et
Rot
ogra
vure
1,
666
357
565.
6 12
1.1
Gra
vy/S
auce
—R
fg &
Fz
DiG
iorn
o M
arin
ara
Sauc
e 15
oz
Labe
l—pr
essu
re
sens
itive
O
ffset
Lith
ogra
phy
865
106
40.0
4.
2
Sala
d D
ress
ing—
Bot
tled,
no
n-rf
g K
raft
Ran
ch D
ress
ing
16 o
z La
bel—
pres
sure
se
nsiti
ve
Offs
et L
ithog
raph
y 2,
206
372
624.
7 52
.0
Sala
d D
ress
ing—
Dry
M
ix
Hid
den
Val
ley
Ran
ch
.4 o
z Pa
per/
foil
pack
et
Rot
ogra
vure
87
15
58
.6
1.2
Sala
d D
ress
ing—
Rfg
M
arie
’s B
lue
Che
ese
Dre
ssin
g 12
oz
Labe
l—pr
essu
re
sens
itive
O
ffset
Lith
ogra
phy
504
50
57.6
1.
4
Vin
egar
K
roge
r W
hite
Vin
egar
32
oz
Labe
l—cu
t & s
tack
O
ffset
Lith
ogra
phy
1,13
4 97
5 78
.4
67.4
Eggs
Proc
esse
d Eg
gs
Egg
Bea
ters
16
oz
Gab
le to
p ca
rton
Fl
exog
raph
y 42
8
51.1
8.
1
Shel
l Egg
s Pr
ivat
e La
bel E
ggs
1 do
zen
Egg
cart
on
Flex
ogra
phy
1,29
4 4,
431
391.
8 1,
341.
7
Entr
ees
Entr
ées—
Fz
Ban
quet
Sal
sbur
y St
eak
Din
ner
9.5
oz
Kno
ck d
own
cart
on
Offs
et L
ithog
raph
y 3,
949
596
2,68
6.0
63.1
Entr
ées—
Rfg
Ll
oyds
BB
Q P
ork
24 o
z Fl
at b
lank
car
ton
Offs
et L
ithog
raph
y 1,
361
680
154.
7 39
.2
Entr
ées—
Shel
f Sta
ble
Spag
ettiO
s 15
oz
Labe
l—cu
t & s
tack
O
ffset
Lith
ogra
phy
1,05
1 29
0 1,
030.
8 10
8.5
Lunc
hes—
Rfg
O
scar
May
er
Lunc
habl
es
4.6
oz
Kno
ck d
own
cart
on
Offs
et L
ithog
raph
y 14
7 90
32
5.0
16.9
Pizz
a—Pi
zza/
Kits
/Mix
es,
Rfg
& F
z To
tino’
s Pa
rty
Pizz
a 10
.2 o
z K
nock
dow
n ca
rton
O
ffset
Lith
ogra
phy
1,55
5 59
1 81
9.8
67.8
(con
tinue
d)
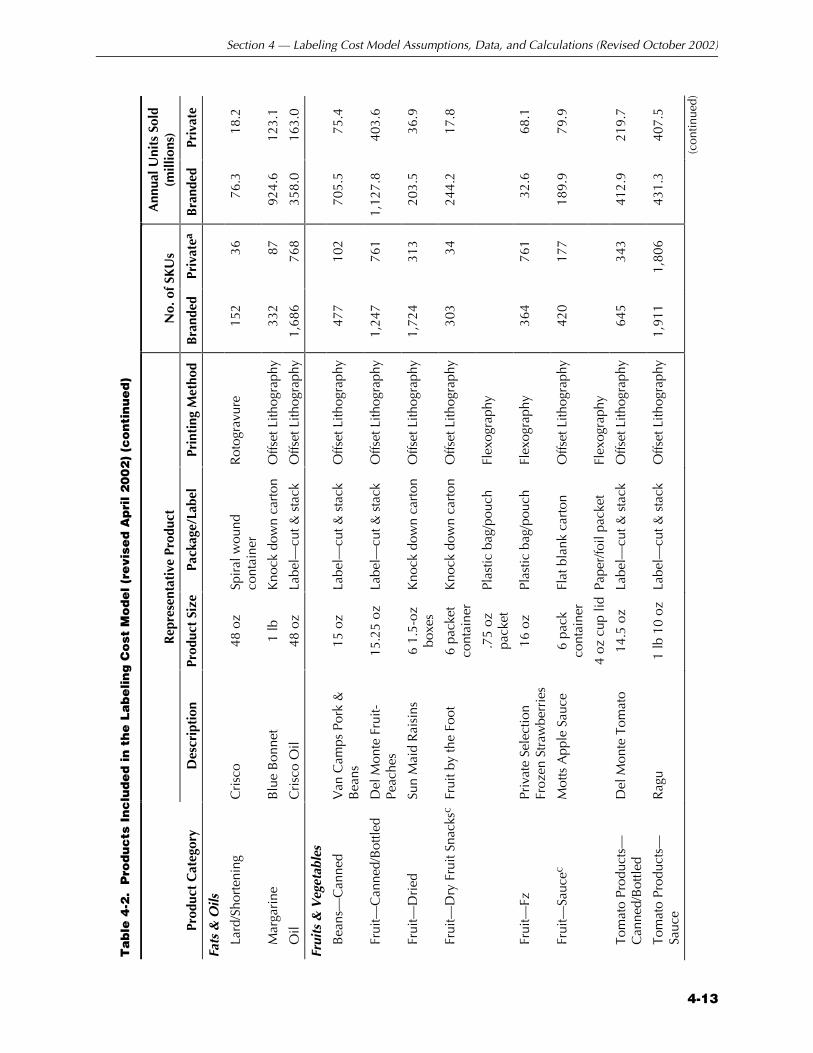
Section 4 — Labeling Cost Model Assumptions, Data, and Calculations (Revised October 2002)
4-13
Ta
ble
4-2
. P
rod
uc
ts I
nc
lud
ed
in
th
e L
ab
elin
g C
ost
Mo
de
l (r
evi
sed
Ap
ril 2
00
2)
(co
nti
nu
ed
)
R
epre
sent
ativ
e Pr
oduc
t N
o. o
f SK
Us
Ann
ual U
nits
Sol
d (m
illio
ns)
Prod
uct
Cat
egor
y D
escr
ipti
on
Prod
uct
Size
Pa
ckag
e/La
bel
Prin
ting
Met
hod
Bra
nded
Pr
ivat
ea
Bra
nded
Pr
ivat
e
Fats
& O
ils
Lard
/Sho
rten
ing
Cri
sco
48 o
z Sp
iral
wou
nd
cont
aine
r R
otog
ravu
re
152
36
76.3
18
.2
Mar
gari
ne
Blu
e B
onne
t 1
lb
Kno
ck d
own
cart
on
Offs
et L
ithog
raph
y 33
2 87
92
4.6
123.
1
Oil
Cri
sco
Oil
48 o
z
Labe
l—cu
t & s
tack
O
ffset
Lith
ogra
phy
1,68
6 76
8 35
8.0
163.
0
Frui
ts &
Veg
etab
les
Bea
ns—
Can
ned
Van
Cam
ps P
ork
&
Bea
ns
15 o
z La
bel—
cut &
sta
ck
Offs
et L
ithog
raph
y 47
7 10
2 70
5.5
75.4
Frui
t—C
anne
d/B
ottle
d D
el M
onte
Fru
it-Pe
ache
s 15
.25
oz
Labe
l—cu
t & s
tack
O
ffset
Lith
ogra
phy
1,24
7 76
1 1,
127.
8 40
3.6
Frui
t—D
ried
Su
n M
aid
Rai
sins
6
1.5-
oz
boxe
s K
nock
dow
n ca
rton
O
ffset
Lith
ogra
phy
1,72
4 31
3 20
3.5
36.9
Frui
t—D
ry F
ruit
Snac
ksc
Frui
t by
the
Foot
6
pack
et
cont
aine
r K
nock
dow
n ca
rton
O
ffset
Lith
ogra
phy
303
34
244.
2 17
.8
.75
oz
pack
et
Plas
tic b
ag/p
ouch
Fl
exog
raph
y
Frui
t—Fz
Pr
ivat
e Se
lect
ion
Froz
en S
traw
berr
ies
16 o
z Pl
astic
bag
/pou
ch
Flex
ogra
phy
364
761
32.6
68
.1
Frui
t—Sa
ucec
M
otts
App
le S
auce
6
pack
co
ntai
ner
Flat
bla
nk c
arto
n O
ffset
Lith
ogra
phy
420
177
189.
9 79
.9
4 oz
cup
lid
Pape
r/fo
il pa
cket
Fl
exog
raph
y
Tom
ato
Prod
ucts
—C
anne
d/B
ottle
d D
el M
onte
Tom
ato
14.5
oz
Labe
l—cu
t & s
tack
O
ffset
Lith
ogra
phy
645
343
412.
9 21
9.7
Tom
ato
Prod
ucts
—Sa
uce
Rag
u 1
lb 1
0 oz
La
bel—
cut &
sta
ck
Offs
et L
ithog
raph
y 1,
911
1,80
6 43
1.3
407.
5
(con
tinue
d)
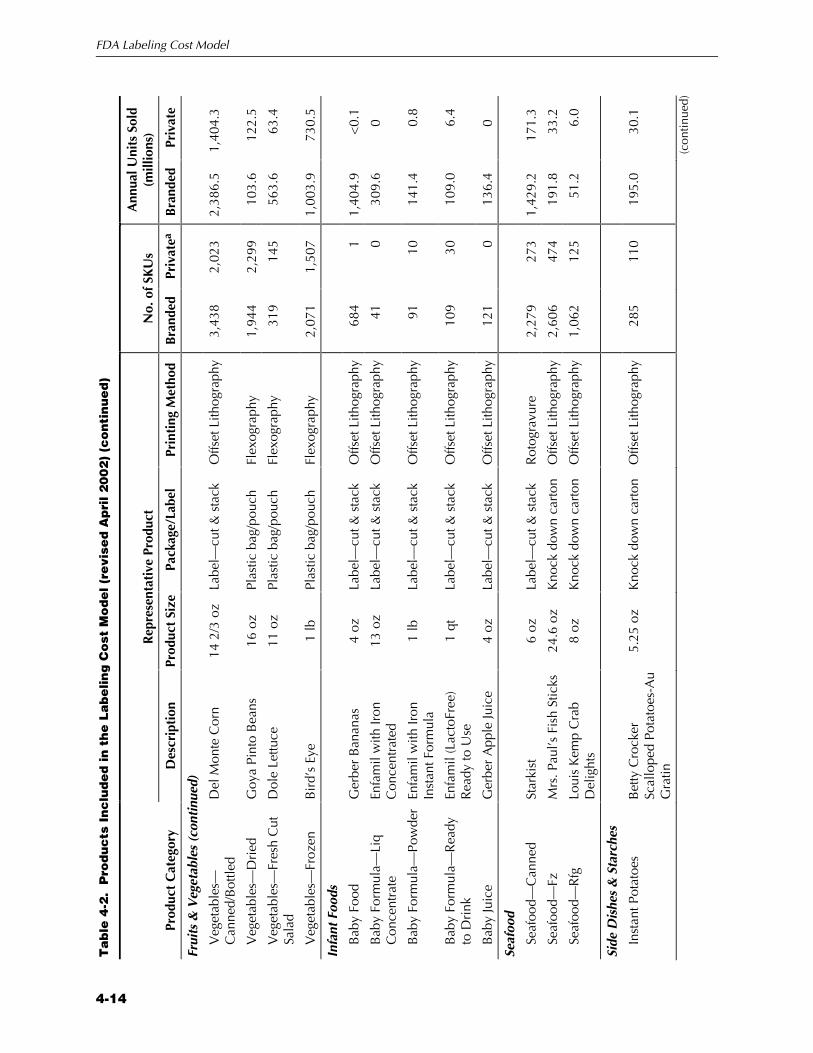
FDA Labeling Cost Model
4-14
Ta
ble
4-2
. P
rod
uc
ts I
nc
lud
ed
in
th
e L
ab
elin
g C
ost
Mo
de
l (r
evi
sed
Ap
ril 2
00
2)
(co
nti
nu
ed
)
R
epre
sent
ativ
e Pr
oduc
t N
o. o
f SK
Us
Ann
ual U
nits
Sol
d (m
illio
ns)
Prod
uct
Cat
egor
y D
escr
ipti
on
Prod
uct
Size
Pa
ckag
e/La
bel
Prin
ting
Met
hod
Bra
nded
Pr
ivat
ea
Bra
nded
Pr
ivat
e
Frui
ts &
Veg
etab
les
(con
tinu
ed)
Veg
etab
les—
Can
ned/
Bot
tled
Del
Mon
te C
orn
14 2
/3 o
z La
bel—
cut &
sta
ck
Offs
et L
ithog
raph
y 3,
438
2,02
3 2,
386.
5 1,
404.
3
Veg
etab
les—
Dri
ed
Goy
a Pi
nto
Bea
ns
16 o
z Pl
astic
bag
/pou
ch
Flex
ogra
phy
1,94
4 2,
299
103.
6 12
2.5
Veg
etab
les—
Fres
h C
ut
Sala
d D
ole
Lettu
ce
11 o
z Pl
astic
bag
/pou
ch
Flex
ogra
phy
319
145
563.
6 63
.4
Veg
etab
les—
Froz
en
Bir
d’s
Eye
1
lb
Plas
tic b
ag/p
ouch
Fl
exog
raph
y 2,
071
1,50
7 1,
003.
9 73
0.5
Infa
nt F
oods
Bab
y Fo
od
Ger
ber
Ban
anas
4
oz
Labe
l—cu
t & s
tack
O
ffset
Lith
ogra
phy
684
1 1,
404.
9 <
0.1
Bab
y Fo
rmul
a—Li
q C
once
ntra
te
Enfa
mil
with
Iron
C
once
ntra
ted
13 o
z La
bel—
cut &
sta
ck
Offs
et L
ithog
raph
y 41
0
309.
6 0
Bab
y Fo
rmul
a—Po
wde
r En
fam
il w
ith Ir
on
Inst
ant F
orm
ula
1 lb
La
bel—
cut &
sta
ck
Offs
et L
ithog
raph
y 91
10
14
1.4
0.8
Bab
y Fo
rmul
a—R
eady
to
Dri
nk
Enfa
mil
(Lac
toFr
ee)
Rea
dy to
Use
1
qt
Labe
l—cu
t & s
tack
O
ffset
Lith
ogra
phy
109
30
109.
0 6.
4
Bab
y Ju
ice
Ger
ber
App
le Ju
ice
4 oz
La
bel—
cut &
sta
ck
Offs
et L
ithog
raph
y 12
1 0
136.
4 0
Seaf
ood
Seaf
ood—
Can
ned
Star
kist
6
oz
Labe
l—cu
t & s
tack
R
otog
ravu
re
2,27
9 27
3 1,
429.
2 17
1.3
Seaf
ood—
Fz
Mrs
. Pau
l’s F
ish
Stic
ks
24.6
oz
Kno
ck d
own
cart
on
Offs
et L
ithog
raph
y 2,
606
474
191.
8 33
.2
Seaf
ood—
Rfg
Lo
uis
Kem
p C
rab
Del
ight
s 8
oz
Kno
ck d
own
cart
on
Offs
et L
ithog
raph
y 1,
062
125
51.2
6.
0
Side
Dis
hes
& S
tarc
hes
Inst
ant P
otat
oes
Bet
ty C
rock
er
Scal
lope
d Po
tato
es-A
u G
ratin
5.25
oz
Kno
ck d
own
cart
on
Offs
et L
ithog
raph
y 28
5 11
0 19
5.0
30.1
(con
tinue
d)
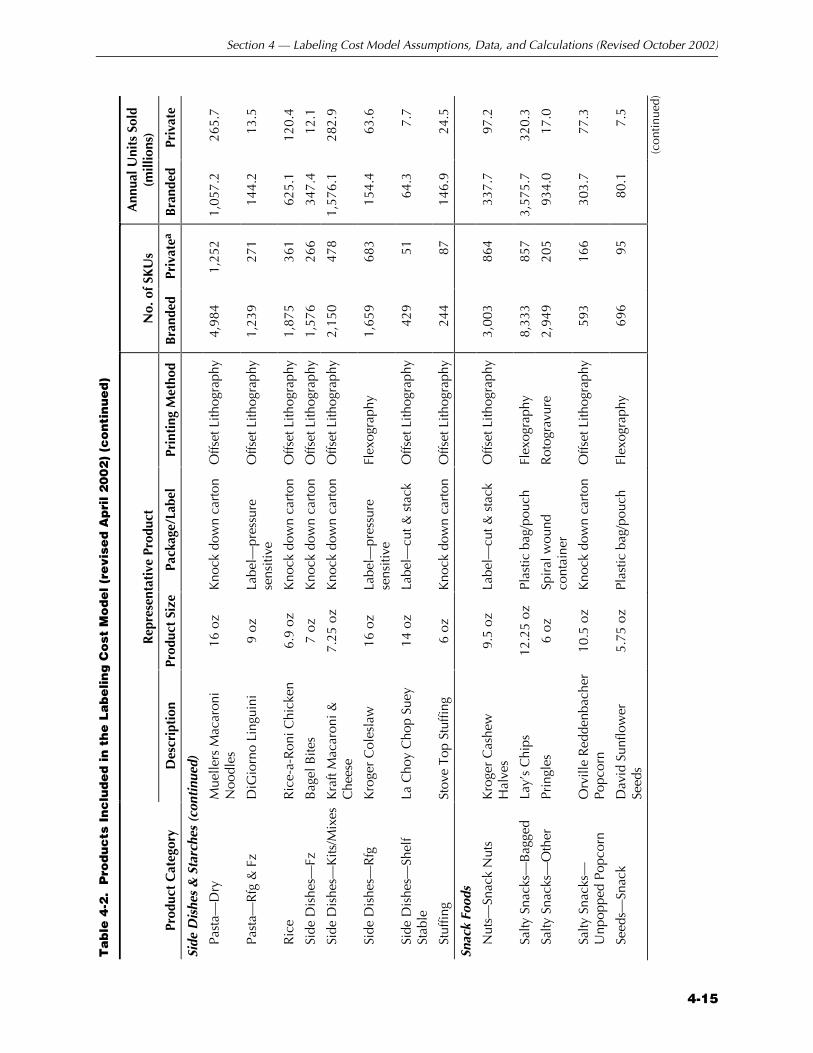
Section 4 — Labeling Cost Model Assumptions, Data, and Calculations (Revised October 2002)
4-15
Ta
ble
4-2
. P
rod
uc
ts I
nc
lud
ed
in
th
e L
ab
elin
g C
ost
Mo
de
l (r
evi
sed
Ap
ril 2
00
2)
(co
nti
nu
ed
)
R
epre
sent
ativ
e Pr
oduc
t N
o. o
f SK
Us
Ann
ual U
nits
Sol
d (m
illio
ns)
Prod
uct
Cat
egor
y D
escr
ipti
on
Prod
uct
Size
Pa
ckag
e/La
bel
Prin
ting
Met
hod
Bra
nded
Pr
ivat
ea
Bra
nded
Pr
ivat
e
Side
Dis
hes
& S
tarc
hes
(con
tinu
ed)
Past
a—D
ry
Mue
llers
Mac
aron
i N
oodl
es
16 o
z K
nock
dow
n ca
rton
O
ffset
Lith
ogra
phy
4,98
4 1,
252
1,05
7.2
265.
7
Past
a—R
fg &
Fz
DiG
iorn
o Li
ngui
ni
9 oz
La
bel—
pres
sure
se
nsiti
ve
Offs
et L
ithog
raph
y 1,
239
271
144.
2 13
.5
Ric
e R
ice-
a-R
oni C
hick
en
6.9
oz
Kno
ck d
own
cart
on
Offs
et L
ithog
raph
y 1,
875
361
625.
1 12
0.4
Side
Dis
hes—
Fz
Bag
el B
ites
7 oz
K
nock
dow
n ca
rton
O
ffset
Lith
ogra
phy
1,57
6 26
6 34
7.4
12.1
Side
Dis
hes—
Kits
/Mix
es
Kra
ft M
acar
oni &
C
hees
e 7.
25 o
z K
nock
dow
n ca
rton
O
ffset
Lith
ogra
phy
2,15
0 47
8 1,
576.
1 28
2.9
Side
Dis
hes—
Rfg
K
roge
r C
oles
law
16
oz
Labe
l—pr
essu
re
sens
itive
Fl
exog
raph
y 1,
659
683
154.
4 63
.6
Side
Dis
hes—
Shel
f St
able
La
Cho
y C
hop
Suey
14
oz
La
bel—
cut &
sta
ck
Offs
et L
ithog
raph
y 42
9 51
64
.3
7.7
Stuf
fing
Stov
e To
p St
uffin
g 6
oz
Kno
ck d
own
cart
on
Offs
et L
ithog
raph
y 24
4 87
14
6.9
24.5
Snac
k Fo
ods
Nut
s—Sn
ack
Nut
s K
roge
r C
ashe
w
Hal
ves
9.5
oz
Labe
l—cu
t & s
tack
O
ffset
Lith
ogra
phy
3,00
3 86
4 33
7.7
97.2
Salty
Sna
cks—
Bag
ged
Lay’
s C
hips
12
.25
oz
Plas
tic b
ag/p
ouch
Fl
exog
raph
y 8,
333
857
3,57
5.7
320.
3
Salty
Sna
cks—
Oth
er
Prin
gles
6
oz
Spir
al w
ound
co
ntai
ner
Rot
ogra
vure
2,
949
205
934.
0 17
.0
Salty
Sna
cks—
Unp
oppe
d Po
pcor
n O
rvill
e R
edde
nbac
her
Popc
orn
10.5
oz
Kno
ck d
own
cart
on
Offs
et L
ithog
raph
y 59
3 16
6 30
3.7
77.3
Seed
s—Sn
ack
Dav
id S
unflo
wer
Se
eds
5.75
oz
Plas
tic b
ag/p
ouch
Fl
exog
raph
y 69
6 95
80
.1
7.5
(con
tinue
d)
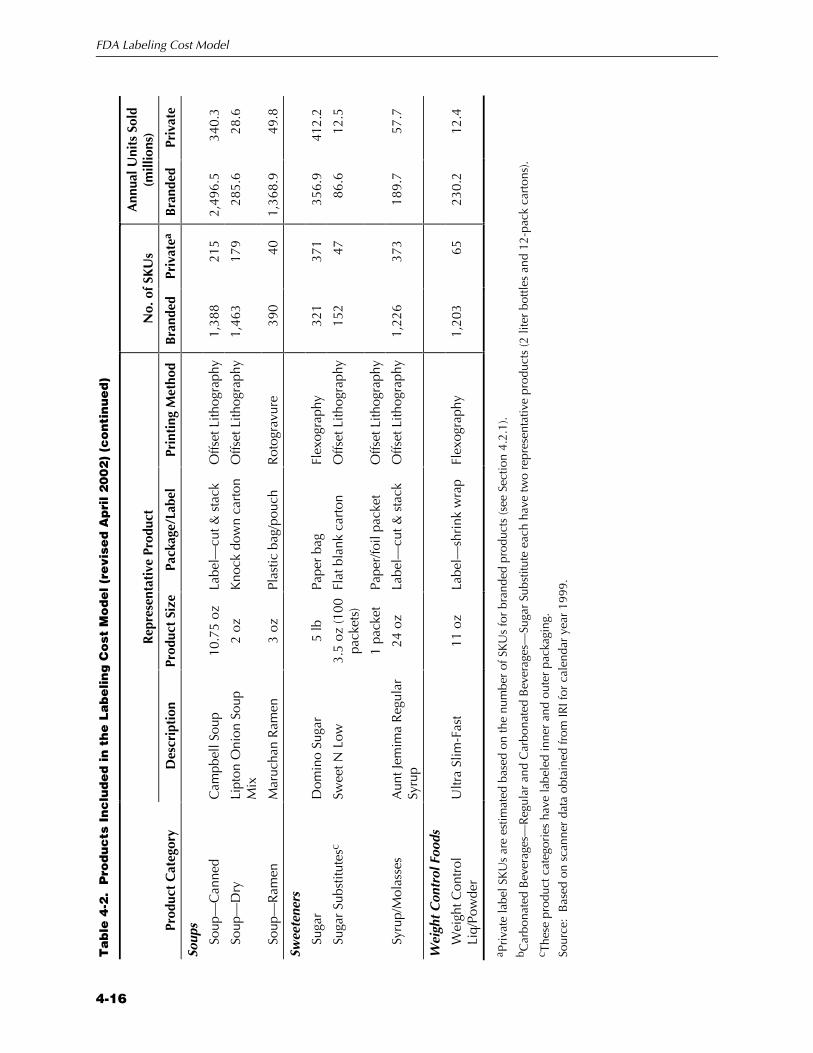
FDA Labeling Cost Model
4-16
Ta
ble
4-2
. P
rod
uc
ts I
nc
lud
ed
in
th
e L
ab
elin
g C
ost
Mo
de
l (r
evi
sed
Ap
ril 2
00
2)
(co
nti
nu
ed
)
R
epre
sent
ativ
e Pr
oduc
t N
o. o
f SK
Us
Ann
ual U
nits
Sol
d (m
illio
ns)
Prod
uct
Cat
egor
y D
escr
ipti
on
Prod
uct
Size
Pa
ckag
e/La
bel
Prin
ting
Met
hod
Bra
nded
Pr
ivat
ea
Bra
nded
Pr
ivat
e
Soup
s
Soup
—C
anne
d C
ampb
ell S
oup
10.7
5 oz
La
bel—
cut &
sta
ck
Offs
et L
ithog
raph
y 1,
388
215
2,49
6.5
340.
3
Soup
—D
ry
Lipt
on O
nion
Sou
p M
ix
2 oz
K
nock
dow
n ca
rton
O
ffset
Lith
ogra
phy
1,46
3 17
9 28
5.6
28.6
Soup
—R
amen
M
aruc
han
Ram
en
3 oz
Pl
astic
bag
/pou
ch
Rot
ogra
vure
39
0 40
1,
368.
9 49
.8
Swee
tene
rs
Suga
r D
omin
o Su
gar
5 lb
Pa
per
bag
Flex
ogra
phy
321
371
356.
9 41
2.2
Suga
r Su
bstit
utes
c Sw
eet N
Low
3.
5 oz
(100
pa
cket
s)
Flat
bla
nk c
arto
n O
ffset
Lith
ogra
phy
152
47
86.6
12
.5
1 pa
cket
Pa
per/
foil
pack
et
Offs
et L
ithog
raph
y
Syru
p/M
olas
ses
Aun
t Jem
ima
Reg
ular
Sy
rup
24 o
z La
bel—
cut &
sta
ck
Offs
et L
ithog
raph
y 1,
226
373
189.
7 57
.7
Wei
ght
Con
trol
Foo
ds
Wei
ght C
ontr
ol
Liq/
Pow
der
Ultr
a Sl
im-F
ast
11 o
z La
bel—
shri
nk w
rap
Flex
ogra
phy
1,20
3 65
23
0.2
12.4
a Pri
vate
labe
l SK
Us
are
estim
ated
bas
ed o
n th
e nu
mbe
r of
SK
Us
for
bran
ded
prod
ucts
(see
Sec
tion
4.2.
1).
b Car
bona
ted
Bev
erag
es—
Reg
ular
and
Car
bona
ted
Bev
erag
es—
Suga
r Su
bstit
ute
each
hav
e tw
o re
pres
enta
tive
prod
ucts
(2 li
ter
bottl
es a
nd 1
2-pa
ck c
arto
ns).
c T
hese
pro
duct
cat
egor
ies
have
labe
led
inne
r an
d ou
ter
pack
agin
g.
Sour
ce:
Bas
ed o
n sc
anne
r da
ta o
btai
ned
from
IRI f
or c
alen
dar
year
199
9.

Section 4 — Labeling Cost Model Assumptions, Data, and Calculations (Revised October 2002)
4-17
selected the highest volume branded product.4 We then verified the list with Dr. Aaron Brody (2001), a food industry packaging consultant. Finally, we visited a Kroger grocery store in Durham, North Carolina, and verified that the representative product did indeed have a substantial amount of shelf space (including different flavors of the product). So that we would be able to determine and verify the printing method and packaging method for each of the representative products, we purchased each of the representative products. In some cases, the package size had changed since 1999, so we purchased the closest currently available package size. Furthermore, in a handful of cases, we were not able to find the selected branded product, so we substituted a similar size Kroger private label product.
Once we purchased each of the representative products, with the assistance of Dr. Aaron Brody, we
Z identified the printing method for each package or label using a magnifying glass,
Z counted the number of colors used in the printing process,
Z recorded the type of package or label (including inner and outer packaging), and
Z obtained estimates of the range of costs for each package or label.
The printing method for each product affects the costs of prepress operations and plate or cylinder engraving (discussed in Section 4.2.3).5 The information on the number of colors provided us with an understanding of the number of colors typically used on packages and labels. The type of package or label and the cost estimates for each are used in estimating the costs of discarded inventory (discussed in Section 4.2.5).
Within each of the approximately 140 product categories, we subdivided the SKUs and calculated the annual units sold for private label and branded products. The IRI dataset includes each
4For most product types, we were able to choose what we believe to be a
representative product. However, for the Carbonated Beverage—Regular and Carbonated Beverages—Sugar Substitute categories, both 2-liter bottles and 12-pack cans are significant portions of the categories. For these categories, we created a composite representative product and based the calculations in the model on a weighted average for these two packaging methods. We determined the weights based on the unit volumes in the IRI dataset.
5We use the term engraving to mean any of the various methods for preparing a cylinder or plate for printing a specific design (as described in Section 2).
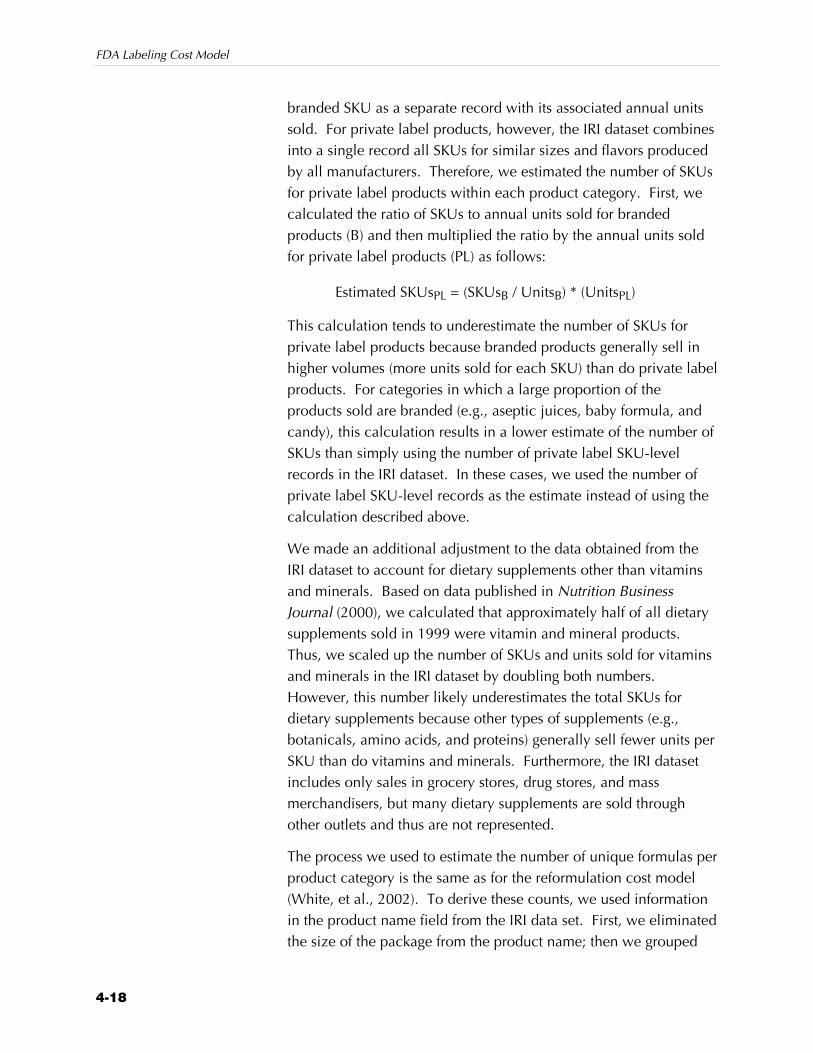
FDA Labeling Cost Model
4-18
branded SKU as a separate record with its associated annual units sold. For private label products, however, the IRI dataset combines into a single record all SKUs for similar sizes and flavors produced by all manufacturers. Therefore, we estimated the number of SKUs for private label products within each product category. First, we calculated the ratio of SKUs to annual units sold for branded products (B) and then multiplied the ratio by the annual units sold for private label products (PL) as follows:
Estimated SKUsPL = (SKUsB / UnitsB) * (UnitsPL)
This calculation tends to underestimate the number of SKUs for private label products because branded products generally sell in higher volumes (more units sold for each SKU) than do private label products. For categories in which a large proportion of the products sold are branded (e.g., aseptic juices, baby formula, and candy), this calculation results in a lower estimate of the number of SKUs than simply using the number of private label SKU-level records in the IRI dataset. In these cases, we used the number of private label SKU-level records as the estimate instead of using the calculation described above.
We made an additional adjustment to the data obtained from the IRI dataset to account for dietary supplements other than vitamins and minerals. Based on data published in Nutrition Business Journal (2000), we calculated that approximately half of all dietary supplements sold in 1999 were vitamin and mineral products. Thus, we scaled up the number of SKUs and units sold for vitamins and minerals in the IRI dataset by doubling both numbers. However, this number likely underestimates the total SKUs for dietary supplements because other types of supplements (e.g., botanicals, amino acids, and proteins) generally sell fewer units per SKU than do vitamins and minerals. Furthermore, the IRI dataset includes only sales in grocery stores, drug stores, and mass merchandisers, but many dietary supplements are sold through other outlets and thus are not represented.
The process we used to estimate the number of unique formulas per product category is the same as for the reformulation cost model (White, et al., 2002). To derive these counts, we used information in the product name field from the IRI data set. First, we eliminated the size of the package from the product name; then we grouped
Section 4 — Labeling Cost Model Assumptions, Data, and Calculations (Revised October 2002)
4-19
products with the same product name. For each product category, we counted each set of grouped products as a unique formula. Because we believe the counting process may have overstated the number of unique formulas, we adjusted the final number of formulas downward by multiplying by 0.94. We derived the adjustment factor by reviewing in detail a sample of product categories. This factor combines an adjustment for mid-year manufacturer name changes for the same branded product (approximately 1.3 percent of formulas) and for multiproduct packaging bundles (approximately 4.7 percent of formulas).
Once we derived a final estimate of the number of private label SKUs, we then adjusted the initial count of private label formulas as follows:
EstimatedFormulasPL
=
Estimated SKUsPL
Counted SKUPL * Counted FormulasPL
Table 4-3 lists the final number of formulas and SKUs per formula for branded and private label products.
4.2.2 Parts of the Label and the Associated Number of Colors
As a result of a regulation, one or more parts of food or dietary supplement labeling may be affected. Depending on which parts of the labeling are affected, manufacturers will need to change one or more printing plates. Based on our discussions with food manufacturers, we developed assumptions about the number of colors (i.e., plates or cylinders) that would typically be affected for each part of the labeling that would have to be changed. Table 4-4 lists each potentially affected part of the labeling on the PDP and IP and our assumptions about the typical number of colors that would be affected.
In general, most changes on the PDP will require a complete redesign, in which case we assumed six colors will be affected. Although some products may have up to nine colors used in the labeling design, we found in our review of products described above that few products have more than six colors, and many products have fewer. The number of colors may be made up of all special ink colors, all process color (maximum of four colors), or a combination of special ink colors and process color.
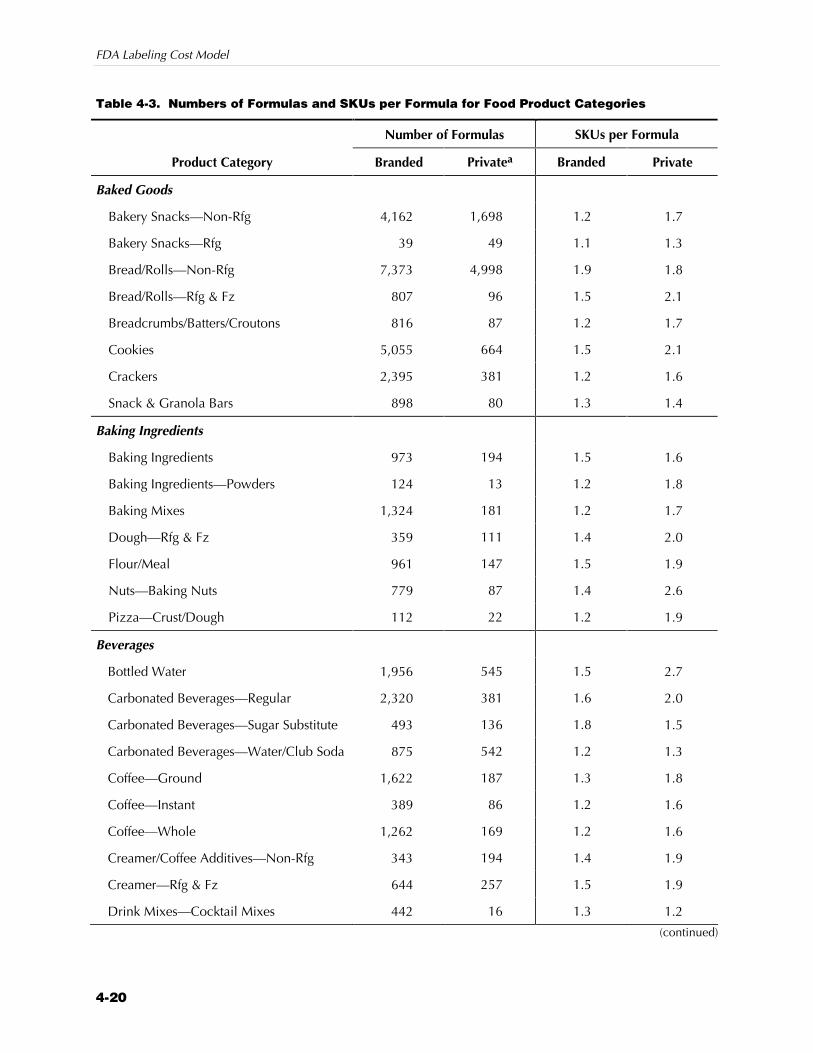
FDA Labeling Cost Model
4-20
Table 4-3. Numbers of Formulas and SKUs per Formula for Food Product Categories
Number of Formulas SKUs per Formula
Product Category Branded Privatea Branded Private
Baked Goods
Bakery Snacks—Non-Rfg 4,162 1,698 1.2 1.7
Bakery Snacks—Rfg 39 49 1.1 1.3
Bread/Rolls—Non-Rfg 7,373 4,998 1.9 1.8
Bread/Rolls—Rfg & Fz 807 96 1.5 2.1
Breadcrumbs/Batters/Croutons 816 87 1.2 1.7
Cookies 5,055 664 1.5 2.1
Crackers 2,395 381 1.2 1.6
Snack & Granola Bars 898 80 1.3 1.4
Baking Ingredients
Baking Ingredients 973 194 1.5 1.6
Baking Ingredients—Powders 124 13 1.2 1.8
Baking Mixes 1,324 181 1.2 1.7
Dough—Rfg & Fz 359 111 1.4 2.0
Flour/Meal 961 147 1.5 1.9
Nuts—Baking Nuts 779 87 1.4 2.6
Pizza—Crust/Dough 112 22 1.2 1.9
Beverages
Bottled Water 1,956 545 1.5 2.7
Carbonated Beverages—Regular 2,320 381 1.6 2.0
Carbonated Beverages—Sugar Substitute 493 136 1.8 1.5
Carbonated Beverages—Water/Club Soda 875 542 1.2 1.3
Coffee—Ground 1,622 187 1.3 1.8
Coffee—Instant 389 86 1.2 1.6
Coffee—Whole 1,262 169 1.2 1.6
Creamer/Coffee Additives—Non-Rfg 343 194 1.4 1.9
Creamer—Rfg & Fz 644 257 1.5 1.9
Drink Mixes—Cocktail Mixes 442 16 1.3 1.2
(continued)

Section 4 — Labeling Cost Model Assumptions, Data, and Calculations (Revised October 2002)
4-21
Table 4-3. Numbers of Formulas and SKUs per Formula for Food Product Categories (continued)
Number of Formulas SKUs per Formula
Product Category Branded Privatea Branded Private
Drink Mixes—Milk/Cocoa Dry Mixes 317 82 1.4 2.0
Drink Mixes—Other 327 132 1.3 1.4
Isotonic Drinks 485 43 1.7 1.6
Juices—Aseptic 444 42 1.3 1.1
Juices—Bottled 3,231 531 1.5 2.2
Juices—Canned 768 136 1.3 1.5
Juices—Concentrate, Rfg & Fz 346 200 1.4 1.4
Juices—Rfg 1,910 475 1.7 1.7
Milk—Condensed 68 55 1.3 1.4
Milk—Flavored/Substitutes 1,294 318 1.7 2.0
Milk—Powdered 38 25 1.6 2.7
Milk—Rfg 1,811 2,234 2.1 3.1
Non-Fruit Drinks 292 3 1.5 1.4
Tea—Canned/Bottled 679 42 1.6 2.0
Tea—Instant 132 81 1.3 2.4
Tea—Loose 1,849 124 1.2 2.0
Breakfast Foods
Breakfast Food—Frozen 227 30 1.9 2.6
Breakfast Food—Instant 41 11 1.4 2.8
Breakfast Food—Ready to Eat 126 46 1.6 2.0
Cereal 1,345 528 1.3 1.8
Candy & Gum
Chocolate Candy—Single Serve 838 26 1.3 1.1
Chocolate Candy—Snack 1,818 161 1.3 1.4
Gum—Regular Gum 669 17 1.4 4.0
Gum—Sugarless Gum 103 1 1.5 1.1
Nonchocolate Candy—Diet 439 54 1.3 1.8
Nonchocolate Candy—Kits 161 22 1.4 1.1
(continued)
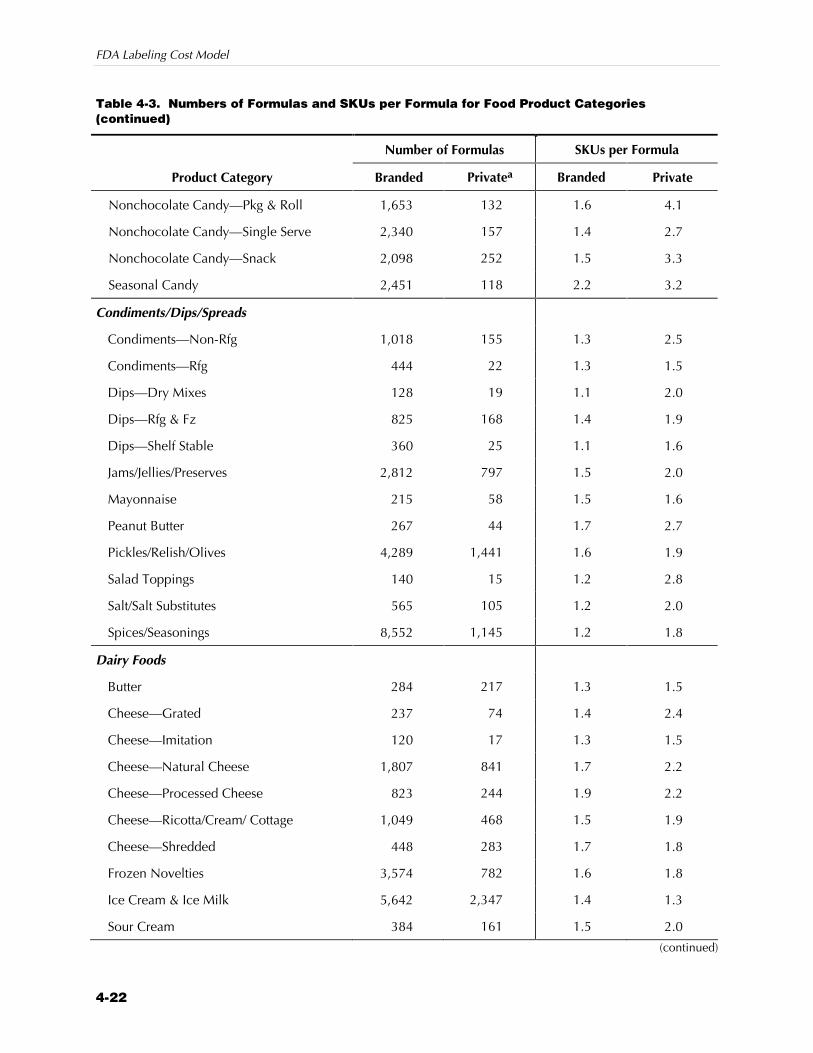
FDA Labeling Cost Model
4-22
Table 4-3. Numbers of Formulas and SKUs per Formula for Food Product Categories (continued)
Number of Formulas SKUs per Formula
Product Category Branded Privatea Branded Private
Nonchocolate Candy—Pkg & Roll 1,653 132 1.6 4.1
Nonchocolate Candy—Single Serve 2,340 157 1.4 2.7
Nonchocolate Candy—Snack 2,098 252 1.5 3.3
Seasonal Candy 2,451 118 2.2 3.2
Condiments/Dips/Spreads
Condiments—Non-Rfg 1,018 155 1.3 2.5
Condiments—Rfg 444 22 1.3 1.5
Dips—Dry Mixes 128 19 1.1 2.0
Dips—Rfg & Fz 825 168 1.4 1.9
Dips—Shelf Stable 360 25 1.1 1.6
Jams/Jellies/Preserves 2,812 797 1.5 2.0
Mayonnaise 215 58 1.5 1.6
Peanut Butter 267 44 1.7 2.7
Pickles/Relish/Olives 4,289 1,441 1.6 1.9
Salad Toppings 140 15 1.2 2.8
Salt/Salt Substitutes 565 105 1.2 2.0
Spices/Seasonings 8,552 1,145 1.2 1.8
Dairy Foods
Butter 284 217 1.3 1.5
Cheese—Grated 237 74 1.4 2.4
Cheese—Imitation 120 17 1.3 1.5
Cheese—Natural Cheese 1,807 841 1.7 2.2
Cheese—Processed Cheese 823 244 1.9 2.2
Cheese—Ricotta/Cream/ Cottage 1,049 468 1.5 1.9
Cheese—Shredded 448 283 1.7 1.8
Frozen Novelties 3,574 782 1.6 1.8
Ice Cream & Ice Milk 5,642 2,347 1.4 1.3
Sour Cream 384 161 1.5 2.0
(continued)
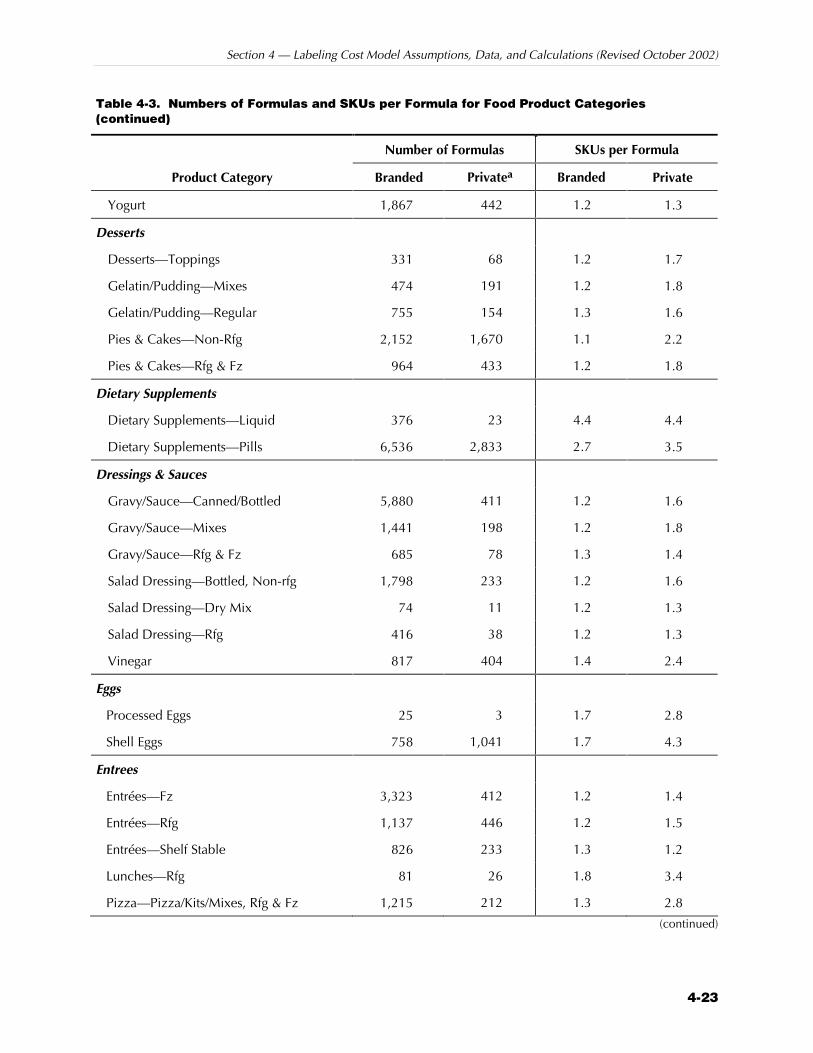
Section 4 — Labeling Cost Model Assumptions, Data, and Calculations (Revised October 2002)
4-23
Table 4-3. Numbers of Formulas and SKUs per Formula for Food Product Categories (continued)
Number of Formulas SKUs per Formula
Product Category Branded Privatea Branded Private
Yogurt 1,867 442 1.2 1.3
Desserts
Desserts—Toppings 331 68 1.2 1.7
Gelatin/Pudding—Mixes 474 191 1.2 1.8
Gelatin/Pudding—Regular 755 154 1.3 1.6
Pies & Cakes—Non-Rfg 2,152 1,670 1.1 2.2
Pies & Cakes—Rfg & Fz 964 433 1.2 1.8
Dietary Supplements
Dietary Supplements—Liquid 376 23 4.4 4.4
Dietary Supplements—Pills 6,536 2,833 2.7 3.5
Dressings & Sauces
Gravy/Sauce—Canned/Bottled 5,880 411 1.2 1.6
Gravy/Sauce—Mixes 1,441 198 1.2 1.8
Gravy/Sauce—Rfg & Fz 685 78 1.3 1.4
Salad Dressing—Bottled, Non-rfg 1,798 233 1.2 1.6
Salad Dressing—Dry Mix 74 11 1.2 1.3
Salad Dressing—Rfg 416 38 1.2 1.3
Vinegar 817 404 1.4 2.4
Eggs
Processed Eggs 25 3 1.7 2.8
Shell Eggs 758 1,041 1.7 4.3
Entrees
Entrées—Fz 3,323 412 1.2 1.4
Entrées—Rfg 1,137 446 1.2 1.5
Entrées—Shelf Stable 826 233 1.3 1.2
Lunches—Rfg 81 26 1.8 3.4
Pizza—Pizza/Kits/Mixes, Rfg & Fz 1,215 212 1.3 2.8
(continued)
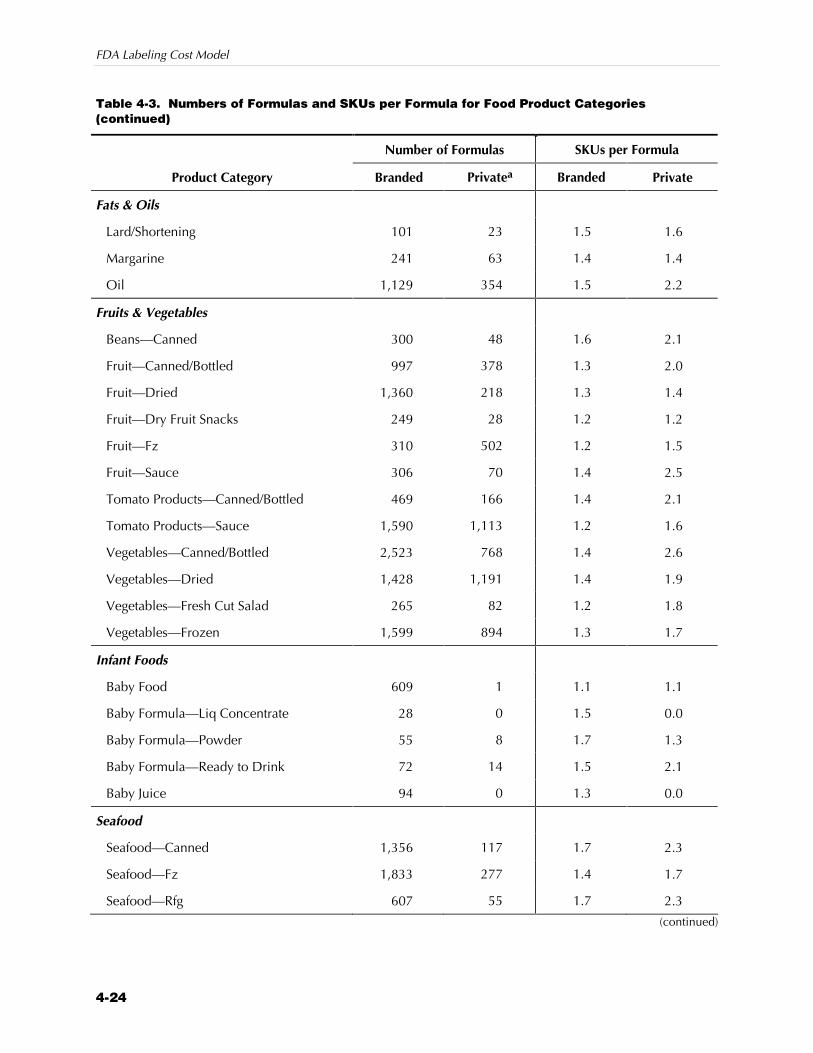
FDA Labeling Cost Model
4-24
Table 4-3. Numbers of Formulas and SKUs per Formula for Food Product Categories (continued)
Number of Formulas SKUs per Formula
Product Category Branded Privatea Branded Private
Fats & Oils
Lard/Shortening 101 23 1.5 1.6
Margarine 241 63 1.4 1.4
Oil 1,129 354 1.5 2.2
Fruits & Vegetables
Beans—Canned 300 48 1.6 2.1
Fruit—Canned/Bottled 997 378 1.3 2.0
Fruit—Dried 1,360 218 1.3 1.4
Fruit—Dry Fruit Snacks 249 28 1.2 1.2
Fruit—Fz 310 502 1.2 1.5
Fruit—Sauce 306 70 1.4 2.5
Tomato Products—Canned/Bottled 469 166 1.4 2.1
Tomato Products—Sauce 1,590 1,113 1.2 1.6
Vegetables—Canned/Bottled 2,523 768 1.4 2.6
Vegetables—Dried 1,428 1,191 1.4 1.9
Vegetables—Fresh Cut Salad 265 82 1.2 1.8
Vegetables—Frozen 1,599 894 1.3 1.7
Infant Foods
Baby Food 609 1 1.1 1.1
Baby Formula—Liq Concentrate 28 0 1.5 0.0
Baby Formula—Powder 55 8 1.7 1.3
Baby Formula—Ready to Drink 72 14 1.5 2.1
Baby Juice 94 0 1.3 0.0
Seafood
Seafood—Canned 1,356 117 1.7 2.3
Seafood—Fz 1,833 277 1.4 1.7
Seafood—Rfg 607 55 1.7 2.3
(continued)
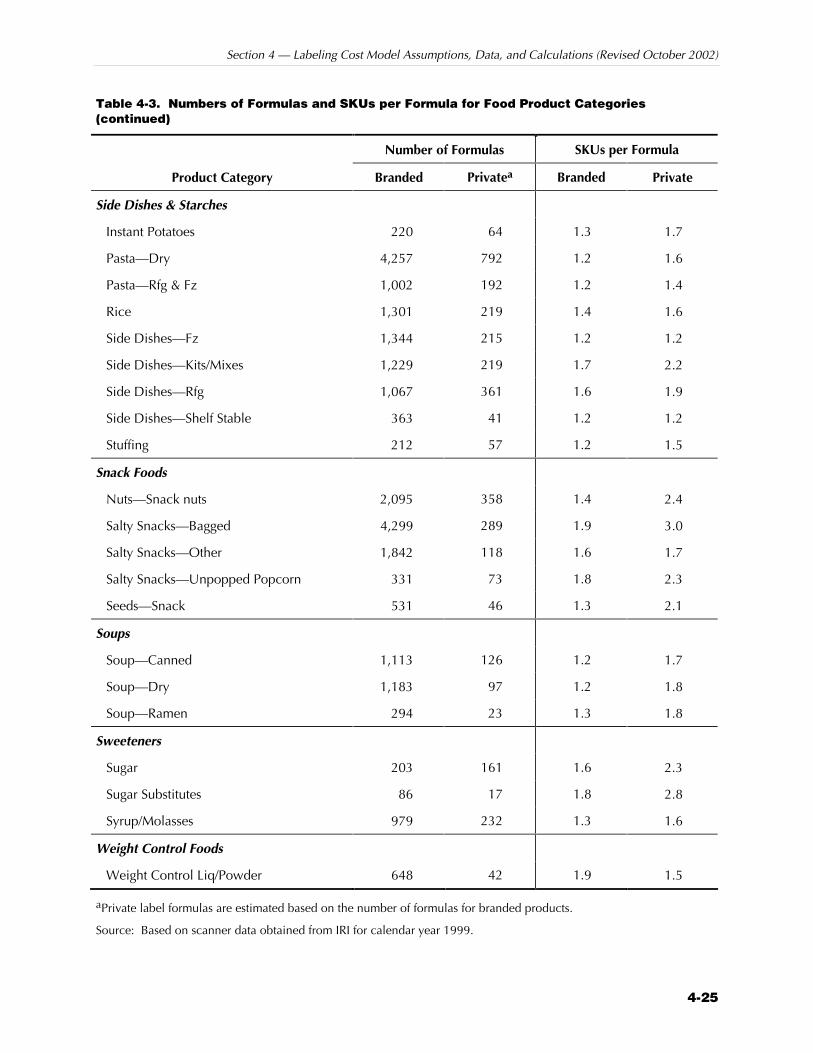
Section 4 — Labeling Cost Model Assumptions, Data, and Calculations (Revised October 2002)
4-25
Table 4-3. Numbers of Formulas and SKUs per Formula for Food Product Categories (continued)
Number of Formulas SKUs per Formula
Product Category Branded Privatea Branded Private
Side Dishes & Starches
Instant Potatoes 220 64 1.3 1.7
Pasta—Dry 4,257 792 1.2 1.6
Pasta—Rfg & Fz 1,002 192 1.2 1.4
Rice 1,301 219 1.4 1.6
Side Dishes—Fz 1,344 215 1.2 1.2
Side Dishes—Kits/Mixes 1,229 219 1.7 2.2
Side Dishes—Rfg 1,067 361 1.6 1.9
Side Dishes—Shelf Stable 363 41 1.2 1.2
Stuffing 212 57 1.2 1.5
Snack Foods
Nuts—Snack nuts 2,095 358 1.4 2.4
Salty Snacks—Bagged 4,299 289 1.9 3.0
Salty Snacks—Other 1,842 118 1.6 1.7
Salty Snacks—Unpopped Popcorn 331 73 1.8 2.3
Seeds—Snack 531 46 1.3 2.1
Soups
Soup—Canned 1,113 126 1.2 1.7
Soup—Dry 1,183 97 1.2 1.8
Soup—Ramen 294 23 1.3 1.8
Sweeteners
Sugar 203 161 1.6 2.3
Sugar Substitutes 86 17 1.8 2.8
Syrup/Molasses 979 232 1.3 1.6
Weight Control Foods
Weight Control Liq/Powder 648 42 1.9 1.5
aPrivate label formulas are estimated based on the number of formulas for branded products.
Source: Based on scanner data obtained from IRI for calendar year 1999.

FDA Labeling Cost Model
4-26
Table 4-4. Number of Colors Typically Affected by Changes to Various Parts of the Label The number of colors affected by a labeling change depends on which part of the labeling must be changed.
Panel Part of Label Typical Number of Colors Affected
Principal Display Panel Name of product Full redesign (assumed six colors)
Standard of identity or fanciful name Full redesign (assumed six colors)
Net quantity statement Two colors
Form of product Full redesign (assumed six colors)
Nutrient or health claim Full redesign (assumed six colors)
Caution statement Two colors
Information Panel Nutrition or supplement facts One color
Ingredient list One color
Nutrient or health claim Two colors
Caution statement Two colors
Dietary supplement disclaimer Two colors
In comparison to the PDP, most changes on the IP will require one or two color changes. Many manufacturers print the Nutrition Facts panel and ingredient list in one color so that, if an FDA regulation requires these to be changed, only one plate or cylinder will be affected.6 As an upper bound, we assumed that changes to other parts of the IP would require two color changes, but in many cases, they may require only one color change.
Based on our conversations with industry members, it is unlikely that food and dietary supplement manufacturers would make a change to their labeling that affected more than two colors but was not a full redesign. In many cases, even two color changes are infeasible and would require a full redesign because, as more parts of the labeling are changed, the more likely it is that the change will interfere with other parts of the design.
6Depending on the format of the labeling for a particular product, a change to the
Nutrition Facts panel or ingredient list that increases the space needed for these items could require a two-color change or a complete redesign.
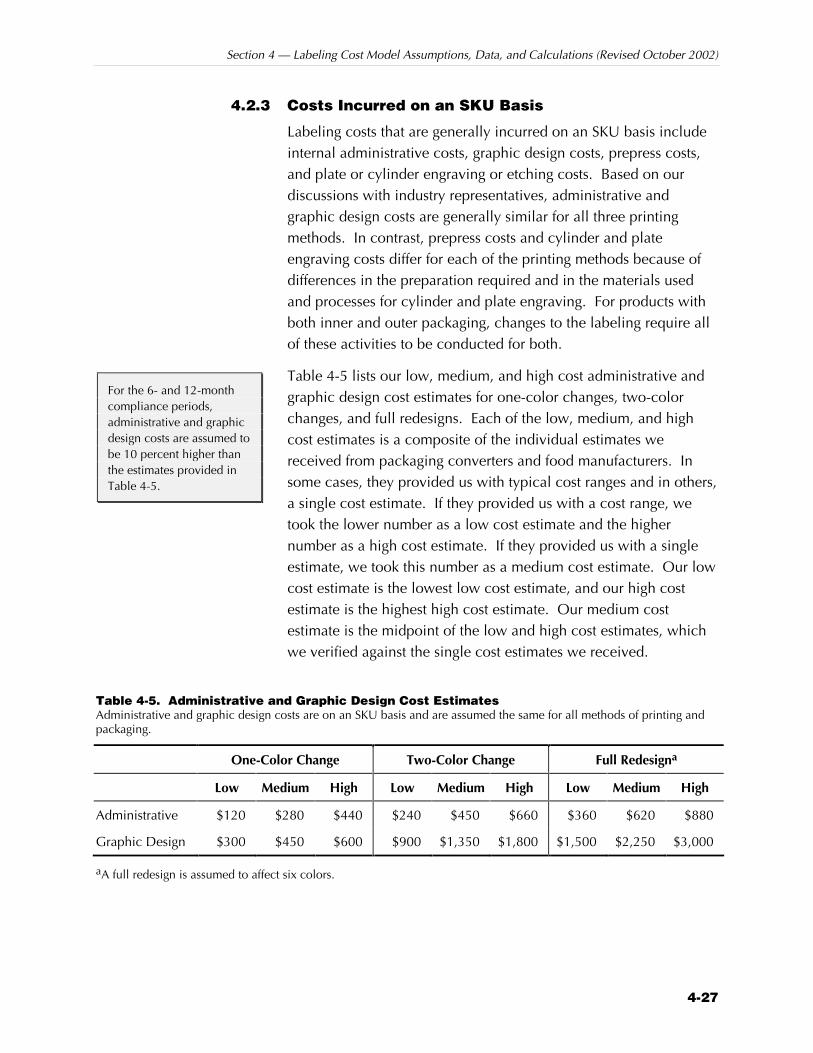
Section 4 — Labeling Cost Model Assumptions, Data, and Calculations (Revised October 2002)
4-27
4.2.3 Costs Incurred on an SKU Basis
Labeling costs that are generally incurred on an SKU basis include internal administrative costs, graphic design costs, prepress costs, and plate or cylinder engraving or etching costs. Based on our discussions with industry representatives, administrative and graphic design costs are generally similar for all three printing methods. In contrast, prepress costs and cylinder and plate engraving costs differ for each of the printing methods because of differences in the preparation required and in the materials used and processes for cylinder and plate engraving. For products with both inner and outer packaging, changes to the labeling require all of these activities to be conducted for both.
Table 4-5 lists our low, medium, and high cost administrative and graphic design cost estimates for one-color changes, two-color changes, and full redesigns. Each of the low, medium, and high cost estimates is a composite of the individual estimates we received from packaging converters and food manufacturers. In some cases, they provided us with typical cost ranges and in others, a single cost estimate. If they provided us with a cost range, we took the lower number as a low cost estimate and the higher number as a high cost estimate. If they provided us with a single estimate, we took this number as a medium cost estimate. Our low cost estimate is the lowest low cost estimate, and our high cost estimate is the highest high cost estimate. Our medium cost estimate is the midpoint of the low and high cost estimates, which we verified against the single cost estimates we received.
Table 4-5. Administrative and Graphic Design Cost Estimates Administrative and graphic design costs are on an SKU basis and are assumed the same for all methods of printing and packaging.
One-Color Change Two-Color Change Full Redesigna
Low Medium High Low Medium High Low Medium High
Administrative $120 $280 $440 $240 $450 $660 $360 $620 $880
Graphic Design $300 $450 $600 $900 $1,350 $1,800 $1,500 $2,250 $3,000
aA full redesign is assumed to affect six colors.
For the 6- and 12-month compliance periods, administrative and graphic design costs are assumed to be 10 percent higher than the estimates provided in Table 4-5.

FDA Labeling Cost Model
4-28
Administrative costs include the internal company costs associated with contracting for packaging and labeling services and routing a changed labeling design through the entire internal approval process (as described in Section 3.1). The food manufacturers we contacted provided us with estimates of the number of hours required for each individual SKU that must be changed. For the preliminary draft of the model, we multiplied these hours by $40 to obtain a total dollar estimate for administrative costs. This estimate was based on average total compensation (wages and benefits) for “professional specialty and technical” workers in manufacturing industries (U.S. Department of Labor, 2001). In general, we believe that the lower estimates are more relevant for small companies because they are less likely to have as many departments that would need to approve a labeling change, while the higher estimates are more relevant for large companies.
Graphic design costs are the costs associated with contracting out the graphic design work for making changes to food and dietary supplement labeling. In developing these cost estimates, we used information from the packaging converters that also provide graphic design services and from the food manufacturers we contacted. We combined these cost estimates across all printing methods because the graphic design process is usually not affected by the printing method used. In contrast to administrative costs, we do not have any specific beliefs about which costs are more applicable for small versus large companies. Although larger companies may be able to obtain volume discounts, they are also likely to have more elaborate or sophisticated labeling that would cost more to design than labeling for products produced by smaller companies. Although some of our industry contacts said that graphic design costs for private label products tend to cost less than for branded products, others said that the costs are approximately the same.
Table 4-6 lists our low, medium, and high cost prepress and engraving cost estimates for one-color changes, two-color changes, and full redesigns.7 As with the administrative and graphic design costs, each of the low, medium, and high cost estimates are
7We revised the high cost estimates in Table 4-6 from the estimates provided in the
draft report based on comments we received from 15 food and beverage manufacturers. The majority said that the estimates were representative of their costs, but a few cited significantly higher costs.
For the 6- and 12-month compliance periods, prepress and engraving costs are assumed to be 10 percent higher than the estimates provided in Table 4-6.
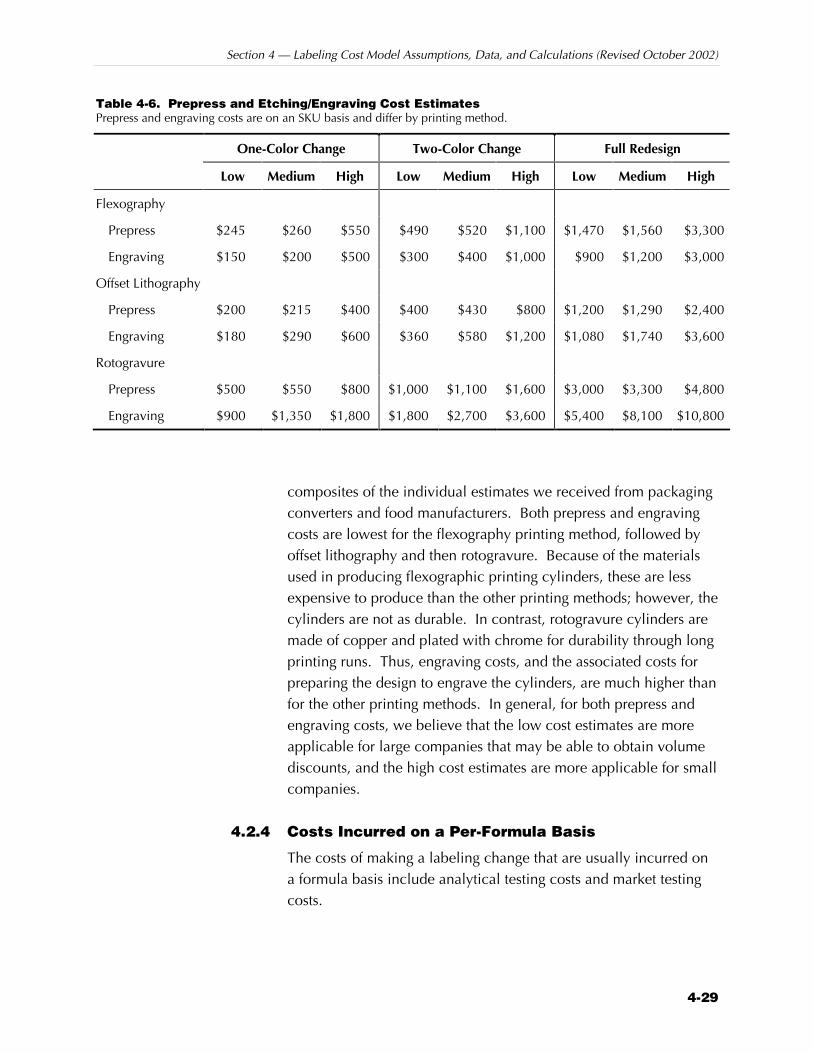
Section 4 — Labeling Cost Model Assumptions, Data, and Calculations (Revised October 2002)
4-29
Table 4-6. Prepress and Etching/Engraving Cost Estimates Prepress and engraving costs are on an SKU basis and differ by printing method.
One-Color Change Two-Color Change Full Redesign
Low Medium High Low Medium High Low Medium High
Flexography
Prepress $245 $260 $550 $490 $520 $1,100 $1,470 $1,560 $3,300
Engraving $150 $200 $500 $300 $400 $1,000 $900 $1,200 $3,000
Offset Lithography
Prepress $200 $215 $400 $400 $430 $800 $1,200 $1,290 $2,400
Engraving $180 $290 $600 $360 $580 $1,200 $1,080 $1,740 $3,600
Rotogravure
Prepress $500 $550 $800 $1,000 $1,100 $1,600 $3,000 $3,300 $4,800
Engraving $900 $1,350 $1,800 $1,800 $2,700 $3,600 $5,400 $8,100 $10,800
composites of the individual estimates we received from packaging converters and food manufacturers. Both prepress and engraving costs are lowest for the flexography printing method, followed by offset lithography and then rotogravure. Because of the materials used in producing flexographic printing cylinders, these are less expensive to produce than the other printing methods; however, the cylinders are not as durable. In contrast, rotogravure cylinders are made of copper and plated with chrome for durability through long printing runs. Thus, engraving costs, and the associated costs for preparing the design to engrave the cylinders, are much higher than for the other printing methods. In general, for both prepress and engraving costs, we believe that the low cost estimates are more applicable for large companies that may be able to obtain volume discounts, and the high cost estimates are more applicable for small companies.
4.2.4 Costs Incurred on a Per-Formula Basis
The costs of making a labeling change that are usually incurred on a formula basis include analytical testing costs and market testing costs.
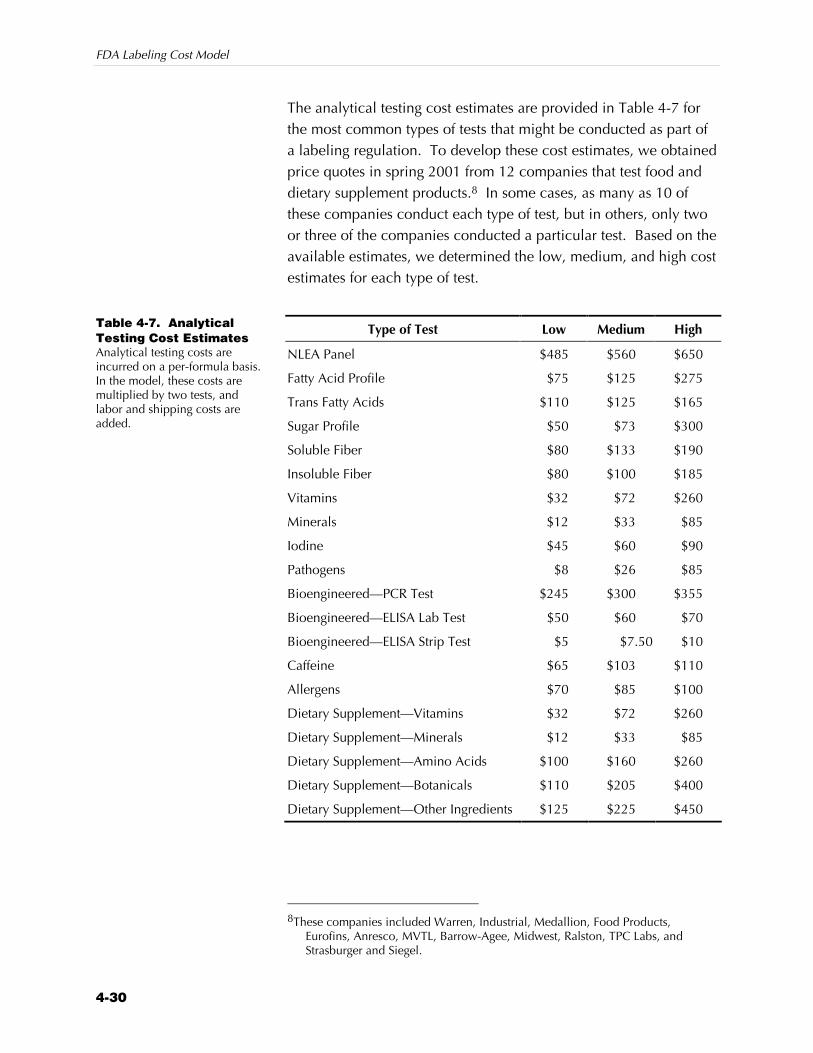
FDA Labeling Cost Model
4-30
The analytical testing cost estimates are provided in Table 4-7 for the most common types of tests that might be conducted as part of a labeling regulation. To develop these cost estimates, we obtained price quotes in spring 2001 from 12 companies that test food and dietary supplement products.8 In some cases, as many as 10 of these companies conduct each type of test, but in others, only two or three of the companies conducted a particular test. Based on the available estimates, we determined the low, medium, and high cost estimates for each type of test.
Type of Test Low Medium High
NLEA Panel $485 $560 $650
Fatty Acid Profile $75 $125 $275
Trans Fatty Acids $110 $125 $165
Sugar Profile $50 $73 $300
Soluble Fiber $80 $133 $190
Insoluble Fiber $80 $100 $185
Vitamins $32 $72 $260
Minerals $12 $33 $85
Iodine $45 $60 $90
Pathogens $8 $26 $85
Bioengineered—PCR Test $245 $300 $355
Bioengineered—ELISA Lab Test $50 $60 $70
Bioengineered—ELISA Strip Test $5 $7.50 $10
Caffeine $65 $103 $110
Allergens $70 $85 $100
Dietary Supplement—Vitamins $32 $72 $260
Dietary Supplement—Minerals $12 $33 $85
Dietary Supplement—Amino Acids $100 $160 $260
Dietary Supplement—Botanicals $110 $205 $400
Dietary Supplement—Other Ingredients $125 $225 $450
8These companies included Warren, Industrial, Medallion, Food Products,
Eurofins, Anresco, MVTL, Barrow-Agee, Midwest, Ralston, TPC Labs, and Strasburger and Siegel.
Table 4-7. Analytical Testing Cost Estimates Analytical testing costs are incurred on a per-formula basis. In the model, these costs are multiplied by two tests, and labor and shipping costs are added.

Section 4 — Labeling Cost Model Assumptions, Data, and Calculations (Revised October 2002)
4-31
In the labeling cost model, the user may select one or more of these tests or enter a separate cost estimate for an analytical test not included as an option in the model. When the user chooses to include an analytical testing cost, the model multiplies the number of affected formulas by the cost per formula tested. The total analytical test cost calculation includes
Z the cost of testing two samples,
Z 1 hour of labor to prepare and package the samples ($14.73), and
Z delivery charges for one 2-pound package delivered overnight ($26.30).
The labor cost estimate was based on average total compensation (wages and benefits) for “handlers, equipment cleaners, helpers, and laborers” in manufacturing industries (U.S. Department of Labor, 2001). The delivery charge estimate was based on the average charge for delivery of a 2-pound package overnight by FedEx (FedEx, 2001).
The market testing cost estimates are provided in Table 4-8 for the two types of tests that companies may conduct as part of a labeling regulation. However, as mentioned in Section 3, companies rarely conduct outside market testing of changes to labeling that would result from regulation.9 Because few companies conduct outside market testing for labeling changes, we had little information on which to base the estimates used in the labeling cost model. Based on this limited information, we assumed that three, four, or six focus groups at a cost of approximately $5,000 each would be conducted for the low, medium, and high cost estimates respectively. In addition, we assumed that 100, 150, or 200 consumers at a cost of approximately $100 per consumer would be included in a quantitative study for the low, medium, and high cost estimates, respectively.
4.2.5 Discarded Inventory Costs
Discarded inventory costs are the costs associated with disposing unused labeling and packaging material. The amount of inventory that might be discarded because of a labeling regulation depends
9In most cases, the internal marketing department within the company would be
involved in evaluating any labeling change, but their activities are included as part of the administrative costs of a labeling change.
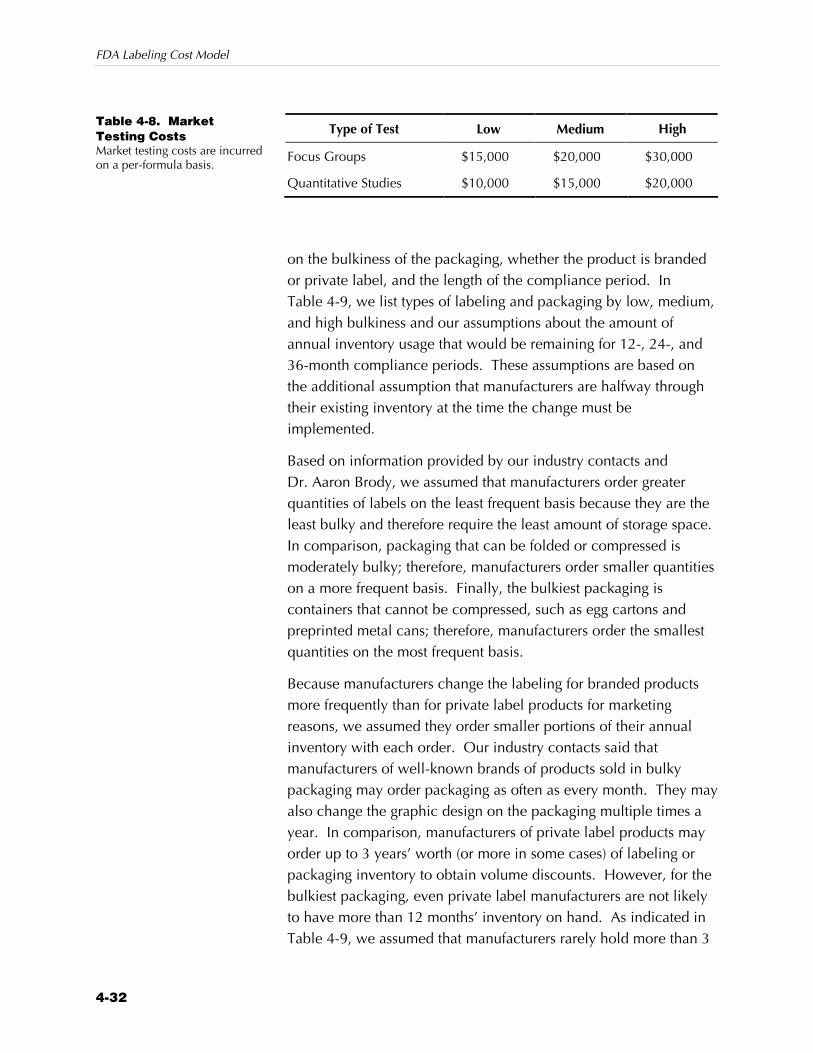
FDA Labeling Cost Model
4-32
Type of Test Low Medium High
Focus Groups $15,000 $20,000 $30,000
Quantitative Studies $10,000 $15,000 $20,000
on the bulkiness of the packaging, whether the product is branded or private label, and the length of the compliance period. In Table 4-9, we list types of labeling and packaging by low, medium, and high bulkiness and our assumptions about the amount of annual inventory usage that would be remaining for 12-, 24-, and 36-month compliance periods. These assumptions are based on the additional assumption that manufacturers are halfway through their existing inventory at the time the change must be implemented.
Based on information provided by our industry contacts and Dr. Aaron Brody, we assumed that manufacturers order greater quantities of labels on the least frequent basis because they are the least bulky and therefore require the least amount of storage space. In comparison, packaging that can be folded or compressed is moderately bulky; therefore, manufacturers order smaller quantities on a more frequent basis. Finally, the bulkiest packaging is containers that cannot be compressed, such as egg cartons and preprinted metal cans; therefore, manufacturers order the smallest quantities on the most frequent basis.
Because manufacturers change the labeling for branded products more frequently than for private label products for marketing reasons, we assumed they order smaller portions of their annual inventory with each order. Our industry contacts said that manufacturers of well-known brands of products sold in bulky packaging may order packaging as often as every month. They may also change the graphic design on the packaging multiple times a year. In comparison, manufacturers of private label products may order up to 3 years’ worth (or more in some cases) of labeling or packaging inventory to obtain volume discounts. However, for the bulkiest packaging, even private label manufacturers are not likely to have more than 12 months’ inventory on hand. As indicated in Table 4-9, we assumed that manufacturers rarely hold more than 3
Table 4-8. Market Testing Costs Market testing costs are incurred on a per-formula basis.
Section 4 — Labeling Cost Model Assumptions, Data, and Calculations (Revised October 2002)
4-33
Table 4-9. Remaining Inventory Assumptions by Type of Package The volume of discarded inventory is calculated by multiplying these percentages by the annual units sold.
Percentage of “Annual Units Sold” Remaining for…
12-Month Compliance 24-Month Compliance 36-Month Compliance
Package Type Branded Private Label Branded
Private Label Branded
Private Label
Low Bulkiness 10% 150% 0% 50% 0% 10%
• Label—cut and stack
• Label—pressure sensitive
• Label—shrink wrap
Medium Bulkiness 0% 10% 0% 0% 0% 0%
• Flat blank carton
• Paper bag
• Paper/foil packet
• Plastic bag/pouch
High Bulkiness 0% 0% 0% 0% 0% 0%
• Aseptic box
• Egg carton
• Gable top carton
• Knock down carton
• Metal can
• Spiral wound container
• Plastic tub
years’ worth of labeling or packaging inventory. However, because manufacturers often order slightly more packaging and labeling inventory than their projected needs, we included a residual 10 percent remaining inventory for low bulkiness—branded, low bulkiness—private label, and medium bulkiness—private label.
Using the estimates of remaining inventory, we calculated the costs of discarded inventory by first estimating the remaining number of labeling and packaging units (i.e., by multiplying the percentages in Table 4-9 by the annual unit sales from the IRI dataset). We then multiplied the estimated remaining number of labeling and packaging units by the cost estimate for each. Table 4-10 lists the cost estimates for each product category based on the labeling or packaging type for the representative product. These cost estimates were obtained from Dr. Aaron Brody and verified against limited estimates we obtained from food manufacturers.

FDA Labeling Cost Model
4-34
Ta
ble
4-1
0. C
ost
s o
f L
ab
el o
r P
ac
ka
ge
fo
r E
ac
h P
roduct
Cate
gory
Base
d o
n a
Repre
senta
tive
Pro
du
ct
The
per-
unit
cost
s of
labe
ls a
nd p
acka
ges
are
used
to c
alcu
late
dis
card
ed in
vent
ory
cost
s.
Prod
uct
Type
Pr
oduc
t C
ateg
ory
Pack
age/
Labe
l Typ
e Lo
w
Med
ium
H
igh
Bak
ed G
oods
B
aker
y Sn
acks
—N
on-R
fg
Kno
ck d
own
cart
on
$0.0
50
$0.0
55
$0.0
60
B
aker
y Sn
acks
—R
fg
Flat
bla
nk c
arto
n $0
.090
$0
.100
$0
.110
B
read
/Rol
ls—
Non
-Rfg
Pl
astic
bag
/pou
ch
$0.0
30
$0.0
35
$0.0
40
B
read
/Rol
ls—
Rfg
& F
z Pl
astic
bag
/pou
ch
$0.0
20
$0.0
25
$0.0
30
B
read
crum
bs/B
atte
rs/C
rout
ons
Kno
ck d
own
cart
on
$0.0
40
$0.0
50
$0.0
60
C
ooki
es
Plas
tic b
ag/p
ouch
$0
.050
$0
.055
$0
.060
C
rack
ers
Kno
ck d
own
cart
on
$0.0
90
$0.0
95
$0.1
00
Sn
ack
& G
rano
la B
ars
Kno
ck d
own
cart
on
$0.0
30
$0.0
35
$0.0
40
Bak
ing
Ingr
edie
nts
Bak
ing
Ingr
edie
nts
Plas
tic b
ag/p
ouch
$0
.030
$0
.035
$0
.040
B
akin
g In
gred
ient
s—Po
wde
rs
Kno
ck d
own
cart
on
$0.0
25
$0.0
30
$0.0
35
B
akin
g M
ixes
K
nock
dow
n ca
rton
$0
.070
$0
.075
$0
.080
D
ough
—R
fg &
Fz
Spir
al w
ound
con
tain
er
$0.0
70
$0.0
75
$0.0
80
Fl
our/
Mea
l Pa
per
bag
$0.0
40
$0.0
50
$0.0
60
N
uts—
Bak
ing
Nut
s Pl
astic
bag
/pou
ch
$0.0
40
$0.0
30
$0.0
50
Pi
zza—
Cru
st/D
ough
Sp
iral
wou
nd c
onta
iner
$0
.090
$0
.095
$0
.100
Bev
erag
es
Bot
tled
Wat
er
Labe
l—pr
essu
re s
ensi
tive
$0.0
40
$0.0
50
$0.0
60
C
arbo
nate
d B
ever
ages
—R
egul
ara
Labe
l—cu
t & s
tack
$0
.015
$0
.020
$0
.025
C
arbo
nate
d B
ever
ages
—R
egul
ara
Kno
ck d
own
cart
on
$0.1
20
$0.1
30
$0.1
40
Met
al c
an
$0.0
70
$0.0
75
$0.0
80
C
arbo
nate
d B
ever
ages
—Su
gar
Subs
titut
ea
Labe
l—cu
t & s
tack
$0
.015
$0
.020
$0
.025
C
arbo
nate
d B
ever
ages
—Su
gar
Subs
titut
ea
Kno
ck d
own
cart
on
$0.1
20
$0.1
30
$0.1
40
Met
al c
an
$0.0
70
$0.0
75
$0.0
80
(con
tinue
d)
Section 4 — Labeling Cost Model Assumptions, Data, and Calculations (Revised October 2002)
4-35
Ta
ble
4-1
0. C
ost
s o
f L
ab
el o
r P
ac
ka
ge
fo
r E
ac
h P
rod
uc
t C
ate
go
ry B
ase
d o
n a
Re
pre
senta
tive
Pro
du
ct
(co
nti
nu
ed
)
Prod
uct
Type
Pr
oduc
t C
ateg
ory
Pack
age/
Labe
l Typ
e Lo
w
Med
ium
H
igh
Bev
erag
es (c
ontin
ued)
C
arbo
nate
d B
ever
ages
—W
ater
/Clu
b So
da
Labe
l—cu
t & s
tack
$0
.040
$0
.050
$0
.060
C
offe
e—G
roun
d La
bel—
shri
nk w
rap
$0.0
50
$0.0
55
$0.0
60
C
offe
e—In
stan
t La
bel—
cut &
sta
ck
$0.0
30
$0.0
35
$0.0
40
C
offe
e—W
hole
Pl
astic
bag
/pou
ch
$0.2
30
$0.2
50
$0.2
70
D
rink
Mix
es—
Coc
ktai
l Mix
es
Labe
l—cu
t & s
tack
$0
.060
$0
.070
$0
.080
D
rink
Mix
es—
Milk
/Coc
oa D
ry M
ixes
K
nock
dow
n ca
rton
$0
.040
$0
.050
$0
.060
D
rink
Mix
es—
Oth
er
Pape
r/fo
il pa
cket
$0
.030
$0
.035
$0
.040
Is
oton
ic D
rink
s La
bel—
cut &
sta
ck
$0.0
20
$0.0
30
$0.0
40
Ju
ices
—C
once
ntra
te, R
fg &
Fz
Spir
al w
ound
con
tain
er
$0.0
30
$0.0
35
$0.0
40
Ju
ices
—R
fg
Gab
le to
p ca
rton
$0
.120
$0
.130
$0
.140
Ju
ices
—A
sept
ic
Flat
bla
nk c
arto
n $0
.025
$0
.030
$0
.035
Ase
ptic
box
$0
.080
$0
.085
$0
.090
Ju
ices
—B
ottle
d La
bel—
cut &
sta
ck
$0.0
20
$0.0
25
$0.0
30
Ju
ices
—C
anne
d La
bel—
cut &
sta
ck
$0.0
40
$0.0
50
$0.0
60
M
ilk—
Con
dens
ed
Labe
l—cu
t & s
tack
$0
.013
$0
.015
$0
.018
M
ilk—
Pow
dere
d Pl
astic
bag
/pou
ch
$0.1
50
$0.1
75
$0.2
00
M
ilk—
Rfg
La
bel—
pres
sure
sen
sitiv
e $0
.013
$0
.015
$0
.018
M
ilk—
Flav
ored
/Sub
stitu
tes
Labe
l—sh
rink
wra
p $0
.040
$0
.045
$0
.050
N
on-F
ruit
Dri
nks
Labe
l—cu
t & s
tack
$0
.050
$0
.060
$0
.070
C
ream
er/C
offe
e A
dditi
ves—
Non
-Rfg
La
bel—
shri
nk w
rap
$0.0
40
$0.0
45
$0.0
50
C
ream
er—
Rfg
& F
z G
able
top
cart
on
$0.0
40
$0.0
50
$0.0
60
Te
a—C
anne
d/B
ottle
d La
bel—
cut &
sta
ck
$0.0
20
$0.0
25
$0.0
30
Te
a—In
stan
t La
bel—
cut &
sta
ck
$0.0
25
$0.0
28
$0.0
30
Te
a—Lo
ose
Flat
bla
nk c
arto
n $0
.060
$0
.070
$0
.080
(c
ontin
ued)
FDA Labeling Cost Model
4-36
Ta
ble
4-1
0. C
ost
s o
f L
ab
el o
r P
ac
ka
ge
fo
r E
ac
h P
rod
uc
t C
ate
go
ry B
ase
d o
n a
Re
pre
senta
tive
Pro
du
ct
(co
nti
nu
ed
)
Prod
uct
Type
Pr
oduc
t C
ateg
ory
Pack
age/
Labe
l Typ
e Lo
w
Med
ium
H
igh
Bre
akfa
st F
oods
B
reak
fast
Foo
d—Fr
ozen
K
nock
dow
n ca
rton
$0
.070
$0
.075
$0
.080
B
reak
fast
Foo
d—In
stan
t K
nock
dow
n ca
rton
$0
.060
$0
.065
$0
.070
Pape
r/fo
il pa
cket
$0
.030
$0
.035
$0
.040
B
reak
fast
Foo
d—R
eady
to E
at
Kno
ck d
own
cart
on
$0.0
40
$0.0
50
$0.0
60
C
erea
l K
nock
dow
n ca
rton
$0
.100
$0
.110
$0
.120
Can
dy &
Gum
C
hoco
late
Can
dy—
Sing
le S
erve
Pl
astic
bag
/pou
ch
$0.0
15
$0.0
20
$0.0
25
C
hoco
late
Can
dy—
Snac
k Pl
astic
bag
/pou
ch
$0.0
25
$0.0
30
$0.0
35
G
um—
Reg
ular
Gum
Pl
astic
bag
/pou
ch
$0.0
20
$0.0
25
$0.0
30
G
um—
Suga
rles
s G
um
Plas
tic b
ag/p
ouch
$0
.020
$0
.025
$0
.030
N
onch
ocol
ate
Can
dy—
Die
t Pl
astic
bag
/pou
ch
$0.0
50
$0.0
55
$0.0
60
N
onch
ocol
ate
Can
dy—
Kits
Pl
astic
tub
$0.0
40
$0.0
50
$0.0
60
N
onch
ocol
ate
Can
dy—
Pkg
& R
oll
Plas
tic b
ag/p
ouch
$0
.050
$0
.055
$0
.060
N
onch
ocol
ate
Can
dy—
Sing
le S
erve
Pl
astic
bag
/pou
ch
$0.0
15
$0.0
20
$0.0
25
N
onch
ocol
ate
Can
dy—
Snac
k Pl
astic
bag
/pou
ch
$0.0
50
$0.0
55
$0.0
60
Se
ason
al C
andy
Pl
astic
bag
/pou
ch
$0.0
15
$0.0
20
$0.0
25
Con
dim
ents
/Dip
s/Sp
read
s C
ondi
men
ts—
Non
-Rfg
La
bel—
cut &
sta
ck
$0.0
15
$0.0
20
$0.0
25
C
ondi
men
ts—
Rfg
Pl
astic
tub
$0.0
80
$0.0
85
$0.0
90
Labe
l—pr
essu
re s
ensi
tive
$0.0
50
$0.0
55
$0.0
60
D
ips—
Dry
Mix
es
Pape
r/fo
il pa
cket
$0
.040
$0
.045
$0
.050
D
ips—
Shel
f Sta
ble
Labe
l—cu
t & s
tack
$0
.008
$0
.010
$0
.013
D
ips—
Rfg
& F
z Pl
astic
tub
$0.0
70
$0.0
75
$0.0
80
Ja
ms/
Jelli
es/P
rese
rves
La
bel—
cut &
sta
ck
$0.0
10
$0.0
15
$0.0
20
M
ayon
nais
e La
bel—
cut &
sta
ck
$0.0
30
$0.0
33
$0.0
35
(con
tinue
d)
Section 4 — Labeling Cost Model Assumptions, Data, and Calculations (Revised October 2002)
4-37
Ta
ble
4-1
0. C
ost
s o
f L
ab
el o
r P
ac
ka
ge
fo
r E
ac
h P
rod
uc
t C
ate
go
ry B
ase
d o
n a
Re
pre
senta
tive
Pro
du
ct
(co
nti
nu
ed
)
Prod
uct
Type
Pr
oduc
t C
ateg
ory
Pack
age/
Labe
l Typ
e Lo
w
Med
ium
H
igh
Pean
ut B
utte
r La
bel—
cut &
sta
ck
$0.0
15
$0.0
20
$0.0
25
Con
dim
ents
/Dip
s/Sp
read
s (c
ontin
ued)
Pi
ckle
s/R
elis
h/O
lives
La
bel—
cut &
sta
ck
$0.0
13
$0.0
15
$0.0
18
Sa
lad
Topp
ings
Sp
iral
wou
nd c
onta
iner
$0
.070
$0
.075
$0
.080
Sa
lt/Sa
lt Su
bstit
utes
La
bel—
cut &
sta
ck
$0.0
20
$0.0
25
$0.0
30
Sp
ices
/Sea
soni
ngs
Labe
l—cu
t & s
tack
$0
.005
$0
.008
$0
.010
Dai
ry F
oods
B
utte
r K
nock
dow
n ca
rton
$0
.030
$0
.035
$0
.040
C
hees
e—G
rate
d
Labe
l—cu
t & s
tack
$0
.020
$0
.030
$0
.040
C
hees
e—Im
itatio
n Pl
astic
bag
/pou
ch
$0.0
15
$0.0
20
$0.0
25
C
hees
e—N
atur
al C
hees
e Pl
astic
bag
/pou
ch
$0.1
20
$0.1
25
$0.1
30
C
hees
e—Pr
oces
sed
Che
ese
Plas
tic b
ag/p
ouch
$0
.015
$0
.020
$0
.025
C
hees
e—R
icot
ta/C
ream
/Cot
tage
Pl
astic
tub
$0.0
60
$0.0
65
$0.0
70
C
hees
e—Sh
redd
ed
Plas
tic b
ag/p
ouch
$0
.120
$0
.130
$0
.140
Fr
ozen
Nov
eltie
s Fl
at b
lank
car
ton
$0.0
15
$0.0
20
$0.0
25
Pape
r/fo
il pa
cket
$0
.015
$0
.020
$0
.025
Ic
e C
ream
& Ic
e M
ilk
Flat
bla
nk c
arto
n $0
.150
$0
.175
$0
.200
So
ur C
ream
Pl
astic
tub
$0.0
50
$0.0
60
$0.0
70
Y
ogur
t Pl
astic
tub
$0.0
70
$0.0
75
$0.0
80
Des
sert
s D
esse
rts—
Topp
ings
Pl
astic
tub
$0.0
70
$0.0
80
$0.0
90
G
elat
in/P
uddi
ng—
Mix
es
Kno
ck d
own
cart
on
$0.0
20
$0.0
25
$0.0
30
G
elat
in/P
uddi
ng—
Reg
ular
K
nock
dow
n ca
rton
$0
.025
$0
.030
$0
.035
Pi
es &
Cak
es—
Non
-rfg
Fl
at b
lank
car
ton
$0.1
20
$0.1
35
$0.1
50
Pi
es &
Cak
es—
Rfg
& F
z K
nock
dow
n ca
rton
$0
.070
$0
.075
$0
.080
(c
ontin
ued)
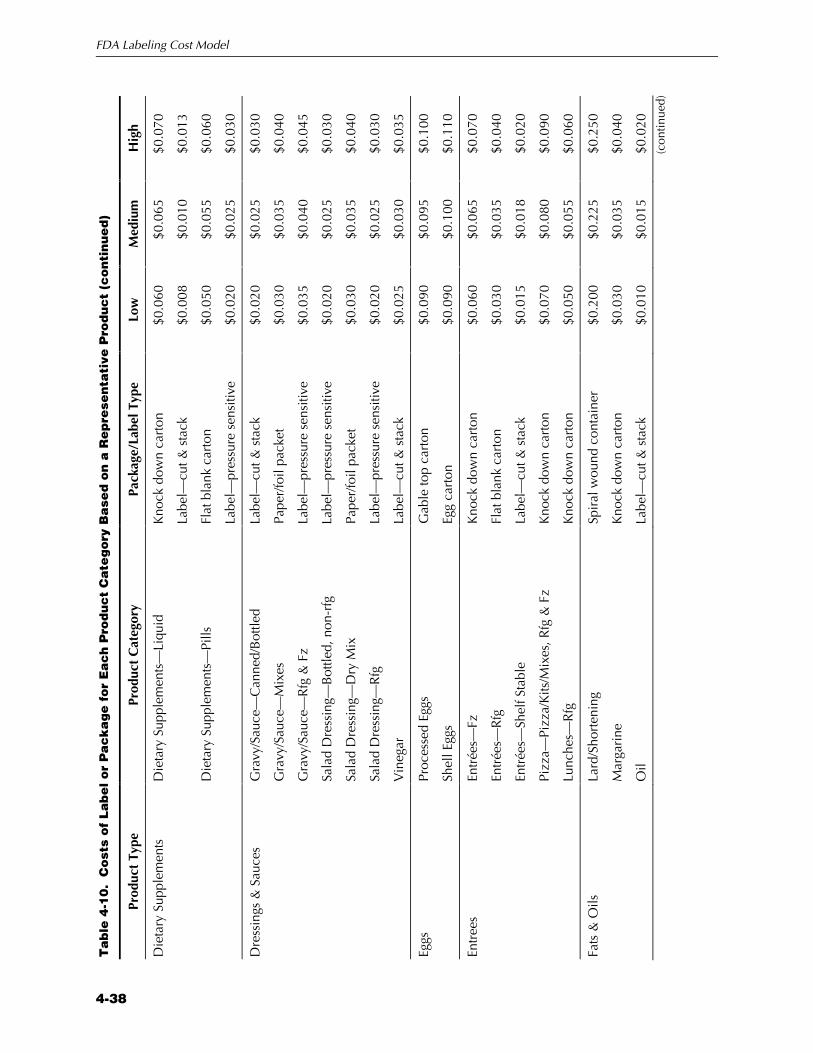
FDA Labeling Cost Model
4-38
Ta
ble
4-1
0. C
ost
s o
f L
ab
el o
r P
ac
ka
ge
fo
r E
ac
h P
rod
uc
t C
ate
go
ry B
ase
d o
n a
Re
pre
senta
tive
Pro
du
ct
(co
nti
nu
ed
)
Prod
uct
Type
Pr
oduc
t C
ateg
ory
Pack
age/
Labe
l Typ
e Lo
w
Med
ium
H
igh
Die
tary
Sup
plem
ents
D
ieta
ry S
uppl
emen
ts—
Liqu
id
Kno
ck d
own
cart
on
$0.0
60
$0.0
65
$0.0
70
Labe
l—cu
t & s
tack
$0
.008
$0
.010
$0
.013
D
ieta
ry S
uppl
emen
ts—
Pills
Fl
at b
lank
car
ton
$0.0
50
$0.0
55
$0.0
60
Labe
l—pr
essu
re s
ensi
tive
$0.0
20
$0.0
25
$0.0
30
Dre
ssin
gs &
Sau
ces
Gra
vy/S
auce
—C
anne
d/B
ottle
d La
bel—
cut &
sta
ck
$0.0
20
$0.0
25
$0.0
30
G
ravy
/Sau
ce—
Mix
es
Pape
r/fo
il pa
cket
$0
.030
$0
.035
$0
.040
G
ravy
/Sau
ce—
Rfg
& F
z La
bel—
pres
sure
sen
sitiv
e $0
.035
$0
.040
$0
.045
Sa
lad
Dre
ssin
g—B
ottle
d, n
on-r
fg
Labe
l—pr
essu
re s
ensi
tive
$0.0
20
$0.0
25
$0.0
30
Sa
lad
Dre
ssin
g—D
ry M
ix
Pape
r/fo
il pa
cket
$0
.030
$0
.035
$0
.040
Sa
lad
Dre
ssin
g—R
fg
Labe
l—pr
essu
re s
ensi
tive
$0.0
20
$0.0
25
$0.0
30
V
ineg
ar
Labe
l—cu
t & s
tack
$0
.025
$0
.030
$0
.035
Eggs
Pr
oces
sed
Eggs
G
able
top
cart
on
$0.0
90
$0.0
95
$0.1
00
Sh
ell E
ggs
Egg
cart
on
$0.0
90
$0.1
00
$0.1
10
Entr
ees
Entr
ées—
Fz
Kno
ck d
own
cart
on
$0.0
60
$0.0
65
$0.0
70
En
trée
s—R
fg
Flat
bla
nk c
arto
n $0
.030
$0
.035
$0
.040
En
trée
s—Sh
elf S
tabl
e La
bel—
cut &
sta
ck
$0.0
15
$0.0
18
$0.0
20
Pi
zza—
Pizz
a/K
its/M
ixes
, Rfg
& F
z K
nock
dow
n ca
rton
$0
.070
$0
.080
$0
.090
Lu
nche
s—R
fg
Kno
ck d
own
cart
on
$0.0
50
$0.0
55
$0.0
60
Fats
& O
ils
Lard
/Sho
rten
ing
Spir
al w
ound
con
tain
er
$0.2
00
$0.2
25
$0.2
50
M
arga
rine
K
nock
dow
n ca
rton
$0
.030
$0
.035
$0
.040
O
il La
bel—
cut &
sta
ck
$0.0
10
$0.0
15
$0.0
20
(con
tinue
d)
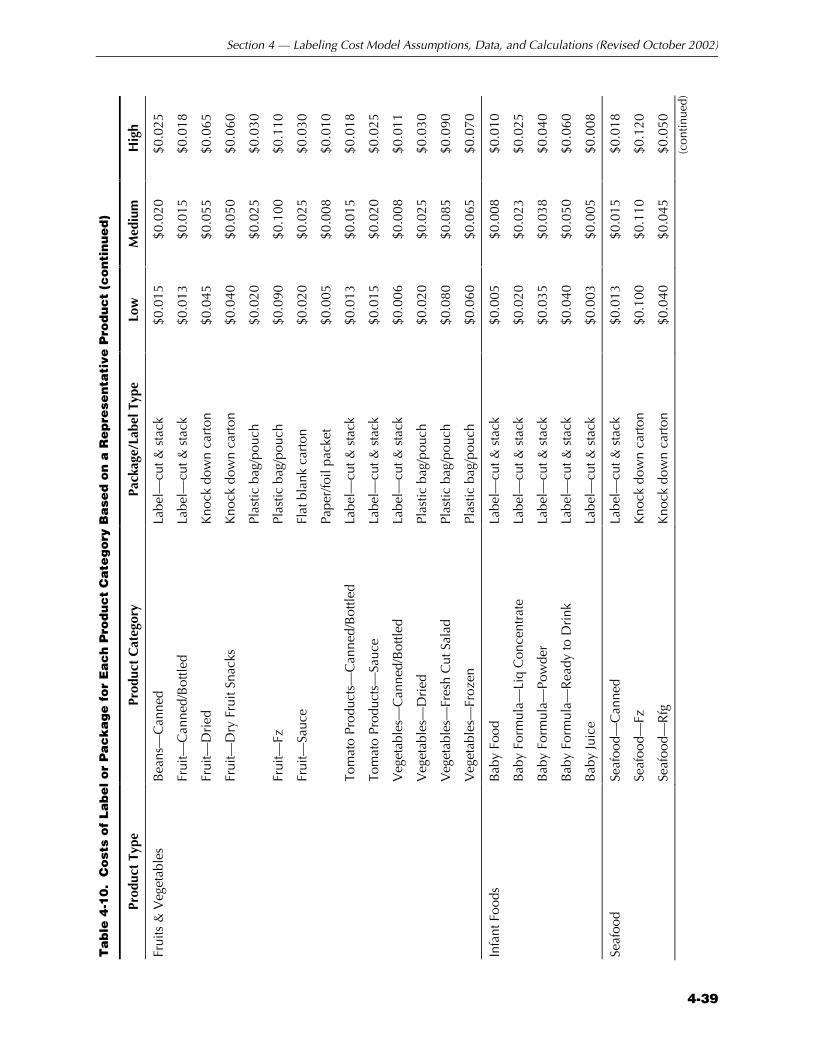
Section 4 — Labeling Cost Model Assumptions, Data, and Calculations (Revised October 2002)
4-39
Ta
ble
4-1
0. C
ost
s o
f L
ab
el o
r P
ac
ka
ge
fo
r E
ac
h P
rod
uc
t C
ate
go
ry B
ase
d o
n a
Re
pre
senta
tive
Pro
du
ct
(co
nti
nu
ed
)
Prod
uct
Type
Pr
oduc
t C
ateg
ory
Pack
age/
Labe
l Typ
e Lo
w
Med
ium
H
igh
Frui
ts &
Veg
etab
les
Bea
ns—
Can
ned
Labe
l—cu
t & s
tack
$0
.015
$0
.020
$0
.025
Fr
uit—
Can
ned/
Bot
tled
Labe
l—cu
t & s
tack
$0
.013
$0
.015
$0
.018
Fr
uit—
Dri
ed
Kno
ck d
own
cart
on
$0.0
45
$0.0
55
$0.0
65
Fr
uit—
Dry
Fru
it Sn
acks
K
nock
dow
n ca
rton
$0
.040
$0
.050
$0
.060
Plas
tic b
ag/p
ouch
$0
.020
$0
.025
$0
.030
Fr
uit—
Fz
Plas
tic b
ag/p
ouch
$0
.090
$0
.100
$0
.110
Fr
uit—
Sauc
e Fl
at b
lank
car
ton
$0.0
20
$0.0
25
$0.0
30
Pape
r/fo
il pa
cket
$0
.005
$0
.008
$0
.010
To
mat
o Pr
oduc
ts—
Can
ned/
Bot
tled
Labe
l—cu
t & s
tack
$0
.013
$0
.015
$0
.018
To
mat
o Pr
oduc
ts—
Sauc
e La
bel—
cut &
sta
ck
$0.0
15
$0.0
20
$0.0
25
V
eget
able
s—C
anne
d/B
ottle
d La
bel—
cut &
sta
ck
$0.0
06
$0.0
08
$0.0
11
V
eget
able
s—D
ried
Pl
astic
bag
/pou
ch
$0.0
20
$0.0
25
$0.0
30
V
eget
able
s—Fr
esh
Cut
Sal
ad
Plas
tic b
ag/p
ouch
$0
.080
$0
.085
$0
.090
V
eget
able
s—Fr
ozen
Pl
astic
bag
/pou
ch
$0.0
60
$0.0
65
$0.0
70
Infa
nt F
oods
B
aby
Food
La
bel—
cut &
sta
ck
$0.0
05
$0.0
08
$0.0
10
B
aby
Form
ula—
Liq
Con
cent
rate
La
bel—
cut &
sta
ck
$0.0
20
$0.0
23
$0.0
25
B
aby
Form
ula—
Pow
der
Labe
l—cu
t & s
tack
$0
.035
$0
.038
$0
.040
B
aby
Form
ula—
Rea
dy to
Dri
nk
Labe
l—cu
t & s
tack
$0
.040
$0
.050
$0
.060
B
aby
Juic
e La
bel—
cut &
sta
ck
$0.0
03
$0.0
05
$0.0
08
Seaf
ood
Seaf
ood—
Can
ned
Labe
l—cu
t & s
tack
$0
.013
$0
.015
$0
.018
Se
afoo
d—Fz
K
nock
dow
n ca
rton
$0
.100
$0
.110
$0
.120
Se
afoo
d—R
fg
Kno
ck d
own
cart
on
$0.0
40
$0.0
45
$0.0
50
(con
tinue
d)

FDA Labeling Cost Model
4-40
Ta
ble
4-1
0. C
ost
s o
f L
ab
el o
r P
ac
ka
ge
fo
r E
ac
h P
rod
uc
t C
ate
go
ry B
ase
d o
n a
Re
pre
senta
tive
Pro
du
ct
(co
nti
nu
ed
)
Prod
uct
Type
Pr
oduc
t C
ateg
ory
Pack
age/
Labe
l Typ
e Lo
w
Med
ium
H
igh
Side
Dis
hes
& S
tarc
hes
Inst
ant P
otat
oes
Kno
ck d
own
cart
on
$0.0
50
$0.0
55
$0.0
60
Pa
sta—
Dry
K
nock
dow
n ca
rton
$0
.040
$0
.050
$0
.060
Pa
sta—
Rfg
& F
z La
bel—
pres
sure
sen
sitiv
e $0
.040
$0
.045
$0
.050
R
ice
Kno
ck d
own
cart
on
$0.0
35
$0.0
40
$0.0
45
Si
de D
ishe
s—Fz
K
nock
dow
n ca
rton
$0
.045
$0
.050
$0
.055
Si
de D
ishe
s—R
fg
Labe
l—pr
essu
re s
ensi
tive
$0.0
15
$0.0
20
$0.0
25
Si
de D
ishe
s—Sh
elf S
tabl
e La
bel—
cut &
sta
ck
$0.0
13
$0.0
15
$0.0
18
Si
de D
ishe
s—K
its/M
ixes
K
nock
dow
n ca
rton
$0
.050
$0
.060
$0
.070
St
uffin
g K
nock
dow
n ca
rton
$0
.050
$0
.060
$0
.070
Snac
k Fo
ods
Nut
s—Sn
ack
Nut
s La
bel—
cut &
sta
ck
$0.0
25
$0.0
30
$0.0
35
Sa
lty S
nack
s—B
agge
d Pl
astic
bag
/pou
ch
$0.1
00
$0.1
10
$0.1
20
Sa
lty S
nack
s—O
ther
Sp
iral
wou
nd c
onta
iner
$0
.090
$0
.100
$0
.110
Sa
lty S
nack
s—U
npop
ped
Popc
orn
Kno
ck d
own
cart
on
$0.0
60
$0.0
65
$0.0
70
Se
eds—
Snac
k Pl
astic
bag
/pou
ch
$0.0
50
$0.0
55
$0.0
60
Soup
s So
up—
Can
ned
Labe
l—cu
t & s
tack
$0
.008
$0
.010
$0
.013
So
up—
Dry
K
nock
dow
n ca
rton
$0
.030
$0
.035
$0
.040
So
up—
Ram
en
Plas
tic b
ag/p
ouch
$0
.015
$0
.020
$0
.025
Swee
tene
rs
Suga
r Pa
per
bag
$0.0
40
$0.0
50
$0.0
60
Su
gar
Subs
titut
es
Flat
bla
nk c
arto
n $0
.030
$0
.035
$0
.040
Su
gar
Subs
titut
es
Pape
r/fo
il pa
cket
$0
.003
$0
.004
$0
.005
Sy
rup/
Mol
asse
s La
bel—
cut &
sta
ck
$0.0
15
$0.0
20
$0.0
25
Wei
ght C
ontr
ol F
oods
W
eigh
t Con
trol
Liq
/Pow
der
Labe
l—sh
rink
wra
p $0
.020
$0
.025
$0
.030
a The
se p
rodu
ct c
ateg
orie
s in
clud
e tw
o re
pres
enta
tive
prod
ucts
.
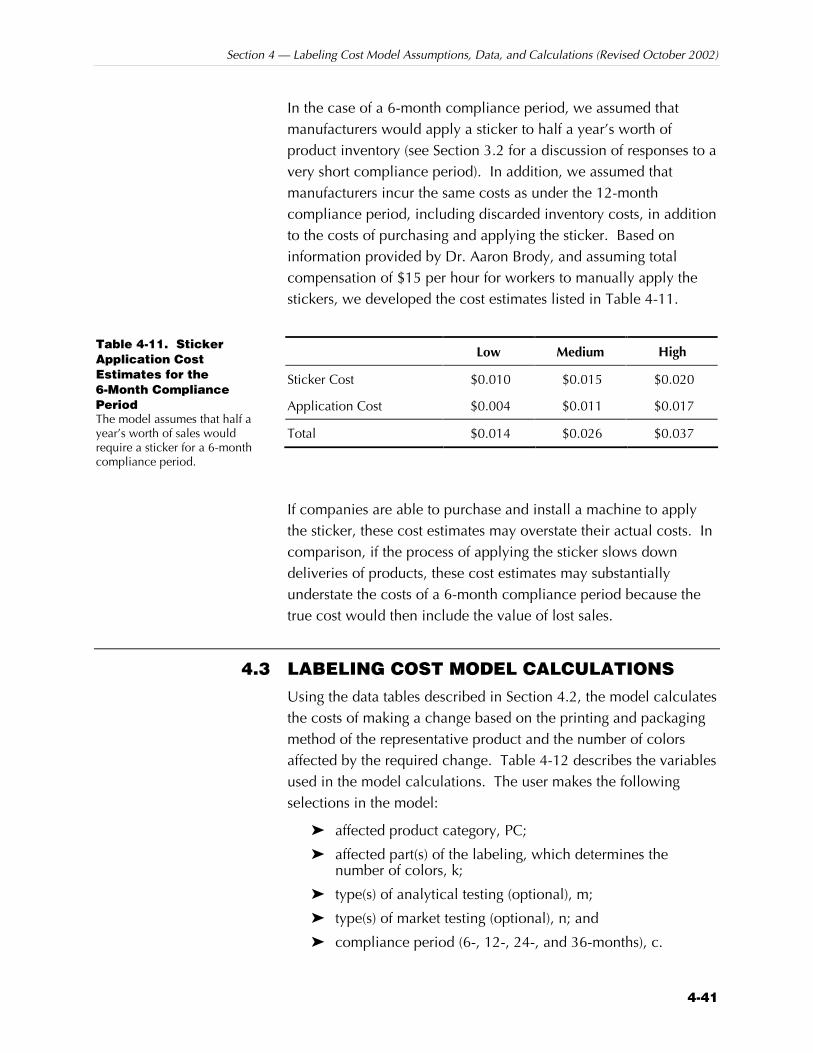
Section 4 — Labeling Cost Model Assumptions, Data, and Calculations (Revised October 2002)
4-41
In the case of a 6-month compliance period, we assumed that manufacturers would apply a sticker to half a year’s worth of product inventory (see Section 3.2 for a discussion of responses to a very short compliance period). In addition, we assumed that manufacturers incur the same costs as under the 12-month compliance period, including discarded inventory costs, in addition to the costs of purchasing and applying the sticker. Based on information provided by Dr. Aaron Brody, and assuming total compensation of $15 per hour for workers to manually apply the stickers, we developed the cost estimates listed in Table 4-11.
Low Medium High
Sticker Cost $0.010 $0.015 $0.020
Application Cost $0.004 $0.011 $0.017
Total $0.014 $0.026 $0.037
If companies are able to purchase and install a machine to apply the sticker, these cost estimates may overstate their actual costs. In comparison, if the process of applying the sticker slows down deliveries of products, these cost estimates may substantially understate the costs of a 6-month compliance period because the true cost would then include the value of lost sales.
4.3 LABELING COST MODEL CALCULATIONS Using the data tables described in Section 4.2, the model calculates the costs of making a change based on the printing and packaging method of the representative product and the number of colors affected by the required change. Table 4-12 describes the variables used in the model calculations. The user makes the following selections in the model:
Z affected product category, PC;
Z affected part(s) of the labeling, which determines the number of colors, k;
Z type(s) of analytical testing (optional), m;
Z type(s) of market testing (optional), n; and
Z compliance period (6-, 12-, 24-, and 36-months), c.
Table 4-11. Sticker Application Cost Estimates for the 6-Month Compliance Period The model assumes that half a year’s worth of sales would require a sticker for a 6-month compliance period.
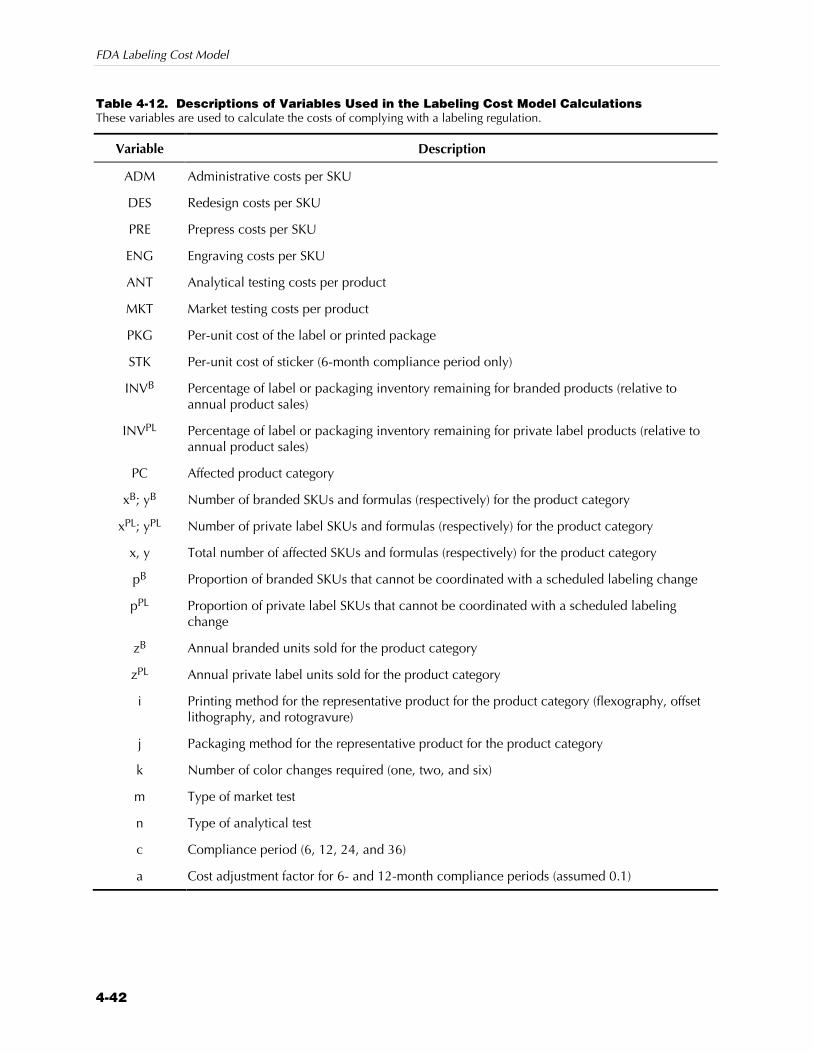
FDA Labeling Cost Model
4-42
Table 4-12. Descriptions of Variables Used in the Labeling Cost Model Calculations These variables are used to calculate the costs of complying with a labeling regulation.
Variable Description
ADM Administrative costs per SKU
DES Redesign costs per SKU
PRE Prepress costs per SKU
ENG Engraving costs per SKU
ANT Analytical testing costs per product
MKT Market testing costs per product
PKG Per-unit cost of the label or printed package
STK Per-unit cost of sticker (6-month compliance period only)
INVB Percentage of label or packaging inventory remaining for branded products (relative to annual product sales)
INVPL Percentage of label or packaging inventory remaining for private label products (relative to annual product sales)
PC Affected product category
xB; yB Number of branded SKUs and formulas (respectively) for the product category
xPL; yPL Number of private label SKUs and formulas (respectively) for the product category
x, y Total number of affected SKUs and formulas (respectively) for the product category
pB Proportion of branded SKUs that cannot be coordinated with a scheduled labeling change
pPL Proportion of private label SKUs that cannot be coordinated with a scheduled labeling change
zB Annual branded units sold for the product category
zPL Annual private label units sold for the product category
i Printing method for the representative product for the product category (flexography, offset lithography, and rotogravure)
j Packaging method for the representative product for the product category
k Number of color changes required (one, two, and six)
m Type of market test
n Type of analytical test
c Compliance period (6, 12, 24, and 36)
a Cost adjustment factor for 6- and 12-month compliance periods (assumed 0.1)
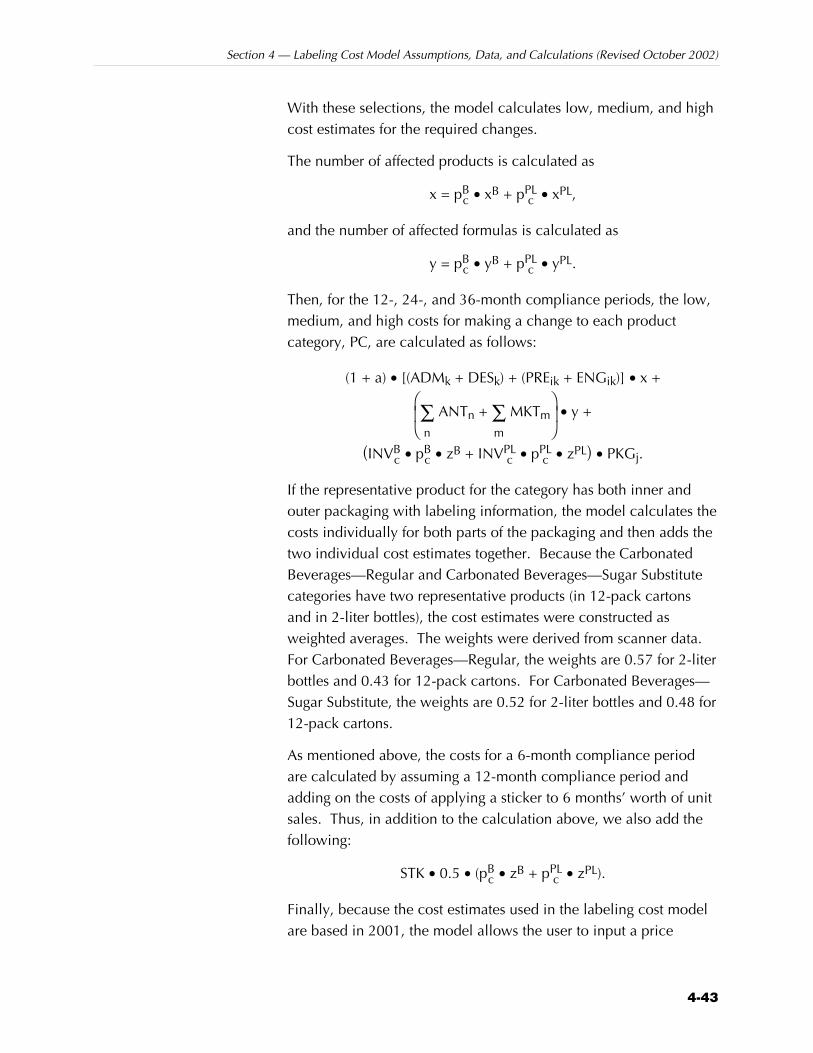
Section 4 — Labeling Cost Model Assumptions, Data, and Calculations (Revised October 2002)
4-43
With these selections, the model calculates low, medium, and high cost estimates for the required changes.
The number of affected products is calculated as
x = pBc • xB + pPL
c • xPL,
and the number of affected formulas is calculated as
y = pBc • yB + pPL
c • yPL.
Then, for the 12-, 24-, and 36-month compliance periods, the low, medium, and high costs for making a change to each product category, PC, are calculated as follows:
(1 + a) • [(ADMk + DESk) + (PREik + ENGik)] • x +
∑n
ANTn + ∑
m
MKTm • y +
(INVBc • pB
c • zB + INVPLc • pPL
c • zPL) • PKGj.
If the representative product for the category has both inner and outer packaging with labeling information, the model calculates the costs individually for both parts of the packaging and then adds the two individual cost estimates together. Because the Carbonated Beverages—Regular and Carbonated Beverages—Sugar Substitute categories have two representative products (in 12-pack cartons and in 2-liter bottles), the cost estimates were constructed as weighted averages. The weights were derived from scanner data. For Carbonated Beverages—Regular, the weights are 0.57 for 2-liter bottles and 0.43 for 12-pack cartons. For Carbonated Beverages—Sugar Substitute, the weights are 0.52 for 2-liter bottles and 0.48 for 12-pack cartons.
As mentioned above, the costs for a 6-month compliance period are calculated by assuming a 12-month compliance period and adding on the costs of applying a sticker to 6 months’ worth of unit sales. Thus, in addition to the calculation above, we also add the following:
STK • 0.5 • (pBc • zB + pPL
c • zPL).
Finally, because the cost estimates used in the labeling cost model are based in 2001, the model allows the user to input a price
FDA Labeling Cost Model
4-44
adjustment factor to account for inflation or discounting. If an adjustment factor is entered, all of the above costs are multiplied by the inflation factor.
4.4 REFERENCES Brody, A., Rubbright-Brody, Inc. July 2, 2001. Personal
communication with Mary Muth, RTI.
FedEx. February 1, 2001. “U.S. Rates: FedEx Priority Overnight®.” Excel spreadsheets. <http://rate.dmz.fedex.com/us/rates/downloads/#eservice>.
Nutrition Business Journal. 2000. “U.S. Nutrition Industry, 1994-2000, Products & Channels.”
U.S. Department of Labor, Bureau of Labor Statistics. June 29, 2001. “Employer Costs for Employee Compensation—March 2001.” USDL: 01-194.
White, W.J., E.C. Gledhill, S.A. Karns, and M.K. Muth. July 2002. “Cost of Reformulating Foods and Cosmetics.” Report prepared for FDA/CFSAN. Research Triangle Park, NC: RTI.
5-1
Instructions for Using the Labeling 5 Cost Model
In this section, we describe the procedures for obtaining cost estimates using the labeling cost model. The data sets that form the core of the model are in Stata for Windows, and the interface is in Microsoft Excel. Once the user chooses the options for running the model, the program executes in Stata for Windows and returns the results in an Excel spreadsheet. The advantage to maintaining the data sets in Stata for Windows is that the user can conduct any additional types of desired analyses within Stata for Windows without converting the data sets from another format. While running the model, the user will not work directly in the Stata for Windows environment.
5.1 PREPARING TO RUN THE MODEL Prior to running the labeling cost model, you must install the program files on your personal computer. To install the program files, you will need to do the following:
1. Create a folder on your hard disk called C:\Labels.
2. Copy the following files into the C:\Labels folder:
X the Excel interface file: label model.xls
X the Stata data files: product.dta, inventory.dta, print.dta, market.dta, package.dta, label.dta, sticker.dta, and analytical.dta
X the Stata program file: label.do

FDA Labeling Cost Model
5-2
In Section 5.2, we provide instructions for running the model. However, prior to running the model, it may be useful to review the process by which the model runs. The process is as follows:
Z The user opens the Excel interface (label model.xls) and chooses the model inputs.
Z The Excel interface outputs the model inputs into a text file in the C:\Labels folder, calls up the Stata for Windows program, and waits for an output file.
Z The Stata for Windows program (label.do) reads the text file of user inputs, calculates the labeling cost estimates, and outputs a tab-delimited text file called allcosts.out into the C:\Labels folder.
Z The Excel interface program opens the allcosts.out file and dumps the cost estimates into the Data sheet and dumps the user inputs into the Inputs sheet.
Z The Excel program creates the following two pivot tables (each on a separate sheet):
X Aggregate Costs, which displays the total low, medium, and high cost estimates by product category, and
X All Costs, which displays the detailed low, medium, and high cost estimates for each product.
5.2 SELECTING MODEL INPUTS To select the inputs for running the labeling cost model, open the Excel file label model.xls. Once the model has opened, click [Start Labeling Cost Model] and the Main Menu screen will appear (see Figure 5-1). This menu will guide you through the process of choosing the inputs for the model. You may click [Cancel] on the Main Menu to exit the model at any time, and you may click [Reset All Selections] to clear all of your selections on every menu. You may click the [More Info] buttons on the right side of the Main Menu or at the bottom of each input menu to learn more about each of the model inputs.
You may select product categories sorted by Product Type OR by NAICS code. If you select categories sorted by one method, you will be able to view the other menu, but you will not be able to select by the other method unless you clear your previous choices.
To choose the affected product categories by Product Type:
Z Click [Select by Type].
Step 1: Open the file label model.xls by double-clicking on the file name.
Step 2: Choose affected product categories sorted by either: Z Product types
Z NAICS codes
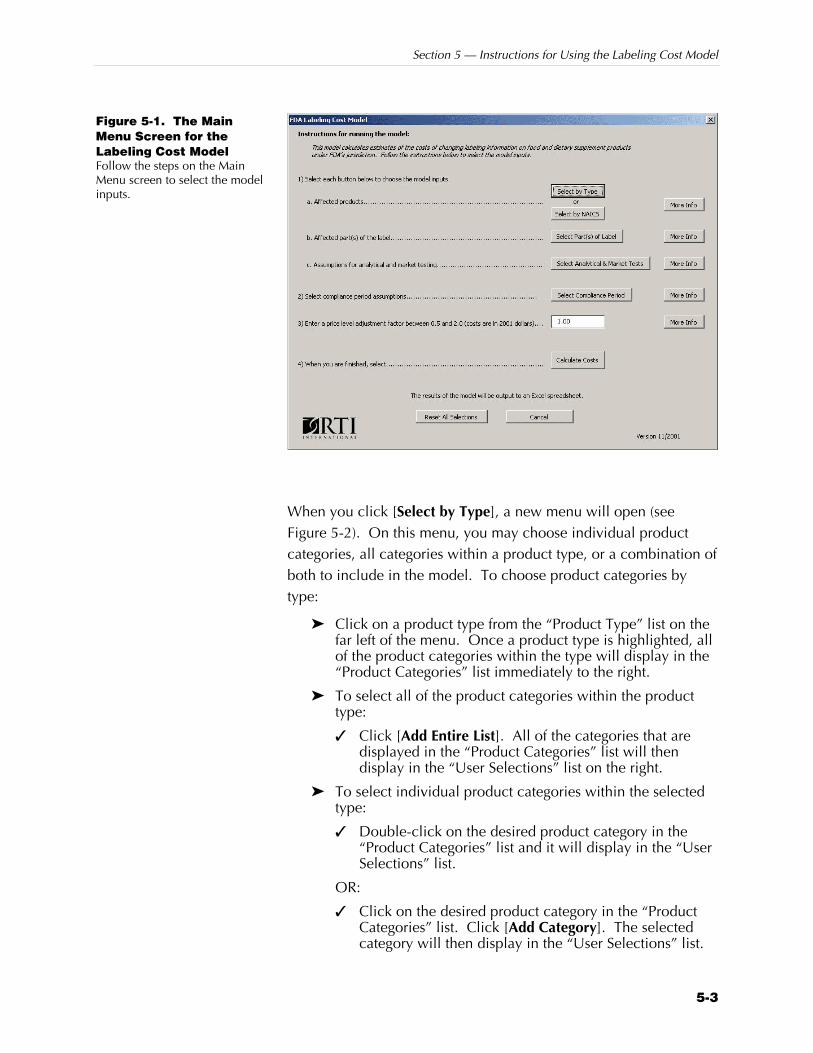
Section 5 — Instructions for Using the Labeling Cost Model
5-3
When you click [Select by Type], a new menu will open (see Figure 5-2). On this menu, you may choose individual product categories, all categories within a product type, or a combination of both to include in the model. To choose product categories by type:
Z Click on a product type from the “Product Type” list on the far left of the menu. Once a product type is highlighted, all of the product categories within the type will display in the “Product Categories” list immediately to the right.
Z To select all of the product categories within the product type:
X Click [Add Entire List]. All of the categories that are displayed in the “Product Categories” list will then display in the “User Selections” list on the right.
Z To select individual product categories within the selected type:
X Double-click on the desired product category in the “Product Categories” list and it will display in the “User Selections” list.
OR:
X Click on the desired product category in the “Product Categories” list. Click [Add Category]. The selected category will then display in the “User Selections” list.
Figure 5-1. The Main Menu Screen for the Labeling Cost Model Follow the steps on the Main Menu screen to select the model inputs.
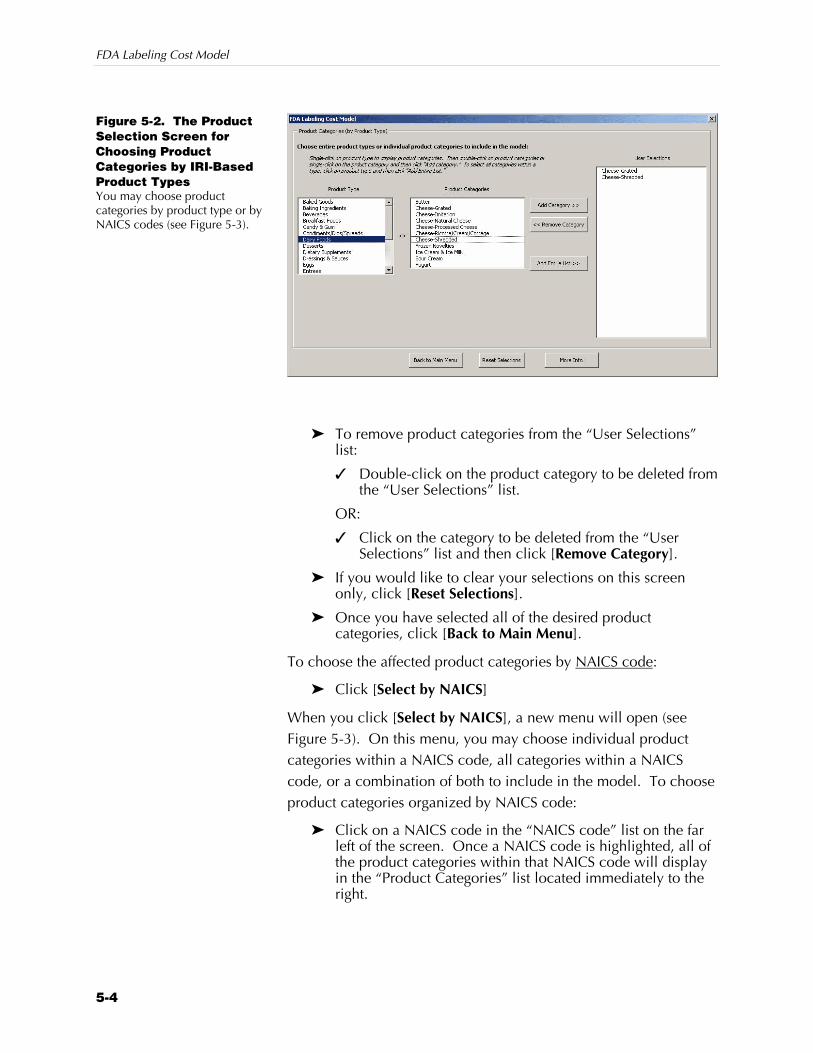
FDA Labeling Cost Model
5-4
Z To remove product categories from the “User Selections” list:
X Double-click on the product category to be deleted from the “User Selections” list.
OR:
X Click on the category to be deleted from the “User Selections” list and then click [Remove Category].
Z If you would like to clear your selections on this screen only, click [Reset Selections].
Z Once you have selected all of the desired product categories, click [Back to Main Menu].
To choose the affected product categories by NAICS code:
Z Click [Select by NAICS]
When you click [Select by NAICS], a new menu will open (see Figure 5-3). On this menu, you may choose individual product categories within a NAICS code, all categories within a NAICS code, or a combination of both to include in the model. To choose product categories organized by NAICS code:
Z Click on a NAICS code in the “NAICS code” list on the far left of the screen. Once a NAICS code is highlighted, all of the product categories within that NAICS code will display in the “Product Categories” list located immediately to the right.
Figure 5-2. The Product Selection Screen for Choosing Product Categories by IRI-Based Product Types You may choose product categories by product type or by NAICS codes (see Figure 5-3).
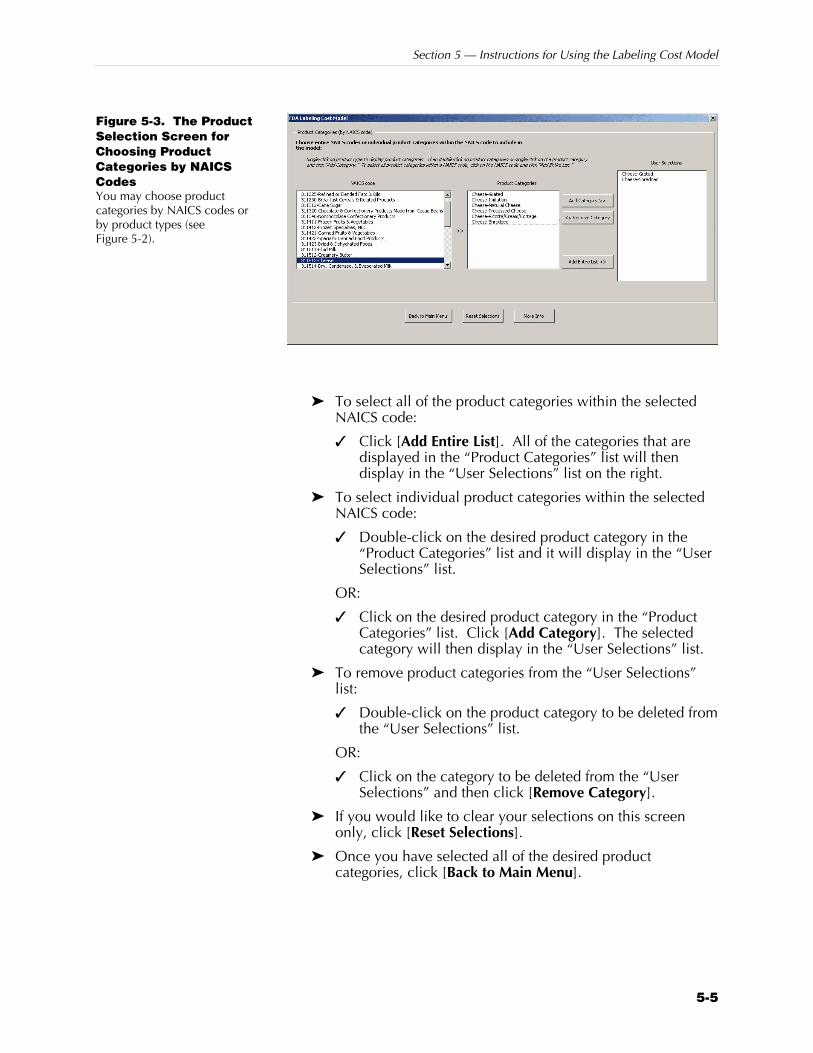
Section 5 — Instructions for Using the Labeling Cost Model
5-5
Z To select all of the product categories within the selected NAICS code:
X Click [Add Entire List]. All of the categories that are displayed in the “Product Categories” list will then display in the “User Selections” list on the right.
Z To select individual product categories within the selected NAICS code:
X Double-click on the desired product category in the “Product Categories” list and it will display in the “User Selections” list.
OR:
X Click on the desired product category in the “Product Categories” list. Click [Add Category]. The selected category will then display in the “User Selections” list.
Z To remove product categories from the “User Selections” list:
X Double-click on the product category to be deleted from the “User Selections” list.
OR:
X Click on the category to be deleted from the “User Selections” and then click [Remove Category].
Z If you would like to clear your selections on this screen only, click [Reset Selections].
Z Once you have selected all of the desired product categories, click [Back to Main Menu].
Figure 5-3. The Product Selection Screen for Choosing Product Categories by NAICS Codes You may choose product categories by NAICS codes or by product types (see Figure 5-2).
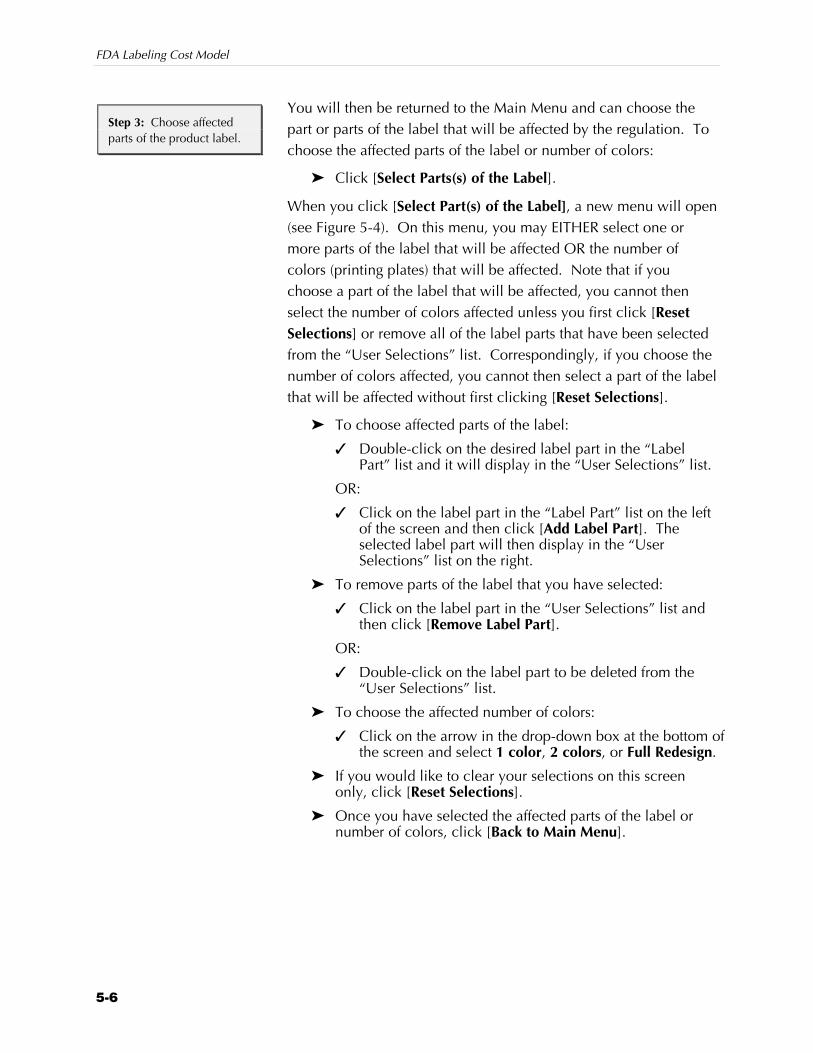
FDA Labeling Cost Model
5-6
You will then be returned to the Main Menu and can choose the part or parts of the label that will be affected by the regulation. To choose the affected parts of the label or number of colors:
Z Click [Select Parts(s) of the Label].
When you click [Select Part(s) of the Label], a new menu will open (see Figure 5-4). On this menu, you may EITHER select one or more parts of the label that will be affected OR the number of colors (printing plates) that will be affected. Note that if you choose a part of the label that will be affected, you cannot then select the number of colors affected unless you first click [Reset Selections] or remove all of the label parts that have been selected from the “User Selections” list. Correspondingly, if you choose the number of colors affected, you cannot then select a part of the label that will be affected without first clicking [Reset Selections].
Z To choose affected parts of the label:
X Double-click on the desired label part in the “Label Part” list and it will display in the “User Selections” list.
OR:
X Click on the label part in the “Label Part” list on the left of the screen and then click [Add Label Part]. The selected label part will then display in the “User Selections” list on the right.
Z To remove parts of the label that you have selected:
X Click on the label part in the “User Selections” list and then click [Remove Label Part].
OR:
X Double-click on the label part to be deleted from the “User Selections” list.
Z To choose the affected number of colors:
X Click on the arrow in the drop-down box at the bottom of the screen and select 1 color, 2 colors, or Full Redesign.
Z If you would like to clear your selections on this screen only, click [Reset Selections].
Z Once you have selected the affected parts of the label or number of colors, click [Back to Main Menu].
Step 3: Choose affected parts of the product label.

Section 5 — Instructions for Using the Labeling Cost Model
5-7
You will again be returned to the Main Menu and can then select analytical or market tests. You may also enter a cost for any analytical tests that are not included in the “Analytical Tests” list. If these options are not applicable for the proposed regulation, you can skip this step.
To include analytical test or market test costs:
Z Click [Select Analytical and Market Tests]
When you click [Select Analytical and Market Tests], a new menu will open (see Figure 5-5). On this menu, you may choose individual or multiple analytical or market tests.
Z To include analytical tests:
X Double-click on the desired test in the “Analytical Tests” list and it will display in the “User Selections” list.
OR:
X Click on the test in the “Analytical Tests” list and then click [Add Analytical Test]. The selected analytical test will then display in the “User Selections” list to the right.
Figure 5-4. The Affected Parts of Label Screen You may choose one or more affected parts of the label or the number of affected colors.
Step 4: Choose analytical and market tests (optional).
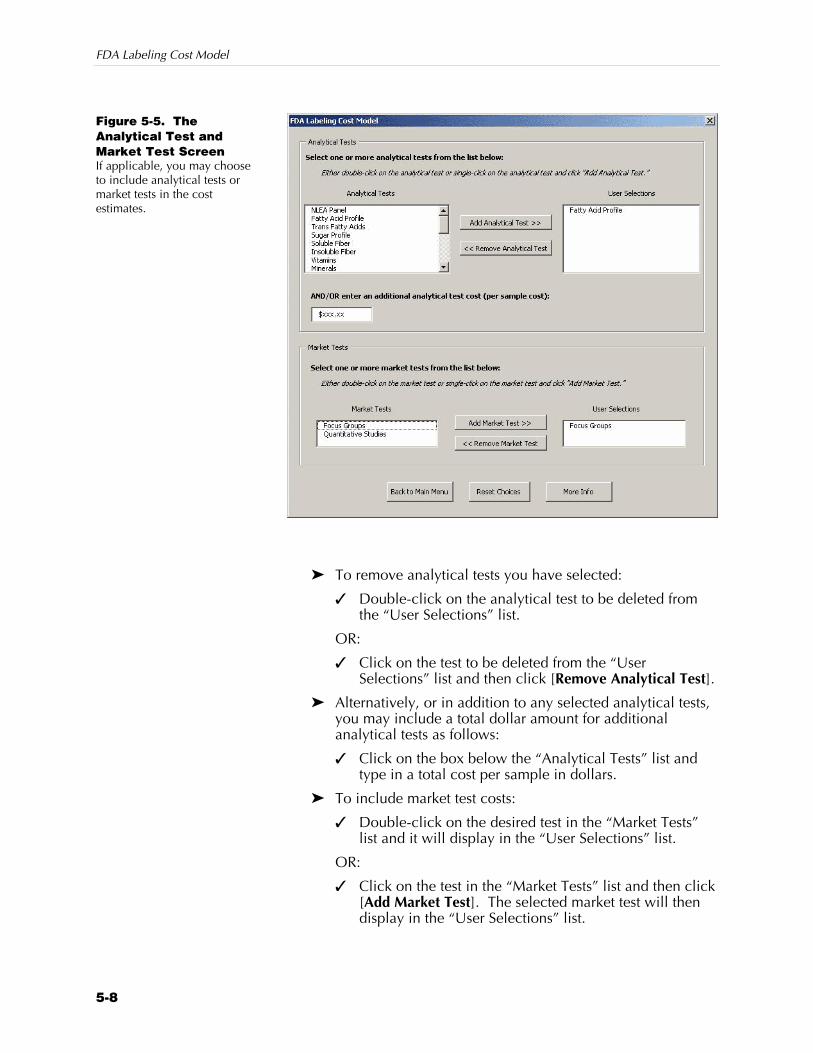
FDA Labeling Cost Model
5-8
Z To remove analytical tests you have selected:
X Double-click on the analytical test to be deleted from the “User Selections” list.
OR:
X Click on the test to be deleted from the “User Selections” list and then click [Remove Analytical Test].
Z Alternatively, or in addition to any selected analytical tests, you may include a total dollar amount for additional analytical tests as follows:
X Click on the box below the “Analytical Tests” list and type in a total cost per sample in dollars.
Z To include market test costs:
X Double-click on the desired test in the “Market Tests” list and it will display in the “User Selections” list.
OR:
X Click on the test in the “Market Tests” list and then click [Add Market Test]. The selected market test will then display in the “User Selections” list.
Figure 5-5. The Analytical Test and Market Test Screen If applicable, you may choose to include analytical tests or market tests in the cost estimates.
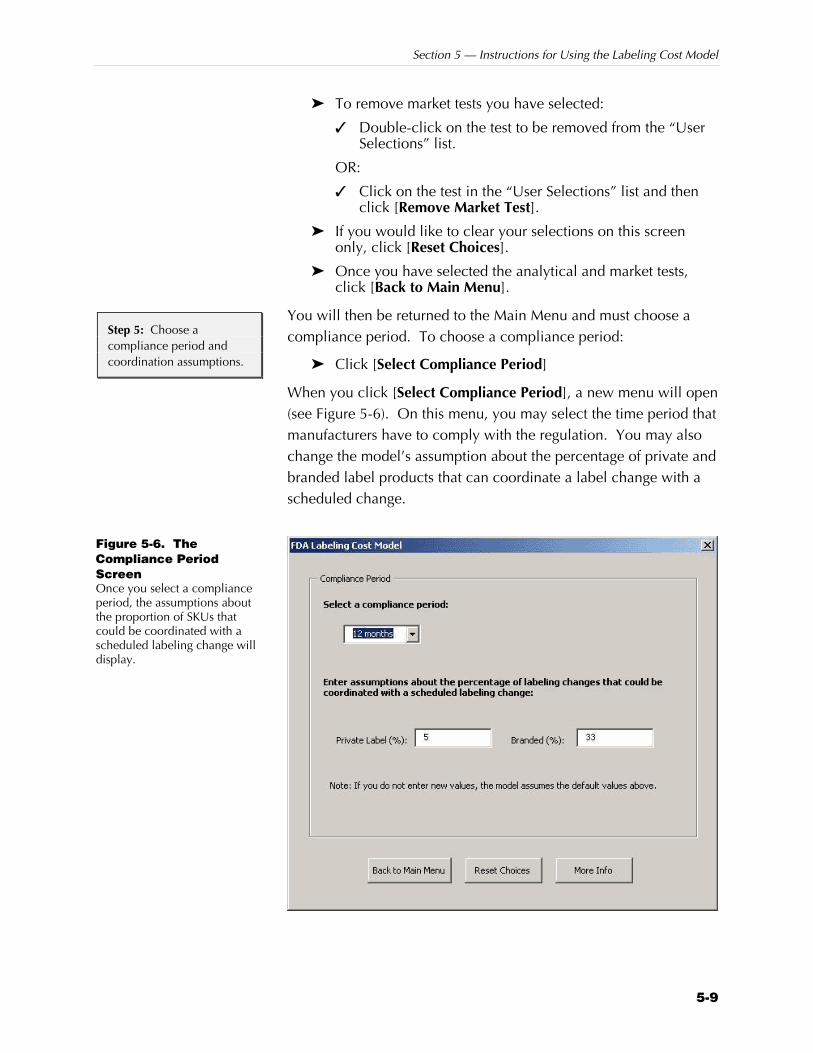
Section 5 — Instructions for Using the Labeling Cost Model
5-9
Z To remove market tests you have selected:
X Double-click on the test to be removed from the “User Selections” list.
OR:
X Click on the test in the “User Selections” list and then click [Remove Market Test].
Z If you would like to clear your selections on this screen only, click [Reset Choices].
Z Once you have selected the analytical and market tests, click [Back to Main Menu].
You will then be returned to the Main Menu and must choose a compliance period. To choose a compliance period:
Z Click [Select Compliance Period]
When you click [Select Compliance Period], a new menu will open (see Figure 5-6). On this menu, you may select the time period that manufacturers have to comply with the regulation. You may also change the model’s assumption about the percentage of private and branded label products that can coordinate a label change with a scheduled change.
Step 5: Choose a compliance period and coordination assumptions.
Figure 5-6. The Compliance Period Screen Once you select a compliance period, the assumptions about the proportion of SKUs that could be coordinated with a scheduled labeling change will display.
FDA Labeling Cost Model
5-10
Z To select a compliance period, choose 6 months, 12 months, 24 months, or 36 months from the drop-down box.
Z The coordination assumptions for the selected compliance period will then display. To change those assumptions click on each box and enter a new percentage for private and/or branded label products.
Z If you would like to clear your selections on this screen only, click [Reset Choices].
Z Once you have selected the compliance period, click [Back to Main Menu].
You will again be returned to the Main Menu and may now select a price adjustment factor. If you are running the model to estimate costs in a year beyond 2001, you may wish to enter an inflation factor. To enter an inflation factor:
Z Click on the price adjustment factor box and enter 1.xx where xx represents the total inflation factor beyond 2001. (By default, the inflation factor is set to 1.00.)
You may also wish to use the price adjustment factor to discount future changes back to the present. To enter a discount factor:
Z Click on the price adjustment factor box and enter a value between 0.5 and 1.0
Finally, once you have made all of your selections:
Z Click [Calculate Costs] at the bottom of the screen.
The model will then calculate the cost estimates in Stata for Windows and return the output as described below.
5.3 OUTPUTS OF THE MODEL Once you have run the labeling cost model, it generates four separate sheets in the file allcosts.out. We describe each of these sheets below.
The Inputs sheet displays the user’s choices in running the model. These inputs, described in Section 5.2, include the following (see Figure 5-7):
Z product categories,
Z compliance period and the proportion of private and branded label products that can coordinate a label change with a scheduled change,
Z parts of the label changed (or number of colors affected),
Step 6: Enter a price adjustment factor (optional).
Step 7: Calculate costs.
The Inputs sheet displays the user’s choices that were used to generate the cost estimates and also descriptive information about the representative products.

Section 5 — Instructions for Using the Labeling Cost Model
5-11
Figure 5-7. The Inputs Sheet of the Labeling Cost Model Output The Inputs sheet displays the user’s selections and provides information on the representative products.
Z analytical tests and any additional analytical test costs, and
Z market tests.
This sheet also displays information about the representative product for each category, including the printing method and packaging or labeling method.
The Aggregate Costs sheet displays the following results of the labeling cost model (see Figure 5-8):
Z product types (if the user selected product categories by type);
Z NAICS codes and NAICS descriptions;
Z product categories;
Z Small Business Administration (SBA) size for the applicable NAICS code;
The Aggregate Costs sheet displays the low, medium, and high cost estimates for private label and branded products within each product category.
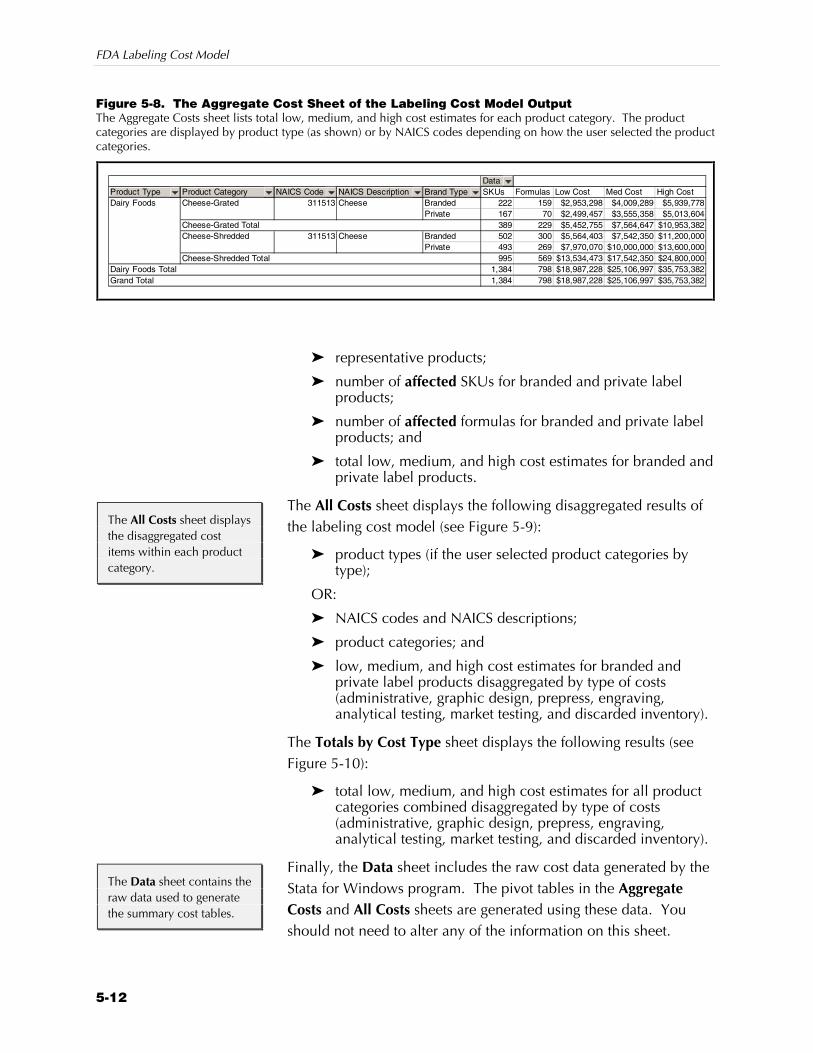
FDA Labeling Cost Model
5-12
Figure 5-8. The Aggregate Cost Sheet of the Labeling Cost Model Output The Aggregate Costs sheet lists total low, medium, and high cost estimates for each product category. The product categories are displayed by product type (as shown) or by NAICS codes depending on how the user selected the product categories.
DataProduct Type Product Category NAICS Code NAICS Description Brand Type SKUs Formulas Low Cost Med Cost High CostDairy Foods Cheese-Grated 311513 Cheese Branded 222 159 $2,953,298 $4,009,289 $5,939,778
Private 167 70 $2,499,457 $3,555,358 $5,013,604Cheese-Grated Total 389 229 $5,452,755 $7,564,647 $10,953,382Cheese-Shredded 311513 Cheese Branded 502 300 $5,564,403 $7,542,350 $11,200,000
Private 493 269 $7,970,070 $10,000,000 $13,600,000Cheese-Shredded Total 995 569 $13,534,473 $17,542,350 $24,800,000
Dairy Foods Total 1,384 798 $18,987,228 $25,106,997 $35,753,382Grand Total 1,384 798 $18,987,228 $25,106,997 $35,753,382
Z representative products;
Z number of affected SKUs for branded and private label products;
Z number of affected formulas for branded and private label products; and
Z total low, medium, and high cost estimates for branded and private label products.
The All Costs sheet displays the following disaggregated results of the labeling cost model (see Figure 5-9):
Z product types (if the user selected product categories by type);
OR:
Z NAICS codes and NAICS descriptions;
Z product categories; and
Z low, medium, and high cost estimates for branded and private label products disaggregated by type of costs (administrative, graphic design, prepress, engraving, analytical testing, market testing, and discarded inventory).
The Totals by Cost Type sheet displays the following results (see Figure 5-10):
Z total low, medium, and high cost estimates for all product categories combined disaggregated by type of costs (administrative, graphic design, prepress, engraving, analytical testing, market testing, and discarded inventory).
Finally, the Data sheet includes the raw cost data generated by the Stata for Windows program. The pivot tables in the Aggregate Costs and All Costs sheets are generated using these data. You should not need to alter any of the information on this sheet.
The All Costs sheet displays the disaggregated cost items within each product category.
The Data sheet contains the raw data used to generate the summary cost tables.
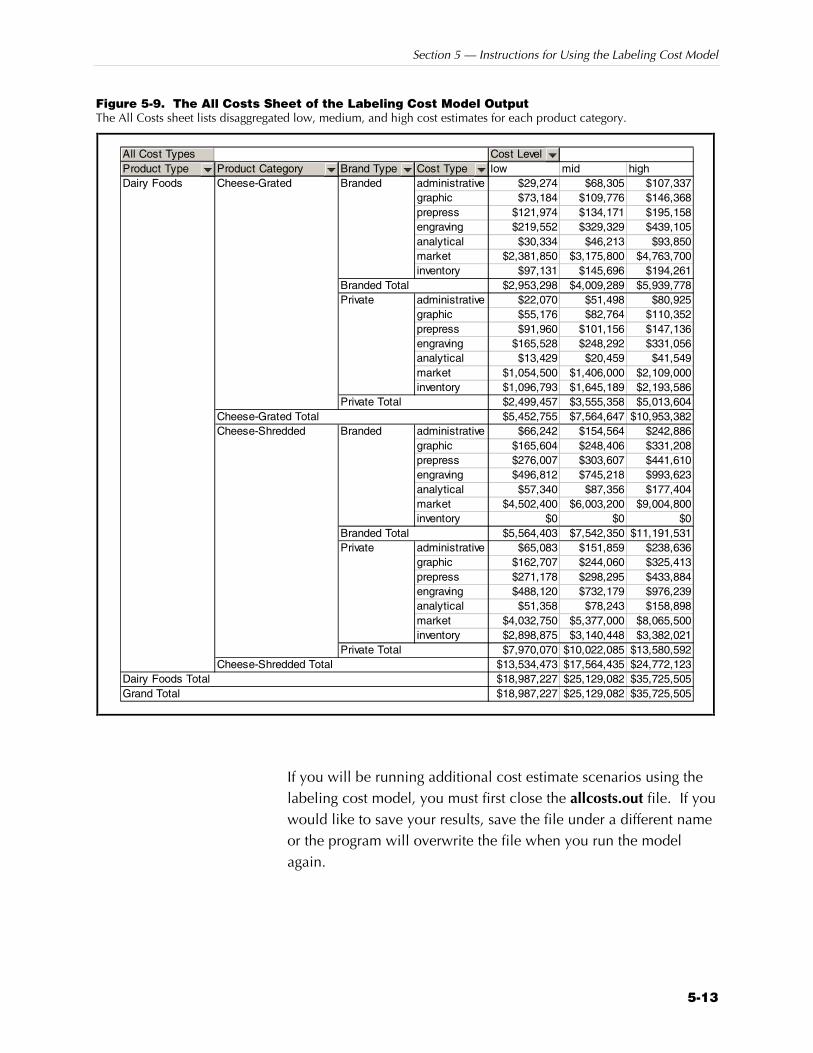
Section 5 — Instructions for Using the Labeling Cost Model
5-13
Figure 5-9. The All Costs Sheet of the Labeling Cost Model Output The All Costs sheet lists disaggregated low, medium, and high cost estimates for each product category.
All Cost Types Cost LevelProduct Type Product Category Brand Type Cost Type low mid highDairy Foods Cheese-Grated Branded administrative $29,274 $68,305 $107,337
graphic $73,184 $109,776 $146,368prepress $121,974 $134,171 $195,158engraving $219,552 $329,329 $439,105analytical $30,334 $46,213 $93,850market $2,381,850 $3,175,800 $4,763,700inventory $97,131 $145,696 $194,261
Branded Total $2,953,298 $4,009,289 $5,939,778Private administrative $22,070 $51,498 $80,925
graphic $55,176 $82,764 $110,352prepress $91,960 $101,156 $147,136engraving $165,528 $248,292 $331,056analytical $13,429 $20,459 $41,549market $1,054,500 $1,406,000 $2,109,000inventory $1,096,793 $1,645,189 $2,193,586
Private Total $2,499,457 $3,555,358 $5,013,604Cheese-Grated Total $5,452,755 $7,564,647 $10,953,382Cheese-Shredded Branded administrative $66,242 $154,564 $242,886
graphic $165,604 $248,406 $331,208prepress $276,007 $303,607 $441,610engraving $496,812 $745,218 $993,623analytical $57,340 $87,356 $177,404market $4,502,400 $6,003,200 $9,004,800inventory $0 $0 $0
Branded Total $5,564,403 $7,542,350 $11,191,531Private administrative $65,083 $151,859 $238,636
graphic $162,707 $244,060 $325,413prepress $271,178 $298,295 $433,884engraving $488,120 $732,179 $976,239analytical $51,358 $78,243 $158,898market $4,032,750 $5,377,000 $8,065,500inventory $2,898,875 $3,140,448 $3,382,021
Private Total $7,970,070 $10,022,085 $13,580,592Cheese-Shredded Total $13,534,473 $17,564,435 $24,772,123
Dairy Foods Total $18,987,227 $25,129,082 $35,725,505Grand Total $18,987,227 $25,129,082 $35,725,505
If you will be running additional cost estimate scenarios using the labeling cost model, you must first close the allcosts.out file. If you would like to save your results, save the file under a different name or the program will overwrite the file when you run the model again.
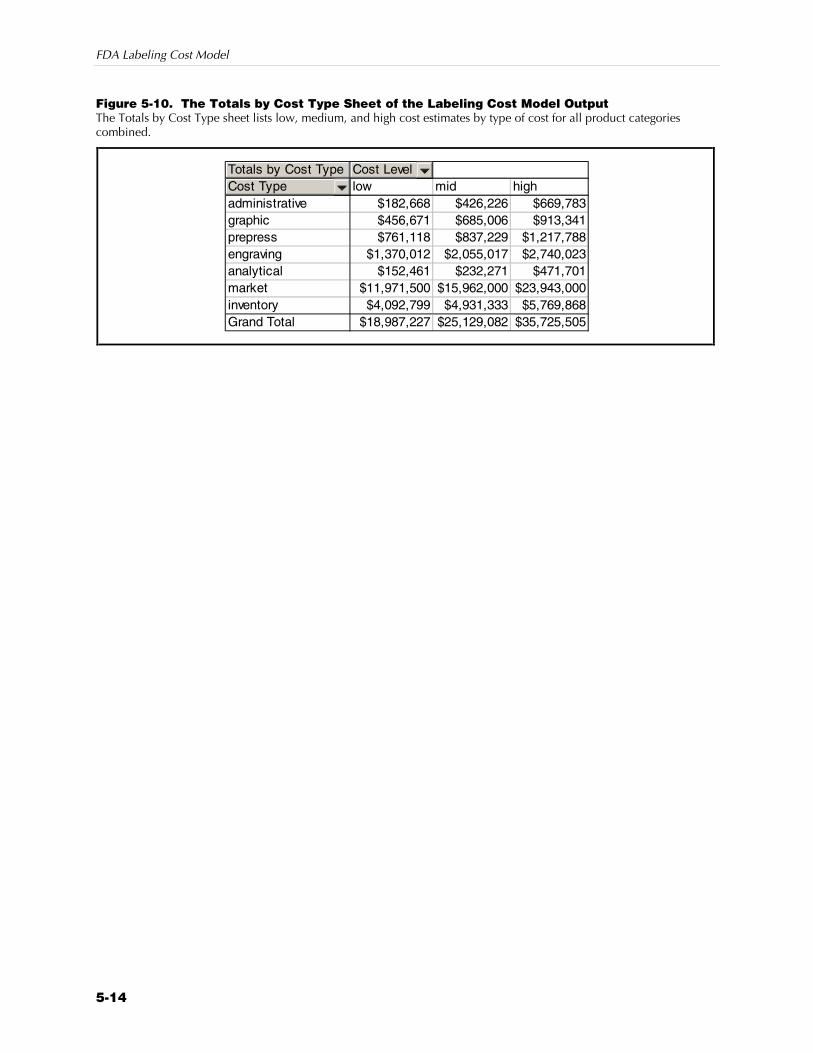
FDA Labeling Cost Model
5-14
Figure 5-10. The Totals by Cost Type Sheet of the Labeling Cost Model Output The Totals by Cost Type sheet lists low, medium, and high cost estimates by type of cost for all product categories combined.
Totals by Cost Type Cost LevelCost Type low mid highadministrative $182,668 $426,226 $669,783graphic $456,671 $685,006 $913,341prepress $761,118 $837,229 $1,217,788engraving $1,370,012 $2,055,017 $2,740,023analytical $152,461 $232,271 $471,701market $11,971,500 $15,962,000 $23,943,000inventory $4,092,799 $4,931,333 $5,769,868Grand Total $18,987,227 $25,129,082 $35,725,505
Appendix A: Additional Product-Level Tables
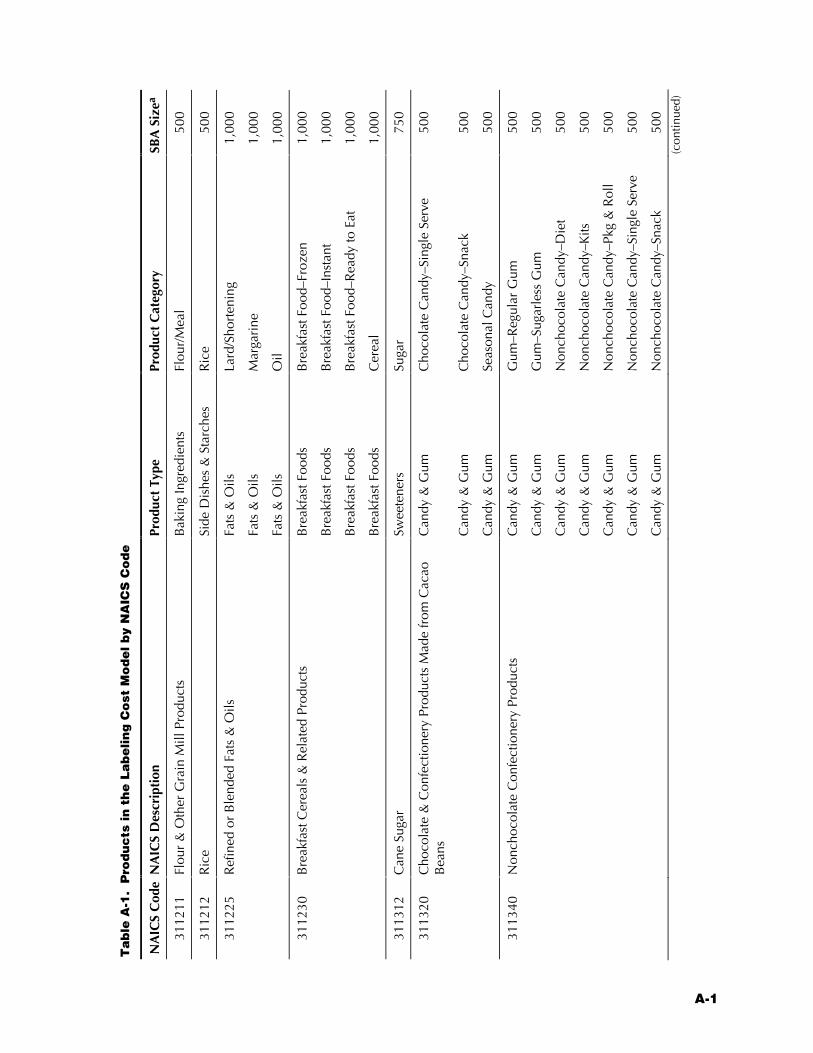
A-1
Ta
ble
A-1
. P
rod
uc
ts in
th
e L
ab
elin
g C
ost
Mo
de
l b
y N
AIC
S C
od
e
NA
ICS
Cod
e N
AIC
S D
escr
ipti
on
Prod
uct
Type
Pr
oduc
t C
ateg
ory
SBA
Siz
ea
3112
11
Flou
r &
Oth
er G
rain
Mill
Pro
duct
s B
akin
g In
gred
ient
s Fl
our/
Mea
l 50
0
3112
12
Ric
e Si
de D
ishe
s &
Sta
rche
s R
ice
500
3112
25
Ref
ined
or
Ble
nded
Fat
s &
Oils
Fa
ts &
Oils
La
rd/S
hort
enin
g 1,
000
Fats
& O
ils
Mar
gari
ne
1,00
0
Fats
& O
ils
Oil
1,00
0
3112
30
Bre
akfa
st C
erea
ls &
Rel
ated
Pro
duct
s B
reak
fast
Foo
ds
Bre
akfa
st F
ood–
Froz
en
1,00
0
Bre
akfa
st F
oods
B
reak
fast
Foo
d–In
stan
t 1,
000
Bre
akfa
st F
oods
B
reak
fast
Foo
d–R
eady
to E
at
1,00
0
Bre
akfa
st F
oods
C
erea
l 1,
000
3113
12
Can
e Su
gar
Swee
tene
rs
Suga
r 75
0
3113
20
Cho
cola
te &
Con
fect
ione
ry P
rodu
cts
Mad
e fr
om C
acao
B
eans
C
andy
& G
um
Cho
cola
te C
andy
–Sin
gle
Serv
e 50
0
Can
dy &
Gum
C
hoco
late
Can
dy–S
nack
50
0
Can
dy &
Gum
Se
ason
al C
andy
50
0
3113
40
Non
choc
olat
e C
onfe
ctio
nery
Pro
duct
s C
andy
& G
um
Gum
–Reg
ular
Gum
50
0
Can
dy &
Gum
G
um–S
ugar
less
Gum
50
0
Can
dy &
Gum
N
onch
ocol
ate
Can
dy–D
iet
500
Can
dy &
Gum
N
onch
ocol
ate
Can
dy–K
its
500
Can
dy &
Gum
N
onch
ocol
ate
Can
dy–P
kg &
Rol
l 50
0
Can
dy &
Gum
N
onch
ocol
ate
Can
dy–S
ingl
e Se
rve
500
Can
dy &
Gum
N
onch
ocol
ate
Can
dy–S
nack
50
0 (c
ontin
ued)
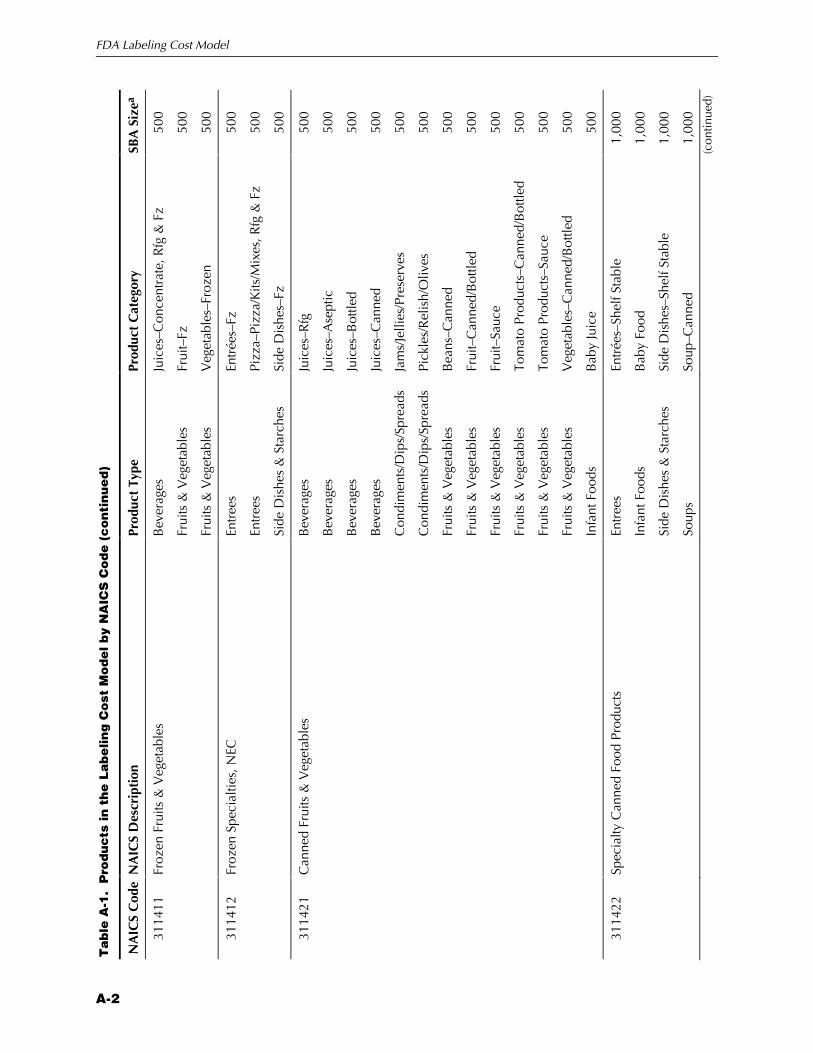
FDA Labeling Cost Model
A-2
Ta
ble
A-1
. P
rod
uc
ts in
th
e L
ab
elin
g C
ost
Mo
de
l b
y N
AIC
S C
od
e (
co
nti
nu
ed
)
NA
ICS
Cod
e N
AIC
S D
escr
ipti
on
Prod
uct
Type
Pr
oduc
t C
ateg
ory
SBA
Siz
ea
3114
11
Froz
en F
ruits
& V
eget
able
s B
ever
ages
Ju
ices
–Con
cent
rate
, Rfg
& F
z 50
0
Frui
ts &
Veg
etab
les
Frui
t–Fz
50
0
Frui
ts &
Veg
etab
les
Veg
etab
les–
Froz
en
500
3114
12
Froz
en S
peci
altie
s, N
EC
Entr
ees
Entr
ées–
Fz
500
Entr
ees
Pizz
a–Pi
zza/
Kits
/Mix
es, R
fg &
Fz
500
Side
Dis
hes
& S
tarc
hes
Side
Dis
hes–
Fz
500
3114
21
Can
ned
Frui
ts &
Veg
etab
les
Bev
erag
es
Juic
es–R
fg
500
Bev
erag
es
Juic
es–A
sept
ic
500
Bev
erag
es
Juic
es–B
ottle
d 50
0
Bev
erag
es
Juic
es–C
anne
d 50
0
Con
dim
ents
/Dip
s/Sp
read
s Ja
ms/
Jelli
es/P
rese
rves
50
0
Con
dim
ents
/Dip
s/Sp
read
s Pi
ckle
s/R
elis
h/O
lives
50
0
Frui
ts &
Veg
etab
les
Bea
ns–C
anne
d 50
0
Frui
ts &
Veg
etab
les
Frui
t–C
anne
d/B
ottle
d 50
0
Frui
ts &
Veg
etab
les
Frui
t–Sa
uce
500
Frui
ts &
Veg
etab
les
Tom
ato
Prod
ucts
–Can
ned/
Bot
tled
500
Frui
ts &
Veg
etab
les
Tom
ato
Prod
ucts
–Sau
ce
500
Frui
ts &
Veg
etab
les
Veg
etab
les–
Can
ned/
Bot
tled
500
Infa
nt F
oods
B
aby
Juic
e 50
0
3114
22
Spec
ialty
Can
ned
Food
Pro
duct
s En
tree
s En
trée
s–Sh
elf S
tabl
e 1,
000
Infa
nt F
oods
B
aby
Food
1,
000
Side
Dis
hes
& S
tarc
hes
Side
Dis
hes–
Shel
f Sta
ble
1,00
0
Soup
s So
up–C
anne
d 1,
000
(con
tinue
d)
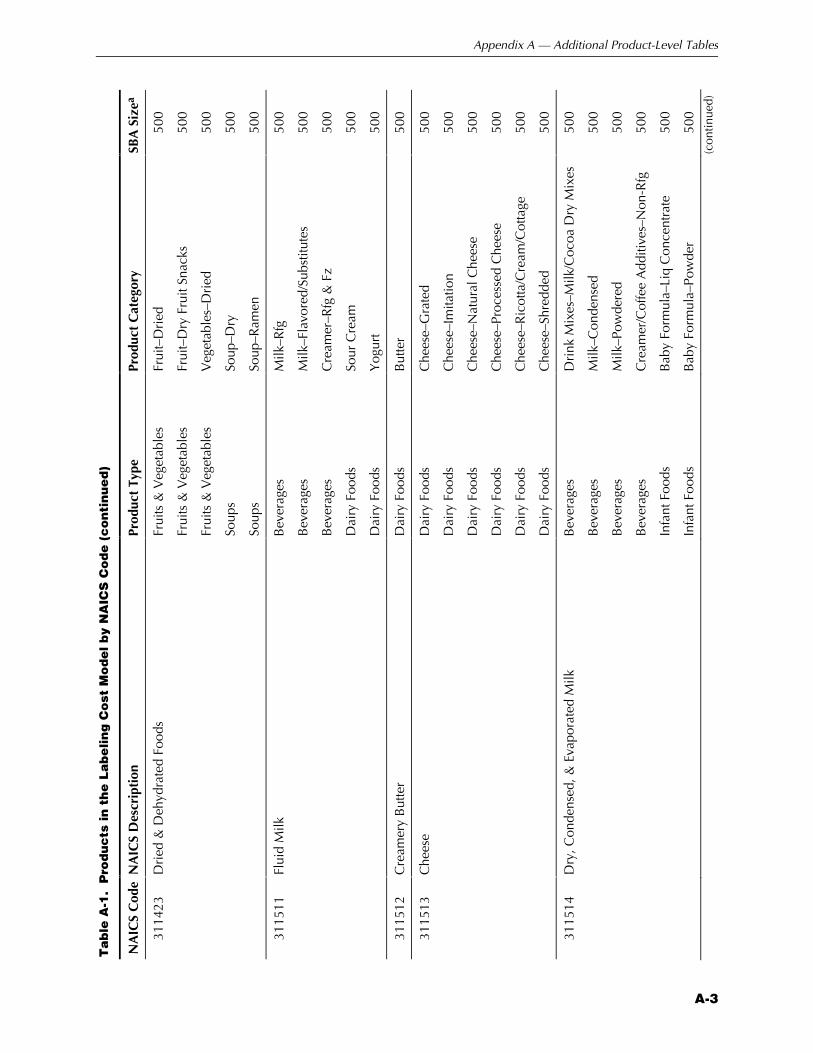
Appendix A — Additional Product-Level Tables
A-3
Ta
ble
A-1
. P
rod
uc
ts in
th
e L
ab
elin
g C
ost
Mo
de
l b
y N
AIC
S C
od
e (
co
nti
nu
ed
)
NA
ICS
Cod
e N
AIC
S D
escr
ipti
on
Prod
uct
Type
Pr
oduc
t C
ateg
ory
SBA
Siz
ea
3114
23
Dri
ed &
Deh
ydra
ted
Food
s Fr
uits
& V
eget
able
s Fr
uit–
Dri
ed
500
Frui
ts &
Veg
etab
les
Frui
t–D
ry F
ruit
Snac
ks
500
Frui
ts &
Veg
etab
les
Veg
etab
les–
Dri
ed
500
Soup
s So
up–D
ry
500
Soup
s So
up–R
amen
50
0
3115
11
Flui
d M
ilk
Bev
erag
es
Milk
–Rfg
50
0
Bev
erag
es
Milk
–Fla
vore
d/Su
bstit
utes
50
0
Bev
erag
es
Cre
amer
–Rfg
& F
z 50
0
Dai
ry F
oods
So
ur C
ream
50
0
Dai
ry F
oods
Y
ogur
t 50
0
3115
12
Cre
amer
y B
utte
r D
airy
Foo
ds
But
ter
500
3115
13
Che
ese
Dai
ry F
oods
C
hees
e–G
rate
d
500
Dai
ry F
oods
C
hees
e–Im
itatio
n 50
0
Dai
ry F
oods
C
hees
e–N
atur
al C
hees
e 50
0
Dai
ry F
oods
C
hees
e–Pr
oces
sed
Che
ese
500
Dai
ry F
oods
C
hees
e–R
icot
ta/C
ream
/Cot
tage
50
0
Dai
ry F
oods
C
hees
e–Sh
redd
ed
500
3115
14
Dry
, Con
dens
ed, &
Eva
pora
ted
Milk
B
ever
ages
D
rink
Mix
es–M
ilk/C
ocoa
Dry
Mix
es
500
Bev
erag
es
Milk
–Con
dens
ed
500
Bev
erag
es
Milk
–Pow
dere
d 50
0
Bev
erag
es
Cre
amer
/Cof
fee
Add
itive
s–N
on-R
fg
500
Infa
nt F
oods
B
aby
Form
ula–
Liq
Con
cent
rate
50
0
Infa
nt F
oods
B
aby
Form
ula–
Pow
der
500
(con
tinue
d)
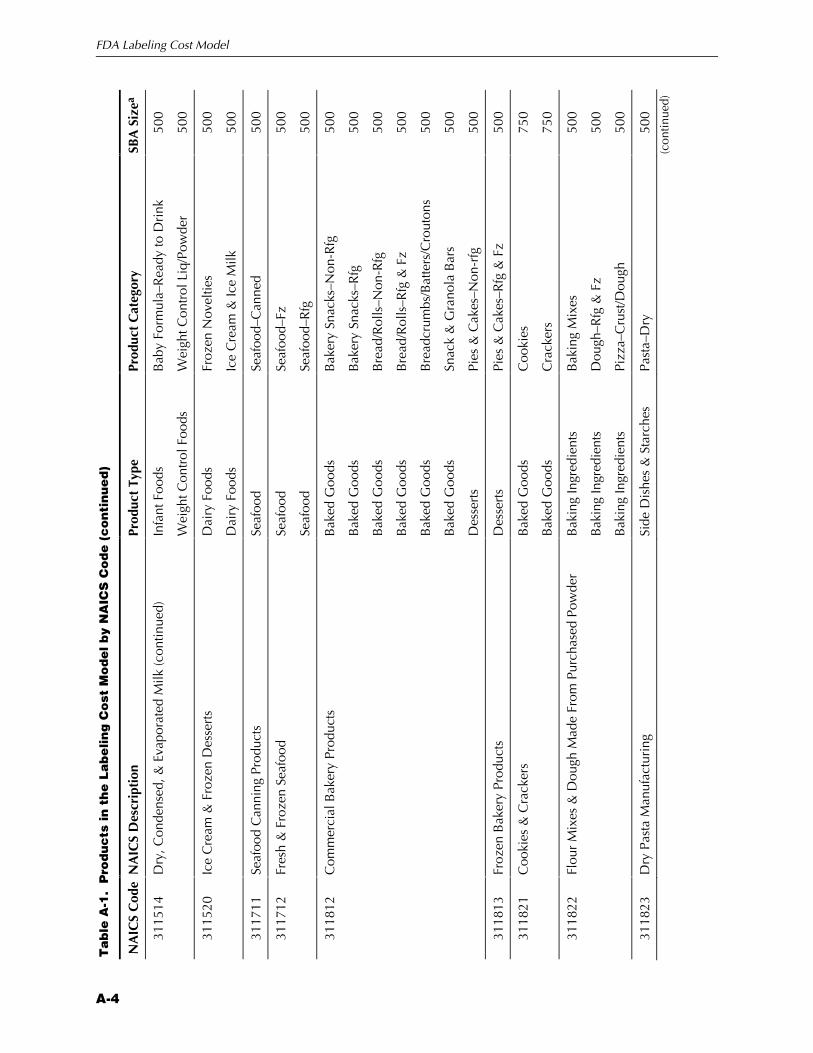
FDA Labeling Cost Model
A-4
Ta
ble
A-1
. P
rod
uc
ts in
th
e L
ab
elin
g C
ost
Mo
de
l b
y N
AIC
S C
od
e (
co
nti
nu
ed
)
NA
ICS
Cod
e N
AIC
S D
escr
ipti
on
Prod
uct
Type
Pr
oduc
t C
ateg
ory
SBA
Siz
ea
3115
14
Dry
, Con
dens
ed, &
Eva
pora
ted
Milk
(con
tinue
d)
Infa
nt F
oods
B
aby
Form
ula–
Rea
dy to
Dri
nk
500
Wei
ght C
ontr
ol F
oods
W
eigh
t Con
trol
Liq
/Pow
der
500
3115
20
Ice
Cre
am &
Fro
zen
Des
sert
s D
airy
Foo
ds
Froz
en N
ovel
ties
500
Dai
ry F
oods
Ic
e C
ream
& Ic
e M
ilk
500
3117
11
Seaf
ood
Can
ning
Pro
duct
s Se
afoo
d Se
afoo
d–C
anne
d 50
0
3117
12
Fres
h &
Fro
zen
Seaf
ood
Seaf
ood
Seaf
ood–
Fz
500
Seaf
ood
Seaf
ood–
Rfg
50
0
3118
12
Com
mer
cial
Bak
ery
Prod
ucts
B
aked
Goo
ds
Bak
ery
Snac
ks–N
on-R
fg
500
Bak
ed G
oods
B
aker
y Sn
acks
–Rfg
50
0
Bak
ed G
oods
B
read
/Rol
ls–N
on-R
fg
500
Bak
ed G
oods
B
read
/Rol
ls–R
fg &
Fz
500
Bak
ed G
oods
B
read
crum
bs/B
atte
rs/C
rout
ons
500
Bak
ed G
oods
Sn
ack
& G
rano
la B
ars
500
Des
sert
s Pi
es &
Cak
es–N
on-r
fg
500
3118
13
Froz
en B
aker
y Pr
oduc
ts
Des
sert
s Pi
es &
Cak
es–R
fg &
Fz
500
3118
21
Coo
kies
& C
rack
ers
Bak
ed G
oods
C
ooki
es
750
Bak
ed G
oods
C
rack
ers
750
3118
22
Flou
r M
ixes
& D
ough
Mad
e Fr
om P
urch
ased
Pow
der
Bak
ing
Ingr
edie
nts
Bak
ing
Mix
es
500
Bak
ing
Ingr
edie
nts
Dou
gh–R
fg &
Fz
500
Bak
ing
Ingr
edie
nts
Pizz
a–C
rust
/Dou
gh
500
3118
23
Dry
Pas
ta M
anuf
actu
ring
Si
de D
ishe
s &
Sta
rche
s Pa
sta–
Dry
50
0 (c
ontin
ued)
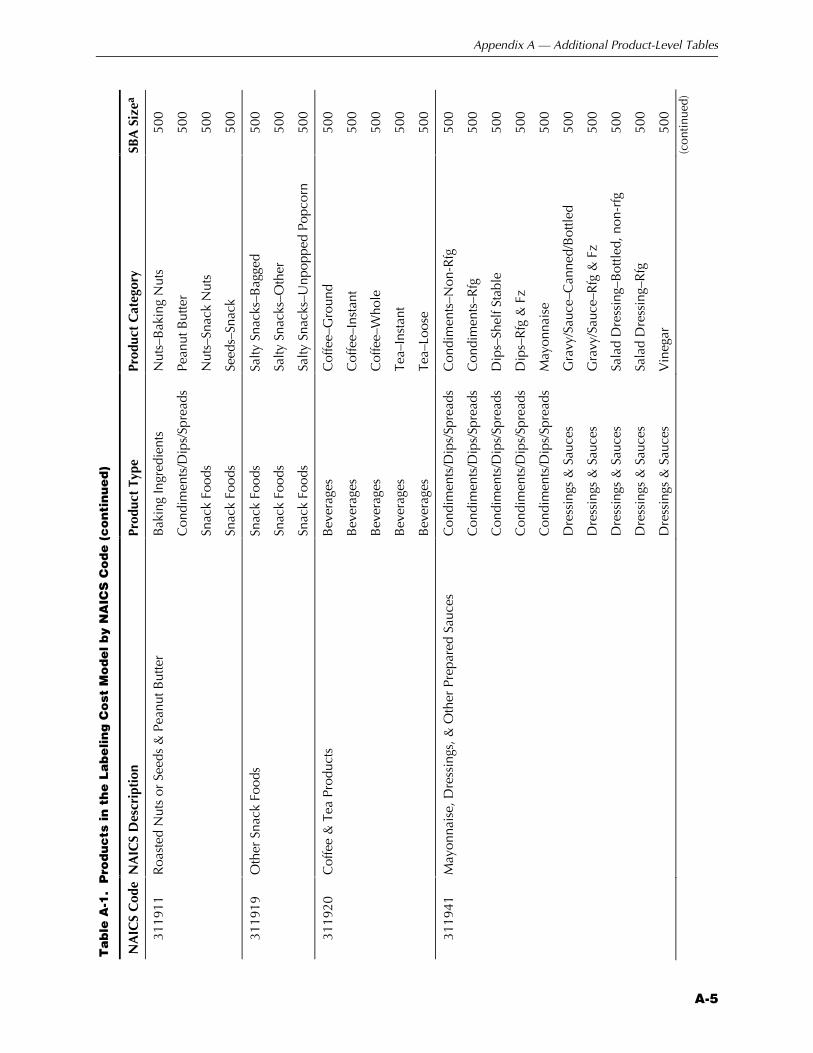
Appendix A — Additional Product-Level Tables
A-5
Ta
ble
A-1
. P
rod
uc
ts in
th
e L
ab
elin
g C
ost
Mo
de
l b
y N
AIC
S C
od
e (
co
nti
nu
ed
)
NA
ICS
Cod
e N
AIC
S D
escr
ipti
on
Prod
uct
Type
Pr
oduc
t C
ateg
ory
SBA
Siz
ea
3119
11
Roa
sted
Nut
s or
See
ds &
Pea
nut B
utte
r B
akin
g In
gred
ient
s N
uts–
Bak
ing
Nut
s 50
0
Con
dim
ents
/Dip
s/Sp
read
s Pe
anut
But
ter
500
Snac
k Fo
ods
Nut
s–Sn
ack
Nut
s 50
0
Snac
k Fo
ods
Seed
s–Sn
ack
500
3119
19
Oth
er S
nack
Foo
ds
Snac
k Fo
ods
Salty
Sna
cks–
Bag
ged
500
Snac
k Fo
ods
Salty
Sna
cks–
Oth
er
500
Snac
k Fo
ods
Salty
Sna
cks–
Unp
oppe
d Po
pcor
n 50
0
3119
20
Cof
fee
& T
ea P
rodu
cts
Bev
erag
es
Cof
fee–
Gro
und
500
Bev
erag
es
Cof
fee–
Inst
ant
500
Bev
erag
es
Cof
fee–
Who
le
500
Bev
erag
es
Tea–
Inst
ant
500
Bev
erag
es
Tea–
Loos
e 50
0
3119
41
May
onna
ise,
Dre
ssin
gs, &
Oth
er P
repa
red
Sauc
es
Con
dim
ents
/Dip
s/Sp
read
s C
ondi
men
ts–N
on-R
fg
500
Con
dim
ents
/Dip
s/Sp
read
s C
ondi
men
ts–R
fg
500
Con
dim
ents
/Dip
s/Sp
read
s D
ips–
Shel
f Sta
ble
500
Con
dim
ents
/Dip
s/Sp
read
s D
ips–
Rfg
& F
z 50
0
Con
dim
ents
/Dip
s/Sp
read
s M
ayon
nais
e 50
0
Dre
ssin
gs &
Sau
ces
Gra
vy/S
auce
–Can
ned/
Bot
tled
500
Dre
ssin
gs &
Sau
ces
Gra
vy/S
auce
–Rfg
& F
z 50
0
Dre
ssin
gs &
Sau
ces
Sala
d D
ress
ing–
Bot
tled,
non
-rfg
50
0
Dre
ssin
gs &
Sau
ces
Sala
d D
ress
ing–
Rfg
50
0
Dre
ssin
gs &
Sau
ces
Vin
egar
50
0 (c
ontin
ued)
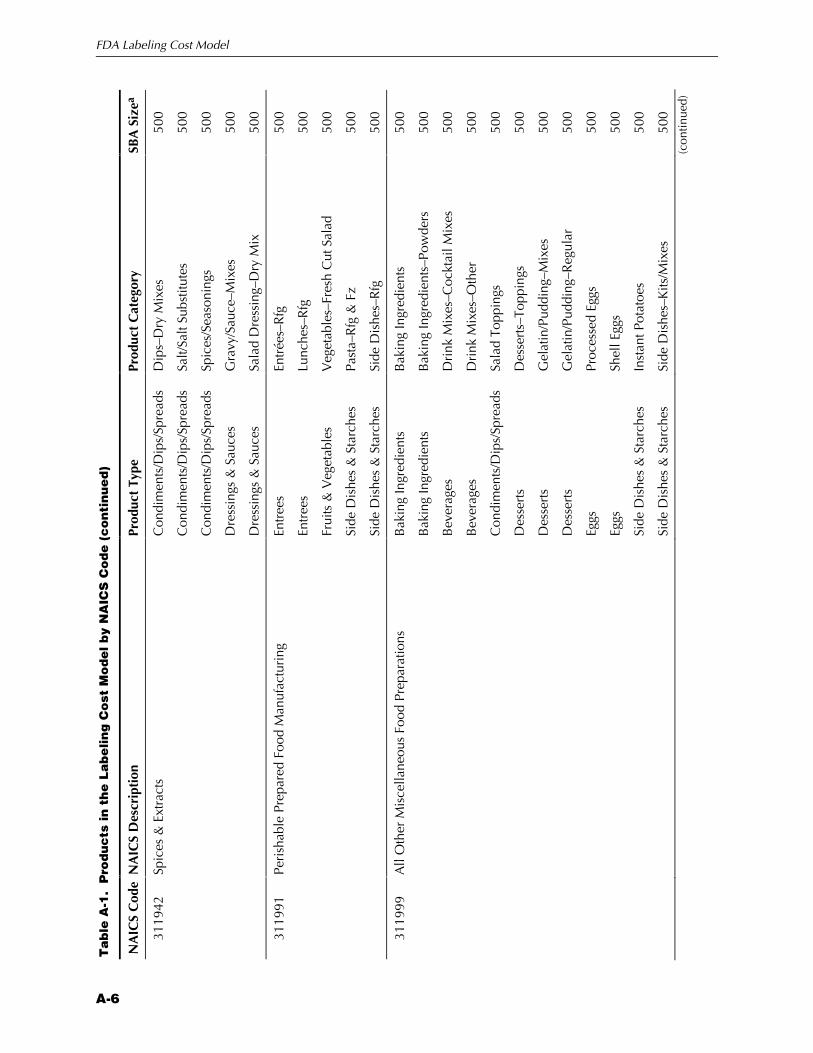
FDA Labeling Cost Model
A-6
Ta
ble
A-1
. P
rod
uc
ts in
th
e L
ab
elin
g C
ost
Mo
de
l b
y N
AIC
S C
od
e (
co
nti
nu
ed
)
NA
ICS
Cod
e N
AIC
S D
escr
ipti
on
Prod
uct
Type
Pr
oduc
t C
ateg
ory
SBA
Siz
ea
3119
42
Spic
es &
Ext
ract
s C
ondi
men
ts/D
ips/
Spre
ads
Dip
s–D
ry M
ixes
50
0
Con
dim
ents
/Dip
s/Sp
read
s Sa
lt/Sa
lt Su
bstit
utes
50
0
Con
dim
ents
/Dip
s/Sp
read
s Sp
ices
/Sea
soni
ngs
500
Dre
ssin
gs &
Sau
ces
Gra
vy/S
auce
–Mix
es
500
Dre
ssin
gs &
Sau
ces
Sala
d D
ress
ing–
Dry
Mix
50
0
3119
91
Peri
shab
le P
repa
red
Food
Man
ufac
turi
ng
Entr
ees
Entr
ées–
Rfg
50
0
Entr
ees
Lunc
hes–
Rfg
50
0
Frui
ts &
Veg
etab
les
Veg
etab
les–
Fres
h C
ut S
alad
50
0
Side
Dis
hes
& S
tarc
hes
Past
a–R
fg &
Fz
500
Side
Dis
hes
& S
tarc
hes
Side
Dis
hes–
Rfg
50
0
3119
99
All
Oth
er M
isce
llane
ous
Food
Pre
para
tions
B
akin
g In
gred
ient
s B
akin
g In
gred
ient
s 50
0
Bak
ing
Ingr
edie
nts
Bak
ing
Ingr
edie
nts–
Pow
ders
50
0
Bev
erag
es
Dri
nk M
ixes
–Coc
ktai
l Mix
es
500
Bev
erag
es
Dri
nk M
ixes
–Oth
er
500
Con
dim
ents
/Dip
s/Sp
read
s Sa
lad
Topp
ings
50
0
Des
sert
s D
esse
rts–
Topp
ings
50
0
Des
sert
s G
elat
in/P
uddi
ng–M
ixes
50
0
Des
sert
s G
elat
in/P
uddi
ng–R
egul
ar
500
Eggs
Pr
oces
sed
Eggs
50
0
Eggs
Sh
ell E
ggs
500
Side
Dis
hes
& S
tarc
hes
Inst
ant P
otat
oes
500
Side
Dis
hes
& S
tarc
hes
Side
Dis
hes–
Kits
/Mix
es
500
(con
tinue
d)
Appendix A — Additional Product-Level Tables
A-7
Ta
ble
A-1
. P
rod
uc
ts in
th
e L
ab
elin
g C
ost
Mo
de
l b
y N
AIC
S C
od
e (
co
nti
nu
ed
)
NA
ICS
Cod
e N
AIC
S D
escr
ipti
on
Prod
uct
Type
Pr
oduc
t C
ateg
ory
SBA
Siz
ea
3119
99
All
Oth
er M
isce
llane
ous
Food
Pre
para
tions
(con
tinue
d)
Side
Dis
hes
& S
tarc
hes
Stuf
fing
500
Swee
tene
rs
Syru
p/M
olas
ses
500
3121
11
Soft
Dri
nks
Bev
erag
es
Car
bona
ted
Bev
erag
es–R
egul
ar
500
Bev
erag
es
Car
bona
ted
Bev
erag
es–S
ugar
Su
bstit
ute
500
Bev
erag
es
Car
bona
ted
Bev
erag
es–W
ater
/Clu
b So
da
500
Bev
erag
es
Isot
onic
Dri
nks
500
Bev
erag
es
Non
-Fru
it D
rink
s 50
0
Bev
erag
es
Tea–
Can
ned/
Bot
tled
500
3121
12
Bot
tled
Wat
er
Bev
erag
es
Bot
tled
Wat
er
500
3251
99
All
Oth
er B
asic
Org
anic
Che
mic
al M
anuf
actu
ring
Sw
eete
ners
Su
gar
Subs
titut
es
1,00
0
3254
12
Phar
mac
eutic
al P
repa
ratio
ns
Die
tary
Sup
plem
ents
D
ieta
ry S
uppl
emen
ts–L
iqui
d 75
0
Die
tary
Sup
plem
ents
D
ieta
ry S
uppl
emen
ts–P
ills
750
a Sm
all B
usin
ess
Adm
inis
trat
ion
size
des
igna
tion
for
the
NA
ICS
code
(num
bers
of e
mpl
oyee
s).
FDA Labeling Cost Model
A-8
Ta
ble
A-2
. I
RI
Pro
du
ct
Typ
es
Inc
lud
ed
in
th
e L
ab
elin
g C
ost
Mo
de
l P
rod
uc
t C
ate
go
rie
s
Labe
ling
Cos
t M
odel
Typ
e La
belin
g C
ost
Mod
el C
ateg
ory
IRI
Type
IR
I Sl
ice
Bak
ed G
oods
B
aker
y Sn
acks
—N
on-R
fg
Cup
cake
s/B
row
nies
10
Dou
ghnu
ts
14
Muf
fins
14
Past
ry/D
anis
h/C
offe
e C
akes
14
B
aker
y Sn
acks
—R
fg
Rfg
Muf
fins
10
Rfg
Pas
try/
Dan
ish/
Cof
fee
Cak
es
10
Rfg
Sna
ck C
akes
/Dou
ghnu
ts
10
B
read
/Rol
ls—
Non
-Rfg
En
glis
h M
uffin
s 10
Bag
els/
Bia
lys
11
Fres
h B
read
11
Fres
h B
read
—N
ew P
aren
ts
11
Fres
h R
olls
/Bun
/Cro
issa
nts
11
B
read
/Rol
ls—
Rfg
& F
z R
fg B
agel
s/B
ialy
s 11
Rfg
Bre
ad
10
Rfg
Din
ner/
Sand
wic
h R
olls
/Cro
issa
nts
10
Rfg
Eng
lish
Muf
fins
10
Fz B
agel
s 12
Fz B
read
/Rol
ls/B
iscu
its
12
Fz M
uffin
s 12
Rfg
Egg
Rol
l/Won
ton
Wra
pper
s 14
Rfg
Tor
tilla
s 14
Fz T
ortil
la/E
gg R
oll/W
onto
n W
rapp
ers
13
Fz T
ortil
las
13
B
read
crum
bs/B
atte
rs/C
rout
ons
Cro
uton
s (N
o St
uffin
g C
rout
ons)
1
Bre
adcr
umbs
1
Bre
adin
g/B
atte
r/C
oatin
g M
ixes
1
(con
tinue
d)
Appendix A — Additional Product-Level Tables
A-9
Ta
ble
A-2
. I
RI
Pro
du
ct
Typ
es
Inc
lud
ed
in
th
e L
ab
elin
g C
ost
Mo
de
l P
rod
uc
t C
ate
go
rie
s (c
on
tin
ue
d)
Labe
ling
Cos
t M
odel
Typ
e La
belin
g C
ost
Mod
el C
ateg
ory
IRI
Type
IR
I Sl
ice
Bak
ed G
oods
(con
tinue
d)
Coo
kies
C
ooki
es
1
Coo
kies
Par
t II
1
Ice
Cre
am C
ones
2
Fz C
ooki
es
12
C
rack
ers
All
Oth
er C
rack
ers
6
Bre
adst
icks
6
Cra
cker
s W
ith F
illin
gs
6
Gra
ham
Cra
cker
s 6
Mat
zoh
Cra
cker
s 6
Salti
ne C
rack
ers
6
Sn
ack
& G
rano
la B
ars
Snac
k B
ars/
Gra
nola
Bar
s 4
Bak
ing
Ingr
edie
nts
Bak
ing
Ingr
edie
nts
Chi
ps/B
akin
g C
hoco
late
/Coc
oa
5
Coc
onut
5
Gra
ham
Cra
cker
Cru
mbs
5
Mar
asch
ino
Che
rrie
s 5
Mar
shm
allo
w C
rem
e 5
Pie/
Past
ry F
illin
g 5
Rea
dy-T
o-U
se P
ie C
rust
5
Edib
le C
ake
Dec
orat
ions
5
Fros
ting/
Fros
ting
Mix
es
6
B
akin
g In
gred
ient
s—Po
wde
rs
Bak
ing
Pow
der/
Soda
5
Coo
king
Sta
rche
s/R
enne
t 5
Dry
/Rfg
Yea
st
5 (c
ontin
ued)
FDA Labeling Cost Model
A-10
Ta
ble
A-2
. I
RI
Pro
du
ct
Typ
es
Inc
lud
ed
in
th
e L
ab
elin
g C
ost
Mo
de
l P
rod
uc
t C
ate
go
rie
s (c
on
tin
ue
d)
Labe
ling
Cos
t M
odel
Typ
e La
belin
g C
ost
Mod
el C
ateg
ory
IRI
Type
IR
I Sl
ice
Bak
ing
Mix
es
All
Oth
er B
akin
g M
ixes
1
Bak
ing
Ingr
edie
nts
(con
tinue
d)
B
row
nie
Mix
es
1
Cak
e/C
upca
ke/P
ie M
ixes
1
Cof
fee
Cak
e/G
inge
rbre
ad/P
astr
y M
ixes
1
Coo
kie/
Coo
kie
Bar
Mix
es
1
Muf
fin M
ixes
1
Piec
rust
Mix
es
1
Panc
ake/
Fren
ch T
oast
/Waf
fle M
ixes
2
D
ough
—R
fg &
Fz
Rfg
Bis
cuit
Dou
gh
10
Rfg
Coo
kie/
Bro
wni
e D
ough
10
Rfg
Dou
gh (B
read
/Rol
ls/B
un)
10
Rfg
Dou
gh (P
astr
y/D
umpl
ing)
10
Fz B
read
/Rol
ls/P
astr
y D
ough
12
Fz C
ooki
e D
ough
12
Fz P
ie/P
astr
y Sh
ells
12
Fl
our/
Mea
l C
ornm
eal/B
akin
g O
at B
ran
6
Flou
r 6
Hom
iny
Gri
ts
6
Mat
zoh
Mea
l 6
N
uts—
Bak
ing
Nut
s C
ooki
ng/B
akin
g N
uts
1
Pi
zza—
Cru
st/D
ough
Pi
zza
Cru
st M
ixes
7
Fz P
izza
Cru
sts/
Dou
gh
12
Rfg
Piz
za C
rust
/Dou
gh
14
(con
tinue
d)
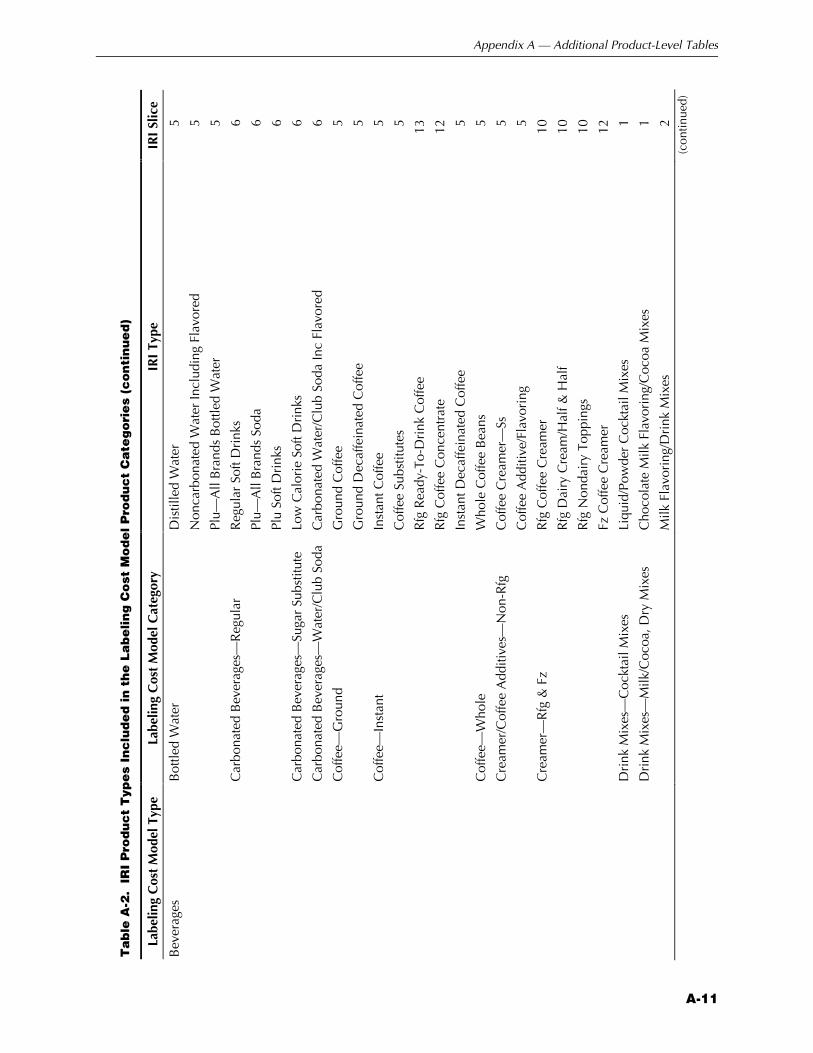
Appendix A — Additional Product-Level Tables
A-11
Ta
ble
A-2
. I
RI
Pro
du
ct
Typ
es
Inc
lud
ed
in
th
e L
ab
elin
g C
ost
Mo
de
l P
rod
uc
t C
ate
go
rie
s (c
on
tin
ue
d)
Labe
ling
Cos
t M
odel
Typ
e La
belin
g C
ost
Mod
el C
ateg
ory
IRI
Type
IR
I Sl
ice
Bev
erag
es
Bot
tled
Wat
er
Dis
tille
d W
ater
5
Non
carb
onat
ed W
ater
Incl
udin
g Fl
avor
ed
5
Plu—
All
Bra
nds
Bot
tled
Wat
er
5
C
arbo
nate
d B
ever
ages
—R
egul
ar
Reg
ular
Sof
t Dri
nks
6
Plu—
All
Bra
nds
Soda
6
Plu
Soft
Dri
nks
6
C
arbo
nate
d B
ever
ages
—Su
gar
Subs
titut
e Lo
w C
alor
ie S
oft D
rink
s 6
C
arbo
nate
d B
ever
ages
—W
ater
/Clu
b So
da
Car
bona
ted
Wat
er/C
lub
Soda
Inc
Flav
ored
6
C
offe
e—G
roun
d G
roun
d C
offe
e 5
Gro
und
Dec
affe
inat
ed C
offe
e 5
C
offe
e—In
stan
t In
stan
t Cof
fee
5
Cof
fee
Subs
titut
es
5
Rfg
Rea
dy-T
o-D
rink
Cof
fee
13
Rfg
Cof
fee
Con
cent
rate
12
Inst
ant D
ecaf
fein
ated
Cof
fee
5
C
offe
e—W
hole
W
hole
Cof
fee
Bea
ns
5
C
ream
er/C
offe
e A
dditi
ves—
Non
-Rfg
C
offe
e C
ream
er—
Ss
5
Cof
fee
Add
itive
/Fla
vori
ng
5
C
ream
er—
Rfg
& F
z R
fg C
offe
e C
ream
er
10
Rfg
Dai
ry C
ream
/Hal
f & H
alf
10
Rfg
Non
dair
y To
ppin
gs
10
Fz C
offe
e C
ream
er
12
D
rink
Mix
es—
Coc
ktai
l Mix
es
Liqu
id/P
owde
r C
ockt
ail M
ixes
1
D
rink
Mix
es—
Milk
/Coc
oa, D
ry M
ixes
C
hoco
late
Milk
Fla
vori
ng/C
ocoa
Mix
es
1
Milk
Fla
vori
ng/D
rink
Mix
es
2 (c
ontin
ued)
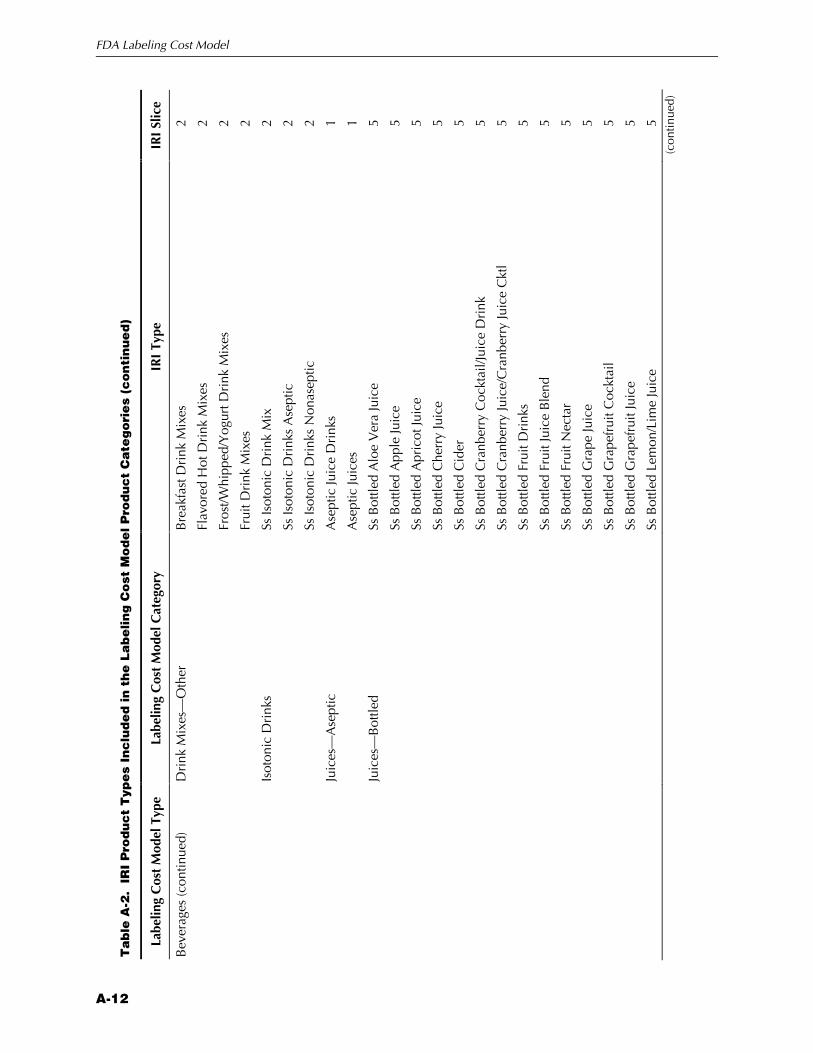
FDA Labeling Cost Model
A-12
Ta
ble
A-2
. I
RI
Pro
du
ct
Typ
es
Inc
lud
ed
in
th
e L
ab
elin
g C
ost
Mo
de
l P
rod
uc
t C
ate
go
rie
s (c
on
tin
ue
d)
Labe
ling
Cos
t M
odel
Typ
e La
belin
g C
ost
Mod
el C
ateg
ory
IRI
Type
IR
I Sl
ice
Bev
erag
es (c
ontin
ued)
D
rink
Mix
es—
Oth
er
Bre
akfa
st D
rink
Mix
es
2
Flav
ored
Hot
Dri
nk M
ixes
2
Fros
t/Whi
pped
/Yog
urt D
rink
Mix
es
2
Frui
t Dri
nk M
ixes
2
Is
oton
ic D
rink
s Ss
Isot
onic
Dri
nk M
ix
2
Ss Is
oton
ic D
rink
s A
sept
ic
2
Ss Is
oton
ic D
rink
s N
onas
eptic
2
Ju
ices
—A
sept
ic
Ase
ptic
Juic
e D
rink
s 1
Ase
ptic
Juic
es
1
Ju
ices
—B
ottle
d Ss
Bot
tled
Alo
e V
era
Juic
e 5
Ss B
ottle
d A
pple
Juic
e 5
Ss B
ottle
d A
pric
ot Ju
ice
5
Ss B
ottle
d C
herr
y Ju
ice
5
Ss B
ottle
d C
ider
5
Ss B
ottle
d C
ranb
erry
Coc
ktai
l/Jui
ce D
rink
5
Ss B
ottle
d C
ranb
erry
Juic
e/C
ranb
erry
Juic
e C
ktl
5
Ss B
ottle
d Fr
uit D
rink
s 5
Ss B
ottle
d Fr
uit J
uice
Ble
nd
5
Ss B
ottle
d Fr
uit N
ecta
r 5
Ss B
ottle
d G
rape
Juic
e 5
Ss B
ottle
d G
rape
frui
t Coc
ktai
l 5
Ss B
ottle
d G
rape
frui
t Jui
ce
5
Ss B
ottle
d Le
mon
/Lim
e Ju
ice
5 (c
ontin
ued)
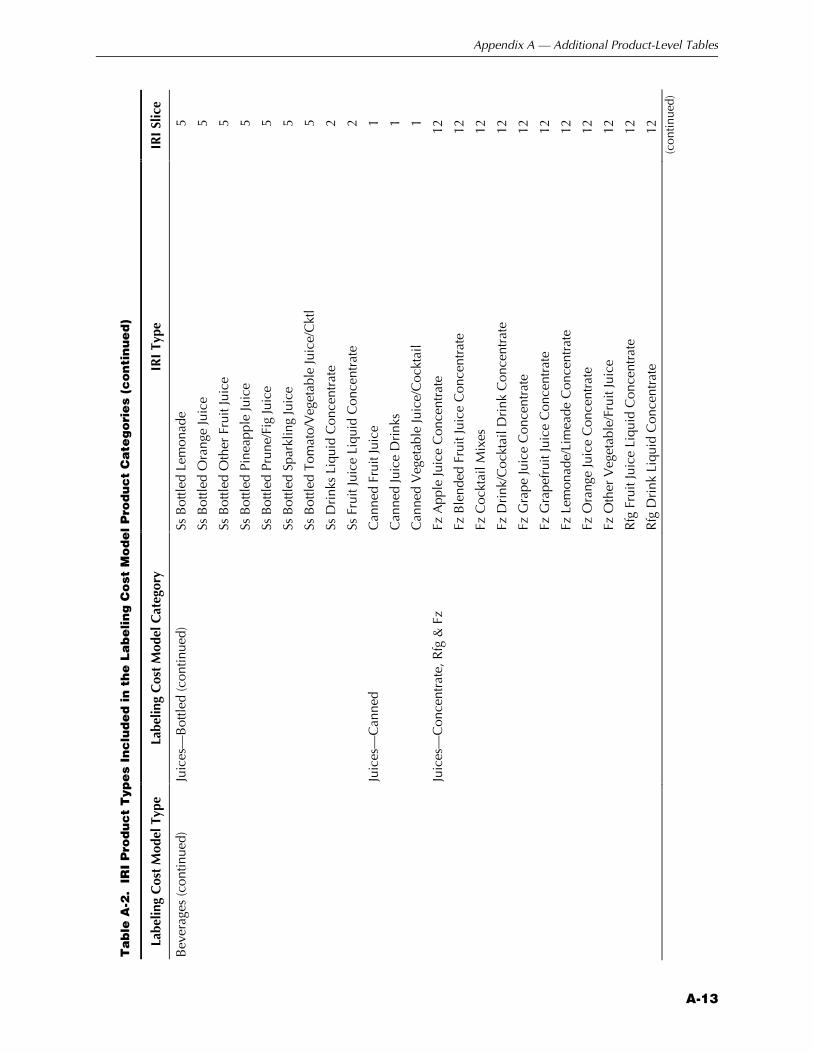
Appendix A — Additional Product-Level Tables
A-13
Ta
ble
A-2
. I
RI
Pro
du
ct
Typ
es
Inc
lud
ed
in
th
e L
ab
elin
g C
ost
Mo
de
l P
rod
uc
t C
ate
go
rie
s (c
on
tin
ue
d)
Labe
ling
Cos
t M
odel
Typ
e La
belin
g C
ost
Mod
el C
ateg
ory
IRI
Type
IR
I Sl
ice
Bev
erag
es (c
ontin
ued)
Ju
ices
—B
ottle
d (c
ontin
ued)
Ss
Bot
tled
Lem
onad
e 5
Ss B
ottle
d O
rang
e Ju
ice
5
Ss B
ottle
d O
ther
Fru
it Ju
ice
5
Ss B
ottle
d Pi
neap
ple
Juic
e 5
Ss B
ottle
d Pr
une/
Fig
Juic
e 5
Ss B
ottle
d Sp
arkl
ing
Juic
e 5
Ss B
ottle
d To
mat
o/V
eget
able
Juic
e/C
ktl
5
Ss D
rink
s Li
quid
Con
cent
rate
2
Ss F
ruit
Juic
e Li
quid
Con
cent
rate
2
Ju
ices
—C
anne
d C
anne
d Fr
uit J
uice
1
Can
ned
Juic
e D
rink
s 1
Can
ned
Veg
etab
le Ju
ice/
Coc
ktai
l 1
Ju
ices
—C
once
ntra
te, R
fg &
Fz
Fz A
pple
Juic
e C
once
ntra
te
12
Fz B
lend
ed F
ruit
Juic
e C
once
ntra
te
12
Fz C
ockt
ail M
ixes
12
Fz D
rink
/Coc
ktai
l Dri
nk C
once
ntra
te
12
Fz G
rape
Juic
e C
once
ntra
te
12
Fz G
rape
frui
t Jui
ce C
once
ntra
te
12
Fz L
emon
ade/
Lim
eade
Con
cent
rate
12
Fz O
rang
e Ju
ice
Con
cent
rate
12
Fz O
ther
Veg
etab
le/F
ruit
Juic
e 12
Rfg
Fru
it Ju
ice
Liqu
id C
once
ntra
te
12
Rfg
Dri
nk L
iqui
d C
once
ntra
te
12
(con
tinue
d)
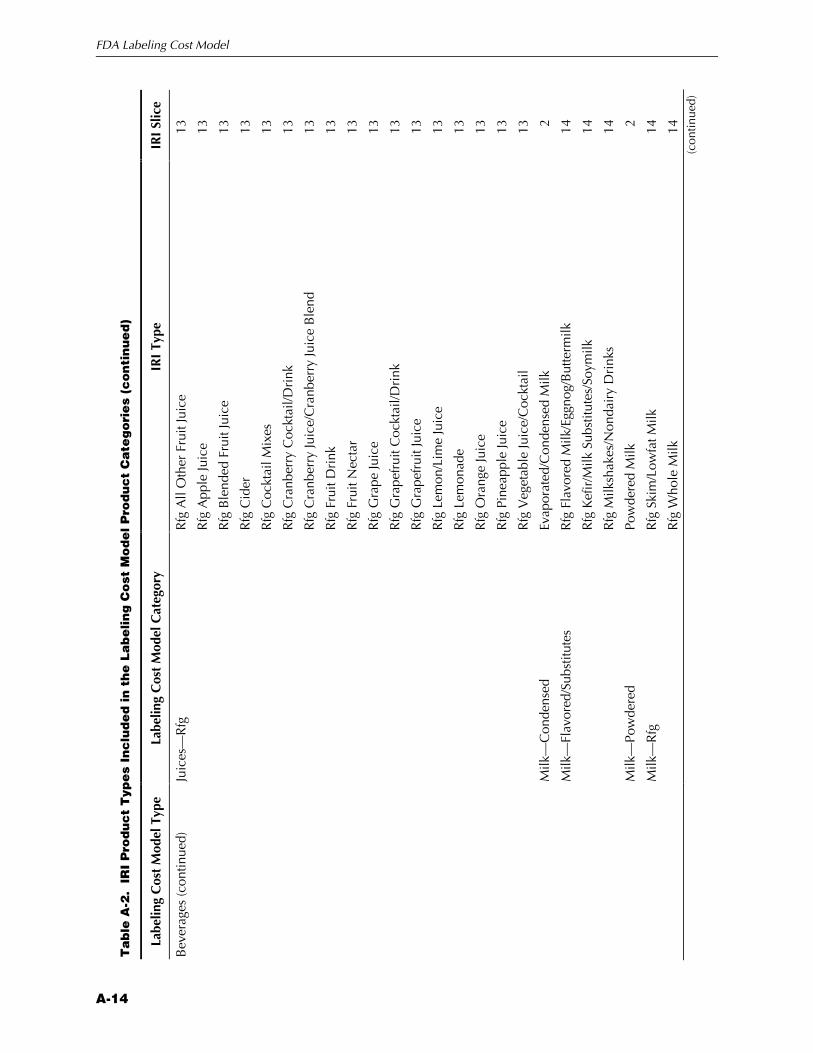
FDA Labeling Cost Model
A-14
Ta
ble
A-2
. I
RI
Pro
du
ct
Typ
es
Inc
lud
ed
in
th
e L
ab
elin
g C
ost
Mo
de
l P
rod
uc
t C
ate
go
rie
s (c
on
tin
ue
d)
Labe
ling
Cos
t M
odel
Typ
e La
belin
g C
ost
Mod
el C
ateg
ory
IRI
Type
IR
I Sl
ice
Bev
erag
es (c
ontin
ued)
Ju
ices
—R
fg
Rfg
All
Oth
er F
ruit
Juic
e 13
Rfg
App
le Ju
ice
13
Rfg
Ble
nded
Fru
it Ju
ice
13
Rfg
Cid
er
13
Rfg
Coc
ktai
l Mix
es
13
Rfg
Cra
nber
ry C
ockt
ail/D
rink
13
Rfg
Cra
nber
ry Ju
ice/
Cra
nber
ry Ju
ice
Ble
nd
13
Rfg
Fru
it D
rink
13
Rfg
Fru
it N
ecta
r 13
Rfg
Gra
pe Ju
ice
13
Rfg
Gra
pefr
uit C
ockt
ail/D
rink
13
Rfg
Gra
pefr
uit J
uice
13
Rfg
Lem
on/L
ime
Juic
e 13
Rfg
Lem
onad
e 13
Rfg
Ora
nge
Juic
e 13
Rfg
Pin
eapp
le Ju
ice
13
Rfg
Veg
etab
le Ju
ice/
Coc
ktai
l 13
M
ilk—
Con
dens
ed
Evap
orat
ed/C
onde
nsed
Milk
2
M
ilk—
Flav
ored
/Sub
stitu
tes
Rfg
Fla
vore
d M
ilk/E
ggno
g/B
utte
rmilk
14
Rfg
Kef
ir/M
ilk S
ubst
itute
s/So
ymilk
14
Rfg
Milk
shak
es/N
onda
iry
Dri
nks
14
M
ilk—
Pow
dere
d Po
wde
red
Milk
2
M
ilk—
Rfg
R
fg S
kim
/Low
fat M
ilk
14
Rfg
Who
le M
ilk
14
(con
tinue
d)

Appendix A — Additional Product-Level Tables
A-15
Ta
ble
A-2
. I
RI
Pro
du
ct
Typ
es
Inc
lud
ed
in
th
e L
ab
elin
g C
ost
Mo
de
l P
rod
uc
t C
ate
go
rie
s (c
on
tin
ue
d)
Labe
ling
Cos
t M
odel
Typ
e La
belin
g C
ost
Mod
el C
ateg
ory
IRI
Type
IR
I Sl
ice
Bev
erag
es (c
ontin
ued)
N
onfr
uit D
rink
s R
eady
-to-
Dri
nk M
ilk/M
ilk S
ubst
itute
s 2
Ss N
onfr
uit D
rink
s 2
Yog
urt/Y
ogur
t Dri
nks
2
Te
a—C
anne
d/B
ottle
d C
anne
d an
d B
ottle
d Te
a 4
Rfg
Tea
s 13
Te
a—In
stan
t In
stan
t Tea
Mix
es
4
Te
a—Lo
ose
Tea—
Bag
s/Lo
ose
4
Bre
akfa
st F
oods
B
reak
fast
Foo
d—Fr
ozen
Fz
Oth
er B
reak
fast
Foo
d 12
Fz W
affle
s 12
B
reak
fast
Foo
d—In
stan
t D
ried
Bre
akfa
st F
ood
1
Inst
ant B
reak
fast
1
Whe
at G
erm
1
Rea
dy-T
o-D
rink
Bre
akfa
st M
eals
1
B
reak
fast
Foo
d—R
eady
to E
at
Ss T
oast
er P
astr
ies/
Tart
s 1
C
erea
l R
eady
-To-
Eat C
erea
l 1
Hot
Cer
eal/O
atm
eal
2
Can
dy &
Gum
C
hoco
late
Can
dy—
Sing
le S
erve
C
hoco
late
Can
dy B
ar <
3.5o
z 6
Cho
cola
te C
over
ed C
ooki
e/W
afer
6
C
hoco
late
Can
dy—
Snac
k C
hoco
late
Can
dy S
nack
Siz
e 6
Cho
cola
te C
over
ed S
alte
d Sn
ack
2
Cho
cola
te C
andy
Box
/Bag
>3.
5oz
6
Gift
Box
Cho
cola
tes
6
G
um—
Reg
ular
Gum
R
egul
ar G
um (N
o Su
garl
ess)
6
Plu—
All
Bra
nds
Gum
6
(con
tinue
d)
FDA Labeling Cost Model
A-16
Ta
ble
A-2
. I
RI
Pro
du
ct
Typ
es
Inc
lud
ed
in
th
e L
ab
elin
g C
ost
Mo
de
l P
rod
uc
t C
ate
go
rie
s (c
on
tin
ue
d)
Labe
ling
Cos
t M
odel
Typ
e La
belin
g C
ost
Mod
el C
ateg
ory
IRI
Type
IR
I Sl
ice
Can
dy &
Gum
(con
tinue
d)
Gum
—Su
garl
ess
Gum
Su
garl
ess
Gum
6
N
onch
ocol
ate
Can
dy—
Die
t D
iet C
andy
8
N
onch
ocol
ate
Can
dy—
Kits
C
aram
el/T
affy
App
les
5
Taffy
/Can
dy A
pple
Kit
5
Can
dy M
akin
g M
ix/K
it/M
old
5
N
onch
ocol
ate
Can
dy—
Pkg
& R
oll
Bre
ath
Fres
hene
r 8
Plai
n M
ints
7
Har
d Su
gar
Can
dy/P
kg &
Rol
l Can
dy
7
N
onch
ocol
ate
Can
dy—
Sing
le S
erve
N
onch
ocol
ate
Che
wy
Can
dy B
ar <
3.5o
z 7
Nov
elty
Can
dy
8
Spec
ialty
Nut
/Coc
onut
Can
dy
7
N
onch
ocol
ate
Can
dy—
Snac
k N
onch
ocol
ate
Che
wy
Snac
k Si
ze
7
Non
choc
olat
e C
hew
y B
ox/B
ag >
3.5o
z 7
Lico
rice
Box
/Bag
>3.
5oz
7
Mar
shm
allo
ws
2
Se
ason
al C
andy
A
ll O
ther
Sea
sona
l Can
dy
8
Chr
istm
as C
andy
8
East
er C
andy
8
Hal
low
een
Can
dy
8
Plu—
All
Bra
nds
Can
dy
8
Val
entin
e C
andy
8
(con
tinue
d)
Appendix A — Additional Product-Level Tables
A-17
Ta
ble
A-2
. I
RI
Pro
du
ct
Typ
es
Inc
lud
ed
in
th
e L
ab
elin
g C
ost
Mo
de
l P
rod
uc
t C
ate
go
rie
s (c
on
tin
ue
d)
Labe
ling
Cos
t M
odel
Typ
e La
belin
g C
ost
Mod
el C
ateg
ory
IRI
Type
IR
I Sl
ice
Con
dim
ents
/Dip
s/Sp
read
s C
ondi
men
ts—
Non
-Rfg
K
etch
up
2
Ket
chup
/Mus
tard
Com
bina
tions
2
Mus
tard
2
Hor
sera
dish
/Hor
sera
dish
Sau
ce
8
C
ondi
men
ts—
Rfg
R
fg M
usta
rd
14
Rfg
Hor
sera
dish
/Hor
sera
dish
Sau
ce
15
Rfg
Fla
vore
d Sp
read
s 15
D
ips—
Dry
Mix
es
Dry
Dip
Mix
es
3
D
ips—
Rfg
& F
z Fz
Dip
s 13
Rfg
Dip
s 14
D
ips—
Shel
f Sta
ble
Dip
—Ss
2
Ja
ms/
Jelli
es/P
rese
rves
Fr
uit B
utte
r 2
Ss Ja
m/Je
lly/P
rese
rves
2
Fz Ja
ms/
Jelli
es/P
rese
rves
13
Ss H
oney
2
Rfg
Hon
ey
15
M
ayon
nais
e M
ayon
nais
e/Sa
ndw
ich
Spre
ad
2
Pe
anut
But
ter
Chu
nky
Pean
ut B
utte
r 2
Cre
amy
Pean
ut B
utte
r 2
Pean
ut B
utte
r C
ombo
2
Plu—
Pean
ut B
utte
r 2
Spec
ialty
Nut
But
ter
2
Rfg
Pea
nut B
utte
r 14
(c
ontin
ued)
FDA Labeling Cost Model
A-18
Ta
ble
A-2
. I
RI
Pro
du
ct
Typ
es
Inc
lud
ed
in
th
e L
ab
elin
g C
ost
Mo
de
l P
rod
uc
t C
ate
go
rie
s (c
on
tin
ue
d)
Labe
ling
Cos
t M
odel
Typ
e La
belin
g C
ost
Mod
el C
ateg
ory
IRI
Type
IR
I Sl
ice
Pick
les/
Rel
ish/
Oliv
es
Chu
tney
3
Con
dim
ents
/Dip
s/Sp
read
s (c
ontin
ued)
Mar
inat
ed V
eget
able
/Fru
it 3
Oliv
es
3
Pepp
ers/
Pim
ento
s 3
Pick
les
3
Rel
ish
3
Rfg
Mar
inat
ed V
eget
able
s/Fr
uit
14
Rfg
Pep
pers
/Pim
ento
s/O
lives
14
Rfg
Pic
kles
14
Rfg
Rel
ishe
s/A
ppet
izer
Rel
ish
14
Rfg
Sau
erkr
aut
11
Sa
lad
Topp
ings
Sa
lad
Topp
ings
3
Rfg
Sal
ad T
oppi
ng/B
acon
Bits
14
Sa
lt/Sa
lt Su
bstit
utes
Sa
lt/Se
ason
ed S
alt/S
alt S
ubst
itute
9
Sp
ices
/Sea
soni
ngs
Extr
act/F
lavo
ring
/Foo
d C
olor
ing
9
Frui
t & V
eget
able
Pre
serv
ativ
e/Pe
ctin
9
Gar
lic S
prea
d 9
Pepp
er
9
Spic
e/Se
ason
ing—
No
Salt/
Pepp
er
9
Dai
ry F
oods
B
utte
r Pl
u—A
ll B
rand
s B
utte
r 10
Rfg
But
ter
10
C
hees
e—G
rate
d R
fg G
rate
d C
hees
e 10
Ss G
rate
d C
hees
e 10
C
hees
e—Im
itatio
n Im
itatio
n C
hees
e (A
ll Fo
rms)
10
(c
ontin
ued)

Appendix A — Additional Product-Level Tables
A-19
Ta
ble
A-2
. I
RI
Pro
du
ct
Typ
es
Inc
lud
ed
in
th
e L
ab
elin
g C
ost
Mo
de
l P
rod
uc
t C
ate
go
rie
s (c
on
tin
ue
d)
Labe
ling
Cos
t M
odel
Typ
e La
belin
g C
ost
Mod
el C
ateg
ory
IRI
Type
IR
I Sl
ice
Dai
ry F
oods
(con
tinue
d)
Che
ese—
Nat
ural
Che
ese
Nat
ural
Che
ese
(No
Shre
dded
) 10
C
hees
e—Pr
oces
sed
Che
ese
All
Oth
er P
roce
ssed
Che
ese
10
Aer
osol
/Squ
eeza
ble
Che
ese
Spre
ads
10
Che
ese
Spre
ads/
Bal
ls
10
Am
eric
an C
hees
e (A
ll Fo
rms)
10
Proc
esse
d Sh
redd
ed C
hees
e 10
C
hees
e—R
icot
ta/C
ream
/Cot
tage
R
icot
ta C
hees
e 10
Cre
am C
hees
e/C
ream
Che
ese
Spre
ad
10
Cot
tage
Che
ese
10
C
hees
e—Sh
redd
ed
Nat
ural
Shr
edde
d C
hees
e 10
Fr
ozen
Nov
eltie
s Fz
Nov
eltie
s 12
Fz Y
ogur
t/Tof
u 13
Plu—
All
Bra
nds
Ice
Cre
am N
ovel
ties
12
Ice
Pop
Nov
eltie
s 12
Sher
bet/S
orbe
t/Ice
s 13
Ic
e C
ream
& Ic
e M
ilk
Ice
Cre
am M
ixes
2
Fz Ic
e C
ream
/Ice
Milk
Des
sert
s 12
Ice
Cre
am
13
Ice
Milk
13
So
ur C
ream
So
ur C
ream
15
Y
ogur
t R
fg Y
ogur
t 15
Rfg
Yog
urt D
rink
s 15
(c
ontin
ued)
FDA Labeling Cost Model
A-20
Ta
ble
A-2
. I
RI
Pro
du
ct
Typ
es
Inc
lud
ed
in
th
e L
ab
elin
g C
ost
Mo
de
l P
rod
uc
t C
ate
go
rie
s (c
on
tin
ue
d)
Labe
ling
Cos
t M
odel
Typ
e La
belin
g C
ost
Mod
el C
ateg
ory
IRI
Type
IR
I Sl
ice
Des
sert
s D
esse
rts—
Topp
ings
C
hoco
late
Syr
up/D
esse
rt T
oppi
ngs
6
Dry
Whi
pped
Top
ping
Mix
es
6
Fz W
hip
Topp
ings
12
G
elat
in/P
uddi
ng—
Mix
es
Gel
atin
Des
sert
Mix
es
6
Pudd
ing/
Pie
Filli
ng/M
ouss
e M
ixes
6
G
elat
in/P
uddi
ng—
Reg
ular
Pu
ddin
g/G
elat
in
6
Rfg
Pud
ding
/Mou
sse/
Gel
atin
/Par
faits
10
Fz P
uddi
ng/M
ouss
e 12
Pi
es &
Cak
es—
Non
-Rfg
C
akes
(No
Snac
k/C
offe
e C
akes
) 15
Pies
(No
Snac
k Pi
es)
15
Pi
es &
Cak
es—
Rfg
& F
z R
fg C
hees
ecak
es
10
Fz C
hees
ecak
es
12
Fz S
wee
t Goo
ds—
No
Che
esec
akes
12
Fz P
ies
12
Rfg
Cak
es (N
o Sn
ack/
Cof
fee
Cak
es)
10
Rfg
Pie
s (N
o Sn
ack
Pies
) 10
Die
tary
Sup
plem
ents
D
ieta
ry S
uppl
emen
ts—
Liqu
id
Liqu
id V
itam
ins/
Min
eral
s 15
D
ieta
ry S
uppl
emen
ts—
Pills
M
iner
al S
uppl
emen
ts
15
Mul
ti-V
itam
ins
15
1 &
2 L
ette
r V
itam
ins
15
Dre
ssin
gs &
Sau
ces
Gra
vy/S
auce
—C
anne
d/B
ottle
d B
arbe
cue
Sauc
e 8
Chi
li/H
ot D
og S
auce
8
Dai
ry S
auce
/Che
ese
Sauc
e 8
Hol
land
aise
/Béa
rnai
se/D
ill S
auce
8
(con
tinue
d)
Appendix A — Additional Product-Level Tables
A-21
Ta
ble
A-2
. I
RI
Pro
du
ct
Typ
es
Inc
lud
ed
in
th
e L
ab
elin
g C
ost
Mo
de
l P
rod
uc
t C
ate
go
rie
s (c
on
tin
ue
d)
Labe
ling
Cos
t M
odel
Typ
e La
belin
g C
ost
Mod
el C
ateg
ory
IRI
Type
IR
I Sl
ice
Gra
vy/S
auce
—C
anne
d/B
ottle
d (c
ontin
ued)
H
ot/C
ajun
Sau
ce
8 D
ress
ings
& S
auce
s (c
ontin
ued)
Mea
t Sau
ce/M
arin
ade/
Gla
ze
8
Seaf
ood
Sauc
e 8
Stea
k/W
orce
ster
shir
e Sa
uce
8
Tart
ar S
auce
8
Mex
ican
Sau
ce &
Mar
inad
es
7
Taco
Sau
ce
7
Ss O
rien
tal S
auce
/Mar
inad
e 7
Liqu
id G
ravy
2
Slop
py Jo
e Sa
uce
2
G
ravy
/Sau
ce—
Mix
es
All
Oth
er D
ry S
easo
ning
Mix
es
2
Dry
Gra
vy M
ixes
2
Dry
Mea
t/Sea
food
Sea
soni
ng M
ixes
2
Dry
Sau
ce M
ixes
2
G
ravy
/Sau
ce—
Rfg
& F
z Fz
Mea
t/Sea
food
Sea
soni
ng M
ixes
13
Fz S
auce
/Gra
vy/M
arin
ade
13
Rfg
Mea
t/Sea
food
Sea
soni
ng M
ixes
14
Rfg
Sau
ce/G
ravy
/Mar
inad
e M
ixes
14
Sa
lad
Dre
ssin
g—B
ottle
d, N
on-R
fg
Ss C
oles
law
Dre
ssin
g 3
Ss P
oura
ble
Sala
d D
ress
ings
3
Sa
lad
Dre
ssin
g—D
ry M
ix
Sala
d D
ress
ing
Mix
es
3
Sa
lad
Dre
ssin
g—R
fg
Rfg
Pou
rabl
e Sa
lad
Dre
ssin
g 14
V
ineg
ar
Coo
king
She
rry/
Win
e 4
Vin
egar
4
(con
tinue
d)
FDA Labeling Cost Model
A-22
Ta
ble
A-2
. I
RI
Pro
du
ct
Typ
es
Inc
lud
ed
in
th
e L
ab
elin
g C
ost
Mo
de
l P
rod
uc
t C
ate
go
rie
s (c
on
tin
ue
d)
Labe
ling
Cos
t M
odel
Typ
e La
belin
g C
ost
Mod
el C
ateg
ory
IRI
Type
IR
I Sl
ice
Eggs
Pr
oces
sed
Eggs
Eg
g Su
bstit
utes
2
Fz E
gg S
ubst
itute
s 13
Rfg
Egg
Sub
stitu
tes
14
Sh
ell E
ggs
Fres
h Eg
gs
11
Plu—
All
Bra
nds
Eggs
11
Entr
ees
Entr
ées—
Fz
Fz D
inne
rs/E
ntre
es
12
Fz H
andh
eld
Entr
ees
(Non
brea
kfas
t) 12
Fz P
ot P
ies
12
Fz C
hili
13
En
trée
s—R
fg
Rfg
Bre
akfa
st E
ntre
es
11
Rfg
Chi
li 11
Rfg
Din
ners
/Ent
rees
11
Rfg
Han
dhel
d N
onbr
eakf
ast E
ntre
es
11
Rfg
Pot
Pie
s 13
En
trée
s—Sh
elf S
tabl
e Ss
Mic
row
avea
ble
Pack
age
Din
ner
1
Ss P
repa
red
Chi
li 1
Ss P
repa
red
Din
ners
/Ent
rees
1
Ss P
repa
red
Past
a D
ishe
s 1
Lu
nche
s—R
fg
Rfg
Mea
t/Che
ese/
Cra
cker
/Des
sert
13
Pi
zza—
Pizz
a/K
its/M
ixes
, Rfg
& F
z Pi
zza
Kits
/Mix
es
7
Fz P
izza
12
Pizz
a K
its/T
oppi
ngs
12
Rfg
Piz
za/P
izza
Kits
14
(c
ontin
ued)
Appendix A — Additional Product-Level Tables
A-23
Ta
ble
A-2
. I
RI
Pro
du
ct
Typ
es
Inc
lud
ed
in
th
e L
ab
elin
g C
ost
Mo
de
l P
rod
uc
t C
ate
go
rie
s (c
on
tin
ue
d)
Labe
ling
Cos
t M
odel
Typ
e La
belin
g C
ost
Mod
el C
ateg
ory
IRI
Type
IR
I Sl
ice
Fats
& O
ils
Lard
/Sho
rten
ing
Rfg
Lar
d 12
Shor
teni
ng
4
M
arga
rine
M
arga
rine
/Spr
eads
/But
ter
Ble
nds
13
Plu—
All
Bra
nds
Mar
gari
ne
13
O
il C
ooki
ng &
Sal
ad O
ils
4
Mic
row
ave
Bro
wni
ng/P
an S
pray
4
Oliv
e O
il 4
Ori
enta
l Coo
king
Oils
7
Popc
orn
Oil
2
Frui
ts &
Veg
etab
les
Bea
ns—
Can
ned
Bak
ed B
eans
1
Can
ned
Bre
ad
1
Ref
ried
Bea
ns
6
Fr
uit—
Can
ned/
Bot
tled
All
Oth
er F
ruit
1
Can
ned/
Bot
tled
App
les
1
Can
ned/
Bot
tled
Apr
icot
s 1
Can
ned/
Bot
tled
Ber
ries
1
Can
ned/
Bot
tled
Che
rrie
s 1
Can
ned/
Bot
tled
Citr
us F
ruit
1
Can
ned/
Bot
tled
Die
t Fru
it 1
Can
ned/
Bot
tled
Gra
pes
1
Can
ned/
Bot
tled
Mix
ed F
ruit
1
Can
ned/
Bot
tled
Peac
hes
1
Can
ned/
Bot
tled
Pear
s 1
Can
ned/
Bot
tled
Pine
appl
e 1
(con
tinue
d)
FDA Labeling Cost Model
A-24
Ta
ble
A-2
. I
RI
Pro
du
ct
Typ
es
Inc
lud
ed
in
th
e L
ab
elin
g C
ost
Mo
de
l P
rod
uc
t C
ate
go
rie
s (c
on
tin
ue
d)
Labe
ling
Cos
t M
odel
Typ
e La
belin
g C
ost
Mod
el C
ateg
ory
IRI
Type
IR
I Sl
ice
Frui
t—C
anne
d/B
ottle
d (c
ontin
ued)
C
anne
d/B
ottle
d Pr
unes
/Plu
m
1 Fr
uits
& V
eget
able
s (c
ontin
ued)
Can
talo
upe/
Mel
on
1
Cra
nber
ry S
auce
1
Pine
appl
e Sa
uce
1
Fr
uit—
Dri
ed
Dat
es
2
Dri
ed P
rune
s 2
Gla
zed
Frui
t 2
Oth
er D
ried
Fru
it 2
Rai
sins
2
Fr
uit—
Dry
Fru
it Sn
acks
Fr
uit R
olls
/Bar
s/Sn
acks
2
Fr
uit—
Fz
Fz F
ruit
12
Fr
uit—
Sauc
e A
pple
sauc
e/Fr
uit S
auce
1
To
mat
o Pr
oduc
ts—
Can
ned/
Bot
tled
Can
ned
And
Bot
tled
Tom
atoe
s 4
To
mat
o Pr
oduc
ts—
Sauc
e Sp
aghe
tti/It
alia
n Sa
uce
4
Tom
ato
Past
e/Sa
uce/
Pure
e 4
Pizz
a Sa
uce
7
V
eget
able
s—C
anne
d/B
ottle
d A
ll O
ther
Bea
ns
8
Can
ned
All
Oth
er V
eget
able
8
Can
ned
Mix
ed V
eget
able
8
Can
ned/
Bot
tled
Car
rots
8
Can
ned/
Bot
tled
Cor
n 8
Can
ned/
Bot
tled
Gre
en B
eans
8
Can
ned/
Bot
tled
Gre
en P
eas
8
Can
ned/
Bot
tled
Mus
hroo
ms
8 (c
ontin
ued)
Appendix A — Additional Product-Level Tables
A-25
Ta
ble
A-2
. I
RI
Pro
du
ct
Typ
es
Inc
lud
ed
in
th
e L
ab
elin
g C
ost
Mo
de
l P
rod
uc
t C
ate
go
rie
s (c
on
tin
ue
d)
Labe
ling
Cos
t M
odel
Typ
e La
belin
g C
ost
Mod
el C
ateg
ory
IRI
Type
IR
I Sl
ice
Veg
etab
les—
Can
ned/
Bot
tled
(con
tinue
d)
Can
ned/
Bot
tled
Saue
rkra
ut
8 Fr
uits
& V
eget
able
s (c
ontin
ued)
Can
ned/
Bot
tled
Spin
ach
8
Pota
to/S
wee
t Pot
ato
8
Ss B
ambo
o Sh
oots
/Wat
er C
hest
nuts
7
V
eget
able
s—D
ried
D
ried
Bea
ns/G
rain
s 6
Dri
ed V
eget
able
s (E
xcep
t Bea
ns)
6
V
eget
able
s—Fr
esh
Cut
Sal
ad
Fres
h C
ut S
alad
11
V
eget
able
s—Fz
Fz
Cor
n O
n Th
e C
ob
12
Fz B
eans
12
Fz B
rocc
oli
12
Fz C
arro
ts
12
Fz C
orn
12
Fz M
ixed
Veg
etab
les
12
Fz O
nion
s 12
Fz O
ther
Pla
in V
eget
able
s 12
Fz P
eas
12
Fz S
pina
ch
12
Fz S
quas
h/Z
ucch
ini
12
Fz P
repa
red
Veg
etab
le (S
auce
/Cru
mbs
) 12
Fz O
nion
Rin
gs
12
Fz P
lain
Pot
atoe
s/Fr
ies/
Has
hbro
wns
12
(c
ontin
ued)
FDA Labeling Cost Model
A-26
Ta
ble
A-2
. I
RI
Pro
du
ct
Typ
es
Inc
lud
ed
in
th
e L
ab
elin
g C
ost
Mo
de
l P
rod
uc
t C
ate
go
rie
s (c
on
tin
ue
d)
Labe
ling
Cos
t M
odel
Typ
e La
belin
g C
ost
Mod
el C
ateg
ory
IRI
Type
IR
I Sl
ice
Infa
nt F
oods
B
aby
Food
B
aby
Food
/Sna
cks
1
Fz B
aby
Food
/Juic
e/Sn
acks
11
B
aby
Form
ula—
Liqu
id C
once
ntra
te
Bab
y Fo
rmul
a—Li
quid
Con
cent
rate
1
B
aby
Form
ula—
Pow
der
Bab
y Fo
rmul
a—Po
wde
r 1
B
aby
Form
ula—
Rea
dy to
Dri
nk
Bab
y Fo
rmul
a—R
td
1
B
aby
Juic
e B
aby
Juic
e 1
Seaf
ood
Seaf
ood—
Can
ned
All
Oth
er F
ish/
Seaf
ood
3
Can
ned
Salm
on
3
Can
ned
Tuna
3
Cla
m Ju
ice
3
Se
afoo
d—Fz
Fz
Fis
h/Se
afoo
d 13
Se
afoo
d—R
fg
Rfg
Fis
h/H
erri
ng/S
eafo
od
15
Side
Dis
hes
& S
tarc
hes
Inst
ant P
otat
oes
Pota
to P
anca
ke/D
umpl
ing
Mix
es
2
Ss In
stan
t Pot
atoe
s 2
Pa
sta—
Dry
N
oodl
es
7
Spag
hetti
/Mac
aron
i/Pas
ta (N
o N
oodl
es)
7
Pa
sta—
Rfg
& F
z R
fg P
asta
/Noo
dle
13
Fz P
asta
/Noo
dles
12
R
ice
Ric
e/R
ice
Mix
es
2
Si
de D
ishe
s—Fz
Fz
Sid
e D
ishe
s 12
Fz A
ppet
izer
s/Sn
ack
Rol
ls
11
Fz B
read
ed V
eget
able
s 11
Fz P
retz
els
11
Fz S
oup
13
(con
tinue
d)

Appendix A — Additional Product-Level Tables
A-27
Ta
ble
A-2
. I
RI
Pro
du
ct
Typ
es
Inc
lud
ed
in
th
e L
ab
elin
g C
ost
Mo
de
l P
rod
uc
t C
ate
go
rie
s (c
on
tin
ue
d)
Labe
ling
Cos
t M
odel
Typ
e La
belin
g C
ost
Mod
el C
ateg
ory
IRI
Type
IR
I Sl
ice
Side
Dis
hes—
Kits
/Mix
es
Dry
Din
ner
Mix
es (A
dd M
eat)
1 Si
de D
ishe
s &
Sta
rche
s (c
ontin
ued)
Dry
Din
ner
Mix
es W
ith M
eat
1
Dry
Mac
aron
i & C
hees
e M
ixes
1
Dry
Sal
ad/S
ide
Dis
h M
ixes
1
Har
d/So
ft To
rtill
as/T
aco
Kits
6
Si
de D
ishe
s—R
fg
Rfg
Sid
e D
ishe
s 11
Rfg
App
etiz
ers/
Snac
k R
olls
11
Rfg
Sal
ad/C
oles
law
11
Rfg
Bak
ed B
eans
14
Si
de D
ishe
s—Sh
elf S
tabl
e Ss
Pre
pare
d Sa
lads
1
Mex
ican
Foo
d Ite
ms
6
Ss O
rien
tal F
ood
Item
s 7
St
uffin
g St
uffin
g M
ixes
4
Fz S
tuffi
ng
13
Snac
k Fo
ods
Nut
s—Sn
ack
Nut
s Sn
ack
Nut
s 4
Sa
lty S
nack
s—B
agge
d C
hees
e Sn
acks
3
Cor
n Sn
acks
(No
Tort
illa
Chi
ps)
3
Pota
to C
hips
3
Pret
zels
3
Rea
dy-T
o-Ea
t Pop
corn
/Car
amel
Cor
n 3
Toas
ted
Cor
n N
ut S
nack
s 3
Tort
illa/
Tost
ado
Chi
ps
3
Ric
e C
akes
/Pop
corn
Cak
es
2 (c
ontin
ued)
FDA Labeling Cost Model
A-28
Ta
ble
A-2
. I
RI
Pro
du
ct
Typ
es
Inc
lud
ed
in
th
e L
ab
elin
g C
ost
Mo
de
l P
rod
uc
t C
ate
go
rie
s (c
on
tin
ue
d)
Labe
ling
Cos
t M
odel
Typ
e La
belin
g C
ost
Mod
el C
ateg
ory
IRI
Type
IR
I Sl
ice
Snac
k Fo
ods
(con
tinue
d)
Salty
Sna
cks—
Oth
er
Oth
er S
alte
d Sn
acks
(No
Nut
s)
3
Nut
ritio
nal S
nack
s/Tr
ail M
ixes
2
Car
ob/Y
ogur
t Coa
ted
Snac
ks
2
Cho
w M
ein
Noo
dles
7
Sa
lty S
nack
s—U
npop
ped
Popc
orn
Ss M
icro
wav
e Po
pcor
n 2
Ker
nel P
opco
rn
2
Fz M
icro
wav
e Po
pcor
n 13
Se
eds—
Snac
k Su
nflo
wer
/Pum
pkin
See
ds
4
Soup
s So
up—
Can
ned
Wet
Sou
p 4
So
up—
Dry
B
ouill
on
4
Dry
Sou
p 4
So
up—
Ram
en
Ram
en
4
Swee
tene
rs
Suga
r B
row
n/Po
wde
r/Fl
avor
ed S
ugar
4
Whi
te G
ranu
late
d Su
gar
4
Cor
n/C
ryst
al/W
hite
Syr
up
4
Frui
t Fla
vore
d Sy
rup
4
Map
le/P
anca
ke &
Waf
fle S
yrup
4
Mol
asse
s 4
Su
gar
Subs
titut
es
Suga
r Su
bstit
utes
4
Wei
ght C
ontr
ol F
oods
W
eigh
t Con
trol
Liq
uid/
Pow
der
Rfg
Wei
ght C
ontr
ol/N
utri
tiona
l Liq
uid/
Pow
der
4
Wei
ght C
ontr
ol/N
utri
tiona
ls L
iqui
d/Po
wde
r 4

Appendix B: Stata Data Sets and Programming Code
B-1
In this appendix, we describe the contents of the data sets for the labeling cost model and provide instructions for viewing and editing the data. We also provide the Stata programming code that calculates the costs of labeling changes.
B.1 STATA FOR WINDOWS DATA SETS The labeling cost model comprises eight separate data sets. In this appendix, we list the data sets, indicate the relationships among them, and provide the format for each. For information on how the data sets were compiled and how they are used in the model, please see Section 4.
The eight data sets in the Stata for Windows model are
Z product.dta,
Z package.dta,
Z inventory.dta,
Z print.dta,
Z label.dta,
Z analytical.dta,
Z market.dta, and
Z sticker.dta.
Tables B-1 through B-8 lists the variable names, variable formats, and relationships for each data set. The tables also indicate which variables are used by the Excel interface.
B.2 EDITING AND VIEWING DATA SETS Stata for Windows provides a Data Editor to conveniently edit or view data sets. The Data Editor is a spreadsheet-style data editor for editing existing data. The Data Editor also has a browse mode that lets you view the data sets without the possibility of accidentally changing the data.
Before editing a data set, please familiarize yourself with the format and relationships of each table. If changes are made to fields that link to other tables, the Stata model will not work. Also, if changes are made to fields linked to the Excel interface, then the Excel interface will not work.
FDA Labeling Cost Model
B-2
To browse data with the Data Editor:
Z Load the data set that you wish to view:
X Pull down File and choose Open. Then select the data set by double-clicking on the filename.
Z Click on the Data Browser icon or type browse in the Command Window.
To edit data with the Data Editor:
Z Load the data set that you wish to edit:
X Pull down File and choose Open. Then select the data set by double-clicking on the filename.
Z Click on the Data Editor icon or type edit in the Command Window.
Z Click on the cell that you would like to change.
Z Type the new value into the cell, then press Tab or Enter.
Z When you exit the editor, a dialog box will ask you to confirm your changes.
X To permanently save changes to the data set, click the Save button or pull down File and choose Save.
Please note that the changes are not permanent unless you save the file.
B.3 STATA PROGRAMMING CODE The programming code for calculating the costs of labeling changes is provided in Exhibit B-1.
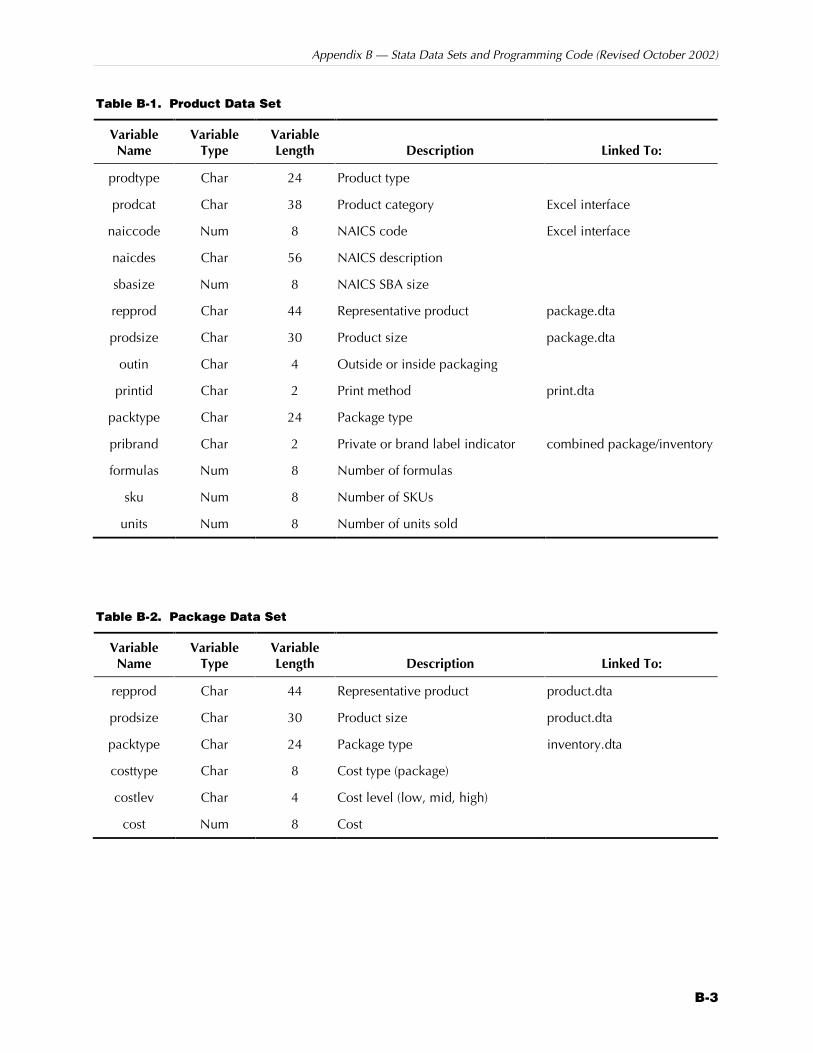
Appendix B — Stata Data Sets and Programming Code (Revised October 2002)
B-3
Table B-1. Product Data Set
Variable Name
Variable Type
Variable Length Description Linked To:
prodtype Char 24 Product type
prodcat Char 38 Product category Excel interface
naiccode Num 8 NAICS code Excel interface
naicdes Char 56 NAICS description
sbasize Num 8 NAICS SBA size
repprod Char 44 Representative product package.dta
prodsize Char 30 Product size package.dta
outin Char 4 Outside or inside packaging
printid Char 2 Print method print.dta
packtype Char 24 Package type
pribrand Char 2 Private or brand label indicator combined package/inventory
formulas Num 8 Number of formulas
sku Num 8 Number of SKUs
units Num 8 Number of units sold
Table B-2. Package Data Set
Variable Name
Variable Type
Variable Length Description Linked To:
repprod Char 44 Representative product product.dta
prodsize Char 30 Product size product.dta
packtype Char 24 Package type inventory.dta
costtype Char 8 Cost type (package)
costlev Char 4 Cost level (low, mid, high)
cost Num 8 Cost
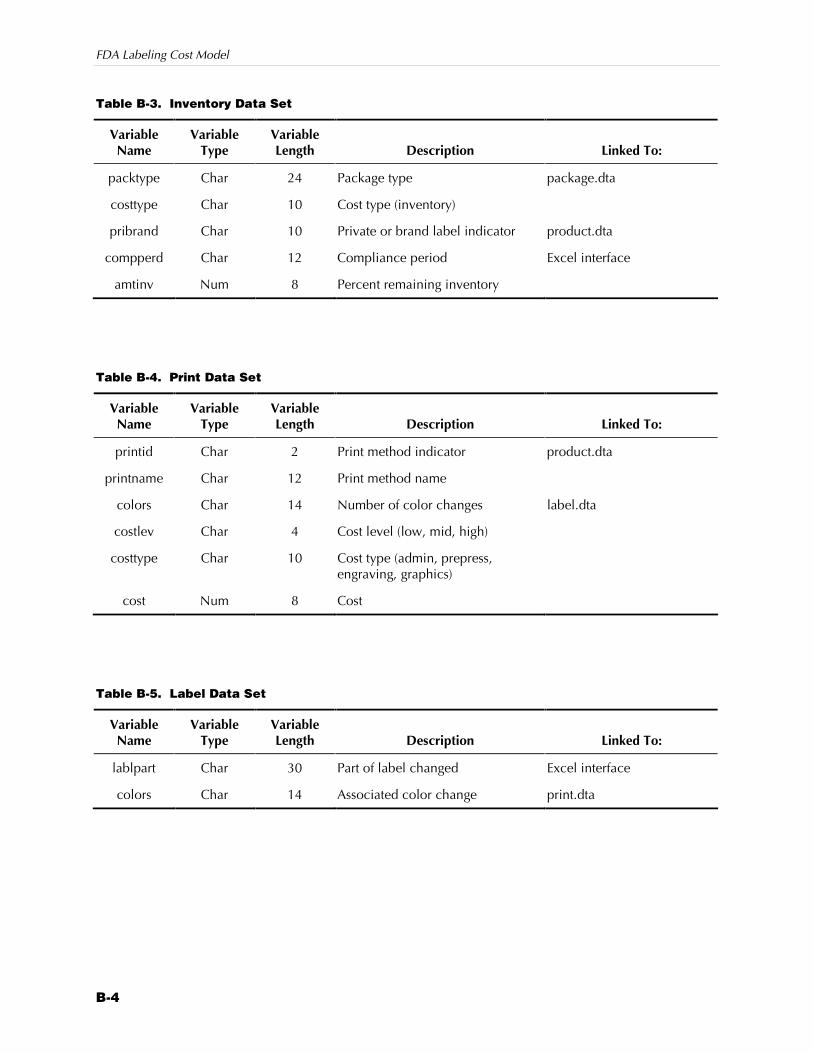
FDA Labeling Cost Model
B-4
Table B-3. Inventory Data Set
Variable Name
Variable Type
Variable Length Description Linked To:
packtype Char 24 Package type package.dta
costtype Char 10 Cost type (inventory)
pribrand Char 10 Private or brand label indicator product.dta
compperd Char 12 Compliance period Excel interface
amtinv Num 8 Percent remaining inventory
Table B-4. Print Data Set
Variable Name
Variable Type
Variable Length Description Linked To:
printid Char 2 Print method indicator product.dta
printname Char 12 Print method name
colors Char 14 Number of color changes label.dta
costlev Char 4 Cost level (low, mid, high)
costtype Char 10 Cost type (admin, prepress, engraving, graphics)
cost Num 8 Cost
Table B-5. Label Data Set
Variable Name
Variable Type
Variable Length Description Linked To:
lablpart Char 30 Part of label changed Excel interface
colors Char 14 Associated color change print.dta
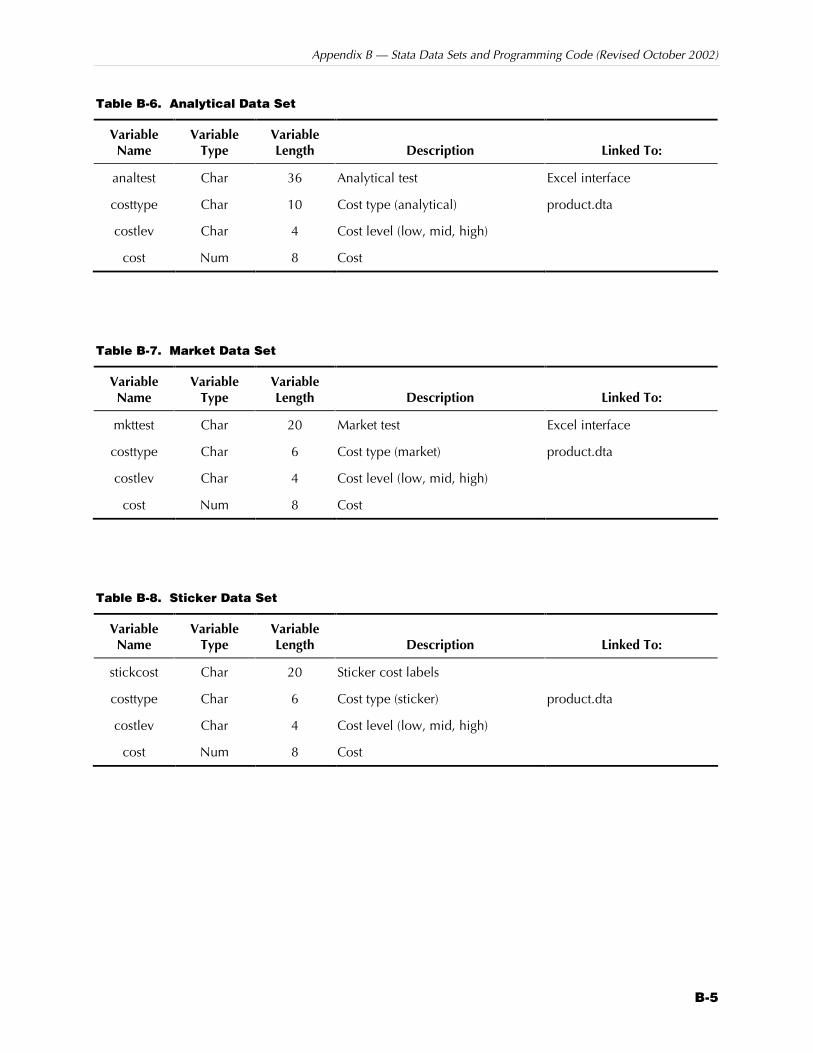
Appendix B — Stata Data Sets and Programming Code (Revised October 2002)
B-5
Table B-6. Analytical Data Set
Variable Name
Variable Type
Variable Length Description Linked To:
analtest Char 36 Analytical test Excel interface
costtype Char 10 Cost type (analytical) product.dta
costlev Char 4 Cost level (low, mid, high)
cost Num 8 Cost
Table B-7. Market Data Set
Variable Name
Variable Type
Variable Length Description Linked To:
mkttest Char 20 Market test Excel interface
costtype Char 6 Cost type (market) product.dta
costlev Char 4 Cost level (low, mid, high)
cost Num 8 Cost
Table B-8. Sticker Data Set
Variable Name
Variable Type
Variable Length Description Linked To:
stickcost Char 20 Sticker cost labels
costtype Char 6 Cost type (sticker) product.dta
costlev Char 4 Cost level (low, mid, high)
cost Num 8 Cost

FDA Labeling Cost Model
B-6
Exhibit B-1. Stata Programming Code for the Labeling Cost Model
******************************** *Labeling Cost Model * *November 12, 2001 * *Revised April 22, 2002 * *Revised October 8, 2002 * *RTI * *Stata version 7.0 * ******************************** capture program drop labmodel program define labmodel set more off tempfile prod results comp pack anal stick mark all costs soda ***Product Choices******************************************** *Create a temporary product file based on User’s choices. * *This temporary file will be used to build the results files.* ************************************************************** use c:\Labels\product.dta, clear preserve keep if $Product /*SKUs, Units, and Formulas based on % of industry that can’t coordinate change*/ gen psku=sku*(1-$PChange) replace psku=sku*(1-$BChange) if pribrand=="B" gen punits=units*(1-$PChange) replace punits=units*(1-$BChange) if pribrand=="B" gen pformulas=formulas*(1-$PChange) replace pformulas=formulas*(1-$BChange) if pribrand=="B" drop sku units formulas sort printid save "‘prod’", replace ***Print Costs (Color Change)*********************************** *Join temp product file with Print Table (join=printid) * *Keep records based on User’s label change choices (# colors). * *Start building the Results file. * **************************************************************** use c:\Labels\print.dta, clear sort printid save c:\Labels\print.dta, replace

Appendix B — Stata Data Sets and Programming Code (Revised October 2002)
B-7
use "‘prod’", clear joinby printid using c:\Labels\print.dta keep if $Color drop colors save "‘results’", replace ***Inventory Costs (Compliance period)******************************************************** *Join temp product file with Package Table (join=repprod) to bring in costs. * *Join above file with Inventory Table (join=packtype pribrand) to bring in compliance period.* *Keep records based on user’s compliance period choice. * *Calculate inventory costs using (packagecost times amtofinventory). * *Save results as temp file, append onto results file. * ***************************************************************** use c:\Labels\package.dta, clear sort repprod prodsize save c:\Labels\package.dta, replace /****Package table and costs****/ use "‘prod’", clear sort repprod prodsize joinby repprod prodsize using c:\Labels\package.dta sort packtype pribrand drop costtype save "‘comp’", replace use c:\Labels\inventory.dta, clear sort packtype pribrand save c:\Labels\inventory.dta, replace /****Inventory table, compliance period, and amt of inventory****/ use "‘comp’", clear joinby packtype pribrand using c:\Labels\inventory.dta /****If Compliance=6 months use 12 months numbers else use User’s choice****/ if $Comp==6 { keep if compperd=="12 months"} else { keep if $Comply} drop compperd replace cost=cost*amtinv save "‘pack’", replace
FDA Labeling Cost Model
B-8
use "‘results’", clear append using "‘pack’" save "‘results’", replace /****If Compliance=6 months bring in additional sticker costs ****/ /****Merge onto temp product file (join=costtype), append to results file****/ if $Comp==6 { use c:\Labels\sticker.dta, clear qui collapse (sum) cost, by(costtype costlev) save "‘stick’", replace use "‘prod’", clear gen str10 costtype="sticker" joinby costtype using "‘stick’" save "‘stick’", replace use "‘results’", clear append using "‘stick’" save "‘results’", replace} ***Analytical Costs****************************************************** *Get User’s analytical choices. Collapse (sum) the costs into one cost.* *Add Additional Tests Costs (if applicable). * *Merge onto temp product file (join=costtype). * *Save results as temp file, append onto results table. * ************************************************************************* /****Check if Analytical tests were chosen****/ if $TogAnal==1 { use c:\Labels\analytical.dta, clear keep if $Analyte qui collapse (sum) cost, by(costtype costlev) replace cost = cost + $AddTest save "‘anal’", replace use "‘prod’", clear gen str10 costtype="analytical" joinby costtype using "‘anal’" save "‘anal’", replace use "‘results’", clear append using "‘anal’" save "‘results’", replace} /****If No tests chosen but Additional Tests were added ****/ /****Collapse Analytical Table, replace costs with Additional Test Costs****/ /****Append onto results file ****/ else if $TogAnal==0 & $AddTest>0 {

Appendix B — Stata Data Sets and Programming Code (Revised October 2002)
B-9
use c:\Labels\analytical.dta, clear qui collapse (sum) cost, by(costtype costlev) replace cost = $AddTest save "‘anal’", replace use "‘prod’", clear gen str10 costtype="analytical" joinby costtype using "‘anal’" save "‘anal’", replace use "‘results’", clear append using "‘anal’" save "‘results’", replace} ***Market Costs********************************************************** *Get User’s market choices. Collapse (sum) the costs into one cost. * *Merge onto temp product file (join=costtype). * *Save results as temp file, append onto results table. * ************************************************************************* if $TogMark==1 { use c:\Labels\market.dta, clear keep if $Market qui collapse (sum) cost, by(costtype costlev) save "‘mark’" use "‘prod’", clear gen str10 costtype="market" joinby costtype using "‘mark’" save "‘mark’", replace use "‘results’", clear append using "‘mark’" save "‘results’", replace} ***Scaling Up All Costs using SKU or Units******** *Using results file * *Calculations based on cost type * *All costs multiplied by Price Adjustment factor * ************************************************** /****Print and Admin Costs ****/ /****If compliance= 6 or 12 months then multiply by 1.1 ****/ gen newcost=cost*psku*$Inflate*$Adj if costtype=="admin" | costtype=="engraving" | costtype=="graphic" | costtype=="prepress" /***Analytical costs ****/ /***Two tests per product and additional shipping and handling costs (41.03) **/ replace newcost=((cost*2)+41.03)*(pformulas)*$Inflate if costtype=="analytical" & outin=="out"

FDA Labeling Cost Model
B-10
/****Market, Inventory, Sticker Costs****/ replace newcost=(cost*(pformulas)*$Inflate) if costtype=="market" & outin=="out" replace newcost=cost*punits*$Inflate if costtype=="inventory" replace newcost=cost*(punits/2)*$Inflate if costtype=="sticker" & outin=="out" drop cost rename newcost cost sort prodtype prodcat pribrand costtype costlev save "‘results’", replace ***Costs by Cost Type************************************************************************ *Some products have 2 packages (in and out). Need to collapse to one. * *Exception=Carbonated Beverages which has 3 packages * *Collapse costs by product type, product category, private/branded, cost type * *Join with temp product table (join=prodtype prodcat pribrand) to bring in descriptor fields* *Save results as a permanent dataset then output as tab-delimited file * ********************************************************************************* use "‘results’", clear collapse (sum) cost, by(prodtype prodcat pribrand costtype costlev) sort prodtype prodcat pribrand save"‘costs’",replace if $Coke==1 { use "‘prod’", clear keep if prodcat=="Carbonated Beverages-Regular" | prodcat=="Carbonated Beverages-Sugar Substitute" keep if outin=="out" sort prodcat pribrand collapse (sum) psku punits, by(prodcat pribrand) save "‘soda’", replace use "‘prod’", clear sort prodtype prodcat pribrand drop if outin=="in" drop if repprod=="Coca-Cola" & printid=="F" drop if repprod=="Diet Coke" & printid=="F" sort prodcat pribrand merge prodcat pribrand using "‘soda’", update replace sort prodtype prodcat pribrand tabulate _merge drop _merge}
Appendix B — Stata Data Sets and Programming Code (Revised October 2002)
B-11
else { use "‘prod’", clear sort prodtype prodcat pribrand drop if outin=="in"} joinby prodtype prodcat pribrand using "‘costs’" rename psku sku rename punits units rename pformulas formulas drop outin save c:\Labels\allcosts.dta, replace outsheet using c:\Labels\allcosts.out, replace /***Create Aggregate Cost File***/ use "C:\Labels\allcosts.dta", clear sort prodtype prodcat naiccode naicdes pribrand sku units formulas costlev collapse (sum) cost, by(prodtype prodcat naiccode naicdes pribrand sku units formulas costlev) reshape wide cost, i(prodtype prodcat pribrand) j(costlev) string save "C:\Labels\labelcostag.dta", replace outsheet using "C:\Labels\labelcostag.out", replace end


![Label Me Wise: Nutrition Labeling Update€¦ · Nutrition Labeling – FDCA 403(q) If [FDA] determines that another “nutrient . . . should be included in the label or labeling](https://static.fdocuments.net/doc/165x107/5fb8056f3648730f461fee44/label-me-wise-nutrition-labeling-update-nutrition-labeling-a-fdca-403q-if-fda.jpg)