FCC Verification Test Report
69
Report No.: FV130424E06E Page No. 1 / 45 Report Format Version: 6.1.0 Reference No.: 150427E11, 150526E01 FCC Verification Test Report Report No.: FV130424E06E Test Model: VC-A50, PTC-120 Series Model: VC-X50, VC-X30, VC-501, VC-502, VC-301, VC-302, VC-302X, VC-502X, VC-A50X (where X can be A to Z for marketing purpose only) Received Date: Apr. 30, 2013 Test Date: Apr. 30, 2013 and Aug. 12 to 22, 2014 Issued Date: June 03, 2015 Applicant: Lumens Digital Optics Inc. Address: 5F.-1, No.20, Taiyuan St., Zhubei City, Hsinchu County 302 Issued By: Bureau Veritas Consumer Products Services (H.K.) Ltd., Taoyuan Branch Hsin Chu Laboratory Lab Address: No. 81-1, Lu Liao Keng, 9th Ling,Wu Lung Tsuen, Chiung Lin Hsiang, Hsin Chu Hsien 307, Taiwan R.O.C. Test Location (1): No. 81-1, Lu Liao Keng, 9th Ling,Wu Lung Tsuen, Chiung Lin Hsiang, Hsin Chu Hsien 307, Taiwan R.O.C. Test Location (2): No. 49, Ln. 206, Wende Rd., Shangshan Tsuen, Chiung Lin Hsiang, Hsin Chu Hsien 307, Taiwan R.O.C. This report is for your exclusive use. Any copying or replication of this report to or for any other person or entity, or use of our name or trademark, is permitted only with our prior written permission. This report sets forth our findings solely with respect to the test samples identified herein. The results set forth in this report are not indicative or representative of the quality or characteristics of the lot from which a test sample was taken or any similar or identical product unless specifically and expressly noted. Our report includes all of the tests requested by you and the results thereof based upon the information that you provided to us. You have 60 days from date of issuance of this report to notify us of any material error or omission caused by our negligence, provided, however, that such notice shall be in writing and shall specifically address the issue you wish to raise. A failure to raise such issue within the prescribed time shall constitute your unqualified acceptance of the completeness of this report, the tests conducted and the correctness of the report contents. Unless specific mention, the uncertainty of measurement has been explicitly taken into account to declare the compliance or non-compliance to the specification. The report must not be used by the client to claim product certification, approval, or endorsement by NVLAP, NIST, or any agency of the federal government. The report must not be used by the client to claim product certification, approval, or endorsement by TAF or any government agencies.
Transcript of FCC Verification Test Report

Report No.: FV130424E06E Page No. 1 / 45 Report Format Version: 6.1.0Reference No.: 150427E11, 150526E01
FCC Verification Test Report
Report No.: FV130424E06E
Test Model: VC-A50, PTC-120
Series Model: VC-X50, VC-X30, VC-501, VC-502, VC-301, VC-302, VC-302X, VC-502X, VC-A50X (where X can be A to Z for marketing purpose only)
Received Date: Apr. 30, 2013
Test Date: Apr. 30, 2013 and Aug. 12 to 22, 2014
Issued Date: June 03, 2015
Applicant: Lumens Digital Optics Inc.
Address: 5F.-1, No.20, Taiyuan St., Zhubei City, Hsinchu County 302
Issued By: Bureau Veritas Consumer Products Services (H.K.) Ltd., Taoyuan Branch Hsin Chu Laboratory
Lab Address: No. 81-1, Lu Liao Keng, 9th Ling,Wu Lung Tsuen, Chiung Lin Hsiang, Hsin Chu Hsien 307, Taiwan R.O.C.
Test Location (1): No. 81-1, Lu Liao Keng, 9th Ling,Wu Lung Tsuen, Chiung Lin Hsiang, Hsin Chu Hsien 307, Taiwan R.O.C.
Test Location (2): No. 49, Ln. 206, Wende Rd., Shangshan Tsuen, Chiung Lin Hsiang, Hsin Chu Hsien 307, Taiwan R.O.C.
This report is for your exclusive use. Any copying or replication of this report to or for any other person or entity, or use of our name or trademark, is permitted only with our prior written permission. This report sets forth our findings solely with respect to the test samples identified herein. The results set forth in this report are not indicative or representative of the quality or characteristics of the lot from which a test sample was taken or any similar or identical product unless specifically and expressly noted. Our report includes all of the tests requested by you and the results thereof based upon the information that you provided to us. You have 60 days from date of issuance of this report to notify us of any material error or omission caused by our negligence, provided, however, that such notice shall be in writing and shall specifically address the issue you wish to raise. A failure to raise such issue within the prescribed time shall constitute your unqualified acceptance of the completeness of this report, the tests conducted and the correctness of the report contents. Unless specific mention, the uncertainty of measurement has been explicitly taken into account to declare the compliance or non-compliance to the specification. The report must not be used by the client to claim product certification, approval, or endorsement by NVLAP, NIST, or any agency of the federal government.The report must not be used by the client to claim product certification, approval, or endorsement by TAF or any government agencies.

Report No.: FV130424E06E Page No. 2 / 45 Report Format Version: 6.1.0Reference No.: 150427E11, 150526E01
Table of Contents Release Control Record .................................................................................................................................. 3
1 Certificate of Conformity ......................................................................................................................... 4
2 Summary of Test Results......................................................................................................................... 5
2.1 Measurement Uncertainty ................................................................................................................... 5 2.2 Modification Record ............................................................................................................................ 5
3 General Information ................................................................................................................................. 6
3.1 Features of EUT .................................................................................................................................. 6 3.2 General Description of EUT ................................................................................................................ 6 3.3 Operating Modes of EUT and Determination of Worst Case Operating Mode ................................... 7 3.4 Test Program Used and Operation Descriptions ................................................................................. 8 3.5 Primary Clock Frequencies of Internal Source ................................................................................... 8 3.6 Miscellaneous...................................................................................................................................... 9
4 Configuration and Connections with EUT ........................................................................................... 10
4.1 Connection Diagram of EUT and Peripheral Devices ....................................................................... 10 4.2 Configuration of Peripheral Devices and Cable Connections ........................................................... 12
5 Conducted Emissions at Mains Ports .................................................................................................. 13
5.1 Limits ................................................................................................................................................. 13 5.2 Test Instruments ................................................................................................................................ 13 5.3 Test Arrangement .............................................................................................................................. 15 5.4 Supplementary Information ............................................................................................................... 15 5.5 Test Results (Mode 1) ....................................................................................................................... 16 5.6 Test Results (Mode 2) ....................................................................................................................... 18 5.7 Test Results (Mode 3) ....................................................................................................................... 20
6 Radiated Emissions up to 1 GHz .......................................................................................................... 22
6.1 Limits ................................................................................................................................................. 22 6.2 Test Instruments ................................................................................................................................ 23 6.3 Test Arrangement .............................................................................................................................. 25 6.4 Supplementary Information ............................................................................................................... 25 6.5 Test Results (Mode 1) ....................................................................................................................... 26 6.6 Test Results (Mode 2) ....................................................................................................................... 28
7 Radiated Emissions above 1 GHz ......................................................................................................... 30
7.1 Limits ................................................................................................................................................. 30 7.2 Test Instruments ................................................................................................................................ 31 7.3 Test Arrangement .............................................................................................................................. 33 7.4 Supplementary Information ............................................................................................................... 33 7.5 Test Results (Mode 1) ....................................................................................................................... 34 7.6 Test Results (Mode 2) ....................................................................................................................... 36
8 Pictures of Test Arrangements ............................................................................................................. 38
8.1 Conducted Emissions at Mains Ports ............................................................................................... 38 8.2 Radiated Emissions up to 1 GHz ...................................................................................................... 41 8.3 Radiated Emissions above 1 GHz .................................................................................................... 43
Appendix – Information on the Testing Laboratories ................................................................................ 45

Report No.: FV130424E06E Page No. 3 / 45 Report Format Version: 6.1.0Reference No.: 150427E11, 150526E01
Release Control Record
Issue No. Description Date Issued
FV130424E06E Original release. June 03, 2015


Report No.: FV130424E06E Page No. 5 / 45 Report Format Version: 6.1.0Reference No.: 150427E11, 150526E01
2 Summary of Test Results
47 CFR FCC Part 15, Subpart B / ICES-003:2012 Issue 5, Class A
ANSI C63.4:2009 FCC
Clause ICES-003
Clause Test Item Result/Remarks Verdict
15.107 6.1 AC Power Line Conducted Emissions
Minimum passing Class A margin is -19.88 dB at 0.17734 MHz
Pass
15.109 6.2.1
Radiated Emissions up to 1 GHz
Minimum passing Class A margin is -3.27 dB at 30.16 MHz
Pass
6.2.2 Radiated Emissions above 1 GHz
Minimum passing Class A margin is -5.95 dB at 1336.51 MHz
Pass
Note: There is no deviation to the applied test methods and requirements covered by the scope of this report.
2.1 Measurement Uncertainty
Where relevant, the following measurement uncertainty levels have been estimated for tests performed on the EUT:
The listed uncertainties are the worst case uncertainty for the entire range of measurement. Please note that the uncertainty values are provided for informational purposes only and are not used in determining the PASS/FAIL results.
For test mode 1:
Measurement Value
Conducted emissions 2.98 dB
Radiated emissions (30MHz-1GHz) 4.12 dB
Radiated emissions (1GHz-6GHz) 3.53 dB
For test mode 2~3:
Measurement Frequency Expended Uncertainty
(k=2) (±)
Conducted Emissions at mains ports 150kHz ~ 30MHz 2.86 dB
Radiated Emissions up to 1 GHz 30MHz ~ 1GHz 3.99 dB
Radiated Emissions above 1 GHz Above 1GHz 3.72 dB
2.2 Modification Record
There were no modifications required for compliance.

Report No.: FV130424E06E Page No. 6 / 45 Report Format Version: 6.1.0Reference No.: 150427E11, 150526E01
3 General Information
3.1 Features of EUT
The tests reported herein were performed according to the method specified by Lumens Digital Optics Inc., for detailed feature description, please refer to the manufacturer's specifications or user's manual.
3.2 General Description of EUT
Product Camera, PTZ Video Camera, HD/SD PTZ Camera
Brand Lumens, datavideo
Test Model VC-A50, PTC-120
Series Model VC-X50, VC-X30, VC-501, VC-502, VC-301, VC-302, VC-302X, VC-502X, VC-A50X (where X can be A to Z for marketing purpose only)
Sample Status ENGINEERING SAMPLE
Operating Software NA
Power Supply Rating DC 12V from power adapter
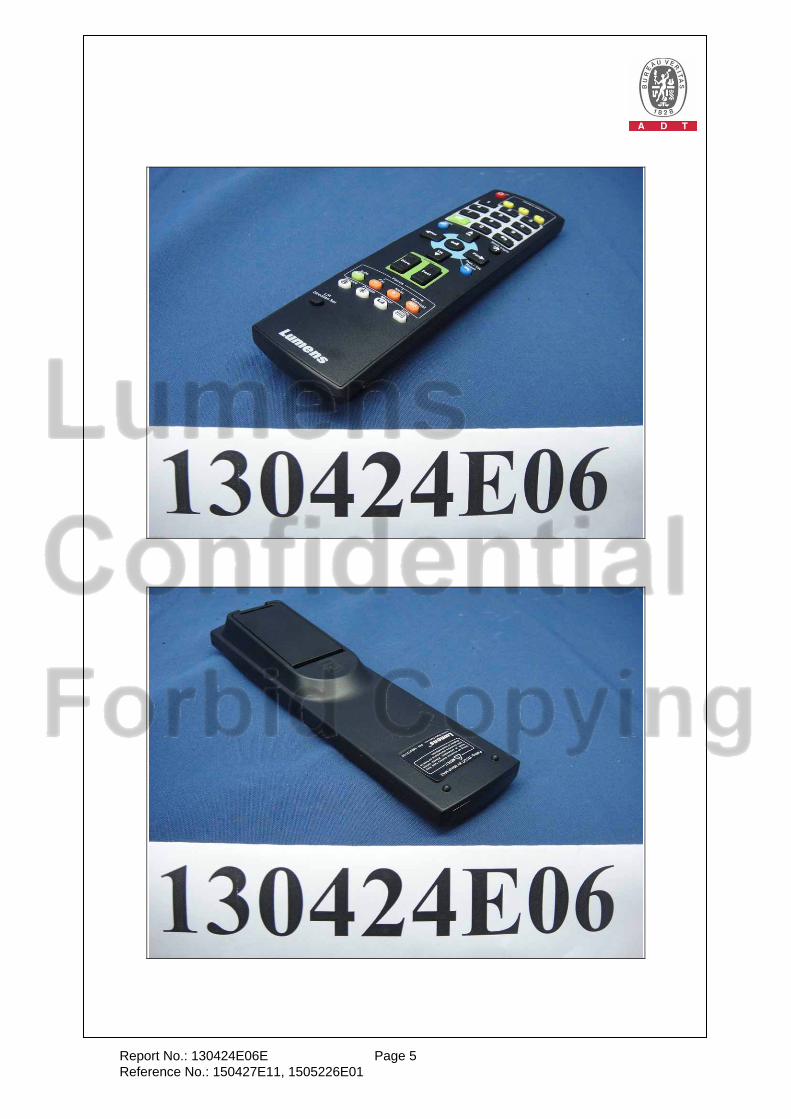
Accessory Device
Remote controller x 1
Adapter x 1
Mount x 1
Mount & Spring x 1
Header 9Pin x 1
Data Cable Supplied VIDEO cable x 1 (unshielded, 1.8m)
Note:
1. This report is a supplementary report of the following original report : FV130424E06D: Issued on May 07, 2015
The main changes are as the following information: Added one product name as below table:
Original
Product Brand Model No. Difference
Camera Lumens
VC-A50
For marketing requirement
VC-X50 VC-X30 VC-501 VC-502 VC-301 VC-302
HD/SD PTZ Camera datavideo PTC-120 With different DC jack, color of enclosure & adapters.
Camera Lumens VC-302X Same as Model No. “VC-302、VC-502”, with different
color of enclosure VC-502X VC-A50X Same as Model No. “VC-A50”
where X can be A to Z for marketing purpose only Newly
Product Brand Model No. Difference
PTZ Video Camera Lumens VC-A50X Same as Model No. “VC-A50”, with different color of enclosure
where X can be A to Z for marketing purpose only For the final test, model: VC-A50 and PTC-120 were selected as the representative model for the test and its data is recorded in this report.
According to above conditions, there is no addition test has to be performed. All test data were
copied from the original test report (Report No.: FV130424E06D) and all data were verified to
meet the requirements.

Report No.: FV130424E06E Page No. 7 / 45 Report Format Version: 6.1.0Reference No.: 150427E11, 150526E01
2. The EUT must be supplied with a power as following table:
No. Brand Model No. Spec.
1 Asian DA-36B12
AC Input: 100-240V, 50-60Hz, 1A AC input cable (unshielded, 1.8m) DC Output: 12V, 3A DC Output cable (unshielded, 1.5m)
Only for Model No.: PTC-120 used
No. Brand Model No. Spec.
2 Sunny SYS1308-2412-W2
Input: 100-240V, 1.0A, 50-60Hz
Output: 12.0V 1.5A
DC output cable(1.8m, unshielded)
3 Sunny SYS1357-2412
Input: 100-240V, 1.0A, 50-60Hz
Output:12V 2.0A
DC output cable(1.4m, unshielded)
3.3 Operating Modes of EUT and Determination of Worst Case Operating Mode
The EUT is designed with AC power of rating 100-240Vac, 50/60Hz.
In the original report, for radiated emission evaluation, 230Vac/50Hz (for EN 55022) & 120Vac/60Hz (for FCC Part 15) had been covered during the pre-test. The worst data was found at 230Vac/50Hz and recorded in the applied test report. In the original report, the EUT has been pre-tested under following test modes, and test modes 2, 4 were the worst case for final test.
Mode Test Condition (Radiated test)
Signal Input Type Adapter
1 RS232 1920*1080 1
2 RS422 1920*1080 1
3 RS422 1280*720 1
4 1920x1080/59.94p 2
5 1920x1080/59.94p 3
6 1280x720/25p 2 Test modes are presented in the report as below.
Mode
Test Condition
Conducted test
Signal Input Type Adapter
1 RS422 1920*1080 1
2 1920x1080/59.94p 2
3 1920x1080/59.94p 3
Mode
Test Condition
Radiated test
Signal Input Type Adapter
1 RS422 1920*1080 1
2 1920x1080/59.94p 2

Report No.: FV130424E06E Page No. 8 / 45 Report Format Version: 6.1.0Reference No.: 150427E11, 150526E01
3.4 Test Program Used and Operation Descriptions
For conducted test mode 1:
1. Turn on the power of all equipment.
2. Support unit 1 (PC) runs ” Video Conference.exe” to link with EUT via an adapter.
3. EUT sends image messages to support units 2~5 (MONITOR) via one DVI cable, one video cable, one
SDI cable and one component cable.
For conducted test mode 2~3:
1. Turn on the power of all equipment.
2. EUT runs live view mode and sends image messages to support unit A (Monitor) via one DVI cable.
For radiated test mode 1:
1. Turn on the power of all equipment.
2. Support unit 1 (PC) runs ” Video Conference.exe” to link with EUT via an adapter.
3. EUT sends image messages to support units 2~5 (MONITOR) via one DVI cable, one video cable, one
SDI cable and one component cable.
For radiated test mode 2:
1. Turn on the power of all equipment.
2. EUT runs live view mode and sends image messages to support unit A (Monitor) via one DVI cable.
3.5 Primary Clock Frequencies of Internal Source
The highest frequency generated or used within the EUT or on which the EUT operates or tunes is 148.5 MHz,
provided by Lumens Digital Optics Inc., for detailed internal source, please refer to the manufacturer's
specifications.

Report No.: FV130424E06E Page No. 9 / 45 Report Format Version: 6.1.0Reference No.: 150427E11, 150526E01
3.6 Miscellaneous
Labelling Requirements for Part 15 Devices:
Verification
The specific labelling requirements for a device subject to the Verification procedure are contained in Section 15.19(a). These labelling requirements are:
If the device is subject only to Verification, include a label bearing a unique identifier (Section 2.954) and one of three compliance statements specified in Section 15.19(a). If the labeling area for the device is so small, and/or it is not practical to place the compliance statement on the device, then the statement can be placed in the user manual or product packaging (Section 15.19(a)(5)). However, the device must still be labelled with the unique identifier (Verification). Generally, devices smaller than the palm of the hand are considered too small for the compliance statement.
Certification
If the device is subject to Certification: (1) Section 2.925 contains information on identification of the equipment; (2) include a label bearing an FCC Identifier (FCC ID) (Section 2.926) and (3) include the appropriate compliance statement in Section 15.19(a). If the device is considered too small and therefore it is impractical (smaller than the palm of the hand) to display the compliance statement, then the statement may be placed in the user manual or product packaging. However, the device must still be labelled with the FCC ID. If the device is unquestionably too small for the FCC ID to be readable (smaller than 4-6 points), the FCC ID may be placed in the user manual. However, it must be determined that the device itself is too small – the label area allocated to the FCC ID may not be reduced because of over crowded identification of other product and regulatory information.
An electronic display of the FCC ID (see 9. Electronic Labelling below) may be used for Certification of Section 15.212 modular transmitters and software defined radios (Section 2.944).
Declaration of Conformity (DoC):
The labelling requirements for a device subject to the DoC procedure are specified in Section 15.19(b). The label should include the FCC logo along with the Trade Name and Model Number, which satisfies the unique identifier requirement of Section 2.1074 if it represents the identical equipment tested for DoC compliance. For personal computers assembled from authorized components, the following additional text must also be included: “Assembled from tested components,” “Complete system not tested.” When the device is so small and/or when it is not practical to place the required additional text on the device, the text may be placed in the user manual or pamphlet supplied to the user. However, the FCC logo, Trade Name, and Model Number must still be displayed on the device (Section 15.19(b)(3)).
Part 15 Declaration of Conformity (DoC) Label Examples
Equipment certified as software defined radio may use a means that readily displays the FCC ID on an electronic display screen, instead of labelling the device (Section 2.925 (e)).
Further information may refer to FCC KDB:784748 D01 Labelling Part 15 &18 Guidelines
Labelling Requirements for ICES-003 Devices:
Industry Canada ICES-003 Compliance Label:
CAN ICES-3 (*)/NMB-3(*)
* Insert either “A” or “B” but not both to identify the applicable Class of ITE.

Report No.: FV130424E06E Page No. 10 / 45 Report Format Version: 6.1.0Reference No.: 150427E11, 150526E01
4 Configuration and Connections with EUT
4.1 Connection Diagram of EUT and Peripheral Devices
For Conducted / Radiated test mode 1:
NOTE: Item A is the Remote Control.
TEST TABLE
DC cable (1.8m) DC cable (1.8m) Video cable (1.8m) SDI cable (1.8m) RS232 cable (1.8m)
A
Component cable (1.8m)
6. PRINTER
4. MONITOR
3. MONITOR
1. PERSONAL COMPUTER
Adapter
7. KEYBOARD
EUT (1)
8. MOUSE
5. MONITOR
EUT (2)
2. MONITOR
ac to dc adapter
DVI cable (1.8m)
RS232 cable (1.8m)

Report No.: FV130424E06E Page No. 11 / 45 Report Format Version: 6.1.0Reference No.: 150427E11, 150526E01
For Conducted / Radiated test mode 2~3:
Note: The test Configuration was defined by the applicant requirement.
Remote site
Remote
controller (B)
EUTDVI
1
Video out
DC in
COMPONENT out
(VGA)
3G-SDI out
RS232 out
RS232 in
RS422
Monitor (A)
6
7
2
8
4
3
5
Adapter

Report No.: FV130424E06E Page No. 12 / 45 Report Format Version: 6.1.0Reference No.: 150427E11, 150526E01
4.2 Configuration of Peripheral Devices and Cable Connections
For Conducted / Radiated test mode 1
NO. PRODUCT BRAND MODEL NO. SERIAL NO. FCC ID
1 PERSONAL
COMPUTER DELL DCSCMF 9KKB32S FCC DoC
2 MONITOR DELL U2410F CNOJ257M728729AG159L FCC DoC
3 MONITOR DELL U2410f CN-082WXD-72872-OCN-06NL FCC DoC
4 MONITOR DELL E2210Hc CN-OG337R-64180-97S-OQGS FCC DoC
5 MONITOR Ikegami HLM-2450WB NA NA
6 PRINTER EPSON LQ-300+II G88Y074083 FCC DoC
7 KEYBOARD DELL SK-8115 MY-0J4635-71619-67V-0111 FCC DoC
8 MOUSE DELL MOC5UO l1401LVG FCC DoC
For Conducted / Radiated test mode 1
NO. SIGNAL CABLE DESCRIPTION OF THE ABOVE SUPPORT UNITS
1 RS232 cable (1.8m) / USB cable (1m)
2 DVI cable (1.8m, with 2 cores)
3 Video cable (1.8m)
4 SDI cable (1.8m)
5 Component cable (1.8m)
6 USB cable (1.8m)
7 USB cable (1.8m, with 1 core)
8 USB cable (1.8,)
For Conducted test mode 2~3 / Radiated test mode 2
No. Product Brand Model No. Serial No. FCC ID Remark
A MONITOR DELL U2410f CN-0J257M-72872-2BC-A4UL FCC DoC Provided by Lab
B REMOTE
CONTROLLER NA NA NA NA Supplied by client
NOTE:
1. All power cords of the above support units are non-shielded (1.8 m).
For Conducted test mode 2~3 / Radiated test mode 2
No. Cable Qty. Length (m)Shielded (Yes/ No)
Cores (Number)
Remark
1 DC 1 1.8 / 1.4 Yes 0 Supplied by client
2 VGA to Component (Y
Pb Pr) 1 1.5 Yes 1 Supplied by client
3 DVI 1 1.8 Yes 2 Provided by Lab
4 Video 1 1.8 Yes 0 Provided by Lab
5 3G-SDI 1 1.5 Yes 0 Supplied by client
6 VISCA to RS232 1 1 Yes 0 Supplied by client
7 VISCA 1 0.6 Yes 0 Supplied by client
8 RS422 to RS232 1 0.1 Yes 1 Supplied by client
NOTE:
1. The core(s) is(are) originally attached to the cable(s).

Report No.: FV130424E06E Page No. 13 / 45 Report Format Version: 6.1.0Reference No.: 150427E11, 150526E01
5 Conducted Emissions at Mains Ports
5.1 Limits
Frequency (MHz) Class A (dBuV) Class B (dBuV)
Quasi-peak Average Quasi-peak Average
0.15 - 0.5 79 66 66 - 56 56 - 46
0.50 - 5.0 73 60 56 46
5.0 - 30.0 73 60 60 50 Notes: 1. The lower limit shall apply at the transition frequencies.
2. The limit decreases linearly with the logarithm of the frequency in the range of 0.15 to 0.50 MHz.
5.2 Test Instruments
For test mode 1:
DESCRIPTION &
MANUFACTURER MODEL NO. SERIAL NO.
CALIBRATED
DATE
CALIBRATED
UNTIL
Test Receiver ESCS 30 100375 Mar. 11, 2013 Mar. 10, 2014
Line-Impedance Stabilization Network (for EUT) SCHWARZBECK
NSLK8127 8127-522 Sep. 06, 2012 Sep. 05, 2013
Line-Impedance
Stabilization
Network (for
Peripheral)
ENV216 100072 June 08,2012 June 07,2013
RF Cable (JYEBAO)
5DFB COCCAB-001 Aug. 28, 2012 Aug. 27, 2013
50 ohms Terminator 50 EMC-3 Sep. 25, 2012 Sep. 24, 2013
Software
ADT
BV
ADT_Cond_V7.3.7.3NA NA NA
Note: 1. The calibration interval of the above test instruments is 12 months and the calibrations are
traceable to NML/ROC and NIST/USA. 2. The test was performed in Shielded Room No. C. 3 The VCCI Con C Registration No. is C-3611. 4 Tested Date: Apr. 30, 2013

Report No.: FV130424E06E Page No. 14 / 45 Report Format Version: 6.1.0Reference No.: 150427E11, 150526E01
For test mode 2~3:
DESCRIPTION &
MANUFACTURER MODEL NO. SERIAL NO.
CALIBRATED
DATE
CALIBRATED
UNTIL
Test Receiver
ROHDE & SCHWARZ ESCS 30 100287 Apr. 09, 2014 Apr. 08, 2015
Line-Impedance
Stabilization Network
(for EUT)
SCHWARZBECK
NSLK-8127 8127-523 Oct. 02, 2013 Oct. 01, 2014
RF Cable
(JYEBAO) 5D-FB COACAB-001 May 26, 2014 May 25, 2015
50 ohms Terminator 50 3 Oct. 17, 2013 Oct. 16, 2014
50 ohms Terminator N/A EMC-04 Oct. 19, 2013 Oct. 18, 2014
Software
ADT
BV
ADT_Cond_V7.3.7
.3
NA NA NA
Line-Impedance
Stabilization Network
(for Peripheral)
ROHDE & SCHWARZ
ESH3-Z5 848773/004 Oct. 27, 2013 Oct. 26, 2014
Note: 1. The calibration interval of the above test instruments is 12 months and the calibrations are
traceable to NML/ROC and NIST/USA. 2 The test was performed in Shielded Room No. A. 3. The VCCI Con A Registration No. is C-817. 4 Tested Date: Aug. 22, 2014
Report No.: FV130424E06E Page No. 15 / 45 Report Format Version: 6.1.0Reference No.: 150427E11, 150526E01
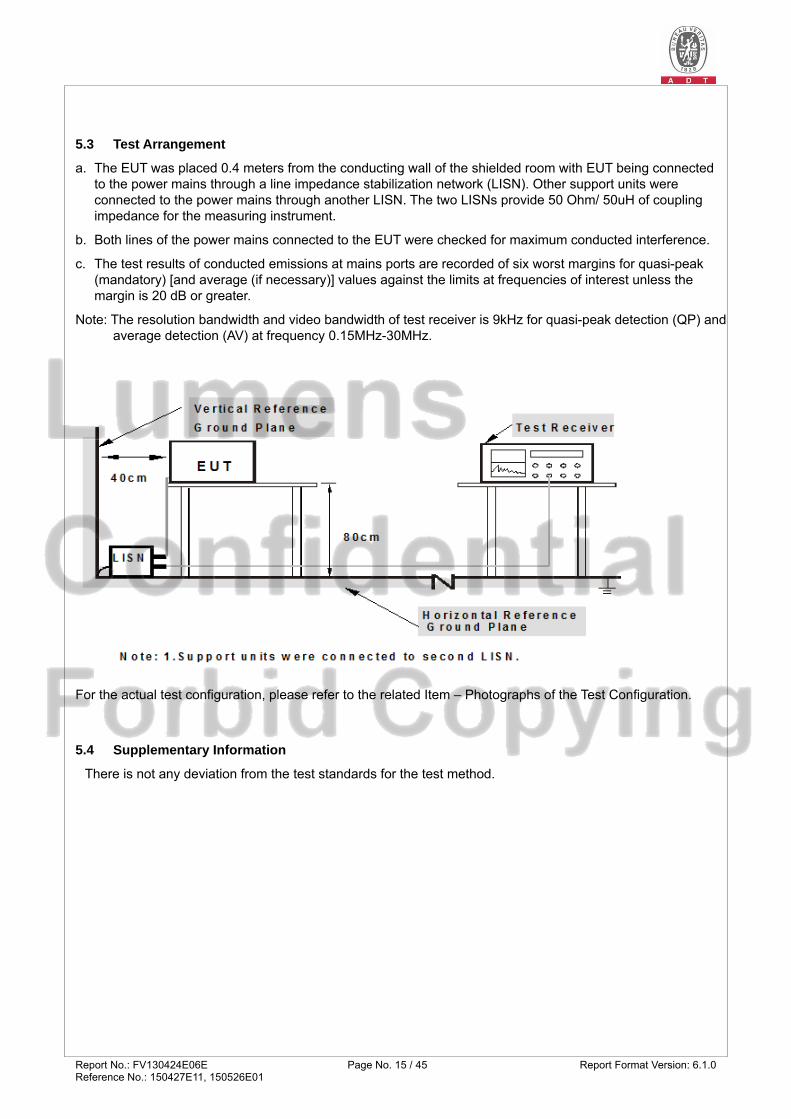
5.3 Test Arrangement
a. The EUT was placed 0.4 meters from the conducting wall of the shielded room with EUT being connected to the power mains through a line impedance stabilization network (LISN). Other support units were connected to the power mains through another LISN. The two LISNs provide 50 Ohm/ 50uH of coupling impedance for the measuring instrument.
b. Both lines of the power mains connected to the EUT were checked for maximum conducted interference.
c. The test results of conducted emissions at mains ports are recorded of six worst margins for quasi-peak (mandatory) [and average (if necessary)] values against the limits at frequencies of interest unless the margin is 20 dB or greater.
Note: The resolution bandwidth and video bandwidth of test receiver is 9kHz for quasi-peak detection (QP) and average detection (AV) at frequency 0.15MHz-30MHz.
For the actual test configuration, please refer to the related Item – Photographs of the Test Configuration.
5.4 Supplementary Information
There is not any deviation from the test standards for the test method.

Report No.: FV130424E06E Page No. 16 / 45 Report Format Version: 6.1.0Reference No.: 150427E11, 150526E01
5.5 Test Results (Mode 1)
Frequency Range 150kHz ~ 30MHz Phase Line (L)
Input Power 120Vac, 60Hz Detector Function & Resolution Bandwidth
Quasi-Peak (QP), 9kHz Average (AV), 9kHz
Environmental Conditions
25℃, 70%RH Tested by Mike Hsieh
Freq. Corr. Reading Value Emission Level Limit Margin No Factor [dB (uV)] [dB (uV)] [dB (uV)] (dB)
[MHz] (dB) Q.P. AV. Q.P. AV. Q.P. AV. Q.P. AV. 1 0.18516 0.11 42.61 25.88 42.72 25.99 79.00 66.00 -36.28 -40.012 0.60313 0.14 33.30 19.20 33.44 19.34 73.00 60.00 -39.56 -40.663 1.91797 0.21 34.49 22.97 34.70 23.18 73.00 60.00 -38.30 -36.824 3.48828 0.30 40.48 31.28 40.78 31.58 73.00 60.00 -32.22 -28.425 10.73047 0.63 41.04 37.11 41.67 37.74 73.00 60.00 -31.33 -22.266 16.57422 0.86 36.33 31.90 37.19 32.76 73.00 60.00 -35.81 -27.24
REMARKS:
1. Q.P. and AV. are abbreviations of quasi-peak and average individually.
2. The emission levels of other frequencies were very low against the limit.
3. Margin value = Emission level – Limit value
4. Correction factor = Insertion loss + Cable loss
5. Emission Level = Correction Factor + Reading Value

Report No.: FV130424E06E Page No. 17 / 45 Report Format Version: 6.1.0Reference No.: 150427E11, 150526E01
Frequency Range 150kHz ~ 30MHz Phase Neutral (N)
Input Power 120Vac, 60Hz Detector Function & Resolution Bandwidth
Quasi-Peak (QP) / Average (AV), 9 kHz
Environmental Conditions
25℃, 70%RH Tested by Mike Hsieh
Freq. Corr. Reading Value Emission Level Limit Margin No Factor [dB (uV)] [dB (uV)] [dB (uV)] (dB)
[MHz] (dB) Q.P. AV. Q.P. AV. Q.P. AV. Q.P. AV. 1 0.18516 0.09 42.45 26.83 42.54 26.92 79.00 66.00 -36.46 -39.082 0.59141 0.13 35.14 20.83 35.27 20.96 73.00 60.00 -37.73 -39.043 1.63672 0.18 34.35 22.29 34.53 22.47 73.00 60.00 -38.47 -37.534 3.54688 0.28 40.63 30.96 40.91 31.24 73.00 60.00 -32.09 -28.765 8.50000 0.42 38.92 34.71 39.34 35.13 73.00 60.00 -33.66 -24.876 14.44531 0.56 37.54 33.26 38.10 33.82 73.00 60.00 -34.90 -26.18
REMARKS:
1. Q.P. and AV. are abbreviations of quasi-peak and average individually.
2. The emission levels of other frequencies were very low against the limit.
3. Margin value = Emission level – Limit value
4. Correction factor = Insertion loss + Cable loss
5. Emission Level = Correction Factor + Reading Value

Report No.: FV130424E06E Page No. 18 / 45 Report Format Version: 6.1.0Reference No.: 150427E11, 150526E01
5.6 Test Results (Mode 2)
Frequency Range 150kHz ~ 30MHz Detector Function & Resolution Bandwidth
Quasi-Peak (QP), 9kHz Average (AV), 9kHz
Input Power 120Vac, 60Hz Environmental Conditions
27℃, 61%RH
Tested by Jyunchun.Lin
Phase Of Power : Line (L)
No Frequency
Correction
Factor Reading Value
(dBuV) Emission Level
(dBuV) Limit
(dBuV) Margin
(dB) (MHz) (dB) Q.P. AV. Q.P. AV. Q.P. AV. Q.P. AV.
1 0.18516 0.10 57.14 44.67 57.24 44.77 79.00 66.00 -21.76 -21.23
2 0.32578 0.13 47.08 33.16 47.21 33.29 79.00 66.00 -31.79 -32.71
3 0.41953 0.14 45.94 35.11 46.08 35.25 79.00 66.00 -32.92 -30.75
4 0.84922 0.15 41.28 30.77 41.43 30.92 73.00 60.00 -31.57 -29.08
5 1.41797 0.19 39.78 30.17 39.97 30.36 73.00 60.00 -33.03 -29.64
6 7.41406 0.56 39.18 32.81 39.74 33.37 73.00 60.00 -33.26 -26.63
Remarks:
1. Q.P. and AV. are abbreviations of quasi-peak and average individually.
2. The emission levels of other frequencies were very low against the limit.
3. Margin value = Emission level – Limit value
4. Correction factor = Insertion loss + Cable loss
5. Emission Level = Correction Factor + Reading Value

Report No.: FV130424E06E Page No. 19 / 45 Report Format Version: 6.1.0Reference No.: 150427E11, 150526E01
Frequency Range 150kHz ~ 30MHz Detector Function & Resolution Bandwidth
Quasi-Peak (QP), 9kHz Average (AV), 9kHz
Input Power 120Vac, 60Hz Environmental Conditions
27℃, 61%RH
Tested by Jyunchun.Lin
Phase Of Power : Neutral (N)
No Frequency
Correction
Factor Reading Value
(dBuV) Emission Level
(dBuV) Limit
(dBuV) Margin
(dB) (MHz) (dB) Q.P. AV. Q.P. AV. Q.P. AV. Q.P. AV.
1 0.18125 0.08 57.20 44.62 57.28 44.70 79.00 66.00 -21.72 -21.30
2 0.32188 0.10 47.02 35.36 47.12 35.46 79.00 66.00 -31.88 -30.54
3 0.42344 0.11 45.37 34.39 45.48 34.50 79.00 66.00 -33.52 -31.50
4 0.83750 0.13 41.18 31.77 41.31 31.90 73.00 60.00 -31.69 -28.10
5 1.33203 0.16 39.80 30.67 39.96 30.83 73.00 60.00 -33.04 -29.17
6 7.33594 0.51 38.87 32.08 39.38 32.59 73.00 60.00 -33.62 -27.41
Remarks:
1. Q.P. and AV. are abbreviations of quasi-peak and average individually.
2. The emission levels of other frequencies were very low against the limit.
3. Margin value = Emission level – Limit value
4. Correction factor = Insertion loss + Cable loss
5. Emission Level = Correction Factor + Reading Value

Report No.: FV130424E06E Page No. 20 / 45 Report Format Version: 6.1.0Reference No.: 150427E11, 150526E01
5.7 Test Results (Mode 3)
Frequency Range 150kHz ~ 30MHz Detector Function & Resolution Bandwidth
Quasi-Peak (QP), 9kHz Average (AV), 9kHz
Input Power 120Vac, 60Hz Environmental Conditions
27℃, 61%RH
Tested by Jyunchun.Lin
Phase Of Power : Line (L)
No Frequency
Correction
Factor Reading Value
(dBuV) Emission Level
(dBuV) Limit
(dBuV) Margin
(dB) (MHz) (dB) Q.P. AV. Q.P. AV. Q.P. AV. Q.P. AV.
1 0.17734 0.10 58.59 46.02 58.69 46.12 79.00 66.00 -20.31 -19.88
2 0.23594 0.12 49.15 27.67 49.27 27.79 79.00 66.00 -29.73 -38.21
3 0.42734 0.14 43.40 32.55 43.54 32.69 79.00 66.00 -35.46 -33.31
4 0.86484 0.16 39.10 26.95 39.26 27.11 73.00 60.00 -33.74 -32.89
5 1.42188 0.19 37.68 28.03 37.87 28.22 73.00 60.00 -35.13 -31.78
6 20.19922 1.20 33.47 27.14 34.67 28.34 73.00 60.00 -38.33 -31.66
Remarks:
1. Q.P. and AV. are abbreviations of quasi-peak and average individually.
2. The emission levels of other frequencies were very low against the limit.
3. Margin value = Emission level – Limit value
4. Correction factor = Insertion loss + Cable loss
5. Emission Level = Correction Factor + Reading Value

Report No.: FV130424E06E Page No. 21 / 45 Report Format Version: 6.1.0Reference No.: 150427E11, 150526E01
Frequency Range 150kHz ~ 30MHz Detector Function & Resolution Bandwidth
Quasi-Peak (QP), 9kHz Average (AV), 9kHz
Input Power 120Vac, 60Hz Environmental Conditions
27℃, 61%RH
Tested by Jyunchun.Lin
Phase Of Power : Neutral (N)
No Frequency
Correction
Factor Reading Value
(dBuV) Emission Level
(dBuV) Limit
(dBuV) Margin
(dB) (MHz) (dB) Q.P. AV. Q.P. AV. Q.P. AV. Q.P. AV.
1 0.18516 0.08 57.42 44.87 57.50 44.95 79.00 66.00 -21.50 -21.05
2 0.25547 0.09 46.90 33.20 46.99 33.29 79.00 66.00 -32.01 -32.71
3 0.43516 0.11 43.13 31.66 43.24 31.77 79.00 66.00 -35.76 -34.23
4 0.88438 0.13 38.97 28.06 39.10 28.19 73.00 60.00 -33.90 -31.81
5 3.25781 0.29 35.17 28.72 35.46 29.01 73.00 60.00 -37.54 -30.99
6 6.84766 0.48 33.57 28.48 34.05 28.96 73.00 60.00 -38.95 -31.04
Remarks:
1. Q.P. and AV. are abbreviations of quasi-peak and average individually.
2. The emission levels of other frequencies were very low against the limit.
3. Margin value = Emission level – Limit value
4. Correction factor = Insertion loss + Cable loss
5. Emission Level = Correction Factor + Reading Value

Report No.: FV130424E06E Page No. 22 / 45 Report Format Version: 6.1.0Reference No.: 150427E11, 150526E01
6 Radiated Emissions up to 1 GHz
6.1 Limits
Emissions radiated outside of the specified bands, shall be according to the general radiated limits as following:
Radiated Emissions Limits at 10 meters (dBμV/m) Frequencies
(MHz) FCC 15B / ICES-003,
Class A FCC 15B / ICES-003,
Class B CISPR 22, Class A CISPR 22, Class B
30-88 39 29.5
40 30 88-216 43.5 33.1
216-230 46.4 35.6
230-960 47 37
960-1000 49.5 43.5
Radiated Emissions Limits at 3 meters (dBμV/m) Frequencies
(MHz) FCC 15B / ICES-003,
Class A FCC 15B / ICES-003,
Class B CISPR 22, Class A CISPR 22, Class B
30-88 49.5 40
50.5 40.5 88-216 54 43.5
216-230 56.9 46
230-960 57.5 47.5
960-1000 60 54
Notes: 1. The lower limit shall apply at the transition frequencies. 2. Emission level (dBuV/m) = 20 log Emission level (uV/m). 3. QP detector shall be applied if not specified.

Report No.: FV130424E06E Page No. 23 / 45 Report Format Version: 6.1.0Reference No.: 150427E11, 150526E01
6.2 Test Instruments
For test mode 1: DESCRIPTION & MANUFACTURER
MODEL NO. SERIAL NO. CALIBRATED DATE
CALIBRATED UNTIL
Spectrum Analyzer Agilent
N9038A MY50010125 Feb. 01, 2013 Jan. 31, 2014
N9038A MY50010132 Dec. 27, 2012 Dec. 26, 2013Pre-Amplifier Mini-Circuits
ZFL-1000VH2B AMP-ZFL-01 Nov. 14, 2012 Nov. 13, 2013ZFL-1000VH2B AMP-ZFL-02 Nov. 14, 2012 Nov. 13, 2013
Pre-Amplifier Mini-Circuits
ZVA-183-S+ AMP-ZVA-01 Nov. 14, 2012 Nov. 13, 2013
Pre-Amplifier SPACEK LABS
SLKKa-48-6 9K16 Nov. 14, 2012 Nov. 13, 2013
Trilog Broadband Antenna SCHWARZBECK
VULB 9168 9168-359 Mar. 22, 2013 Mar. 21, 2014VULB 9168 9168-358 Mar. 20, 2013 Mar. 19, 2014
Spectrum Analyzer Agilent
E4446A MY48250253 Aug. 28, 2012 Aug. 27, 2013
Horn Antenna SCHWARZBECK
BBHA 9170 9170-424 Oct. 12, 2012 Oct. 11, 2013
Pre-Amplifier Agilent
8449B 3008A01975 Mar. 02, 2013 Mar. 01, 2014
Horn Antenna SCHWARZBECK
BBHA 9120D 9120D-783 Sep. 20, 2012 Sep. 19, 2013
RF Cable NA RF104-110 RF104-206 RF104-209
Dec. 21, 2012 Dec. 20, 2013
RF Cable 8DFB CHFCAB-001CHFCAB-002CHFCAB-003
Nov. 14, 2012 Nov. 13, 2013
Software ADT_Radiated_V8.7.06
NA NA NA
Antenna Tower & Turn Table CT
NA NA NA NA
Note: 1. The calibration interval of the above test instruments is 12 months and the calibrations are
traceable to NML/ROC and NIST/USA. 2. The test was performed in 10m Chamber No. F. 3 The FCC Site Registration No. is 928149. 4. The VCCI Site Registration No. is R-3252 & G-136. 5 The CANADA Site Registration No. is IC 7450H-1. 6 Tested Date: Apr. 30, 2013
Report No.: FV130424E06E Page No. 24 / 45 Report Format Version: 6.1.0Reference No.: 150427E11, 150526E01
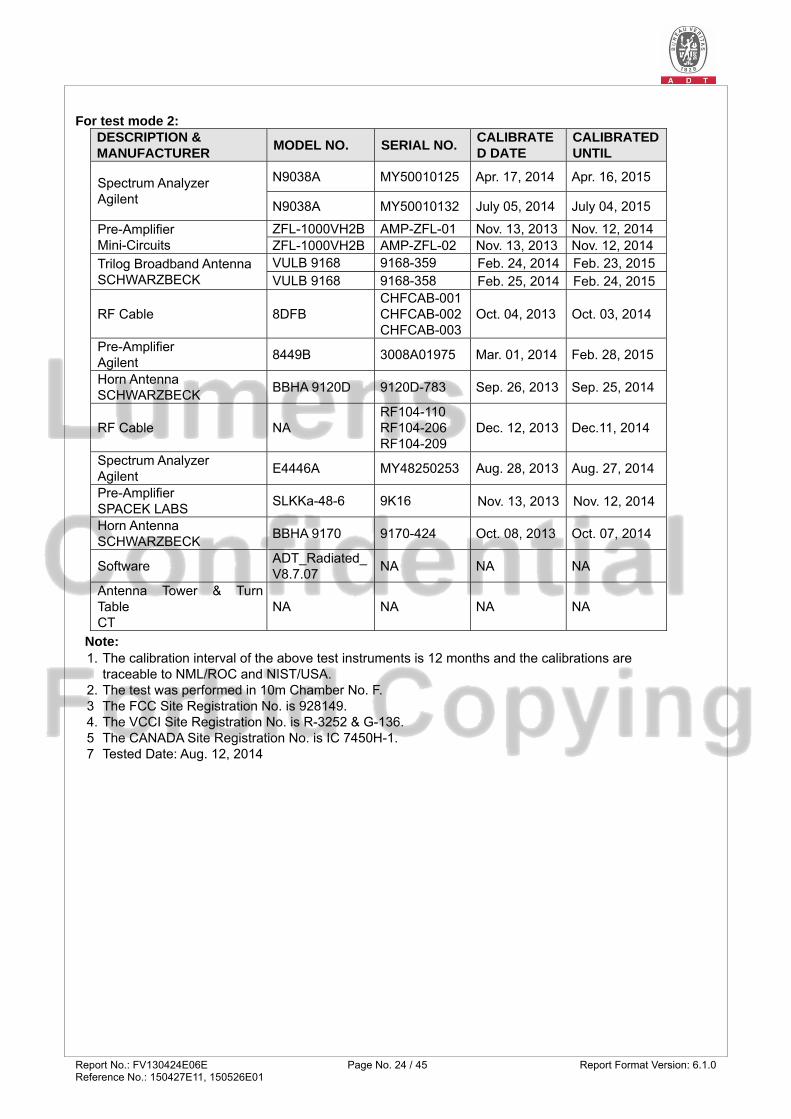
For test mode 2: DESCRIPTION & MANUFACTURER
MODEL NO. SERIAL NO. CALIBRATED DATE
CALIBRATED UNTIL
Spectrum Analyzer Agilent
N9038A MY50010125 Apr. 17, 2014 Apr. 16, 2015
N9038A MY50010132 July 05, 2014 July 04, 2015
Pre-Amplifier Mini-Circuits
ZFL-1000VH2B AMP-ZFL-01 Nov. 13, 2013 Nov. 12, 2014 ZFL-1000VH2B AMP-ZFL-02 Nov. 13, 2013 Nov. 12, 2014
Trilog Broadband Antenna SCHWARZBECK
VULB 9168 9168-359 Feb. 24, 2014 Feb. 23, 2015VULB 9168 9168-358 Feb. 25, 2014 Feb. 24, 2015
RF Cable 8DFB CHFCAB-001CHFCAB-002CHFCAB-003
Oct. 04, 2013 Oct. 03, 2014
Pre-Amplifier Agilent
8449B 3008A01975 Mar. 01, 2014 Feb. 28, 2015
Horn Antenna SCHWARZBECK
BBHA 9120D 9120D-783 Sep. 26, 2013 Sep. 25, 2014
RF Cable NA RF104-110 RF104-206 RF104-209
Dec. 12, 2013 Dec.11, 2014
Spectrum Analyzer Agilent
E4446A MY48250253 Aug. 28, 2013 Aug. 27, 2014
Pre-Amplifier SPACEK LABS
SLKKa-48-6 9K16 Nov. 13, 2013 Nov. 12, 2014
Horn Antenna SCHWARZBECK
BBHA 9170 9170-424 Oct. 08, 2013 Oct. 07, 2014
Software ADT_Radiated_V8.7.07
NA NA NA
Antenna Tower & Turn Table CT
NA NA NA NA
Note: 1. The calibration interval of the above test instruments is 12 months and the calibrations are
traceable to NML/ROC and NIST/USA. 2. The test was performed in 10m Chamber No. F. 3 The FCC Site Registration No. is 928149. 4. The VCCI Site Registration No. is R-3252 & G-136. 5 The CANADA Site Registration No. is IC 7450H-1. 7 Tested Date: Aug. 12, 2014

Report No.: FV130424E06E Page No. 25 / 45 Report Format Version: 6.1.0Reference No.: 150427E11, 150526E01
6.3 Test Arrangement
a. The EUT was placed on the top of a rotating table 0.8 meters above the ground at an accredited test facility. The table was rotated 360 degrees to determine the position of the highest radiation.
b. The EUT was set 10 meters away from the interference-receiving antenna, which was mounted on the top of a variable-height antenna tower.
c. The antenna is a broadband antenna, and its height is varied from one meter to four meters above the ground to determine the maximum value of the field strength. Both horizontal and vertical polarizations of the antenna are set to make the measurement.
d. For each suspected emission, the EUT was arranged to its worst case and then the antenna was tuned to heights from 1 meter to 4 meters and the rotatable table was turned from 0 degrees to 360 degrees to find the maximum reading.
e. The test-receiver system was set to quasi-peak detect function and specified bandwidth with maximum hold mode when the test frequency is below 1 GHz.
Note: The resolution bandwidth and video bandwidth of test receiver/spectrum analyzer is 120kHz for
quasi-peak detection (QP) at frequency below 1GHz.
For the actual test configuration, please refer to the related Item – Photographs of the Test Configuration.
6.4 Supplementary Information
There is not any deviation from the test standards for the test method.

Report No.: FV130424E06E Page No. 26 / 45 Report Format Version: 6.1.0Reference No.: 150427E11, 150526E01
6.5 Test Results (Mode 1)
Frequency Range 30MHz ~ 1GHz Detector Function & Bandwidth
Quasi-Peak (QP), 120kHz
Tested by Eagle Chen Environmental Conditions
25℃, 68%RH
Antenna Polarity & Test Distance : Horizontal at 10 m
No. Freq.
(MHz)
Emission
Level
(dBuV/m)
Limit
(dBuV/m)
Margin
(dB)
Antenna
Height
(m)
Table
Angle
(Degree)
Raw
Value
(dBuV)
Correction
Factor
(dB/m)
1 148.52 33.86 QP 40.00 -6.14 4.00 H 225 46.56 -12.70
2 297.00 38.83 QP 47.00 -8.17 2.00 H 249 50.36 -11.53
3 445.48 42.19 QP 47.00 -4.81 3.00 H 14 49.42 -7.23
4 594.01 40.82 QP 47.00 -6.18 2.00 H 77 44.40 -3.58
5 742.49 43.66 QP 47.00 -3.34 1.00 H 67 44.21 -0.55
6 891.02 37.11 QP 47.00 -9.89 1.00 H 216 35.06 2.05
REMARKS:
1. Emission level(dBuV/m)=Raw Value(dBuV) + Correction Factor(dB/m)
2. Correction Factor(dB/m) = Antenna Factor (dB/m) + Cable Factor (dB)
– Pre-Amplifier Factor (dB) if use 3. The other emission levels were very low against the limit.
4. Margin value = Emission level – Limit value

Report No.: FV130424E06E Page No. 27 / 45 Report Format Version: 6.1.0Reference No.: 150427E11, 150526E01
Frequency Range 30MHz ~ 1GHz Detector Function & Bandwidth
Quasi-Peak (QP), 120kHz
Tested by Eagle Chen Environmental Conditions
25℃, 68%RH
Antenna Polarity & Test Distance : Vertical at 10 m
No. Freq.
(MHz)
Emission
Level
(dBuV/m)
Limit
(dBuV/m)
Margin
(dB)
Antenna
Height
(m)
Table
Angle
(Degree)
Raw
Value
(dBuV)
Correction
Factor
(dB/m)
1 30.16 36.73 QP 40.00 -3.27 1.00 V 175 50.64 -13.91
2 148.52 36.22 QP 40.00 -3.78 1.00 V 352 49.34 -13.12
3 297.00 39.44 QP 47.00 -7.56 2.00 V 8 51.20 -11.76
4 445.48 40.38 QP 47.00 -6.62 1.00 V 339 47.94 -7.56
5 594.01 39.72 QP 47.00 -7.28 3.00 V 313 43.84 -4.12
6 742.49 41.86 QP 47.00 -5.14 3.00 V 192 43.17 -1.31
REMARKS:
1. Emission level(dBuV/m)=Raw Value(dBuV) + Correction Factor(dB/m)
2. Correction Factor(dB/m) = Antenna Factor (dB/m) + Cable Factor (dB)
– Pre-Amplifier Factor (dB) if use 3. The other emission levels were very low against the limit.
4. Margin value = Emission level – Limit value

Report No.: FV130424E06E Page No. 28 / 45 Report Format Version: 6.1.0Reference No.: 150427E11, 150526E01
6.6 Test Results (Mode 2)
Frequency Range 30MHz ~ 1GHz Detector Function & Bandwidth
Quasi-Peak (QP), 120kHz
Tested by Scott Chen Environmental Conditions
25℃, 70%RH
Antenna Polarity & Test Distance : Horizontal at 10 m
No Frequency
(MHz)
Emission Level
(dBuV/m)
Limit (dBuV/m)
Margin (dB)
AntennaHeight
(m)
Table Angle
(Degree)
Raw Value
(dBuV)
CorrectionFactor (dB/m)
1 296.700 33.89 QP 47.00 -13.11 3.00 H 99 45.25 -11.36
2 408.400 34.66 QP 47.00 -12.34 2.00 H 197 42.94 -8.28
3 445.060 33.14 QP 47.00 -13.86 3.00 H 63 40.07 -6.93
4 594.010 37.78 QP 47.00 -9.22 1.00 H 173 41.04 -3.26
5 741.790 38.91 QP 47.00 -8.09 1.00 H 221 39.23 -0.32
6 890.100 39.13 QP 47.00 -7.87 1.00 H 16 37.03 2.10
Remarks:
1. Emission Level(dBuV/m) = Raw Value(dBuV) + Correction Factor(dB/m)
2. Correction Factor(dB/m) = Antenna Factor (dB/m) + Cable Factor (dB)
– Pre-Amplifier Factor (dB)
3. The other emission levels were very low against the limit.
4. Margin value = Emission level – Limit value

Report No.: FV130424E06E Page No. 29 / 45 Report Format Version: 6.1.0Reference No.: 150427E11, 150526E01
Frequency Range 30MHz ~ 1GHz Detector Function & Bandwidth
Quasi-Peak (QP), 120kHz
Tested by Scott Chen Environmental Conditions
25℃, 70%RH
Antenna Polarity & Test Distance : Vertical at 10 m
No Frequency
(MHz)
Emission Level
(dBuV/m)
Limit (dBuV/m)
Margin (dB)
AntennaHeight
(m)
Table Angle
(Degree)
Raw Value
(dBuV)
CorrectionFactor (dB/m)
1 31.360 35.97 QP 40.00 -4.03 1.00 V 118 49.88 -13.91
2 148.340 33.00 QP 40.00 -7.00 1.00 V 299 45.25 -12.25
3 296.700 36.18 QP 47.00 -10.82 1.00 V 340 47.46 -11.28
4 594.010 37.90 QP 47.00 -9.10 3.00 V 348 41.57 -3.67
5 741.740 39.68 QP 47.00 -7.32 3.00 V 169 40.63 -0.95
6 890.100 37.59 QP 47.00 -9.41 2.00 V 353 36.12 1.47
Remarks:
1. Emission Level(dBuV/m) = Raw Value(dBuV) + Correction Factor(dB/m)
2. Correction Factor(dB/m) = Antenna Factor (dB/m) + Cable Factor (dB)
– Pre-Amplifier Factor (dB)
3. The other emission levels were very low against the limit.
4. Margin value = Emission level – Limit value

Report No.: FV130424E06E Page No. 30 / 45 Report Format Version: 6.1.0Reference No.: 150427E11, 150526E01
7 Radiated Emissions above 1 GHz
7.1 Limits
Emissions radiated outside of the specified bands, shall be according to the general radiated limits as following:
Radiated Emissions Limits at 10 meters (dBμV/m) Frequencies
(MHz) FCC 15B / ICES-003,
Class A FCC 15B / ICES-003,
Class B CISPR 22, Class A CISPR 22, Class B
1000-3000 Avg: 49.5 Peak: 69.5
Avg: 43.5 Peak: 63.5
Not defined Not defined
Above 3000 Not defined Not defined
Radiated Emissions Limits at 3 meters (dBμV/m) Frequencies
(MHz) FCC 15B / ICES-003,
Class A FCC 15B / ICES-003,
Class B CISPR 22, Class A CISPR 22, Class B
1000-3000 Avg: 60
Peak: 80 Avg: 54
Peak: 74
Avg: 56 Peak: 76
Avg: 50 Peak: 70
Above 3000 Avg: 60
Peak: 80 Avg: 54
Peak: 74 Notes: 1. The lower limit shall apply at the transition frequencies.
2. Emission level (dBuV/m) = 20 log Emission level (uV/m). 3. As shown in 15.35(b), for frequencies above 1000MHz, the field strength limits are based on
average detector, however, the peak field strength of any emission shall not exceed the maximum permitted average limits, specified above by more than 20dB under any condition of modulation.
Frequency Range (For unintentional radiators)
Highest frequency generated or used in the device or
on which the device operates or tunes (MHz) Upper frequency of measurement range (MHz)
Below 1.705 30
1.705-108 1000
108-500 2000
500-1000 5000
Above 1000 5th harmonic of the highest frequency or 40GHz,
whichever is lower

Report No.: FV130424E06E Page No. 31 / 45 Report Format Version: 6.1.0Reference No.: 150427E11, 150526E01
7.2 Test Instruments
For test mode 1: DESCRIPTION & MANUFACTURER
MODEL NO. SERIAL NO. CALIBRATED DATE
CALIBRATED UNTIL
Spectrum Analyzer Agilent
N9038A MY50010125 Feb. 01, 2013 Jan. 31, 2014
N9038A MY50010132 Dec. 27, 2012 Dec. 26, 2013Pre-Amplifier Mini-Circuits
ZFL-1000VH2B AMP-ZFL-01 Nov. 14, 2012 Nov. 13, 2013ZFL-1000VH2B AMP-ZFL-02 Nov. 14, 2012 Nov. 13, 2013
Pre-Amplifier Mini-Circuits
ZVA-183-S+ AMP-ZVA-01 Nov. 14, 2012 Nov. 13, 2013
Pre-Amplifier SPACEK LABS
SLKKa-48-6 9K16 Nov. 14, 2012 Nov. 13, 2013
Trilog Broadband Antenna SCHWARZBECK
VULB 9168 9168-359 Mar. 22, 2013 Mar. 21, 2014VULB 9168 9168-358 Mar. 20, 2013 Mar. 19, 2014
Spectrum Analyzer Agilent
E4446A MY48250253 Aug. 28, 2012 Aug. 27, 2013
Horn Antenna SCHWARZBECK
BBHA 9170 9170-424 Oct. 12, 2012 Oct. 11, 2013
Pre-Amplifier Agilent
8449B 3008A01975 Mar. 02, 2013 Mar. 01, 2014
Horn Antenna SCHWARZBECK
BBHA 9120D 9120D-783 Sep. 20, 2012 Sep. 19, 2013
RF Cable NA RF104-110 RF104-206 RF104-209
Dec. 21, 2012 Dec. 20, 2013
RF Cable 8DFB CHFCAB-001CHFCAB-002CHFCAB-003
Nov. 14, 2012 Nov. 13, 2013
Software ADT_Radiated_V8.7.06
NA NA NA
Antenna Tower & Turn Table CT
NA NA NA NA
Note: 1. The calibration interval of the above test instruments is 12 months and the calibrations are
traceable to NML/ROC and NIST/USA. 2. The test was performed in 10m Chamber No. F. 3. The FCC Site Registration No. is 928149. 4. The VCCI Site Registration No. is R-3252 & G-136. 5. The CANADA Site Registration No. is IC 7450H-1. 6. Tested Date: Apr. 30, 2013

Report No.: FV130424E06E Page No. 32 / 45 Report Format Version: 6.1.0Reference No.: 150427E11, 150526E01
For test mode 2:
DESCRIPTION &
MANUFACTURER MODEL NO. SERIAL NO.
CALIBRATED
DATE
CALIBRATED
UNTIL MXE EMI Receiver Agilent
N9038A MY50010156 Jan. 15, 2014 Jan. 14, 2015
Pre-Amplifier Mini-Circuits
ZFL-1000VH2B
AMP-ZFL-04 Nov. 13, 2013 Nov. 12, 2014
Trilog Broadband Antenna SCHWARZBECK
VULB 9168 9168-361 Feb. 27, 2014 Feb. 26, 2015
RF Cable NA CHHCAB_001 Oct. 06, 2013 Oct. 05, 2014 Spectrum Analyzer R&S
FSV40 100964 July 05, 2014 July 04, 2015
Horn_Antenna AISI
AIH.8018 0000220091110 Dec. 06, 2013 Dec. 05, 2014
Pre-Amplifier Agilent
8449B 3008A01923 Oct. 29, 2013 Oct. 28, 2014
RF Cable NA RF104-205 RF104-207 RF104-202
Dec. 12, 2013 Dec. 11, 2014
Spectrum Analyzer Agilent
E4446A MY48250253 Aug. 28, 2013 Aug. 27, 2014
Pre-Amplifier SPACEK LABS
SLKKa-48-6 9K16 Nov. 13, 2013 Nov. 12, 2014
Horn_Antenna SCHWARZBECK
BBHA 9170 9170-424 Oct. 08, 2013 Oct. 07, 2014
Software ADT_Radiated_V8.7.07
NA NA NA
Antenna Tower & Turn Table CT
NA NA NA NA
Note:
1. The calibration interval of the above test instruments is 12 months and the calibrations are traceable to NML/ROC and NIST/USA.
2. The horn antenna, preamplifier (model: 8449B) are used only for the measurement of emission frequency above 1GHz if tested.
3. The test was performed in 966 Chamber No. H. 4. The FCC Site Registration No. is 797305. 5. The CANADA Site Registration No. is IC 7450H-3. 6. Tested Date: Aug. 21, 2014
Report No.: FV130424E06E Page No. 33 / 45 Report Format Version: 6.1.0Reference No.: 150427E11, 150526E01
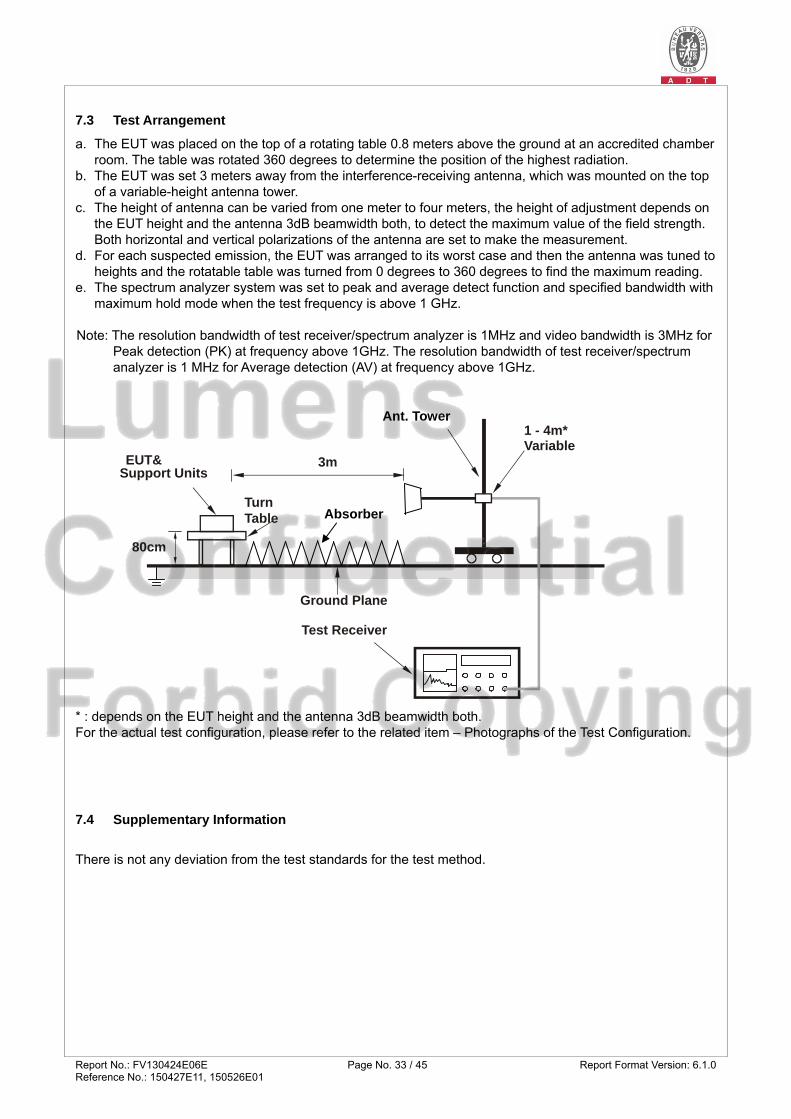
7.3 Test Arrangement
a. The EUT was placed on the top of a rotating table 0.8 meters above the ground at an accredited chamber room. The table was rotated 360 degrees to determine the position of the highest radiation.
b. The EUT was set 3 meters away from the interference-receiving antenna, which was mounted on the top of a variable-height antenna tower.
c. The height of antenna can be varied from one meter to four meters, the height of adjustment depends on the EUT height and the antenna 3dB beamwidth both, to detect the maximum value of the field strength. Both horizontal and vertical polarizations of the antenna are set to make the measurement.
d. For each suspected emission, the EUT was arranged to its worst case and then the antenna was tuned to heights and the rotatable table was turned from 0 degrees to 360 degrees to find the maximum reading.
e. The spectrum analyzer system was set to peak and average detect function and specified bandwidth with maximum hold mode when the test frequency is above 1 GHz.
Note: The resolution bandwidth of test receiver/spectrum analyzer is 1MHz and video bandwidth is 3MHz for
Peak detection (PK) at frequency above 1GHz. The resolution bandwidth of test receiver/spectrum analyzer is 1 MHz for Average detection (AV) at frequency above 1GHz.
* : depends on the EUT height and the antenna 3dB beamwidth both. For the actual test configuration, please refer to the related item – Photographs of the Test Configuration.
7.4 Supplementary Information
There is not any deviation from the test standards for the test method.
3m
1 - 4m*Variable
Turn Table
EUT& Support Units
Ground Plane
Test Receiver
80cm
Absorber
Ant. Tower

Report No.: FV130424E06E Page No. 34 / 45 Report Format Version: 6.1.0Reference No.: 150427E11, 150526E01
7.5 Test Results (Mode 1)
Frequency Range 1GHz ~ 2GHz Detector Function & Resolution Bandwidth
Peak (PK), 1MHz Average (AV), 1MHz
Tested by Eagle Chen Environmental Conditions 25℃, 68%RH
ANTENNA POLARITY & Test Distance: HORIZONTAL at 3 m
No. Freq.
(MHz)
Emission
Level
(dBuV/m)
Limit
(dBuV/m)
Margin
(dB)
Antenna
Height
(m)
Table
Angle
(Degree)
Raw
Value
(dBuV)
Correction
Factor
(dB/m)
1 1336.51 56.19 PK 80.00 -23.81 1.00 H 52 61.15 -4.96
2 1336.51 54.05 AV 60.00 -5.95 1.00 H 52 59.01 -4.96
3 1485.00 56.56 PK 80.00 -23.44 1.00 H 9 60.79 -4.23
4 1485.00 44.25 AV 60.00 -15.75 1.00 H 9 48.48 -4.23
5 1930.56 56.52 PK 80.00 -23.48 1.00 H 0 58.81 -2.29
6 1930.56 42.11 AV 60.00 -17.89 1.00 H 0 44.40 -2.29
Remarks:
1. Emission Level(dBuV/m) = Raw Value(dBuV) + Correction Factor(dB/m)
2. Correction Factor(dB/m) = Antenna Factor (dB/m) + Cable Factor (dB)
– Pre-Amplifier Factor (dB)
3. The other emission levels were very low against the limit.
4. Margin value = Emission level – Limit value

Report No.: FV130424E06E Page No. 35 / 45 Report Format Version: 6.1.0Reference No.: 150427E11, 150526E01
Frequency Range 1GHz ~ 2GHz Detector Function & Resolution Bandwidth
Peak (PK), 1MHz Average (AV), 1MHz
Tested by Eagle Chen Environmental Conditions 25℃, 68%RH
Antenna Polarity & Test Distance: Vertical at 3 m
No. Freq.
(MHz)
Emission
Level
(dBuV/m)
Limit
(dBuV/m)
Margin
(dB)
Antenna
Height
(m)
Table
Angle
(Degree)
Raw
Value
(dBuV)
Correction
Factor
(dB/m)
1 1188.01 57.41 PK 80.00 -22.59 1.00 V 24 63.27 -5.86
2 1188.01 41.87 AV 60.00 -18.13 1.00 V 24 47.73 -5.86
3 1484.95 57.10 PK 80.00 -22.90 1.00 V 137 61.33 -4.23
4 1484.95 53.59 AV 60.00 -6.41 1.00 V 137 57.82 -4.23
5 1930.69 58.96 PK 80.00 -21.04 1.00 V 216 61.25 -2.29
6 1930.69 53.88 AV 60.00 -6.12 1.00 V 216 56.17 -2.29
Remarks:
1. Emission Level(dBuV/m) = Raw Value(dBuV) + Correction Factor(dB/m)
2. Correction Factor(dB/m) = Antenna Factor (dB/m) + Cable Factor (dB)
– Pre-Amplifier Factor (dB)
3. The other emission levels were very low against the limit.
4. Margin value = Emission level – Limit value

Report No.: FV130424E06E Page No. 36 / 45 Report Format Version: 6.1.0Reference No.: 150427E11, 150526E01
7.6 Test Results (Mode 2)
Frequency Range 1GHz ~ 2GHz Detector Function & Resolution Bandwidth
Peak (PK), 1MHz Average (AV), 1MHz
Tested by Tim Ho Environmental Conditions
23℃, 67%RH
Antenna Polarity & Test Distance : Horizontal at 3 m
No Frequency
(MHz)
Emission Level
(dBuV/m)
Limit (dBuV/m)
Margin (dB)
AntennaHeight
(m)
Table Angle
(Degree)
Raw Value
(dBuV)
CorrectionFactor (dB/m)
1 1483.750 56.89 PK 80.00 -23.11 1.00 H 267 65.81 -8.92
2 1483.750 49.49 AV 60.00 -10.51 1.00 H 267 58.41 -8.92
3 1631.890 51.00 PK 80.00 -29.00 1.00 H 360 59.03 -8.03
4 1631.890 34.60 AV 60.00 -25.40 1.00 H 360 42.63 -8.03
5 1930.420 57.24 PK 80.00 -22.76 1.00 H 3 63.93 -6.69
6 1930.420 52.23 AV 60.00 -7.77 1.00 H 3 58.92 -6.69
Remarks:
1. Emission Level(dBuV/m) = Raw Value(dBuV) + Correction Factor(dB/m)
2. Correction Factor(dB/m) = Antenna Factor (dB/m) + Cable Factor (dB)
– Pre-Amplifier Factor (dB)
3. The other emission levels were very low against the limit.
4. Margin value = Emission level – Limit value

Report No.: FV130424E06E Page No. 37 / 45 Report Format Version: 6.1.0Reference No.: 150427E11, 150526E01
Frequency Range 1GHz ~ 2GHz Detector Function & Resolution Bandwidth
Peak (PK), 1MHz Average (AV), 1MHz
Tested by Tim Ho Environmental Conditions
23℃, 67%RH
Antenna Polarity & Test Distance : Vertical at 3 m
No Frequency
(MHz)
Emission Level
(dBuV/m)
Limit (dBuV/m)
Margin (dB)
AntennaHeight
(m)
Table Angle
(Degree)
Raw Value
(dBuV)
CorrectionFactor (dB/m)
1 1335.130 59.26 PK 80.00 -20.74 1.00 V 343 68.79 -9.53
2 1335.130 50.72 AV 60.00 -9.28 1.00 V 343 60.25 -9.53
3 1483.690 57.45 PK 80.00 -22.55 1.00 V 25 66.37 -8.92
4 1483.690 49.24 AV 60.00 -10.76 1.00 V 25 58.16 -8.92
5 1930.530 57.23 PK 80.00 -22.77 1.00 V 227 63.92 -6.69
6 1930.530 52.54 AV 60.00 -7.46 1.00 V 227 59.23 -6.69
Remarks:
1. Emission Level(dBuV/m) = Raw Value(dBuV) + Correction Factor(dB/m)
2. Correction Factor(dB/m) = Antenna Factor (dB/m) + Cable Factor (dB)
– Pre-Amplifier Factor (dB)
3. The other emission levels were very low against the limit.
4. Margin value = Emission level – Limit value

Report No.: FV130424E06E Page No. 38 / 45 Report Format Version: 6.1.0Reference No.: 150427E11, 150526E01
8 Pictures of Test Arrangements
8.1 Conducted Emissions at Mains Ports
Mode 1

Report No.: FV130424E06E Page No. 39 / 45 Report Format Version: 6.1.0Reference No.: 150427E11, 150526E01
Mode 2

Report No.: FV130424E06E Page No. 40 / 45 Report Format Version: 6.1.0Reference No.: 150427E11, 150526E01
Mode 3

Report No.: FV130424E06E Page No. 41 / 45 Report Format Version: 6.1.0Reference No.: 150427E11, 150526E01
8.2 Radiated Emissions up to 1 GHz
Mode 1

Report No.: FV130424E06E Page No. 42 / 45 Report Format Version: 6.1.0Reference No.: 150427E11, 150526E01
Mode 2

Report No.: FV130424E06E Page No. 43 / 45 Report Format Version: 6.1.0Reference No.: 150427E11, 150526E01
8.3 Radiated Emissions above 1 GHz
Mode 1

Report No.: FV130424E06E Page No. 44 / 45 Report Format Version: 6.1.0Reference No.: 150427E11, 150526E01
Mode 2

Report No.: FV130424E06E Page No. 45 / 45 Report Format Version: 6.1.0Reference No.: 150427E11, 150526E01
Appendix – Information on the Testing Laboratories
We, Bureau Veritas Consumer Products Services (H.K.) Ltd., Taoyuan Branch, were founded in 1988 to provide our best service in EMC, Radio, Telecom and Safety consultation. Our laboratories are accredited and approved according to ISO/IEC 17025. If you have any comments, please feel free to contact us at the following:
Linko EMC/RF Lab
Tel: 886-2-26052180
Fax: 886-2-26051924
Hsin Chu EMC/RF/Telecom Lab
Tel: 886-3-5935343
Fax: 886-3-5935342
Hwa Ya EMC/RF/Safety Lab
Tel: 886-3-3183232
Fax: 886-3-3270892
Email: [email protected]
Web Site: www.bureauveritas-adt.com
The address and road map of all our labs can be found in our web site also. --- END ---

Report No.: 130424E06E Page 1 Reference No.: 150427E11, 1505226E01
CONSTRUCTION PHOTOS OF EUT
Model No.: VC-X50

Report No.: 130424E06E Page 2 Reference No.: 150427E11, 1505226E01

Report No.: 130424E06E Page 3 Reference No.: 150427E11, 1505226E01

Report No.: 130424E06E Page 4 Reference No.: 150427E11, 1505226E01
Report No.: 130424E06E Page 5 Reference No.: 150427E11, 1505226E01

Report No.: 130424E06E Page 6 Reference No.: 150427E11, 1505226E01

Report No.: 130424E06E Page 7 Reference No.: 150427E11, 1505226E01

Report No.: 130424E06E Page 8 Reference No.: 150427E11, 1505226E01

Report No.: 130424E06E Page 9 Reference No.: 150427E11, 1505226E01

Report No.: 130424E06E Page 10 Reference No.: 150427E11, 1505226E01

Report No.: 130424E06E Page 11 Reference No.: 150427E11, 1505226E01

Report No.: 130424E06E Page 12 Reference No.: 150427E11, 1505226E01
Model No.: PTC-120

Report No.: 130424E06E Page 13 Reference No.: 150427E11, 1505226E01

Report No.: 130424E06E Page 14 Reference No.: 150427E11, 1505226E01

Report No.: 130424E06E Page 15 Reference No.: 150427E11, 1505226E01

Report No.: 130424E06E Page 16 Reference No.: 150427E11, 1505226E01

Report No.: 130424E06E Page 17 Reference No.: 150427E11, 1505226E01

Report No.: 130424E06E Page 18 Reference No.: 150427E11, 1505226E01

Report No.: 130424E06E Page 19 Reference No.: 150427E11, 1505226E01

Report No.: 130424E06E Page 20 Reference No.: 150427E11, 1505226E01

Report No.: 130424E06E Page 21 Reference No.: 150427E11, 1505226E01

Report No.: 130424E06E Page 22 Reference No.: 150427E11, 1505226E01

Report No.: 130424E06E Page 23 Reference No.: 150427E11, 1505226E01

Report No.: 130424E06E Page 24 Reference No.: 150427E11, 1505226E01
Model No.: VC-302X