Salterbaxter - Directions Supplement - Online Investor Centres
• Third Quarter 2017 Results
• October 24, 2017
• This document, and in particular the section entitled “2017 guidance confirmed”, contains forward-looking statements. These statements may include terms such as “may”, “will”, “expect”, “could”, “should”, “intend”, “estimate”, “anticipate”, “believe”, “remain”, “on track”, “design”, “target”, “objective”, “goal”, “forecast”, “projection”, “outlook”, “prospects”, “plan”, or similar terms. Forward-looking statements are not guarantees of future performance. Rather, they are based on the Group’s current expectations and projections about future events and, by their nature, are subject to inherent risks and uncertainties. They relate to events and depend on circumstances that may or may not occur or exist in the future and, as such, undue reliance should not be placed on them. Actual results may differ materially from those expressed in such statements as a result of a variety of factors, including: the Group's ability to maintain vehicle shipment volumes; changes in the global financial markets, general economic environment and changes in demand for automotive products, which is subject to cyclicality; changes in local economic and political conditions, including with regard to trade policy; the Group's ability to expand certain of the Group's brands internationally; various types of claims, lawsuits, governmental investigations and other contingent obligations against the Group, including product liability and warranty claims and environmental claims, governmental investigations and lawsuits; material operating expenditures in relation to compliance with environmental, health and safety regulations; the Group's ability to enrich its product portfolio and offer innovative products; the high level of competition in the automotive industry, which may increase due to consolidation; exposure to shortfalls in the Group's defined benefit pension plans; the Group's ability to provide or arrange for adequate access to financing for the Group's dealers and retail customers and risks associated with financial services companies; the Group's ability to access funding to execute the Group's business plan and improve the Group's business, financial condition and results of operations; changes in the Group's credit ratings; the Group's ability to realize anticipated benefits from any joint venture arrangements and other strategic alliances; disruptions arising from political, social and economic instability; risks associated with our relationships with employees, dealers and suppliers; increases in costs, disruptions of supply or shortages of raw materials; developments in labor and industrial relations and developments in applicable labor laws; exchange rate fluctuations, interest rate changes, credit risk and other market risks; political and civil unrest; earthquakes or other disasters and other risks and uncertainties.
• Any forward-looking statements contained in this document speak only as of the date of this document and the Company does not undertake any obligation to update or revise publicly forward-looking statements. Further information concerning the Group and its businesses, including factors that could materially affect the Company’s financial results, is included in the Company’s reports and filings with the U.S. Securities and Exchange Commission, the AFM and CONSOB. Safe Harbor Statement
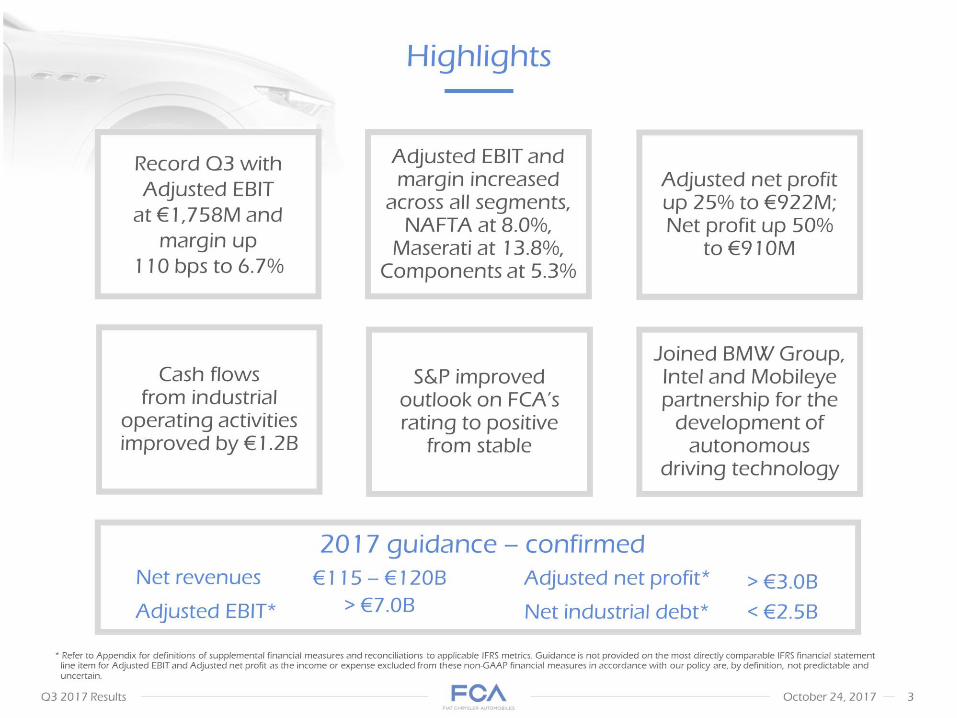
• Record Q3 with Adjusted EBITat €1,758M and margin up 110 bps to 6.7% Adjusted EBIT and margin increased across all segments, NAFTA at 8.0%, Maserati at 13.8%, Components at 5.3% Cash flows from industrial operating activities improved by €1.2B S&P improved outlook on FCA’s rating to positive from stable Joined BMW Group, Intel and Mobileye partnership for the development of autonomous driving technology * Refer to Appendix for definitions of supplemental financial measures and reconciliations to applicable IFRS metrics. Guidance is not provided on the most directly comparable IFRS financial statement line item for Adjusted EBIT and Adjusted net profit as the income or expense excluded from these non-GAAP financial measures in accordance with our policy are, by definition, not predictable and uncertain. 2017 guidance –confirmed Highlights Adjusted net profit up 25% to €922M; Net profit up 50% to €910M
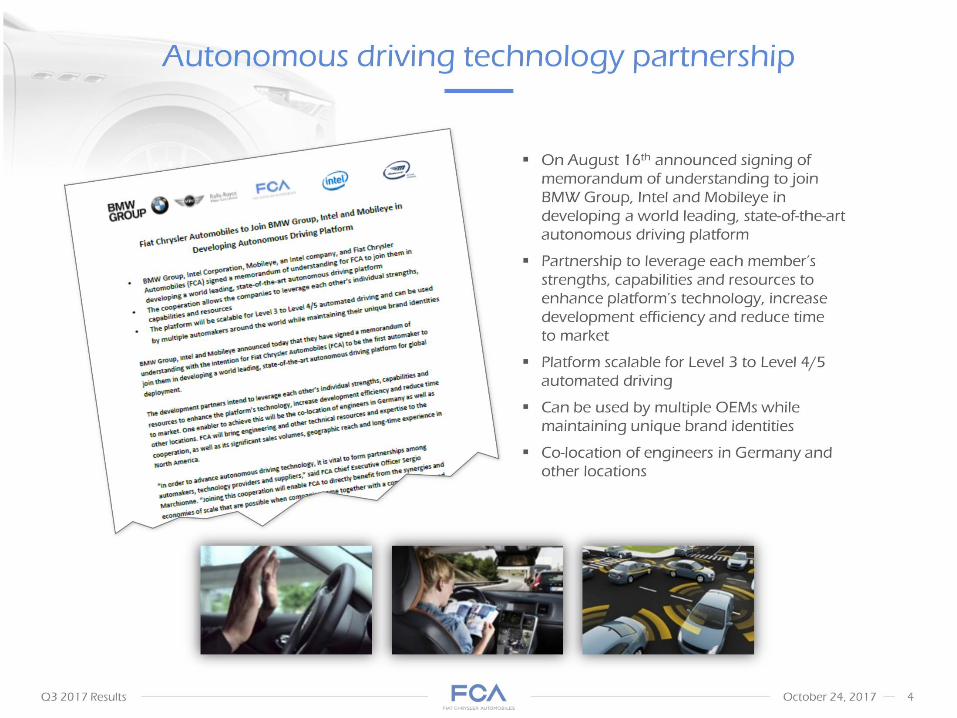
• Autonomous driving technology partnership On August 16th announced signing of memorandum of understanding to join BMW Group, Intel and Mobileye in developing a world leading, state-of-the-art autonomous driving platform
• Partnership to leverage each member’s strengths, capabilities and resources to enhance platform’s technology, increase development efficiency and reduce time to market
• Platform scalable for Level 3 to Level 4/5 automated driving
• Can be used by multiple OEMs while maintaining unique brand identities
• Co-location of engineers in Germany and other locations
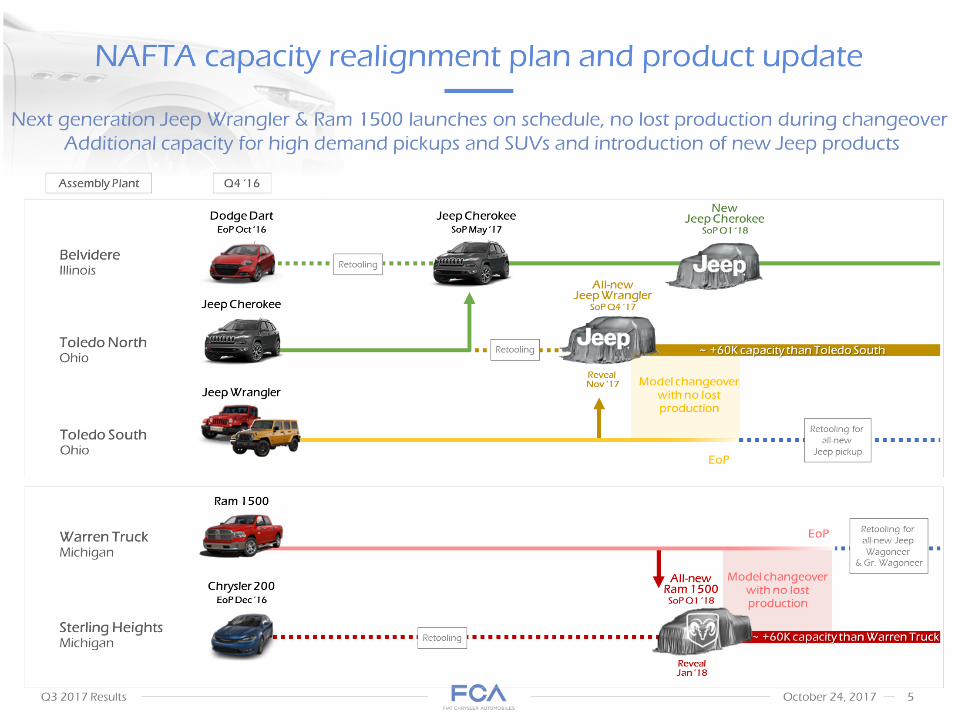
• ~ +60K capacity than Warren Truck NAFTA capacity realignment plan and product update Next generation Jeep Wrangler & Ram 1500 launches on schedule, no lost production during changeover
• Additional capacity for high demand pickups and SUVs and introduction of new Jeep products Q4 ‘16 Assembly Plant Toledo North
• Ohio All-newJeep WranglerSoP Q4 ‘17 Jeep Cherokee ~ +60K capacity than Toledo South Retooling Belvidere Illinois Jeep CherokeeSoP May ‘17 NewJeep CherokeeSoP Q1 ‘18 Toledo South Ohio Jeep Wrangler Retooling for all-new Jeep pickup EoP RevealNov ‘17 Model changeover with no lost production Sterling Heights Michigan Warren Truck
• Michigan All-newRam 1500SoP Q1 ‘18 Ram 1500 RevealJan ‘18 Retooling for all-new Jeep Wagoneer & Gr. Wagoneer Dodge Dart EoP Oct ‘16 Chrysler 200EoP Dec ‘16
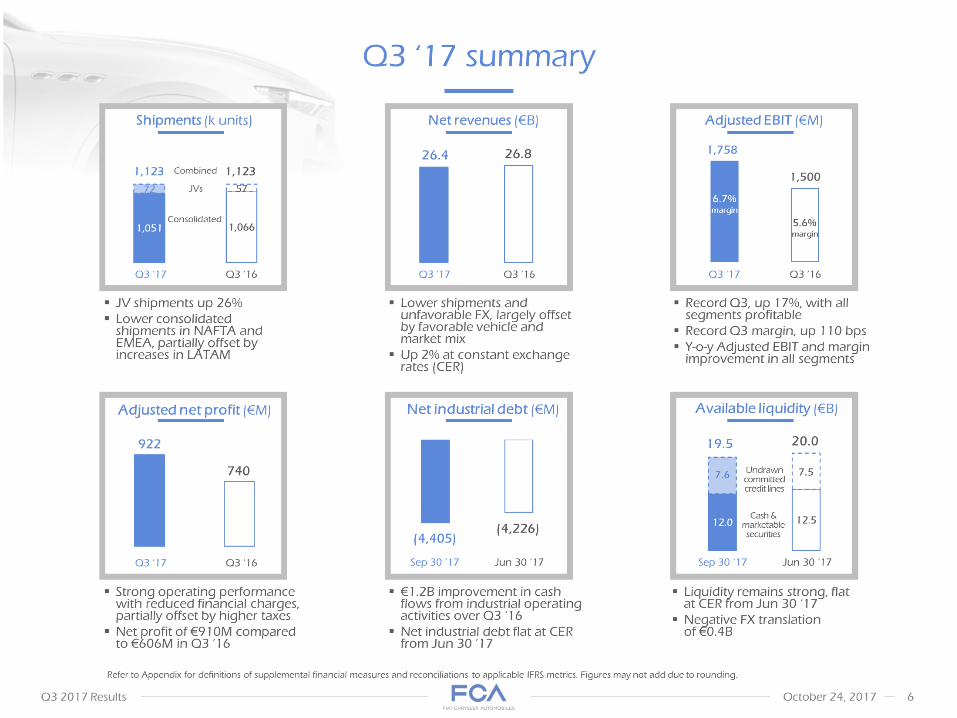
• Refer to Appendix for definitions of supplemental financial measures and reconciliations to applicable IFRS metrics. Figures may not add due to rounding. Shipments (k units) Net revenues (€B) Adjusted EBIT (€M) Consolidated JV shipments up 26%
• Lower consolidated shipments in NAFTA and EMEA, partially offset by increases in LATAM Lower shipments and unfavorable FX, largely offset by favorable vehicle and market mix
• Up 2% at constant exchange rates (CER) Record Q3, up 17%, with all segments profitable
• Record Q3 margin, up 110 bps
• Y-o-y Adjusted EBIT and margin improvement in all segments Net industrial debt (€M) Strong operating performance with reduced financial charges, partially offset by higher taxes
• Net profit of €910M compared to €606M in Q3 ’16 €1.2B improvement in cash flows from industrial operating activities over Q3 ‘16
• Net industrial debt flat at CER from Jun 30 ’17 Liquidity remains strong, flat at CER from Jun 30 ‘17
• Negative FX translation of €0.4B Adjusted net profit (€M) Available liquidity (€B) Cash & marketable securities Undrawn committed credit lines 6.7%margin 5.6%margin Sep 30 ‘17 Jun 30 ‘17 JVs Q3 ‘17 Q3 ‘16 (4,226) (4,405) Q3 ‘17 summary 1,123 20.0 19.5 Combined

• €M% = Adjusted EBIT margin 1,500 5.6% Q3 ‘16 NAFTA LATAM APAC EMEA Maserati Components Others & Eliminations Q3 ‘17 6.7% By segment Q3 ‘17 Adjusted EBIT walk Volume & Mix Net price Industrial costs SG&A Other By operational driver Refer to Appendix for definitions of supplemental financial measures and reconciliations to applicable IFRS metrics. Figures may not add due to rounding.
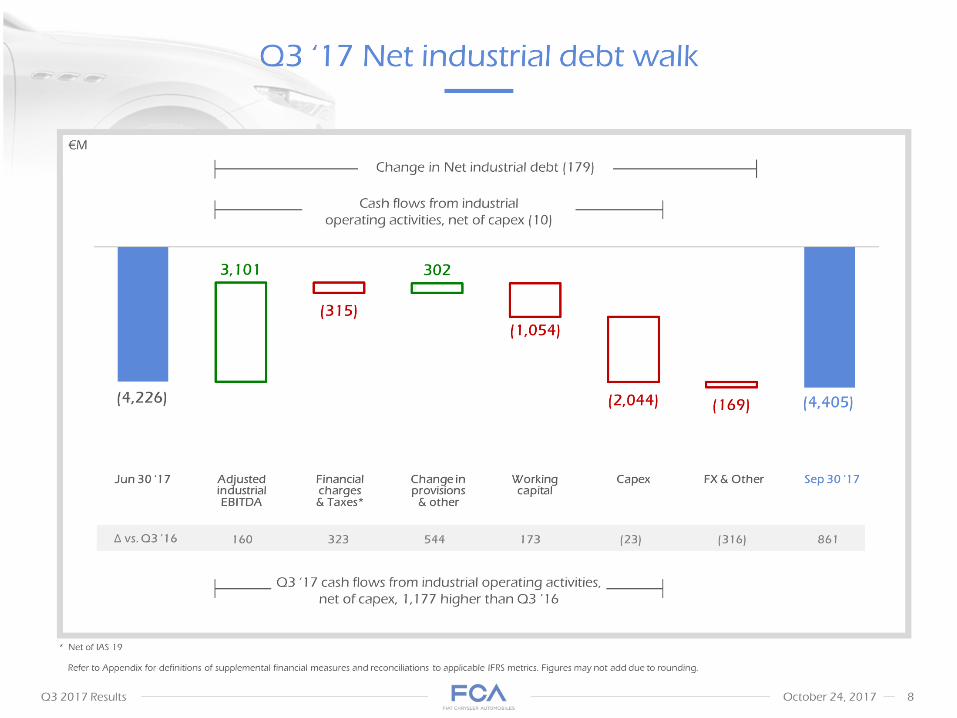
• * Net of IAS 19 Jun 30 ‘17 Adjusted industrial
• EBITDA Financial charges
• & Taxes* Change in provisions & other Capex FX & Other Sep 30 ‘17 €M Change in Net industrial debt (179) Cash flows from industrial operating activities, net of capex (10) Q3 ‘17 Net industrial debt walk (4,226) Workingcapital Refer to Appendix for definitions of supplemental financial measures and reconciliations to applicable IFRS metrics. Figures may not add due to rounding.
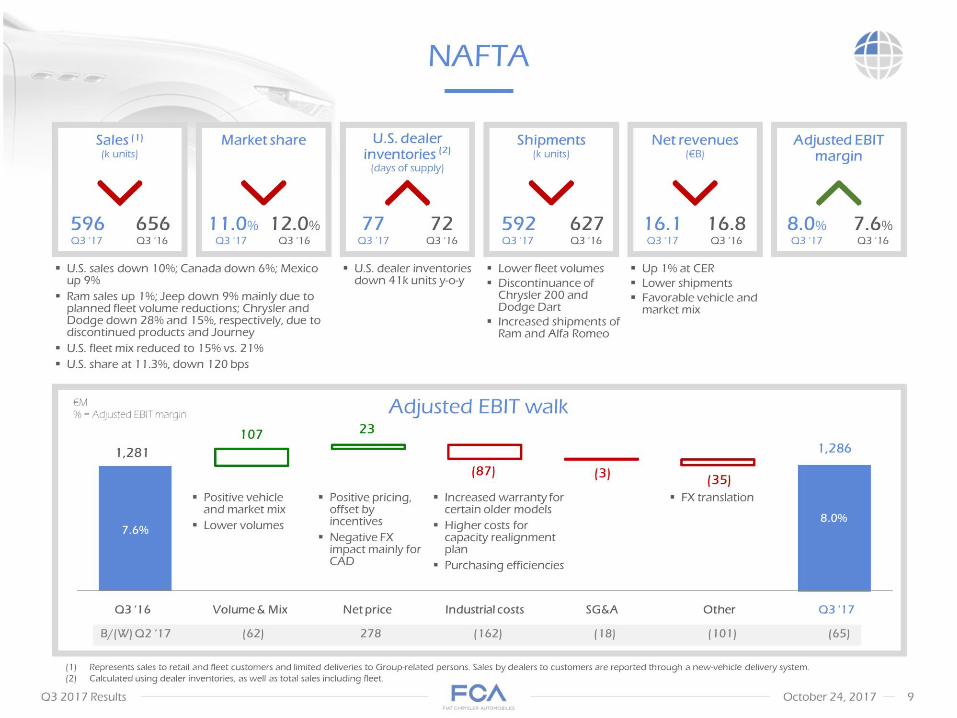
• U.S. sales down 10%; Canada down 6%; Mexico up 9%
• Ram sales up 1%; Jeep down 9% mainly due to planned fleet volume reductions; Chrysler and Dodge down 28% and 15%, respectively, due to discontinued products and Journey
• U.S. fleet mix reduced to 15% vs. 21%
• U.S. share at 11.3%, down 120 bps U.S. dealer inventories down 41k units y-o-y Lower fleet volumes
• Discontinuance of Chrysler 200 and Dodge Dart
• Increased shipments of Ram and Alfa Romeo Up 1% at CER
• Lower shipments
• Favorable vehicle and market mix Represents sales to retail and fleet customers and limited deliveries to Group-related persons. Sales by dealers to customers are reported through a new-vehicle delivery system.
• Calculated using dealer inventories, as well as total sales including fleet. NAFTA U.S. dealer inventories (2)
• (days of supply) Sales (1)(k units) Market share Shipments(k units) Net revenues(€B) 656 12.0% 72 627 16.8 Q3 ‘16 596 11.0% 77 592 16.1 Q3 ‘17 Volume & Mix Net price Industrial costs SG&A Other Adjusted EBIT walk €M
• % = Adjusted EBIT margin Positive vehicle and market mix
• Lower volumes Positive pricing, offset by incentives
• Negative FX impact mainly for CAD Increased warranty for certain older models
• Higher costs for capacity realignment plan
• Purchasing efficiencies 1,281 7.6% 8.0% FX translation
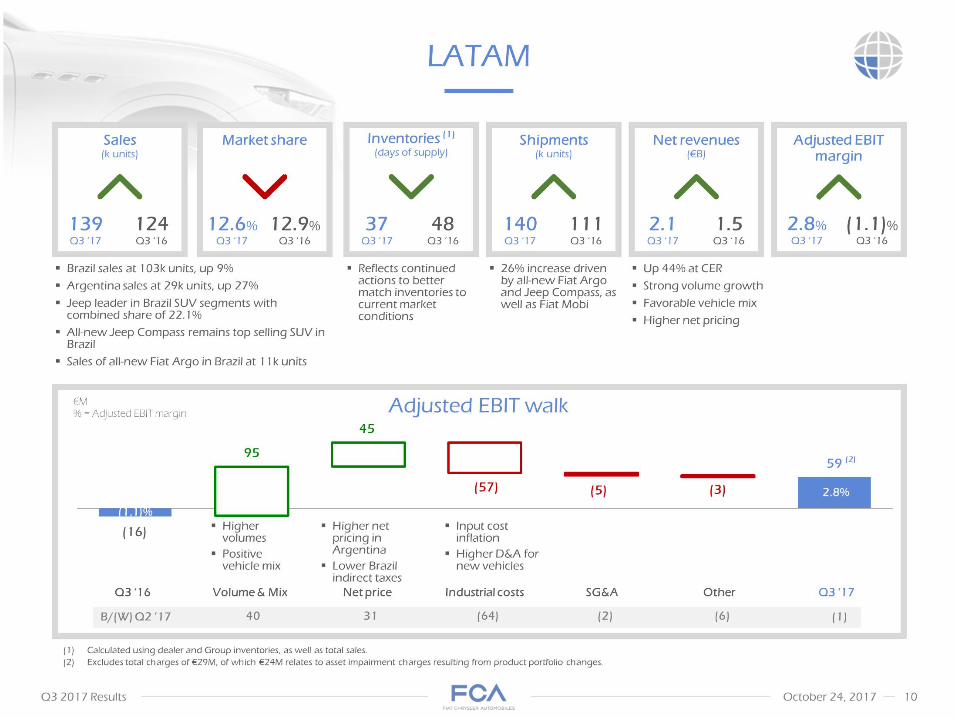
• Brazil sales at 103k units, up 9%
• Argentina sales at 29k units, up 27%
• Jeep leader in Brazil SUV segments with combined share of 22.1%
• All-new Jeep Compass remains top selling SUV in Brazil
• Sales of all-new Fiat Argo in Brazil at 11k units Reflects continued actions to better match inventories to current market conditions 26% increase driven by all-new Fiat Argo and Jeep Compass, as well as Fiat Mobi Up 44% at CER
• Strong volume growth
• Favorable vehicle mix
• Higher net pricing LATAM Net revenues(€B) Q3 ‘16 1.5 Q3 ‘17 2.1 48 37 Inventories (1)
• (days of supply) 124 139 Sales(k units) Volume & Mix Net price Industrial costs SG&A Other Adjusted EBIT walk Higher volumes
• Positive vehicle mix Input cost inflation
• Higher D&A for new vehicles (16) €M
• % = Adjusted EBIT margin 2.8% 111 140 Shipments(k units) (1.1)% Higher net pricing in Argentina
• Lower Brazil indirect taxes 12.9% 12.6% Market share Calculated using dealer and Group inventories, as well as total sales.
• Excludes total charges of €29M, of which €24M relates to asset impairment charges resulting from product portfolio changes. (2) Adjusted EBIT margin
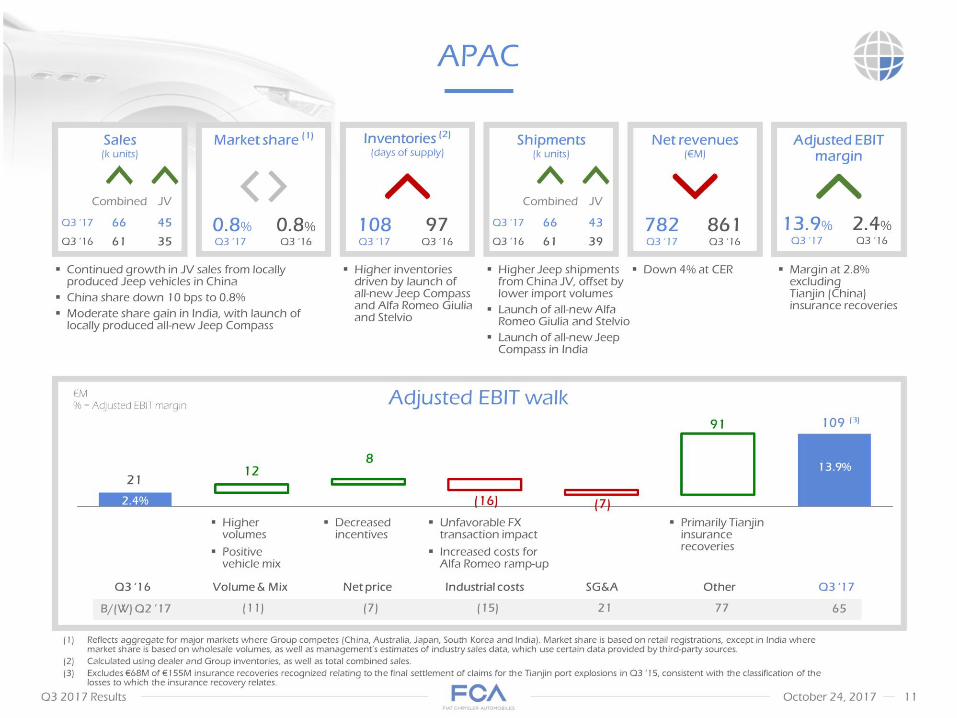
• Continued growth in JV sales from locally produced Jeep vehicles in China
• China share down 10 bps to 0.8%
• Moderate share gain in India, with launch of locally produced all-new Jeep Compass Higher inventories driven by launch of all-new Jeep Compass and Alfa Romeo Giulia and Stelvio Higher Jeep shipments from China JV, offset by lower import volumes
• Launch of all-new Alfa Romeo Giulia and Stelvio
• Launch of all-new Jeep Compass in India Down 4% at CER APAC Reflects aggregate for major markets where Group competes (China, Australia, Japan, South Korea and India). Market share is based on retail registrations, except in India where market share is based on wholesale volumes, as well as management’s estimates of industry sales data, which use certain data provided by third-party sources.
• Calculated using dealer and Group inventories, as well as total combined sales.
• Excludes €68M of €155M insurance recoveries recognized relating to the final settlement of claims for the Tianjin port explosions in Q3 ‘15, consistent with the classification of the losses to which the insurance recovery relates. Sales(k units) Combined JV 61 35 Q3 ‘16 Q3 ‘17 66 45 Volume & Mix Net price Industrial costs SG&A Other Adjusted EBIT walk 21 €M
• % = Adjusted EBIT margin 2.4% 13.9% Decreased incentives Unfavorable FX transaction impact
• Increased costs for Alfa Romeo ramp-up Net revenues(€M) 861 782 (3) Inventories (2)
• (days of supply) 97 108 Higher volumes
• Positive vehicle mix Primarily Tianjin insurance recoveries Market share (1) 0.8% Shipments(k units) 39 43 Margin at 2.8% excluding Tianjin (China) insurance recoveries
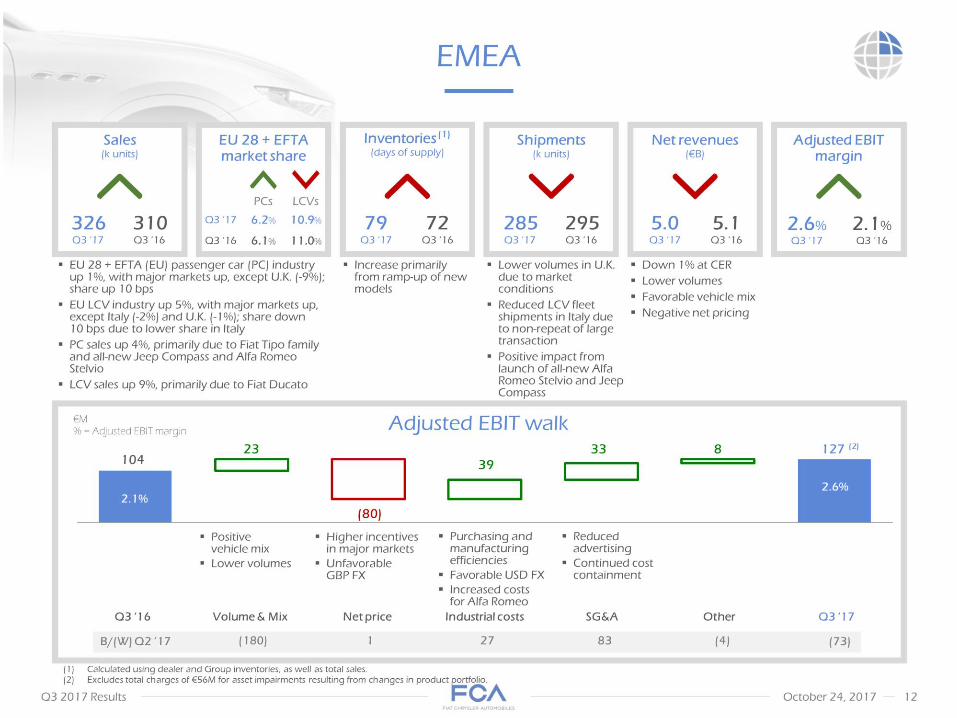
• Q3 ‘16 Volume & Mix Net price Industrial costs SG&A Other Q3 ‘17 Adjusted EBIT walk EU 28 + EFTA (EU) passenger car (PC) industry up 1%, with major markets up, except U.K. (-9%); share up 10 bps
• EU LCV industry up 5%, with major markets up, except Italy (-2%) and U.K. (-1%); share down 10 bps due to lower share in Italy
• PC sales up 4%, primarily due to Fiat Tipo family and all-new Jeep Compass and Alfa Romeo Stelvio
• LCV sales up 9%, primarily due to Fiat Ducato Increase primarily from ramp-up of new models Lower volumes in U.K. due to market conditions
• Reduced LCV fleet shipments in Italy due to non-repeat of large transaction
• Positive impact from launch of all-new Alfa Romeo Stelvio and Jeep Compass Down 1% at CER
• Lower volumes
• Favorable vehicle mix
• Negative net pricing Positive vehicle mix
• Lower volumes Purchasing and manufacturing efficiencies
• Favorable USD FX
• Increased costs for Alfa Romeo EMEA 104 €M
• % = Adjusted EBIT margin Inventories (1)
• (days of supply) 72 79 2.1% 2.6% Higher incentives in major markets
• Unfavorable GBP FX Shipments(k units) 295 285 Net revenues(€B) 5.1 5.0 Calculated using dealer and Group inventories, as well as total sales.
• Excludes total charges of €56M for asset impairments resulting from changes in product portfolio. (2) Reduced advertising
• Continued cost containment Sales(k units) 310 326 EU 28 + EFTA market share 6.1% 11.0% PCs LCVs 6.2% 10.9% Adjusted EBIT margin
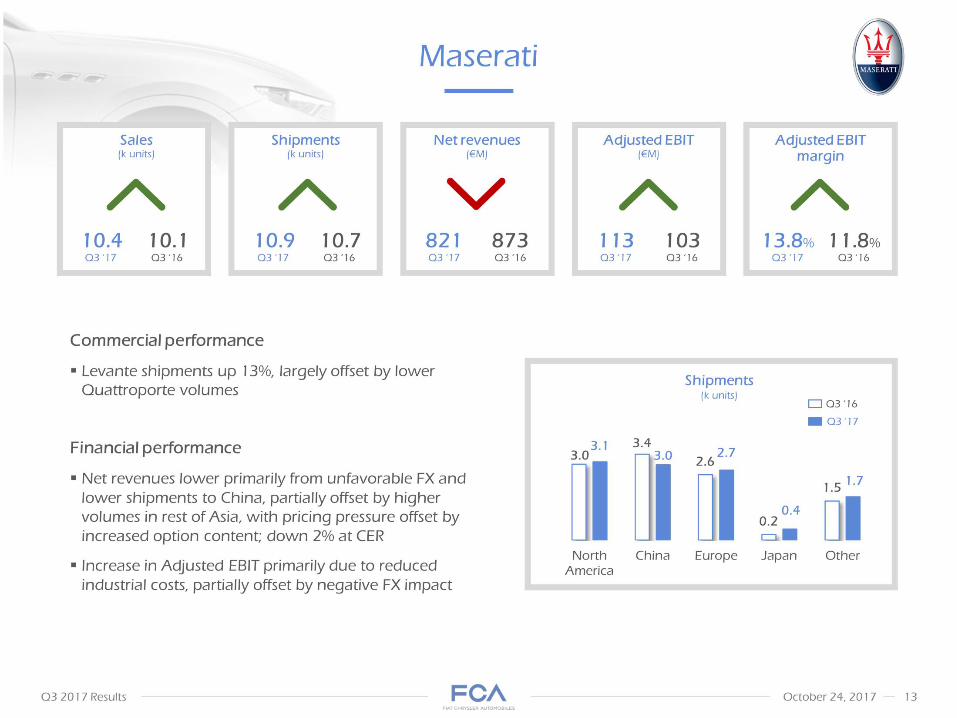
• Maserati Sales(k units) Net revenues(€M) Shipments(k units) Adjusted EBIT(€M) Adjusted EBIT margin Commercial performance
• Levante shipments up 13%, largely offset by lower Quattroporte volumes
• Financial performance
• Net revenues lower primarily from unfavorable FX and lower shipments to China, partially offset by higher volumes in rest of Asia, with pricing pressure offset by increased option content; down 2% at CER
• Increase in Adjusted EBIT primarily due to reduced industrial costs, partially offset by negative FX impact Shipments
• (k units) Q3 ‘17 Q3 ‘16
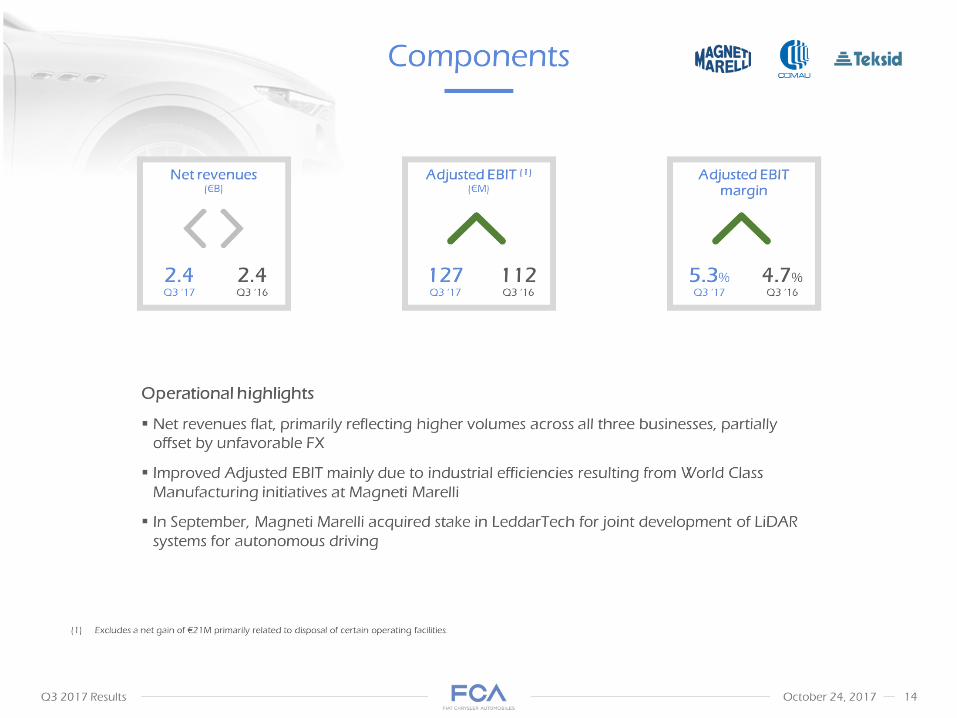
• Components Net revenues(€B) 2.4 Q3 ‘16 Q3 ‘17 Adjusted EBIT (1)(€M) 112 127 Adjusted EBIT margin 4.7% 5.3% Operational highlights
• Net revenues flat, primarily reflecting higher volumes across all three businesses, partially offset by unfavorable FX
• Improved Adjusted EBIT mainly due to industrial efficiencies resulting from World Class Manufacturing initiatives at Magneti Marelli
• In September, Magneti Marelli acquired stake in LeddarTech for joint development of LiDAR systems for autonomous driving Excludes a net gain of €21M primarily related to disposal of certain operating facilities.
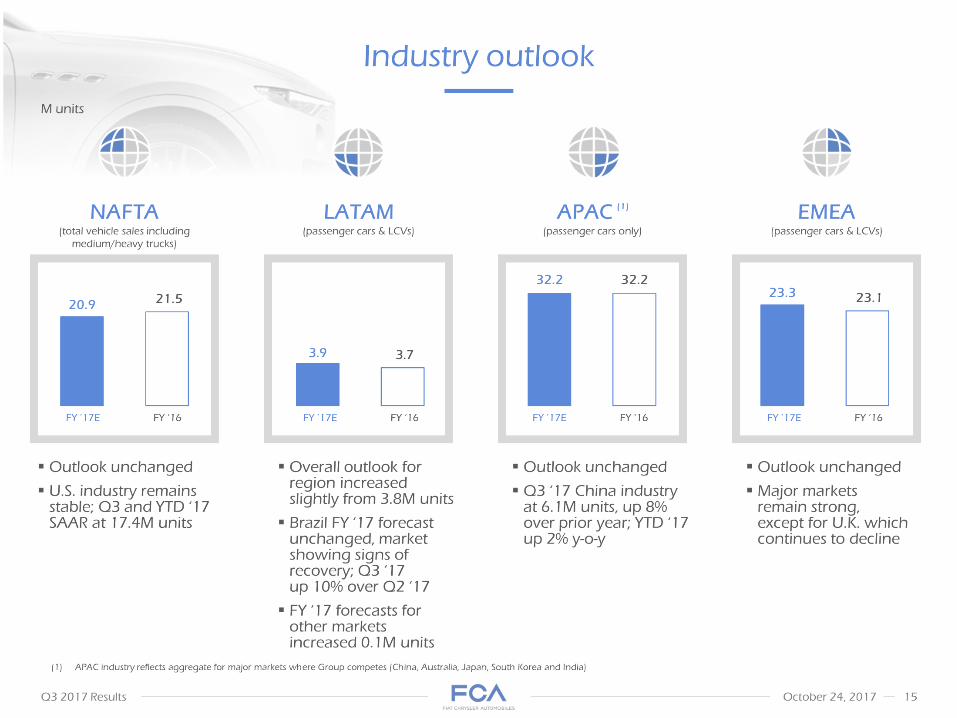
• Industry outlook M units Overall outlook for region increased slightly from 3.8M units
• Brazil FY ‘17 forecast unchanged, market showing signs of recovery; Q3 ‘17 up 10% over Q2 ‘17
• FY ‘17 forecasts for other markets increased 0.1M units Outlook unchanged
• Q3 ‘17 China industry at 6.1M units, up 8% over prior year; YTD ‘17 up 2% y-o-y LATAM
• (passenger cars & LCVs) APAC (1)
• (passenger cars only) EMEA
• (passenger cars & LCVs) Outlook unchanged
• Major markets remain strong, except for U.K. which continues to decline NAFTA
• (total vehicle sales including medium/heavy trucks) APAC industry reflects aggregate for major markets where Group competes (China, Australia, Japan, South Korea and India) FY ’17E FY ‘16 Outlook unchanged
• U.S. industry remains stable; Q3 and YTD ‘17 SAAR at 17.4M units
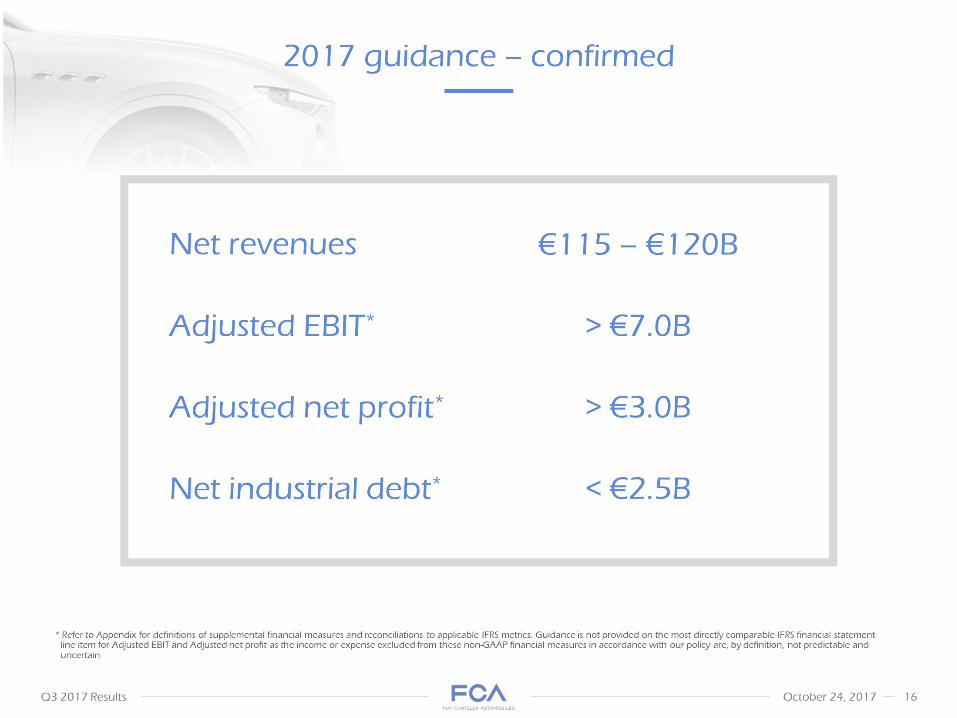
• 2017 guidance – confirmed * Refer to Appendix for definitions of supplemental financial measures and reconciliations to applicable IFRS metrics. Guidance is not provided on the most directly comparable IFRS financial statement line item for Adjusted EBIT and Adjusted net profit as the income or expense excluded from these non-GAAP financial measures in accordance with our policy are, by definition, not predictable and uncertain.
• Appendix
• FCA monitors its operations through the use of various supplemental financial measures that may not be comparable to other similarly titled measures of other companies. Accordingly, investors and analysts should exercise appropriate caution in comparing these supplemental financial measures to similarly titled financial measures reported by other companies. Group management believes these supplemental financial measures provide comparable measures of its financial performance which then facilitate management’s ability to identify operational trends, as well as make decisions regarding future spending, resource allocations and other operational decisions.
• FCA’s supplemental financial measures are defined as follows:
• Earnings before interest, taxes, depreciation and amortization (“EBITDA”) is computed starting with Net profit and adding back Net financial expenses, Tax expense/(benefit) and depreciation and amortization expense
• Adjusted earnings before interest and taxes (“Adjusted EBIT”) excludes certain adjustments from Net profit including: gains/(losses) on the disposal of investments, restructuring, impairments, asset write-offs and unusual income/(expenses) that are considered rare or discrete events that are infrequent in nature, and also excludes Net financial expenses and Tax expense/(benefit)
• Adjusted net profit is calculated as Net profit/(loss) excluding post-tax impacts of the same items excluded from Adjusted EBIT, as well as financial income/(expenses) and tax income/(expenses) considered rare or discrete events that are infrequent in nature Adjusted diluted EPS is calculated by adjusting Diluted EPS for the post-tax impact of the same items excluded from Adjusted EBIT, as well as financial income/(expenses) and tax income/(expenses) considered rare or discrete events that are infrequent in nature
• Net industrial debt is computed as: Debt plus derivative financial liabilities related to industrial activities less (i) cash and cash equivalents, (ii) current available-for-sale and held-for-trading securities, (iii) current financial receivables from Group or jointly controlled financial services entities and (iv) derivative financial assets and collateral deposits; therefore, debt, cash and cash equivalents and other financial assets/liabilities pertaining to financial services entities are excluded from the computation of Net industrial debt
• Net industrial debt should not be considered as a substitute for cash flows or other financial measures under IFRS; in addition, Net industrial debt depends on the amount of cash and cash equivalents at each balance sheet date, which may be affected by the timing of monetization of receivables and the payment of accounts payable, as well as changes in other components of working capital, which can vary from period to period due to, among other things, cash management initiatives and other factors, some of which may be outside of the Group’s control. Net industrial debt should therefore be evaluated alongside these other measures as reported under IFRS for a more complete view of the Company’s capital structure and liquidity. Supplemental financial measures
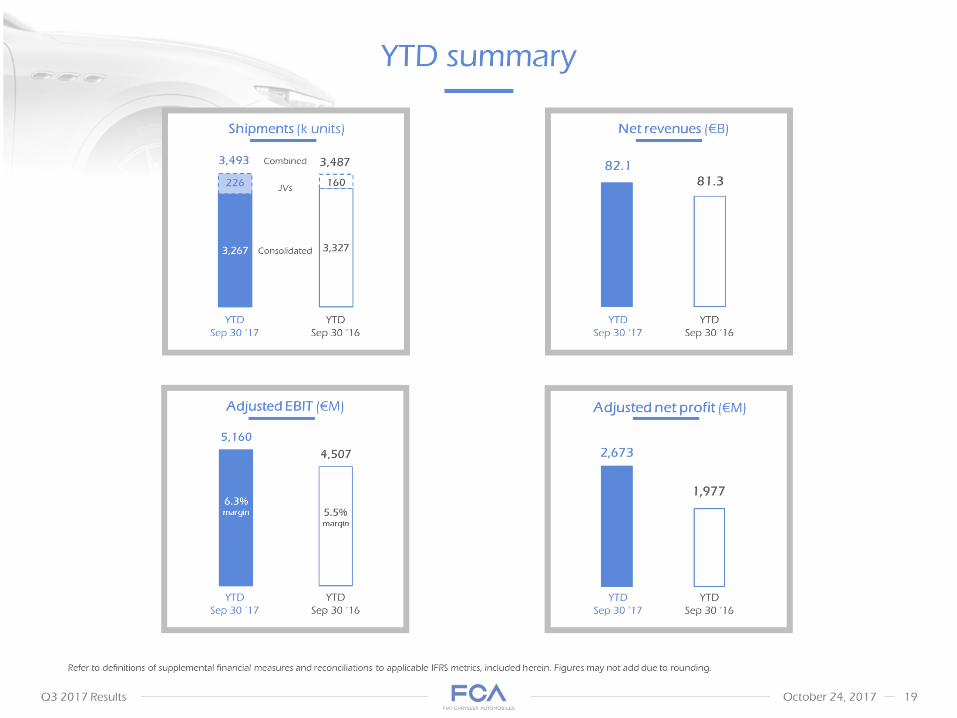
• Net revenues (€B) YTD Sep 30 ‘17 YTD Sep 30 ‘16 Adjusted EBIT (€M) 6.3%margin 5.5%margin Adjusted net profit (€M) YTD summary Shipments (k units) 3,487 Consolidated JVs 3,493 Refer to definitions of supplemental financial measures and reconciliations to applicable IFRS metrics, included herein. Figures may not add due to rounding. Combined
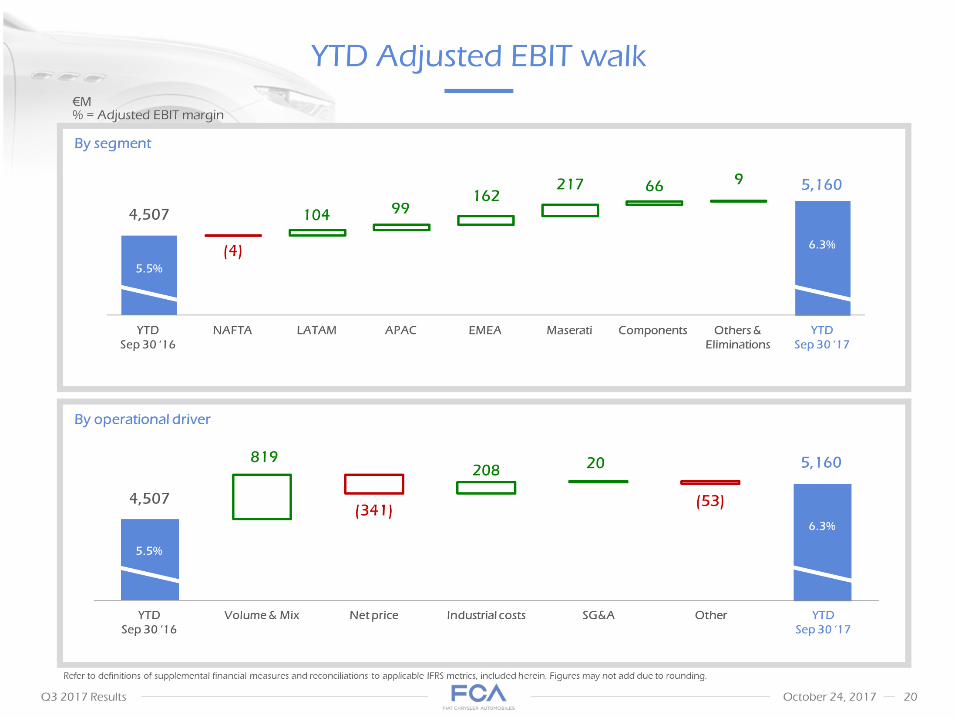
• 4,507 5.5% YTD Sep 30 ‘16 NAFTA LATAM APAC EMEA Maserati Components Others & Eliminations YTD Sep 30 ‘17 6.3% By segment YTD Adjusted EBIT walk €M% = Adjusted EBIT margin Volume & Mix Net price Industrial costs SG&A Other By operational driver Refer to definitions of supplemental financial measures and reconciliations to applicable IFRS metrics, included herein. Figures may not add due to rounding.
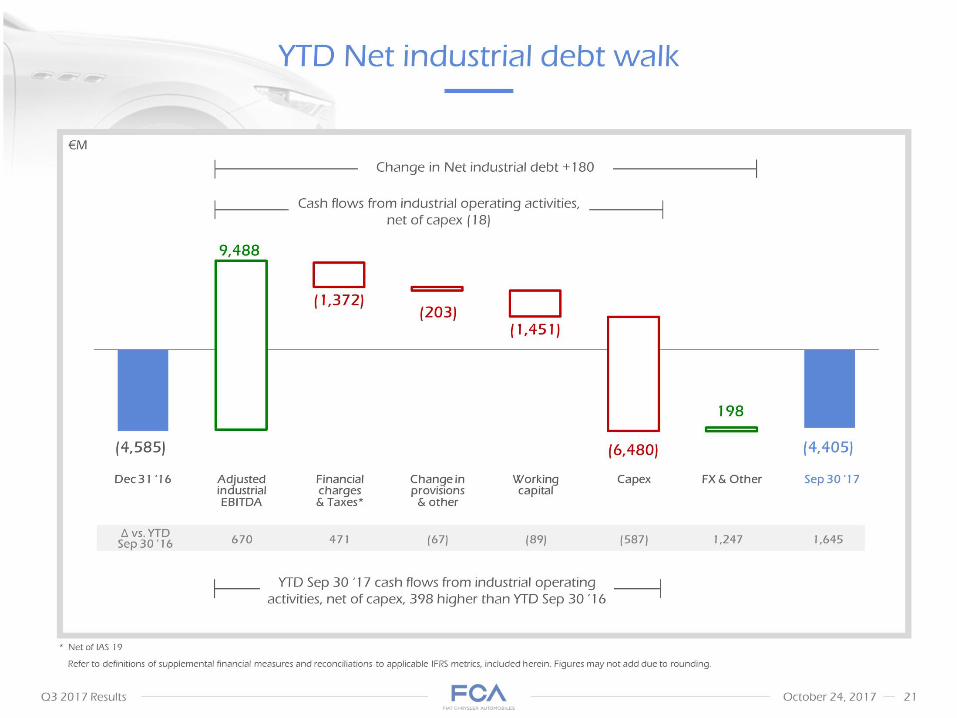
• * Net of IAS 19 Dec 31 ‘16 Adjusted industrial
• EBITDA Financial charges
• & Taxes* Change in provisions& other Capex FX & Other Sep 30 ‘17 €M Cash flows from industrial operating activities, net of capex (18) YTD Net industrial debt walk (4,585) Workingcapital Refer to definitions of supplemental financial measures and reconciliations to applicable IFRS metrics, included herein. Figures may not add due to rounding.
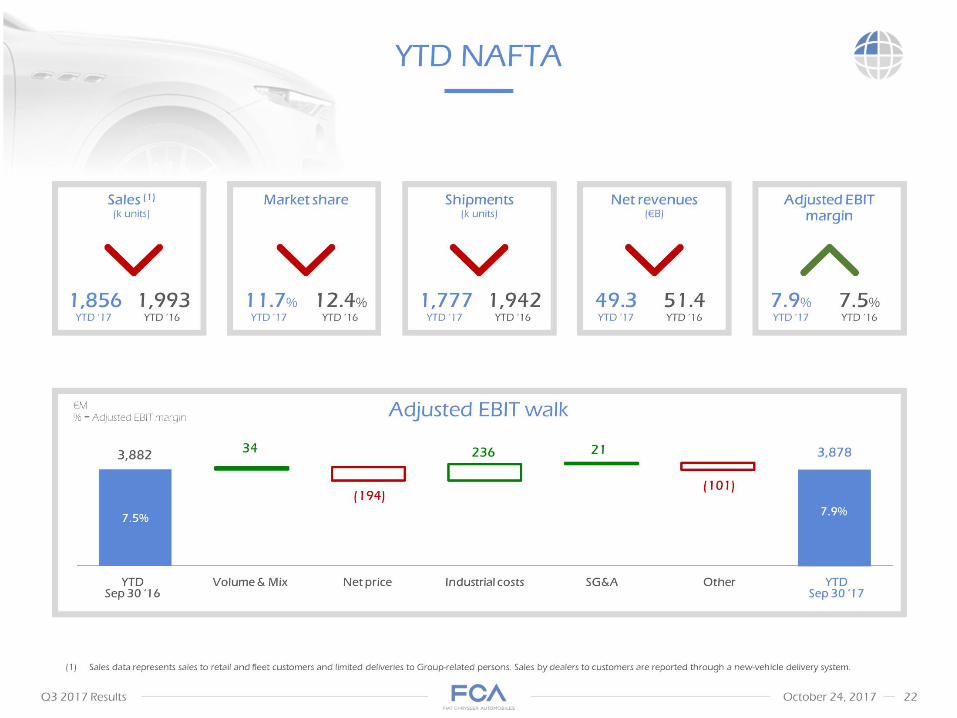
• Sales data represents sales to retail and fleet customers and limited deliveries to Group-related persons. Sales by dealers to customers are reported through a new-vehicle delivery system. YTD NAFTA Net revenues(€B) 51.4 YTD ‘16 49.3 YTD ‘17 YTD Sep 30 ‘16 Volume & Mix Net price Industrial costs SG&A Other YTD Sep 30 ‘17
• Adjusted EBIT walk €M
• % = Adjusted EBIT margin 3,882 7.5% 7.9% Adjusted EBIT margin
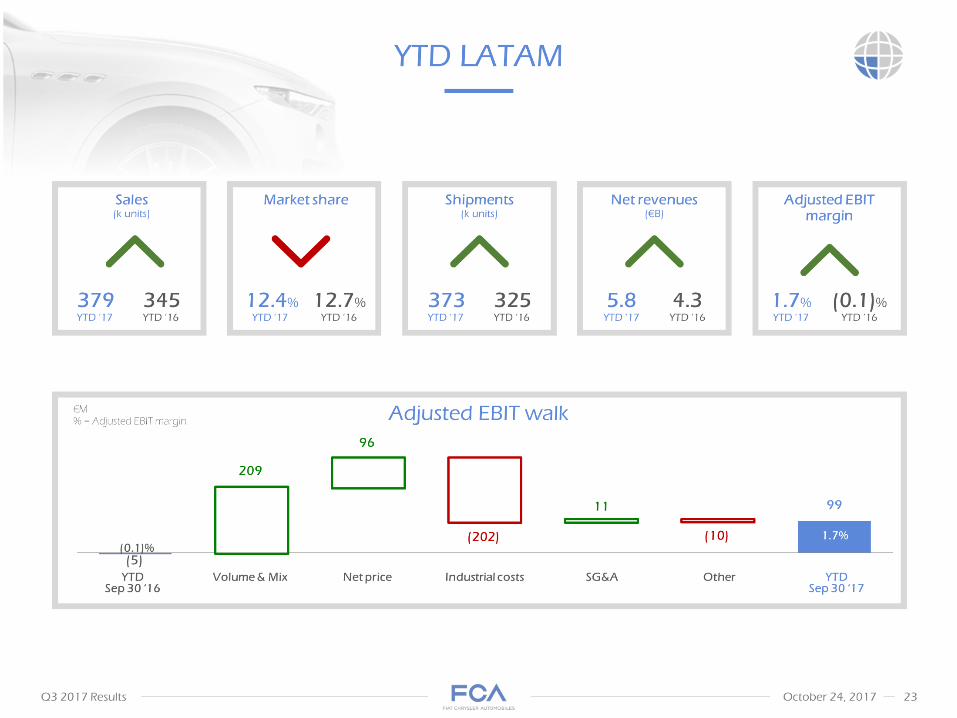
• YTD LATAM YTD Sep 30 ‘16 Volume & Mix Net price Industrial costs SG&A Other YTD Sep 30 ‘17 Adjusted EBIT walk (5) €M
• % = Adjusted EBIT margin 1.7% (0.1)%
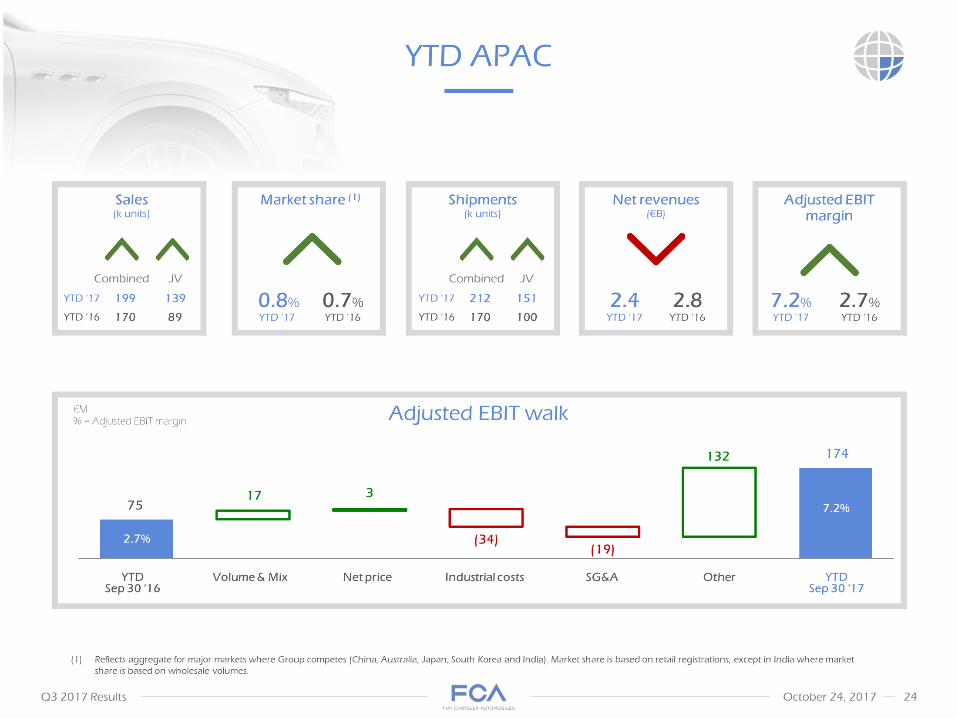
• YTD APAC Reflects aggregate for major markets where Group competes (China, Australia, Japan, South Korea and India). Market share is based on retail registrations, except in India where market share is based on wholesale volumes. YTD Sep 30 ‘16 Volume & Mix Net price Industrial costs SG&A Other YTD Sep 30 ‘17 Adjusted EBIT walk 75 €M
• % = Adjusted EBIT margin 2.7% 7.2%
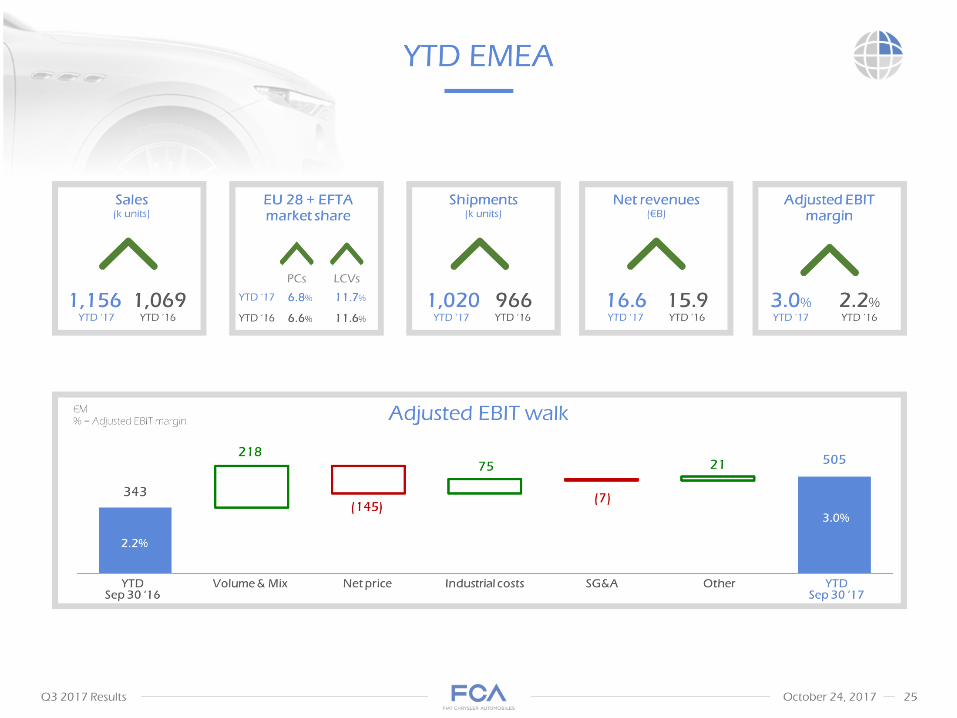
• YTD Sep 30 ‘16 Volume & Mix Net price Industrial costs SG&A Other YTD Sep 30 ‘17 Adjusted EBIT walk YTD EMEA €M
• % = Adjusted EBIT margin 2.2% 3.0% EU 28 + EFTA market share 6.6% 11.6% YTD ‘16 PCs LCVs YTD ‘17 6.8% 11.7% 343
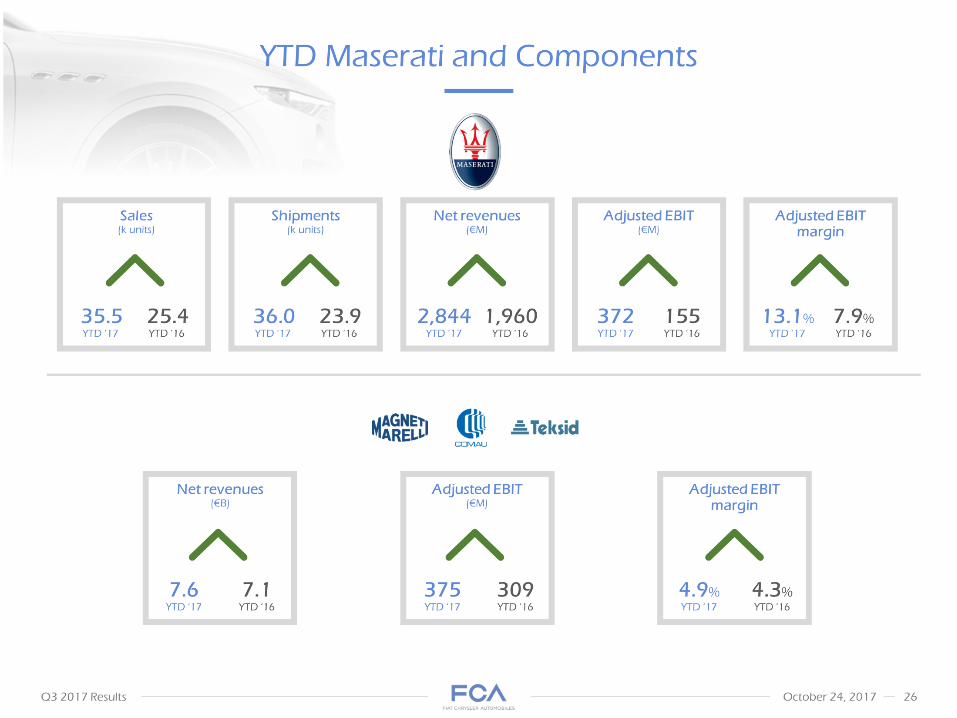
• YTD Maserati and Components Sales(k units) Net revenues(€M) Shipments(k units) Adjusted EBIT(€M) Adjusted EBIT margin Net revenues(€B) 7.1 YTD ‘16 4.3% 7.6 YTD ‘17 4.9%
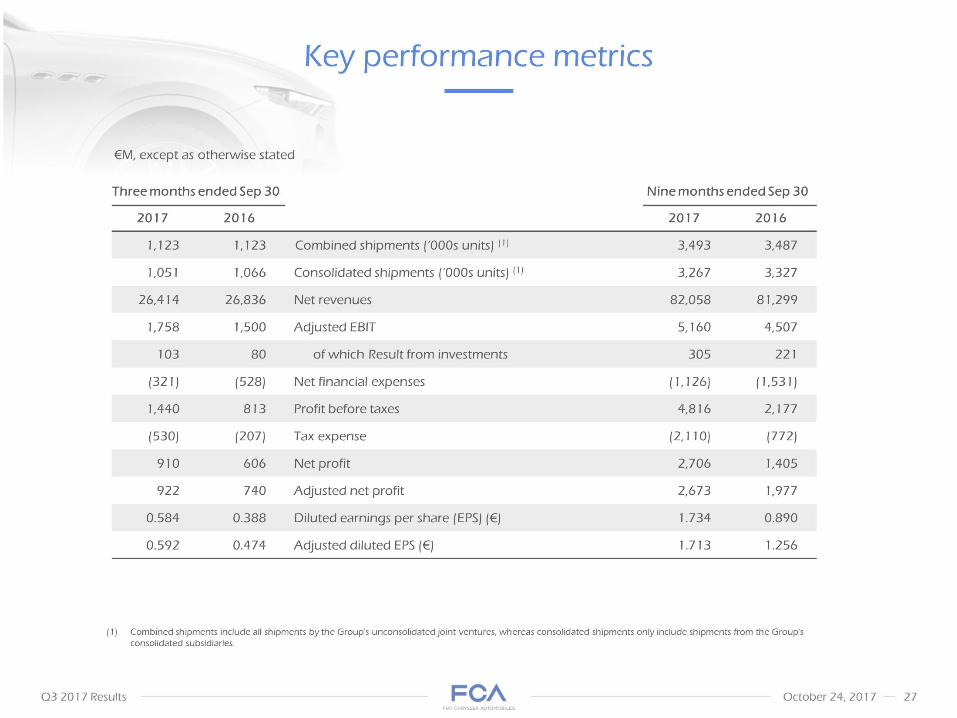
• Key performance metrics €M, except as otherwise stated Combined shipments include all shipments by the Group's unconsolidated joint ventures, whereas consolidated shipments only include shipments from the Group's consolidated subsidiaries.
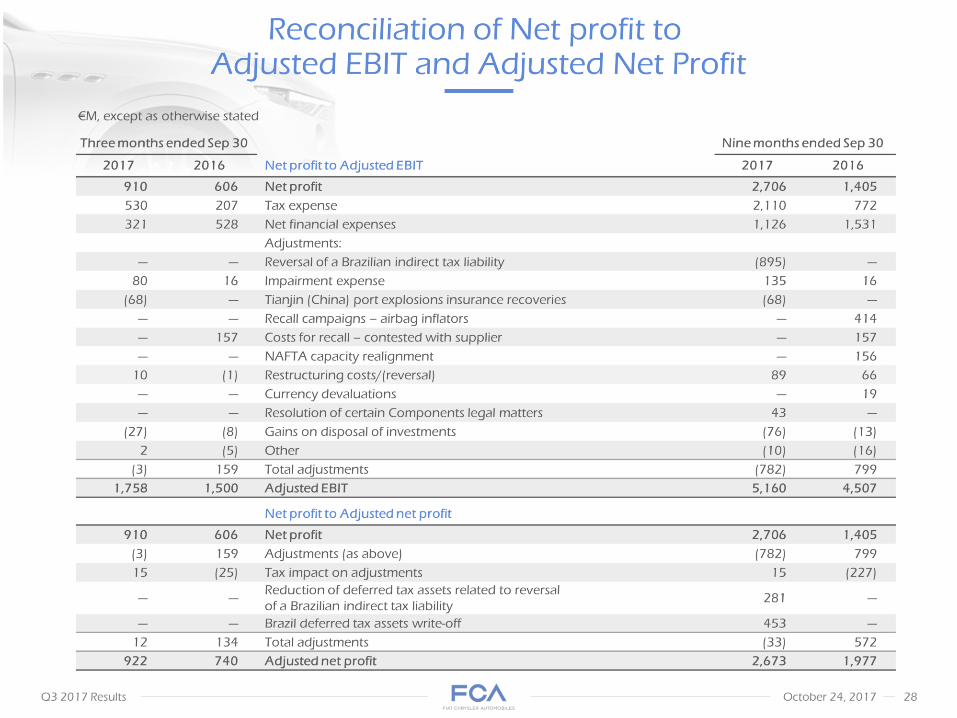
• Reconciliation of Net profit to Adjusted EBIT and Adjusted Net Profit €M, except as otherwise stated
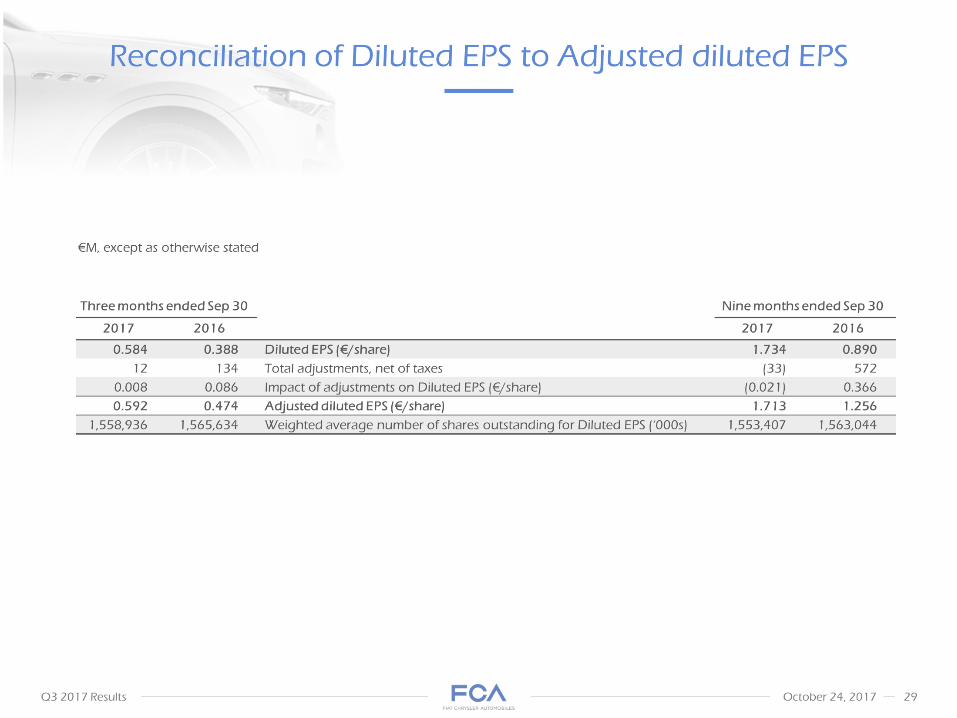
• Reconciliation of Diluted EPS to Adjusted diluted EPS €M, except as otherwise stated
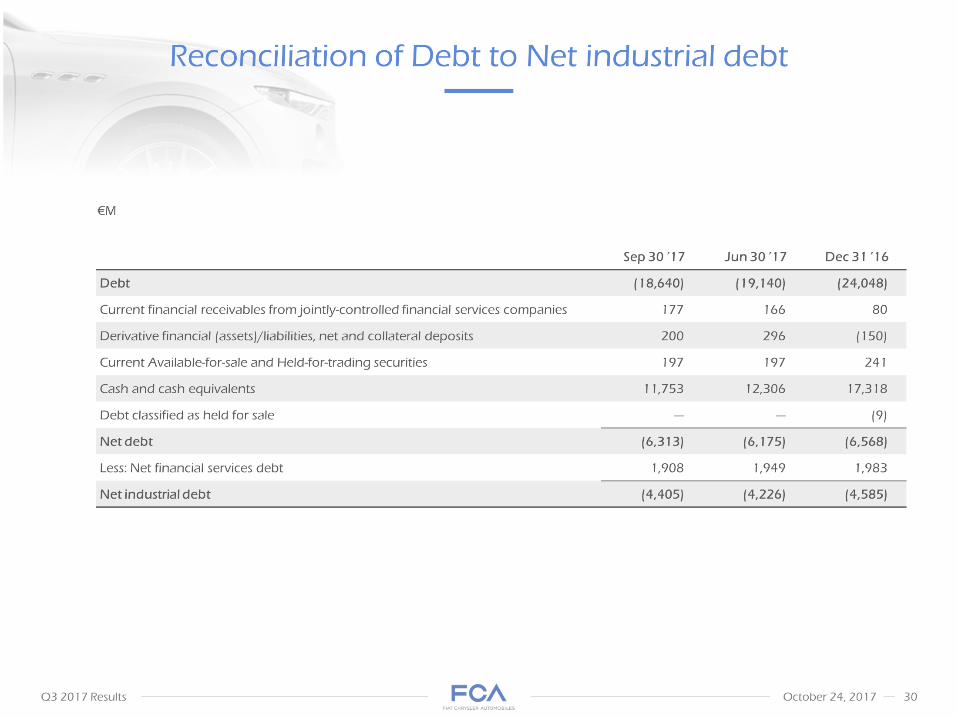
• Reconciliation of Debt to Net industrial debt €M
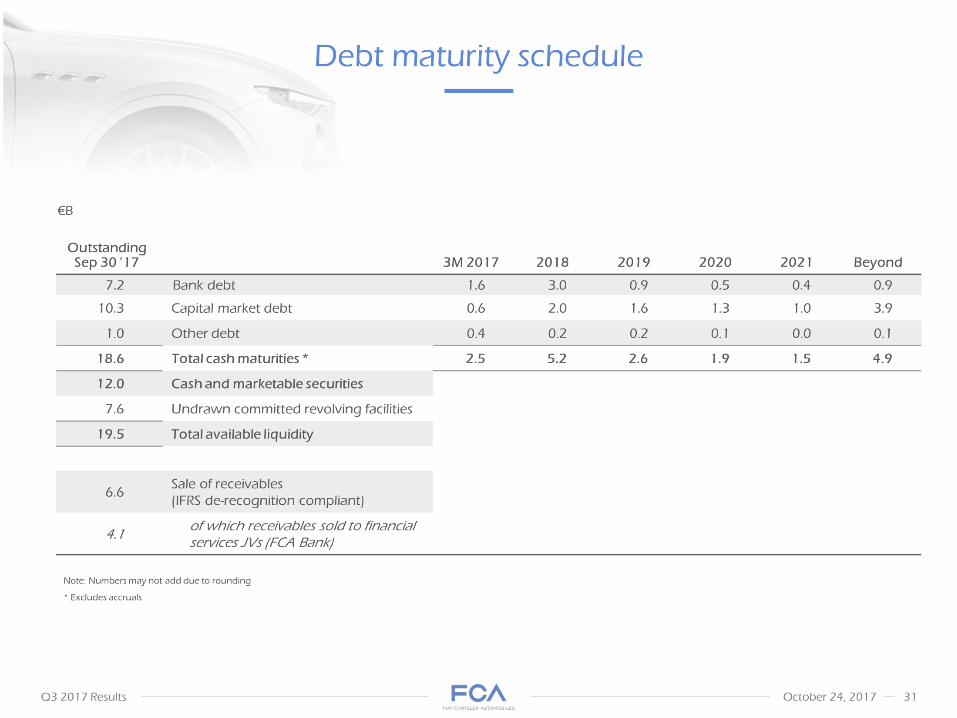
• Debt maturity schedule Note: Numbers may not add due to rounding
• * Excludes accruals €B
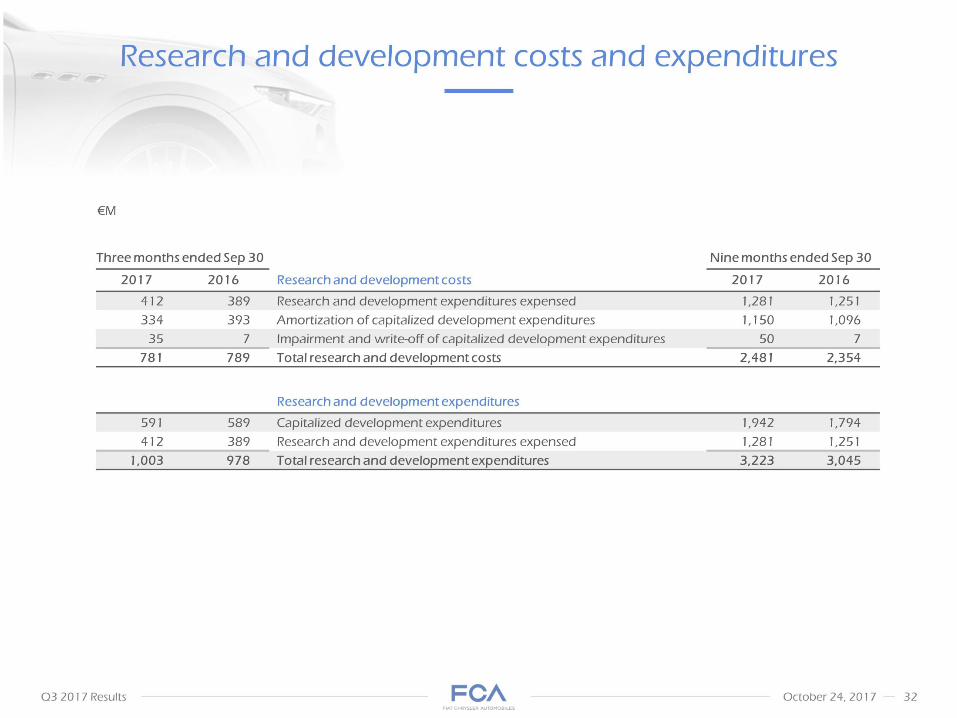
• Research and development costs and expenditures €M
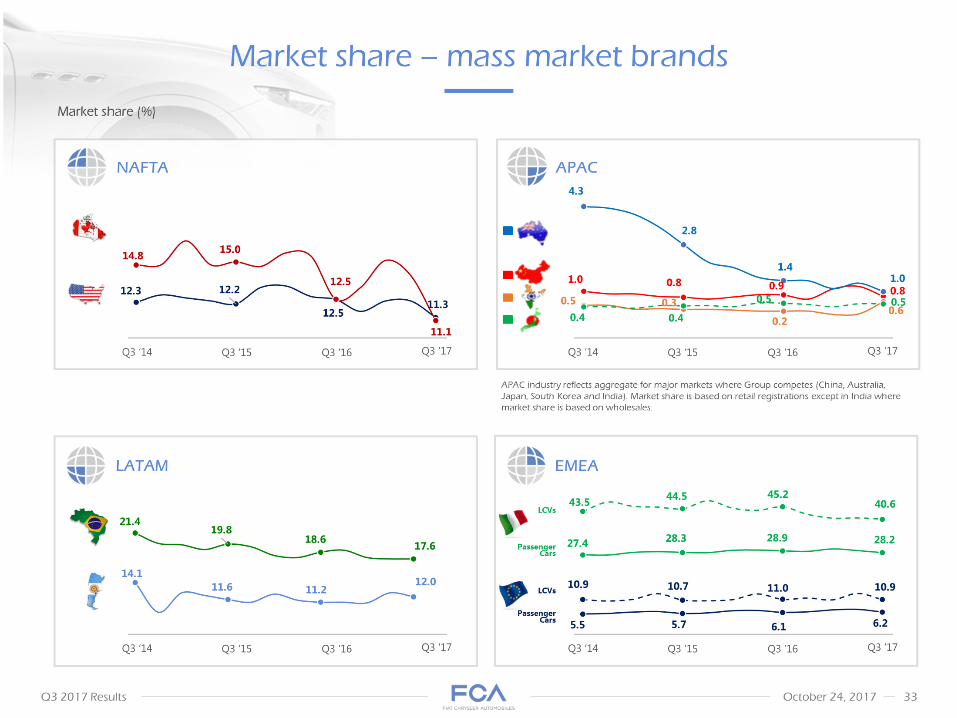
• Market share – mass market brands APAC industry reflects aggregate for major markets where Group competes (China, Australia, Japan, South Korea and India). Market share is based on retail registrations except in India where market share is based on wholesales. Market share (%) LATAM APAC EMEA Q3 ‘15 Q3 ’16 Q3 ‘17 Q3 ‘14 LCVs Passenger Cars NAFTA

•
![[ACA webinar] Investor Experiences with Online Equity Platforms](https://static.fdocuments.net/doc/165x107/58ec95411a28ab9f488b4639/aca-webinar-investor-experiences-with-online-equity-platforms.jpg)
![[FINAL ONLINE] CNPF 1H18 Investor Presentation](https://static.fdocuments.net/doc/165x107/622da732490085282e59227e/final-online-cnpf-1h18-investor-presentation.jpg)