FBD Holdings plc 2006 Preliminary Results 7 th March 2007 A.

Our Policy is You
FBD Holdings plc2014 Results
March 2015
1
Forward Looking Statement
This presentation contains certain forward-looking statements. Actual
results may differ materially from those projected or implied in
such forward-looking statements. Such forward-looking information
involves risks and uncertainties that could affect expected results.

2014 Results – Highlights
Path to profitability Market wide rating action is required This underscores the need for underwriting discipline at FBD Significant underwriting action and rate increases
implemented since June 2014 We will be in a period of reduced exposure while uneconomic
market rates prevail
Performance Rate led Gross Written Premium (GWP) up 3.6% Combined Operating Ratio (COR) of 113%:
• Sharp deterioration in market claims environment • Worst weather experience in Group’s history• Increase in claims frequency associated with
economic growth• Poor large claims experience • Adverse development of some prior year claims
Annualised investment return of 3.1%, excellent result in a low yield environment
Financial strength NAV of 693c Reserving ratio 251% (2013: 235%) Solvency of 67.6% of NEP
Dividend Final dividend of 34c Full year dividend up 4.1% to 51c
Current environment extremely challenging, significant action taken to return to profitability2
2014 2013GWP €363.7m €351.2mResult before tax (€4.5m) €51.5m
Operating EPS (13c) 136cDiluted EPS (11c) 131cNAV 693c 823cDPS 51c 49c

2014 Results – Irish economy
Economic recovery stronger than expected, a positive in medium term for FBD
Economy Economic growth stronger than expected Domestic demand forecast to grow 4.1% in
2015 Unemployment rate 10.8% in 2014, down
from 12.2% in 2013 Consumer sentiment at an eight year high Increase in 2014 new vehicle registrations:
• Cars up 30% (Highest sales since 09) • HGVs up 16% • LCVs up 51%
3

2014 Results – Insurance industry
Insurance industry The Irish property and casualty insurance
market increased by 3.4% in 2014, the first market growth since 2003
The market COR in 2012 and 2013 was 109%
The deterioration in the claims environment is likely to result in another loss-making year for the industry in 2014
Industry risk exposure will rise with economic activity
Market rates have begun to harden on motor and liability, but more is required to deliver adequate returns
4 The insurance market grew in 2014. Industry faces a steep profitability challenge
50%60%70%80%90%100%110%120%130%140%150%
Motor and Liability Insurance MarketCombined Operating Ratio
Motor Annual %COR Liability Annual %COR Break‐Even %CORSource: CBI

2014 Results – Claims: Attritional
Economic recovery leads to higher claims frequency 5
Higher claims frequency Economic recovery and increased activity
led to higher frequency in motor and liability claims
Increase evident across all customer profiles
NRA Toll usage 2011-14: +20% HGVs, +11% Non HGVs
Highest level of road fatalities since 2010
Analysis of Loss Ratio 2008 ‐ 2014
Attritional claims environment Attritional loss ratio rose from 49.2% to 63.8%
• Frequency of motor and liability claims• Prior year development• Potential slowdown in settlements • Discount rate judgement
20
40
60
80
100
120Automotive Fuel v Road Fatalities
Automotive Fuel Fatalities

2014 Results – Claims: Non-attritional
Non-attritional claims environment Non-attritional weather and large claims
accounted for 22% of NEP vs seven year average of 17.6%
6
Large claims Cost of large claims has been above
seven year average for three of last four reporting periods
Volume of claims has remained within its historic range
Weather Severe and persistent weather experience
in areas where FBD’s risk exposure is highest
9,000 customers affected Group reinsurance treaties
operated effectively and reduced overall cost to €15.2m
Customer feedback positive
Most severe weather experience in Group’s history and large claims make 2014 a costly year
Analysis of Loss Ratio 2008 – 2014 Severe and persistent weather and large claims
H1 2008
H2 2008
H1 2009
H2 2009
H1 2010
H2 2010 H1 2011H2 2011
H1 2012
H2 2012
H1 2013
H2 2013
H1 2014
H2 2014
0
2
4
6
8
10
12
€'m€'m
Net cost of accident and liability claims (> €1m) 2008 ‐ 2014
15.8%
19.4% 20.8%
14.2%13.1%
18.7% 22.2%
10%
12%
14%
16%
18%
20%
22%
2008 2009 2010 2011 2012 2013 2014
Severe and persistent weather & large claims LR Seven year average LR: Severe and persistent weather & large claims

2014 Results – Underwriting and rating actions
Significant action taken in response to changing market conditions 7
Underwriting and rating actions FBD has taken strong rating action Selective risk appetite on certain classes, lines Focus on stable lines and classes of risk Retention of performing risk segments Expanded product offering and upselling
contributes to higher cover levels
Premium GWP up 3.6% Rate led growth FBD has prudent approach to new risks in a
recovering economy experiencing increased claims frequency
Average premium up 4.5%, policy volume reduced 1.9%
Analysis of change in GWP (YoY)
‐10.0%
‐8.0%
‐6.0%
‐4.0%
‐2.0%
0.0%
2.0%
4.0%
6.0%
8.0%Policy volume Average rate Cover and mix Total GWP
H1 09 H2 09 H1 10 H2 10 H1 11 H2 11 H1 12 H2 12 H1 13 H2 13 H1 14 H2 14

2014 Results – Earned premium trails rates
FBD rating actions will be reflected in 2015 improvements in profitability 8
Earned premium trails rate increases
The increase in economic activity is positive for FBD in the medium term
The pace of growth in economic activity results in increased claims activity and impacts profitability in the short term
There is a time lag before rate increases are fully reflected in profitability
Earned premium trails FBD car rate increases (Indexed from Sep 2013)
Average Rate Increase Applied Average Earned Premium
Earnedpremium trails rate increases

2014 Results – FBD’s business mix stable over time
Continuing to broaden and deepen customer reach
Farm and business direct Expanded product offering to farmers Enhanced call handling Non-core activity centralised to allow sales offices
focus on customers’ needs
9
Consumer Rate-led growth in car insurance Launched new home insurance product in July and new
home marketing campaign in February 2015
Brokers 20% of all new business Broker book has reached target levels and
relationships with broker partners developing well Market rates hardening for business insurance,
particularly liability Broker book has diversification characteristics
Balanced premium growth

12.0
%
7.6%
24.9
%
12.8
%
15.2
%
7.6%
4.8%
9.7% 10
.7%
20.7
%
11.6
%
10.3
%
7.8%
12.0
%
10.4
%
11.3
%
19.9
%
11.2
%
10.0
%
8.0%
12.2
%
10.4
% 11.6
%
19.2
%
11.5
%
10.0
%
8.7%
11.2
%
11.1
%
11.5
%
16.1
%
11.2
%
10.7
%
10.7
%
10.4
%12.3
%
11.8
%
16.0
%
11.1
%
11.5
%
9.0%
8.6%
14.7
%
12.2
%
15.5
%
11.8
%
11.6
%
9.4%
6.2%
15.9
%
12.6
%
15.4
%
11.1
%
11.6
%
10.0
%
6.5%
14.2
%
13.6
%
13.3
%
12.3
%
12.0
%
10.4
%
6.8%
13.7
%
RSA FBD Aviva Allianz AXA Zurich Liberty/Quinn2000 2006 2007 2008 2009 2010 2011 2012 2013 2014
200
250
300
350
400
23002500270029003100330035003700390041004300
FBD ‐ €m Market ‐ €m Premium Income ‐ FBD and the Market
Total Market FBD
2014 Results – Market share (GWP)
10
Latest availablemarket data (II)
Market share growth in 13 of the last 14 years
99
178
60
110
160
210
Premium Income ‐ FBD and the Market (Base 2000 = 100)
Total Market FBD

2014 Results – Non-underwriting
Financial services
11
Includes: • premium instalment services• life, pension and investment broking (FBD Financial Solutions, largest retail broker in Ireland) • costs of Holding Company
Solid performance in a tough environment, delivering an operating profit of €5.2m (2013: €6.4m)
Joint venture (JV) 50% share of property and leisure operations in Ireland and Spain Trading performance improved in 2014, driven by growth in occupancy and yield, particularly in Irish
market, where revpar increased by 9% The Group’s share of JV profits was €1.9m (2013: €1.3m) In early 2015, JV completed the sale of Temple Bar Hotel in Dublin city centre Agreement with Taylor Wimpey plc on development land at La Cala Resort in Spain is ahead of plan Objective is to realise value as market conditions improve
JV taking opportunities to realise value

Prudent management of investment assets - protecting customers and shareholders
2014 Results – Investment asset allocation
• Investment return of 3.1%, an excellentperformance in a low yield environment
• Return delivered with a low risk portfolio
• All asset classes contributed to performance
• Tactical allocation guards against volatility and provides flexibility to take opportunities
• Equity holdings reduced by 44% as gains were realised
12
31-Dec-14 31-Dec-13Underwriting investment assets €m % €m %
Deposits and cash 511 58% 454 53%Corporate bonds 224 25% 144 17%Government bonds 46 5% 134 16%Equities 41 5% 73 8%Unit trusts 25 3% 24 3%Own land & buildings 16 2% 15 2%Investment property 20 2% 12 1%
Underwriting investment assets 883 100% 856 100%
Other assets 118 116Reinsurers’ share of provisions 57 44Investment in joint venture 47 45Plant and equipment 47 31
Total assets 1,152 1,092

2014 Results – Balance sheet
13
IAS 19 retirement benefit obligation increased by €22m, discount rate reached historic low
Resilient solvency level of 67.6% of NEP which equates to 343% of minimum solvency level
Reserving ratio* 251% (2013: 235% ) Net asset value per share 693c
NAV & solvency strength
Resilient balance sheet, robust reserves
Solvency & Reserving Ratios
*Reserving ratio = (Outstanding claims reserve + unearned premium reserve)/ Net earned premium
210%
220%
230%
240%
250%
260%
30%35%40%45%50%55%60%65%70%75%80%
Solvency Ratio Reserving Ratio
823693
1173
50 4
0
100
200
300
400
500
600
700
800
NAV - Dec '13 to December '14
NAV progression – Dec 2013 to Dec 2014

Prior years 2005 2006 2007 2008 2009 2010 2011 2012 2013 2014 Total€m €m €m €m €m €m €m €m €m €m €m €m
Estimate of cumulative claims:At end of underwriting year 290 298 307 338 308 283 233 235 248 276 One year later 287 257 281 319 286 265 208 219 232 Two years later 221 254 277 318 286 266 216 226 Three years later 210 251 273 317 284 260 218 Four years later 205 247 269 313 274 255 Five years later 201 243 263 306 272 Six years later 199 239 259 303 Seven years later 198 236 256 Eight years later 196 236 Nine years later 197
Estimate of cumulative claims 197 236 256 303 272 255 218 226 232 276
Cumulative payments (190) (229) (245) (285) (245) (206) (150) (132) (113) (87)
Claims outstanding 8 7 7 11 18 28 49 68 94 119 189 597
Saving 2014 0 (1) (0) 2 2 1 5 (2) (7) 16 ‐ 16
2014 Results – Reserving strength
Robust reserves14
Net reserving and run off
2014 Results – Dividend
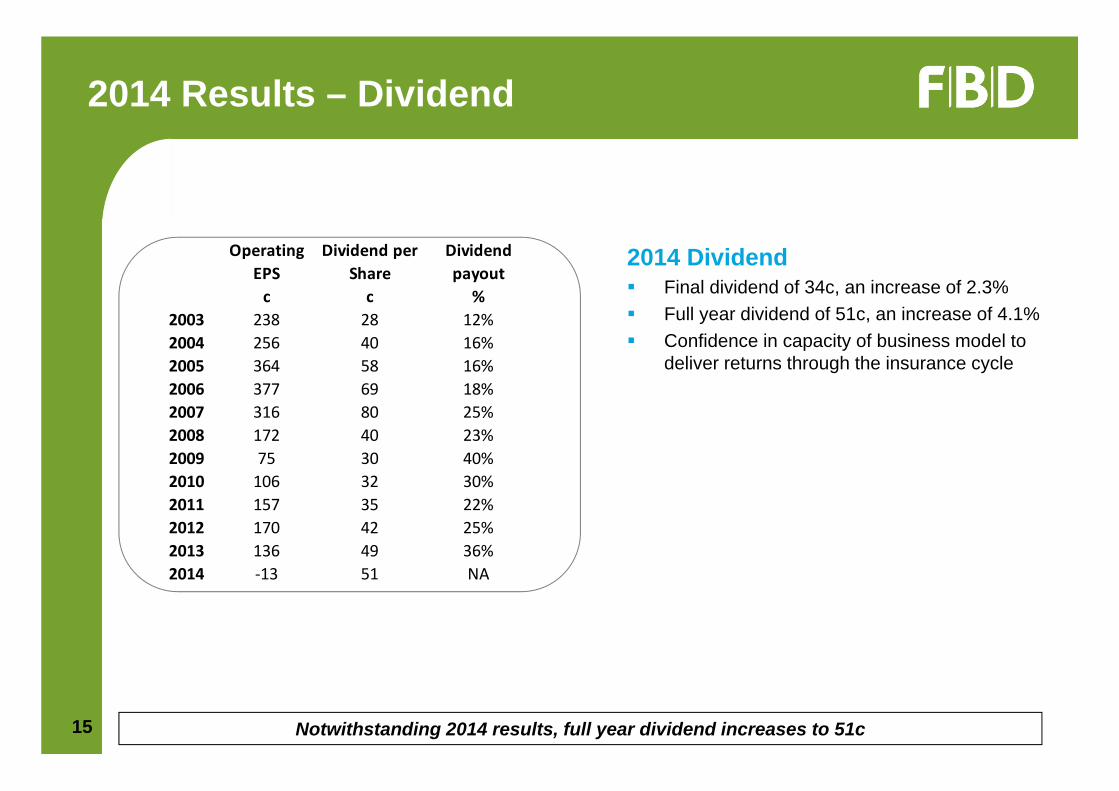
2014 Dividend Final dividend of 34c, an increase of 2.3% Full year dividend of 51c, an increase of 4.1% Confidence in capacity of business model to
deliver returns through the insurance cycle
15 Notwithstanding 2014 results, full year dividend increases to 51c
Operating EPS
Dividend per Share
Dividend payout
c c %2003 238 28 12%2004 256 40 16%2005 364 58 16%2006 377 69 18%2007 316 80 25%2008 172 40 23%2009 75 30 40%2010 106 32 30%2011 157 35 22%2012 170 42 25%2013 136 49 36%2014 ‐13 51 NA

2014 Results – Outlook
15
FBD
Is committed to achieving profitable growth in book value through
underwriting discipline
Is well positioned to continue to outperform the market
Has taken and will continue to take appropriate action to deliver
strong shareholder returns
Actions since early 2014 are having a beneficial impact on the loss
ratio
Profitability in 2015 will be impacted by external environmental
challenges
In particular, heightened uncertainty in the claims environment
contributes to our cautious outlook
Subject to no exceptional events arising, the Group is guiding full
year 2015 operating earnings per share of between 20 and 40 cent
FBD aims to deliver superior returns to shareholders through the underwriting cycle
External environment
Economic indicators point to an improved outlook
for Ireland
First growth in Irish Insurance market in eleven
years
Industry profitability continues to be challenging
We have entered a period of uncertainty
Improvement in market profitability will be
contingent on :
• evolution of claims costs
• market rating actions
16

2014 Results – Summary
FBD remains well positioned in its market and will deliver superior returns
FBD has A long track record of superior shareholder
returns A robust underwriting business and an
excellent franchise Industry leading net promotor score A resilient balance sheet and a prudent
reserving strategy A low-risk investment portfolio
FBD will Achieve profitable margins through
underwriting discipline Seek opportunities for sustainable growth Continue to invest in people and technology Deliver superior returns to shareholders
17
The insurance market Is inherently cyclical and is experiencing heightened
uncertainty in claims environment Continues to face profitability challenges Rates have begun to harden but more is required Competitive dynamics will decide the speed and extent
of recovery

Our Policy is You
FBD Holdings plc
2014 Final Results
18