THE FATIGUE PROPERTIES OF LOW ALLOY AND CARBON STRUCTURAL ...

Procedia Engineering 66 ( 2013 ) 626 – 634
Available online at www.sciencedirect.com
1877-7058 © 2013 The Authors. Published by Elsevier Ltd. Selection and peer-review under responsibility of CETIM doi: 10.1016/j.proeng.2013.12.114
ScienceDirect
5th Fatigue Design Conference, Fatigue Design 2013
Fatigue Damage Analysis on Aluminium Alloy Specimens under Strain Loading Sequences Associating with the Kurtosis-based
Coefficient M. M. Padzi, S. Abdullah, M. Z. Nuawi, Z. M. Nopiah*
Department of Mechanical and Materials Engineering, Universiti Kebangsaan Malaysia, 43600 UKM Bangi, Selangor, MALAYSIA
Abstract
Constant amplitude data obtained from smooth specimens have been used for many years to evaluate the fatigue life of components. However, most of the loadings used in real applications are variable or random. This paper discussed the analysis on fatigue signal of Al 6061 specimen under three types of loading sequences, i.e. constant loading (CL), Hi-lo (HL) and Lo-hi (LH) associating with Integrated Kurtosis-based Algorithm for Z-filter (I-Kaz) technique. Fatigue test was performed according to the ASTM E466-96 standard with attachment of 2 mm strain gauge at the gauge of flat dumbbell shape specimen. Fatigue test was carried out at all the three types of loading stress at the sampling frequency of 8 Hz. Series of strain data were collected throughout the test from initial until failure occur using a data acquisition system. The respective I-kaz coefficients and the three dimensional plot s were used to analyse and interpret the strain signals. Fatigue damage for thress loading sequences were compared, and it was found that the I-kaz coefficient was linearly correlate to fatigue damage, hence, it is worth to see the capability of this method to representing the fatigue damage of metallic materials.
© 2013 The Authors. Published by Elsevier Ltd. Selection and peer-review under responsibility of CETIM, Direction de l'Agence de Programme.
* Corresponding author.. E-mail address: [email protected]
© 2013 The Authors. Published by Elsevier Ltd. Open access under CC BY-NC-ND license.Selection and peer-review under responsibility of CETIM
Open access under CC BY-NC-ND license.

627 M.M. Padzi et al. / Procedia Engineering 66 ( 2013 ) 626 – 634
1. Introduction
Almost all materials, machinery, structures and structural components can suffer fatigue failure. To date, fatigue accounts for at least 90% of all service failures due to mechanical causes [1]. Most of the fatigue characterization of a material is traditionally performed under constant sinusoidal loading [2]; however, in service, the majority of structures and components are subjected to the stress of variable amplitude. There is extensive evidence to suggest that variable amplitude stress cycle could be more damaging than the same stress cycle under constant amplitude loading.
Usually, in fatigue study, a signal comprises of a measurement of a cyclic load, i.e., force, stress, and strain against time [3]. The strain-based approach, in which a strain signal is used to analyse fatigue failure, is presently widely used in fatigue problems. A signal is a series of numbers that come from measurement, typically obtained using some recording methods, as a function of time. The load applied to the structures will affect the value of the strain amplitudes that varies with time [4]. These signals are analysed using necessary statistical methods, which can evaluate and assess the fatigue failure behaviour/damage. The statistical method or statistics is a mathematical science pertaining to the collection, analysis, explanation, and presentation of data. These, falling under the mathematical discipline, are applied in a wide variety of dealings and help people identify, study, and solve complex problems. Statistical methods have been found to be extensively used in processing real-world signals [5]. However, current global signal statistical analysis is only sensitive to either signal amplitude or frequency.
In this research, aluminium has been used as an experiment material as these metals is widely used in most industrial and automotive application. Constant loading was used to observe and compare their fatigue failure damage. Strain signals were collected throughout the fatigue test. The signals were analysed using a new statistical method, the Integrated Kurtosis-based algorithm for Z-notch filter (I-kaz) technique. The I-kaz method was developed [6] based on its ability to detect any changes in the measured mechanical signal. Unlike the existing statistical parameters in standard deviation, variance, and kurtosis, the I-kaz method can indicate both amplitude and frequency differences by simultaneously obtaining the I-kaz three-dimensional (3D) representation and the I-kaz coefficient, Z∞.
2. Literature background
In fatigue life, there were three major prediction approaches: stress-life, strain-life and fracture mechanics. The strain-life theory relates fatigue to the plastic deformation that occurs in a localised region where fatigue cracks begin to affect the durability of the structural components. This approach is often used for ductile materials with a relatively short fatigue life and can also be applied to material with little plasticity and high number of cycle. Therefore, the strain-life method is a comprehensive approach that can be used in place of the stress-based method [7].The application of strain-life analysis requires a description of the response of material to cyclic elastic-plastic strains and a relationship between these strains and the fatigue life to the crack initiation behaviour.
I-kaz is a new statistical signal approach which developed based on the combination of kurtosis and the standard deviation values [8]. It describes the random or nondeterministic signal characteristics. To classify the random signals, the r-th order of moment Mr is frequently used. The r-th order of moment Mr for the discrete signal in the frequency band can be written as
1
1 ( )N
rr i
iM x
n (1)
where N is the number of data, xi is the data value at the instantaneous point, and μ is the mean. This technique is feasible in forming an effective condition monitoring system, as both descriptive and
inferential statistics have been utilised. The numerical descriptor of this method is the I-kaz coefficient, Z∞, and it is synchronised by the 3D graphical summarisation of the frequency distribution. The I-kaz display is used to model patterns in the data, accounting for randomness and drawing inferences about the larger population, which is classified as the inferential statistics. These inferences are very useful for the estimation and forecasting of future observations [8].

628 M.M. Padzi et al. / Procedia Engineering 66 ( 2013 ) 626 – 634
The I-kaz method can be used to recognize important variables or groups of variables that control the system under study. The resulting graphical representation permits the reduce of dimensions so that significant relationships among observations or samples can be identified. I-kaz measures the degree of data scattering with respect to the data centroid for a dynamic signal analysis. It provides better understanding through the visualisation of three graphical dimensions. It is based on the concept of data scattering around the centroid. In order to measure the scattering of a data distribution, the variance σ2 for each frequency band, which are σ2
L, σ2M, and σ2
H, respectively, is calculated as in Eq. 2. σ2
L, σ2M, and σ2
H indicates the decomposition of signals into three frequency ranges, which
are low frequency (L), medium frequency (M) and high frequency (H). The variance obtains the average magnitude deviation of instantaneous points with respect to the mean value.
2 2 2
2 2 21 1 1
( ) ( ) ( ); ;
i i i
N N NL M H
L M Hi i i
L M H
x x x
n n n (2)
Since the I-kaz method was developed based on the concept of scattering data around the centroid, the Z∞ coefficient can be written as follows:
2 2 2
1 1 12 2 2
( ) ( ) ( )i i i
N N NL L L
L M Hi i i
x x xZ
n n n (3)
Where xi, yi, and zi are the values of discrete data at the ith-sample of time in the range of low frequency (L), medium frequency (M), and high frequency (H), respectively. In addition, μL, μM, and μH are the mean of each frequency band, and n is the number of data. The Z∞ coefficient can be simplified in terms of variance σ, as in Eq. 4:
2 2 22 2 2
L M H (4)
The I-kaz method is generally adaptive and has the ability to detect any changes in the measured ultrasound
signal. Unlike existing statistical analyses, such as standard deviation, variance, and kurtosis, this method is capable of indicating both amplitude and frequency differences by simultaneously obtaining the I-kaz representation and the I-kaz coefficient.
3. Materials and methods
3.1. Materials
Aluminium 6061 is one of the most common alloys of aluminium for general purpose, has good mechanical properties and exhibits good weldability. It has been selected for this experiment due to its low cost and various applications in most engineering fields and machinery tools.
3.2. Tensile testing
Tensile tests were performed at room temperature using a 100 kN servo hydraulic test system with computer control [9], as shown in Fig. 1. Monotonic tensile tests were performed according to the ASTM standard E08 [11] to obtain
629 M.M. Padzi et al. / Procedia Engineering 66 ( 2013 ) 626 – 634
the main mechanical properties of the aluminium 6061 specimen, which will be used to determine the load value in the cyclic test. Fig. 2 shows the dimensions of flat rectangular tensile specimens, which were used for the tensiletesting at ambient temperature [10]. The tensile specimens were machined in order for them to be in a received (flat)condition. The dimensions of the specimens before and after the tensile test were also recorded. These data wereanalysed to determine the yield strength, tensile strength, elongation, and reduction in area. Standard procedures todetermine these values are described in ASTM E8 [10].
Fig. 1 The 100 kN servo-hydraulic universal testing machine used for the test of the flat specimen.
(a) (b)Fig. 2 Specimen used for the test; (a) dimension, (b) geometry in the ‘mm’ unit
3.3. Cyclic Testing
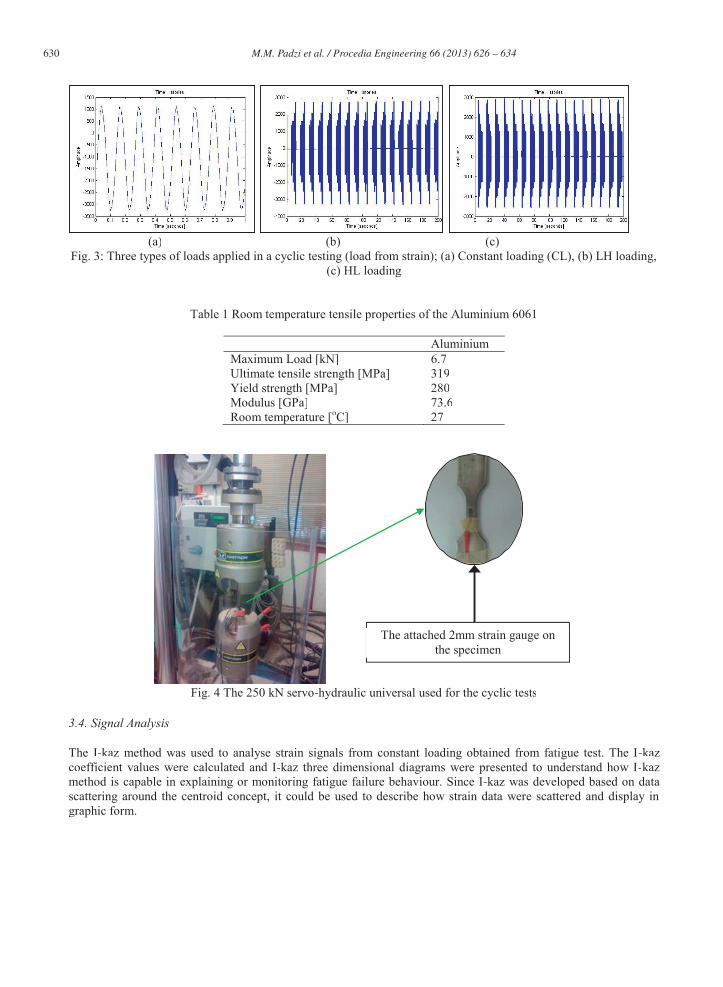
Cyclic testing was done using three types of loading – constant, LH, and HL loading – as shown in Fig 3. From the stress–strain curve measured by the tension test, the maximum stress (σmaxσσ ) of the cyclic tensile test in the fatiguetest is determined in Table 1. A specimen is subjected to constant, LH, and HL cyclic tensile test amplitudes atcyclic tensile stress ratio (R = σminσσ /σnn maxσσ ) of –1 and frequency of 8 Hz [11] using the 25 kN servohydraulic universaltesting machine as shown in Fig. 4. Constant loading, which is 80% of its maximum load, was used due to timeconstraint and the capability of the data acquisition system. LH and HL loading were determined and designed using specific software based on the fatigue damage calculated from the constant loading damage. A 2 mm strain gaugewas attached to the specimen connected to the fatigue-based data acquisition system. Strain data were collected using the specific fatigue data acquisition system at a sampling frequency of 100 Hz [12]. Such sampling frequencywas chosen based on the standard capability of the strain gauge to record the data. The tests were performedaccording to the ASTM E466-96, which is based on the stress control procedure. The process flow of theexperimental method is shown in Fig. 5.
Flat specimen(SAE 1045)
630 M.M. Padzi et al. / Procedia Engineering 66 ( 2013 ) 626 – 634
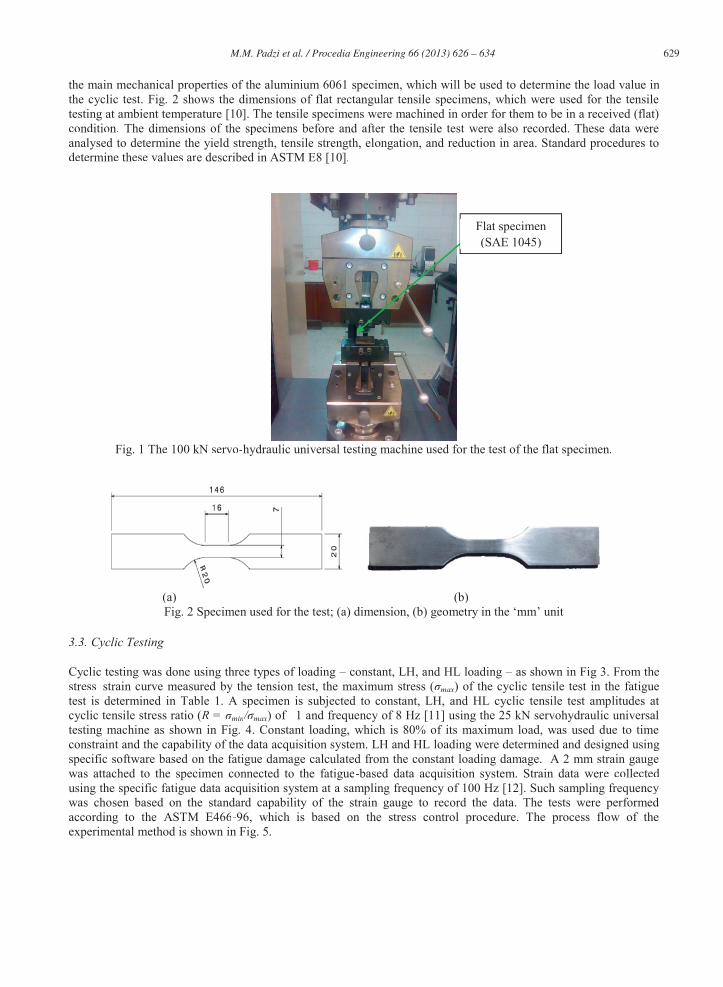
(a) (b) (c)Fig. 3: Three types of loads applied in a cyclic testing (load from strain); (a) Constant loading (CL), (b) LH loading,
(c) HL loading
Table 1 Room temperature tensile properties of the Aluminium 6061
AluminiumMaximum Load [kN]Ultimate tensile strength [MPa]Yield strength [MPa]Modulus [GPa]Room temperature [oC]
6.731928073.627
Fig. 4 The 250 kN servo-hydraulic universal used for the cyclic tests
3.4. Signal Analysis
The I-kaz method was used to analyse strain signals from constant loading obtained from fatigue test. The I-kazcoefficient values were calculated and I-kaz three dimensional diagrams were presented to understand how I-kazmethod is capable in explaining or monitoring fatigue failure behaviour. Since I-kaz was developed based on data scattering around the centroid concept, it could be used to describe how strain data were scattered and display ingraphic form.
The attached 2mm strain gauge on the specimen

631 M.M. Padzi et al. / Procedia Engineering 66 ( 2013 ) 626 – 634
Fig. 5 Process flow of the experimental procedure
4. Results and discussions
A moderate ductile fracture was observed in the tensile test specimen of Al 6061, where the fracture ispreceded only by a moderate amount of necking. The tensile properties, such as its strength-yielding nature and the ultimate tensile strength, were automatically evaluated from the load-extension plots. The tensile properties, whichare used to estimate the value of load applied to be used in the fatigue test, are shown in Table 1.
Three types of load were applied for fatigue testing with zero mean stress – CL, LH, and HL loading. Thestrain signals were collected throughout the test, from the initial stage until the occurrence of failure. During thefatigue test, strain data were collected; strain amplitude changes were observed. Figs. 6(a)-(c) show the strain signals collected for CL, LH, and HL loading, respectively. The figures exhibit the trend of strain signals form initial untilfailure for each of load type. The CL (Fig. 6(a)) gives a continuous increment throughout the test but slightlydecrease when it comes to failure. Comparing to the HL loading (Fig. 6(b)), the strain signal continuously increaseuntil the point of failure. However, for LH loading (Fig. 6(c)), the strain signal keep constant almost throughout thefatigue test and slightly increase when near to failure. In terms of strain range, all types of loading are in a samerange which is around 6000 μs. The trend exhibit by each signal may due to loading sequence effect; HL and LH.For constant loading, the specimen undergoes the constant stress continuously from early until the end of test.Therefore, the strain slightly decrease towards the end since the specimen has lost its atomic bonding at this point.Comparing between HL and LH loading, the stress applied are different each stress block. Each block has fourdifferent stress values, and the stress block is repeated till failure. Therefore, for HL and LH loading, the stress ismore stable from early towards the end due to applied stress are in block (less stress effect) and less energy to break the metal bonding inside the specimen. In addition, for both HL and LH loading, the strain signal slightly increasednear to failure because of high energy required to break the specimen.
Specimen preparation
Cyclic Testing
TensileTesting
Strain data collection
MechanicalProperties
Signal Analysis(I-kaz approach)
Constant loading I-kaz
coefficients
I-kaz 3Dgraphic

632 M.M. Padzi et al. / Procedia Engineering 66 ( 2013 ) 626 – 634
(a) (b)
(c)
Fig. 6 Strain signals collected from the aluminium alloy cyclic test at the sress levels of 255 MPa for (a) CL,( b) HL,
(c) LH
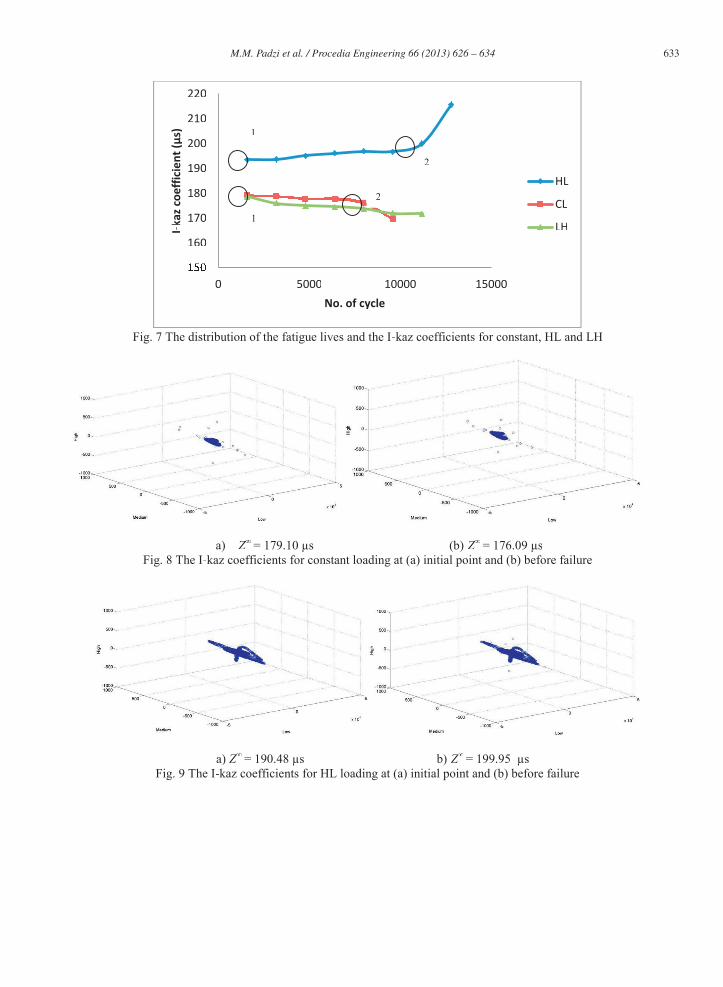
In further analysis, the I-kaz coefficients and I-kaz 3D diagram are obtained for each load. The experimentally determined fatigue lives for those CL, HL and LH loadings are found to be at 9600, 14400 and11200 cycles, respectively. It seems that the CL provided the lowest fatigue life followed by LH and HL. The strain signals were analysed at every 20,000 data points in order to determine the I-kaz trend from initial of experiment up to the end, or fracture occurence. Fig. 7 shows the correlation between I-kaz coefficients and fatigue life for each of loads. Constant loads gives a constant increment of I-kaz coefficient value from initial and abruptly increased when it fails. However for both HL and LH loads, the I-kaz coefficients values constantly decrease throughout the test. This may due to high stress effect occur at constant load compare to sequence load as sequence load have different stress values at each block which will have less stress effect. Furthermore, this explains the load sequence effect to fatigue life. The I-kaz coefficient ranges around 190 μs – 220 μs for constant load and around 160 μs – 180 μs for both HL and LH loads. I-kaz coefficient values obtained are depends on signals values.
Three dimensional I-kaz diagrams for each load applied are shown in Fig. 8-10. I-kaz 3D diagram were obtained at initial part (point 1) and the part before failure (point 20 as shown in circle Fig. 7. Each part consists of 20,000 data points. For constant loading, the I-kaz diagram have scattered points for both point 1 (Fig 8(a)) and 2 (Fig 8(b)) but the points scattered nearer at point 2. The scattered points in I-kaz diagram explain that there are several values in the signal which higher than the points that agglomerate. Higher strain values occur at point 1 compare to point 2 as the strain values keep decrease towards failure. The same explanation goes for LH load (Fig. 10), less points scattered at point 2. Different with HL load, more point scattered at point 2 (Fig. 9(b)) compare to initial part. This indicates higher strain values occur near to failure. For all loads, more scattered points will have higher I-kaz coefficients compared to less scattered points. Therefore, I-kaz technique can be used as another useful tool to evaluate and describe fatigue assessment although it may need more stress values to be experimented in order to conform its capability in fatigue assessment.
633 M.M. Padzi et al. / Procedia Engineering 66 ( 2013 ) 626 – 634
Fig. 7 The distribution of the fatigue lives and the I-kaz coefficients for constant, HL and LH
a) Z∞ZZ = 179.10 μs (b) Z∞ZZ = 176.09 μsFig. 8 The I-kaz coefficients for constant loading at (a) initial point and (b) before failure
a) Z∞ZZ = 190.48 μs b) Z∞ZZ = 199.95 μsFig. 9 The I-kaz coefficients for HL loading at (a) initial point and (b) before failure
160
170
180
190
200
210
220
0 5000 10000 15000
I-kaz
coe
ffici
ent (μs
)
No. of cycle
HL
CL
LH
1
2
1
2

634 M.M. Padzi et al. / Procedia Engineering 66 ( 2013 ) 626 – 634
a) Z∞ = 178.55 μs b) Z∞ = 73.72 μs Fig. 10 The I-kaz coefficients for LH loading at (a) initial point and (b) before failure
5. Conclusions
This study is performed evaluate the fatigue behaviour of aluminium Al 6061 with respect to the I-kaz method. Three types of loading were used which are CL, HL and LH. The I-kaz coefficients at initial part (point 1) were found to be at 179.1 μs, 190.48 μs and 178.55 μs, while they are at the values of 176.09 μs, 199.95 μs and 73.72 μs at the point before failure (point 2) for constant, HL and LH, respectively. I-kaz 3D diagram for both constant and LH show less point scattered before failure compared to HL which has more scattered points near the failure condition. It was found that the CL gave the lowest fatigue life compared to the LH and HL loadings. This indicates the significant of loading sequence effect which may increase or decrease fatigue life. For loading sequence effect, higher strain values produced may have longer fatigue life compare to constant load, which normally higher strain will have shorter fatigue life. However, more research should be done to explain the sequence effect to fatigue life and the application of I-kaz method in fatigue life assessment.
6. References
1. G.E. Dieter, Editor, Mechanical Metallurgy, McGraw-Hill, Singapore, 1986 2. N. L. Post, S. W. Case, J. J. Lesko, Int. J. Fatigue. 30, 2008, 2064-2086 3. S. Abdullah, M. D. Ibrahim, Z. M. Nopiah, A. Zaharin, J. Appl. Sci. 8, 2008, 1590-1593 4. K. A. Zakaria, S. Abdullah, M. J. Ghazali, M. Z. Nuawi, M. M. Padzi, Adv. Mater. Res. 2011, 197-198 5. M. Z. Nuawi, S. Abdullah, A. R. Ismail, R. Zulkifli, M. K. Zakaria, M. F. H. Hussin, WSEAS Trans. Signal
Process. 4, 2008, 279-288 6. M. Z. Nuawi, M. J. M. Nor, N. Jamaludin, S. Abdullah, F. Lamin, C. K. E. Nizwan, J. Appl. Sci. 2008, 1541-
1547 7. J. M. Barsom and S. T. Rolfe, Editor, Fracture and Fatigue Control in Structures, Applications of Fracture
Mechanics, Prentice-Hall, Inc., New Jersey, 1987 8. M. Z. Nuawi, M. J. M. Nor, N. Jamaludin, S. Abdullah, F. Lamin, C. K. E. Nizwan, J. Appl. Sci. 8, 2008,
1541-1547 9. T. G. Pals, R. I. Stephens, Int. J. Fatigue. 26, 2004, 651–661 10. Standard E 08, Standard test methods for tension testing of metallic materials. 2000 Annual Book of ASTM
Standards, vol.03.01. West Conshohocken, PA: American Society for Testing and Materials (2000) 11. T. Tanaka and Y. Izawa, J. Nucl. Sci. and Technol. 39, 2002, 514-519 12. K. Yamaguchi, T. Abe, K. Kobayashi, E. Takeuchi, H. Hirukawa, Y. Maeda, N. Nagashima, M. Hayakawa,
Y. Furuya, M. Shimodaira, K. Miyahara, J. Sci. and Technol. Adv. Mater. 8, 2007, 545-551