
Fatigue Behavior of Air-Entrained Concrete -...
100
Submitted to the Highway Division, Iowa Department of Transportation HR-183 ISU-ERl-Ames-78017 ERi Project 1259 ENGINEERING RESEARCH ENGINEERING RESEARCH ENGINEERING RESEARCH ENGINEERING RESEARCH ENGINEERING RESEARCH FINAL REPORT FATIGUE BEHAVIOR OF AIR-ENTRAINED CONCRETE D.Y.Lee F. W. Klaiber J. W. Coleman · July1977 DEPARTMENT OF CIVIL ENGINEERING ENGINEERING RESEARCH INSTITUTE IOWA STATE UNIVERSITY AMES
Transcript of Fatigue Behavior of Air-Entrained Concrete -...

Submitted to the Highway Division, Iowa Department of Transportation HR-183
ISU-ERl-Ames-78017 ERi Project 1259
ENGINEERING RESEARCH ENGINEERING RESEARCH ENGINEERING RESEARCH ENGINEERING RESEARCH ENGINEERING RESEARCH
FINAL REPORT
FATIGUE BEHAVIOR OF AIR-ENTRAINED CONCRETE
D.Y.Lee F. W. Klaiber
J. W. Coleman ·
July1977
DEPARTMENT OF CIVIL ENGINEERING ENGINEERING RESEARCH INSTITUTE
IOWA STATE UNIVERSITY AMES

Page Line
14 6
14
22 Fig. 5
ERRATA Final Report· HR-183
"Fatigue Behavior of Air-Entrained Concrete"
bv D. Y. Lee, F. W. Klaiber, and J. W. Coleman
July 1977
Now is
••• with class V aggregate
2.59
Should be
••• with crushed stone & .natural sand as aggregates.
2.66
Delete data pd.int at 5. 2 % air

TABLE OF CONTENTS
l. INTRODUCTION
1.1 Fatigue of Concrete in Pavement
1.2 Air-entrained Concrete in Pavement
1.3 Fatigue Behavior of Air-entrained Concrete
2. PURPOSE AND SCOPE
3. MATERIALS AND PROCEDURES
3.1 Test Program
3.2 Materials
3.3 Mixing Procedures and Quality Control
3.4 Equipment
4. RESULTS AND DISCUSSION
4.1 Physical Properties
4.2 Air Content
4.3 Microstructure
4.4 Results of Fatigue Tests
4.5 Treatment of Fatigue Data by Application of Fracture Mechanics
4.6 Implications in Concrete Pavement Design
5. SUMMARY AND CONCLUSIONS
6. RECOMMENDED FUTURE STUDIES
7 • REFERENCES
8. ACKNOWLEDGMENTS
9. APPENDIXES
9.1 Appendix A. Material Details
9.2 Appendix B. Test Data
9. 3. Appendix C. Pavement Design Calculations
l
l
6
8
10
11
12
14
15
17
20
20
25
33
45
58
60
66
69
70
74
75
76
79
84

ii
LIST OF TABLES
Page
Table 1. Physical characteristics of concrete studied. 21
Table 2. Air content of concrete by various methods. 29
Table 3. Comparison of pavement design procedures. 64
Table A.1. Gradation of fine aggregate. 76
Table A.2. Gradation of coarse aggregate. 76
Table A.3. Cement properties. 77
Table A.4. Laboratory batch quantities. 78
Table B.1. Test data, Batch c, 2.8% air. 79
Table B.2. Test data, Batch A, 3.5% air. 80
Table B.3. Test data, Batch E, 6.4% air. 81
Table B.4. Test data, Batch D, 10.2% air. 82
Table B.5. Test data, Batch B, 11.3% air. 83
iii
LIST OF FIGURES
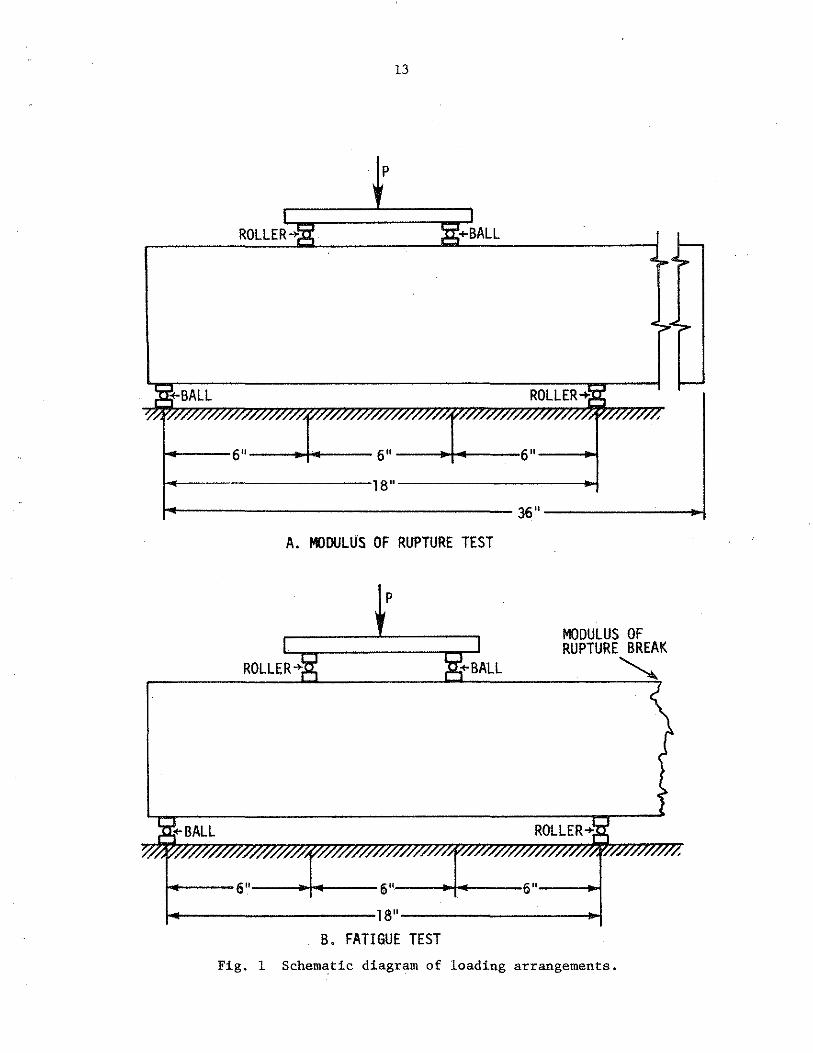
Fig. 1. Schematic diagram of loading arrangements. 13
Fig. 2. Photograph of the modulus of rupture test set-up 18 showing support conditions for the third-point flexural loading scheme. Identical support conditions were used in the InStron dynamic cycle for fatigue testing.
Fig. 3. Photograph of the Instron dynamic cycle used for fatigue 18 testing. Note plastic bag around test beam to maintain moist condition.
Fig. 4. Modulus of rupture versus percent air. 22
Fig. 5. Compressive strength versus percent air. 22
Fig. 6. Modulus of elasticity versus percent air. 24
Fig. 7. Unit weight versus percent air. 24
Fig. 8. High pressure air and linear traverse air vs. plastic 30 state air content.
Fig. 9. High pressure air versus linear traverse air. 32
Fig. 10. Scanning electron micrographs of concrete specimens 34 taken from end sections of tested beams at about 100 magnification.
Fig. 11. Scanning electron micrographs of concrete specimens 35 taken from end sections of tested beams at about 300 magnification.
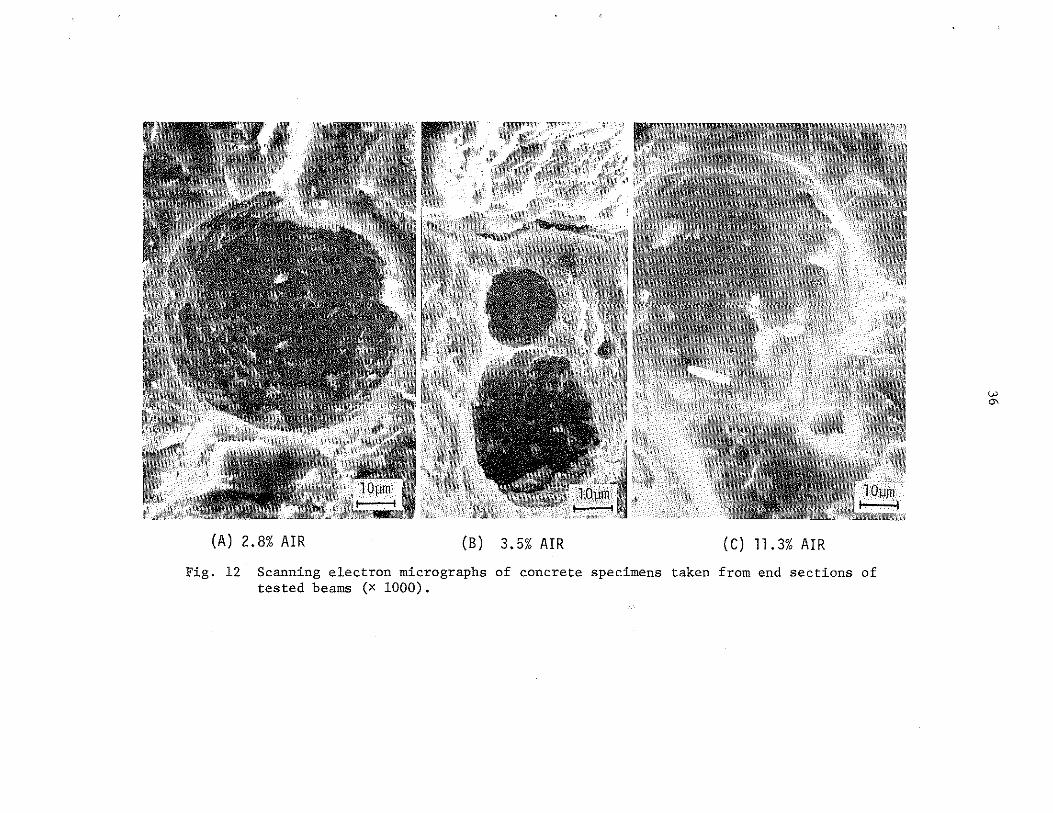
Fig. 12. Scanning electron micrographs of concrete specimens 36 taken from end sections of tested beams at about 1000 magnification.
Fig. 13. Cumulative pore volume as percent of bulk volume 41 of concrete versus pore diameter - (non-air-entrained concrete).
Fig. 14. Cumulative pore volume as percent of bulk volume of 41 concrete versus pore diameter -' 11. 3% air.
Fig, 15. Cumulative pore volume as percent of bulk volume of 42 concrete versus pore diameter of five concretes studied.
iv
Fig. 16. Cumulative pore volume as percent of total pore volume versus pore diameter - non-air-entrained concrete.
43
Fig. 17. Cumula.tive pore volume as percent of total pore 43 volume versus pore diameter - 11.3% air.
Fig. 18. Cumulative pore volume as percent of total pore 44 volume versus pore diameter of five concretes studied.
Fig. 19. Relationship between volume of large mode pores and 46 tot.al air content/porosity.
Fig. 20. Relationship between air content/porosity and 47a median pore diameter.
Fig. 21. Relationship between volume of mercury retained 47a and total air content/porosity.
Fig. 22. Relationship between uniformity coefficient and 47b air content/porosity.
Fig. 23. Photographs of tested beams showing fractured faces.
Fig. 24. S-N curve for 2.8% air concrete.
Fig. 25. S-N curve for 3.5% air concrete.
Fig. 26. S-N curve for 6.4% air concrete.
Fig. 27. S-N curve for 10.2% air concrete.
Fig. 28. S-N curve for 11.3% air concrete.
Fig. 29. Composite S-N curves for five concretes studied.
Fig. 30. Confidence limits for plain concrete with 2.8% and 11.3% air.
Fig. 31. Modified Goodman diagram for plain concrete with 2.8, 6.4, and 11,3% air.
Fig. 32. Pavement fatigue (S-N) design curves.
49
51
51
52
52
53
54
55
57
61

1. INTRODUCTION
1.1. Fatigue of Concrete in Pavement
When a material fails under a number of repeated loads, each
smaller than the ultimate static strength, a fatigue failure is said
to have taken place. Many studies have been made to characterize
the fatigue behavior of various engineering materials. The results
of some of these studies have proved invaluable in the evaluation and
prediction of the fatigue strength of structural materials. Consider
able time and effort has gone into the evaluation of the fatigue behavior
of metals. These early studies were motivated by practical considera
tions: The first fatigue tests were performed on materials that had
been observed to fail after repeated loading of a magnitude less than
that required for failure under the application of a single load.
Mine-hoist chains, railway axles, and steam engine parts were among
the first structural components to be recognized as exhibiting fatigue
behavior.
Since concrete is usually subjected to static loading rather than
cyclic loading, need for knowledge of the fatigue behavior of concrete
has lagged behind that of metals. One notable exception to this,
however, is in the area of highway and airfield pavement design.
Due to the fact that the fatigue behavior of concrete must be understood
in the design of pavements and reinforced concrete bridges, highway
engineers have provided the motivation for concrete fatigue studies
since the 1920's.

2
Results from fatigue studies are usually presented in the fonn
of an S-N curve (stress versus log of the number of cycles to failure).
If there is a break in the curve and the curve becomes asymptotic to
a line parallel to the horizontal axis, the stress at which this occurs
is called the endurance or fatigue limit. Most metals have an endurance
limit; however, tests on concrete up to 10 million cycles of load
application have failed t 0 establish an endurance limit. 6 It is
therefore important to quote fatigue strength for a specified number
of cycles when discussing the fatigue properties of concrete. Fatigue
strength is defined as the stress causing failure after a stated number
of cycles of loading. Fatigue life is the number of cycles of stress
that a specimen can withstand without failure.
The fatigue of concrete is associated with the fonnation and
propagation of microcracks at the aggregate-cement matrix interface
. . 6 10 17 43 53 and in the cement matrix itself •. ' ' ' ' The mechanism of fatigue
fracture of concrete is essentially identical to the mechanism of fracture
under static and sustained loading. lO Fatigue fracture involves
microcracking similar to, but more extensive than, the microcracking
that accompanies static failure. 6 For instance, Bennett found that
the total length of surface cracks visible on a concrete specimen
subjected to 100,000 cycles of a stress equal to 75% of the static
strength was typically 35% greater than the length measured after a
single loading to 95% of the static strength.
Most research into the fatigue strength of concrete involves the
repeated application of a constant stress until failure (constant
stress fatigue). If rest periods are allowed during the test, the

3
fatigue strength increases. Hilsdorf and Kesler18 found that rest
periods of up to 5 min. after every 10 min. of testing increased the
fatigue life from 62 to 68%. One possible explanation of this is
24 concrete's inherent ability to heal cracks in the cement paste,
Fatigue life is a function of the range of stress to which the concrete
. 18 33 is sub3ected. ' If a test specimen is subjected to varying stress
levels, the fatigue life will also be altered. It is important to
understand the effect of varying stress levels because this condition
is more representative of the actual condition to which a structural
component will be subjected. The fatigue life of a specimen is larger
if cyclic loading at a high stress level is followed by cyclic loading
at low stress level. If the lower stress level is applied first, a
decrease in fatigue life is observed. A relatively low number of cycles
of high loads can increase the fatigue life of concrete under a lower
load beyond the life cf a specimen which has not been previously 18
loaded.
This increase in fatigue life can be attributed to the fact that concrete
exhibits two opposing effects when loaded: consolidation and consequent
strengthening and microcracking and consequent weakening. The controlling
effect will depend on the relative magnitude and method of application
of the loads. Many other factors affect the fatigue strength of concrete;
among these are aggregate type and quality, moisture condition,- rate
of loading, age of concrete at testing, type of loading, concrete
. 22 36 38 strength, curing conditions, specimen size, and air entrainment. ' '
Highway concrete slabs are subjected to many repetitions of traffic
loads during their service lives; thus, the importance of fatigue in
concrete pavement is self-evident. Since the flexural stresses in

4
concrete pavement slabs are critical, fatigue due to flexural stress
is used for concrete pavement design. Fatigue tests in compression,
although useful for many design applications, do not provide information
useful to the designer of pavements. Loading schemes which subject
concrete specimens to flexural loading more realistically duplicate
conditions encountered i~ the field.
The first fatigue tests using flexure specimens were carried
out by Fe'ret in 1906. 36 Thes~ tests, although similar to later inves-
tigations, are only of historical vahie due to more recent and complete
research. Two extensive investigations on flexural fatigue of concrete
were carried out by Purdue. University (1922-24) and the Illinois
Department of Highways (1921-23). The Illinois tests reported by
11 37 Clemmer ' and the Purdue tests served as a basis for the deyelopment
of the Portland Cement Association (PCA) design curve for fatigue
strength of concrete pavement in 1933.45
Clemmer devised a unique testing machine in which 6 in. x 6 in. x
36 in. concrete beams were cantilevered out from a central hub. Load
was applied by rotating a pair of rubber-tired wheels about the central
hub. Blocks were placed between the cantilevered beams to form a
smooth circular track. Load applied by the wheels could be varied by
placing dead weight in two weight boxes located on the axle between the
two wheels. Test beams were subjected to 40 load applicati~ns per
minute. Clemmer found that the endurance limit for concrete was between
51 and 54% of the modu1us of rupture, as determined from a static test,
for up to 2 million cycles of load application. As was previously

5
stated, more recent investigations have not shown the existence of a
fatigue limit in concrete, at least up to 10 million cycles of load
application.
16 Hatt at Purdue University carried out flexural tests significantly
different from Clennner's but came to similar conclusions. Specimens,
4 in. x 4 in. x 30 in., were tested as cantilever beams. Each specimen
was subjected to stress reversal at a rate of 10 cycles/min. by a test
machine which applied load by weights alternately lowered on the opposite
ends of a cross member fastened to the end of the beam. Hatt felt
that 40 applications of load per minute used by Clemmer was too fast
to compare with actual road conditions. Testing was also shut down
overnight to allow for rest periods to better duplicate field conditions.
Of special significance is the fact that the fatigue response of
concrete in the laboratory was also reflected in actual pavement per-
formance and in results of field road tests in terms of decrease of
serviceability index and development of cracks with increasing number
Of load 1 . t' 9,20,39,40,48,52 app ica ions.
The most widely used fatigue curves for plain concrete pavement
design are those of the Portland Cement Association. 13 •45 The derivation
and history of these curves will be elaborated later in the text. The
current PCA curve, adopted in 1966, can be expressed as follows:
SR= 0.972 - 0.0828 log N
where
SR = stress ratio
ratio of flexural stress to modulus of rupture
and

6
N = number of allowable load repetitions.
Virtually all modern rigid pavement design methods recognize
the importance of the fatigue life of concrete and, in design, consider
not only the anticipated weights but also the number of heavy axle
loads which will be applied during the pavement design life. These
methods, for example, the AASHTO Interim Design 1 .
Procedure used by
most highway departments in this country, and the Road Note 29 design
2 procedure used in the United Kingdom are also based on road test data.
The major input of both methods is the total number of equivalent
18-kip single axle loads applied during the design life. The PCA
design proc.edure evaluates the accumulated fatigue effects of all
heavy axle load applications during the pavement life to prevent slab
cracking.
In sunnnarizing the preceding discussions on concrete fatigue and
rigid pavement design, the following can be concluded:
• Concrete, used in pavement slabs, is subjected to fatigue failure.
• Concrete pavement performance and distress is a function of load repetitions; therefore, load repetitions have a direct influence on the thickness requirements of a concrete pavement.
•Virtually all modern rigid pavement design methods take into consideration the fatigue strength (fatigue life and load repetitions) of concrete.
1.2. Air-entrained Concrete in Pavement
The use of admixtures which cause the entraimnent of air in
concrete is considered by many to be one of the most important developments

7
in concrete technology in the last few decades. The principal application
has been to pavement concrete. Entrained air benefits concrete mainly
in two ways: (1) improved resistance of the concrete to freezing and
thawing and (2) improvement of the workability and decrease in segrega-
tion of freshly mixed concrete. Air bubbles present in the cement paste
28 of unhardened concrete can come from several sources ( 1) air
originally present in intergranular spaces in the cement and aggregate,
(2) air originally present within the particles of cement and aggregate
but expelled from the particles before hardening of the concrete by
inward movement of water under hydraulic and capillary potential,
(3) air originally dissolved in the mixing water, and (4) air which
is in-folded and mechanically enveloped within the concrete during
mixing and placing. These are the only sources of air bubbles in
concrete, whethe.r or not an air-entraining agent is used. 28
An air-
entraining agent makes use of the fourth method of supplying air
bubbles to a plastic concrete mix. Air-entraining agents reduce the
surf ace tension at air-water interfaces within the cement paste which
reduces the rate of dissolution of air in the bubbles and the tendency
of bubbles to join together, forming larger bubbles. This produces a
uniform distribution of very small air bubbles within the cement paste
matrix. It is this distribution of bubbles that accounts for the
increased freeze-thaw durability as well as the decreased compressive
and tensile strengths of air-entrained concrete. These and other
effects of the air void system in concrete have been well docu-
t d 28,29,30,31 men e •
8
Today air-entrained concrete is reconunended for all structures
under conditions of severe exposure and for all pavements regardless
19,25,45,51 . f of climatic conditions. Depending on the maximum size o
aggregate, the usual reconunended entrained air content varies from
5% for a 2-in. aggregate to 8% for a 1/2-in. aggregate.46
For pavement
concrete the specified air content in Iowa is 6 ± 1~%. 44
In recent years, because of the greatly increased use of de-icing
chemicals, it has been found necesary to incorporate higher levels of
air in concrete to assure freedom from deterioration due to frost action
(in certain instances, air content of 8 or 9% has been reconunended for
use in structures such as highway bridge decks), Furthermore, there
is reason to suspect that, because of the concern on the part of the
contractor that he achieve the desired workability and meet minimum
air content requirements, the actual air content in field placed concrete
couldj in some casesj be higher than recommended~
1.3. Fatigue Behavior of Air-entrained Concrete
The effects of air content on most concrete properties such as
compressive strength, workability, durability, and creep are quite well
understood. For example, it is known that, for normal levels of air
content, if there is no change in water-cement ratio the strength will
be reduced by 3 to 5% for each percent air added. However, knowledge
of the effect of air content on the flexural fatigue strength of plain
concrete is nearly nonexistent. In view of recent nationwide interest in
economical pavement design, data must be collected on the effects of all
9
additives and variables on the fatigue strength of concrete.
A literature search of the past 70 years produced only two reported
studies on the fatigue strength of air-entrained concrete. One of the
studies was carried out in 1943 by Purdue University for the Kentucky
Department of Highways. 14 It involved flexural fatigue testing of
beam specimens in which one of the variables was air entrairnnent. The
fatigue life of the air-entrained concrete was slightly greater than
non-air-entrained groups. This finding is only of limited interest,
however, since the different groups that were compared contained
different cements, and the variable of air content was not singled out
for comparison. Also, the load histories of the test beams varied,
making a comparison of fatigue lives difficult. In the second study,
Antrim and McLaughlin4 performed axial compression fatigue tests on
two types of concrete, one air-entrained and the other containing only
natural air. This study resulted in two major conclusions:
1. The fatigue behavior of non-air-entrained plain concrete and air-entrained plain concrete in compression are not significantly different. However, there is an indication that airentrained concrete exhibits longer fatigue life at low stress ratios (less than about 77% of static compressive strength) and shorter fatigue life at higher stress levels.
2. There is considerably less variation present among fatigue test data for air-entrained plain concrete than there is for non-air-entrained concrete.
This study is of interest since an air-entrained concrete was
included, although at only one air-content level. However, the failure
of highway pavements is essentially a tensile failure, and this study
involved loading of specimens in compression; thus, an assumption of
the behavior of concrete pavement based on the results of this study
would be a dangerous extrapolation of the findings.

10
2. PURPOSE AND SCOPE
While all of the modern pavement design procedures recognize
the importance of fatigue life of concrete and air entrainment is
being used for all concrete pavements, design curves currently being
used in the design of portland cement concrete pavements do not reflect
the effect of air entrainment. The basic fatigue data, on which concrete
pavement designs have been based for the past 40 to 50 years, were
derived in early 1920's, 20 years before the introduction and 40 years
before the widespread use of air-entrained concrete. No data are available
on the fatigue behavior of air-entrained concrete in flexure.
In light of the extensive use of air entrainment and the growing
interest in economy and efficiency of design, it becomes self-evident
that, in order to properly design concrete pavements, a study of the
effects of air entrainment on the fatigue behavior of concrete in flexure
is urgently needed. The purpose of this study is to evaluate the effects
of air entrainment on the fatigue strength of plain concrete and establish
preliminary fatigue curves for air-entrained concrete to be used in
concrete pavement design.
The scope of this work includes flexural fatigue testings of
concretes at various levels of air entrainment, prepared with one
aggregate and grading, one cement type, and at one water~cement ratio.

11
3. MATERIALS AND PROCEDURES
3.1. Test Program
The objective of this investigation was to determine the effect
of varied air content on the flexural fatigue strength of plain concrete.
To optimize the research effort, the test program was designed with
air content as the only independent variable. All other variables such
as age of concrete when tested, water-cement ratio, aggregate type,
curing conditions, temperature, and cement type were held constant.
A total of five laboratory mixes with air content as the only variable
were studied.
The age variable was eliminated by testing all batches at an age
of 28 to 56 days. This meant that a concrete batch was mixed and
poured approximately once each month. After the initial 28-day period
when the first batch was curing., fatigue testing proceeded at a contin
uous rate. The first batch was tested at the same time the second batch
was curing. At the end of the 28-day period, testing of the first batch
was completed, the third batch was poured, and testing of the second
batch began. This cycle was continued until testing of all five batches
was complete.
The original test program failed to allow for machine down time,
in that problems with the fatigue machine were encountered during testing
of the first batch. Because of this, Batch A was actually tested at
an age of 48 to 97 days. Batches B through E were tested according to
the schedule outlined above. As will be demonstrated later, the age
variable (in Batch A) had no effect on the fatigue behavior up to 97 days.

12
Beams for fatigue testing we;re 6 in. x 6 in. x 36 in. A modulus
of rupture test was performed on the first 18 in. of the beam (Fig. la)
and a fatigue test on the remaining unstressed portion (Fig. lb). This
procedure provided a companion modulus of rupture test for each individ-
ual fatigue test. After the modulus of rupture test and prior to the
fatigue testing each beam was sealed in a plastic bag to maintain a
saturated moist condition. Previous studies38 have found that if the
beams are allowed to air dry during fatigue testing the scatter of the
data will increase. This is believed to be due to differential strains
generated by moisture gr~dients within the beam.
The stress level for fatigue testing of each specimen was arrived
at by taking a percentage of the modulus of rupture. This stress
level was then converted to an equivalent load to be applied to the
beam. Fatigue testing consisted of repeated applications of this
constant equivalent load until failure occurred. Fatigue tests were
made at four stress levels corresponding to 90, 80, 70, and 60% of
the modulus of rupture. Si.x specimens were tested at each stress level,
corresponding to an anticipated 95% confidence limit. 23 •27
The main fatigue test program was supplemented by five additional
investigations; these investigations were centered around the following
subjects:
1. Modulus of rupture tests,
2. Compressive strength tests,
3. Modulus of elasticity determination,
13
p
I I
ROLLER+lI lt+BALL -
,
li+BALL ROLLER+lt ~ 17,7, "
r, '7
"" ' . , . , . , . , . " . , . , . " .
6" 6" 6"
18"
36"
A. fl«)DlJUJS OF RUPTURE TEST
p
MODULUS OF RUPTURE BREAK
ROLLER+ ~
ROLLER+
I-.---6"'---.i...--- 6"'·---..+---6"---..l
1-.----------18"-----------<...i B. FATIGUE TEST
Fig. 1 Schematic diagram of loading arrangements.
....__ . ,
,
.__
14
4. Comparison of air determination methods, and
5. Concrete microstructure by scanning electron microscopy and
mercury penetration porosimry.
3.2. Materials
Concrete used for laboratory test specimens consisted of an Iowa
Department of Transportation c-3 mix with Class V aggregate~4 The
water-cement ratio used was .41 for all batches, slightly less than
0.43 called for in Iowa specifications. Coarse aggregate consisted
of crushed limestone from the Alden quarry near Alden, Iowa. Fine
aggregate (concrete sand) was obtained from Hallett Construction
Company in Ames, Iowa. Both coarse and fine aggregates came from Iowa
D.O.T. approved stockpiles. The coarse aggregate had a saturated-surface-
dry specific gravity of 2.55 and absorption of 2.46%. The fine aggregate
had a saturated-surface-dry specific gravity of 2.59 and water absorption
of 1.33%. Further information regarding aggregate gradation and specifi
cations can be found in Tables A-1 and A-2 of Appendix A and reference 44.
As may be observed in the tables, the coarse and fine aggregates utilized
meet the Iowa D.O.T. specifications. Type 1 Portland cement used in
the concrete batches was obtained from Marquette Cement Corporation in
Des Moines, Iowa. In order to guarantee uniformity, care was taken to
assure that all the cement was taken from one batch at the cement plant.
Chemical and physical properties of the cement are given in Table A-3
of Appendix A.
Ad-Aire, a vinsol resin produced by the Carter Waters Company of
Kansas City, Missouri (recommended by the engineers of the Iowa D.O.T.),

15
was used as the air-entraining agent for all laboratory mixes. Trial
batches were run to determine the amount of air-entraining agent to
use for a specified air content. It was found that this amount varied
with respect to age, Due to this variation it was necessary to run
trial batches prior to each concrete pour to determine the amount of
air-entraining agent and other batch quantities necessary for the
desired air content.
3.3. Mixing Procedures and quality Control
The laboratory portion of the investigation consisted of five
different series of test specimens in which the only variable was
the amount of air. In one batch of concrete no air-entraining agent
was added, so that the only air would be the natural air, which is a
function of mixer type, amount of concrete mixed compared to mixer
capacity, etc. This non-air-entrained batch was used as the control
for comparison purposes. Each batch (A - E) consisted of approximately
30 fatigue beams 6 in. x 6 in. x 36 in., approximately six modulus of
rupture beams 6 in, x 6 in. x 30 in., and fifteen 6-in. diameter x
12 in. cylinders. Approximately 1 1/2 cubic yards of concrete were
required in each batch for preparation of the required test and control
specimens.
Because uniformity of mix was of the utmost importance, all mixing
was carried out in the laboratory. Since no mixer of this capacity was
available, a ready-mix transit mixer was rented and brought into .the
laboratory. Before the batch quantities were charged into the mixer,
the mixing drum was carefully inspected to determine if there was any

16
left-over concrete or mixing water left in the drum which would alter
the desired mix. This procedure allowed strict control of the concrete
batch quantities throughout the mixing procedure. Batch quantities
(see Table A-4 of Appendix A) were weighed, corrected for moisture content,
and charged into the empty mixing drum. After completion of a predeter-
mined mixing time, the slump and plastic air content of each batch was
measured and recorded. The fresh concrete was then transferred to
the beam molds by wheelbarrow. All mixing procedures utilized were
in accordance with ASTM C 192. Flexural specimens were vibrated according
to ASTM C 192 using a small laboratory type pencil vibrator with a 1-in.
head which operated at 10,500 vibrations per minute. As the concrete
was being placed in the forms control cylinders were cast in 6 in. by
12 in. waxed cardboard cylinder molds that were filled with concrete
representative of that in the beams.
Immediately after initial set the beams and cylinders were covered
with wet burlap and heavy polyethylene sheet to assure proper and
uniform curing conditions.
After an initial curing period of 24 to 48 hours, the forms were
stripped and the beams removed, They were then transferred to large
metal tanks where they were stored submerged in water until testing.
Air content determination tests were performed on the fresh concrete
using standard air meters of the pressure type throughout the investiga-
12 tion (ASTM 231). In addition to the Iowa State University air meters,
two air meters were borrowed from the Iowa Department of Transportation
for comparison. Both sets of meters were calibrated prior to, and used
only for, this investigation. Air meter readings from both sets of meters

17
were in close agreement throughout the test program. For consistency
all plastic air tests were performed by one operator throughout the
investigation. Fresh air contents were later compared with hardened
air contents obtained by high pressure26 and linear traverse methods. 7
3.4. Equipment
Modulus of elasticity and compression tests were performed on
k u a 400 universal testing machine. ASTM standards C 39 and C 469
were adhered to during all tests. A concrete cylinder compressometer
was used for determination of the modulus of elasticity. The 400k
test machine in conjunction with a one-third point load fixture (see
Fig. 2) was used for modulus of rupture tests. The overhanging portion
of the test specimen caused an insignificant amount of stress of opposite
sense at the critical test section and thus its effect is negligible.
After the modulus of rupture test, the longer portion of the test specimen,
which was approximately 24 in. long, was placed in an Instron Model 1211
dynamic cycler for fatigue testing. The portion of the beam used in
the fatigue test was the overhang portion of the beam and thus was
stress free in the modulus of rupture test. The Instron was modified
so that flexural one-third point loading was applied (Fig. 3). As may
be seen in Fig. lb, the loading on the test specimen is at the same
spacing as in the modulus of rupture tes~ (Fig. la). The dynamic
cycler has a± 20,000 lb force capability with the ability to test from
0 to 15,000 lb in tension. The frequency of load application can be
varied from 5 to 35 cycles/sec. All tests during this investigation

18
Fig. 2 Photograph of the modulus of rupture test set-up showing support conditions for the third-point flexural loading scheme.
Fig. 3 Photograph of the Instron dynamic cycle used for fatigue testing. Note plastic bag around test beam to maintain moist condition.
19
21 were run at 5 to 7.5 cycles/sec. Kesler has shown that speed of
testing between 70 and 440 cycles/min. has a negligible effect on the
fatigue strength of plain concrete. The bottom fibers of the specimens
were subjected to a nominal minimum load to tension load cycle for
fatigue testing with tension corresponding to the maximum flexural
load applied.
Air contents of hardened concrete by high pressure air meter and
by linear traverse methods were performed at Iowa D.O.T. laboratories
with Iowa D.O.T, equipment.
Microstructures of hardened concrete were studied using a JEOL
JSM-U3 scanning electron microscope and a Micromeritics Model 905-1
mercury porosimeter.

20
4. RESULTS AND DISCUSSION
4.1. Physical Properties
In the following sections the experimentally determined physical
characteristics for the five batches of concrete tested in this study
are presented. A summary of the concrete properties are presented in
Table 1. The 28-day compressive strength presented is the average
of three compression tests, modulus of elasticity value is the average
of two tests, and the modulus of rupture value is the average of all
beams tested in each batch. Note that the data presented in Table 1
is in order of increasing air contents. Batch designations represent
order of pour, i.e., A was first, B second, and so forth.
4.1.1, Modulus of Rupture
In addition to modulus of rupture Stresses obtained in the fatigue
beams, two modulus of rupture tests were performed per each additional
beam in order to establish the degree of variability within and between
the various beams of a given batch. It was found that occasionally a
significant difference would occur (up to 12%); however, the difference
between companion breaks was usually less than 3%. The method of supply
ing a companion static test for each fatigue test is felt to be the
most accurate when dealing with a nonhomogeneous material such as concrete.
The results of the modulus of rupture tests are plotted in Fig. 4.
The curve shown represents a log-log regression analysis with a correla
tion coefficient (r) of -0.99. The equation of the line is:

Table 1. Physical characteristics of concretes studied.
Modulus 28-day of
Slump, Unit Compressive Elasticity-Batch % Air in~ Weight, pcf Strength, psi psi x 10° Modulus of Rupture, psi
c 2.8 1.00 149. 9 5365 5.03 862.8 N ....
A 3.5 1.25 146. 7 5000 4.24 817. 9
E 6.4 4.50 140.1 3650 3.23 582.3
D 10.2 5.00 132.4 2608 2.66 482.3
B 11.3 3.75 133.1 2728 2.33 508.5

22
900 0
·~
~ 800 • w
0:: ::::> 700 t-0.. ::::> 0::
..... 0 600 Vl ::::> ...J :::> 0
500 ~
2 4 6 8 10 12 PERCENT AIR
Fig. 4 Modulus of rupture vs percent air.
6000
·~
~5000 • :c
t-<LI
E5 4000 0:: t-Vl
~ 3000 0 Vl 0 Vl
UJ 0::
!it: 2000 0 u
1000
2 4 6 8 10 12 PERCENT AIR
Fig. 5 Compressive strength vs percent air.

f = 1337.09 Pa - 0.42 r
23
where f iS the modulus of rupture and Pa is the percent air. (Hencer
forth, "percent of air" refers to plastic air content unless otherwise
stated.) Modulus of rupture values observed in the laboratory are
higher than can be expected in the field, due primarily to the superior
curing conditions available in a laboratory environment. The results
of these tests show that as the air content of concrete increases the
modulus of rupture decreases at a second-order rate. This finding
agrees with the general relationship between tensile strength of
concrete and the square root of the compressive strength.
4.1.2. Compressive Strength
Results of the 28-day compressive tests are shown in Fig. 5.
The line represents a linear regression analysis, the equation of which
is:
f' = 313.95 Pa+ 6000 c
where f' is the 28-day compressive strength, Pa is the percent air, c
and the correlation coefficient (r) is -0.98. From these .tests it
can be concluded that the compressive strength of concrete decreases
linearly as air content increases, about 30D_ psi or 6 to 12% decrease
in strength for each percent of air added.
4.1.3. Modulus of Elasticity
As the amount of entrained air in a concrete specimen goes up
the elastic behavior of the concrete is altered. Fig. 6 shows the
effect of air on the modulus of elasticity of plain concrete.

24
6
"" 0 5 ~
x
·~ Vl Q. 4 . >-r-..... u 3 ..... r-Vl c(
-' w u.. 2 0
Vl ::::> -' ::::> Cl
~
2 4 6 8 10 12 PERCENT AIR
Fig. 6 Modulus of elasticity vs percent air.
150 0
M ..... 145 .,_ ' ..0 ~ . r- 140 0 :c:
"' ..... w 3
r- 135 ..... z ::::>
130
2 4 6 8 10 12 PERCENT AIR
Fig. 7 Unit weight vs percent air.
The equation of this line is:
E = -0.28 Pa + 5.42 c
25
where Pa is the percent air in the concrete, the correlation coefficient
(r) is -0.96, and E is the modulus of elasticity in 106 psi. Modulus c
of elasticity tests were made using a standard concrete cylinder compresso-
meter with a dial gage attachment. The elastic modulus was determined
by taking the difference between strain readings at 354 and 1768 psi
stress. These values correspond to 10,000 and 50,000 lb loads,
respectively.
4.1.4. Unit Weight
The results of the unit weight determinations are shown in Fig. 7.
A loss in unit weight of approximately 2 lb/cu ft accompanied the addition
of 1% air.
4.2. Air Content
The benefits of ,air entrainment in concrete with respect to freeze-
thaw, salt-scaling resistance, and workability have been discussed earlier.
Depending on the maximum size of aggregate ~nd therefore on the amount
of air bubbles in mortar), the usually recommended total air content
ranges from about 5% for a 2-in. aggregate to about 8% for a 1/2-in.
aggregate.
Although total air content is specified and measured in current
practice, the more important air void property influencing concrete
durability is a parameter called the spacing factor, i.e., the average
distance from any point in the paste to the periphery of the nearest
26
air bubble, As the spacing factor decreases, the freeze-thaw durability
increases. It has been found that for proper durability a maxinrum
spacing factor of about 0.01 in. is required. 3 Warren has shown that
the void-spacing factor is decreased by about half when air content is
increased slightly above that obtained without using an air-entraining
agent. For air contents greater than about 3% the void-spacing factor
decreased only slightly with an increase in air content of from 3 to 8%.
This finding indicates that there is little advantage in increasing
air content beyond about 4%, especially in view of the reduction in
strength with increase in air content. On the other hand, it is
possible, although unlikely, to obtain the reconnnended total air content
but not the desired protection againstfreeze-thaw action if the bubbles
are too large and not well distributed throughout the mortar component
of the concrete.
From the above discussion the following can be concluded:
1. There exists an optimum range of air contents which gives the desirable qualities of durability and workability without undue loss of strength,
2. There is a need for a better or alternate method of specifying, measuring, and controlling air content in concrete other than total air content.
Air content of concrete in the plastic state can be measured
by the pressure method (ASTM C 231), the volumetric method (ASTM C 173),
or the gravimetric method (ASTM C 138). The air content of hardened
concrete can be measured. by the high pressure air method26 or various
microscopic methods; among these are the point count method, the areal
traverse method, and the linear traverse method. 31 •41

27
An Iowa Department of Transportation high pressure air meter was
used for determining the air content of 4-in. diameter hardened concrete
cores drilled from end sections of tested fatigue beams. Cores were
first oven dried for 72 hrs at 300°F, and then cooled for a period of
3 hrs. After weighing, the cores were soaked in water for 48 hrs. The
cores were then weighed in water, removed and patted dry with a cloth,
and weighed again in air to determine the water absorption. With
specimen preparation complete, the cores were placed in the high
pressure air meter. Pressure of approximately 5000 psi was then applied
to the specimen chamber by means of a cylinder piston. A dial reading
was recorded from which the air content of the core could be computed,
Detailed information concerning the high pressure air tests can be
obtained by consulting Test Method No. Iowa 407-A, April 1971, Iowa
Department of Transportation, Materials Department.
Linear traverse air content determinations were performed according
to ASTM C 457, with a few modifications as noted below. Specimens were
also cut from the end section of tested fatigue beams using a diamond
saw. The same beams were used to obtain linear traverse specimens
and high pressure air specimens. Each linear traverse sample was
polished with wet silicon carbide paper of grades 120, 240, 320, 400,
and 600. Polishing time was approximately 15 min. for each grade
except the 120 grade which was applied for 30 min. A total traverse
of 100 in. was obtained from a minimum area of 24 sq. in. Minimum
distance between traverses was taken as 0.2 in. All measurements
were made at a magnification of 50 times. Both total and less than
1 mm diameter air contents were determined, the latter being considered

28
by many as the upper limit of "entrained air." To determine voids
less than l mm in diameter, the counter reading corresponding to
1 mm was determined. A traverse was first completed for total air,
and then all voids larger than 1 nun or parts thereof were counted along
the same traverse. The amount of less than 1 nun air was then deter
mined by taking the difference between these two readings. Spacing
factors were also calculated based on equations given in ASTM C 457.
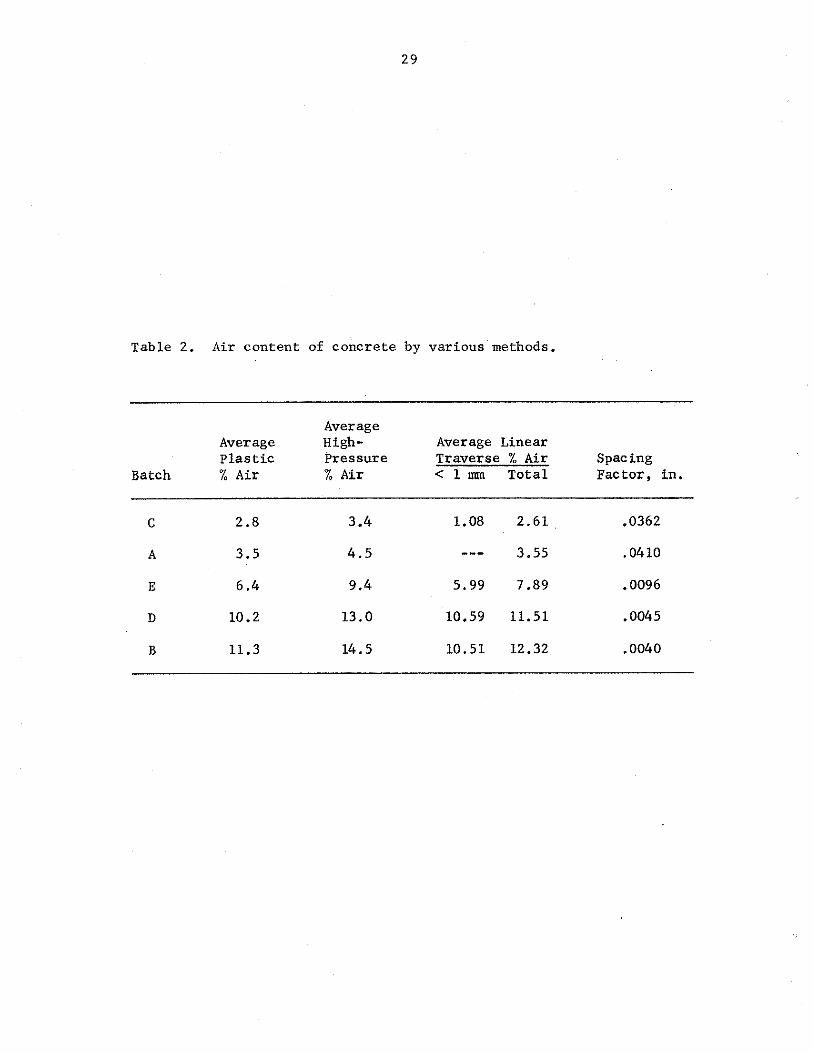
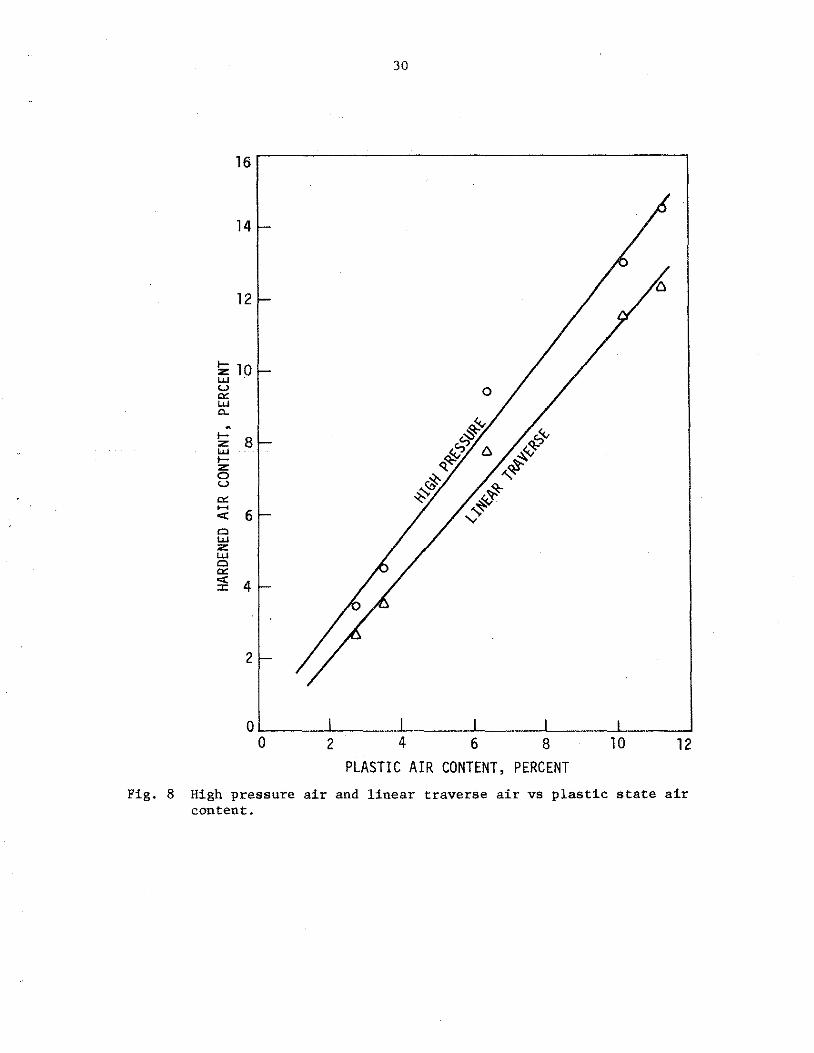
The results of air content determinations are given in Table 2,
High pressure air meter results are compared with plastic air
contents in Fig. 8. The line shown represents a linear regression
analysis of the data with a correlation coefficient of 0.99. The
equation of the line is
HA = 1.28 Pa + 0.25
where HA is high pressure air content and Pa is plastic air content.
Linear traverse results are also compared with plastic air
contents in Fig. 8. The .linear traverse curve represents a linear
regression with a correlation coefficient of 0.99. The equation of
the line is
LT = 1.15 Pa - 0.28
where LT is linear traverse percent air and Pa is the plastic air
content. Although there is no agreement on the differences between
entrapped and entrained air,. if for discussion purpose air voids larger·
than 1 nun are called "entrapped air" and air voids less than 1 mm
are referred to as "entrained air," the following statements can be
made.
29
Table 2. Air content of concrete by various methods.
Average Average High- Average Linear Plastic Pressure Traverse % Air Spacing
Batch % Air % Air < 1 mm Total Factor, in.
c 2.8 3.4 1.08 2.61 .0362
A 3.5 4.5 3.55 .0410
E 6.4 9.4 5.99 7.89 .0096
D 10.2 13.0 10.59 11.51 .0045
B 11.3 14.5 10.51 12.32 .0040
30
16
14
12
!z 10 UJ u 0 ex: UJ 0.. . ~ ~ ....
8 .;s
z 91:::, ~ ...... .... ~ <# z ~ 0 <$- "' u ~ ex: ~ #' ..... < 6 ~ c ...... z UJ c ex: < 4 ::r
2
PLASTIC AIR CONTENT, PERCENT Fig. 8 High pressure air and linear traverse air vs plastic state air
content.

31
The percent "entrapped air" (larger than 1 nun) ranged from O. 9
to 1. 9 with an average of 1.5 and was independent of total "entrained
air" (less than 1 nnn) content. Spacing factor ranged from 0,0362 in.
for 2.8% air (non-air-entrained) concrete to 0.0040 in. for 11.3% air
concrete. Except for one case, both high pressure air and linear
traverse methods yielded results higher than the original plastic
air content, especially at higher air content levels. This is in
general agreement with findings of other investigators.
Results of the high pressure air tests are compared with linear
traverse results in Fig. 9. Again the curve represents a linear
regression analysis with a correlation coefficient of O. 998. The equation
of the curve is
where HP is high pressure percent air and LT is linear traverse percent
air. Air content values determined by the high pressure method were
consistently higher.
2 The coefficient of determination, r , for all three curves is
very close to 1.00, indicating a good linear data fit.
Since pavement specifications are written on the basis of plastic
air content, curves of this type are useful in establishing the
original plastic air content any time after placement of a concrete
pavement.

32
0
14
0
12 c:: LU I-LU .x c:: 10 ~
c(
LU c:: . ::> V'l V'l
8 LU c:: 0..
:r: <!) ~
:r: >- 6 co c:: ~
c(
I-z 4 LU
w c:: LU 0..
2
0~~~~~~~~~~~~~~~~~~~~~~~~~~~~~ 0 2 4 6 8 10 12 14
PERCENT AIR BY LINEAR TRAVERSE Fig. 9 High pressure air vs linear traverse air.
33
4.3. Microstructure
4.3.1. Scanning Electron Microscopy
A JEOL/JSM-U3 scanning electron microscope was used to visually
examine the microstructure of hardened concrete specimens from all
batches. The purposes were: (1) to establish the differences, if
any, between entrapped and entrained air, (2) to determine the effect
of air entrainment on the pore structure and pore size distribution,
and (3) to examine the microcracks in the cement paste matrix caused
by stress.
The relative size of entrained versus entrapped air is a subject
that few authorities agree on. Neville35
indicates that entrained
air is of the magnitude of 0,5 mm (0,02 in.), with a range between
0,5 and 1.30 mm (0.002 and 0,05 in.), while entrapped air forms much
larger bubbles. Other tttJthorities give varying parameters for the
differentiation between entrained and entrapped air. Among those
who believe there is a size difference between entrapped and entrained
air, the dividing size seems to be 1.00 mm.
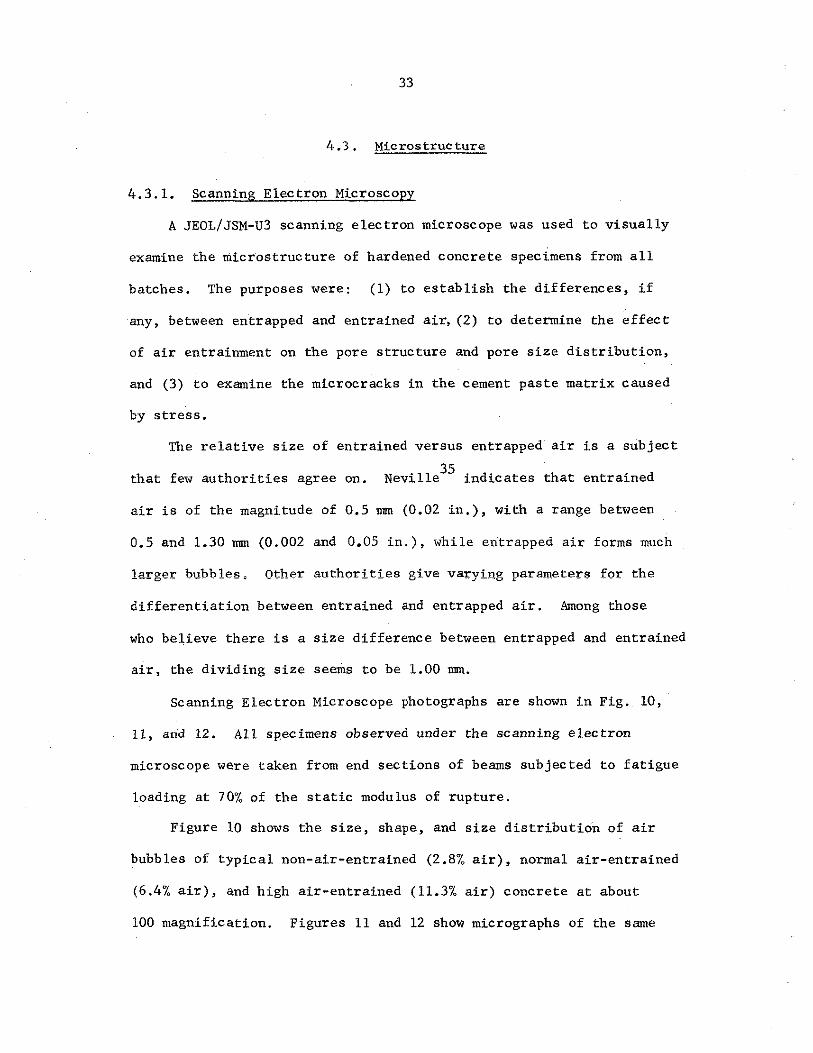
Scanning Electron Microscope photographs are shown in Fig. 10,
11, and 12. All specimens observed under the scanning electron
microscope were taken from end sections of beams subjected to fatigue
loading at 70% of the static modulus of rupture.
Figure 10 shows the size, shape, and size distribution of air
bubbles of typical non-air-entrained (2.8% air), normal air-entrained
(6.4% air), and high air-entrained (11.3% air) concrete at about
100 magnification. Figures 11 and 12 show micrographs of the same

(A) 2.8% AIR (NON-AIR-ENTRAINED) (B) 6.4 AIR
SPACING FACTOR = 0.0362 IN. SPACING FACTOR = 0.0096 IN.
(0.92 mm) (0.24 mm)
(C) 11.3% AIR
SPACING FACTOR = 0.0040 IN.
(0. 10 mm)
Fig. 10.. Scanning electron micrographs of concrete speciments ta~en from end section of teste.d beams (X 100).
"" -1'-

(A) 2.8% (NON-AIR-ENTRAINED) (B) 6.4% AIR (C) 11.3% AIR
Fig. 11. Scanning electron micrographs of concrete specimens taken from end section of tested beams (x 30(}).
w ln
(A) 2.8% AIR (B) 3.5% AIR (C) 11.3% AIR
Fig. 12 Scanning electron micrographs of concrete specimens taken from end sections of tested beams (x 1000).
co "'

37
three concretes at about 300 and 1000 magnifications. Details of
Fig. lOa is shown in Fig. 12a and those of Fig. lOb and c are shown
in Figs. llb and c.
The introduction of air-entraining agent increased the number of
bubbles, the bubble density, and the uniformity of air bubbles; this
is most evident from Fig. 10. The spacing factors are indicated for
visual comparison. Air bubbles in air-entrained concrete consist of
a uniform distribution of very small air voids, mostly between 0.02
and 0.10 nn:n (20 and 100 µm); few are as large as 0.2 nn:n and some are
as small as 0.005 nn:n (5 µm), and are usually spherical in shape.
However, air bubbles as large as 1.5 nn:n, although not shown in the
micrographs presented, have been observed. The interior of most air
bubbles is usually smooth in appearance. The air bubbles of the
non-air-entrained concrete can usually be characterized by a lack
of intermediate size bubbles, presence of large bubbles (as large as
2 mm), and by bubbles of more irregular shapes and rough interior
texture (Fig. 12a). However, smooth, spherical air bubbles of sizes
in the range found in air-entrained concrete can also be found.(Fig.
lla). From these micrographs it is difficult to conclude that there
is a dividing line between entrained and entrapped air based on size
and shape. The differentiation between entrained and entrapped air
should, therefore, be based on intent and effect rather than.a strict
size determination. Entrained air is a uniform network of small air
voids intentionally placed in a concrete mix. Entrapped air can be
any size air void naturally present in the material and/or caused
by mixing action or improper compaction. Entrapped air, due to its

38
uneven distribution,and its often large size and spacing factor, does
not have a beneficial effect on freeze-thaw durability.
As shown in Figs. lOa, lla, llc, and 12, microcracks can be observed
in specimens subjected to stress. Fatigue behavior of metals is based
on crack propagation and growth on a microscopic scale. Microcracks
in concrete have been observed under dynamic as well as static loads. 10
It would seem that some parallel could be drawn between the fatigue
behavior of metals and concrete. In order for this to be done the
initiation and propagation of microcracks in concrete must be well
documented and understood. This subject should be pursued in future
studies to better understand the fatigue behavior of concrete.
4.3.2. Pore Size Analysis by Mercury Porosimetry
Most of the important properties of hardened concrete, especially
strength and durability, are influenced by the quantity, size, and
size distribution of various types of pores in the concrete. In an
attempt to characterize and quantify the pores of concrete specimens
with various air content, mercury porosimetry was used.
The principle of the mercury penetration technique is quite simple.
The size and quantity of pores in solid materials are measured by
determining the quantities of a nonwetting liquid - mercury - that is
forced into the pores under investigation at various pressures. The
equation describing the penetration of mercury into pores under
49 pressure is given by Washburn
pr = -2CJ cos e
where p is the pressure applied, r the pore radius, CJ the surface

39
tension of mercury, and 8 the contact angle of the mercury with respect
to the solids. Specimens used in this study were concrete cores, 1 in.
long by 1 in. diameter, drilled from slices cut from the end section
of test beams. Prior to placing the specimen in the sample cell of
the porosimeter, the concrete core is soaked in acetone for several
hours to remove lubricant used in drilling and then oven-dried. The
sample cell, containing the specimen, is then placed in the pressure
chamber of the mercury porosimeter. A vacuum is used to evacuate the
chamber so that the pressure gages will indicate the net pressure, p,
used in the Washburn equation. Once the pressure chamber is evacuated,
mercury is let into the chamber, filling the sample cell and immersing
the specimen. Knowing the volume of the mercury which flows into
the sample cell and the volume of the sample cell, it is possible to
calculate the bulk volume of the sample. As pressure is applied,
mercury intrudes the specimen. Both the volume of mercury which
intrudes the specimen and the corresponding pressure are measured.
Using these data in the Washburn equation, it is possible to compute
.the radius of pore which is being intruded at a given pressure.
After completion of the pressurization/mercury penetration measure
ments, a de-pressurization/mercury retention can be run. Mercury
expelled from pores as a function of decreasing pressure can be measured.
This gives information about the shape and structure of the pores.
The porosimeter used in this study was a Micromeritics Model 905-1
Mercury Penetration Porosimeter. It has a pressure range from about
2.7 to 50,000 psi for large sample cell. Using a mercury surface tension
of 474 dyn/cm at 25°c and a contact angle with concrete of 130°, it is

40
possible to measure pore diameters between 32.7 and 0.00354 µm.
At least three cores were tested from each batch, The results are
presented in two ways: (a) cumulative pore volume distribution curves
(Figs. 13, 14, and 15) and (b) cumulative pore volume as percent of
total pore volume versus pore diameter curves (Figs. 16, 17, and 18).
In discussing mercury penetration results and comparing them
with air content results of hardened concrete measured by conventional
methods, the following should be noted:
• As indicated in pore size distribution curves the maximum pore size detected by mercury penetration technique is about 10 µm, which is the lower limit of air bubbles which can be measured by conventional air content determinations.
• The calculated pore diameter is the equivalent diameter of the pore entrance ("pore entry diameter") of interconnected or open pores; the total volume of pore may not include all isolated discrete air bubbles.
• The pore volume of the concrete specimens included pores in the paste (capillary and gel pores), pores in the aggregate, "under-aggregate" fissures, 47 and, in some cases, stress-induced microcracks.
Recognizing the above characteristics of mercury penetration data,
the following can be observed:
1. In spite of the heterogeneous nature of the concrete material dealt with and the limitations of the small sample sizes, the results, as seen in Figs. 13 and 14,are surprisingly reproducible.
2. At low air entrainment (2.8 and 3.5% air), the added air had essentially no effect on the pore structure of cement paste, The total porosity of the concrete can be attributed to the porosity of the aggregate and capillary/gel pores (see Fig. 15).
3. At a total air content larger than 3.5%, as the air content increases, there is an increase in total porosity and pore volume (Figs. 15 and 18). This increase was mainly reflected in the volume of "large" (1 to 10 µm) pores with little effect on smaller pores (between 1 and 0.008 µm), corresponding
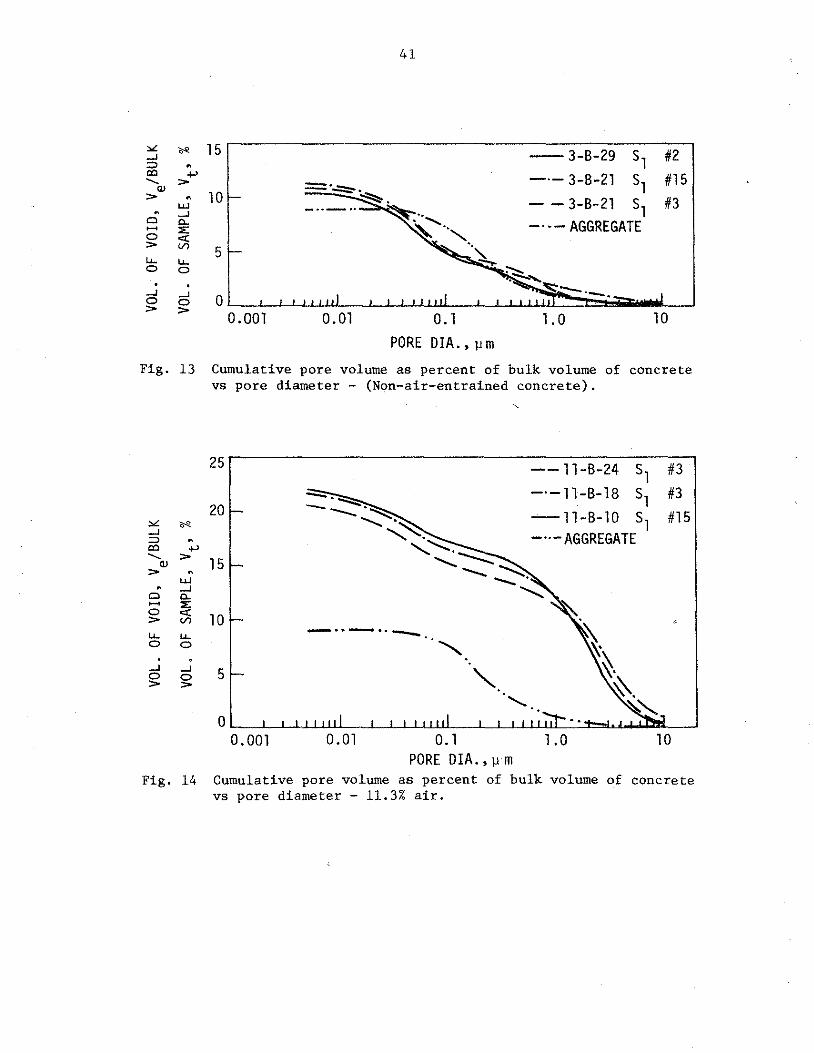
41
"" .. 15 --3-B-29 sl #2 ....J :::> . IXl +> -·- 3-B-21 sl #15 ....... > = ·-::::::-. . "' 10 > . ~. - - 3-B-21 sl #3 LL! -··-" ~·· . ....J Cl 0.. . ....... - .. - AGGREGATE - :;: ~ 0 ci:: > (/)
5 LL. LL. 0 0 . . ....J ....J 0 0 0 > > 0.001 0. 01 0. 1 l.O 10
PORE DIA., µm
Fig. 13 Cumulative pore volume as percent of bulk volume of concrete vs pore diameter - (Non-air-entrained concrete).
25 -- ll-B-24 s, #3
~~·-..::::: -·-11-B-18 sl #3
20 -11-B-10 sl #15 "" "" ........... '>::: ....J .......... . - .. -AGGREGATE :::> .
.......... """'· IXl +> ....... > 15 ........... --.:::::: "' > . --~· LL! . ....J -.......: Cl 0.. - :;:
0 ci:: 10 > (/)
LL. LL. -··-··-...... 0 0 -.......... . ....J ....J 5 " 0 0 > >
......... 0
0.001 0. 01 0. l l.O 10 PORE DIA.,µ m
Fig. 14 Cumulative pore volume as percent of bulk volume of concrete vs pore diameter - 11.3% air.

.,.. . .µ
> . LU _, Q.. ::E < V'l
u. 0
_, 0 > :.:: _, :::> <XI --...
Q) > . Cl -0 > u. 0 . _, 0 >
25
20
15
10
5
0.001
····-. .......... -·---....... ..............
----... ............
..
..........
"
--~ ........ -~---···-···- ~""·
' ........ ~·-=-·-....... ........___' -.
0.01 0. 1
PORE DIA., µ m
" '\
1.0
10.2% AIR (lOB)
11.3% AIR (llB)
6.4% AIR (6B)
3.5% AIR (4B)
2.8% AIR (3B)
AGGREGATE
\. \
10
Fig. 15 Cumulative pore volume as percent of bulk volume of concrete vs.pore diameter of five concretes studied. ·
.,,_ "'

• -'
~ ~ 80 • LU
...J 0:: oO >a.. LU -' 60 0:: ;:: 00 0.. ,_
LU LL. ~ 0 40 !;;;: 1-...J r5 ::> u ~ ffi 20 u a..
0.001 0.01
43
0. l
PORE OIA., µ m
1.0
3-B-29 s1 #2
3-B-21 s1
#3
3-B-21 s1 #15
10
Fig. 16 Cumulative pore volume as percent of total pore volume vs pore diameter - Non-air-entrained concrete •
. -'
V> 0 < > . LU
0:: -' 0 0 a.. > LU -' 0:: ;:: 0 0 a.. I-LU ..... > 0 .... 40 I- I-< :z: -' UJ
~ u 0:: ::> LU u 0..
11-B-24 sl #3
20 ll-B-10 sl #3
ll-B-10 sl #15
0.001 0.01 0. l 1.0 10
PORE DIA.,µ m
Fig. 17 Cumulative pore volume as percent of total pore volume vs pore diameter - 11.3% air.

LU :E ::> ...J 0 > '-'J 0:: 0 0..
...J
~ ~ u. 0
1-z: LU u 0:: '-'J c.. ti) ct: '-'J
!5 -' 0 > '-'J 0:: 0 0..
LU > ..... ~ ....J
~ u
100 ""'·~~,~ . ' ·~
......,: '" . ~
- - 38 (2.8% AIR) ·- -· 48 (3.5% AIR) -·-· 68 (6.4% AIR)
80
60
40
20
--108 (10.2% AIR) -...:~ ~. ·:-... '\ ~~ ................. '\ ·'""-. ·.,
-··-118 (11.3% AIR)
\ '· .......... ,_'\. \" ~-, .\ ' ........... , .\ \ ', '· .\ . \ '',. ' ·' ~ '''· \ ' ·'"'-. ·, ' ....... ~ .. ......
'- ·-.....;; ........ ::_,... I ~?"i:n I I I I 10 I I I I I I I I I 1.0 I I I I I I
I I I 0. 1 I I J I I l
1 · • ' O 01 . m 00.001 . PORE DIA.'µ
Fig. 18 Cumulative pore volume as percent of total pore volume vs pore diameter of five concretes studied.
.;o-1'-

45
roughly to the capillary pores.5 •47 •50
This increase may also be noted in Fig. 19,in which percent of pores larger than 1.0 µm was plotted against total air content and porosity. Pore volume between l and 10 µm (excluding pores in aggregate) increased from 0.5% for 2.8% air (non-air-entrained) concrete to 11.0% for 11.3% air concrete. The percent pores in the 0.008 to 1 µm range remained essentially unchanged at about 11% (including aggregate pores). Although microcracks could cause some increase in porosity in the range between 1 and 10 µm, the consistent increase in pore volume in this region with increasing air content suggests that it was the direct result of air entrainment. 'Some evidence of these air bubbles was also observed in SEM micrographs.
4. The median pore diameter (D5o) also increased with total air content, from 0.1 µmat 2.8% air to 1.3 µmat 11.2% air (Fig. 20).
5. Figure 21 shows the relationship between mercury retained in the pores at atmospheric pressure as percent of volume of mercury filled at maximum pressure (40,000 psi) and percent total air (porosity). Since lower percent retention indicates pores with more or less uniform cross sections and large retention indicates pores with enlargements or constrictions (ink-bottle pores),5 the increase in mercury retention with increase in air content indicates that the air entrainment introduces more non-uniform pores. This is also shown in the uniformity coefficient (D40/Dso) versus air content curve (Fig. 22)-, higher uniformity coefficient indicating less uniform pore size distribution.·
4.4. Results of Fatigue Tests
One hundred and twelve beams were subjected to flexural fatigue
testing. As has been previously stated, beams of five different air
contents (2~8%, 3.5%, 6.4%, 10.2%, and 11.3%) were tested.
Within each air content group, beams were tested at four different
stress levels. A minimum of five beams within each of the groups
were tested at each stress level. The only exception was in the first
group (3.5% air), where, due to fatigue machine down time, fewer beams

"" • ~
E ;1
0 . ~
A ~
...., a:: 0 0.. ...., (.!) a:: cc ...J
46
60 AIR CONTENT 0
POROSITY 6
50
40
30
20
10
0 0 2 - 4· 6 8 10 12 14 16 18 20 22 24
AIR CONTENT/POROSITY,%. Fig. 19 Relationship between volume of large mode pores and total
air content/porosity.

e ;i
1.40
1.20
~ 1.00 Cl
ex: t:: 0.80 Ji! c( ..... Cl 0.60 w ex: 0 0. 0. 40 z c( ..... ~ 0.20 lE
AIR CONTENT o
POROSITY AS DETERMINED BY Hg POROSIMETRY o
0
47a
0
16
AIR CONTENT/POROSITY, %
0
18 20 22 24
Fig. 20 Relationship between air content/porosity and median pore diameter •
. "" . Cl LIJ z ..... ;:: LIJ ex: >-ex: => u 0:: LIJ lE ..... 0 . ...J 0 >
80
70
60
50 o AIR CONTENT o POROSITY
40 0 2 4 6 8 10 12 14 16 18 20 22 24
AIR CONTENT/POROSITY, %.
Fig. 21 Relationship between volume of mercury retained and total air content/porosity.

47b
32 AIR CONTENT 0
28 POROSITY 6 0 co
0
' 24 0 .... 0 . I- 20 :z w ..... u .....
16 "-"-w 0 u >- 12 I-..... lE ex: 8 tr ..... :z :::i 4
2 4 6 8 10 12 14 16 18 20 22 24
AIR CONTENT/POROSITY,%
Fig. 22 Relationship between uniformity coefficient and air content/ porosity.

48
were tested at two of the stress levels. Modulus of rupture strength,
maxinrum load applied as a percentage of modulus of rupture, and fatigue
life for each specimen are given in Tables B-1 through B-5 in Appendix B.
Each specimen listed in these tables has a three-digit designation, for
example, 3-B-21; the first number indicates the percent of plastic
air in the concrete rounded to the nearest whole number, the letter
designates the specimen as being a beam, whi.le the second number is
simply the specimen number and varies from 1 to the number of specimens
cast in each batch. Specimens which did not fail are also indicated
in these tables. As may be noted, specimens which did not fail were
loaded a minimum of 2 million cycles. In each case the minimum stress
applied was approximately 15 psi. Therefore, the beams were stressed
so that the bottom fiber stress varied from essentially zero to a
maxinrum value of 60, 70, 80, or 90% of the modulus of rupture strength.
Figure 23 shows the failure faces of modulus of rupture specimens
(upper section) and fatigue specimens (lower section) for three air
contents: 2.8, 6.4, and 11.3%. By observing the failure surfaces,
one may note that there is no visual difference between the modulus
of rupture failure surface and the fatigue failure surface for each
of the three air contents. However, there is a difference between the
failure surfaces of the various air contents. The failure surfaces
for the low air specimens exhibit predominantly failure through the
coarse aggregate. Failure surfaces for the high air specimens show
some failure of the aggregate; however, the main failure is between
the cement paste matrix and the aggregate. Thus, it may be concluded

{A) {B) (C)
Fig. 23 Photographs of tested beams showing fractured faces.
-"' "'
so
that high percentages of air weaken the interlock or bond between the
cement past matrix and the aggregate.
In Figs. 24 through 28 these data have been plotted on S-N curves
for each of the five air contents. Each of these curves is the result
of a log-log regression analysis plotted on a semi-log scale. The
correlation coefficients for the curves varied from -0.90 to -0.94.
Specimens that did not fail before 2 million cycles of load were assigned
a fatigue life of 10 million cycles and have been indicated on the
curves with small arrows.
For comparison, the curves presented in Figs. 24 through 28 are
presented on a composite plot in Fig. 29. As may be seen in Fig. 29, air
content has a definite effect on fatigue strength. By comparing the various
curves with the 2.8% air curve, which is the natural air curve, i.e.,
no air-entraining agent added, one may see the decrease in fatigue
strength as the air content increases. Ninety five percent confidence
limits are shown for 11.3 and 2.8% air in Fig. 30. Confidence limits
for the middle range air contents (3.5, 6.4, and 10.2%), although not
included in this figure do exhibit a considerable amount of overlap.
Confidence limits for 2.8 and 11.3% air curves overlap only slightly
at the ends of the ranges. This indicates that while the precise
locations of the middle range curves are probably not statistically
significant, the trend of the data is statistically significant and
unmistakable. Furthermore, the curves diverge at the lower stress
levels. Based on these findings it can be concluded that air content
has an undeniable effect on the fatigue strength of plain concrete in
flexure. As air content increases, the expected fatigue life of a

u. 0
Vl :::::> ...J :::::> 0
90
70
i 60 I-z: ..... ~ ""' 50 a..
l
l
51
10 102 103 104 105 LOG NUMBER OF CYCLES TO FAILURE
Fig. 24 S-N curve for 2.8% air concrete.
3. 5 PERCENT AIR
o+
10 102 103 104 105
LOG NUMBER OF CYCLES TO FAILURE
Fig. 25 S-N curve for 3.5% air concrete.

100
90
!z ..... ~ 50 ..... 0..
52
6.4 PERCENT AIR

LU IX
90
i= ao c.. ~ "-0 70 (/) :::> ...J
i5 i 60
~ LU
~ 50 LU c..
l 10
5')
11. 3 PERCENT AIR 0
102 103 104 105
LOG NUMBER OF CYCLES TO FAILURE
Fig. 28 S-N curve for 11. 3% air concrete.

90
LLI c:: :::>
80 I-0.. :::> c:: u. 0
V') :::>
70 ....I :::> 0 0 ::e: I-z: LLI u
60 c:: LLI 0..
50
l
.......... , :; ..... , '· ·· .. ~ ...... ........ ···· ........... .
··-....... ···· ....... ~. ......... . ,,.,. . .... • •'!'ooo. ~
.... ·-.--~ '···,·.~:··~~~ '··· ·····-~,... ........ ··;:-:::::::.. ....
........... · ... ~~~ .. ···"'"' .......... ··~:"::::.. .....
--- 2.8% ------ 3.5%
AIR AIR AIR AIR AIR
............ :··>-:,~ ...... . .. . '""' ...... .... ............ '"-"':' ............
'··~:.:..: .. -:- ...... ---·- 6.4% ... ············· l 0. 2% -···-· .. -11.3%
10 102 . 103 104
LOG NUMBER OF CYCLES TO FAILURE 105
Fig. 29 Composite S-N curves for five concretes studied.
···~:· ... :---...... ...... ""'·-::-;;: ::.:-....... ......
--...:.~:;:.;:-: .•.
106 107
"' ..,_

w ex:
90
i= 80 0.. ::::> ex: u... 0
V')
3 70 ::::> 0
~ f-. z: w 2;! 60 w 0..
50
1
11.3% AIR
10 J02 103 104 105 106 LOG NUMBER OF CYCLES TO FAILURE
Fig. 30 Confidence limits for plain concrete with 2.8% and 11.3% air.
107
\.n \.n

56
concrete specimen decreases. Although not obvious from the curves,
due to the semi-log plot, the effect of a:i.r is more drastic at the
lower stress ranges than at higher stress ranges. For instance, at
the 70% stress level 11.3% air concrete would have an anticipated
fatigue life of 30,000 cycles compared with 200,000 cycles for a 2.8%
air concrete. At the 65% stress level, the values are 200,000 and
1,700,000 cycles, respectively. The difference in fatigue lives of
the two concretes at 70% modulus of rupture is 130,000 cycles, while
the difference at 65% is 1,500,000 cycles. The lower stress ranges
are crucial with respect to pavement design, making this divergence
of critical importance.
A modified Goodman diagram22 for the fatigue data at one million
cycles is shown in Fig. 31. Any point on a modified Goodman diagram
of this type indicates a load combination that will cause a fatigue
failure at one million cycles. For instance, the diagram can be used
if it were desired to cycle from 60% to some maximum percentage of the
modulus of rupture instead of from zero to maximum. If the minimum
were set at 60%, then a specimen with 11.3% air could be loaded up
to 68% and still fail at one million cycles. A 2.8% air specimen
could be cycled from 60% to 73% modulus of rupture and also fail at
one million load repetitions.
If tests were performed from zero to maximum load, the 11.8%
and 2.8% air specimens could be subjected to 61% and 66.5% modulus
of rupture, respectively, and also fail at 1 million cycles. In other
words, for the same fatigue life of 1 million cycles, the low air

57
100%
90 R=O
LU 0:: ::> I-a.. ~ 80 u. 0
(/) ::>
--- R=l ----- 2.8% AIR -c.- 11.3% AIR -o- 6.4% AIR
60
50 60 70 80 90 100 PERCENT MODULUS OF RUPTURE
Fig. 3l Modified Goodman diagram for plain concrete with 2.8, 6.4 and 11. 3% air.

58
concrete can withstand an additional stress equal to 5.5% of the
modulus of rupture.
4.5. Treatment of Fatigue Data by Application of Fracture Mechanics
Fracture of a material occurs by extension of a pre-existing
flaw. The importance of the size of the flaw depends on the fracture
toughness of the material. Crack extension occurs in three stages:
subcritical, critical, and running. Subcritical crack extension is
slow and is measured as a length change per cycle for fatigue. At
critical crack extension there is a transition from a slowly propagating
crack to a rapidly running crack. Running crack extension corresponds
to fracture of the material. In order to understand the fracture
behavior of a material the transition point from subcritical to
critical crack extension must be quantified.
Fracture of concrete can occur by fracture of the cement paste,
fracture of the aggregate, failure of the bond between cement paste
and aggregate, or any combination of these. For this reason concrete
differs slightly from the ideal crack extension behavior. "Two types
of crack growth are present in concrete: an initial stage in which
the rate of release of strain energy with slow crack extension is so
low that any sudden increase in energy requirement, such as encountering
an aggregate, will stabilize the propagating crack; and a final stage
where the energy release rate with rapid crack propagation is of such
magnitude that any energy demand encountered will be supplied so that
an unstable situation results. 1134 The transition between these two

59
stages is a function of the critical stress intensity factor, K , c
The smaller the K , the smaller crack length is required for failure c
in fracture. In general, the stress intensity factor (K) can be
expressed as:
k K = JC (A)2
where J = stress, A= crack length, and C is some constant dependent
on the geometry of the material.
8 Brown and Srawley developed the following expression for K,
for a single-edge-cracked specimen subjected to pure bending:
K 6Malz
y--Bw2
where Y = 1.99 - 2.47 (a/w) + 12.97 (a/w) 2 - 23.17 (a/w)3 + .24.80 (a/w)4 ,
a is the flaw depth, w is specimen depth, M is applied bending moment,
and B is specimen width.
42 Rolfe and Barsom presented equations for K for various other
conditions.
If stress (or moment above) is held constant, then the only
variable for a constant geometry section is the crack length a. The
critical stress intensity factor (Kc) then corresponds to some critical
crack length a , When this critical crack length is reached, the c
transition between slow and rapid crack propagation will occur.
Fatigue behavior of concrete can then be thought of as a phenome-
non involving the growth of microscopic flaws. When the length of one
of these flaws reaches the critical value a , failure will occur. c
The fatigue behavior is directly affected by the critical stress
intensity factor, K : As K goes up, a also increases. The c c c

60
importance of this statement with respect to understanding the fatigue
behavior of air-entrained concrete can be fully understood in light of
34 the findings of Naus and Lott.. Naus and Lott found that Kc decreased
by 8.2% when the air content in concrete was increased from 2.0 to
12. 0%.
This finding indicates a decrease in the critical crack length a , c
with increasing air content. If it can be assumed that microcracking
occurs at similar rates for varying air contents, then a decrease in
a will mean a fewer number of load (stress) repetitions will be c
required to effect a fracture or fatigue failure. In other words,
as air content increases and K (and a ) decreases, fatigue life . c c
would b.e expected to decrease.
This theoretical approach is in agreement with the experimental
findings of this investigation. The flexural fatigue life of concrete
was found to decrease as the amount of air increased between the limits
of 2.8 and 11.3%.
4.6. Implications in Concrete Pavement Design
The results of two research projects carried out in the early
1920's at Purdue and the Illinois Department of Highways11
•37
provided
basic data for the 1933 PCA fatigue curve shown in Fig. 32. 13 This
curve was used in conjunction with Minor's theory32 to evaluate the
accunrulated fatigue effects of all anticipated load applications,
to prevent slab cracking, and to evaluate the design adequacy of a
concrete slab thickness for streets, highways, and airfields. Minor's

ioo.--~~~~~~~~~~~~~~~~~~~~~~~~~~~~~~
90
w 0:: ~ f- 80 0. ~ 0::
u... 0
(/) ~ 70 ...J ~ Cl
~ f- I ~· ~ -·--. I 0' z: .......... _ " n 4TD --- .... w u 60 0:: w 0.
50 PRESENT PCA CURVE
10 102 103 104 105 106 107
LOG NUMBER OF CYCLES TO FAILURE
Fig. 32 Pavement fatigue (S-N) design curves.
62
theory applies to stress repetitions above the endurance limit and
postulates that fa~igue strength not used by repetitions at one stress
level is available for repetitions at other stress levels; Minor's
theory is often referred to as the cumulative damage theory. Due in
part to work done in the 1960's by Hilsdorf and Kesler 18 and, in part
to results of several test roads, the 1933 PCA fatigue curve was
replaced by the present 1966 curve.
The fatigue curve which resulted from the work by Hilsdorf and
Kesler is shown in Fig. 32. This curve represents a constant probability
of 0,05, which means that for 100 fatigue tests not more than five
would show fatigue strengths below the curve. Calculations of pavement
thickness with the Hilsdorf and Kesler curve gave usable results, and
their curve was considered for replacement of the 1933 PCA curve.
However, due to the limitations of the Hilsdorf and Kesler investigation,
evidence from several test roads, and performance of normally constructed
pavements subject to normal mixed traffic, the present PCA curve was
adopted for thickness design.
Results of the current investigation are also shown in Fig. 32
for non-air-entrained (2.8%), medium range air (6.4%), and high air-
entrained concrete (11.3%). These curves also represent a constant
probability of 0.05 and can therefore be compared directly with the
work of Hilsdorf and Kesler and the two PCA fatigue curves.
It should be kept in mind that the curve presented by Hilsdorf
and Kesler is the result of varying stress fatigue, while the findings
of this investigation are the result of constant stress fatigue testing.
63
The present PCA fatigue curve is conservative with respect to
Hilsdorf and Kesler air curve as well as the 2.8% air curve of this
investigation. When the effect of high air content is considered,
the PCA curve is not conservative in the higher stress ranges. The
location of the 11.3% air curve indicates that a pavement designed
by current PCA procedures and coutaining this much air could fail
prematurely. This i'llustrates most dramatically the effect of air
content on current pavement design procedures.
To further illustrate the effect of air content, pavement designs
were performed using the Iowa DOT Pavement Design Procedure15 with
the fatigue curves from this investigation as well as the standard
PCA 1933 and 1966 fatigue curves, The results are compared in terms
of both fatigue consumption for a given slab thickness and the slab
thickness required to ensure against fatigue failure. The same design
traffic data and subgrade k values were used in all cases. The fatigue
curves that were used are those shown in Fig. 32. The distribution of
axle loads during the design life corresponds to Design Example Number 2
of reference 45. The design calculations are presented in Appendix C.
The effect of air content on the modulus of rupture was taken into
account. Values of modulus of rupture used were 500 psi for 11.3%
air, 700 psi for 2.8% air, and 600 psi for 6.4% air, which correspond
to the 600 psi used for the PCA design calculations. The results of
the thickness design calculations are presented in Table 3.
For the given subgrade, traffic, and modulus of rupture, based
on Iowa D.O.T. design methods, a pavement thickness of 9.5 in. is
required. Using this thickness as a basis for comparison, the current

Table 3. Comparison of pavement design procedures.
Assumed Modulus of Rupture, psi
% Fatigue Life used in a 9.5 in. Pavement
Pavement Thickness Required for Less Than 125% Fatigue Life Consumption, in.
Design Procedure
PCA
Iowa DOT (Current PCA)
600
75.1
9.5
1933 PCA
600
196. 9
10.0
2.8% Air Curve
700
None
7.5
r.s.u.
6.4% Air Curve
600
16.9
9.0
11.3% Air Curve
500
3322.6
10.5
"' ..,..
65
D.O.T. procedure arrives at a value of 75.1% of the available fatigue
life used, The 1933 PCA fatigue curve results in a fatigue life
consumption of 196.9%. With 2.8% air and using the r.s.u. fatigue
curve, none of the fatigue life is used, At 6.4% air, 16.9% of the
fatigue life is used, and at 11.3% air, 3322.6% of the fatigue life
would be used,
A more meaningful comparison can be made by calculating the
respective pavement thickness required when each of the fatigue curves
is used. The current PCA fatigue curve will require a thickness of
9.5 in. The 1933 curve would require 10.0 in. If the fatigue curve
for an air content of 2.8% is used, the thickness required could be
held down to 7.5 in. A 6.4% air pavement would require a thickness of
9.0 in. However, if the fatigue curve for an 11.3% air concrete were
used, a 10.5-in. pavement would be required. This again illustrates
the effect of air content on current pavement design practices,
It should be noted that the air contents used for the previous
comparison are out of the range of normal design for concrete mixes.
This, however, does not alter the basic finding of this investigation,
that air content does indeed affect the fatigue life of plain concrete
in flexure and should be considered for optimum design of concrete
pavements,

66
5. SUMMARY AND CONCLUSIONS
The need for fatigue strength data in the design of concrete
highway and airfield pavements has been known for years. Practically
all rigid pavement design procedures used today make use of the fatigue
life of concrete. The fatigue curves presently used were last revised
in 1966 and do not take into account the effects of entrained air.
Thus, this study investigated the effectsof air on fatigue strength
of plain concrete. All other variables (water-cement ratio, aggregate
type, cement type, etc.) were held constant.
The previous text presents the results of the study on the fatigue
behavior of plain concrete of various air contents. Tests were conducted
on five batches of concrete with air contents of 2.8, 3.5, 6.4, 10.2,
and 11.3%. Fatigue specimens consisted of 6 in. x 6 in. beams subjected
to flexural loading under a zero to maximum load cycle. Under such
conditions the bottom fiber of the beam was subjected to zero to tension
stress cycles. The maximum bottom fiber stress for a specific test in
most cases was 60, 70, 80, or 90% of the static modulus of rupture.
Concrete for all batches was mixed and poured in the laboratory. Test
specimens were stored submerged in water until testing which took
place at a specimen age of 28 to 56 days.
Tests were conducted using an Instron Corporation model 1211
dynamic cycler fitted with a one-third point loading frame identical
to the one used in the modulus of rupture test. One hundred and twelve
fatigue tests were conducted, Results of these tests are presented
in both tabular and graphic form.

67
S-N diagrams show a significant reduction in fatigue life as the air
content of concrete increases. This reduction is further illustrated
when S-N curves with 95% confidence limits for a point are used for
pavement design. Using the I.s.u. fatigue curves, a pavement containing
2.8% air would require a design thickness of 7 .5 in., while a pavement
containing 6.4% air would require a design thickness of 9.0 in.
The main fatigue test program was supplemented by additional
investigations. The compressive strength, modulus of rupture, modulus
of elasticity, and unit weight were determined for each batch. Plastic
air content determinations were compared with hardened air contents
determined by the linear traverse and high pressure air meter methods.
Scanning electron microscope photographs were taken at various magnifi-
cations and various air contents to determine characteristics of the
air void system. A mercury penetration porosimeter was used to character-
ize the void properties of the concrete at the various air contents.
As a result of the various tests performed in this study the
following conclusions were reached:
1. The fatigue behavior of plain concrete in flexure is affected by the air content of the concrete. Fatigue strength decreases as air content increases. Fatigue curves obtained from this study (Figs. 29 and 32) provide a basis for an improved rigid pavement design for pavements in which air-entrained concrete is used. Pavements designed using the high air and low air fatigue curves developed in this study resulted in a difference in thickness of several inches.
2. The linear traverse and high pressure air determination methods are reliable means of ascertaining the air content of hardened concrete and can be used to determine. the original plastic concrete air content by mathematical means.

68
3. The modulus of rupture, compressive strength, modulus of elasticity, and unit weight of concrete all decrease as the air content of the concrete increases.
4. As the air content rises the failure of concrete subjected to fatigue occurs increasingly at the aggregate-cement paste interface. The fatigue failure surface is, however, identical, on a macroscopic level, to the modulus of rupture (static) failure surface,
5. Although it has been generally suggested that entrained air voids are between 1 and 0.005 mm in diameter and spherical in shape, and that entrapped air bubbles are greater than 1 mm in diameter and irregular in shape, the SEM micrographs made in this study showed that the two kinds of voids cannot be distinguished by either size or shape.
6. Air entrainment had essentially no effect on pores of capillary/ gel size (less than 1 µm). However, mercury porosimetry data showed that at higher air entrainment, increased air resulted in more pores in size of 1 to 10 µm range, between that of conventional concept of entrained air and capillary pores. Also, increasing air content increased the median pore diameter of the micropores as well as the non-uniformity of pore system.

69
6. RECOMMENDED FUTURE STUDIES
The present study has clearly shown that air content does have
an effect on fatigue concrete in flexure. In view of these findings
the following areas of concrete fatigue in flexure should be pursued:
• Effects of varied W/C ratio
• Effects of different aggregate types
• Surf ace treatments and other approaches to increase fatigue life (high density surface, polymer, sulfur penetration, etc.)
• Development of comprehensive rigid pavement design curves applicable for concretes of commonly used combinations of air content, water-cement ratio, aggregate type, etc.

70
7. REFERENCES
1. AASHTO Interim Guide for Design of Pavement Structures, 1962.
2. A Guide 'to the Structural Design of Pavements for New Roads, Road Research Laboratory, Road Note 29, 1970.
3. Air Entrained Concrete, Washington, D.C., Highway Research Board, Bulletin 70, 1953.
4. Antrim, J. c. and J. F. McLaughlin. "Fatigue Study of Air Entrained Concrete . 11 American Concrete Institute Journal, Proceedings, Vol. 55, May 1959, pp. 1173-1182.
5. Auskern, A. and W. Horn. "Capillary Porosity in Hardened Cement Paste." Journal of Testing and Evaluation, Vol. 1, No. 1., 1973, pp. 74-79.
6. Bennett, ·E. W. "Fatigue in Concrete." Concrete (Chicago), May 1974, pp. 43-45.
7. Brown, L. S. and C. U. Pierson. "Linear Traverse Technique for Measurement of Air in Hardened Concrete." American Concrete Institute Journal, Proceedings, Vol. 47, 1950, pp. 117-123.
8. Brown, W. F. and J. E. Srawley. "Plain Strain Crack Toughness Testing of High Strength Metallic Materials." America Society of Testing and Materials, STP No. 410, 1966, pp. 13-14.
9. Carey, w. N. and P. E. Irick. "Relationships of AASHO Road Test Pavement Performance to Design and Load Fae tors." Highway Research Board, Special Report No. 73, 1962, p. 259.
10. Causes, Mechanism, and Control of Cracking in Concrete. Detroit, Michigan, American Concrete Institute, Publication SP-20, 1968.
11. Clemmer, H. F. "Fatigue of Concrete." Proceedings, American Society of Testing and Materials, Vol. 22, Part II, 1922, pp. 409-419.
12. Concrete and Mineral Aggregates. Philadelphia, Pa,, American Society for Testing and Materials: Annual Book of Standards, Part 10, 1973.
13. Fordyce, P. and W. A. Yrjanson. "Modern Techniques for Thickness Design of Concrete Pavements," American Society of Civil Engineers Annual Meeting and National Meeting on Structural Engineering; 1968 (also available from Portland Cement Association).

71
14. Gregg, L. E. Experiments with Air Entrainment in Cement Concrete. Lexington, Kentucky, Kentucky Department of Highways, Bulletin No. 5, September 1947.
15. Guide for Primary and Interstate Road Pavement Design, Iowa Department of Transportation, 1976.
16. Hatt, W. K. "Fatigue of Concrete." Proceedings, Highway Research Board, Vol. 4, 1924, pp. 47-60.
17. Hawkins, N. M., A, N. Wyss and A. H. Mattock. "Fracture Analysis of Cracking in Concrete Beams." ASCE Journal of the Structural Division, May 1977, pp. 1015-1030.
18. Hilsdorf, H. K. and C. E. Kesler. Under Varying Flexural Stresses." Journal, Proceedings, Vol. 63, No.
"Fatigue Strength of Concrete American Concrete Institute 10, October 1966; pp. 1059-1075.
19. Hollen, G. W. and M. E. Prior. "Factors Influencing Proportioning of Air Entrained Concrete." American Concrete Institute, Publication SP-46, 1974.
20. Hudson, W. R. and B. F. McCullough. "An Extension of Rigid Pavement Design Methods." Highway Research Record, No. 60, 1964, pp. 1-14.
21. Kesler, C. E., "Effect of Speed of Testing on Flexural Fatigue Strength of Plain Concrete." Proceedings, Highway Research Board, Vol. 32, 1953, pp. 251-258.
22. Kesler, C. E. Significance of Tests and Properties of ConcreteMaking Materials. American Society of Testing and Materials: Special Technical Publication 169A, 1966, pp. 144-159.
23. Kosteas, D. "Effect of the Number of Samples on the Statistical and Regression Analysis of Fatigue Tests." Aluminium, Vol. 50, No. 2, 1974, pp. 165-170.
24. Lauer, K. R. and F. o. Slate. "Autogenous Healing of Cement Paste." American Concrete Institute Journal, Proceedings, Vol. 52, June 1956, pp. 1083-1098.
25, Lerch, W. Basic Principals of Air Entrained Concrete. Portland Cement Association, 1953.
26. Lindsay, J. D., "Illinois Develops High Pressure Air Meter for Determining Air-Content of Hardened Concrete." Proceedings, Highway Research Board, Vol. 35, 1956, pp. 424-435.
27. McCall, J. T. "Probability of Fatigue Failure of Plain Concrete." American Concrete Institute Journal, Proceedings, Vol. 55, August 1958, pp. 233-244.

72
28. Mielenz, R. C., V. E. Wolkodoff, J.E. Backstrom and H. L. Flack. "Origin, Evolution, and Effects of the Air Void System in Concrete. Part I - Entrained Air in Unhardened Concrete. 11 American Concrete Institute Journal, Proceedings, Vol. 55, July 1958, pp. 95-122.
29. Mielenz, R. C., V. E. Wolkodoff, J.E. Backstrom and H. L. Flack. "Origin, Evolution, and Effects of the Air Void System in Concrete, Part 2 - Influence of Type and Amount of Air-Entraining Agent." American Concrete Institute Journal, Proceedings, Vol, 55, August 1958, pp. 261-283.
30. Mielenz, R. C., v. E. Wolkodoff, J. E. Backstrom and H. L. Flack. "Origin, Evolution, and Effects of the Air Void System in Concrete. Part 3 - Influence of Water-Cement Ratio and Compaction." American Concrete Institute Journal, Proceedings, Vol. 55, September 1958, pp. 359-376.
31. Mielenz, R. C., v. E. Wolkodoff, J. E. Backstrom and H. L. Flack. "Origin, Evolution, and Effects of the Air Void System in Concrete. Part 4 - The Air Void System in Job Concrete. 11 American Concrete Institute Journal, Proceedings, Vol. 55, October 1958, pp. 507-518.
32. Miner, M. A. "Cumulative Damage in Fatigue." Transactions of the ASME, Vol. 67, 1945, pp. Al59-Al64.
33. Murdock, J. W. and C. E. Kesler, "Effect of Range of Stress on Fatigue Strength of Plain Concrete Beams. 11 American Concrete Institute Journal, Proceedings, Vol. 55, August 1958, pp. 221-232.
34. Naus, D. and J. Lott, Fracture Toughness of Portland Cement Concretes. Urbana, Illinois, University of Illinois, T & AM Report No. 314, 1968.
35, Neville, A. M. Properties of Concrete. New York, John Wiley and Sons, Inc., 1973.
36. Nordby, G. M. "Fatigue of Concrete - A Review of Research." American Concrete Institute Journal, Proceedings, Vol. 55, August 1958, pp. 191-220.
37. Older, C. "Highway Research in Illinois, 11 Transactions, American Society of Civil Engineers, Vol. 87, 1924, pp. 1180-1222.
38. Raithby, K. D. and J. w. Galloway, "Effects of Moisture Age, and Rate of Loading on Fatigue of Plain Concrete." Concrete Institute, Publication SP-41, 1974, pp. 15-34.
Condition, American
39. Ray, G. K., E. G. Robbins and R. G. Packard. "Concrete Pavement Design Today. 11 Proceedings of the American Society of Ci vi 1 Engineers Conference on Pavement Design for Practicing Engineers, Atlanta, Ga., 1975, pp. 1-2.
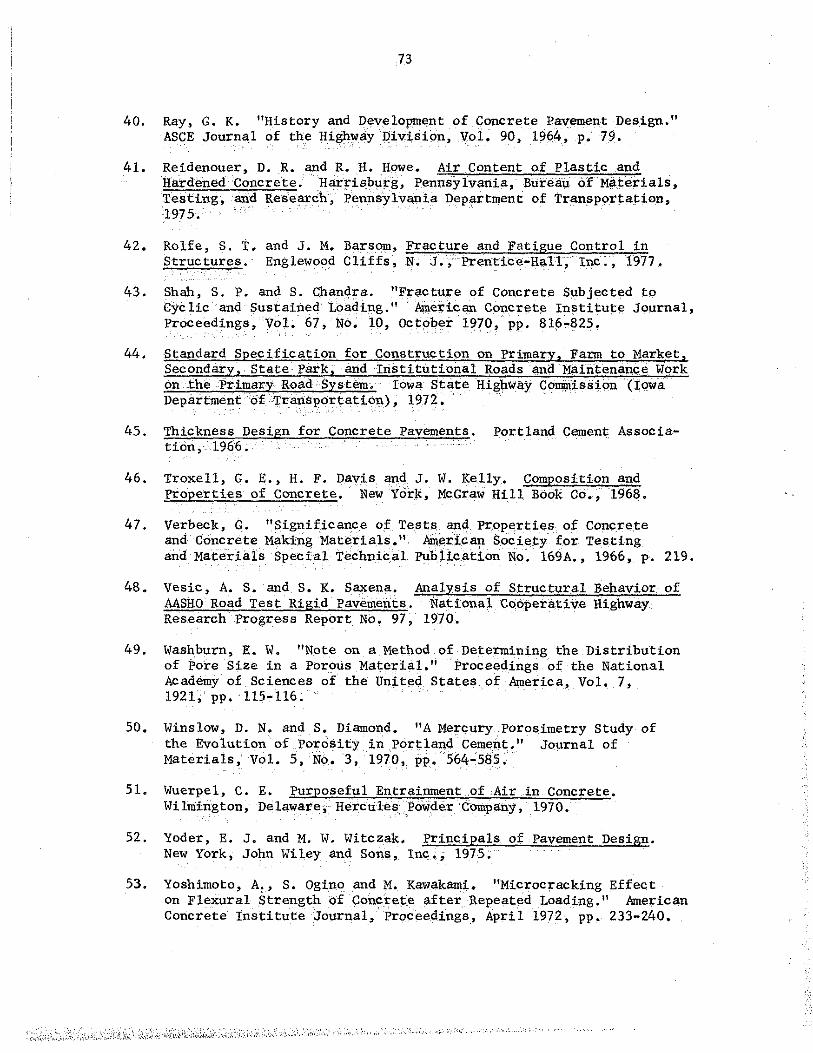
7.3
40. Ray, G. K. "History and D,;,veloprnent pf Cpncrete Pavement Design." ASCE Journal of the Hig!l!'lay Piv:i,sfon, Vol. 90, 19(;4, p. 79.
41. Reidenouer, D .. R. and R •. H •• Howe. Air Content of Plastic and Hardened Concrete .. Harrisburg, Pennsylvania, Bureau of Mat:erials, Testing, and Research, Pennsylvania Department of Transpori:ation, 1975.
42. Rolfe, S. T, and J. M. Barsom, Fracture and Fatigue Control in Structures. Englewood Cliffs, N; J., Prentice-m:tlT, Inc., 1977.
43. Shah, s. P. and s. Chandi:a. "Fract:µre of Concrete Sµbjected to Cyclic and Sustained Loading." · A,nerican Concrete Institute Journal, Proceedings, Vol. 67, No. 10, October 1970, PP• 816~825,
44. Standard Specification for Construction on Primary, Farm to Market, Secondary,. State· Park, and Institutional Roads. and Maintenance Work on .the Primary Road System. Iowa State Highway C011Wiission (Iowa Department of Tratisportation), 1972.
45. Thickness Design for Concrete Pavements. Portland Cement. Association,• 1966.
46. Troxell, G. E., H. F. Dav.is. and J. W. Kelly. Composition and Properties of Concrete. New York, McGraw Hill Book Co., 1968.
47. Verbeck, G. "Significance of Tests and ?roperties of Concre.te and Concrete Making Materials." Aineri.can Society for Testing and Materilils Special Technic.al Pub ti.cation No. 169A., 1966, p. 219.
48. Ve sic, A. S. and S. K. Saxena. Analysis of Structural Behavior of AASHO Road Test Rigid Pavements. National Cooperative Highway Research Progress Report No, 97, 1970.
49. Washburn, E. W. "Note on a Method of Determining the Distrl.bution of Pore Size in a Porous Mater id." Proceedings of the National Academy of Sciences of the United St:ates of America, Vol. 7, 1921, pp. 115-116.
50. Winslow, D. N. and S. Diamond. "A Mercµry Porosimetry Study of the Evolution of Porosity in Port: land Ceme11t." Journal of Materials, Vol. 5, No. 3, 1970,. pp. 564~585,
51. Wuerpel, c. E. Purposeful Entrainment .of Air in Concrete. Wilmington, Delaware; Hercules. Powder C:0mpany, 1970. ,., '
52. Yoder, E. J. and M. W. Witczak, Principals of Pavement Design. New York, John Wil,ey and Sons, Inc,; 1975;
53. Yoshimoto, A .. , s. Ogino and M. Kawakami. "Microcracking Effect on Flexural Strength of Concrete after Repeated Loading." American Concrete Institute Journal,· Pro<::eedings, Apr:i.l 1972, pp. 233-240.

74
8. ACKNOWLEDGMENTS
The study presented in this report was sponsored by the Highway
Division of the Iowa Department of Transportation under Research
Project HR-183. This study, under the same title, was also supported
by and designated as Project 1259 of the Engineering Research Institute,
Iowa State University.
The authors wish to extend sincere appreciation to the engineers
of Iowa D.O.T. for their support, cooperation, and counseling. A
special thanks is extended to Messrs. Bernard Brown and LaVern Huckstadt
for their assistance in running the linear transverse and high pressure
air tests.
Appreciation is also extended to Dr. Herb T. David, Statistics,
for advice on testing sequence for fatigue beams; Dr. Tom McGee,
Material Science and Engineering, for use of the concrete specimen
polisher and light microscope; Drs. Donald Biggs and Robert Cody,
Earth Science, for use of the diamond saw and core drill; and
Mr. Jerry Amenson for assistance in the SEM work.
The following individuals contributed, in various capacities,
to this investigation: Gary Krupicka, Cheryl Heyveld, Bob Sykes,
and s. T. Tong.
75
9. APPENDIXES
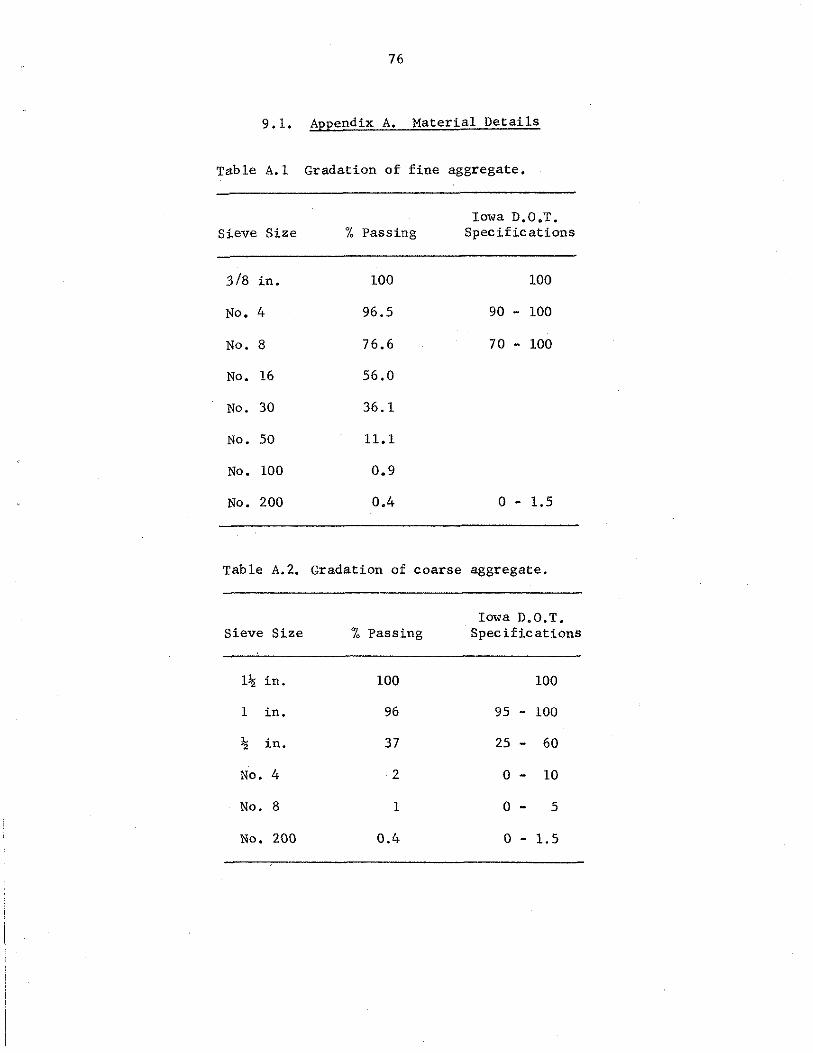
76
9 .1. Appendix A. Material Details
Table A. l Gradation of fine aggregate.
Iowa D.O,T. SJ.eve Size !. Passing Spec if ic ations
318 in. 100 100
No. 4 96.5 90 - 100
No. 8 76.6 70 - 100
No. 16 56.0
No. 30 36.1
No. 50 11.1
No. 100 0.9
No. 200 0.4 0 - 1.5
Table A.2. Gradation of coarse aggregate,
Iowa n.o. T. Sieve Size '70 Passing Specifications
l!i; in. 100 100
1 in. 96 95 100
!ii in. 37 25 60
No. 4 2 0 - 10
No. 8 1 0 - 5
No. 200 0.4 0 - 1.5

Table A.3. Cement properties.
Property
Chemical Data
Mgo
so3
Loss on Ignition
Insoluable Residue
Physical Data
Fineness, 2 Blaine, cm /gm
Soundness, Autoclave, %
Time of Set, min. Vicat, Initial Vicat, Final
Air Content, %
Compressive Strength, psi 3 Day 7 Day
Test Value
2.6
2.8
.9
.2
3460
.1
80 155
11.0
2480 4070
~·.--... - -.,-~ ---.-~~
Specification (ASTM C150 and Fed. SS·C-192)
5.0 max.
3.5 max.
3.0 max.
.75 max. ...., ....,
2800 min.
.80 max.
45 min. 480 max.
12.0 max.
1800 min. 2800 min.

Table A.4. Laboratory batch quantitiesa.
Batch Cement, lb Water, lbb Sand, lb Coarse Aggregate, lb
A 847 382 1890 2314
B 968 435 2000 2272
c 968 435 2000 2272
D 968 435 2000 2272
E 575 259 1188 1350
~ater-cement ratio = 0.41.
b Includes water required to bring aggregates to saturated surface dry condition.
Ad Aire, ml
107
1935
None .... "' 968
293
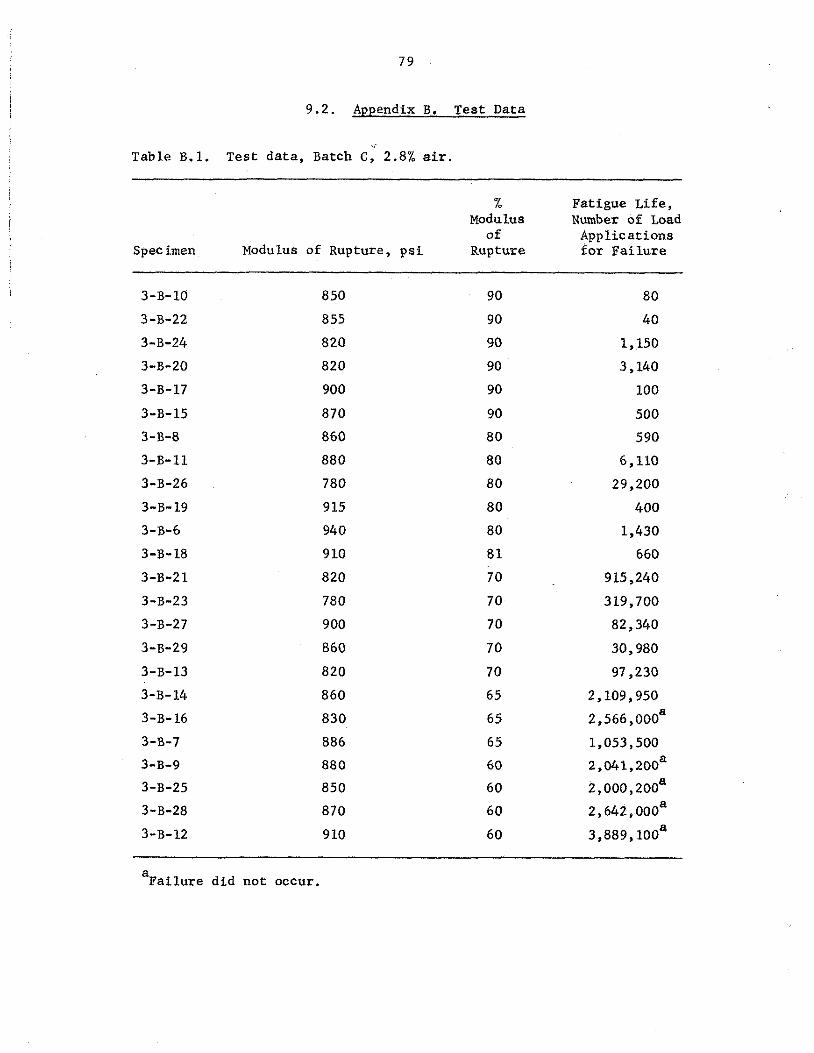
79
9.2. Appendix B. Test Data
v
Table B.1. Test data, Batch C, 2.8% air.
% Fatigue Life, Modulus Number of Load
of Applications Specimen Modulus of Rupture, psi Rupture for Failure
3-B-10 850 90 80
3-B-22 855 90 40
3-B-24 820 90 1,150
3-B-20 820 90 3,140
3-B-17 900 90 100
3-B-15 870 90 500
3-B-8 860 80 590
3-B-11 880 80 6, 110
3-B-26 780 80 29,200
3-B-19 915 80 400
3-B-6 940 80 1,430
3-B-18 910 81 660
3-B-21 820 70 915,240
3-B-23 780 70 319,700
3-B-27 900 70 82,340
3-B-29 860 70 30,980
3-B-13 820 70 97 ,230
3-B-14 860 65 2, 109' 950
3-B-16 830 65 2,566,000 a
3-B-7 886 65 1,053,500
3-B-9 880 60 2,041,200 a
3-B-25 850 60 2,000,200 a
3-B-28 870 60 2,642,000 a
3-B-12 910 60 3,889, 100 a
a Failure did not occur.

80
Table B.2. Test data, Batch A, 3.5% air.
% Fatigue Life, Modulus Nl.llllber of Load
of Applications Specimen Modulus of Rupture, psi Rupture for Failure
4-B-19 770/790
4-B-21 820/840
4-B-13 830 90 290
4-B-14 770 90 310
4-B-15 870 90 530
4-B-l 790 85 830
4-B-2 830 85 850
4-B-3 830 85 1,070
4-B-9 850 85 2, 100
4-B-10 790 85 1,420
4-B-11 820 85 1,200
4-B-4 810 75 4,880
4-B-5 840 75 2,410
4-B,-6 850 75 5,910
4-B-7 870 75 1,010
4-B-8 830 75 10,850
4-B-16 820 65 74,310
4-B-17 890 65 495,460
4-B-18 840 65 2,074,690 a
4-B-12 820 55 2 '721, 640 a
a Failure did not occur.

81
Table B.3. Test data, Batch E, 6.4% air.
% Fatigue Life, Modulus Number of Load
of App lie at ions Specimen Modulus of Rupture, psi Rupture for Failure
6-B-19 585 90 630
6-B-8 548 90 580
6-B-5 590 90 1,110
6-B-22 620 90 330
6-B-O 550 90 460
6-B-18 540 80 1,990
6-B-6 533 80 3,670
6-B-4 600 80 6,310
6-B-3 546 80 9,870
6-B-l 600 80 2,830
6-B-20 638 70 5 '940
6-B-11 538 70 39,350
6-B-10 548 70 19,280
6-B-16 590 70 22,940
6-B-17 590 70 26,300
6-B-21 643 60 704,830
6-B-7 603 60 144,500
6-B-2 648 60 52,980
6-B-15 600 60 2,200,000 a
6-B-9 535 60 2,169,790 a
~ailure did not occur.

82
Table B.4. Test data, Batch D, 10.2% air.
?o Fatigue Life, Modulus Number of Load
of Applications Specimen Modulus of Rupture, psi Rupture for Failure
10-B-20 460 90 560
10-B-21 495 90 80
10-B-18 440 90 270
10-B-8 490 90 410
10-B-14 506 90 160
10-B-24 483 90 180
10-B-17 490 80 830
10-B•9 445 80 8,810
10-B-11 445 80 16, 120
10-B-12 466 80 17 ,060
10-B-15 460 80 4, 100
10-B-7 477 80 1,390
10-B-4 492 80 690
10-B-5 488 80 2,480
10-B-22 500 70 9,080
10-B-19 425 70 82,840
10-B-27 520 70 10,390
10-B-26 506 70 12,390
10-B-6 500 70 8,010
10-B-3 532 70 7,020
10-B-29 495 60 457 ,810
10-B-16 494 60 2,548,000 a
10-B-10 471 60 2,652,910 a
10-B-13 490 60 1,063, 510
10-B-23 440 60 3, 147 ,240 a
10-B-25 520 60 29,860
a Failure did not occur.

83
Table B.5. Test data, Batch B, 11,3% air.
% Fatigue Life, Modulus Number of Load
of Applications Specimen Modulus of Rupture, psi Rupture for Failure
11-B-31 440/450
11-B-30 470/490
ll-B-30A 450/500
11-B-22 500/540
11-B-5 480 90 1,440
11-B-14 520 90 240
li-B-9 510 90 90
11-B-2 560 90 100
11-B-23 470 90 "360
11-B-20 540 90 50
11-B-3 550 80 460
11-B-15 490 80 3,000
11-B-11 510 80 580
11-B-l 540 80 1,470
11-B-12 540 80 590
11-B-19 530 80 720
11-B-13 510 70 32, 970
11-B-16 510 70 277,050
11-B-6 500 70 2,810
11-B-10 498 70 17. 980
11-B-18 560 70 8,700
11-B-24 520 70 14, 600
11-B-4 560 60 72,250
11-B-17 510 60 2, 110, 720 a
11-B-7 470 60 2,000,000 a
li-B-8 520 60 42,950
11-B-29 540 60 322,380
11-B-21 500 60 1,529,260
a Failure did not occur,

84
9.3. Appendi~ c. Pavement Design Calculations
Axles during design life - standard PCA design method (45)
Axle Load Groups, Kips
SINGLE
28-30
26-28
24-26
22-24
20-22
18-20
16-18
TANDEM
52-54
50-52
48-50
46-48
44-46
42-44
40-42
38-40
36-38
34-36
32-34
30-32
Axle Loads in Design Life
3,700
3, 700
7 ,410
195,000
764,400
2, 139, 150
2,870,400
3, 700
3,700
36,270
36,270
57,530
179, 790
204,750
296,400
319,800
487,500
610,350
1,078,350 Total 19,500,000 Trucks

85
CALCULATION OF CONCRETE PAVEMENT THICKNESS (Use wittl Cose I Sln9le e Tandem Axle Desi9n Chorte) Project Design Example - Iowa OOT (Current PCA Procedqre) Typo ____ _
·--------------No.of Lane'-------
Suborode k -~1o"o~_pcl., SUbboso --------------------Combined k 130 pci., Load Safety Factor __ ._.. ____ ( L.S F)
PROCEDURE
L Fill in Col. 1,2 and 6, listing Ollie loads in decreasing order. 2.Aasume 1st trial depth.Use l/2~1n.increments. 3.Analyz:e let trial depth by compl•tino columns 3,4,5 and 7. 4.Analyz:e oth•r trial d•pths, varying M.R~ slob d•pth and subbase type~*
I 2 3 4 5 6
Allie A Kie Stress Stress Allowable Expected Loads Load• Ratios Repetitions Repetitions
x t...S.F. kips kip• psi No. No.
7
Fatigue Resistance
Used '"1*
percent
Trial depth_~9~·~'---in. M.R~--6~0~0'--~P•i k --'-'"'--PC i
SINGLE AXLES . 30 " 0 000 " .., '·" ililO. - -3r100- 1.5 .. _
28 00 h 100 '" Unlimited ' 000
TANDEM AXLES 54 64.8 "" <O " 000 ' 000 6.5 -52 62.4 340 " 75 ooo ' 000 4,Q
50 60.0 "" '' 130 000 O< 0 00 27.9 __ - ... 48 5 7. 6 320 . " O•.A AAA " 1r.. ,
_ _iL__ 55.2 "" <O 300 000 <O <oo 19. 2 __ 1,4 52. 8 300 .so Unlimited 1 '70 '7<'lf\ _____ ,,. -
-----
.. Total 75.1% M. R. Modulus of Rupture for 3rd pt. loading.
Cement~treoted subbases result in greatly increased combined k value&.
"'** Total fatigue reSistance used should noi exceed obou; 125 percent.
"

86
CALCULATION OF CONCRETE PAVEMENT THICKNESS (Use with Cose I Single e Tandem Ai1le Design Charts) Project Design EKample - 1933 PCA
T)'pe No. of Lones -------
Sub9rode k __ 1~o~o __ pcl. 1 Subbo•• ------,.-,,..-----------Combined k 130 pci., Load Sof•ty Factor ___ l_._2 _____ ( L.S.F.)
PROCEOURE
L Fill in Col.1,2 and 6, lietino Ollie loads in decreasing order. 2.Assume lat trial depth.Use 1/2-in,lncrements. 3.Anolyze lat trial depth by completing columns 3,4,5 and 7. 4.Anolyze other trial de1>th9 1 voryino M. R~ slob depth and subbote type~*
I 2 3 4 5 6
Axle Axle Stress Stress Allowable Expected Loodt Loads Ratios Repeti1ions Repetitions
x t.. S.F. kips kips pai No. No.
7
Fatigue Resistance 1 -
Used••* percent
Trial depth_-""'""'----in. M.R~--"-6"-00"---P•i •--"1"'30,__pci
SINGLE AXLES
30 36.0 000 .53 .,..., "".Q __ 1,_ZOJL 4.8 .. _ .. 28 33.6 300 sn Unlimited 1 ;no
TANDEM AXLES 54 64.8 150 39 000 • ·-:i. 7An 9 , 52 62.4 340 .57 43 nno 1 000 8.6 -so ,o n "n " 59 non O< Ooo " ' 48 57.6 320 " " 000
O< o;o , ; ' 46 55.2 310 . 52 SA O"" s 7 530 65.4 __ c-·----11!1 52.8 300 .so Unlimited 179 790 -----··---
,_
-·--···
Total 196.9%
" M. R. Modulus of Rupture for 3rd pt. loading.
** Cement- treot•d su~boset result in greatly increased camt:>ined k values.
*** Total fOtigue re1i1tonce used should not e11.ceed about 125 perctnt.
"

87
CALCULATION OF CONCRETE PAVEMENT THICKNESS (Ute with Case I Single 6 Tandem A~le Deelon Charts) Project Design Example.- 2.8% Air
Type----- -------------- No. of L.on•s -------Suborode k _ _,1,,0,,;o __ pct, Subbo•• ------~-,------------Combined Jc I 30 pcL, t.ood Safety Factor ___ 1_·_2 ____ ( L.S.F.)
PROCEDURE
L Fill in Col.1,2 and 6 1 listing air.le loads in decreoeing order. 2.Atsumt ltt trial depth. Use 1/2 #In, increments. 3.Anolyze let trial depth by completing columns 3,4,'5 and 7. 4.Analyze oiher trial depths, varying M.R~ alob depth and 1ubba11 type~·
I 2 3 4 5 6
Axle Ax.le S1rtt.t. St res• A\\ow·oblt E11:pected Loads Loadt Ratios Repetition• Repetitions
x L.S.F. kip• kipa psi No. No.
7
Fatigue Realatance Used••* percent
Triol d•Plh __ 9~·~5 ___ in. M.R~ 700 psi k--1~3~0~- pci
SINGLE AXLES 30 36.0 320 < <n Unlimited - ~ - -· 28 33.6 '°" 26 31.2
- -
TANDEM AXLES S4 64.8 350 < '" Unlimited 52 62.4
. -340
50 60.0 330 ·-48 5 7. 6 32n 46 f-·---- 55.2 310
~---·~--
--·---··
.. Total None M. R. Modulus of Ruptur• for 3rd pt. loading.
*" Cement- treated sub base• result in or•otly increased co~blned k values.
*** Totol fotigue resistance used thou Id not eKceed obou1 125 percent.
"
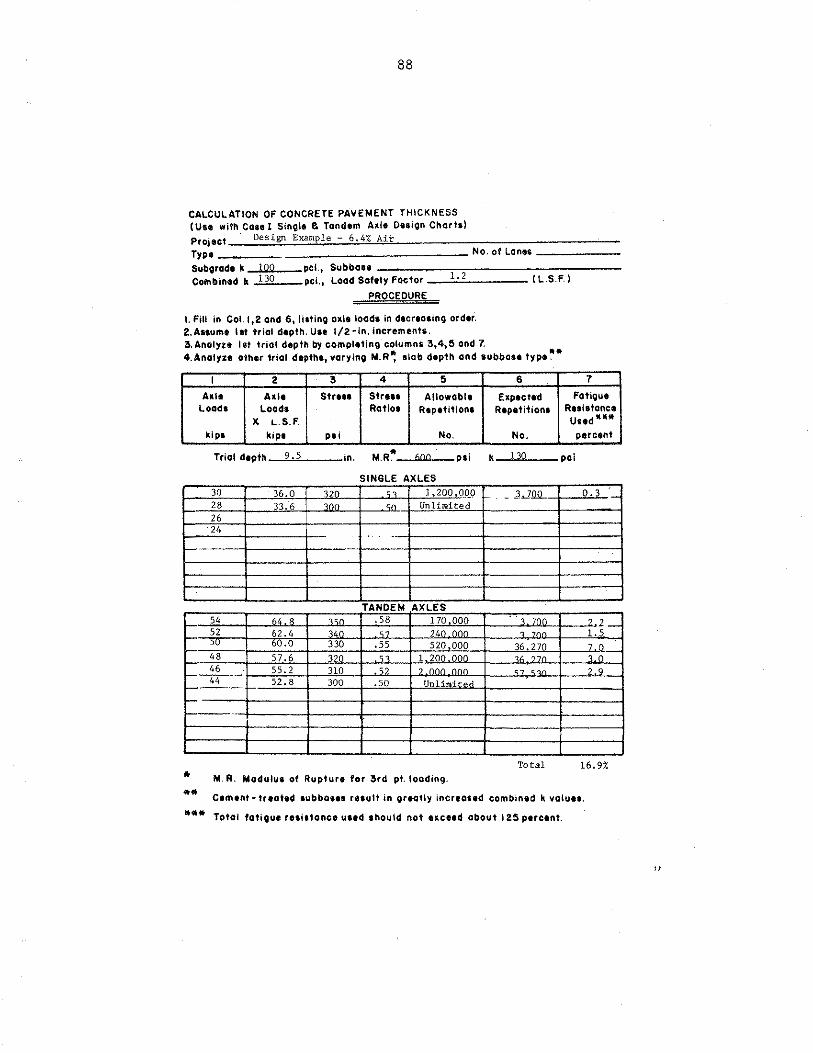
88
CALCULATION OF CONCRETE PAVEMENT THICKNESS (Use with Coao I Sinol• e. Tandem Axle Oesion Chort1)
Proj act _._;:D•;::s::.;':;· gn;:;__;E~xa~mpi;.l~e;_;-=--'6'-'.-"4-"'%~A"''"-. r;:.· -------::---;-:-------~Type------------------- No. of Lones -----Suborodt k ~l"O"o __ pcl., Subbooe -------.,-....,------------Cornbined k 130 pcl. 1 Load Safety Factor _ _;:1.:.·"2----- ( L.S.F.)
PROCEDURE
1. Fill in Col. 11 2 and 6 1 listing axle loads in decreasing order. 2.Aasurnt let trial depth.Utt 1/2~1n.increments. 3.Anotyze lat trial depth by comple1inQ columns 3,41 5 and 7. 4.Anoly1e othtr 1riol dtptht, varying M.R~ slob depth and aubbate type~*
I 2 3 4 5 6
Axl• Axlt Stress Str111 Allowable Exptcte·d Loads Load• Ratios Repetition• Repetitions
)( L.S.F. kip• kip• psi No. No.
7
FotiQut Rtaiatonce Used••• percent
Trial depth-~9".~s'----in. M.R~ __ 6.,,o.uo..__pai k_,.1_.30,_ __ pci
SINGLE AXLES 30 36.0 320 "' l ,200 QQQ - ' - JJ.Q.Q_ 0.3 -28 33.6 ''°" "" Unlimited 26
. 24
- .
TANDEM AXLES S4 64 • 0 00 .SB 170 000 •. 1. ''"' '2_ S2 62.4 "·" "" 2'0 Mo 0 - L< JV oO.O 330 .SS 520 000 36 270 - 0
48 S7. 6 320 -- 1 200 0011 °' ' 0 46 SS.2 310 - .S2 ? '"'" """ -- 2 Q 44 52.8 ---·-- 300 .50 Unlimi'*""A
-____ ,,
Total 16,9% .. M. R. Modulus of Rupture for 3rd pt. loading . ... Cement· treated subbote• result in greatly incrtoted combined k values.
*** Total fatigue re1i1tonce used should not eit.ceed about 125 perctnt.
"

89
CALCULATION OF CONCRETE PAVEMENT THICKNESS (Uat with Coee t Single Q Tandem Axl• De1ion Charts)
Projoct~--~D~e~s~i~gn"--'E~xga~m~p~l~e--;:...lLll.'-'1~%.-AAiiLr----------------
Type -----· --------------- No. of Lones ------Suborode k _ _.1.,0,,_o __ pcl.; Subbot& --------------------Combined k 130 pcL, Lood Safety Factor _c:1c.:·.=2 ______ ( L.S.F.)
PROCEDURE
I. Fill in Col.1 1 2 ond 6, littino axle loads in decreasing order. 2.Assumt 1st trial depth.Ult 1/2~in.incrementt. a.l\nol,-1• lt.t tr\ol depih by comp\etino columns ?>,4,5 and 7. 4.Anolyz.e oiher triol dtptht, varying M.R~ slob depth and 1ubbo11 typt ~*
I 2 3 4 5 6
A•lt Axle Streat Str111 Allowable Expected Loads Load• Ro'tios Repetition• Rtpetitiona
x L.S.F. kips kip• psi No. No.
7
Fatigue Rtaietonce Used""* pereent
Trial depth_-'-....,_ ___ in. M.R~ 500 psi k __ ..,.,__pci
SINGLE AXLES
30 36,0 ''" .64 onoo ..:l.,200. 46.3 ._ . 28 33.6 000 '" 39 000 '000
q ' 26 31. 2 285 . " 140.000 7 1.1/\
' 1 24 28. 8 2.70. .. ,54.__ ___ !350~90 195 000 22.9 22 . ,..... 26.4 "" <n u~.12.n,i_:U:_~a
TANDEM AXLES 54 64.8 om '° Ooo ".".I .,,..,,... 462.5 ·-52 62.4 34° '° , 000 ' "' OM '
50 60.0 000 ,, 3 600 " nn 10fl7,)_ 48 57. 6 320 "· o nnn '' /,<;".I /,
46 55.2 310 .62 p 000 57 530 "Ll-,_ ____
41, 52.B 300 .60 1Q noo 179 790 '·"'' fl r----z-z- 50.4 287 .57 140.000 204 750 1 46 1 ...... 40 48.0 280 " 210 (\/"\(\ '°' 1.00 141.1 f--rir-·· 45.6 267 .53 1 400 (\(\(\ "" onn 22.8 36 41 2 O<n ~ '" Unlimi'""";. 34 .
.. Total 3322.6% M. R. Modulus of Rupture for 3rd pt 1oodin9 .
•• Cement - treoted 1ubbos•• r•tult in oreo11y increoctd combined k volutl.
••• Total fatigue re1i1tonco used thou Id not exceed about 125 percent.
"

90
CALCULATION OF CONCRETE PAVEMENT THICKNESS (Use with Coae 1 Singlo e. Tandem Axle Oealon Charts)
Project Design Example - 1933 PCA
Type-------------------- No. of Lones ------Subgrodt k _ _.j i;.oo.,__pcl., Combined k 130 pcl.,
Subbast ------·--------------L.ood Saftty Foctor _ _.1"."'~---- ( L.S.F.)
PROCEDURE
I. Fill in Col.1,2 and 6, listing oxlt loads in dtcr101in9 ordtr. 2.Assumt ltt trial dtpth.U1e 1/2-in,increments. 3.Analyzt ltt trial depth by complt1inQ columns 3,4,5 and 7. 4.Anolyz.e other trial dtpth1, varying M.R~ slob depth and aubboat type~*
I 2 3 4 5 6
Alli le Axlt Str111 Stro11 Allowable Expected Loads Load1 Ratio• Reptti'tions Rtpttitiont
x L.S.F. kips kip• psi No. No.
7
Fatigue Rtsietonct
Used ••tt percent
Trial dtpth __ ~lO~.O~--in. M.R~--'""'--Pli k _ _,1_.3,,_o __ pc i
SINGLE AXLES 30 °' " <-""" < "" .... '4 _;... • - - - -28 " h 26 31. 2 24 28.8 22 26.4 20 24.0
TANDEM AXLES 54 64.8 "" " 59 .ooo 3 700 6~.3-52 62.4 320 .53 77 000 '""° '· 0 50 60.0 310 .52 00 Mo -· '" ,,, ' 48 57.6 300 .so Unlfm; ~ -" 46 55.2 -----44 52.8
~~--~--so.'~ -r-_j.Q_ __ 48.0
.
.. Total 52.3% M. R. Modulus of Rup,ure for 3rd pt. loading . .... Cement-treated subboses result in greatly increased combined k values.
*** Toto! fatigue resis1once used should not exceed obou't 125 perctnt.
"

91
CALCULATION OF CONCRETE PAVEMENT THICKNESS (Use with Coue I SlnQI• e. Tond111m Axle Desi on Charts) Project . Desigp Example - 2.8% Air
Typo-------------------- No. of Lones-------
Sub9rode k -~l~O~o~_pcl., SubbO•• --------------------Combln•d It --'~3~0 __ pci., Load Safety Factor ___ 1c..·-2 _____ ( L.S.F.)
PROCEDURE
I. Fill in Col. 1,2 and 6, lilting oxlt loads in decreoaing order. 2.A11um• lat trial depth. Use 1/2-ln, increments. 3.Anolyz:e let trtot depth by compttth\Q cohunnt !,4,5 ond 7. 4.Anolyz.e other trial depths, varying M.R~ slab depth Qnd 1ubba1e typt ~*
I 2 3 4 5 6
Axle Axle Stre11 Streea Allowable Expected Loads Loads Ratio• Repetition• Repetition•
)( L.S.F. kips kipt pai No. No.
7
Fotiou• Reaiatonct Used"** percent
Trial dtpth-~7~·~5 ____ in. M.R~--7uO~o~_pti k-~'~3~0 __ pci
SINGLE AXLES
30 "' 0 ' ' " 1 7f'I o.ou __ J., 700 ? ? .·-. 28 33.6 420 <o .. ,.,,.. ,..,..,..,
' OAA o.< 26 31. 2 396 " 4 700 ,..,,..,.., "1 ,_ "' 0.? 24 28.8 '7.3. ·" 10 ono """ 22 26.4 ,,,0
< '" Unlimited
TANDEM AXLES 54 « 0 '·°" '" 11 OM ' "" ;:,~ 52 "' " ' h7 27 000 ' 000
50 60.0 450 "· 1(1(1 """ " "" ~>:;-48 57 .h "0 "' 170 000 1" no
-· 46 " ' '00 .60 740 f'lf'U"l '7 000 7._i._ 44 52.8 4"' <o 2 200 f'lf'lf'I '00 OoA 8.2 --42-· 50.4 390 .56 10 "'"' "'"' 204 750 2.0 - 40 48.0 ---- .. 375 .54 )IQ 000 """ 38 45.6 "o " 36 43.2 '"" <. <O ····' , .
* Total 124.8%
M. R. Modulu• of Rupture tor 3rd pt. loading.
Cement M treated subbo1e1 result in greatly increased combined k values.
••• Total fatigue resistance used 1hould not exceed about 12:5 percent.

92
CALCULATION OF CONCRETE PAVEMENT THICKNESS ( Uae with Cose I SinQlt e Tandem Axle Oesion Chor ts)
Project ____ n_e_s~i~g~nc..::E~xa~m~p~l~e~·-~6~·~42%~A~,~·r'------------------Type ----- --------------- No. of Lanes -------Suborodt k __ 1_oo __ pcl. 1 Subbo•• -------,.-,,------------Combined k 130 pci.
1 LoodSofetyFactor ___ 1_·2 ____ (L.S.F.)
PROCEDURE
1. Fill in Col.1,2 and 6 1 lietino all.le loads in decreaaing order. 2.Assume 1st trial d1pth. Use 1/2-in. Increments. 3.Analyze ltt trial depth by completing columns 3,4,5 and 7. 4.Anolyz.e other trial dtptht, varying M.R~ slab depth and aubbaae type~*
I 2 3 4 5 6
Axle Axle Street Streta Allowable Eitpecttd Load a Load• Ratios Repetitions Repetition•
x L.S.F.
kip• kip• pai No. No.
7
Fatigue Reaiatonce Used 11:•• percent
Trial dtpth-~9~.o~---in. M.R~--6~0~0 __ pti k-~-~-pci
SINGLE AXLES
30 O< 0 0 0 .57 2<;f'l f'l('\0. i,.zoo_ 1.5.~_ -- . -28 33. 6 '2" "· 850 "'"' , "- 0.4 26 31.2 30• " 2,600.000 7 1.1,., o., 24 28.8 "">QQ, .. .<,.,_t;f'l Unlimit~..i
22 26.4 ,..... 20
TANDEM AXLES 54 64.8 ,00 30 ono .. .., -,,.,,.,
lZ·L " 62.4 365 . 61 62 OM ' "'" 6.0 50 60.0 '" <Q 120 f'lflf'I " """ 30.2 48 5 7 .6 346 '° 180 on,., "' """ ""-2
__ 4_6 __ 55.2 000 -- 530 (\f'lf'I °' <oo l.Q...L 1,4 52.8 318 " ' - l ~n ~~~ 1 "l. i'I
-~-z;y-.. --50.4 308 .51 2,600.000 204 750 7.9 - 40 ------ 48.0 295
.
<.. 50 "- 1 !m1
.. Total 103.5% M. R. Modulus of Ruptur• for 3rd pt. loading . ... C•mtnt-treoted subbos•• result in grtotly increosod comtiined k values.
*** Toto! foti9ue re1i1tonce used should not eiceed obout 125 percent.
"

93
CALCULATION OF CONCRETE PAVEMENT THICKNESS (Uat with Cose I. Sinol• e. Tandem Alllle D••ion Chor ta) Project Design El)ample 11.3% Ajr
Type No. of LO net -------
Sub9rcide k 100 pcl., Subbo•• ------...,-...,,.------------Combined k 130 pcl., Load Safety Factor c1:.:·.;;2 ____ ( L.S.F.)
PROCEDURE
I. Fill in Col. 1,2 ond 6, liatino ode loads in clecr101ing ordtr. 2.Assumt lat trial depth. Use 1/2 ~In. increments. 3.Anolyz:e 1st trial dtpth by complttino columns 3,4,6 and 7. 4.Anolyze other trial depths, varying M.R~ slob depth and 1ubbo•• type~*
I 2 3 4 s 6
Aalt Aalt Stress Str111 Allowable Expected Load• Loads Ratio• Rept1itiont Repetitions
x t....S.F.
kip• kip• psi No. No.·
1
Fatigue Rt1i•tonce Used••• percent
k --'"30"'--- pc i
SINGLE AXLES 30 36.0 276 " 330.0Q_Q - _;wQ.Q 1.1 -28 33.6 "'" '" ' ' 1 700 1
26 31.2 ' <.so
,_
TANDEM AXLES 54 64. 8 700 ,,
'7 7 700 21,!L_ 52 62.4 298 .60 ,,0 AOO 1 700 a o
50 60.0 290 . ,. . "" -- 7' - 770 7< 1
48 57.6 zoo « zoo AAA 36.770 '0 ' 46 55.2 269 .54 500 000 57 "" ,, ' f------44 52.S 261 .52 , ~ ,.,,., """ l 7Q ..,,"'
" 7 ,_ 42 50.4 250 < .50
~
f------·
.. Total 114. 7% M. R. Modulus of Rupture for 3rd pt. loading.
cement~ treated 1ubbo1e1 retult in Qreotly increased combintd k values.
*** Total fatigue re1i11ance used should not eitceed abou't 125 perctl'it.
"


![Effect of entrained air voids - CORE · 2017. 2. 18. · 61 study, Toutanji [10] measured the AASHTO T277 rapid chloride permeability (RCP) of concrete containing 2-15% 62 entrained](https://static.fdocuments.net/doc/165x107/610e8f1918b2e3096a7c464d/effect-of-entrained-air-voids-core-2017-2-18-61-study-toutanji-10-measured.jpg)