Fatigue and fracture behavior of A516 steel used in thick...
46
1 Fatigue and fracture behavior of A516 steel used in thick-walled pressure vessels Hossein Ghasemi 1,* , Reza Masoudi Nejad 2 , Ahmad Jalayerian Darbandi 3 , Yaghoub Tadi Beni 4 , Mahmoud Shariati 5 1 Department of Mechanical Engineering, Foolad Institute of Technology, Fooladshahr, Isfahan, 84916-63763, Iran, Tel:+ 989217764539 2 Department of Mechanical Engineering, Foolad Institute of Technology, Fooladshahr, Isfahan, 84916-63763, Iran, Tel:+989399935405 3 Faculty of Engineering, Department of Mechanical Engineering, Ferdowsi University of Mashhad, Mashhad, Iran, Tel:+989156198038 4 Faculty of Engineering, Shahrekord University, Shahrekord, Iran, Tel:+989126385016 5 Faculty of Engineering, Department of Mechanical Engineering, Ferdowsi University of Mashhad, Mashhad, Iran, Tel:+989121733750 Abstract In this paper, the growth of semi elliptical crack in the walls of thick walled cylindrical pressure vessels has been investigated. Considering the importance of the crack growth problem in cylindrical pressure vessels provides a numerical and experimental 3D model for the growth of fatigue crack and estimating the fatigue life of pressure vessels. Because of available geometric geometric and physical parameters, it can be predicted the problem of the fatigue life of these pressure vessels more precisely in comparison with existing standard tests which are experimental and numerical. A most common specimen of thick walled tanks, steel, is analyzed for conducting experimental tests. The mechanical properties and fatigue behavior of A516 steel have been determined experimentally. For estimating the crack growth and calculation of fatigue life, boundary element method and linear fracture mechanics equations have been used. Finally, the experimental results for fatigue crack * Corresponding author. Tel.: +989217764539, E-mail addresses: [email protected].
Transcript of Fatigue and fracture behavior of A516 steel used in thick...
1
Fatigue and fracture behavior of A516 steel used in thick-walled pressure
vessels
Hossein Ghasemi1,*
, Reza Masoudi Nejad2, Ahmad Jalayerian Darbandi
3, Yaghoub Tadi
Beni4, Mahmoud Shariati
5
1Department of Mechanical Engineering, Foolad Institute of Technology, Fooladshahr,
Isfahan, 84916-63763, Iran, Tel:+ 989217764539
2Department of Mechanical Engineering, Foolad Institute of Technology, Fooladshahr,
Isfahan, 84916-63763, Iran, Tel:+989399935405
3Faculty of Engineering, Department of Mechanical Engineering, Ferdowsi University of
Mashhad, Mashhad, Iran, Tel:+989156198038
4Faculty of Engineering, Shahrekord University, Shahrekord, Iran, Tel:+989126385016
5Faculty of Engineering, Department of Mechanical Engineering, Ferdowsi University of
Mashhad, Mashhad, Iran, Tel:+989121733750
Abstract
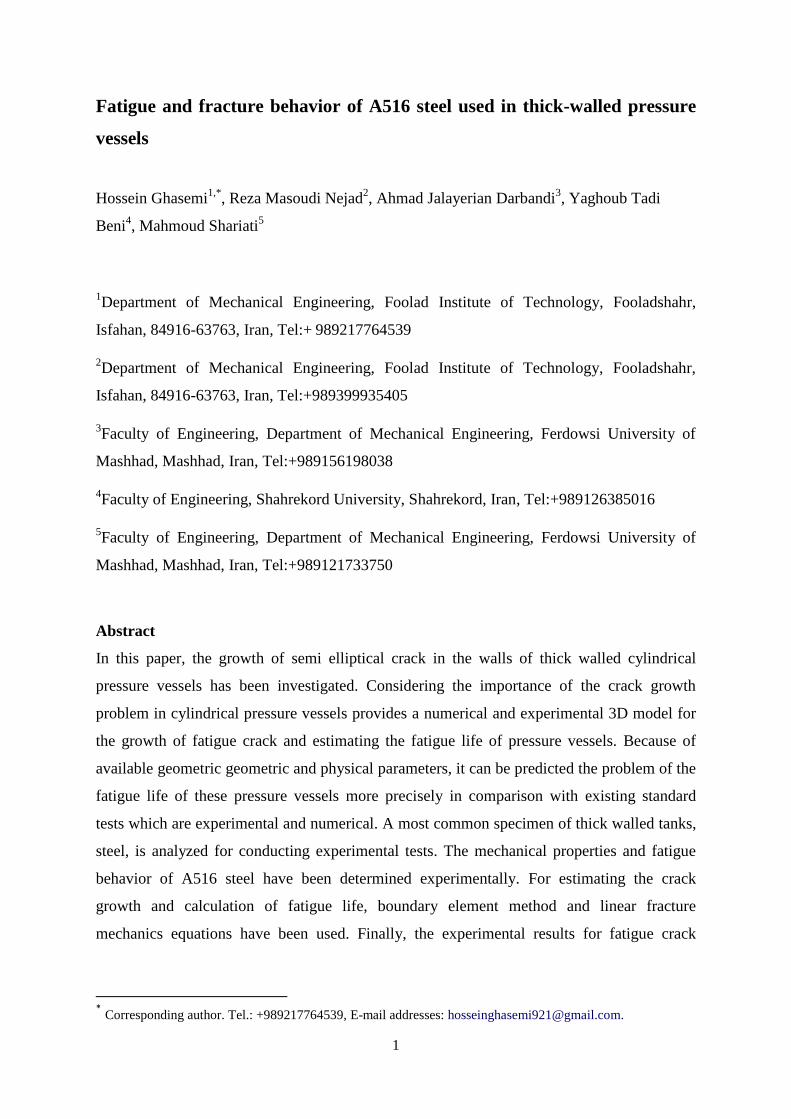
In this paper, the growth of semi elliptical crack in the walls of thick walled cylindrical
pressure vessels has been investigated. Considering the importance of the crack growth
problem in cylindrical pressure vessels provides a numerical and experimental 3D model for
the growth of fatigue crack and estimating the fatigue life of pressure vessels. Because of
available geometric geometric and physical parameters, it can be predicted the problem of the
fatigue life of these pressure vessels more precisely in comparison with existing standard
tests which are experimental and numerical. A most common specimen of thick walled tanks,
steel, is analyzed for conducting experimental tests. The mechanical properties and fatigue
behavior of A516 steel have been determined experimentally. For estimating the crack
growth and calculation of fatigue life, boundary element method and linear fracture
mechanics equations have been used. Finally, the experimental results for fatigue crack
* Corresponding author. Tel.: +989217764539, E-mail addresses: [email protected].
2
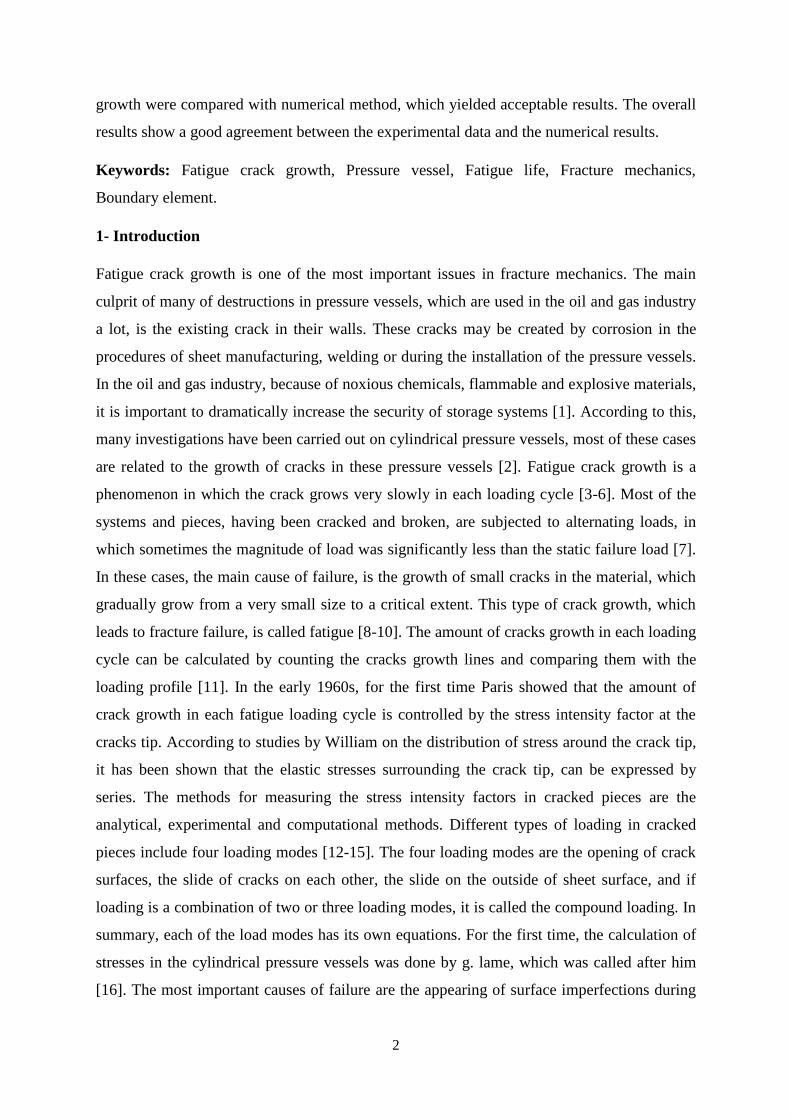
growth were compared with numerical method, which yielded acceptable results. The overall
results show a good agreement between the experimental data and the numerical results.
Keywords: Fatigue crack growth, Pressure vessel, Fatigue life, Fracture mechanics,
Boundary element.
1- Introduction
Fatigue crack growth is one of the most important issues in fracture mechanics. The main
culprit of many of destructions in pressure vessels, which are used in the oil and gas industry
a lot, is the existing crack in their walls. These cracks may be created by corrosion in the
procedures of sheet manufacturing, welding or during the installation of the pressure vessels.
In the oil and gas industry, because of noxious chemicals, flammable and explosive materials,
it is important to dramatically increase the security of storage systems [1]. According to this,
many investigations have been carried out on cylindrical pressure vessels, most of these cases
are related to the growth of cracks in these pressure vessels [2]. Fatigue crack growth is a
phenomenon in which the crack grows very slowly in each loading cycle [3-6]. Most of the
systems and pieces, having been cracked and broken, are subjected to alternating loads, in
which sometimes the magnitude of load was significantly less than the static failure load [7].
In these cases, the main cause of failure, is the growth of small cracks in the material, which
gradually grow from a very small size to a critical extent. This type of crack growth, which
leads to fracture failure, is called fatigue [8-10]. The amount of cracks growth in each loading
cycle can be calculated by counting the cracks growth lines and comparing them with the
loading profile [11]. In the early 1960s, for the first time Paris showed that the amount of
crack growth in each fatigue loading cycle is controlled by the stress intensity factor at the
cracks tip. According to studies by William on the distribution of stress around the crack tip,
it has been shown that the elastic stresses surrounding the crack tip, can be expressed by
series. The methods for measuring the stress intensity factors in cracked pieces are the
analytical, experimental and computational methods. Different types of loading in cracked
pieces include four loading modes [12-15]. The four loading modes are the opening of crack
surfaces, the slide of cracks on each other, the slide on the outside of sheet surface, and if
loading is a combination of two or three loading modes, it is called the compound loading. In
summary, each of the load modes has its own equations. For the first time, the calculation of
stresses in the cylindrical pressure vessels was done by g. lame, which was called after him
[16]. The most important causes of failure are the appearing of surface imperfections during
3
production and corrosion of pressure vessels inner surface, because of an inappropriate acidic
environment or the oxidation of that area in the presence of a specific substance inside the
pressure vessel. Because of these corrosions, on the surface, fine imperfections are formed as
a line of small porosities which cause a stress concentration in the corrosion zone. In many
cases, when the pressure vessel has a weld line, failures will begin from those surface
imperfections which occurred on the weld line during welding. These superficial surface
defects are the source of semi elliptical cracks growth and development that grow to some
extent, then join each other and form a single crack [17]. Surface cracks under tensile load,
grow in the form of elliptical shape on a thick wall. These walls can be flat, cylindrical or
spherical. Because of the complicated structure of semi elliptical cracks growth on curved
surfaces, for facilitating, crack growth in the flat wall is also considered as an approximation
of crack growth in the curved walls, however, by increasing wall thickness and curvature of
pressure vessel surfaces, these approximations are not very accurate and reliable. In [18], an
attempt has been made to improve these approximations for a cylindrical pressure vessel by
using weight functions. The required calculations for finding the stress intensity factor were
calculated on a perimeter of a semi elliptical crack in a flat plate under the tensile load. The
existing equations are presented in [19], which are used for calculating the stress intensity
factor at the crack tip in a radial direction. Also, Newman and Raju have proposed the
equations in [20] for calculating the stress intensity factor on a perimeter of a semi elliptical
crack in a pressure vessel. In calculations of pressure vessels designing and, in general, any
other structures, there are mainly two criteria for avoiding failures which should be
considered. First, the stress intensity factor should not reach critical value, and secondly, the
stress applied to the uncracked section should not exceed the critical stress or in other words
should not reach the plastic deformation region. In order to achieve this purpose, the
relationship between the stress intensity factor during failure and the amount of stress at the
time of failure can be found by using the experimental data obtained from many failures.
Also, failure-resistance can be predicted for every situation. The results of these studies [21,
22] show that when the pure stress of fracture is less than the flux stress, a linear equation
between maximum stress intensity factor and amount of stress at the time of failure can be
identified [23, 24]. In the literature, various problems concerning the fatigue crack growth
under pure mode conditions (modes I, II, III) can be found, such as reported by Silva et al.
[25] or Rozumek et al. [26] and Lesiuk et al. [27]. Correia et al. [28] and Abílio et al. [29]
have used fatigue local models based on strain and SWT relations to model the fatigue crack
propagation curves. Correia et al. [30-33] proposed a procedure for a modification of the
4
UniGrow model which uses an elementary material block size, which is obtained from
existing FCG data.
In experimental tests, the geometry of standard specimens has always been used as the basis
for measuring experimental data. In this paper, experimental data is obtained by using
standard specimens and a new confirmed standard specimen that is more accurate. The
methods of fatigue cracking test and the way of displaying and processing test data are
presented in different standards [34]. The study of crack growth behavior is carried out by
using the rules and equations of linear elastic fracture mechanics under fatigue loads. For
analyzing of crack growth, it has been used boundary element method. Then, the Paris law
was used to obtain fatigue life [35]. The intensity factor mode I which is created in cracking,
are more important than the other factors, calculated by numerical method [36].
2- Materials and Methods
Mechanical properties including hardness, tensile, Charpy impact and fatigue growth tests
has been carried out at room temperature. For this purpose, A516 steel is used because it is
the kind of steel which has been used to manufacture thick walled pressure vessels. To
determine material elements and by using a metallographic method and observing atomic
microstructure in non-destructive methods, including the use of quantum devices, it can be
determined the initial operations, such as thermal operations and the basic state of the
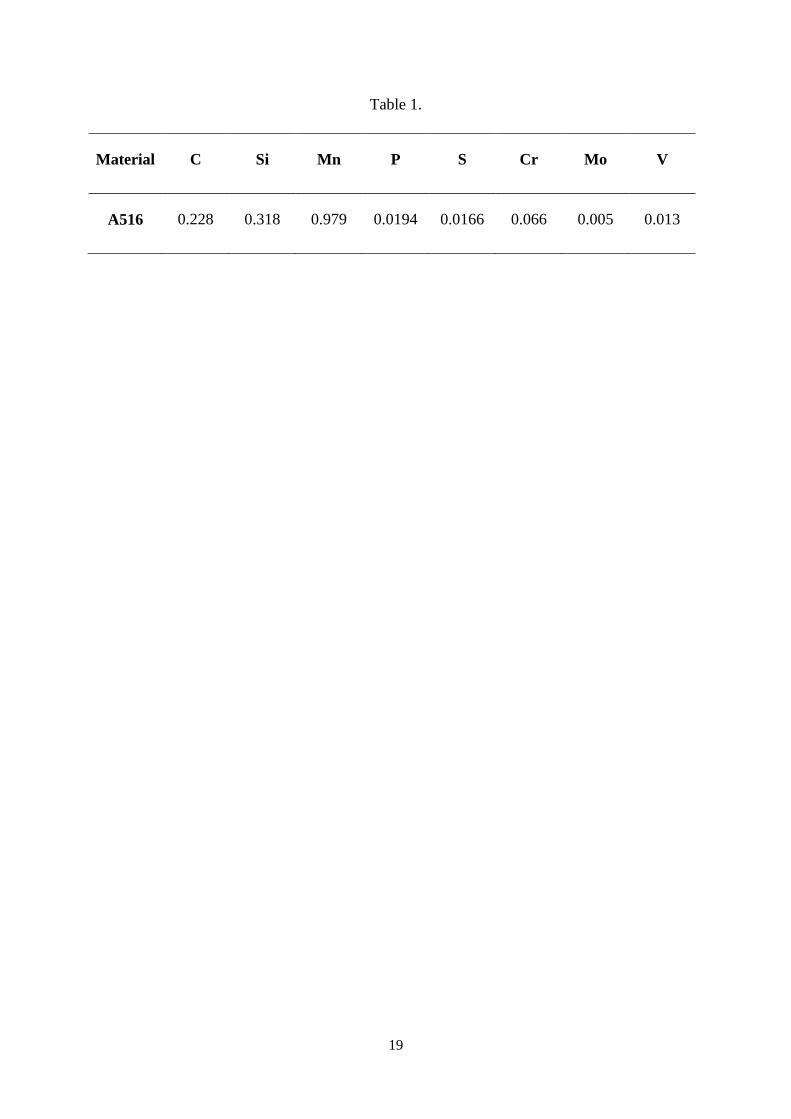
material. By testing, the elements of A516 steel are determined and presented in Table 1.
Placement of Table 1
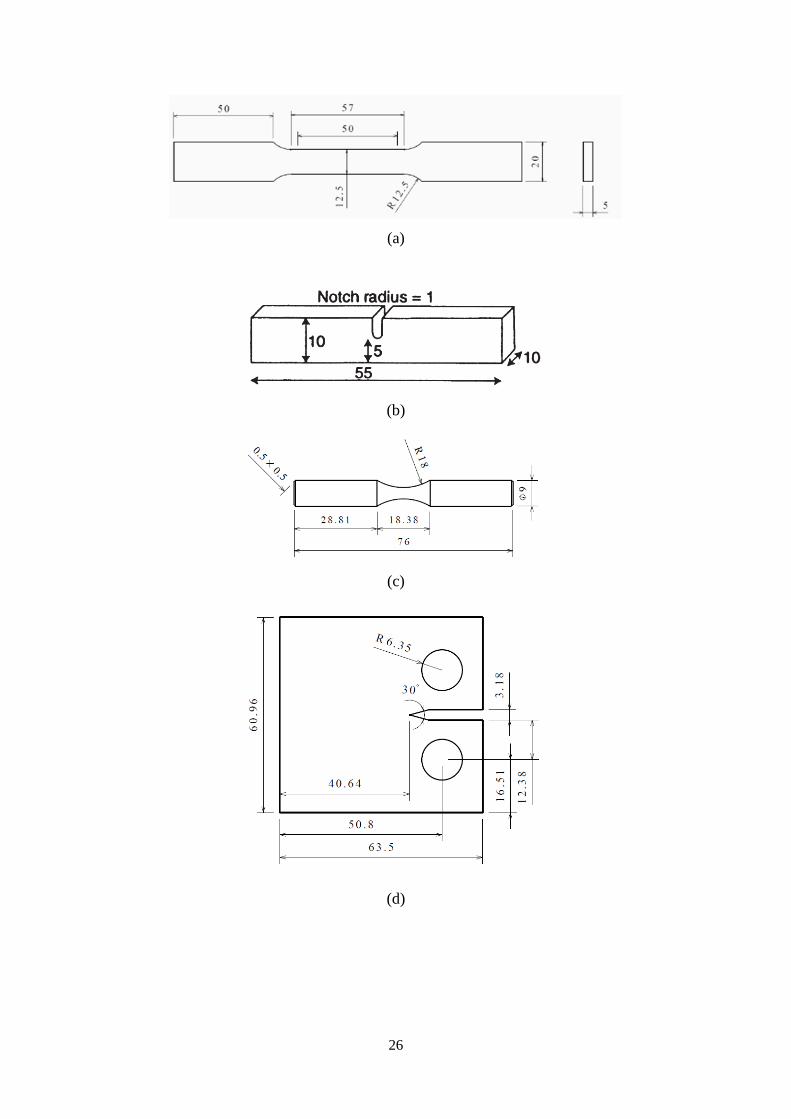
To extract the mechanical properties of A516 steel the tensile test was performed. According
to standard tensile test ASTM E8 [34] specimens as shown in Figure 1.a were machined and
were ready for testing. Mechanical properties including yield strength, ultimate tensile
strength, relative elongation and Elastic modulus, E, were calculated according to strain-
stress curves. Impact resistance of most materials has a direct relation with their malleability.
The Charpy impact test was performed according to the ASTM E23 standard at room
temperature [37]. For all tests, the impact velocity during impact should be a constant
number. The impact velocity in this method is 5-5.5 m/s. For this test, specimens were
manufactured with standard dimensions and V-notch for specimens was formed by standard
device. The initial angle for the pendulum velocity of 5 m/s is 134 degrees. Figure 1.b shows
the standard specimen of Charpy impact test. To perform a hardness test, the hardness tester
was first calibrated, and then a part of the steel was placed under the device. According to the
5
ASTM E10 standard, a 2.5 mm ball bearing was used. According to the ASTM standard
tables for a 2.5 mm ball bearing, and the Brinell hardness test method, a force of 187.5 kg
was chosen [38]. Rotating bending fatigue test was performed to extract fatigue behavior of
A516 steel. Fatigue tests under time-control conditions at room temperature and in order to
get the S-N curves have been done in fatigue mode. These curves are plotted in the conditions
of the recurrent variable stress cycles (i.e., 0m ). The amount of stress can be a or
max .
Rotating bending fatigue tests can be performed with different specimens. According to the
ASTM E466 standard, the fatigue test specimens are ready to be tested according to Figure
1.c [39]. In S-N curve, which shows the fatigue strength in terms of the number of cycles,
under the 310 cycles, is called Low-Cycle Fatigue and above that is High-Cycle Fatigue. On
the other hand, under 610 or 710 cycles, the specimen has a finite life (due to the high operating
stress) and above 610 cycles, the specimen will have an infinite life. For this test, 10
specimens were manufactured with the standard dimensions by CNC machine and excellent
surface quality.
In the fatigue crack growth the ratio of changes in the cracks length to the changes in the
loading cycle (dN
da) show the amount of crack growth in each loading cycle. In the early
1960s, for the first time Paris showed that the amount of crack growth in each fatigue loading
cycle is controlled by the stress intensity factor at the crack tip [40, 41]. For the first time,
Paris showed that dN
daK , quantities can be in the form of an exponential equation like Eq.
(1):
nKCdN
da)( (1)
In which n and C are the material constants dependent on the material fatigue crack growth
under tensile load when Rratio = 0.
To investigate the fatigue crack growth, the test specimens can be of the compact tension
C(T) type, or sheet with a central crack. This test is usually carried out under constant loading
in which the maximum and minimum loads are constant during the experiment. According to
the ASTM E647 standard, the dimensions of C(T) specimen are shown in Figure 1.d [42].
Although the above specimens have already been used as a standard approximation for
predicting the cracks behavior in pressure vessels, either semi elliptical or general, but in fact
there is a significant difference between the life of a pressure vessel containing a semi
6
elliptical crack and standard specimens under the conditions of the same crack growth, which
is because of the difference between the fatigue crack growth behavior in a pressure vessel
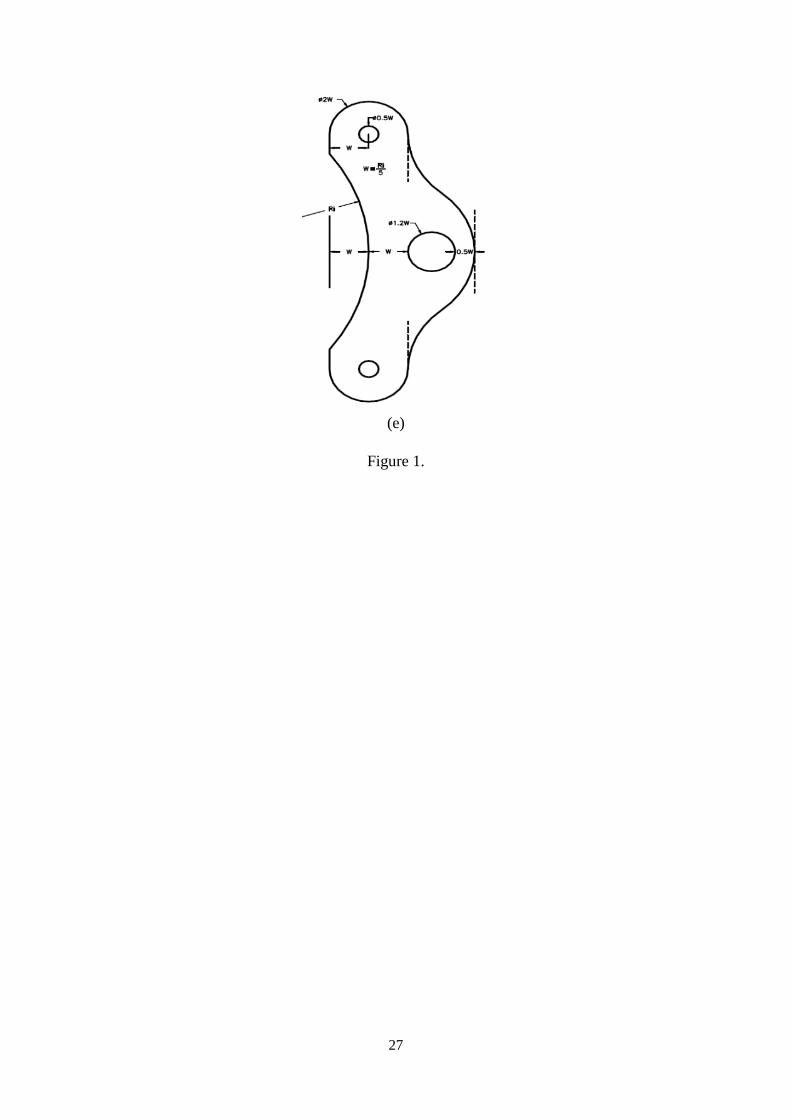
and current standard specimens. For this reason, by using the research carried out in [43], it
has been proved that the new proposed specimen is closer to the actual situation. Thus, using
the geometry of new specimen for A516 steel, which is most used in the pressure vessels
manufacture, crack growth test was also performed with the new specimen. Figure 1-e shows
the new specimen geometry [44].
Placement of Figure 1
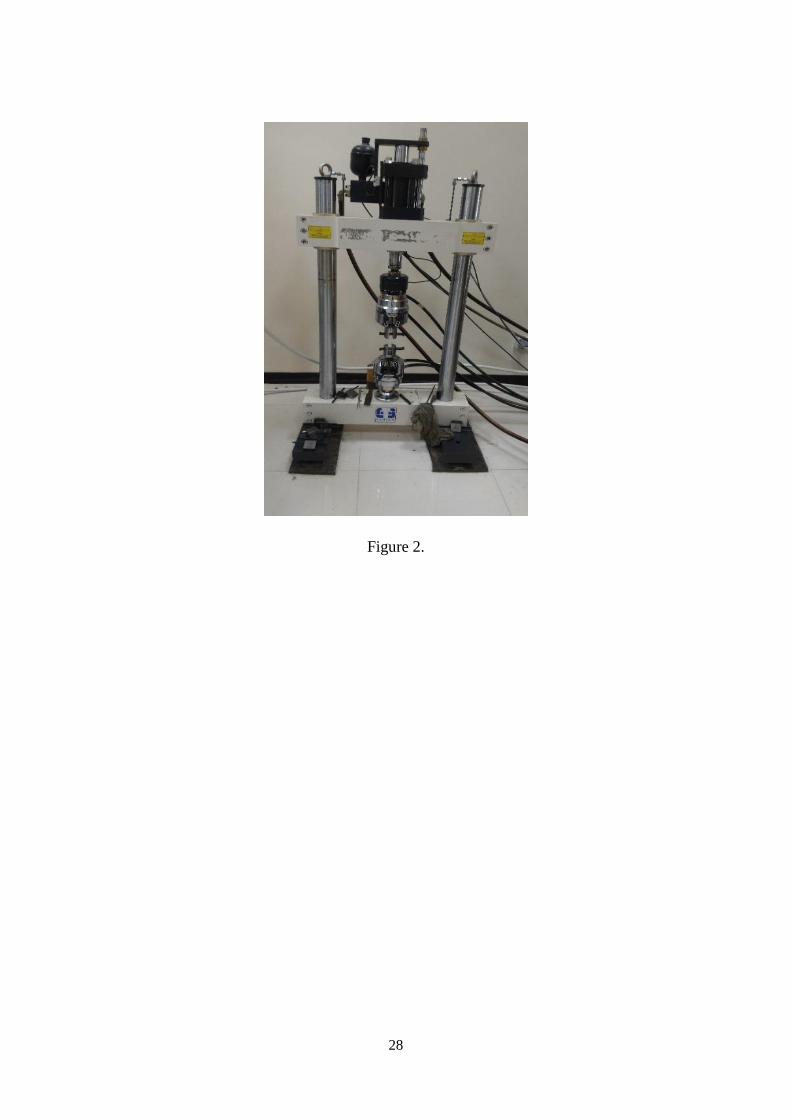
To perform this test, the Santam hydraulic device was used. This device is controlled by a
computer and has the ability to load up to 50 kN with a frequency of 10 Hz. Figure 2 shows
the Santam Fatigue Test device.
Placement of Figure 2
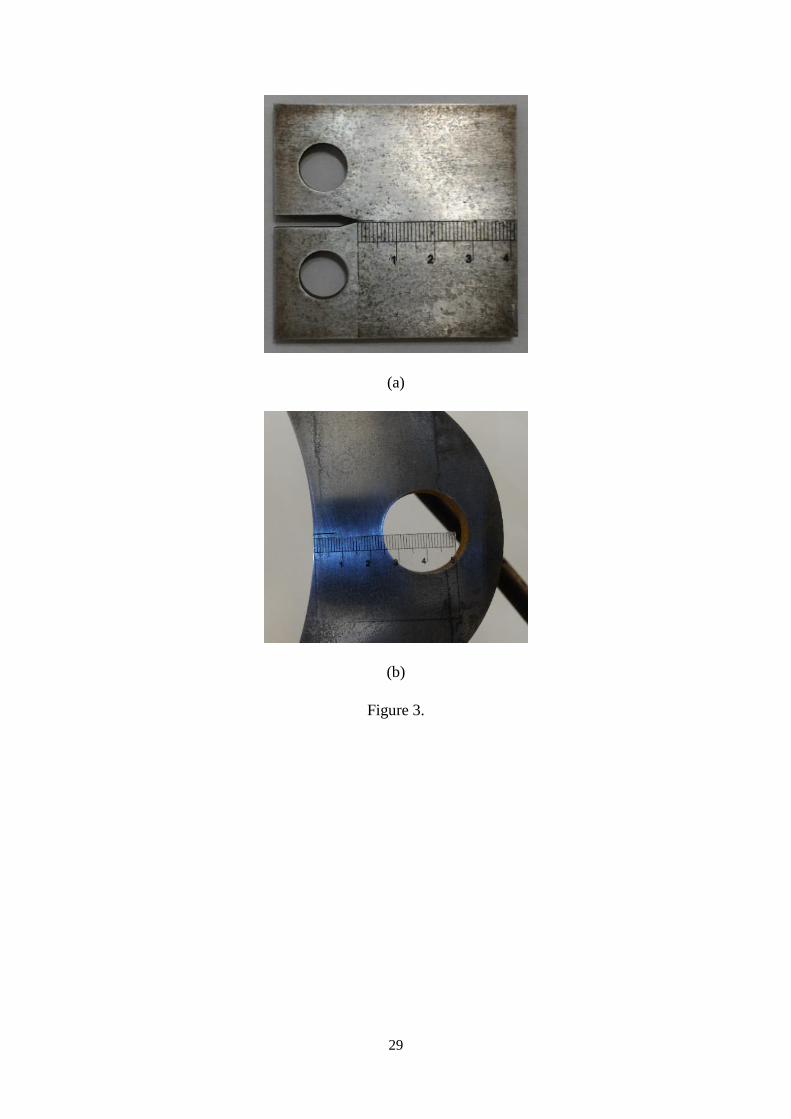
To measure the fatigue crack growth, a camera was installed at the proper location for filming
the specimen during the test. For this purpose, it was necessary to install an appropriate index
in the place of the crack growth, which measured the amount of crack growth. Figure 3 shows
the test specimens of fatigue crack growth along with the index mounted on them.
Placement of Figure 3
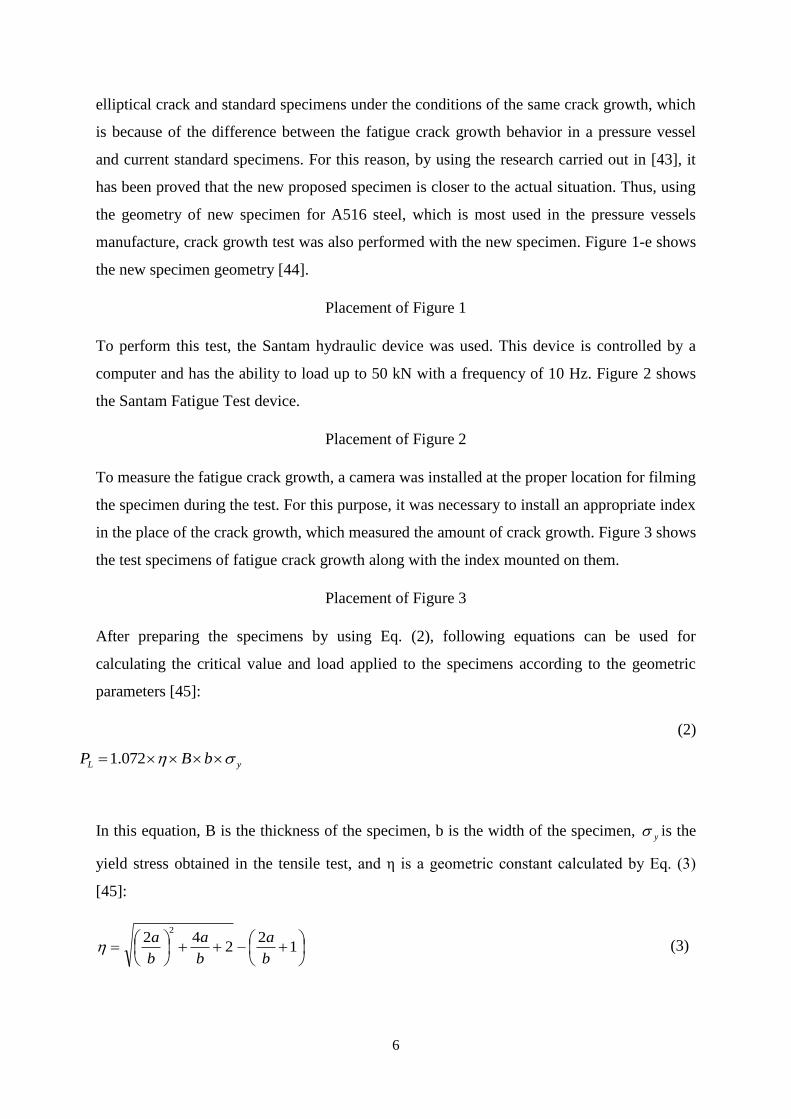
After preparing the specimens by using Eq. (2), following equations can be used for
calculating the critical value and load applied to the specimens according to the geometric
parameters [45]:
(2)
yL bBP 072.1
In this equation, B is the thickness of the specimen, b is the width of the specimen, y is the
yield stress obtained in the tensile test, and η is a geometric constant calculated by Eq. (3)
[45]:
1
22
422
b
a
b
a
b
a (3)
7
Through the use of provided equations and inserting geometric values, the critical loading
value for C(T) specimens is about 12 kN and for the new specimen is 20 kN. The loading
force ratio in this test was considered to be 0.1 ( 1.0max
min P
PR ). After the specimens were
prepared and placed in the device, the load and a frequency of 5 Hz were applied to the
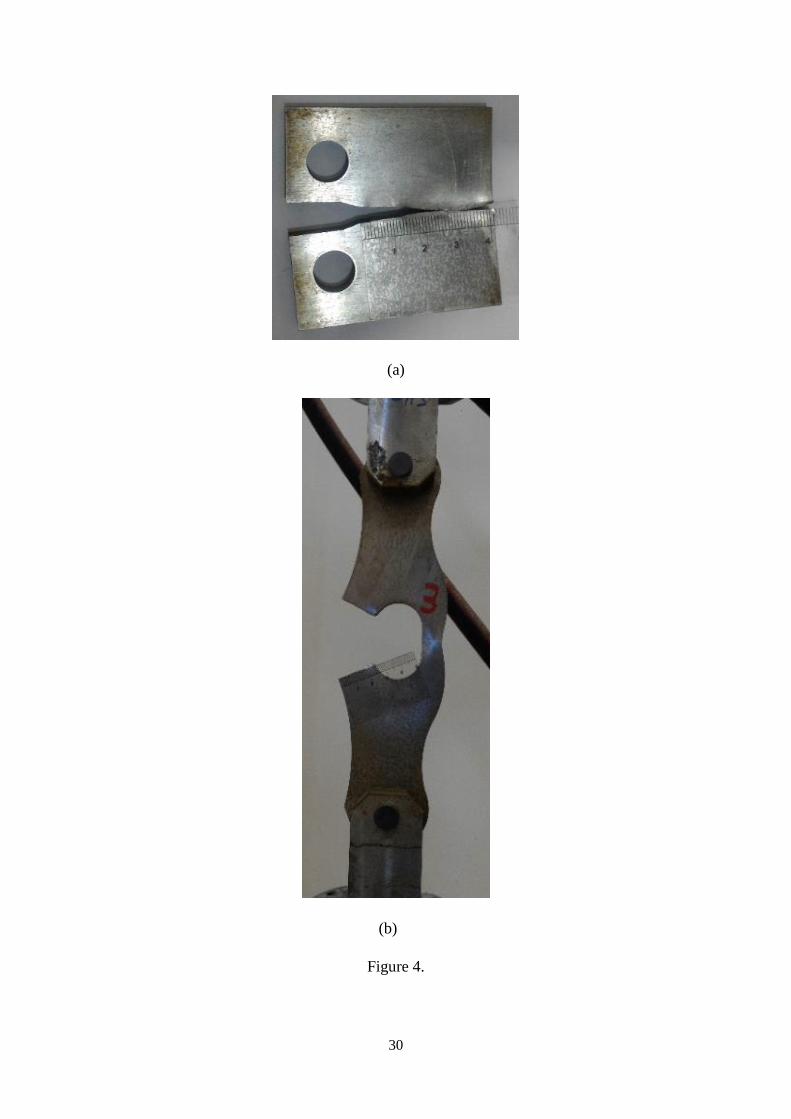
controller computer. The camera was installed in front of the specimen notch and the camera
shutter was timed to shoot every 20 seconds. Figure 4 shows broken specimens after the test.
Placement of Figure 4
3. Experimental results and discussion
3.1. Metallography
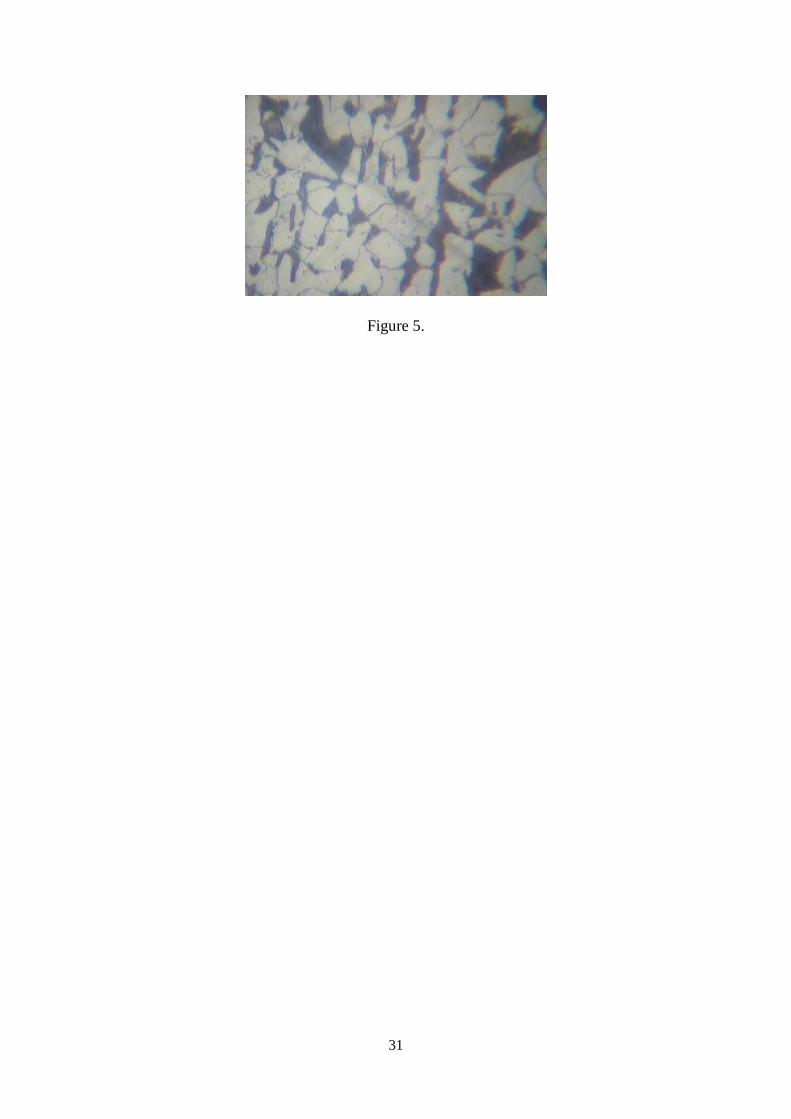
The surface images are magnified 1000 times (Figure 5). Test result show that the basis
structure is ferrite- pearlite, in which the grains are drawn in the direction of rolling.
Metallographic investigation showed that the steel has a ferrite- pearlite. Due to differences in
intragranular crystal orientation, interlayer distance from a grain to another grain is different.
The average distance between the layers utilizing quantitative metallography is 0.679 m .
Placement of Figure 5
3.2. Tensile Behavior
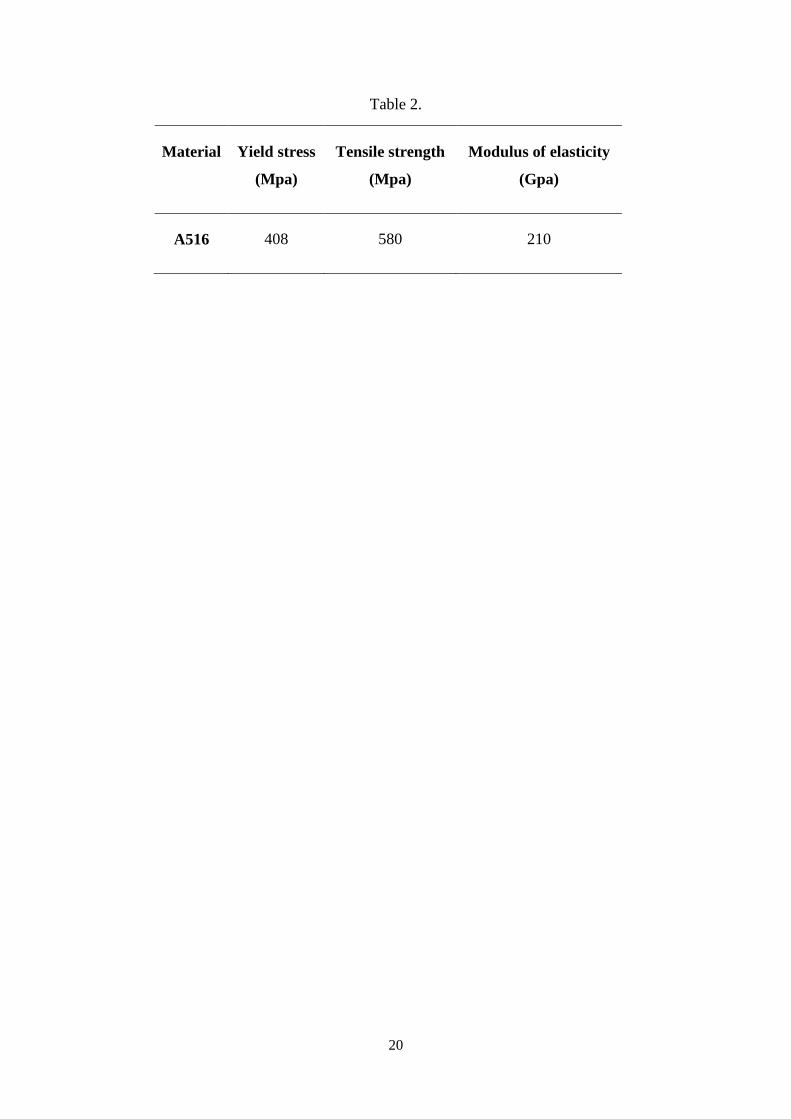
Mechanical properties of A516 steel has been presented in Table 2. The results show that this
alloy has a sufficient standard tensile strength for using in pressure vessels. Yield strength
and ultimate tensile strength are respectively obtained as 408 and 580 MPa, while the
elongation at break is 10%. The material has high strain hardening rate with hardening rate of
0.238, which is a high value for engineering steels.
Placement of Table 2
3.3. Charpy Impact
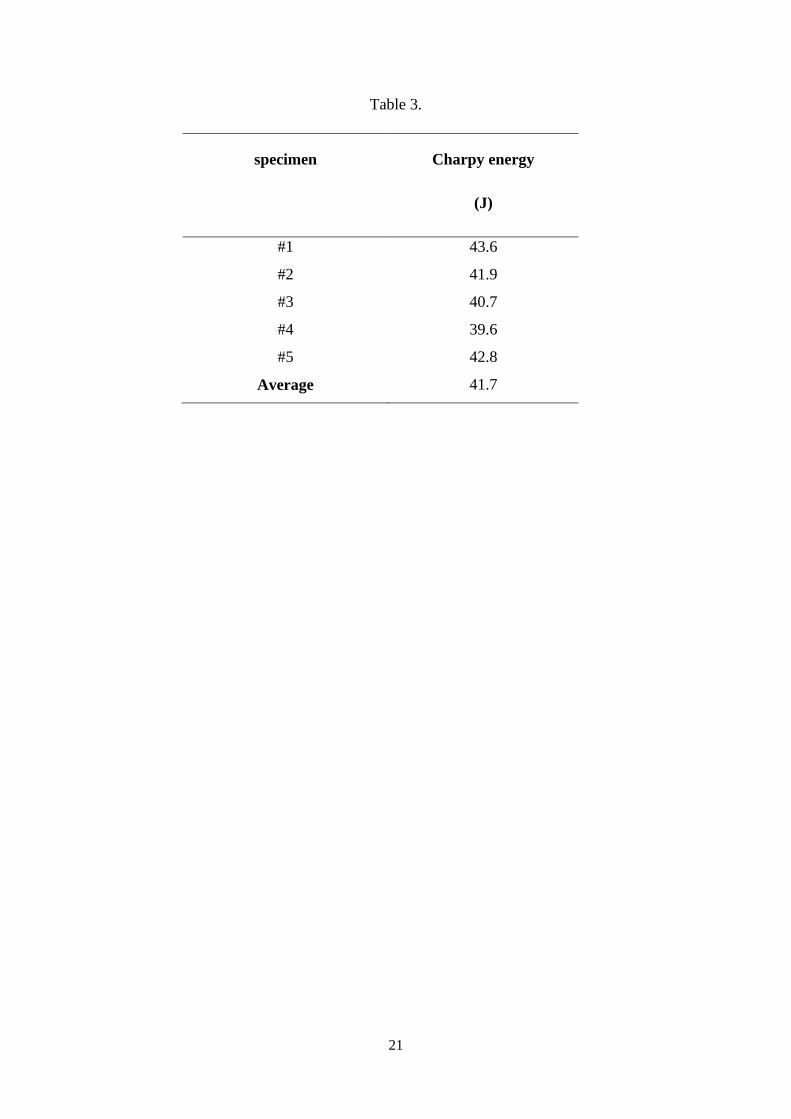
Table 3 shows the average Charpy energy for A516 steel. A516 steel requires more energy to
fracture the specimens. Lateral expansion of CVN specimens in the side of impact and
percentage of shear failure fracture surface has been inserted in the table. The impact test
results show that the energy absorption for this alloy is very high, which can withstand
possible impact and reduce the possibility of explosion.
8
Placement of Table 3
3.4. Hardness
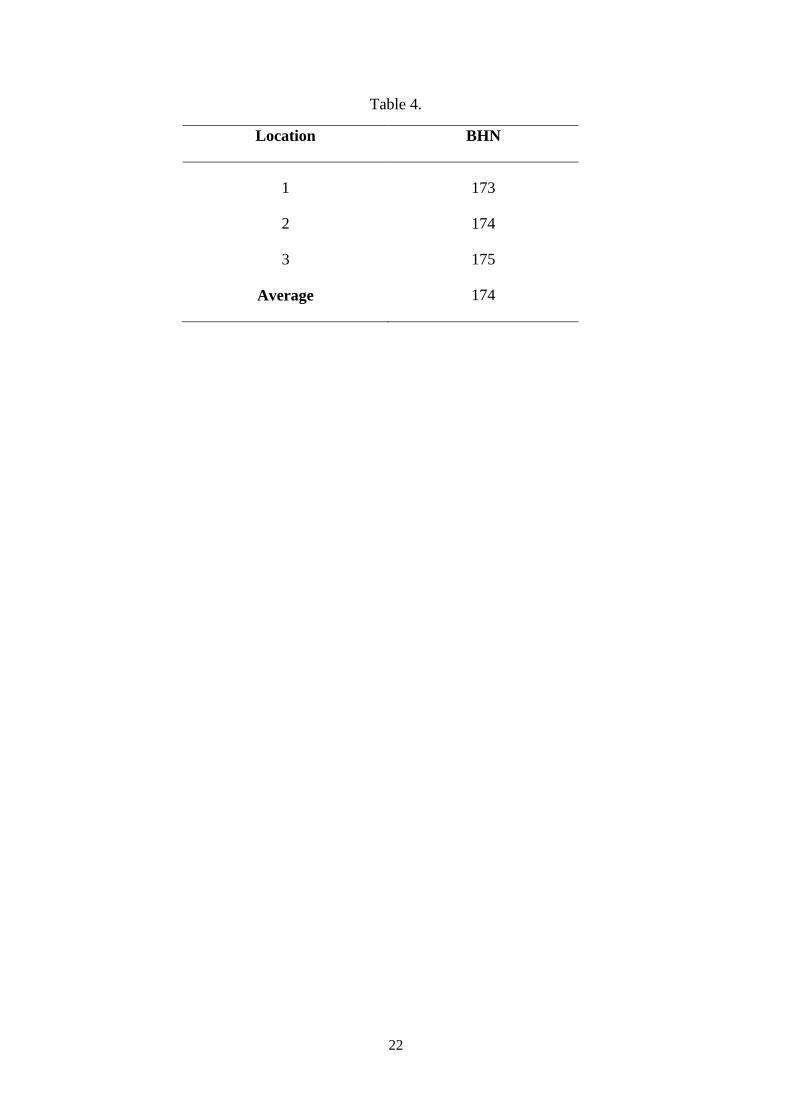
Here Brinell static test and the results are presented in Table 4. The results show that this
alloy has a sufficient standard hardness for using in pressure vessels. According to the test
results, all measured hardness data conformed to the A516 steel specifications.
Placement of Table 4
3.5 Fatigue Performance
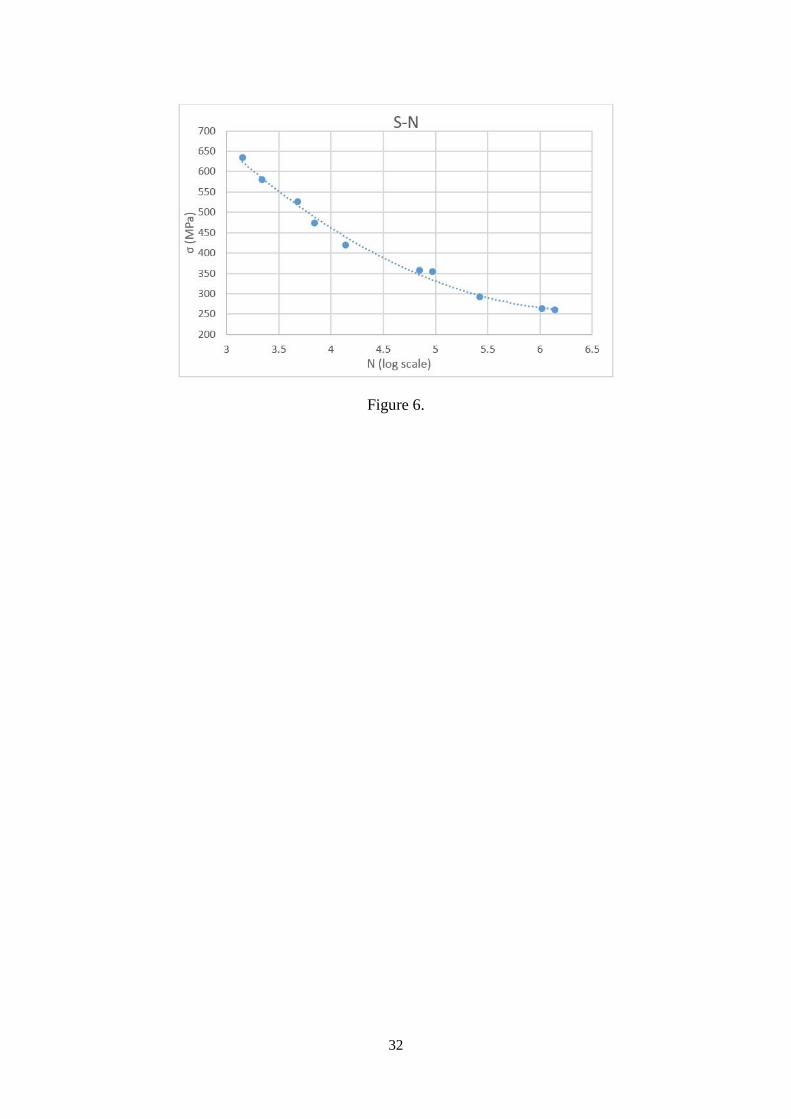
This test is performed according to the ASTM E466 standard. As seen in the general form of
S-N curve, by reducing stress applied to the specimen, the fatigue life increases along a
horizontal Asymptote. This reduction will stop in a range that the specimen does not fail
anymore, and it is called durability of the material. According to the test results, A516 steel
does not fail at stresses less than 250 MPa and it has a finite life in stresses of 400 to 550
MPa. Figure 6 shows the S-N curve.
Placement of Figure 6
3.6. Evaluation of fatigue crack growth
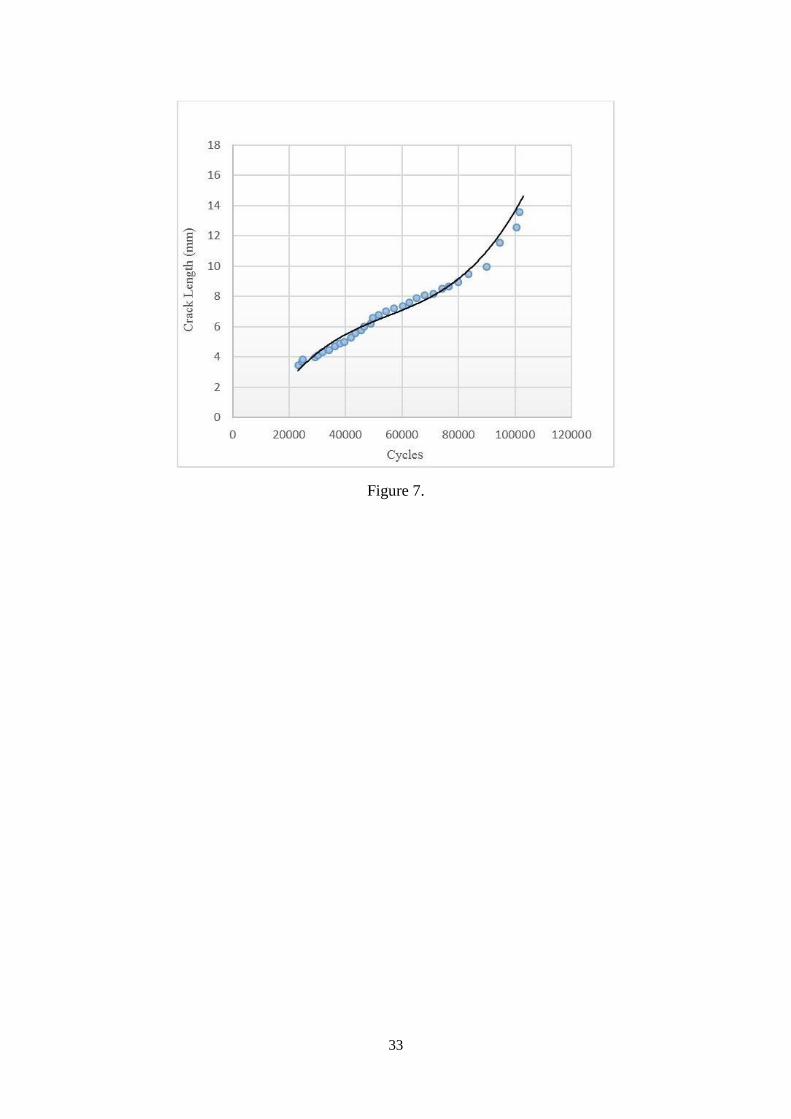
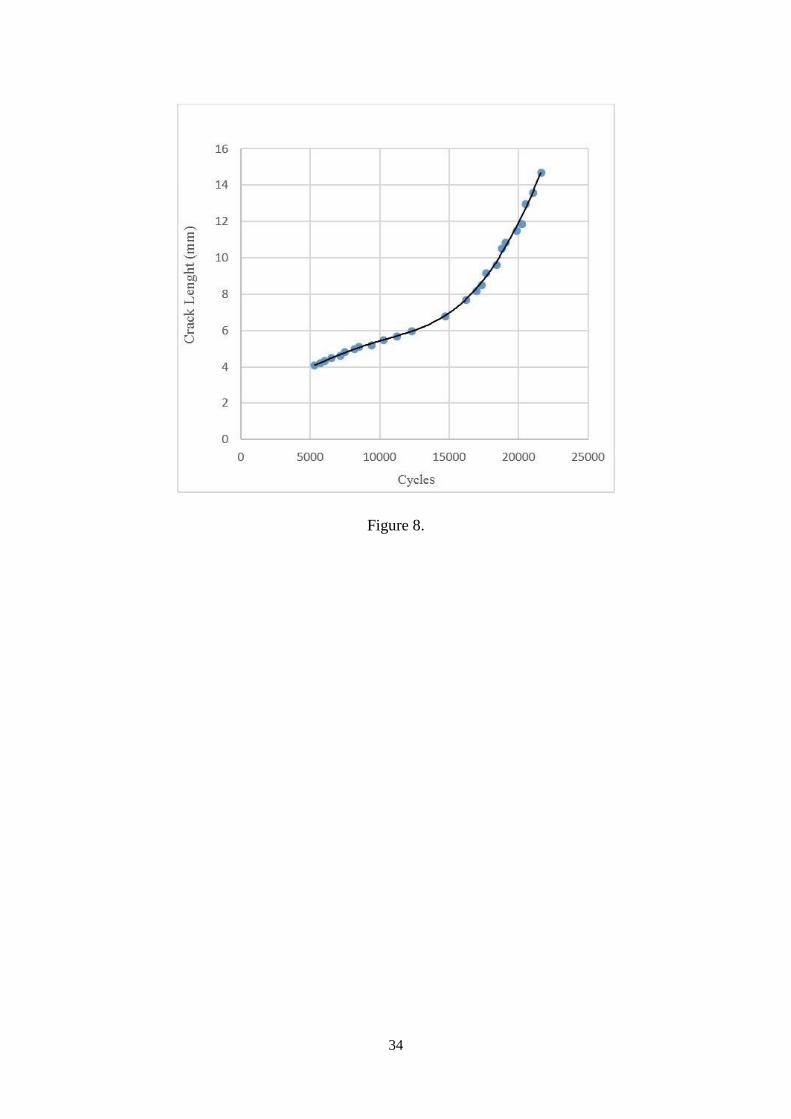
After testing and measuring the crack growth from the recorded images, the fatigue life
curves are plotted in Figures 7 and 8. Using the gradient of obtained results and calculating
the stress intensity factor with Eq. (4), the crack growth rate is obtained in terms of stress
intensity factor. To calculate ΔK, the following equation was used [45]:
aK (4)
Here, a is the crack length and σ is the stress applied to the cross-sectional area of the specimen.
Placement of Figure 7
Placement of Figure 8
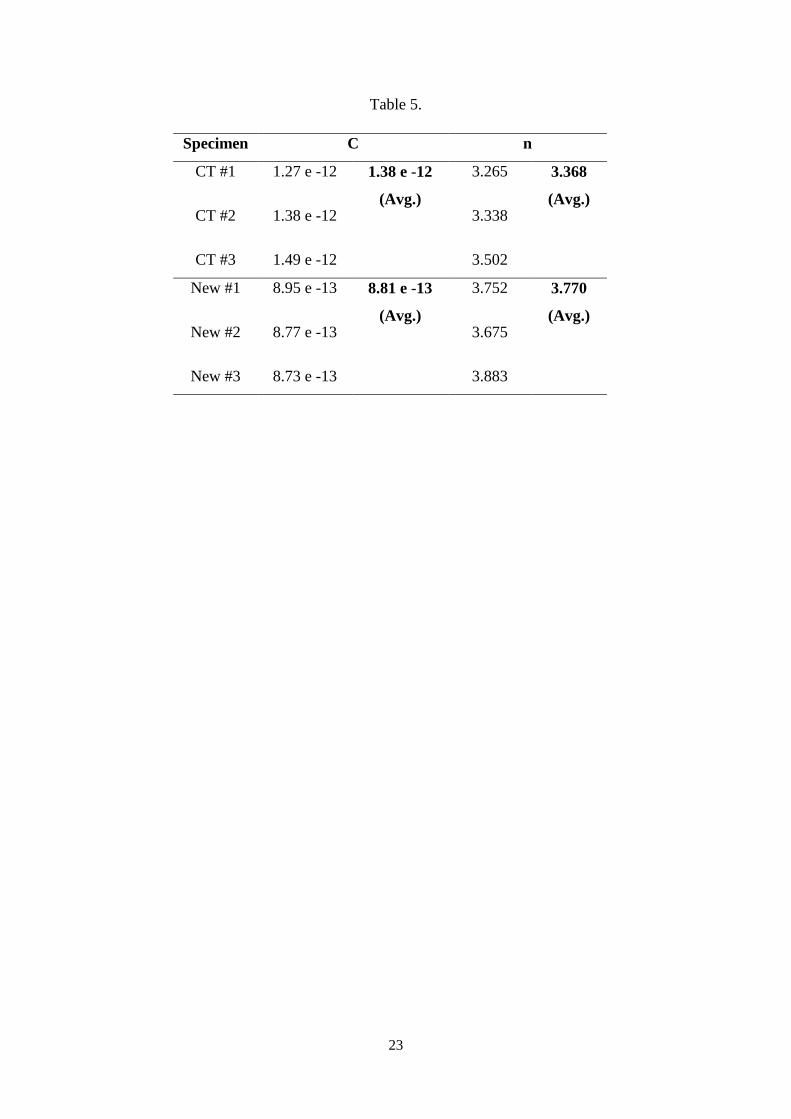
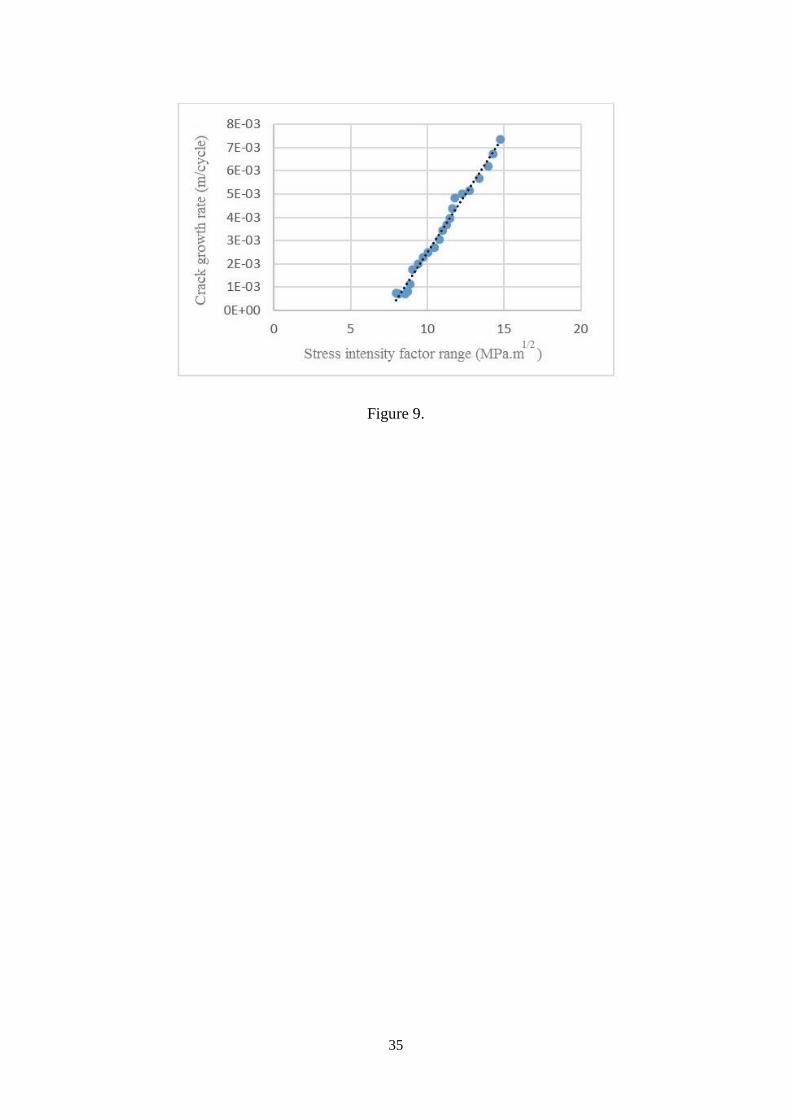
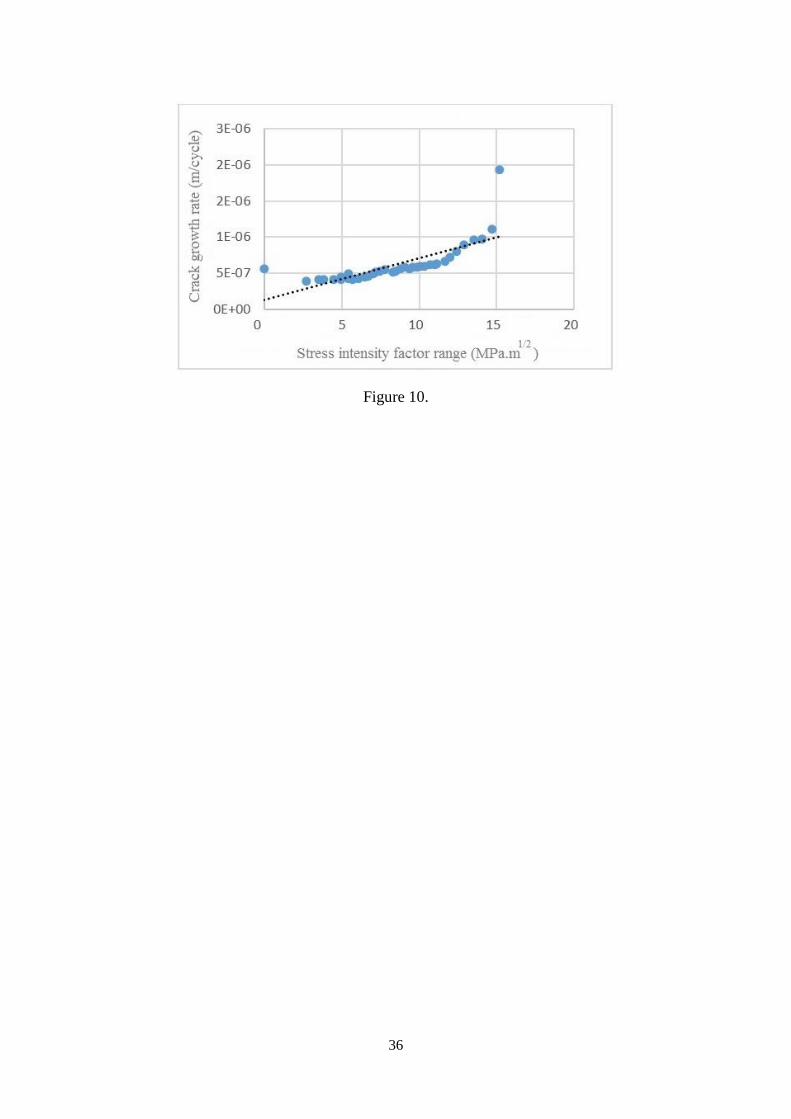
In order to find the constant values of the Paris equation, the crack growth rate curves are plotted
in terms of the stress intensity factor. Figures 9 and 10 show fatigue crack growth rate in terms
9
of stress intensity factor for C(T) specimen and new specimen. After plotting the curves, the
constants of Paris equation for each specimen are presented in Table 5.
Placement of Figure 9
Placement of Figure 10
Placement of Table 5
4. Numerical Method for Fatigue Crack Growth
Nowadays, Numerical Methods by means of computers solve many complicated problems
easily in a short time. One of the Numerical Methods is the use of Finite Element Method
(FEM) or Boundary Element Method (BEM). While the stress intensity factors for a number
of specific geometries exist in books and references, there is no reference for complicated
geometries. The best method for calculating crack tip parameters in complicated geometries
is using FEM. Because of the singular terms near the crack tip, the stress around the crack tip
calculated by Eq. (5):
)(2
fr
K I (5)
In the above equation the stress is a function ofr
1 which near the crack tip, r tends to zero,
and as a result stress tends to infinity. After defining the loading vector, the hardness matrix
and applying the fixed boundary conditions, the finite element software performs static
analysis, and consequently calculates the stress-intensity factor using the analysis results and
the Eqs (6-10):
2
3sin.
2sin1
2cos2
Ixx Kr (6)
2
3sin.
2sin1
2cos2
Iyy Kr (7)
2
3cos
2cos)12()1(
22
r
E
Ku I
x (8)
2
3sin
2sin)12()1(
22
r
E
Ku I
x (9)
10
1
43
43
(10)
In the above equations, r is the distance from the crack tip and is the angle at which the
stresses are calculated.
In order to simulate fatigue crack growth and estimation of A516 steel life, modeling was
done in Franc 3D software which is designed by researchers at Cornell University [46], a
software for studying crack growth in 3D geometric shapes.
4.1. Finite Element Method
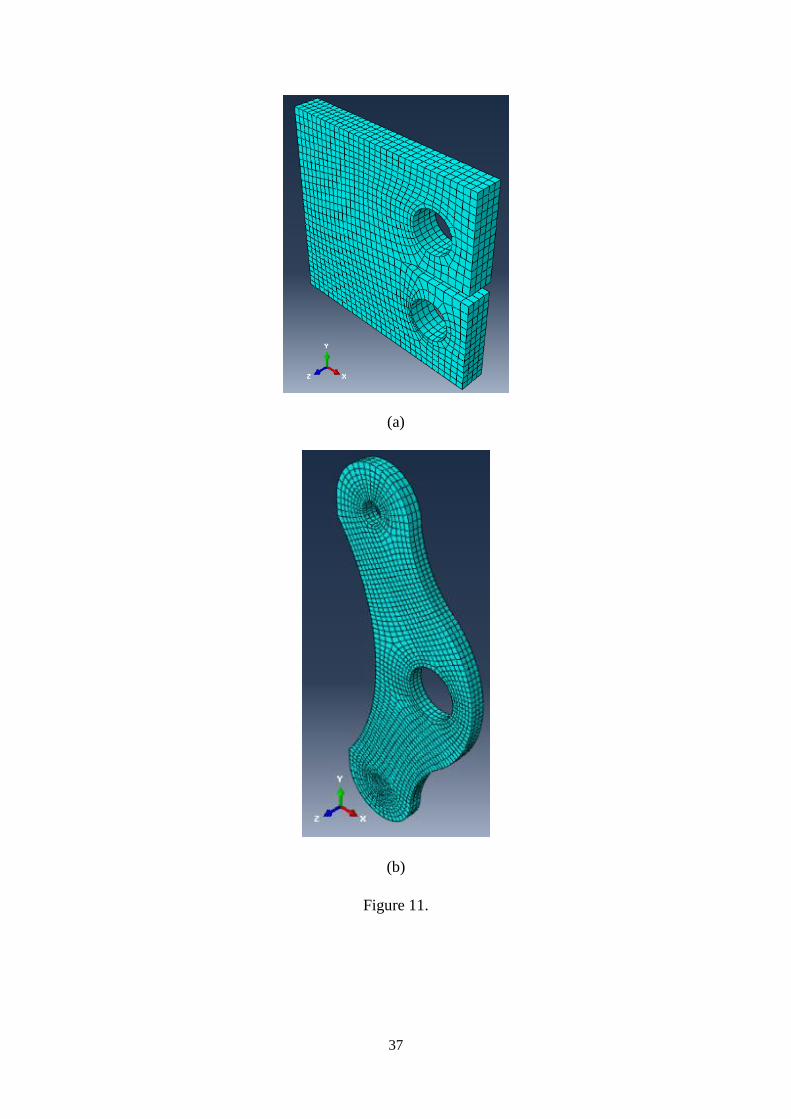
The number of elements will be selected after different meshing. Here the size of elements is
3 mm and Quadrilateral element shape is selected. The number of appropriate elements for
the C(T) specimen was 1216 and for the new specimen, was 4130. Figure 11 shows the finite
element model of C(T) specimen and the new specimen. Also, all the properties of the
material and the applied load are same as the experimental tests.
Placement of Figure 11
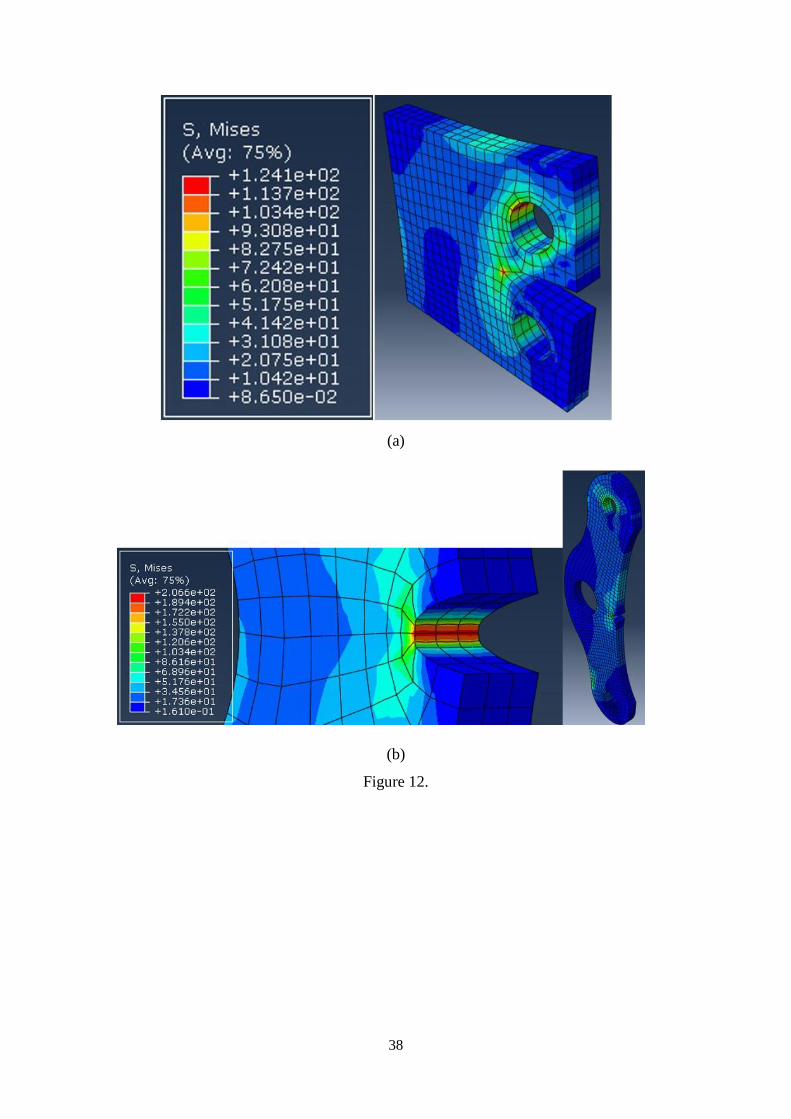
The stress-strain analysis results with a similar loading in the experimental tests for the C(T)
specimen are shown in Figure 12.a. All the steps were also performed for the new specimen.
Also, the maximum stress obtained for the new specimen is shown in Figure 12.b.
Placement of Figure 12
4.2. Boundary Element Method
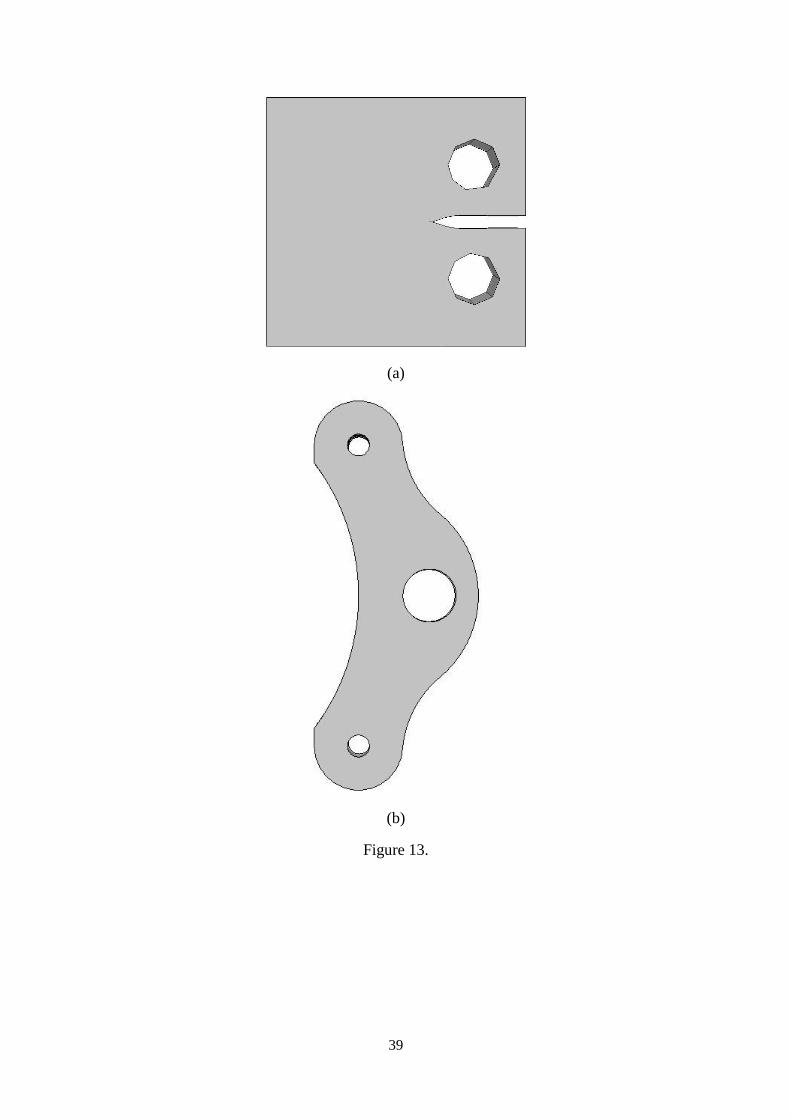
FRANC3D software has been created and developed by Cornell University. The purpose of
this software is to simulate the three-dimensional crack growth of industrial components in
relatively complicated conditions. Figure 13 shows the specimens’ geometric modeling in the
software.
Placement of Figure 13
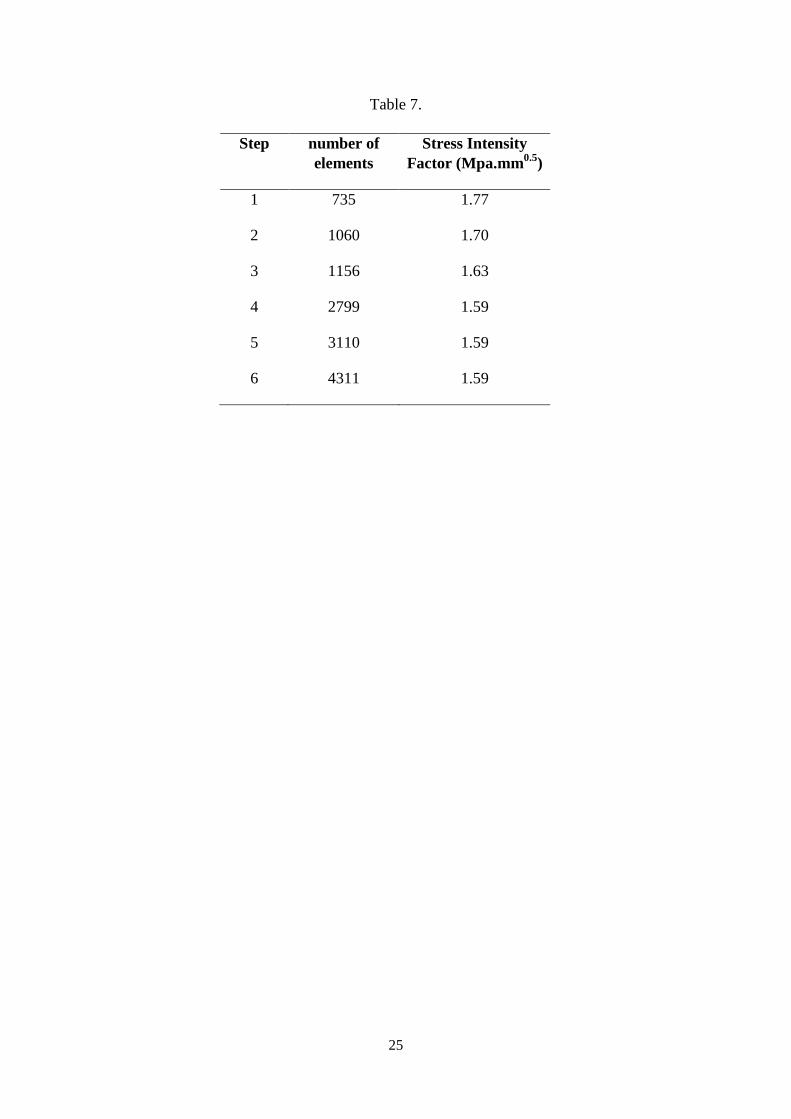
To solve the problem in a correct way and to ensure its accuracy, the meshing must be done
correctly. The more the number of elements, the higher the accuracy, but the problem-solving
speed decreases. In order to make sure the problem is solved accurately, the number of
11
elements must be increased as much as possible. To find the number of appropriate elements,
the problem was solved with the number of different elements several times. According to
Tables 6 and 7, the number of appropriate elements was selected for the C(T) specimens and
the new specimen, respectively. The number of appropriate elements for the C(T) specimen
was 1218 elements, and for the arch form of the new specimen, was 2799 elements.
Placement of Table 6
Placement of Table 7
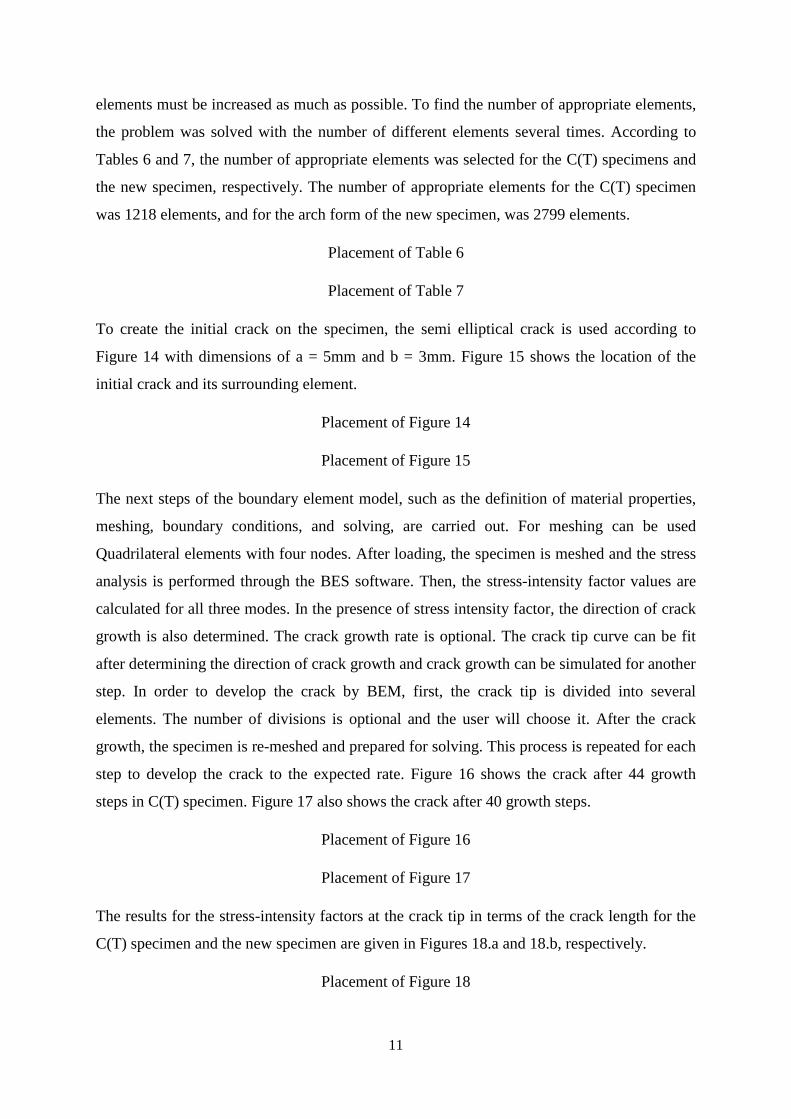
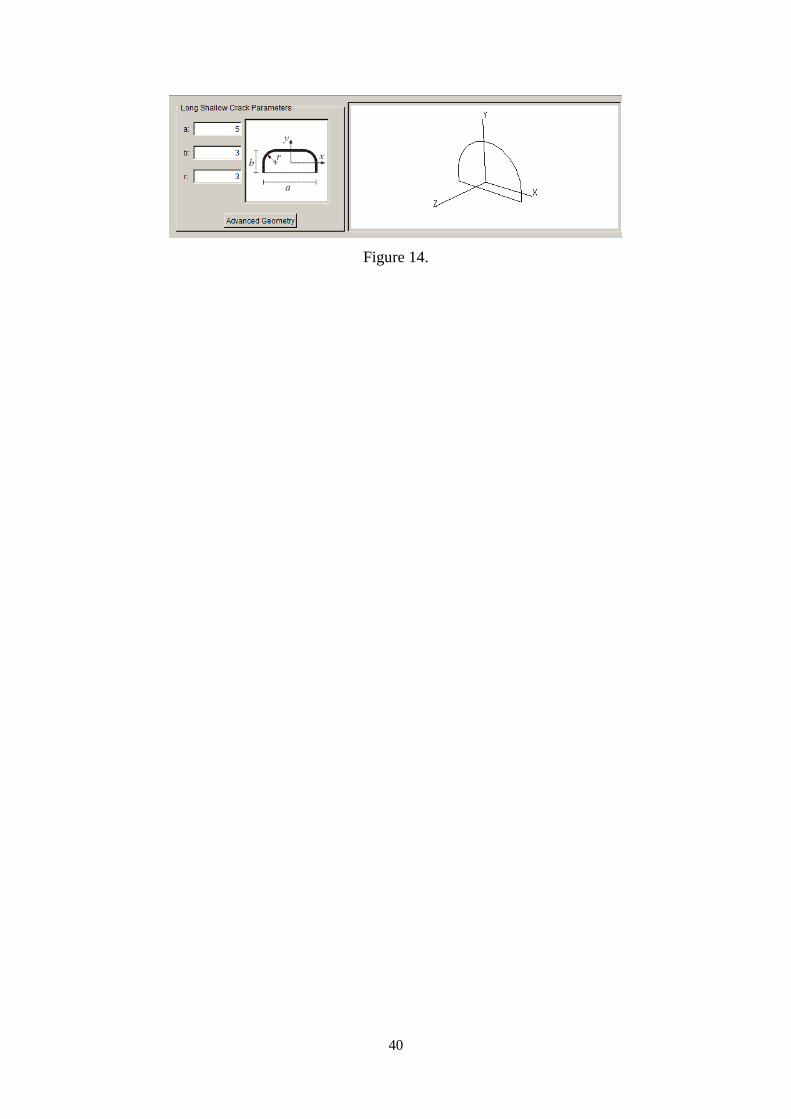
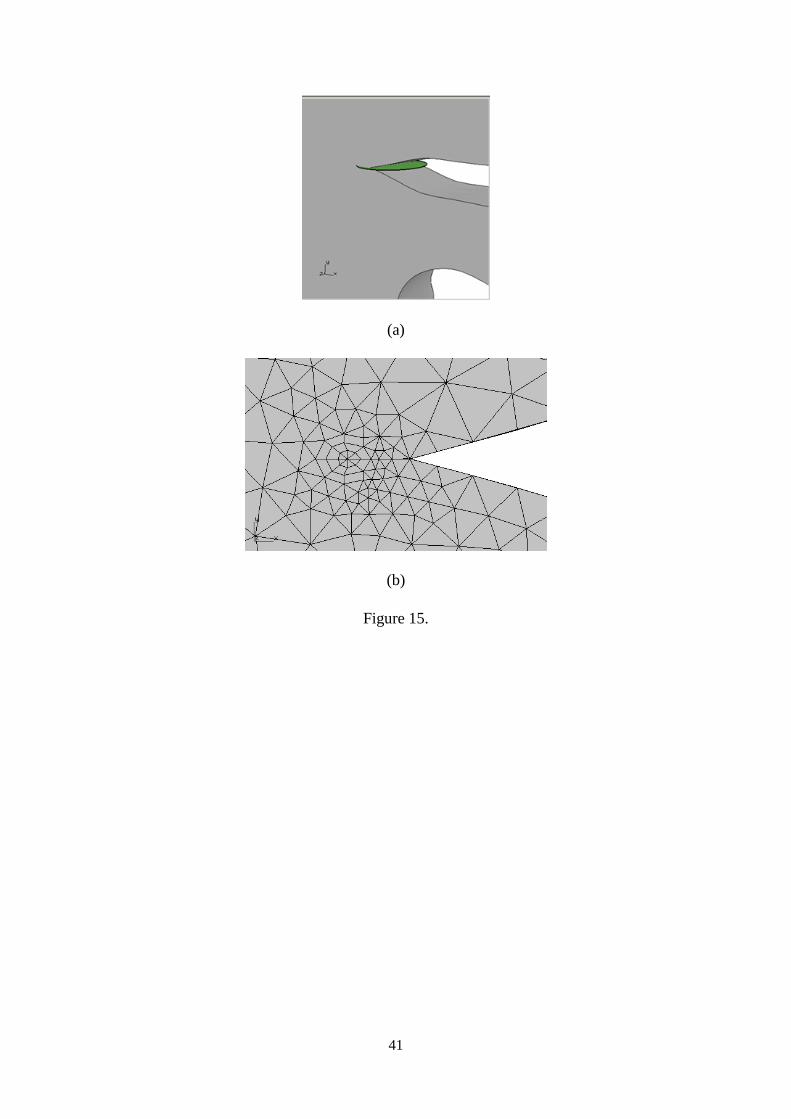
To create the initial crack on the specimen, the semi elliptical crack is used according to
Figure 14 with dimensions of a = 5mm and b = 3mm. Figure 15 shows the location of the
initial crack and its surrounding element.
Placement of Figure 14
Placement of Figure 15
The next steps of the boundary element model, such as the definition of material properties,
meshing, boundary conditions, and solving, are carried out. For meshing can be used
Quadrilateral elements with four nodes. After loading, the specimen is meshed and the stress
analysis is performed through the BES software. Then, the stress-intensity factor values are
calculated for all three modes. In the presence of stress intensity factor, the direction of crack
growth is also determined. The crack growth rate is optional. The crack tip curve can be fit
after determining the direction of crack growth and crack growth can be simulated for another
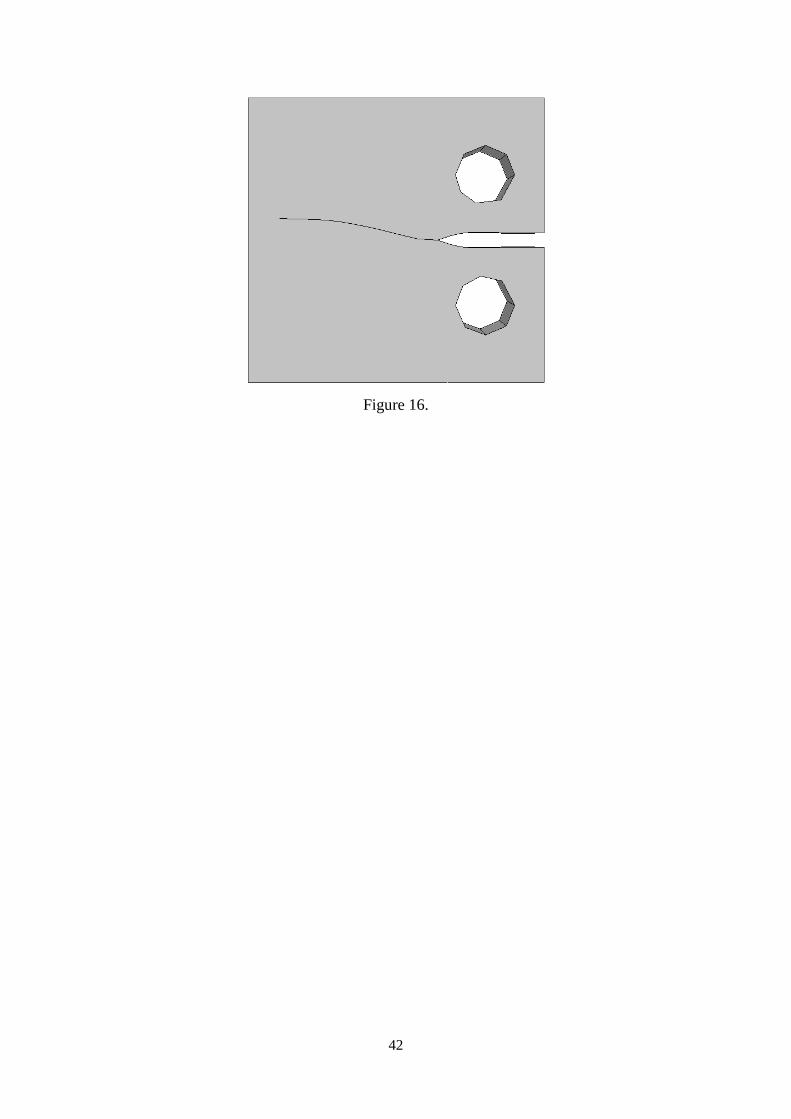
step. In order to develop the crack by BEM, first, the crack tip is divided into several
elements. The number of divisions is optional and the user will choose it. After the crack
growth, the specimen is re-meshed and prepared for solving. This process is repeated for each
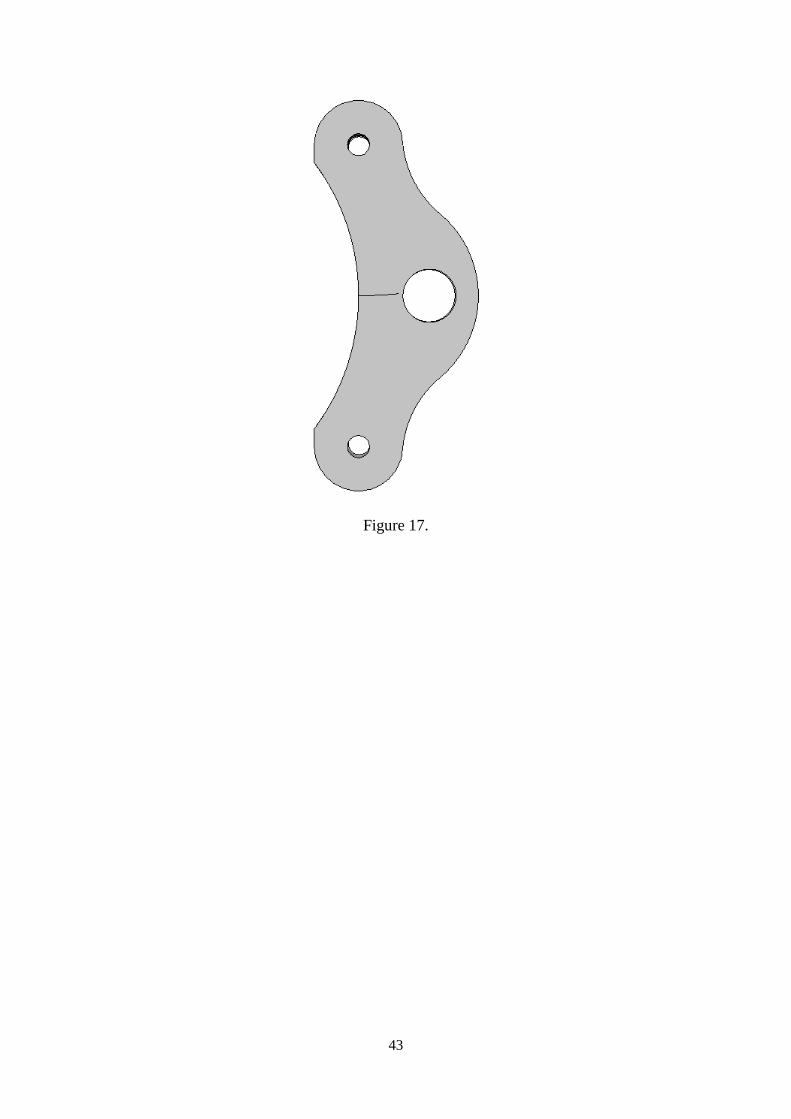
step to develop the crack to the expected rate. Figure 16 shows the crack after 44 growth
steps in C(T) specimen. Figure 17 also shows the crack after 40 growth steps.
Placement of Figure 16
Placement of Figure 17
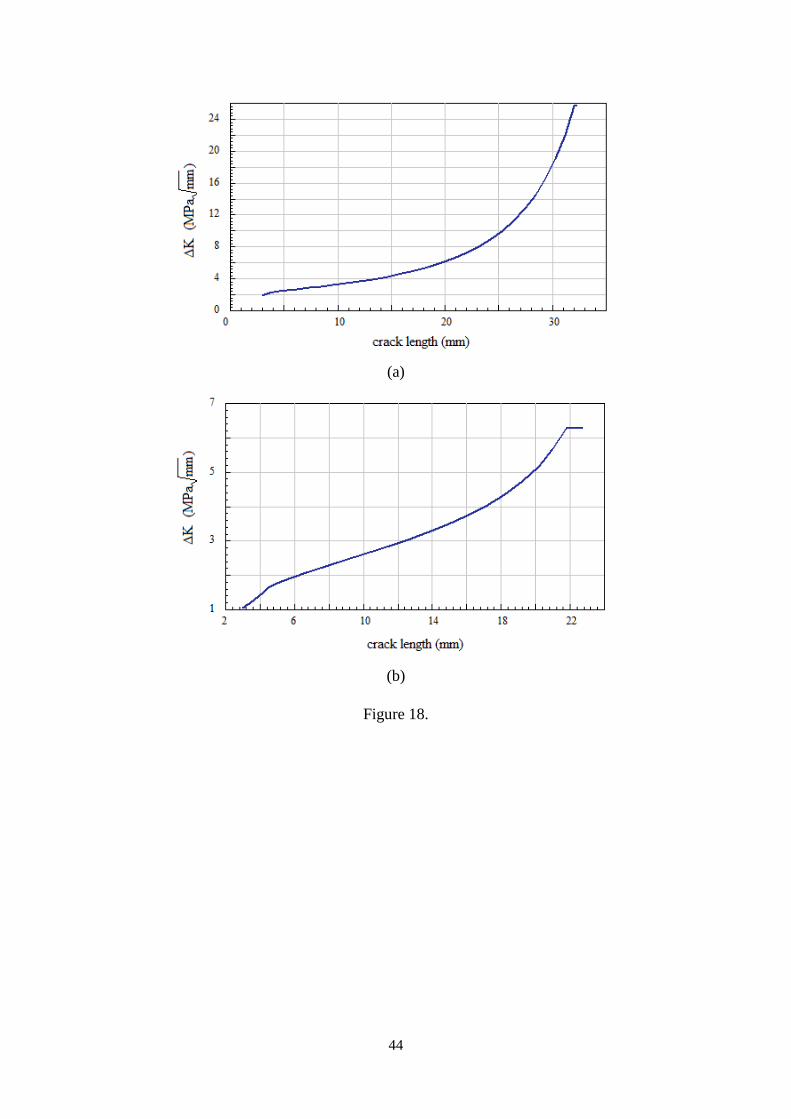
The results for the stress-intensity factors at the crack tip in terms of the crack length for the
C(T) specimen and the new specimen are given in Figures 18.a and 18.b, respectively.
Placement of Figure 18
12
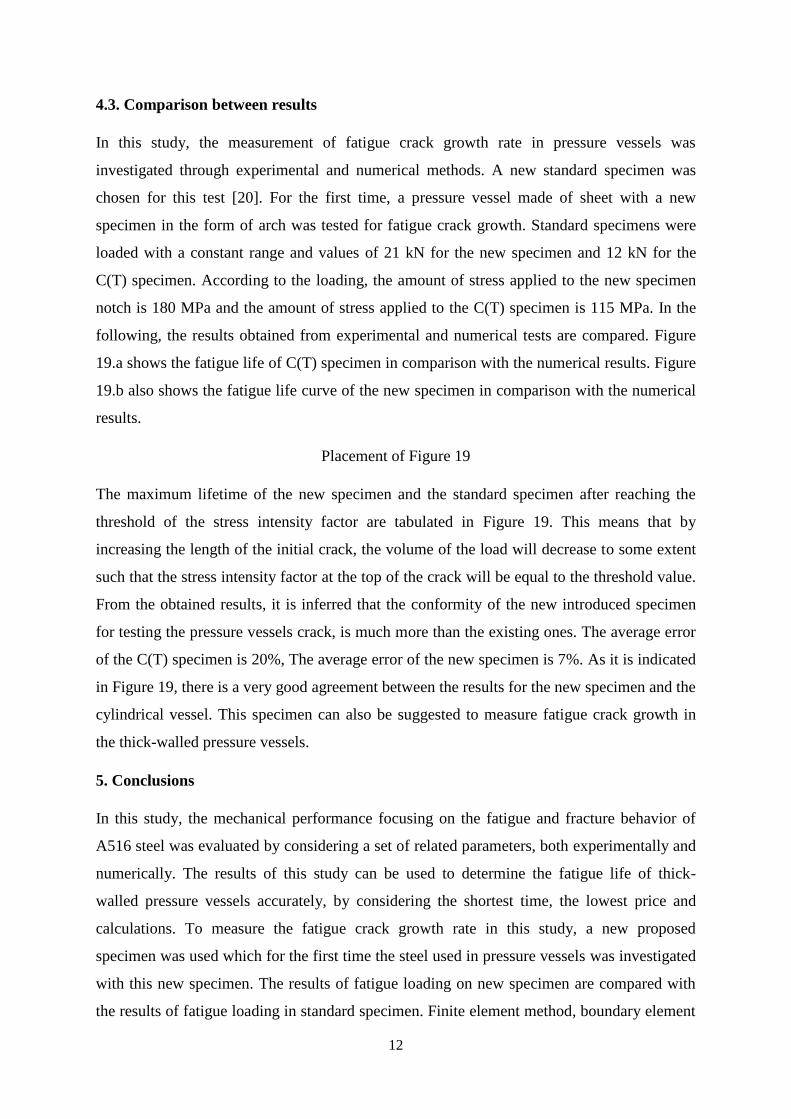
4.3. Comparison between results
In this study, the measurement of fatigue crack growth rate in pressure vessels was
investigated through experimental and numerical methods. A new standard specimen was
chosen for this test [20]. For the first time, a pressure vessel made of sheet with a new
specimen in the form of arch was tested for fatigue crack growth. Standard specimens were
loaded with a constant range and values of 21 kN for the new specimen and 12 kN for the
C(T) specimen. According to the loading, the amount of stress applied to the new specimen
notch is 180 MPa and the amount of stress applied to the C(T) specimen is 115 MPa. In the
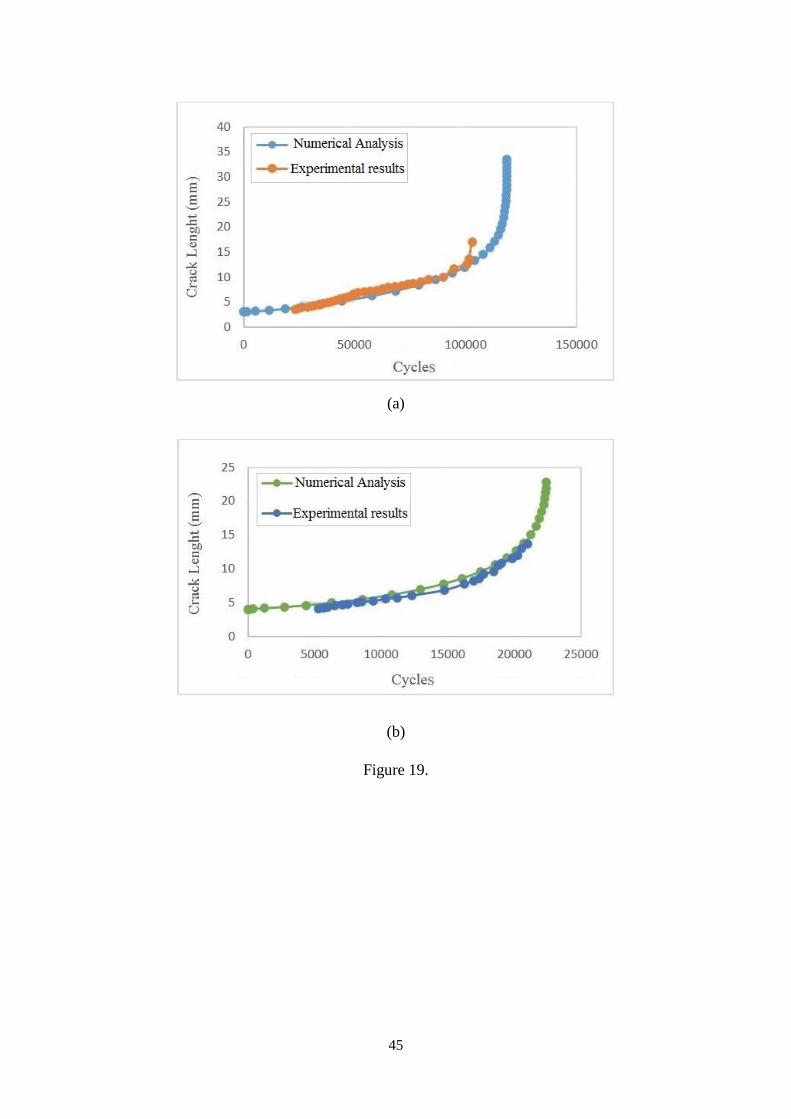
following, the results obtained from experimental and numerical tests are compared. Figure
19.a shows the fatigue life of C(T) specimen in comparison with the numerical results. Figure
19.b also shows the fatigue life curve of the new specimen in comparison with the numerical
results.
Placement of Figure 19
The maximum lifetime of the new specimen and the standard specimen after reaching the
threshold of the stress intensity factor are tabulated in Figure 19. This means that by
increasing the length of the initial crack, the volume of the load will decrease to some extent
such that the stress intensity factor at the top of the crack will be equal to the threshold value.
From the obtained results, it is inferred that the conformity of the new introduced specimen
for testing the pressure vessels crack, is much more than the existing ones. The average error
of the C(T) specimen is 20%, The average error of the new specimen is 7%. As it is indicated
in Figure 19, there is a very good agreement between the results for the new specimen and the
cylindrical vessel. This specimen can also be suggested to measure fatigue crack growth in
the thick-walled pressure vessels.
5. Conclusions
In this study, the mechanical performance focusing on the fatigue and fracture behavior of
A516 steel was evaluated by considering a set of related parameters, both experimentally and
numerically. The results of this study can be used to determine the fatigue life of thick-
walled pressure vessels accurately, by considering the shortest time, the lowest price and
calculations. To measure the fatigue crack growth rate in this study, a new proposed
specimen was used which for the first time the steel used in pressure vessels was investigated
with this new specimen. The results of fatigue loading on new specimen are compared with
the results of fatigue loading in standard specimen. Finite element method, boundary element
13
method and experimental method are used to investigate the behavior of fatigue crack growth
in specimen. For this purpose, a three-dimensional model is conducted using model. Fatigue
test is carried out on a couple of specimens with new geometry and made of A516 in order to
verify the numerical results. The most significant results of this study can be presented as
follows:
1. According to the flat S-N curve with high fatigue limit slightly higher than the yield point
of the material, A516 steel showed high fatigue strength. Also, the level of fatigue failure of
this steel is cleavage type, which generally leads to brittle behavior of the material.
2. Cracks play an important role in fatigue crack initiation in thick-wall pressure vessels.
Effects of size and direction of cracks is important.
3. The results of boundary element method have been compared with those achieved from
experimental tests. The numerical analysis results obtained show good agreement with those
obtained from experimental results.
4. Slope of fatigue life curve in terms of crack length, in initial part and along small cracks is
very low. In other words, a small increase in crack length lead to a great growth in life.
Therefore, direction of stress intensity factor along small cracks is considered much more
important than stress intensity factor along big cracks.
5- By comparing the new specimen results with other existing specimens, it was found that
the new specimen had more accurate results and less error than the other existing ones.
Also, other effects, such as loading frequency, temperature and surface smoothness in the
material life and the ratio of surface properties need to be investigated in the future.
References
[1] Rickerby D.G., Fenici P., “Simultaneous light ion irradiation and fatigue experiment for
the Ispra cyclotron”, Journal of Nuclear Materials, 104, pp. 1577-1581 (1981).
[2] Mackerle J., “Finite elements in the analysis of pressure vessels and piping, an addendum:
A bibliography (2001–2004)”, International Journal of Pressure Vessels and Piping,
82(7), pp. 571-592 (2005).
[3] Masoudi Nejad R., “Rolling contact fatigue analysis under influence of residual stresses”,
MS Thesis, Sharif University of Technology, School of Mechanical Engineering, 2013.
14
[4] Masoudi Nejad R., Salehi S.M., and Farrahi G.H., “Simulation of railroad crack growth
life under the influence of combination mechanical contact and thermal loads”, in 3rd
International Conference on Recent Advances in Railway Engineering, Iran, 2013.
[5] Masoudi Nejad R., Salehi S.M., Farrahi G.H., and Chamani M., “Simulation of crack
propagation of fatigue in Iran rail road wheels and Effect of residual stresses”, In:
Proceedings of the 21st International Conference on Mechanical Engineering, Iran, 2013.
[6] Salehi S.M., Farrahi G.H., Sohrabpoor S., and Masoudi Nejad R., “Life Estimation in the
Railway Wheels under the Influence of Residual Stress Field”, International Journal of
Railway Research, 1(1), pp. 53-60 (2014).
[7] Hadipour M., Alambeigi F., Hosseini R., and Masoudinejad R., “A study on the
vibrational effects of adding an auxiliary chassis to a 6-ton truck”, Journal of American
Science, 7(6), pp. 1219-1226 (2011).
[8] Aliakbari K., Imanparast M., and Masoudi Nejad R., “Microstructure and fatigue fracture
mechanism for a heavy-duty truck diesel engine crankshaft”, Scientia Iranica, (2018).
just-accepted.
[9] Masoudi Nejad R., Shariati M., Farhangdoost Kh. and Atrian A., “Rolling contact fatigue
analysis of rails under the influence of residual stresses induced by manufacturing”,
Scientia Iranica, (2018). just-accepted.
[10] Masoudi Nejad R., Farhangdoost Kh., Shariati M., and Moavenian M., “Stress intensity
factors evaluation for rolling contact fatigue cracks in rails”, Tribology Transactions,
60(4), pp. 645-652 (2016).
[11] Ghahremani Moghadam D., Farhangdoost Kh., and Masoudi Nejad R., “Microstructure
and Residual Stress Distributions Under the Influence of Welding Speed in Friction Stir
Welded 2024 Aluminum Alloy”, Metallurgical and Materials Transactions B, 47(3), pp.
2048-2062 (2016).
[12] Masoudi Nejad R., Farhangdoost Kh., and Shariati M., “Numerical study on fatigue
crack growth in railway wheels under the influence of residual stresses”, Engineering
Failure Analysis, 52, pp. 75-89 (2015).
[13] Masoudi Nejad R., Farhangdoost Kh., and Shariati M., “Three-dimensional simulation
of rolling contact fatigue crack growth in UIC60 rails”, Tribology Transactions, 59(6), pp.
1059-1069 (2016).
[14] Shariati M., Masoudi Nejad R., “Fatigue Strength and Fatigue Fracture Mechanism for
Spot Welds in U-Shape Specimens”, Latin American Journal of Solids and Structures,
13(15), pp. 2787-2801 (2016).
15
[15] Masoudi Nejad R., Shariati M., and Farhangdoost Kh., “Effect of wear on rolling contact
fatigue crack growth in rails”, Tribology International, 94, pp. 118-125 (2016).
[16] Boresi A.P., Chong K., and Lee J.D., “Elasticity in engineering mechanics”, second
edition, John Wiley & Sons (2010).
[17] Thurlbeck S.D., “A fracture mechanics based methodology for the assessment of weld
toe cracks in tubular offshore joints”, Ph. D. Thesis, University of Manchester, Institute of
Science and Technology, 1991.
[18] Zheng X.J., Kiciak A., and Glinka G., “Weight functions and stress intensity factors for
internal surface semi-elliptical crack in thick-walled cylinder”, Engineering Fracture
Mechanics, 58(3), pp. 207-221 (1997).
[19] Anderson T.L., “Fracture mechanics-fundamentals and applications”, NASA STI/Recon
Technical Report, (1991).
[20] Newman J.C., Raju I.S., “Stress-intensity factors for internal surface cracks in
cylindrical pressure vessels”, Journal of Pressure Vessel Technology, 102(4), pp. 342-346
(1980).
[21] Perl M., Levinsohn J.A., “Measurement of the actual fracture toughness of a maraging
300 pressurized cylinder using the vessel as the test specimen”, Engineering Fracture
Mechanics, 34(2), pp. 525-530 (1989).
[22] Newman J.C., “Fracture analysis of various cracked configurations in sheet and plate
materials”, In Properties related to fracture toughness, ASTM International, 1976.
[23] Masoudi Nejad R., “Using three-dimensional finite element analysis for simulation of
residual stresses in railway wheels”, Engineering Failure Analysis, 45, pp. 449-455
(2014).
[24] Masoudi Nejad R., Shariati M., and Farhangdoost Kh., “3D finite element simulation of
residual stresses in UIC60 rails during the quenching process”, Thermal Science, 21(3),
pp. 1301-1307 (2017).
[25] Silva A.L.L., Jesus D., Xavier A.M.P, Correia José A.F.O., and Fernandes A.,
“Combined analytical-numerical methodologies for the evaluation of mixed-mode (I+II)
fatigue crack growth rates in structural steels”, Engineering Fracture Mechanics, 185, pp.
124-138 (2017).
[26] Rozumek D., Marciniak Z., Lesiuk G., Correia J.A., and de Jesus A.M., “Experimental
and numerical investigation of mixed mode I+ II and I+ III fatigue crack growth in S355J0
steel”, International Journal of Fatigue, 113, pp. 160-170 (2018).

16
[27] Lesiuk G., Kucharski P., Correia J.A., De Jesus A.M.P., Rebelo C., and da Silva, L.S.,
“Mixed mode (I+ II) fatigue crack growth in puddle iron”, Engineering Fracture
Mechanics, 185, pp. 175-192 (2017).
[28] Correia José A.F.O., Abilio MP., and Fernández-Canteli A., “A procedure to derive
probabilistic fatigue crack propagation data”, International Journal of Structural Integrity,
3(2), pp. 158-183 (2012).
[29] Abílio MP., Correia Jos A.F.O., “Critical assessment of a local strain-based fatigue crack
growth model using experimental data available for the P355NL1 steel”, Journal of
Pressure Vessel Technology, 135(1), pp. 11-40 (2013).
[30] Correia José A.F.O., Abílio MP., and Fernández-Canteli A., “Local unified probabilistic
model for fatigue crack initiation and propagation: application to a notched geometry”,
Engineering Structures, 52, pp. 394-407 (2013).
[31] Correia José A.F.O., Huffman P.J., Abílio MP., Cicero S., Fernández-Canteli A., Berto
F., and Glinka G., “Unified two-stage fatigue methodology based on a probabilistic
damage model applied to structural details”, Theoretical and Applied Fracture Mechanics,
92, pp. 252-265 (2017).
[32] Correia José A.F.O., Abílio MP., Moreira P.M., and Tavares P.J., “Crack closure effects
on fatigue crack propagation rates: application of a proposed theoretical model”, Advances
in Materials Science and Engineering, 2016, pp. 13-24 (2016).
[33] Correia José A.F.O, Blasón S., Arcari A., Calvente M., Apetre N., Moreira P.M.G.P., De
Jesus A.M.P., and Canteli A.F., “Modified CCS fatigue crack growth model for the
AA2019-T851 based on plasticity-induced crack-closure”, Theoretical and Applied
Fracture Mechanics, 85, pp. 26-36 (2016).
[34] ASTM E8, Standard Test Methods for Tension Testing of Metallic Materials, 2012.
[35] Masoudi Nejad R. “Three-dimensional analysis of rolling contact fatigue crack and life
prediction in railway wheels and rails under residual stresses and wear”, Ph. D. Thesis,
Ferdowsi University of Mashhad, School of Mechanical Engineering, 2017.
[36] Masoudi Nejad R., Farhangdoost Kh., and Shariati M., “Microstructural analysis and
fatigue fracture behavior of rail steel”, Mechanics of Advanced Materials and Structures,
(2018). just-accepted.
[37] ASTM E23, Standard Test Methods for Notched Bar Impact Testing of Metallic
Materials, 2012.
[38] ASTM E10-10, Standard Test Methods for Brinell hardness of Metallic Materials, 2012.
17
[39] ASTM E466-07, Standard Practice for Conducting Force Controlled Constant
Amplitude Axial Fatigue Tests of Metallic Materials, 2012.
[40] Shariati M., Mirzaei M., and Masoudi Nejad R., “An applied method for fatigue life
assessment of engineering components using rigid-insert crack closure model”,
Engineering Fracture Mechanics, 204, pp. 421-433 (2018).
[41] Masoudi Nejad R., Shariati M., and Farhangdoost Kh., “Prediction of fatigue crack
propagation and fractography of rail steel”, Theoretical and Applied Fracture Mechanics,
101, pp. 320-331 (2019).
[42] ASTM E647-11 Standard Test Method for Measurement of Fatigue Crack Growth
Rates, 2011.
[43] Shariati M., Mohammadi E., and Masoudi Nejad R., “Effect of a new specimen size on
fatigue crack growth behavior in thick-walled pressure vessels”, International Journal of
Pressure Vessels and Piping, 150, pp. 1-10 (2017).
[44] ASTM designation E-399-83, Standard Method of Test for Plane-Strain Fracture
Toughness of Metallic Materials, ASTM Annual Standards, 03.01, 2011.
[45] Anderson T.L., “Fracture mechanics: fundamentals and applications”, second edition,
CRC press, 2017.
[46] Cornell Fracture Group, Accessed 15 March 2016; http://www.cfg.cornell.edu
18
List of Table caption
Table 1: Chemical composition of A516 steel (%).
Table 2: Mechanical properties of A516 steel.
Table 3: Average Charpy energy for A516 steel.
Table 4: Hardness test results.
Table 5: Paris Constants.
Table 6: The number of elements for the C(T) specimen.
Table 7: The number of elements for the new specimen.
List of Figure caption
Figure 1: Geometries of (a) tensile, (b) charpy impact, (c) fatigue, (d) crack growth rate, e)
new proposed specimen for fatigue crack growth, test specimens (dimensions in mm).
Figure 2: Experimental test setup.
Figure 3: the index mounted on specimens to measure crack growth. a) C(T) specimen [43],
b) new specimen [44].
Figure 4: test specimens after failure. a) C(T) specimen, b) new specimen.
Figure 5: A516 steel ferrite- pearlite basis structure magnification X1000.
Figure 6: fatigue S-N curve.
Figure 7: Fatigue life based on the crack length for C(T) specimen.
Figure 8: Fatigue life based on the crack length for the new specimen.
Figure 9: Crack growth rate in terms of stress intensity factor for C(T) specimen.
Figure 10: Crack growth rate in terms of stress intensity factor for new specimen.
Figure 11: Finite element model. a) C(T) specimen, b) new specimen.
Figure 12: The maximum von-mises stress. a) C(T) specimen, b) new specimen.
Figure 13: Boundary element model in Franc3D software. a) C(T) specimen b) the new
specimen.
Figure 14: geometry of initial crack.
Figure 15: geometry and location of the initial crack. a) location of the initial crack, b) the
surroundings of the crack tip.
Figure 16: the crack after 44 growth steps in C(T) specimen.
Figure 17: the crack after 40 growth steps in the new specimen.
Figure 18: Stress intensity factor in terms of the crack length. a) C(T) specimen, b) the new
specimen.
Figure 19: the fatigue life in terms of crack length. a) C(T) specimen, b) the new specimen.
19
Table 1.
Material C Si Mn P S Cr Mo V
A516 0.228 0.318 0.979 0.0194 0.0166 0.066 0.005 0.013
20
Table 2.
Material Yield stress
(Mpa)
Tensile strength
(Mpa)
Modulus of elasticity
(Gpa)
A516 408 580 210
21
Table 3.
specimen Charpy energy
(J)
#1 43.6
#2 41.9
#3 40.7
#4 39.6
#5 42.8
Average 41.7
22
Table 4.
Location BHN
1 173
2 174
3 175
Average 174
23
Table 5.
Specimen C n
CT #1 1.27 e -12 1.38 e -12
(Avg.)
3.265 3.368
(Avg.) CT #2 1.38 e -12 3.338
CT #3 1.49 e -12 3.502
New #1 8.95 e -13 8.81 e -13
(Avg.)
3.752 3.770
(Avg.) New #2 8.77 e -13 3.675
New #3 8.73 e -13 3.883

24
Table 6.
Step number of
elements
Stress Intensity
Factor (Mpa.mm0.5
)
1 356 2.81
2 496 2.72
3 1218 2.48
4 1305 2.47
5 1674 2.47
6 2142 2.47
25
Table 7.
Step number of
elements
Stress Intensity
Factor (Mpa.mm0.5
)
1 735 1.77
2 1060 1.70
3 1156 1.63
4 2799 1.59
5 3110 1.59
6 4311 1.59
26
(a)
(b)
(c)
(d)
27
(e)
Figure 1.
28
Figure 2.
29
(a)
(b)
Figure 3.
30
(a)
(b)
Figure 4.
31
Figure 5.
32
Figure 6.
33
Figure 7.
34
Figure 8.
35
Figure 9.
36
Figure 10.
37
(a)
(b)
Figure 11.
38
(a)
(b)
Figure 12.
39
(a)
(b)
Figure 13.
40
Figure 14.
41
(a)
(b)
Figure 15.
42
Figure 16.
43
Figure 17.
44
(a)
(b)
Figure 18.
45
(a)
(b)
Figure 19.
46
Hossein Ghasemi received the MSc degree from Foolad Institute of Technology, Iran. His research
interests are in the areas of boundary element, fracture mechanics, and residual stress prediction.
Reza Masoudi Nejad received the PhD degree from Ferdowsi University of Mashhad, Iran; He is
currently an Assistant Professor of Mechanical Engineering at Foolad Institute of Technology, Iran.
To date, he has published more than 27 journal and 13 conference papers. He has recently published a
book named "Mechanical design of electromechanical systems in micro-nano scale", in Sharif
University of Technology Publishing. His research interests are in the areas of finite element, fatigue
and fracture mechanics, stresses, fatigue and friction of rolling/sliding, surface science, residual stress
measurement and prediction.
Ahmad Jalayerian Darbandi received the BSc degree from Ferdowsi University of Mashhad, Iran.
His research interests are in the areas of experimental mechanics, fracture mechanics, and stress
analysis.
Yaghoub Tadi Beni obtained his PhD degree in Mechanical Engineering from Sharif University of
Technology, Tehran, Iran, and is currently a Professor of Mechanical Engineering at Shahrekord
University, Iran. To date, he has published more than 94 journal and 36 conference papers. His
research interests include nano-mechanics/nano-structure stability, nonlinear/nonclassical continuum
mechanics, nonlinear analysis of beam and plates and shells, nonlinear finite element method and
FEM simulation of metal forming processes.
Mahmoud Shariati received his PhD degree in Mechanical Engineering in 1999 from Tarbiat
Modares University, Iran, and is currently a Professor of Mechanical Engineering at Ferdowsi
University of Mashhad, Iran. To date, he has published more than 124 journal and 64 conference
papers. His research interests include fatigue and fracture mechanics, nano-mechanics, stress analysis,
and experimental mechanics.