Faster Turnaround Times for Troponin and Other …€¦ · Faster Turnaround Times for Troponin and...
27
Faster Turnaround Times for Troponin and Other Essential Tests: How We used Real-Time Analytics and Process Improvement to Support Improved ED Outcomes Alastair Dunnett Laboratory Director, Lutheran Hospital - Fort Wayne, Indiana Thel Grayson Interim Lab Director, Seton Healthcare Family - Austin, Texas Day 2 - Wednesday, October 2, 2:10PM-3:00PM
Transcript of Faster Turnaround Times for Troponin and Other …€¦ · Faster Turnaround Times for Troponin and...
Faster Turnaround Times for Troponin and Other Essential Tests: How We used Real-Time Analytics and Process Improvement to Support Improved ED Outcomes
Alastair Dunnett Laboratory Director, Lutheran Hospital - Fort Wayne, Indiana Thel Grayson Interim Lab Director, Seton Healthcare Family - Austin, Texas
Day 2 - Wednesday, October 2, 2:10PM-3:00PM
Turnaround time (TAT) is the most recognized indicator of laboratory performance and service
How do you make and sustain real improvement in TAT of STAT tests?
} Seton Healthcare Family is a not for profit organization that is the leading provider of healthcare in central Texas. There are 10 hospitals in the system including a level 1 adult trauma center and a dedicated level 1 trauma children’s hospital
} There are 320FTE’s working in the laboratory across the network running approximately 3 million tests a year system wide
} The laboratories are equipped with Beckman Coulter chemistry analyzers (DXC, DXI and Access 2 analyzers connected to the LIS using Remisol middleware), Sysmex hematology analyzers and IL coagulation analyzers
} We utilize the Sunquest Laboratory information system (LIS)
} Seton runs Troponin on the Beckman Coulter Access analyzers which have a run time from aspiration to completion of about 16 minutes
} Troponin: A marker of cardiac cell death (elevated in AMI, acute myocardial infarction) utilized in the Emergency Department (ED) and is almost always urgent (i.e. ordered STAT)
The saying in the ED is that “time is muscle”; the reality is that for every minute wasted in making a decision to treat AMI, more heart muscle dies
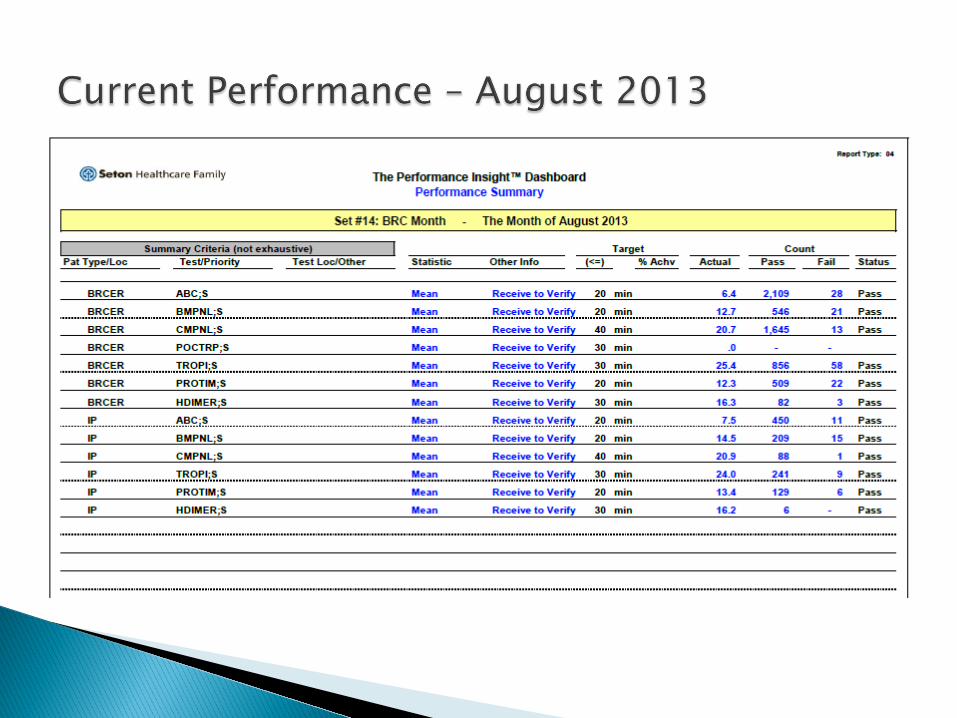
Definition of TAT intervals } Collect (documented time of collection) } Receipt (time received in lab computer) } Result (time result was released)
Our focus was on the Receipt to Result interval

◦ 2 business days to produce reports utilizing Excel ◦ Monthly summary of laboratory results ◦ Analysis by shift, by department, by test – not by individual ◦ Emphasis on Mean/Mode results ◦ No outlier reporting, typically large SD/CV
Spring of 2012 - Average TAT for Troponin was 45 minutes and the SD was >10 minutes
Experience with TAT improvement efforts ◦ Auto-validation and real-time pending log monitors had resulted in some
improvement ◦ Reports and efforts focused on average, not the number of outliers ◦ Lack of timely or specific feedback meant very little changed ◦ Emergency Department accustomed to a lack of sustained improvement in Lab ◦ Point of care cardiac testing “threat” – estimated to be 250k per year in additional
costs at the largest site
May, 2012 - Average TAT for Troponin was 40 minutes and the SD >10 minutes
} Lab had implemented auto-validation and installed monitors in the
automated departments to list (real-time) pending tests and their TAT } Seton implemented new Chemistry/Immunoassay analyzers and needed to
maximize their performance } Early results of auto-validation were showing some improvement, but
variability in performance was still a major issue } Leadership frustrations with current system and lack of reductions in
variance } Poor relationship with emergency departments; perception was that
laboratory lacked interest in making and sustaining improvements } Potential Joint Commission Core Measure related to Acute Myocardial
Infarction (AMI) and the need for faster TAT on cardiac testing } The real potential of more costly point of care troponin testing being
implemented in the emergency room
www.visiun.com
} Because of Beckman Coulter’s partnership with Visiun, Seton was able to implement their “performance insights” reporting system
} Visiun’s system provided Seton with next day reporting capabilities without creating any system overhead for the Laboratory Information System (LIS)
} Easy to use “canned” reports for TAT by shift, site, department and test } All reports are generated using data from one Crystal report extracted by the
LIS each night } A scheduled report batch generates all reports and email/print to multiple
destinations without any interaction } Ad hoc report writer functionality, including benchmarking against peers } Turnaround time reporting is only one feature of the system, there is more
functionality, which Seton continues to explore and utilize

The Tools

Process Inputs (X) Type Process Step Output (Y)Physician order U Correct test ordered in EMRUnit Clerk U If add on, correct selection in Compass to alert LabExperience of Unit Clerk U Correct tube for testExperience of Nurse U Specimen labeled correctlyLabels C Specimen tubed to Lab in timely mannerCompass Functionality U Collect to Rec in Lab <30 min.Patient condition ULocation of tube station UFunctionality of tube station U CLA experience and training C Lab intake receives the specimenLabels C Specimen labeled correctly with patient identifiersStorage of blood C Correct specimen tubeStaff experience C If new specimen, assign accession numberReceiving specimen C If add on, locate blood in Lab for processingAccessioning C Distribute blood to departmentDistributing to department C Alert tech to ER Stat and/or Add-on testAdd-on Print out C If add on, labels print in Lab Tech experience and training C Specimen labeled correctly with patient identifiersNumber of techs on shift C Correct specimen tubeNumber of STAT specimens rec'd U Correctly centrifuged or processedPlatform availability C Correct specimen quality for testCentrifuge availability C Specimen run on correct testing platformSupplies C Results ready for Sunquest download
Number of platforms tech is running C Specimen labeled correctly with patient identifiersTech experience and training C Correct result for patientNumber of techs on shift C Results ready for verification in SunquestNumber of STAT specimens rec'd UInterface CReagents CFrequency of testing CTime on analyzer UReview of results C
Review of results before verification C Results verified and crossed over into CompassResults interfaced C Coll-Rslt TAT <60 min.Tech experience and training C No errors or corrected reportsAmendments requested C Rec-Rslt < 30 min.
Analysis of ER Troponin TAT
Result Verification
Test Analysis
Test Ordered, Drawn, and tubed to Lab
Intake/Receiving
Processing


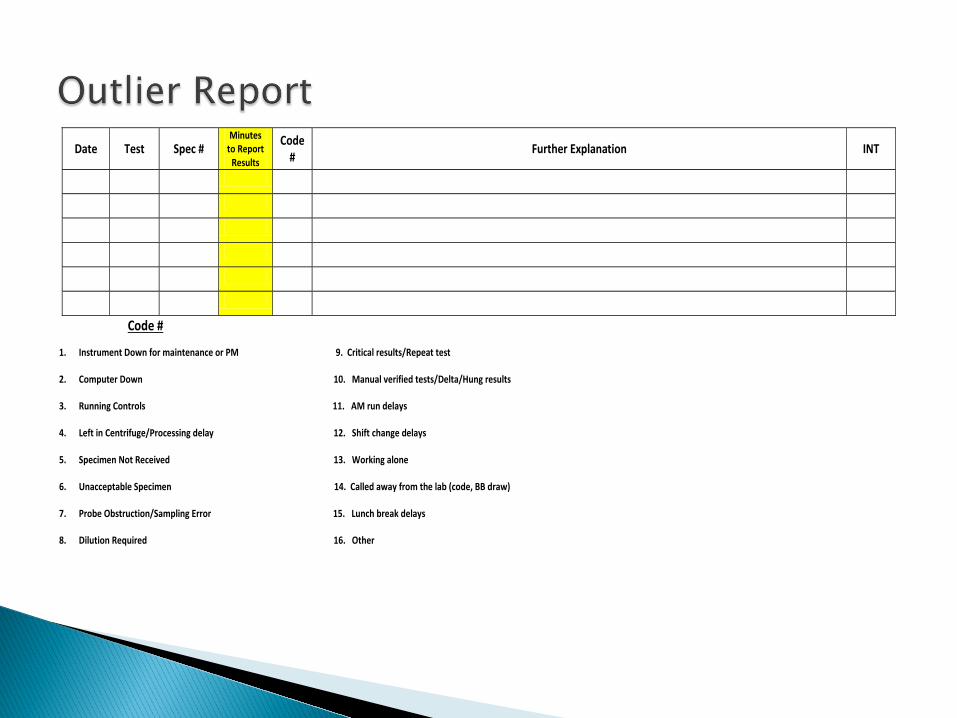
Daily Real time Outlier Reporting
Date Test Spec # Minutes to Report Results
Code # Further Explanation INT
Code #
1. Instrument Down for maintenance or PM 9. Critical results/Repeat test
2. Computer Down 10. Manual verified tests/Delta/Hung results
3. Running Controls 11. AM run delays
4. Left in Centrifuge/Processing delay 12. Shift change delays
5. Specimen Not Received 13. Working alone
6. Unacceptable Specimen 14. Called away from the lab (code, BB draw)
7. Probe Obstruction/Sampling Error 15. Lunch break delays
8. Dilution Required 16. Other
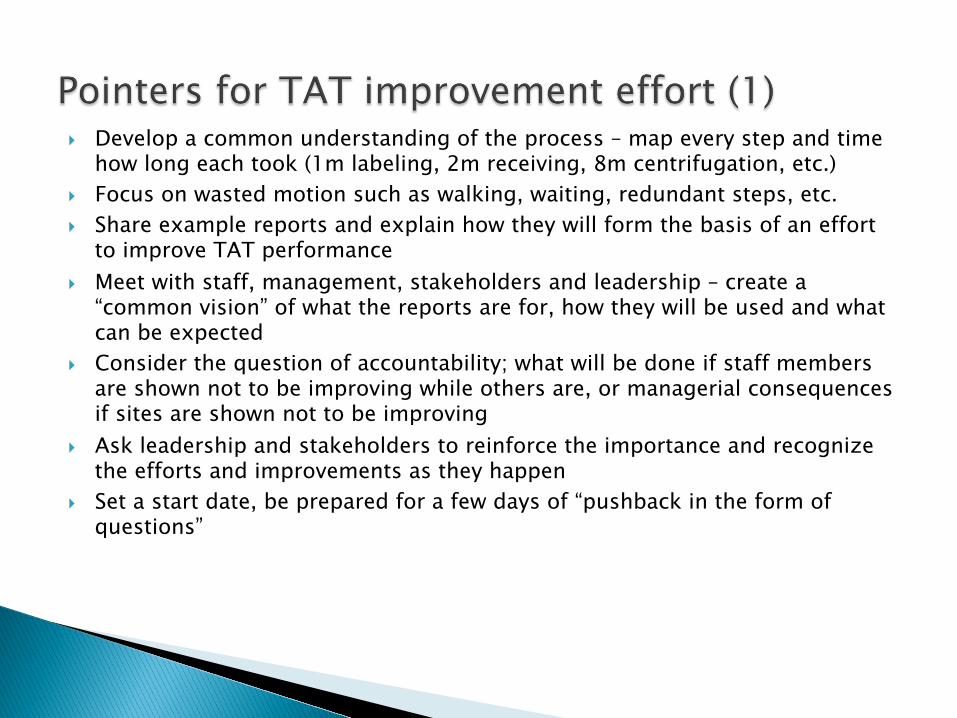
} Develop a common understanding of the process – map every step and time how long each took (1m labeling, 2m receiving, 8m centrifugation, etc.)
} Focus on wasted motion such as walking, waiting, redundant steps, etc. } Share example reports and explain how they will form the basis of an effort
to improve TAT performance } Meet with staff, management, stakeholders and leadership – create a
“common vision” of what the reports are for, how they will be used and what can be expected
} Consider the question of accountability; what will be done if staff members are shown not to be improving while others are, or managerial consequences if sites are shown not to be improving
} Ask leadership and stakeholders to reinforce the importance and recognize the efforts and improvements as they happen
} Set a start date, be prepared for a few days of “pushback in the form of questions”
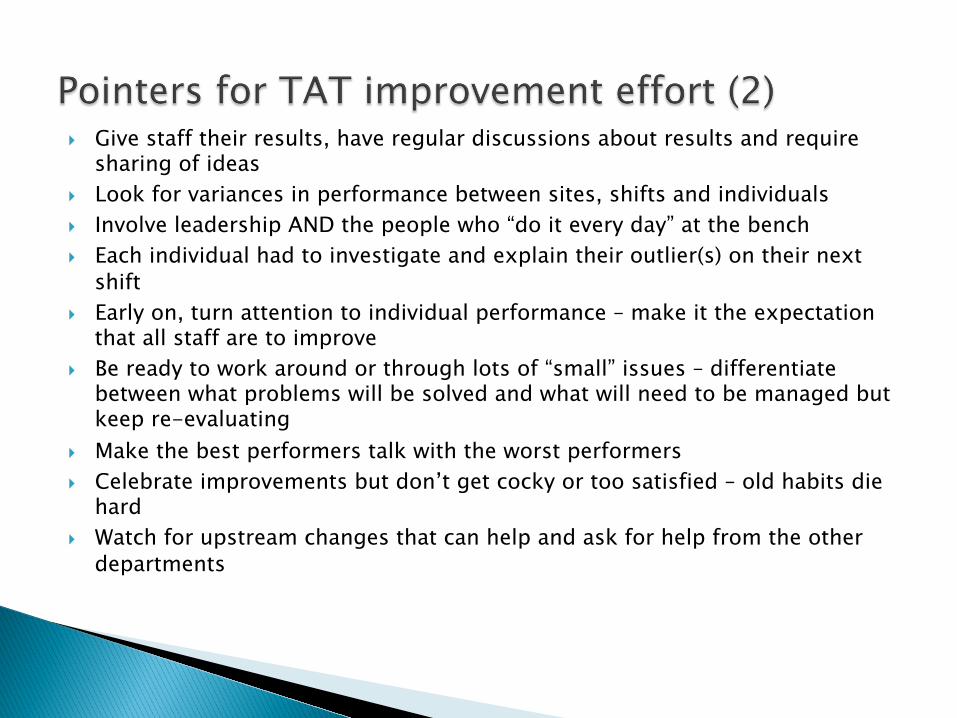
} Give staff their results, have regular discussions about results and require sharing of ideas
} Look for variances in performance between sites, shifts and individuals } Involve leadership AND the people who “do it every day” at the bench } Each individual had to investigate and explain their outlier(s) on their next
shift } Early on, turn attention to individual performance – make it the expectation
that all staff are to improve } Be ready to work around or through lots of “small” issues – differentiate
between what problems will be solved and what will need to be managed but keep re-evaluating
} Make the best performers talk with the worst performers } Celebrate improvements but don’t get cocky or too satisfied – old habits die
hard } Watch for upstream changes that can help and ask for help from the other
departments

Our Experience
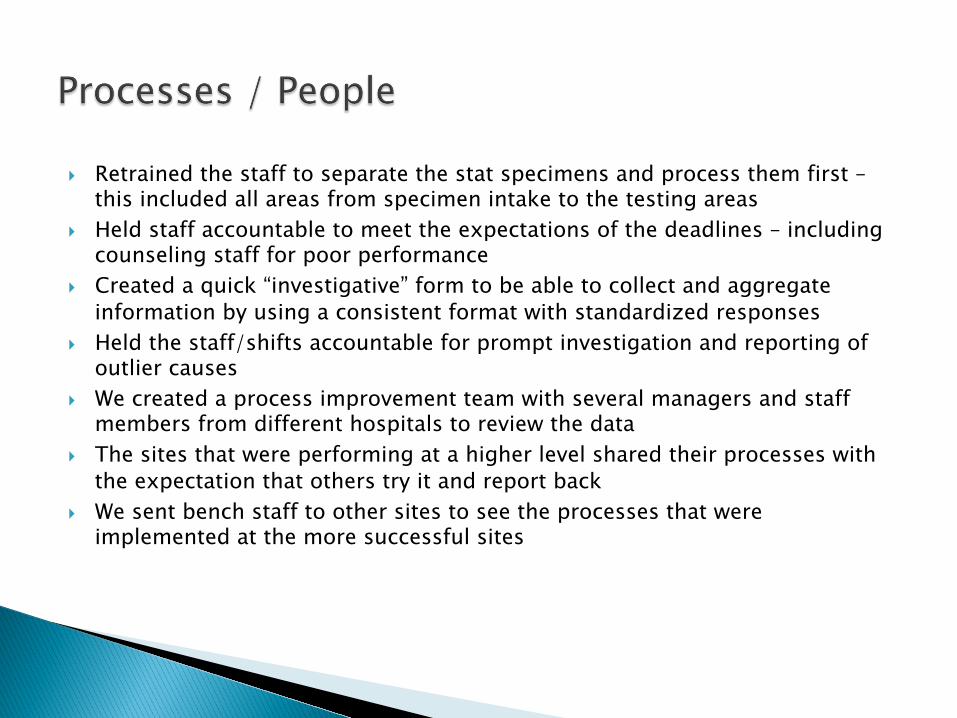
} Retrained the staff to separate the stat specimens and process them first – this included all areas from specimen intake to the testing areas
} Held staff accountable to meet the expectations of the deadlines – including counseling staff for poor performance
} Created a quick “investigative” form to be able to collect and aggregate information by using a consistent format with standardized responses
} Held the staff/shifts accountable for prompt investigation and reporting of outlier causes
} We created a process improvement team with several managers and staff members from different hospitals to review the data
} The sites that were performing at a higher level shared their processes with the expectation that others try it and report back
} We sent bench staff to other sites to see the processes that were implemented at the more successful sites
} We were consistent and transparent in sharing our successes and failures } We share Visiun reports internally and externally, everyone can see the data } We report the information in our daily huddles that were established at each
facility in support of our High Reliability Organizational (HRO) goals } Consistently shared and discussed the reports with the staff } We discussed the outliers with the ED doctors and nursing clinical managers } We eventually created and started emailing the collect to receive reports to
the ED physicians and clinical managers so they could help improve pre-analytic performance
} We reiterated proper labeling with the nursing staff } We celebrate our days of no outliers
} Purchased Stat Spin centrifuges to reduce “spin” time (3 minute spin) } Made sure backup instruments were available for stat testing when volumes
increased } Located the Stat Spins by intake personnel workstations to decrease extra
steps } Re-evaluated who should answer phones } Review of pending log monitors to ensure they were focusing attention on
stat requests } Revision of work schedules - matched manpower to workload } Management of break/lunch times to maintain appropriate workforce in the
laboratory } Some sites placed timers on their centrifuges to alert when centrifuging was
soon to be complete } We changed the rules for the auto-validation of results so that individual test
results were released as they were completed instead of when ALL tests were complete
} We benchmarked our performance against other peers in the Visiun database

Our Results
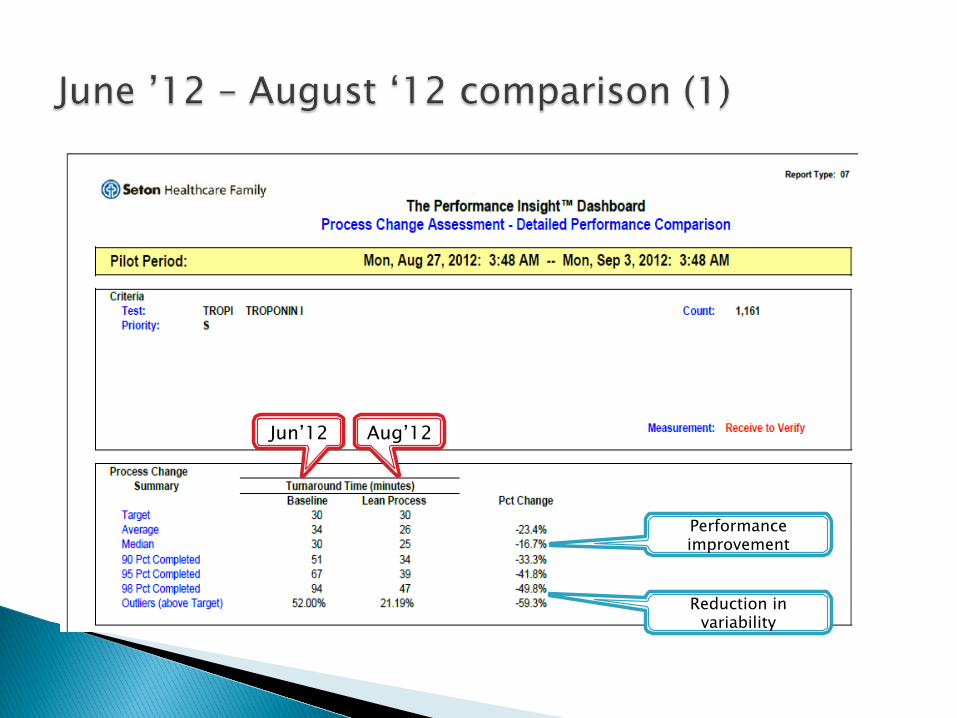
Reduction in variability
Performance improvement
Jun’12 Aug’12

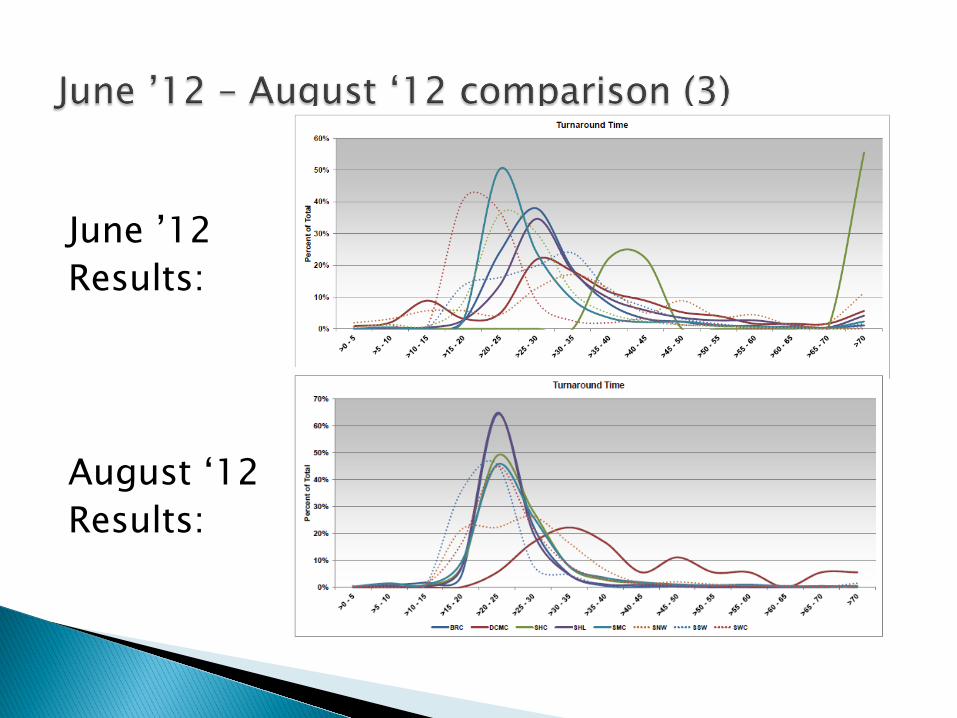
June ’12 Results: August ‘12 Results:

} ED Medical Director requested that we include the collection to receipt interval in the monitoring reports so he could see how the ED was performing when sending specimens to lab
} Based on laboratory’s reported performance, AMI core measures group and ED medical director concluded there was no need to pursue the point of care testing option
The Emergency department is able to rely on laboratory’s consistent performance now ; the almost 15minutes of
TAT improvement and significant reduction in outliers has meant faster decision making on AMI patients