
Fast Target Detection Framework for Onboard Processing · PDF file03/06/2015 ·...
20
Applied Research LLC 1 Fast Target Detection Framework for Onboard Processing of Multispectral and Hyperspectral Images B. Ayhan and C. Kwan June 3, 2015 Applied Research LLC 9605 Medical Center Dr., Rockville, MD20850 Research supported by NASA SBIR Program
Transcript of Fast Target Detection Framework for Onboard Processing · PDF file03/06/2015 ·...
Applied Research LLC
11
Fast Target Detection Framework for Onboard Processing of Multispectral and Hyperspectral Images
B. Ayhan and C. Kwan
June 3, 2015
Applied Research LLC
9605 Medical Center Dr., Rockville, MD20850
Research supported by NASA SBIR Program

Applied Research LLC
22
1. Contents
1. Contents 2
2. Research Objectives 3
3. Technical Approach 4-8
4. Results 9-20

Applied Research LLC
33
2. Research Objectives
33
• Develop a robust, automated, and real-time target detection system under varying illumination, atmospheric conditions and target/sensor viewing geometry.
• Demonstrate the feasibility of the system using actual and/or simulated data.
Applied Research LLC
4
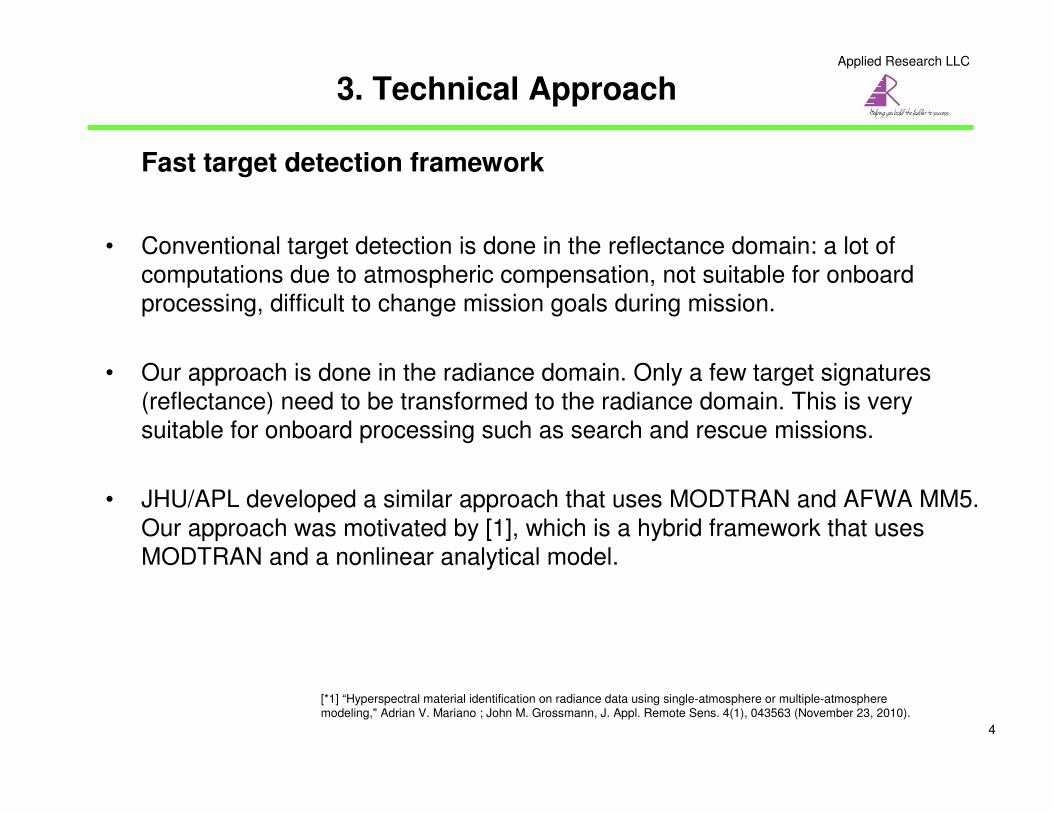
Fast target detection framework
• Conventional target detection is done in the reflectance domain: a lot of
computations due to atmospheric compensation, not suitable for onboard
processing, difficult to change mission goals during mission.
• Our approach is done in the radiance domain. Only a few target signatures
(reflectance) need to be transformed to the radiance domain. This is very
suitable for onboard processing such as search and rescue missions.
• JHU/APL developed a similar approach that uses MODTRAN and AFWA MM5.
Our approach was motivated by [1], which is a hybrid framework that uses
MODTRAN and a nonlinear analytical model.
3. Technical Approach
[*1] “Hyperspectral material identification on radiance data using single-atmosphere or multiple-atmosphere modeling," Adrian V. Mariano ; John M. Grossmann, J. Appl. Remote Sens. 4(1), 043563 (November 23, 2010).

Applied Research LLC
5
• Radiance equation model parameter estimation using MODTRAN outputs [*1]
3. Technical Approach
1 1
A
A A
BAL P D
S S
ρρα ρ
ρ ρ= + + −
− −
ρ : Material reflectance
Aρ : Adjacent region reflectance
S : Spherical albedo
A,B : Coefficients that depend on atmospheric, geometric and solar illumination conditions
P : Path radiance
D : Radiance due to direct solar illumination
α : Amount of solar occlusion
[*1] “Hyperspectral material identification on radiance data using single-atmosphere or multiple-atmosphere modeling," Adrian V. Mariano ; John M. Grossmann, J. Appl. Remote Sens. 4(1), 043563 (November 23, 2010).
L: Radiance

Applied Research LLC
6
• Radiance equation model parameter estimation using MODTRAN outputs [*1]
3. Technical Approach
1 0.05ρ =
2 0.6ρ =
MODTRAN
Simulation
(1)
MODTRAN Output
"DRCT_REFL(1)"
Atmospheric,
geometric and solar
illumination conditions
MODTRAN Output
" GRND_RFLT(1) " Estimation of
radiance equation
parameters
(A,B, D,P and S)
1 1
A
A A
BAL P D
S S
ρρα ρ
ρ ρ= + + −
− −
MODTRAN Output
" SOL_SCAT (1) "
MODTRAN
Simulation
(2)
MODTRAN Output
"DRCT_REFL(2)"
MODTRAN Output" GRND_RFLT(2)"
MODTRAN Output" SOL_SCAT(2) "
DRCT_RFLT: Direct Reflectance (MODTRAN output)
SOL_SCAT: Solar Multiple Scattering (MODTRAN output)
GRND_RFLT: Ground Reflectance (MODTRAN output)
[*1] “Hyperspectral material identification on radiance data using single-atmosphere or multiple-atmosphere modeling," Adrian V. Mariano ; John M. Grossmann, J. Appl. Remote Sens. 4(1), 043563 (November 23, 2010).

Applied Research LLC
7
• Radiance equation model parameter estimation using MODTRAN outputs [*1]
3. Technical Approach
1 1
A
A A
BAL P D
S S
ρρα ρ
ρ ρ= + + −
− −
( ) ( )1 2DRCT_RFLT 1 / DRCT_RFLT / 2D ρ ρ= =
1 11 1
1 1
, 1 1
A BG C P
S Sρ ρ
ρ ρ
ρ ρ= = +
− −
2 22 2
2 2
, 1 1
A BG C P
S Sρ ρ
ρ ρ
ρ ρ= = +
− −
2 2 1 1
2 1
/ /G GS
G G
ρ ρ
ρ ρ
ρ ρ−=
−
2
22
GA G S
ρρ
ρ= −
1 2 2 2 1 1
2 1
( ) / /
1 / 1/
S C C C CP
ρ ρ ρ ρρ ρ
ρ ρ
− + −=
−
11
1( )( )B C P Sρ
ρ= − −
Suppose , and1 1_ (1) and _ (1)C GSOL SCAT GRND RFLTρ ρ= =
2 2_ (2) and _ (2)C GSOL SCAT GRND RFLTρ ρ= =
Then, and
The radiance model parameters can then be found as:
[*1] “Hyperspectral material identification on radiance data using single-atmosphere or multiple-atmosphere modeling," Adrian V. Mariano ; John M. Grossmann, J. Appl. Remote Sens. 4(1), 043563 (November 23, 2010).
Applied Research LLC
Proprietary Information - ARLLC8
3. Technical Approach
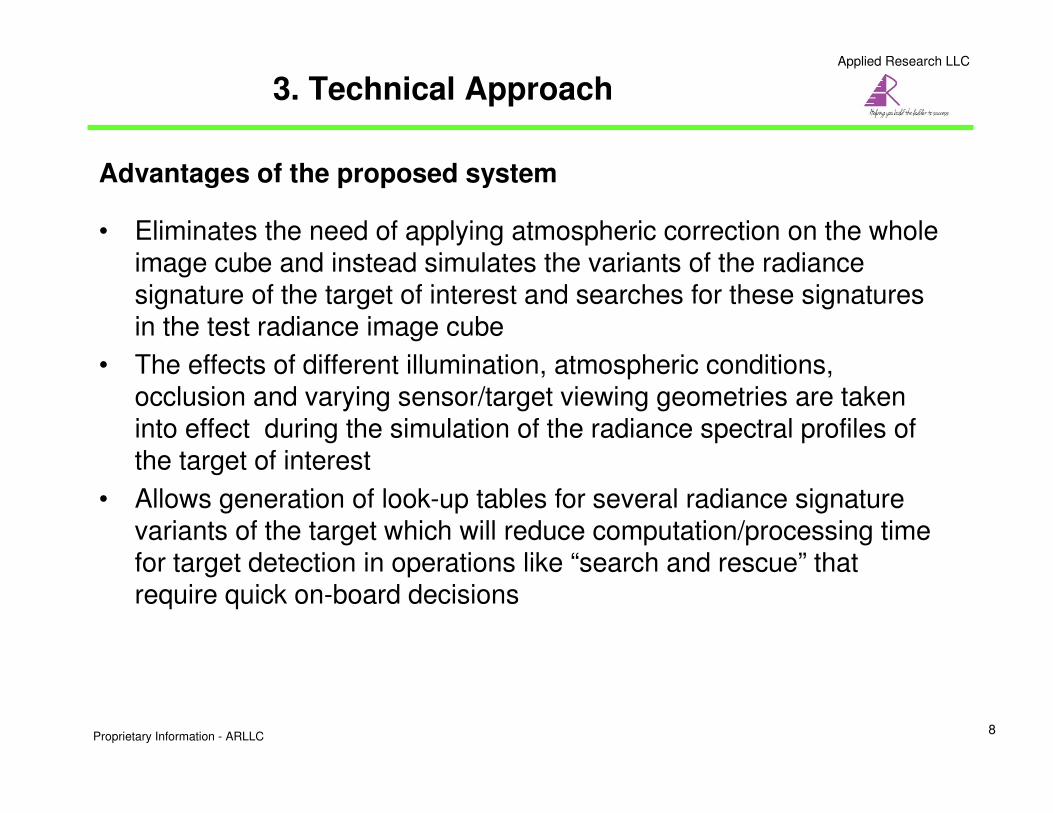
Advantages of the proposed system
• Eliminates the need of applying atmospheric correction on the whole image cube and instead simulates the variants of the radiance signature of the target of interest and searches for these signatures in the test radiance image cube
• The effects of different illumination, atmospheric conditions, occlusion and varying sensor/target viewing geometries are takeninto effect during the simulation of the radiance spectral profiles of the target of interest
• Allows generation of look-up tables for several radiance signature variants of the target which will reduce computation/processing time for target detection in operations like “search and rescue” that require quick on-board decisions

Applied Research LLC
9
• Demonstration of radiance model parameter estimation and simulating radiance profiles with the model parameter estimates
Model Tropical
IHAZE Rural
VIS 5 km
H2OSTR 0.5
Altitude 1 km
Approximate observer position Latitude: 39.3305º (N), Longitude: 76.2879 (W)
Date August 29, 1995
Time data collected 18:37 UTC
Atmospheric, solar illumination and geometric
location parameters used in
two MODTRAN runs to
estimate model parameters
(S, A, P, D, B)
0 500 1000 1500 2000 2500 30000
0.05
0.1
0.15
0.2
0.25
0.3
0.35
0.4
Frequency (nm)
Am
plit
ude
S
0 500 1000 1500 2000 2500 30000
2
4
6
8
10
12
14
16
Frequency (nm)
Am
plit
ude
A
0 500 1000 1500 2000 2500 30000
0.5
1
1.5
2
2.5
3
3.5
Frequency (nm)
Am
plit
ud
e
P
0 500 1000 1500 2000 2500 30000
1
2
3
4
5
6
7
Frequency (nm)
Am
plit
ude
D
0 500 1000 1500 2000 2500 30000
2
4
6
8
10
12
14
16
18
Frequency (nm)
Am
plit
ude
B
S
P
A
D B
Plots of estimated model parameters (S, A, P, D, B)
4. Results
Applied Research LLC
10
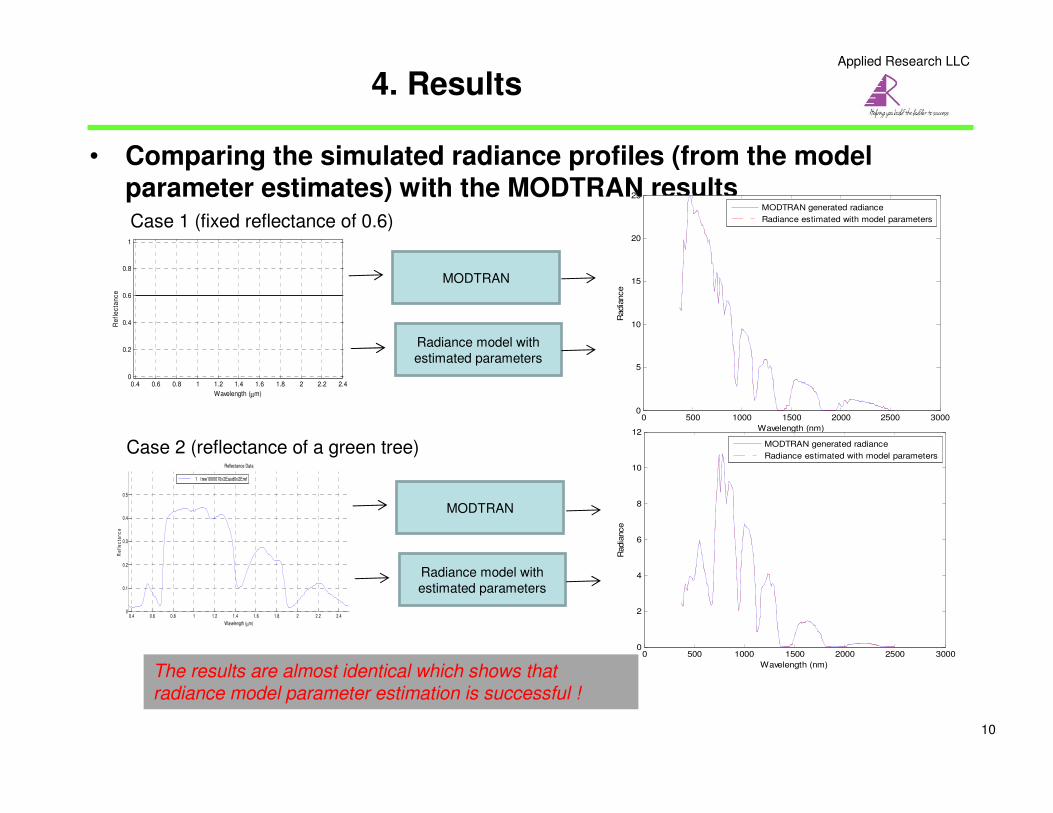
• Comparing the simulated radiance profiles (from the model parameter estimates) with the MODTRAN results
0.4 0.6 0.8 1 1.2 1.4 1.6 1.8 2 2.2 2.40
0.1
0.2
0.3
0.4
0.5
Reflectance Data
Wavelength (µm)
Re
fle
cta
nc
e
1 tree1000010x2Easd0x2Eref
Case 2 (reflectance of a green tree)
Case 1 (fixed reflectance of 0.6)
0.4 0.6 0.8 1 1.2 1.4 1.6 1.8 2 2.2 2.40
0.2
0.4
0.6
0.8
1
Wavelength (µm)
Re
fle
cta
nc
e
MODTRAN
Radiance model with
estimated parameters
MODTRAN
Radiance model with
estimated parameters
0 500 1000 1500 2000 2500 30000
5
10
15
20
25
Wavelength (nm)
Radia
nce
MODTRAN generated radiance
Radiance estimated with model parameters
0 500 1000 1500 2000 2500 30000
2
4
6
8
10
12
Wavelength (nm)
Radia
nce
MODTRAN generated radiance
Radiance estimated with model parameters
The results are almost identical which shows that radiance model parameter estimation is successful !
4. Results

Applied Research LLC
11
• AVIRIS data for Los Angeles Station Fire (Aug 2009) to detect burnscar
The Station Fire took place between August 26 and October 16, and a total of 160,577
acres (251 sq mi; 650 km2) were affected, 209 structures had been destroyed, including
89 homes [*2]. It first started in the Angeles National Forest near the U.S. Forest Service
ranger station on the Angeles Crest Highway (State Highway 2) [*2].
[*2] http://en.wikipedia.org/wiki/2009_California_wildfires
AVIRIS images acquired on October 6, 2009 (fire is mostly over)
4. Results

Applied Research LLC
12
• Getting groundtruth of burned locations for AVIRIS data using MODIS MCD45A1 product
500 1000 1500 2000
500
1000
1500
2000
20 40 60 80 100 120
10
20
30
40
50
60
70
80
90
MODIS H8-V5 tile (Los Angeles region falls into this tile)
MCD45A1 burned area product for this tile for Sep 2009 (red pixels indicate burned areas)
Zoom into the region for the LA Station Fire in MCD45A1 product
Based on AVIRIS image data coverage for each strip the groundtruth maps for burned area are extracted
4. Results
Applied Research LLC
13
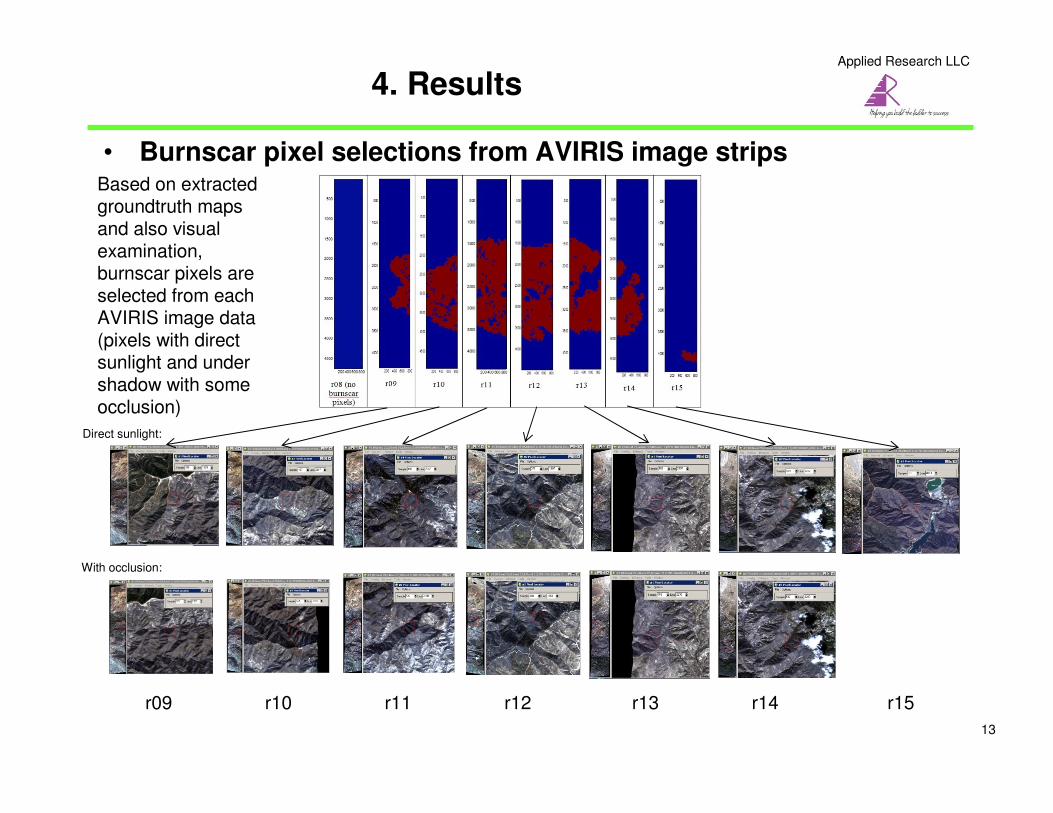
• Burnscar pixel selections from AVIRIS image strips
Direct sunlight:
With occlusion:
Based on extracted groundtruth maps and also visual examination, burnscar pixels are selected from each AVIRIS image data (pixels with direct sunlight and under shadow with some occlusion)
r09 r10 r11 r12 r13 r14 r15
4. Results

Applied Research LLC
14
• Radiance and reflectance signatures of selected burnscar pixelsActual radiance
signatures of selected pixels
(in DN)
0 500 1000 1500 2000 2500 3000
200
400
600
800
1000
1200
1400
1600
1800
2000
2200
Wavelength (nm)
Radia
nce
r09 (Sample:389, Line:1929)
r09 (Sample:575, Line:1955)
r10 (Sample:3437, Line:2887)
r10 (Sample:665 Line:2778)
r11 (Sample:498, Line:2043)
r11 (Sample:532, Line:2298)
r12 (Sample:377, Line:1997)
r12 (Sample:398, Line:1953)
r13 (Sample:182, Line:2197)
r13 (Sample:163, Line:2235)
r14 (Sample:519, Line:3232)
r14 (Sample:537, Line:3280)
r15 (Sample:619, Line:4013)
2 3 4 5 6 7
500
1000
1500
2000
MODIS band index
Radia
nce (7 M
ODIS
bands)
r09 (Sample:389, Line:1929)
r09 (Sample:575, Line:1955)
r10 (Sample:3437, Line:2887)
r10 (Sample:665 Line:2778)
r11 (Sample:498, Line:2043)
r11 (Sample:532, Line:2298)
r12 (Sample:377, Line:1997)
r12 (Sample:398, Line:1953)
r13 (Sample:182, Line:2197)
r13 (Sample:163, Line:2235)
r14 (Sample:519, Line:3232)
r14 (Sample:537, Line:3280)
r15 (Sample:619, Line:4013)
Actual radiance
signatures of selected pixels
(in DN) for
MODIS bands only
MODIS bands: 648 nm, 858 nm, 470 nm, 555 nm, 1240 nm, 1640 nm, and 2130 nm (In target
detection investigations in this work, we used the 7 bands that are closest to these MODIS bands )
0 500 1000 1500 2000 2500
0
0.1
0.2
0.3
0.4
0.5
0.6
0.7
0.8
0.9
1
Wavelength (nm)
Reflecta
nce
r09 (Sample:389, Line:1929)
r09 (Sample:575, Line:1955)
r10 (Sample:3437, Line:2887)
r10 (Sample:665 Line:2778)
r11 (Sample:498, Line:2043)
r11 (Sample:532, Line:2298)
r12 (Sample:377, Line:1997)
r12 (Sample:398, Line:1953)
r13 (Sample:182, Line:2197)
r13 (Sample:163, Line:2235)
r14 (Sample:519, Line:3232)
r14 (Sample:537, Line:3280)
r15 (Sample:619, Line:4013)
Reflectance
signatures of selected pixels
(after QUAC atmospheric
correction)
1 2 3 4 5 6 70
0.1
0.2
0.3
0.4
0.5
0.6
0.7
Wavelength (nm)
Reflecta
nce
r09 (Sample:389, Line:1929)
r09 (Sample:575, Line:1955)
r10 (Sample:3437, Line:2887)
r10 (Sample:665 Line:2778)
r11 (Sample:498, Line:2043)
r11 (Sample:532, Line:2298)
r12 (Sample:377, Line:1997)
r12 (Sample:398, Line:1953)
r13 (Sample:182, Line:2197)
r13 (Sample:163, Line:2235)
r14 (Sample:519, Line:3232)
r14 (Sample:537, Line:3280)
r15 (Sample:619, Line:4013)
Reflectance
signatures of selected pixels
after QUAC atmospheric
correction (MODIS bands
only)
4. Results

Applied Research LLC
0 500 1000 1500 2000 25000
0.1
0.2
0.3
0.4
0.5
0.6
0.7
Wavelength (nm)
Reflecta
nce
r09 (Sample:389, Line:1929)
r09 (Sample:575, Line:1955)
r10 (Sample:3437, Line:2887)
r10 (Sample:665 Line:2778)
r11 (Sample:498, Line:2043)
r11 (Sample:532, Line:2298)
r12 (Sample:377, Line:1997)
r12 (Sample:398, Line:1953)
r13 (Sample:182, Line:2197)
r13 (Sample:163, Line:2235)
r14 (Sample:519, Line:3232)
r14 (Sample:537, Line:3280)
r15 (Sample:619, Line:4013)
15
• Atmospheric, illumination and geometric location conditions used in radiance model parameter estimation and simulation of radiance signatures for the selected reflectance profiles
Geometric locations of the AVIRIS image strips and corresponding UTC values
AVIRIS
Image Strip Min Lat Min Long Max Lat Max Long UTC
Ground
Elevation (km)
r09 34.1436 -118.376 34.5639 -118.276 18:51
0.67
r10 34.1488 -118.31 34.6222 -118.208 19:01
0.93
r11 34.152 -118.236 34.5625 -118.133 19:11 0.98
r12 34.1571 -118.165 34.5788 -118.066 19:21
1.11
r13 34.1603 -118.091 34.5626 -117.99 19:29
1.22
r14 34.1575 -118.022 34.5984 -117.924 19:39
1.17
r15 34.1634 -117.943 34.563 -117.847 19:48
1.18
Model Mid Latitude Summer (MODEL = 2)
VIS (Visibility) 20 km
H2OSTR (Water vapor) 0.270
IHAZE Rural (IHAZE =1)
Altitude 14 km
Observer position (see above table for observer positions)
Data collection day Oct 6, 2009
Data collection time (see above table for UTC times)
Atmospheric and time/date conditions
Variants of selected burnscar reflectance profiles (based on QUAC)
4. Results
Applied Research LLC
16
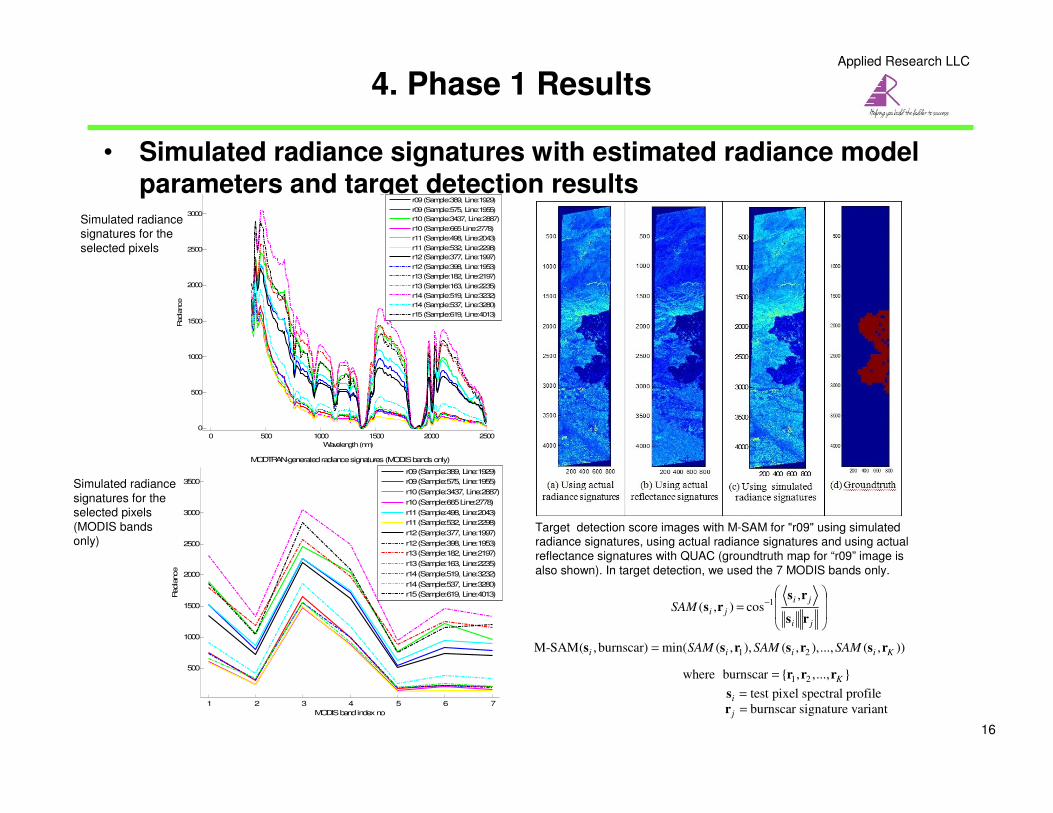
• Simulated radiance signatures with estimated radiance model parameters and target detection results
0 500 1000 1500 2000 2500
0
500
1000
1500
2000
2500
3000
Wavelength (nm)
Radia
nce
r09 (Sample:389, Line:1929)
r09 (Sample:575, Line:1955)
r10 (Sample:3437, Line:2887)
r10 (Sample:665 Line:2778)
r11 (Sample:498, Line:2043)
r11 (Sample:532, Line:2298)
r12 (Sample:377, Line:1997)
r12 (Sample:398, Line:1953)
r13 (Sample:182, Line:2197)
r13 (Sample:163, Line:2235)
r14 (Sample:519, Line:3232)
r14 (Sample:537, Line:3280)
r15 (Sample:619, Line:4013)
1 2 3 4 5 6 7
500
1000
1500
2000
2500
3000
3500
MODIS band index no
Radia
nce
MODTRAN-generated radiance signatures (MODIS bands only)
r09 (Sample:389, Line:1929)
r09 (Sample:575, Line:1955)
r10 (Sample:3437, Line:2887)
r10 (Sample:665 Line:2778)
r11 (Sample:498, Line:2043)
r11 (Sample:532, Line:2298)
r12 (Sample:377, Line:1997)
r12 (Sample:398, Line:1953)
r13 (Sample:182, Line:2197)
r13 (Sample:163, Line:2235)
r14 (Sample:519, Line:3232)
r14 (Sample:537, Line:3280)
r15 (Sample:619, Line:4013)
= −
ji
ji
jiSAMrs
rs
rs
,cos),( 1
1 2M-SAM( ,burnscar) min( ( , ), ( , ),..., ( , ))i i i i KSAM SAM SAM=s s r s r s r
1 2where burnscar { , ,..., }K= r r r
Simulated radiance signatures for the
selected pixels
Simulated radiance
signatures for the selected pixels
(MODIS bands only)
Target detection score images with M-SAM for "r09" using simulated radiance signatures, using actual radiance signatures and using actual
reflectance signatures with QUAC (groundtruth map for “r09” image is
also shown). In target detection, we used the 7 MODIS bands only.
test pixel spectral profilei =s
burnscar signature variantj =r
4. Phase 1 Results

Applied Research LLC
17
• ROC curves with M-SAM detection technique for AVIRIS images
0 0.1 0.2 0.3 0.4 0.5 0.6 0.7 0.8 0.9 10
0.1
0.2
0.3
0.4
0.5
0.6
0.7
0.8
0.9
1
False alarm rate
Pro
bability
of dete
ction
r09
Actual radiance signatures with M-SAM
Actual reflectance signatures with M-SAM
MODTRAN-simulated radiance signatures with M-SAM
0 0.1 0.2 0.3 0.4 0.5 0.6 0.7 0.8 0.9 10
0.1
0.2
0.3
0.4
0.5
0.6
0.7
0.8
0.9
1
False alarm rate
Pro
bability
of dete
ction
r10
Actual radiance signatures with M-SAM
Actual reflectance signatures with M-SAM
MODTRAN-simulated radiance signatures with M-SAM
0 0.1 0.2 0.3 0.4 0.5 0.6 0.7 0.8 0.9 10
0.1
0.2
0.3
0.4
0.5
0.6
0.7
0.8
0.9
1
False alarm rate
Pro
bability
of dete
ction
r11
Actual radiance signatures with M-SAM
Actual reflectance signatures with M-SAM
MODTRAN-simulated radiance signatures with M-SAM
0 0.1 0.2 0.3 0.4 0.5 0.6 0.7 0.8 0.9 10
0.1
0.2
0.3
0.4
0.5
0.6
0.7
0.8
0.9
1
False alarm rate
Pro
bability
of dete
ction
r12
Actual radiance signatures with M-SAM
Actual reflectance signatures with M-SAM
MODTRAN-simulated radiance signatures with M-SAM
r09
r11
r10
r12
4. Results

Applied Research LLC
18
• ROC curves with M-SAM detection technique
0 0.1 0.2 0.3 0.4 0.5 0.6 0.7 0.8 0.9 10
0.1
0.2
0.3
0.4
0.5
0.6
0.7
0.8
0.9
1
False alarm rate
Pro
bability
of dete
ction
r13
Actual radiance signatures with M-SAM
Actual reflectance signatures with M-SAM
MODTRAN-simulated radiance signatures with M-SAM
0 0.1 0.2 0.3 0.4 0.5 0.6 0.7 0.8 0.9 10
0.1
0.2
0.3
0.4
0.5
0.6
0.7
0.8
0.9
1
False alarm rate
Pro
bability
of dete
ction
r14
Actual radiance signatures with M-SAM
Actual reflectance signatures with M-SAM
MODTRAN-simulated radiance signatures with M-SAM
r13 r14
4. Results
0 0.1 0.2 0.3 0.4 0.5 0.6 0.7 0.8 0.9 10
0.1
0.2
0.3
0.4
0.5
0.6
0.7
0.8
0.9
1
False alarm rate
Pro
bability
of dete
ction
r15
Actual radiance signatures with M-SAM
Actual reflectance signatures with M-SAM
MODTRAN-simulated radiance signatures with M-SAM
r15

Applied Research LLC
19
• AUC (Area under curve) measures from ROC curves
AVIRIS
Filename
Analysis Type
Using
actual radiance
signatures
(target detection
in radiance
domain)
Using
QUAC reflectance
signatures (target
detection in
reflectance
domain)
Using simulated
radiance signatures
(reflectances are from
QUAC) (target
detection in radiance
domain )
r09 AUC(overall) 0.8958 0.8856 0.8935
AUC(partial) 0.0761 0.0750 0.0745
r10 AUC(overall) 0.9395 0.9183 0.9400
AUC(partial) 0.0655 0.0612 0.0653
r11 AUC(overall) 0.9028 0.8814 0.9087
AUC(partial) 0.0427 0.0472 0.0471
r12 AUC(overall) 0.8696 0.8487 0.8783
AUC(partial) 0.0473 0.0544 0.0514
r13 AUC(overall) 0.8772 0.8601 0.8771
AUC(partial) 0.0691 0.0679 0.0676
r14 AUC(overall) 0.8370 0.8055 0.8415
AUC(partial) 0.0648 0.0631 0.0659
r15 AUC(overall) 0.8536 0.7794 0.8713
AUC(partial) 0.0676 0.0585 0.0687
Overall: Whole ROC curve is used in AUC computationPartial: ROC curve up to a false alarm rate of 0.1 is used in AUC computation
4. Results
Applied Research LLC
20
• Observations
- With the simulated radiance signature library using estimated radiance models, we observed detection performances close to the detection performance obtained with using actual radiance signatures that are retrieved from actual images and in some cases slightly better than those.
- It is possible that if a better set of MODTRAN parameters has been selected in the radiance model parameter estimation that fully complies with the atmospheric conditions during the actualdata acquisition, or a more realistic set of reflectance signature variations for burnscar has been used, the detection performances could perhaps be further improved.
- These results are found highly promising in demonstrating the feasibility and effectiveness of the proposed fast target detection idea.
4. Results


