FAST MOVING CONSUMER GOODS (FMCG) - IBEF · · 2017-11-14For updated information, please visit ...
39
For updated information, please visit www.ibef.org November 2017 FAST MOVING CONSUMER GOODS (FMCG)
Transcript of FAST MOVING CONSUMER GOODS (FMCG) - IBEF · · 2017-11-14For updated information, please visit ...
For updated information, please visit www.ibef.org November 2017
FAST MOVING
CONSUMER GOODS
(FMCG)
Table of Content
Advantage India…………………..….……. 4
Market Overview and Trends………..…….6
Strategies adopted……………....………...16
Growth Drivers…….………………............18
Case Studies……….……….......…………30
Industry Organisations……….……….......34
Porters Five Forces Framework…….……15
Executive Summary……………….….…….3
Opportunities.....…………………………...27
Useful Information……….……….......…...36
For updated information, please visit www.ibef.org FMCG 3
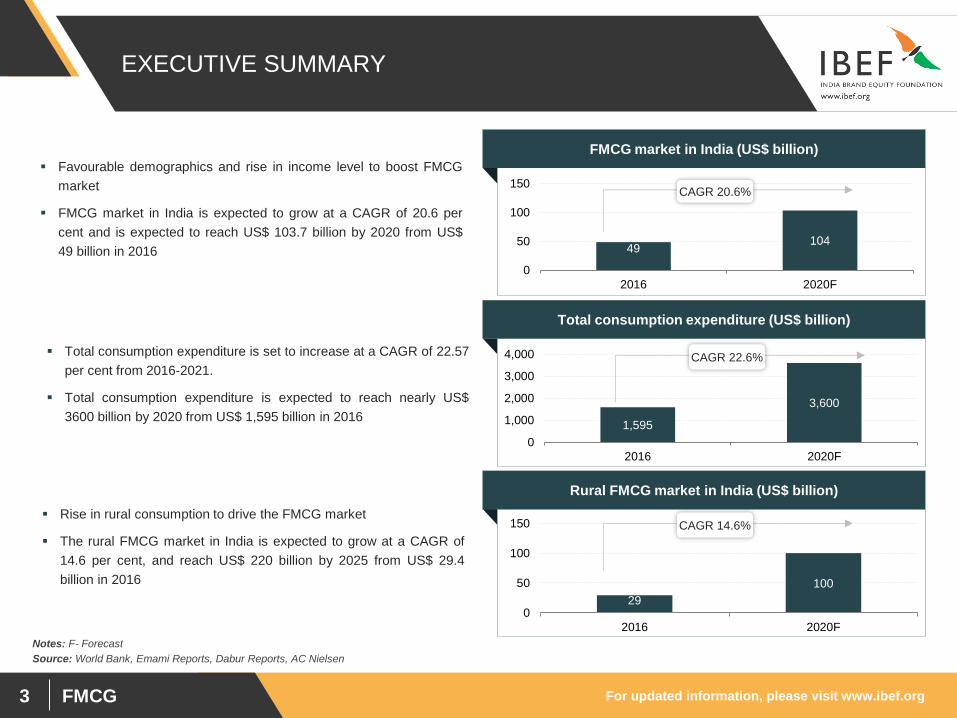
EXECUTIVE SUMMARY
Total consumption expenditure (US$ billion)
1,595
3,600
0
1,000
2,000
3,000
4,000
2016 2020F
Rural FMCG market in India (US$ billion)
29
100
0
50
100
150
2016 2020F
FMCG market in India (US$ billion)
Source: World Bank, Emami Reports, Dabur Reports, AC Nielsen
Notes: F- Forecast
49 104
0
50
100
150
2016 2020F
Favourable demographics and rise in income level to boost FMCG
market
FMCG market in India is expected to grow at a CAGR of 20.6 per
cent and is expected to reach US$ 103.7 billion by 2020 from US$
49 billion in 2016
Total consumption expenditure is set to increase at a CAGR of 22.57
per cent from 2016-2021.
Total consumption expenditure is expected to reach nearly US$
3600 billion by 2020 from US$ 1,595 billion in 2016
Rise in rural consumption to drive the FMCG market
The rural FMCG market in India is expected to grow at a CAGR of
14.6 per cent, and reach US$ 220 billion by 2025 from US$ 29.4
billion in 2016
CAGR 20.6%
CAGR 22.6%
CAGR 14.6%
FMCG
ADVANTAGE INDIA

For updated information, please visit www.ibef.org FMCG 5
ADVANTAGE INDIA
Rising incomes and growing youth
population have been key growth drivers
of the sector. Brand consciousness has
also aided demand
India’s consumer spending is expected to
increase to US$ 3.6 trillion by 2020 and
India’s contribution to global consumption
is expected to more than double to 5.8 per
cent by 2020.*
Tier II/III cities are witnessing faster
growth in modern trade
Low penetration levels in rural market offers
room for growth
Disposable income in rural India has
increased due to the direct cash transfer
scheme
Exports is another growing segment
E-commerce companies like Amazon are
strengthening their business in FMCG
sector, by positioning their platform pantry
as front line offering to drive daily products
sales.
Many players are expanding into new
geographies and categories
Modern retail share is expected to triple its
growth from US$60 billion in 2015 to US$180
billion in 2020
With an investment of US$254.50 million,
Wipro is diversifying and expanding its product
range in energy drinks, detergents and fabric
conditioners.
Patanjali will spend US$743.72 million in
various food parks in Maharashtra, M.P.
Assam, Andhra Pradesh and Uttar Pradesh.
Investment approval of up to 100 per cent
foreign equity in single brand retail and 51
per cent in multi-brand retail
Initiatives like Food Security Bill and direct
cash transfer subsidies reach about 40 per
cent of households in India
The minimum capitalisation for foreign
FMCG companies to invest in India is
US$100 million
ADVANTAGE
INDIA
Source: Emami
Note: E – Estimated, F – Forecast, * - as per a report by BCG and CII
FMCG
MARKET
OVERVIEW AND
TRENDS
For updated information, please visit www.ibef.org FMCG 7
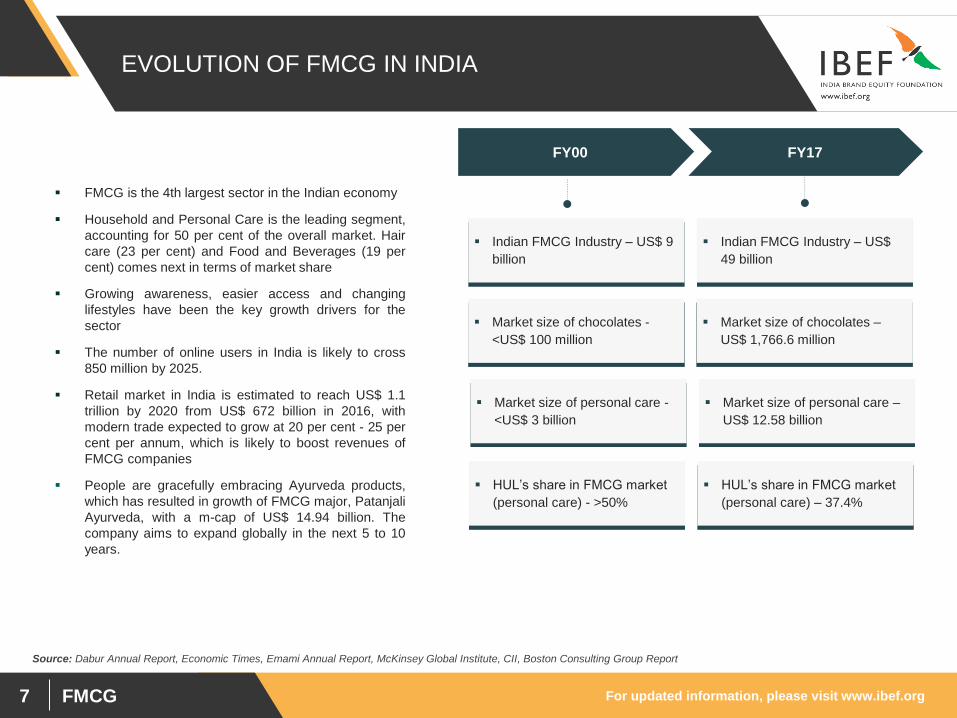
EVOLUTION OF FMCG IN INDIA
Source: Dabur Annual Report, Economic Times, Emami Annual Report, McKinsey Global Institute, CII, Boston Consulting Group Report
FY00 FY17
Indian FMCG Industry – US$ 9
billion
Market size of chocolates -
<US$ 100 million
Market size of personal care -
<US$ 3 billion
HUL’s share in FMCG market
(personal care) - >50%
Indian FMCG Industry – US$
49 billion
Market size of chocolates –
US$ 1,766.6 million
Market size of personal care –
US$ 12.58 billion
HUL’s share in FMCG market
(personal care) – 37.4%
FMCG is the 4th largest sector in the Indian economy
Household and Personal Care is the leading segment,
accounting for 50 per cent of the overall market. Hair
care (23 per cent) and Food and Beverages (19 per
cent) comes next in terms of market share
Growing awareness, easier access and changing
lifestyles have been the key growth drivers for the
sector
The number of online users in India is likely to cross
850 million by 2025.
Retail market in India is estimated to reach US$ 1.1
trillion by 2020 from US$ 672 billion in 2016, with
modern trade expected to grow at 20 per cent - 25 per
cent per annum, which is likely to boost revenues of
FMCG companies
People are gracefully embracing Ayurveda products,
which has resulted in growth of FMCG major, Patanjali
Ayurveda, with a m-cap of US$ 14.94 billion. The
company aims to expand globally in the next 5 to 10
years.
For updated information, please visit www.ibef.org FMCG 8
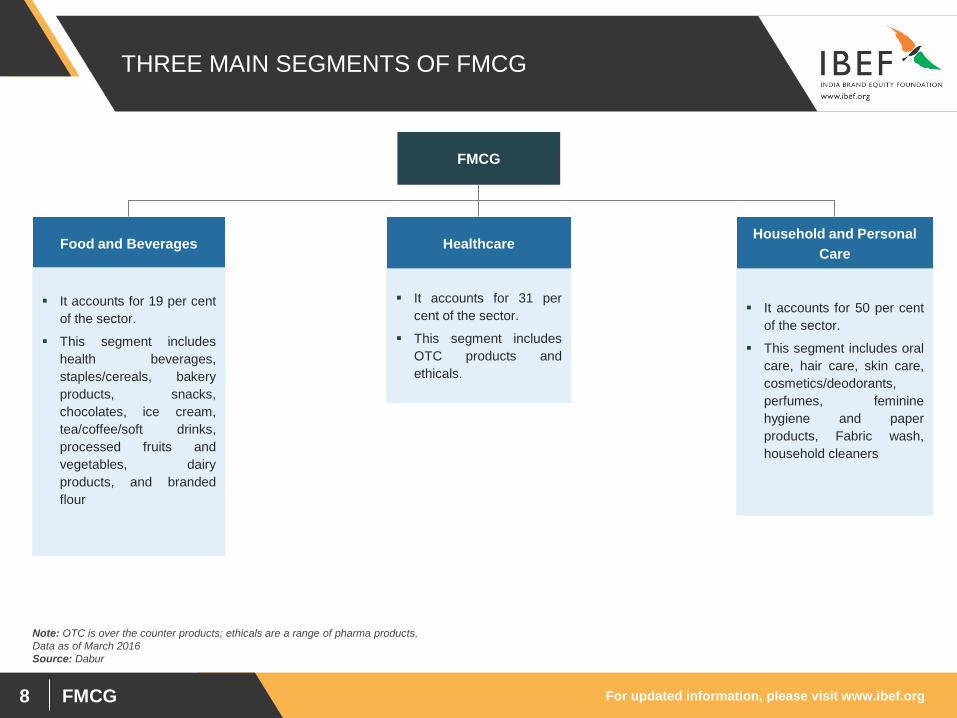
THREE MAIN SEGMENTS OF FMCG
Food and Beverages Healthcare Household and Personal
Care
It accounts for 19 per cent
of the sector.
This segment includes
health beverages,
staples/cereals, bakery
products, snacks,
chocolates, ice cream,
tea/coffee/soft drinks,
processed fruits and
vegetables, dairy
products, and branded
flour
It accounts for 31 per
cent of the sector.
This segment includes
OTC products and
ethicals.
It accounts for 50 per cent
of the sector.
This segment includes oral
care, hair care, skin care,
cosmetics/deodorants,
perfumes, feminine
hygiene and paper
products, Fabric wash,
household cleaners
FMCG
Note: OTC is over the counter products; ethicals are a range of pharma products,
Data as of March 2016
Source: Dabur
For updated information, please visit www.ibef.org FMCG 9
Note: F - Forecast
Source: Dabur, AC Nielsen
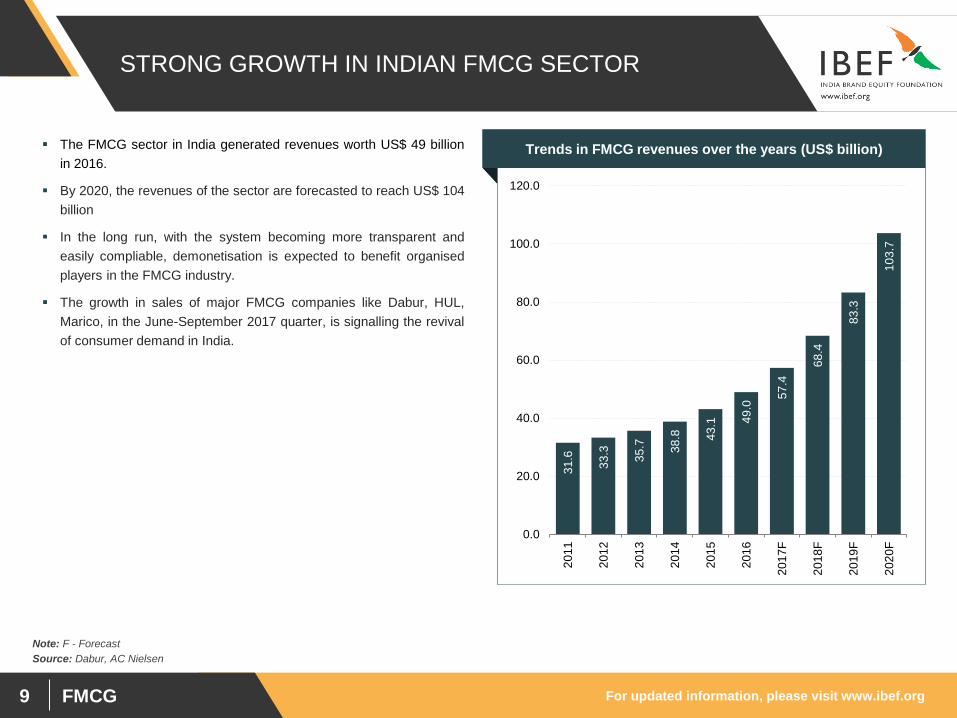
The FMCG sector in India generated revenues worth US$ 49 billion
in 2016.
By 2020, the revenues of the sector are forecasted to reach US$ 104
billion
In the long run, with the system becoming more transparent and
easily compliable, demonetisation is expected to benefit organised
players in the FMCG industry.
The growth in sales of major FMCG companies like Dabur, HUL,
Marico, in the June-September 2017 quarter, is signalling the revival
of consumer demand in India.
Visakhapatnam port traffic (million tonnes) Trends in FMCG revenues over the years (US$ billion)
31
.6
33
.3
35
.7
38
.8
43
.1
49
.0 5
7.4
68
.4
83
.3
10
3.7
0.0
20.0
40.0
60.0
80.0
100.0
120.0
201
1
201
2
201
3
201
4
201
5
201
6
201
7F
201
8F
201
9F
202
0F
STRONG GROWTH IN INDIAN FMCG SECTOR
For updated information, please visit www.ibef.org FMCG 10
FOOD AND PERSONAL CARE ACCOUNT FOR 2/3rd
SHARE IN REVENUES
Source: Dabur
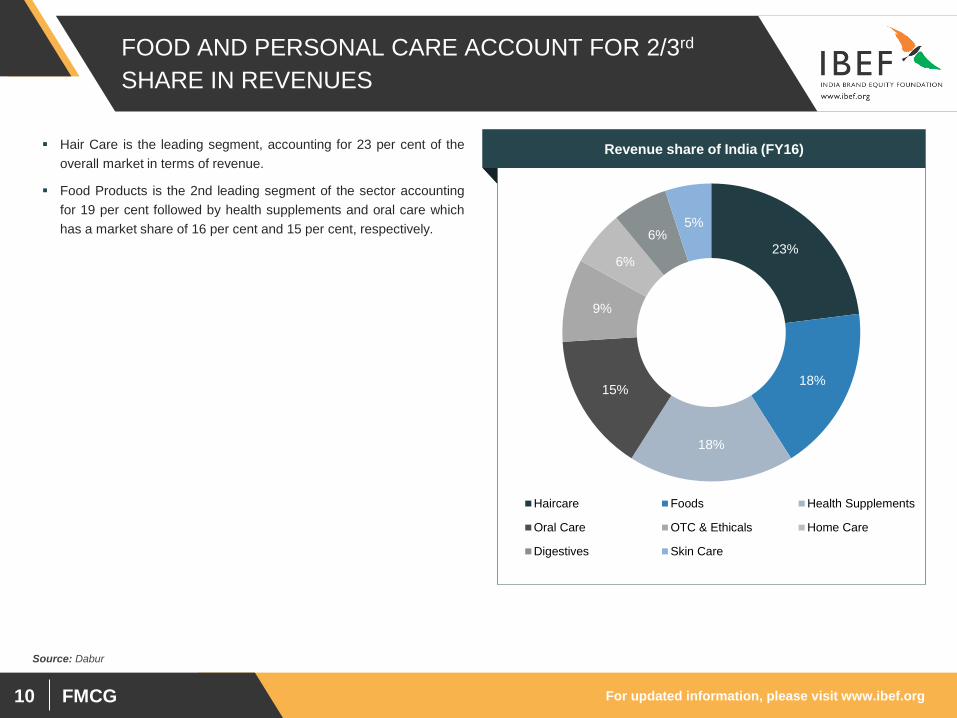
Visakhapatnam port traffic (million tonnes) Revenue share of India (FY16) Hair Care is the leading segment, accounting for 23 per cent of the
overall market in terms of revenue.
Food Products is the 2nd leading segment of the sector accounting
for 19 per cent followed by health supplements and oral care which
has a market share of 16 per cent and 15 per cent, respectively.
23%
18%
18%
15%
9%
6%
6% 5%
Haircare Foods Health Supplements
Oral Care OTC & Ethicals Home Care
Digestives Skin Care
23%

For updated information, please visit www.ibef.org FMCG 11
URBAN MARKET ACCOUNTS FOR MAJOR CHUNK OF
REVENUES
Source: BCG , KPMG- indiaretailing.com, Deloitte Report, Winning in India’s Retail Sector
Urban – Rural industry Breakup (FY2016-17)
Note: E – estimate
Accounting for a revenue share of around 60 per cent, urban
segment is the largest contributor to the overall revenue generated
by the FMCG sector in India and recorded a market size of around
US$ 29.4 billion in 2016-17.
Semi-urban and rural segments are growing at a rapid pace and
accounted for a revenue share of 40 per cent in the overall revenues
recorded by FMCG sector in India.
In the last few years, the FMCG market has grown at a faster pace in
rural India compared with urban India.
FMCG products account for 50 per cent of total rural spending.
60%
40%
US$ 49 billion
Urban Rural
For updated information, please visit www.ibef.org FMCG 12
RURAL SEGMENT IS QUICKLY CATCHING UP
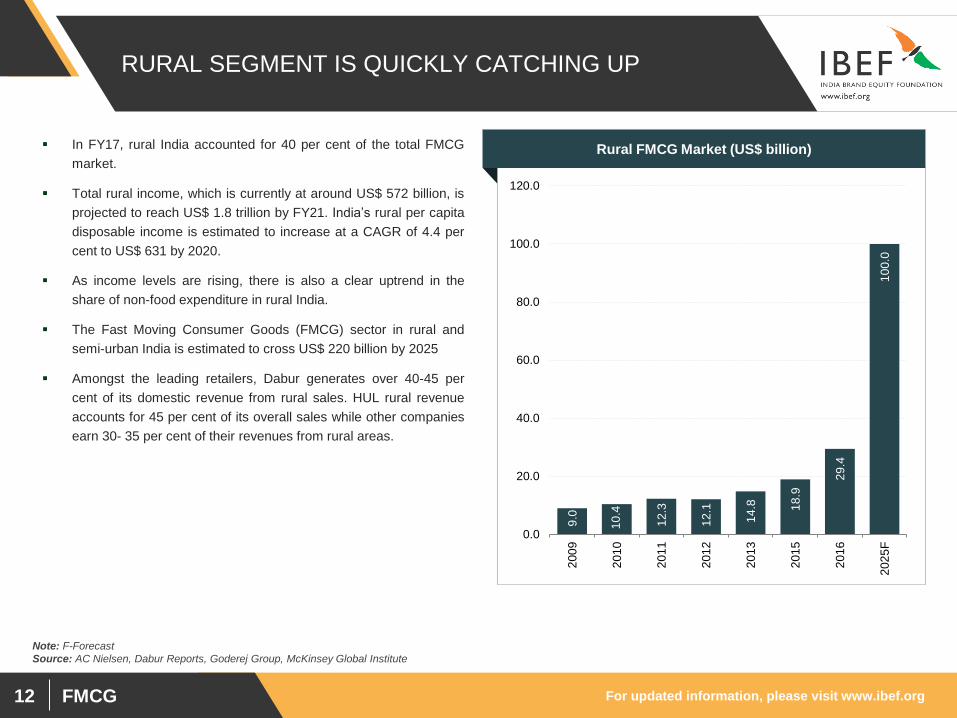
In FY17, rural India accounted for 40 per cent of the total FMCG
market.
Total rural income, which is currently at around US$ 572 billion, is
projected to reach US$ 1.8 trillion by FY21. India’s rural per capita
disposable income is estimated to increase at a CAGR of 4.4 per
cent to US$ 631 by 2020.
As income levels are rising, there is also a clear uptrend in the
share of non-food expenditure in rural India.
The Fast Moving Consumer Goods (FMCG) sector in rural and
semi-urban India is estimated to cross US$ 220 billion by 2025
Amongst the leading retailers, Dabur generates over 40-45 per
cent of its domestic revenue from rural sales. HUL rural revenue
accounts for 45 per cent of its overall sales while other companies
earn 30- 35 per cent of their revenues from rural areas.
Note: F-Forecast
Source: AC Nielsen, Dabur Reports, Goderej Group, McKinsey Global Institute
Rural FMCG Market (US$ billion)
9.0
10
.4
12
.3
12
.1
14
.8
18
.9
29
.4
10
0.0
0.0
20.0
40.0
60.0
80.0
100.0
120.0
200
9
201
0
201
1
201
2
201
3
201
5
201
6
202
5F
For updated information, please visit www.ibef.org FMCG 13
INCREASING SALES OF TOP FMCG COMPANIES
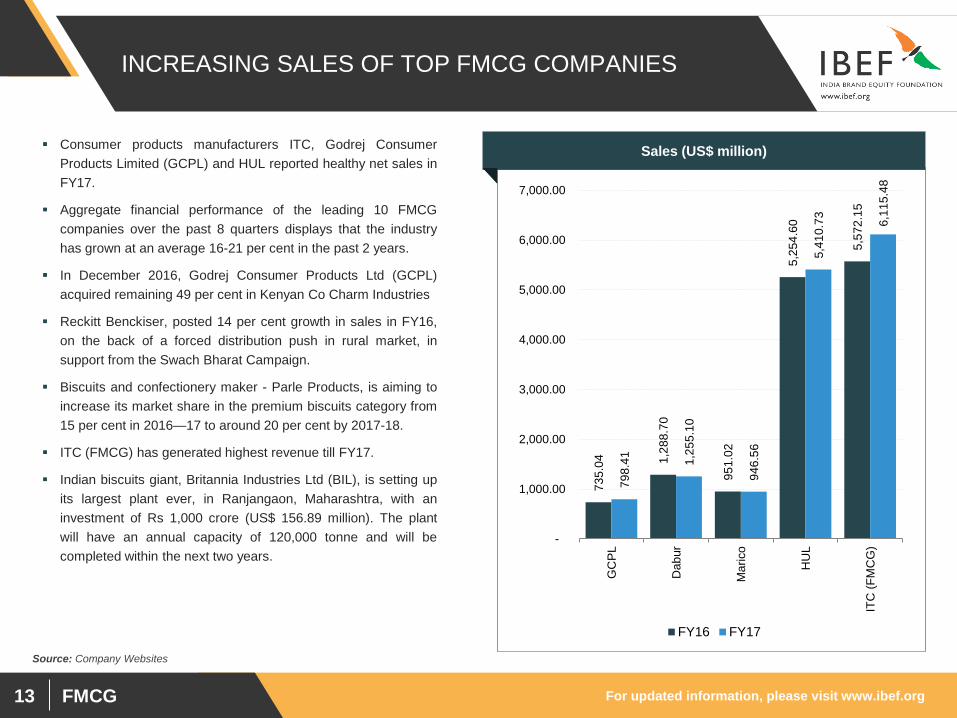
Sales (US$ million)
Source: Company Websites
Consumer products manufacturers ITC, Godrej Consumer
Products Limited (GCPL) and HUL reported healthy net sales in
FY17.
Aggregate financial performance of the leading 10 FMCG
companies over the past 8 quarters displays that the industry
has grown at an average 16-21 per cent in the past 2 years.
In December 2016, Godrej Consumer Products Ltd (GCPL)
acquired remaining 49 per cent in Kenyan Co Charm Industries
Reckitt Benckiser, posted 14 per cent growth in sales in FY16,
on the back of a forced distribution push in rural market, in
support from the Swach Bharat Campaign.
Biscuits and confectionery maker - Parle Products, is aiming to
increase its market share in the premium biscuits category from
15 per cent in 2016—17 to around 20 per cent by 2017-18.
ITC (FMCG) has generated highest revenue till FY17.
Indian biscuits giant, Britannia Industries Ltd (BIL), is setting up
its largest plant ever, in Ranjangaon, Maharashtra, with an
investment of Rs 1,000 crore (US$ 156.89 million). The plant
will have an annual capacity of 120,000 tonne and will be
completed within the next two years.
73
5.0
4
1,2
88
.70
95
1.0
2
5,2
54
.60
5,5
72
.15
79
8.4
1
1,2
55
.10
94
6.5
6
5,4
10
.73
6,1
15
.48
-
1,000.00
2,000.00
3,000.00
4,000.00
5,000.00
6,000.00
7,000.00
GC
PL
Dab
ur
Ma
rico
HU
L
ITC
(F
MC
G)
FY16 FY17
For updated information, please visit www.ibef.org FMCG 14
MARKET SHARE OF COMPANIES IN A FEW FMCG
CATEGORIES
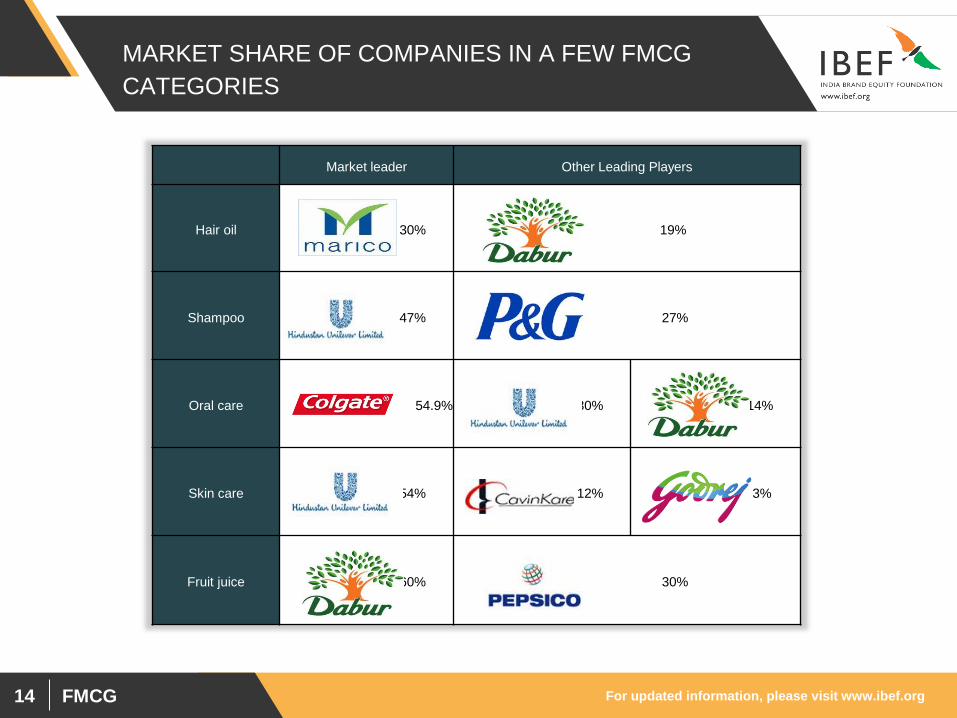
Market leader Other Leading Players
Hair oil 30% 19%
Shampoo 47% 27%
Oral care 54.9% 30% 14%
Skin care 54% 12% 3%
Fruit juice 60% 30%
For updated information, please visit www.ibef.org FMCG 15
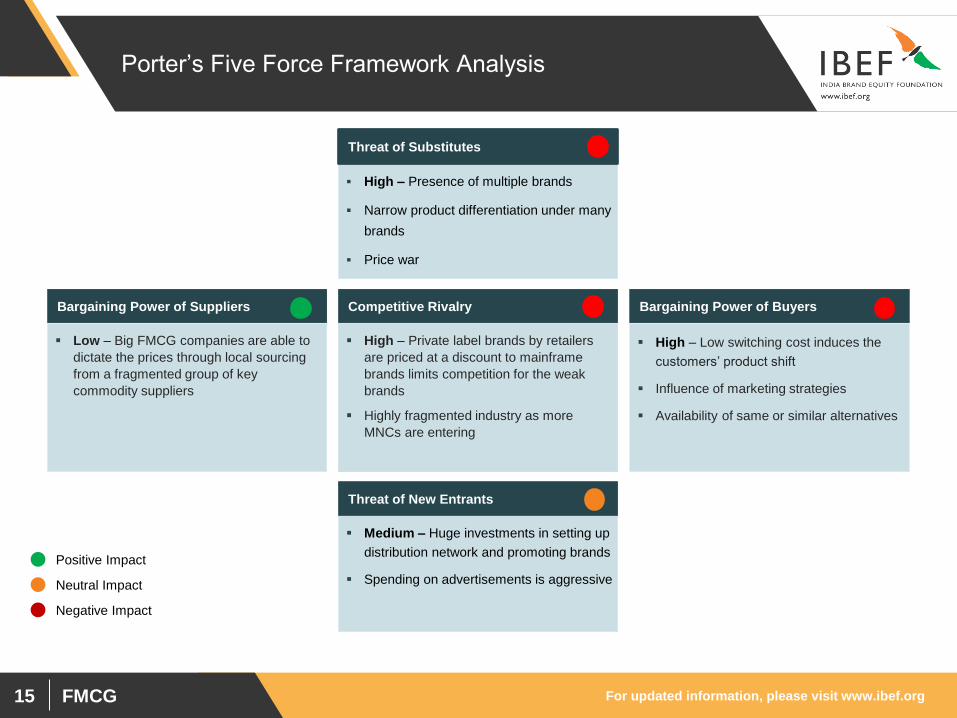
Porter’s Five Force Framework Analysis
Low – Big FMCG companies are able to
dictate the prices through local sourcing
from a fragmented group of key
commodity suppliers
Bargaining Power of Suppliers
High – Presence of multiple brands
Narrow product differentiation under many
brands
Price war
Threat of Substitutes
High – Private label brands by retailers
are priced at a discount to mainframe
brands limits competition for the weak
brands
Highly fragmented industry as more
MNCs are entering
Competitive Rivalry
Medium – Huge investments in setting up
distribution network and promoting brands
Spending on advertisements is aggressive
Threat of New Entrants
High – Low switching cost induces the
customers’ product shift
Influence of marketing strategies
Availability of same or similar alternatives
Bargaining Power of Buyers
Positive Impact
Neutral Impact
Negative Impact
FMCG
STRATEGIES
ADOPTED
For updated information, please visit www.ibef.org FMCG 17
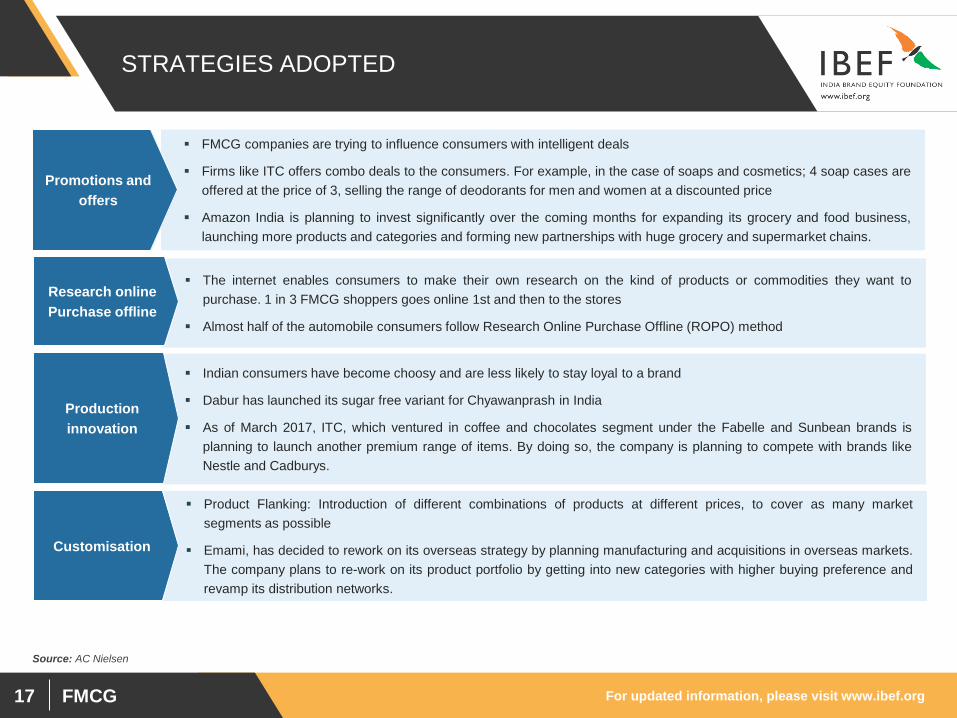
STRATEGIES ADOPTED
FMCG companies are trying to influence consumers with intelligent deals
Firms like ITC offers combo deals to the consumers. For example, in the case of soaps and cosmetics; 4 soap cases are
offered at the price of 3, selling the range of deodorants for men and women at a discounted price
Amazon India is planning to invest significantly over the coming months for expanding its grocery and food business,
launching more products and categories and forming new partnerships with huge grocery and supermarket chains.
Promotions and
offers
The internet enables consumers to make their own research on the kind of products or commodities they want to
purchase. 1 in 3 FMCG shoppers goes online 1st and then to the stores
Almost half of the automobile consumers follow Research Online Purchase Offline (ROPO) method
Research online
Purchase offline
Indian consumers have become choosy and are less likely to stay loyal to a brand
Dabur has launched its sugar free variant for Chyawanprash in India
As of March 2017, ITC, which ventured in coffee and chocolates segment under the Fabelle and Sunbean brands is
planning to launch another premium range of items. By doing so, the company is planning to compete with brands like
Nestle and Cadburys.
Production
innovation
Product Flanking: Introduction of different combinations of products at different prices, to cover as many market
segments as possible
Emami, has decided to rework on its overseas strategy by planning manufacturing and acquisitions in overseas markets.
The company plans to re-work on its product portfolio by getting into new categories with higher buying preference and
revamp its distribution networks.
Customisation
Source: AC Nielsen
FMCG
GROWTH DRIVERS
For updated information, please visit www.ibef.org FMCG 19
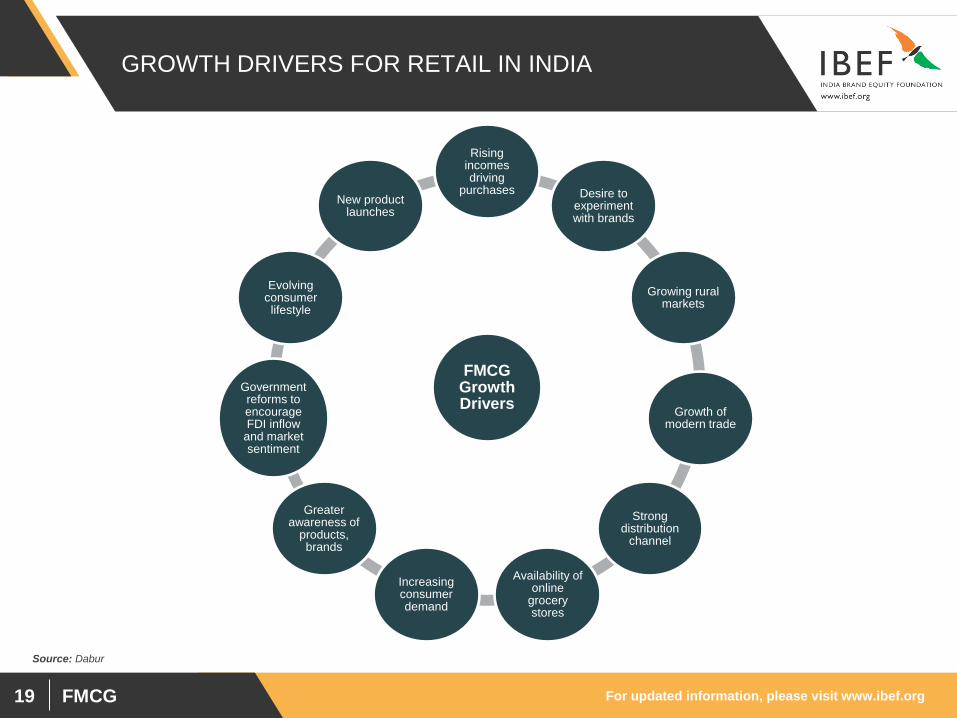
GROWTH DRIVERS FOR RETAIL IN INDIA
FMCG Growth Drivers
Rising incomes driving
purchases Desire to experiment with brands
Growing rural markets
Growth of modern trade
Strong distribution
channel
Availability of online
grocery stores
Increasing consumer demand
Greater awareness of
products, brands
Government reforms to encourage FDI inflow
and market sentiment
Evolving consumer lifestyle
New product launches
Source: Dabur
For updated information, please visit www.ibef.org FMCG 20
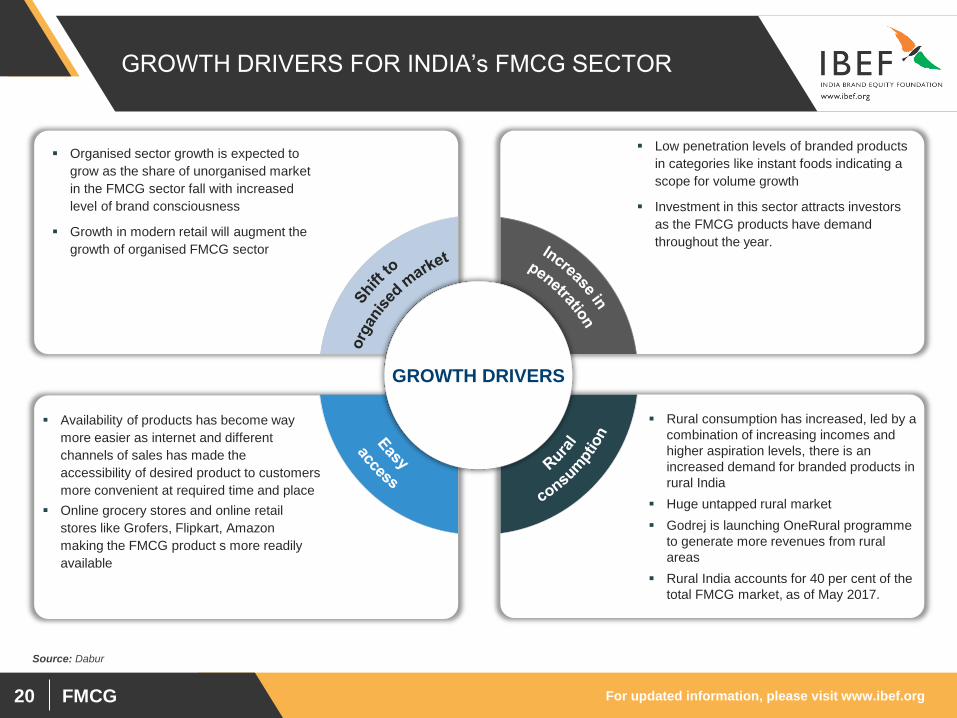
GROWTH DRIVERS FOR INDIA’s FMCG SECTOR
Organised sector growth is expected to
grow as the share of unorganised market
in the FMCG sector fall with increased
level of brand consciousness
Growth in modern retail will augment the
growth of organised FMCG sector
Low penetration levels of branded products
in categories like instant foods indicating a
scope for volume growth
Investment in this sector attracts investors
as the FMCG products have demand
throughout the year.
Availability of products has become way
more easier as internet and different
channels of sales has made the
accessibility of desired product to customers
more convenient at required time and place
Online grocery stores and online retail
stores like Grofers, Flipkart, Amazon
making the FMCG product s more readily
available
Rural consumption has increased, led by a
combination of increasing incomes and
higher aspiration levels, there is an
increased demand for branded products in
rural India
Huge untapped rural market
Godrej is launching OneRural programme
to generate more revenues from rural
areas
Rural India accounts for 40 per cent of the
total FMCG market, as of May 2017.
GROWTH DRIVERS
Source: Dabur
For updated information, please visit www.ibef.org FMCG 21
HIGHER INCOMES AID GROWTH IN URBAN AND
RURAL MARKETS
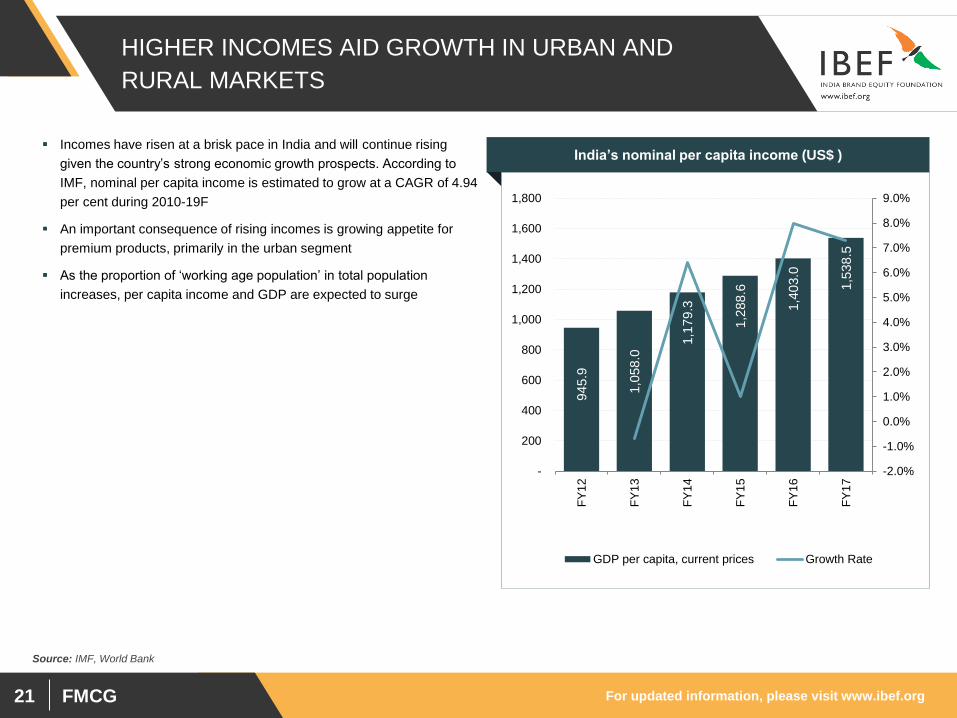
Incomes have risen at a brisk pace in India and will continue rising
given the country’s strong economic growth prospects. According to
IMF, nominal per capita income is estimated to grow at a CAGR of 4.94
per cent during 2010-19F
An important consequence of rising incomes is growing appetite for
premium products, primarily in the urban segment
As the proportion of ‘working age population’ in total population
increases, per capita income and GDP are expected to surge
Source: IMF, World Bank
945.9
1,0
58.0
1,1
79.3
1,2
88.6
1,4
03.0
1,5
38.5
-2.0%
-1.0%
0.0%
1.0%
2.0%
3.0%
4.0%
5.0%
6.0%
7.0%
8.0%
9.0%
-
200
400
600
800
1,000
1,200
1,400
1,600
1,800
FY
12
FY
13
FY
14
FY
15
FY
16
FY
17
GDP per capita, current prices Growth Rate
India’s nominal per capita income (US$ )

For updated information, please visit www.ibef.org FMCG 22
7,8
07
1,3
10
1,2
12
1,0
42
76
3
11
2
0
1,000
2,000
3,000
4,000
5,000
6,000
7,000
8,000
9,000
Fo
od
pro
cessin
g
Pa
pe
r P
ulp
So
ap
, C
osm
etic &
To
ilet p
repe
ratio
ns
Reta
il T
rad
ing
Ve
ge
table
Oils
Te
a,
Coffe
e
FDI INFLOWS RISE OVER THE YEARS
Source: DIPP
Cumulative FDI inflows – April 2000 to June 2017 (US$ million) 100 per cent FDI is allowed in food processing and single-brand
retail and 51 per cent in multi-brand retail.
This would bolster employment and supply chains, and also
provide high visibility for FMCG brands in organised retail
markets, bolstering consumer spending and encouraging more
product launches
The sector witnessed healthy FDI inflows of US$ 12,245.89
million during April 2000 to June 2017.
Within FMCG, food processing was the largest recipient; its
share was 63.75 per cent
US based dairy giant - Schreiber Dynamix Dairies, opened its
1st fully-automated infant nutrition plant, at Baramati,
Maharashtra, with an investment of US$ 37.18 million.
Britannia has signed an MoU with a Greek baker – Chipita, to
produce bakery items such as croissants, rolls and various
dough products. The venture is worth an investment of US$ 11
million, in which Britannia will be looking after functions like
logistics costs, supply-chain and distribution network
The Hershey Co plans to invest US$ 50 million over the next
five years in India, its fastest growing core market outside of
US. The company is also planning to make India an export hub
for Hershey products.
For updated information, please visit www.ibef.org FMCG 23
POLICY AND REGULATORY FRAMEWORK
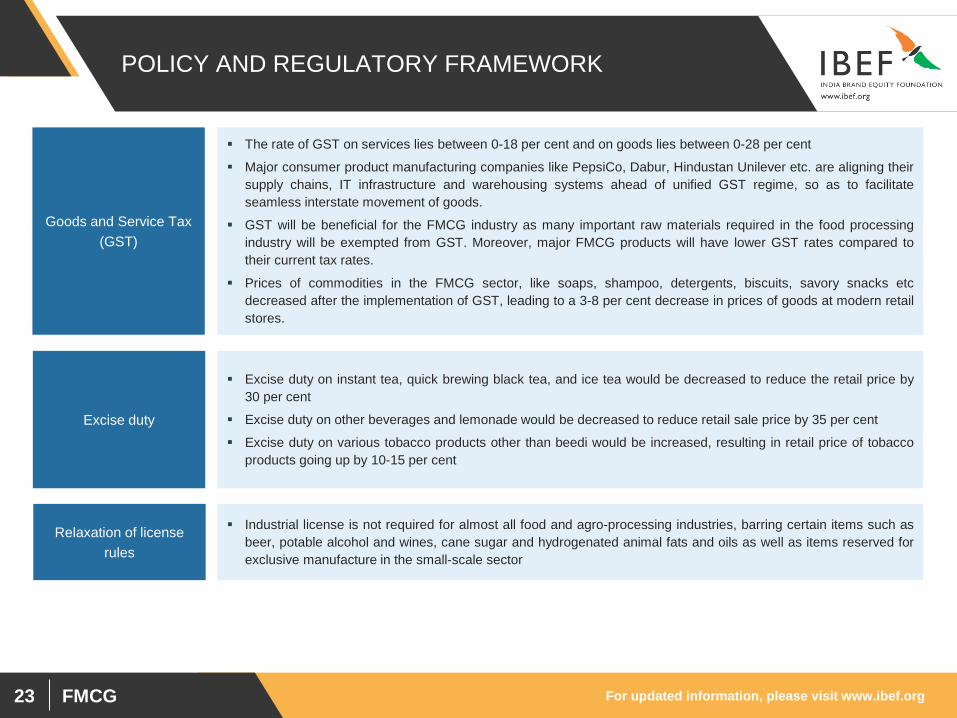
The rate of GST on services lies between 0-18 per cent and on goods lies between 0-28 per cent
Major consumer product manufacturing companies like PepsiCo, Dabur, Hindustan Unilever etc. are aligning their
supply chains, IT infrastructure and warehousing systems ahead of unified GST regime, so as to facilitate
seamless interstate movement of goods.
GST will be beneficial for the FMCG industry as many important raw materials required in the food processing
industry will be exempted from GST. Moreover, major FMCG products will have lower GST rates compared to
their current tax rates.
Prices of commodities in the FMCG sector, like soaps, shampoo, detergents, biscuits, savory snacks etc
decreased after the implementation of GST, leading to a 3-8 per cent decrease in prices of goods at modern retail
stores.
Excise duty on instant tea, quick brewing black tea, and ice tea would be decreased to reduce the retail price by
30 per cent
Excise duty on other beverages and lemonade would be decreased to reduce retail sale price by 35 per cent
Excise duty on various tobacco products other than beedi would be increased, resulting in retail price of tobacco
products going up by 10-15 per cent
Goods and Service Tax
(GST)
Excise duty
Industrial license is not required for almost all food and agro-processing industries, barring certain items such as
beer, potable alcohol and wines, cane sugar and hydrogenated animal fats and oils as well as items reserved for
exclusive manufacture in the small-scale sector
Relaxation of license
rules
For updated information, please visit www.ibef.org FMCG 24
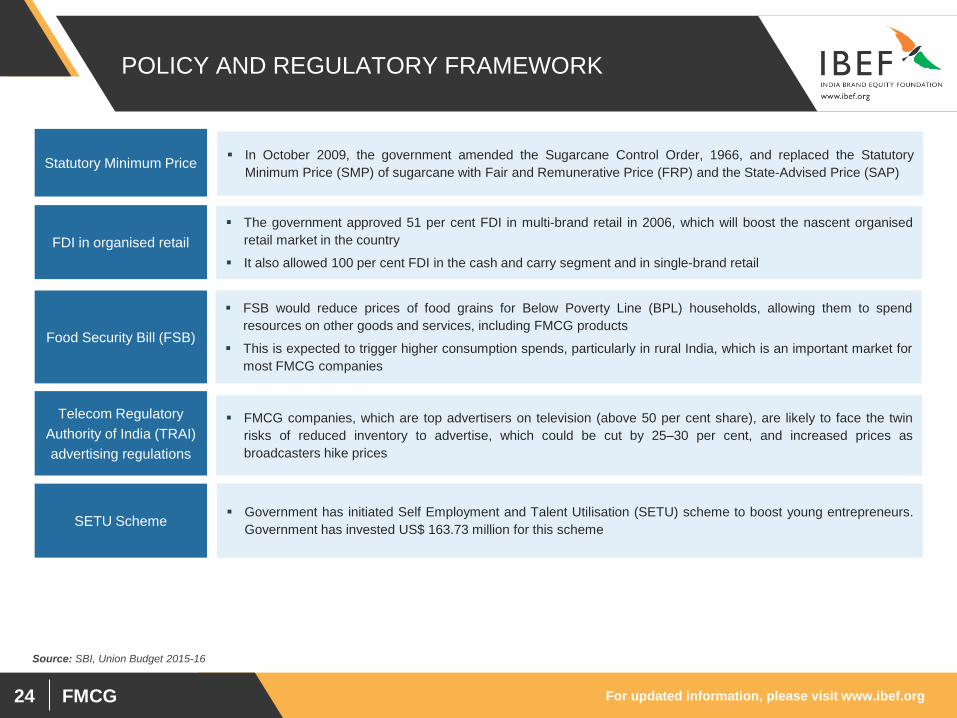
POLICY AND REGULATORY FRAMEWORK
In October 2009, the government amended the Sugarcane Control Order, 1966, and replaced the Statutory
Minimum Price (SMP) of sugarcane with Fair and Remunerative Price (FRP) and the State-Advised Price (SAP)
The government approved 51 per cent FDI in multi-brand retail in 2006, which will boost the nascent organised
retail market in the country
It also allowed 100 per cent FDI in the cash and carry segment and in single-brand retail
Statutory Minimum Price
FDI in organised retail
FSB would reduce prices of food grains for Below Poverty Line (BPL) households, allowing them to spend
resources on other goods and services, including FMCG products
This is expected to trigger higher consumption spends, particularly in rural India, which is an important market for
most FMCG companies
Food Security Bill (FSB)
FMCG companies, which are top advertisers on television (above 50 per cent share), are likely to face the twin
risks of reduced inventory to advertise, which could be cut by 25–30 per cent, and increased prices as
broadcasters hike prices
Telecom Regulatory
Authority of India (TRAI)
advertising regulations
Government has initiated Self Employment and Talent Utilisation (SETU) scheme to boost young entrepreneurs.
Government has invested US$ 163.73 million for this scheme SETU Scheme
Source: SBI, Union Budget 2015-16
For updated information, please visit www.ibef.org FMCG 25
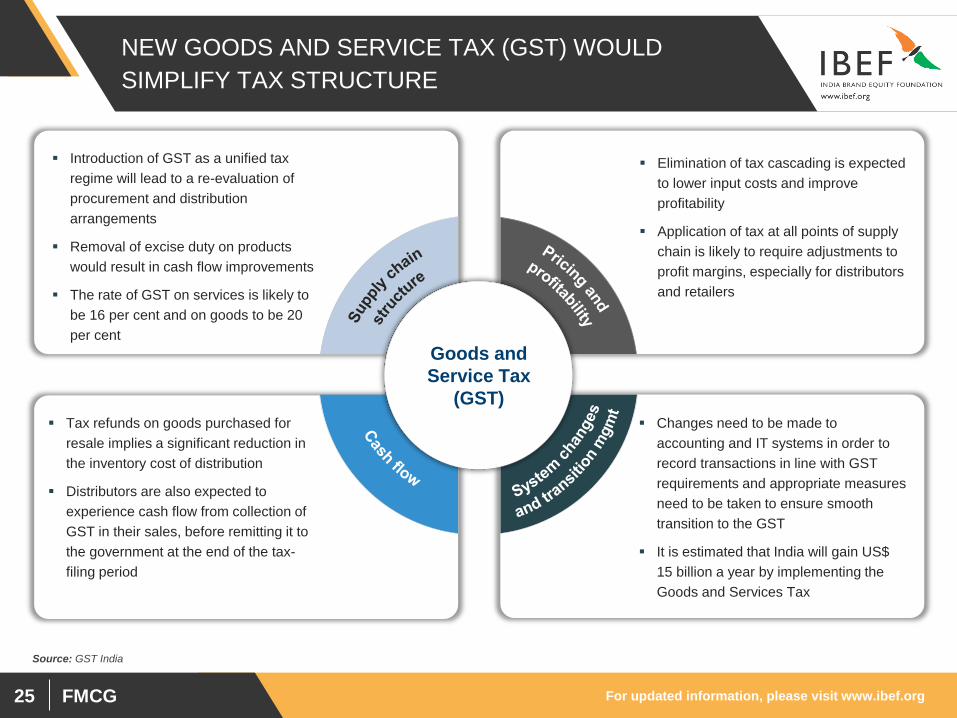
NEW GOODS AND SERVICE TAX (GST) WOULD
SIMPLIFY TAX STRUCTURE
Introduction of GST as a unified tax
regime will lead to a re-evaluation of
procurement and distribution
arrangements
Removal of excise duty on products
would result in cash flow improvements
The rate of GST on services is likely to
be 16 per cent and on goods to be 20
per cent
Elimination of tax cascading is expected
to lower input costs and improve
profitability
Application of tax at all points of supply
chain is likely to require adjustments to
profit margins, especially for distributors
and retailers
Tax refunds on goods purchased for
resale implies a significant reduction in
the inventory cost of distribution
Distributors are also expected to
experience cash flow from collection of
GST in their sales, before remitting it to
the government at the end of the tax-
filing period
Changes need to be made to
accounting and IT systems in order to
record transactions in line with GST
requirements and appropriate measures
need to be taken to ensure smooth
transition to the GST
It is estimated that India will gain US$
15 billion a year by implementing the
Goods and Services Tax
Goods and
Service Tax
(GST)
Source: GST India
For updated information, please visit www.ibef.org FMCG 26
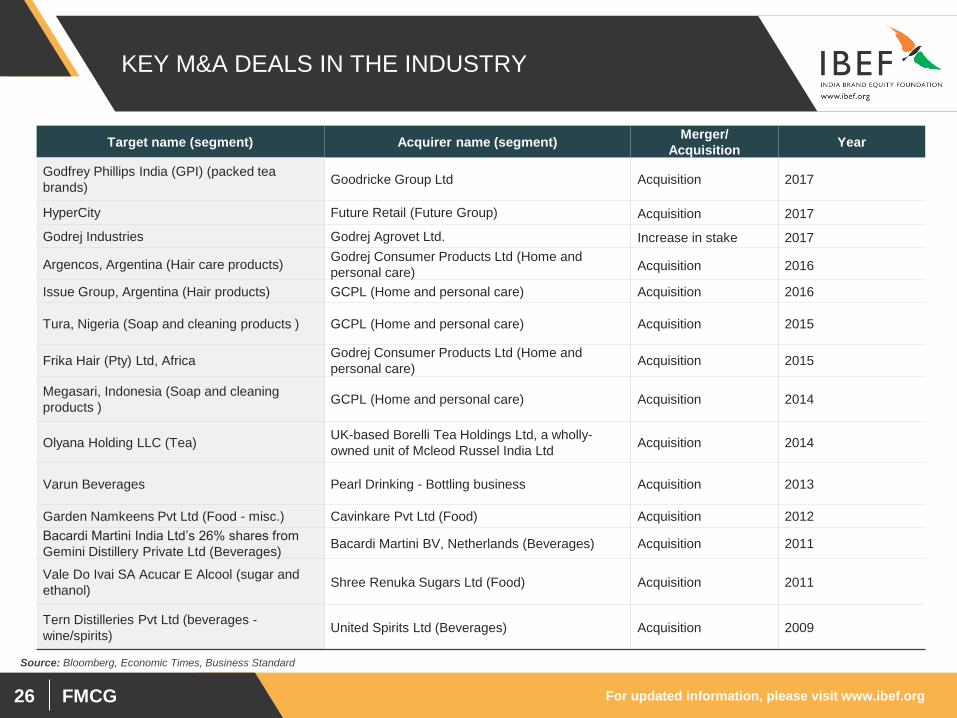
KEY M&A DEALS IN THE INDUSTRY
Target name (segment) Acquirer name (segment) Merger/
Acquisition Year
Godfrey Phillips India (GPI) (packed tea
brands) Goodricke Group Ltd Acquisition 2017
HyperCity Future Retail (Future Group) Acquisition 2017
Godrej Industries Godrej Agrovet Ltd. Increase in stake 2017
Argencos, Argentina (Hair care products) Godrej Consumer Products Ltd (Home and
personal care) Acquisition 2016
Issue Group, Argentina (Hair products) GCPL (Home and personal care) Acquisition 2016
Tura, Nigeria (Soap and cleaning products ) GCPL (Home and personal care) Acquisition 2015
Frika Hair (Pty) Ltd, Africa Godrej Consumer Products Ltd (Home and
personal care) Acquisition 2015
Megasari, Indonesia (Soap and cleaning
products ) GCPL (Home and personal care) Acquisition 2014
Olyana Holding LLC (Tea) UK-based Borelli Tea Holdings Ltd, a wholly-
owned unit of Mcleod Russel India Ltd Acquisition 2014
Varun Beverages Pearl Drinking - Bottling business Acquisition 2013
Garden Namkeens Pvt Ltd (Food - misc.) Cavinkare Pvt Ltd (Food) Acquisition 2012
Bacardi Martini India Ltd’s 26% shares from
Gemini Distillery Private Ltd (Beverages) Bacardi Martini BV, Netherlands (Beverages) Acquisition 2011
Vale Do Ivai SA Acucar E Alcool (sugar and
ethanol) Shree Renuka Sugars Ltd (Food) Acquisition 2011
Tern Distilleries Pvt Ltd (beverages -
wine/spirits) United Spirits Ltd (Beverages) Acquisition 2009
Source: Bloomberg, Economic Times, Business Standard

FMCG
OPPORTUNITIES

For updated information, please visit www.ibef.org FMCG 28
GROWTH OPPORTUNITIES IN THE INDIAN FMCG
INDUSTRY
Leading players of consumer products have a strong distribution network in rural India; they also stand to gain from the
contribution of technological advances like internet and e-commerce to better logistics. Godrej is focusing on rural market
for household insecticides segment. At present, Godrej accounts for 25 per cent of the household insecticides sales from
rural areas
Rural FMCG market size is expected to touch US$ 220 billion by 2025
Rural Market
Indian consumers are highly adaptable to new and innovative products. For instance there has been an easy acceptance of
men’s fairness creams, flavoured yoghurt, cuppa mania noodles, gel based facial bleach, drinking yogurt, sugar free
Chyawanprash
Innovative
products
With the rise in disposable incomes, mid and high-income consumers in urban areas have shifted their purchase trend
from essential to premium products
Premium brands are manufacturing smaller packs of premium products. Example: Dove soap is available in 50g packaging
Nestle is looking to expand its portfolio in premium durables cereals, pet care, coffee, and skin health accessing the
potential in India.
Coca-Cola India Pvt Ltd is planning to launch its global enhanced water brand Glacéau Smartwater in India in December
2017.
Premium products
Indian and multinational FMCG players can leverage India as a strategic sourcing hub for cost-competitive product
development and manufacturing to cater to international markets Sourcing base
Low penetration levels offer room for growth across consumption categories
Major players are focusing on rural markets to increase their penetration in those areas Penetration
Source: Assorted articles and reports, AC Nielsen
It is estimated that 40 per cent of all FMCG purchases in India will be online by 2020, thereby making it a US$ 5-6 billion
business opportunity. ^ Online FMCG
Note:^ - as per Boston Consulting Group (BCG) and Google
For updated information, please visit www.ibef.org FMCG 29
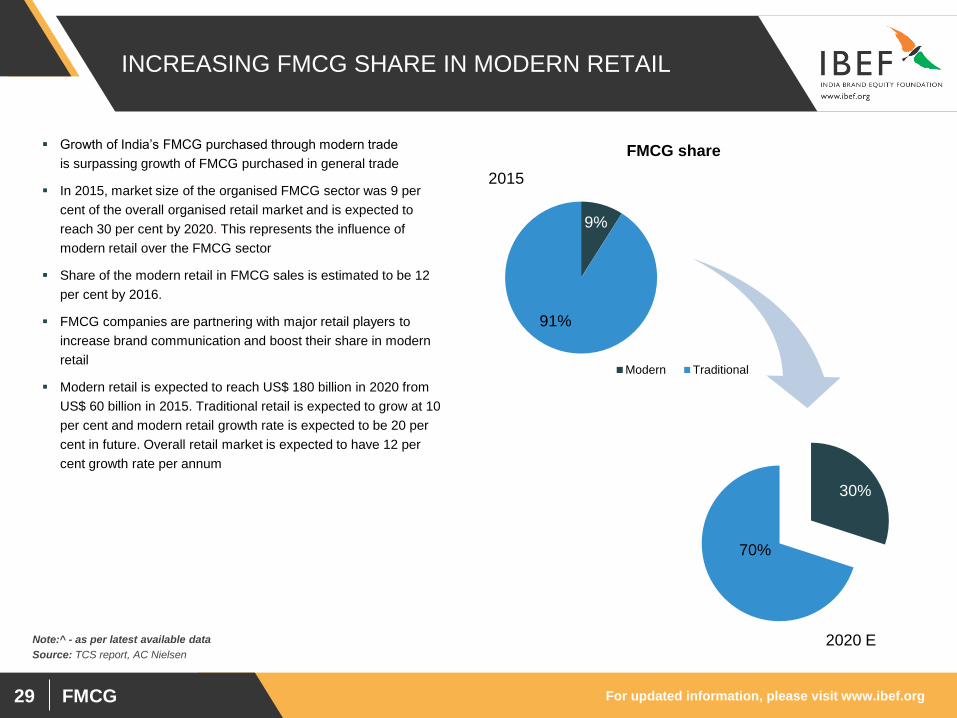
INCREASING FMCG SHARE IN MODERN RETAIL
Growth of India’s FMCG purchased through modern trade
is surpassing growth of FMCG purchased in general trade
In 2015, market size of the organised FMCG sector was 9 per
cent of the overall organised retail market and is expected to
reach 30 per cent by 2020. This represents the influence of
modern retail over the FMCG sector
Share of the modern retail in FMCG sales is estimated to be 12
per cent by 2016.
FMCG companies are partnering with major retail players to
increase brand communication and boost their share in modern
retail
Modern retail is expected to reach US$ 180 billion in 2020 from
US$ 60 billion in 2015. Traditional retail is expected to grow at 10
per cent and modern retail growth rate is expected to be 20 per
cent in future. Overall retail market is expected to have 12 per
cent growth rate per annum
Source: TCS report, AC Nielsen
9%
91%
FMCG share
Modern Traditional
30%
70%
2020 E
2015
Note:^ - as per latest available data
FMCG
CASE STUDIES
For updated information, please visit www.ibef.org FMCG 31
EMAMI – ONE OF THE FASTEST GROWING FMCG
COMPANIES
Emami’s Sales and PAT (US$ million)
27
3.3
31
0.2
31
2.8
30
2.1
36
7.8
40
0.9
39
7.4
50
.2
55
.2
58
.0
66
.7
80
.6
54
.8
52
.8
0.0
50.0
100.0
150.0
200.0
250.0
300.0
350.0
400.0
450.0
FY
11
FY
12
FY
13
FY
14
FY
15
FY
16
FY
17
Sales PAT
Source: Company website, Annual Report, Media sources
CAGR 5.49%
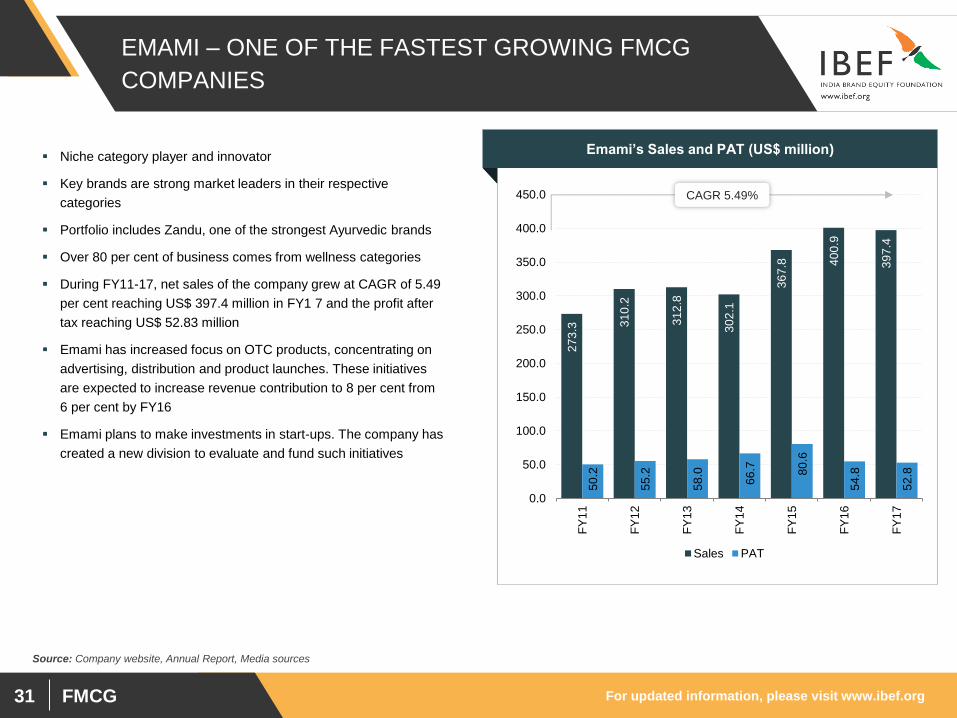
Niche category player and innovator
Key brands are strong market leaders in their respective
categories
Portfolio includes Zandu, one of the strongest Ayurvedic brands
Over 80 per cent of business comes from wellness categories
During FY11-17, net sales of the company grew at CAGR of 5.49
per cent reaching US$ 397.4 million in FY1 7 and the profit after
tax reaching US$ 52.83 million
Emami has increased focus on OTC products, concentrating on
advertising, distribution and product launches. These initiatives
are expected to increase revenue contribution to 8 per cent from
6 per cent by FY16
Emami plans to make investments in start-ups. The company has
created a new division to evaluate and fund such initiatives
For updated information, please visit www.ibef.org FMCG 32
DABUR – RIDING ON STRONG BRAND EQUITY IN
INDIA
Source: Dabur Annual Report
Dabur’s sales growth (US$ million)
89
4.3
1,1
26
.3
1,1
32
.4
1,1
72
.9
1,2
95
.6
1,2
88
.7
1,2
04
.9
12
4.9
13
6.5
13
9.9
15
1.0
17
7.5
19
1.8
20
0.4
-
200.0
400.0
600.0
800.0
1,000.0
1,200.0
1,400.0
FY
11
FY
12
FY
13
FY
14
FY
15
FY
16
FY
17
Sales PAT
CAGR 4.35%
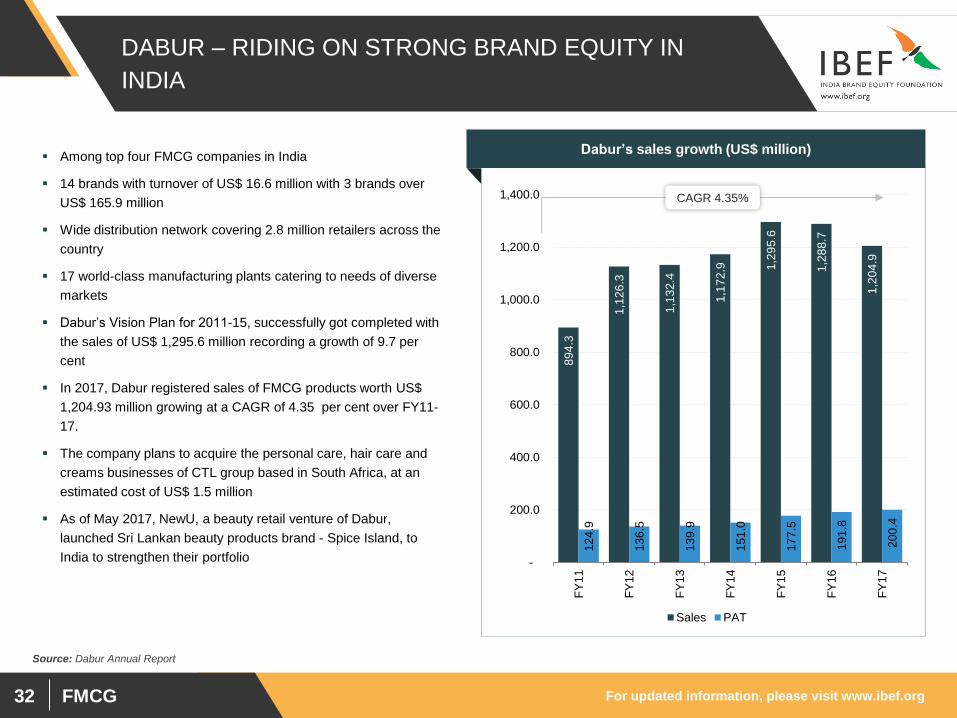
Among top four FMCG companies in India
14 brands with turnover of US$ 16.6 million with 3 brands over
US$ 165.9 million
Wide distribution network covering 2.8 million retailers across the
country
17 world-class manufacturing plants catering to needs of diverse
markets
Dabur’s Vision Plan for 2011-15, successfully got completed with
the sales of US$ 1,295.6 million recording a growth of 9.7 per
cent
In 2017, Dabur registered sales of FMCG products worth US$
1,204.93 million growing at a CAGR of 4.35 per cent over FY11-
17.
The company plans to acquire the personal care, hair care and
creams businesses of CTL group based in South Africa, at an
estimated cost of US$ 1.5 million
As of May 2017, NewU, a beauty retail venture of Dabur,
launched Sri Lankan beauty products brand - Spice Island, to
India to strengthen their portfolio
For updated information, please visit www.ibef.org FMCG 33
Source: Company Reports
ITC’s sales growth (US$ million)
CAGR 4.43%
ITC – LEADING FOOD AND BEVERAGES COMPANY
4,5
15
.5
4,5
66
.0
4,9
11
.0
5,4
55
.0
5,9
85
.9
5,5
72
.1
6,1
15
.5
98
2.5
1,1
82
.8
1,2
91
.1
1,3
47
.4
1,4
99
.3
1,4
86
.6
1,8
57
.8
1,0
93
.3
1,3
14
.4
1,3
65
.9
1,4
57
.4
1,5
93
.9
1,5
04
.0
1,6
00
.5
-
1,000.0
2,000.0
3,000.0
4,000.0
5,000.0
6,000.0
7,000.0
FY
11
FY
12
FY
13
FY
14
FY
15
FY
16
FY
17
Sales (Total) Sales (FMCG) PAT
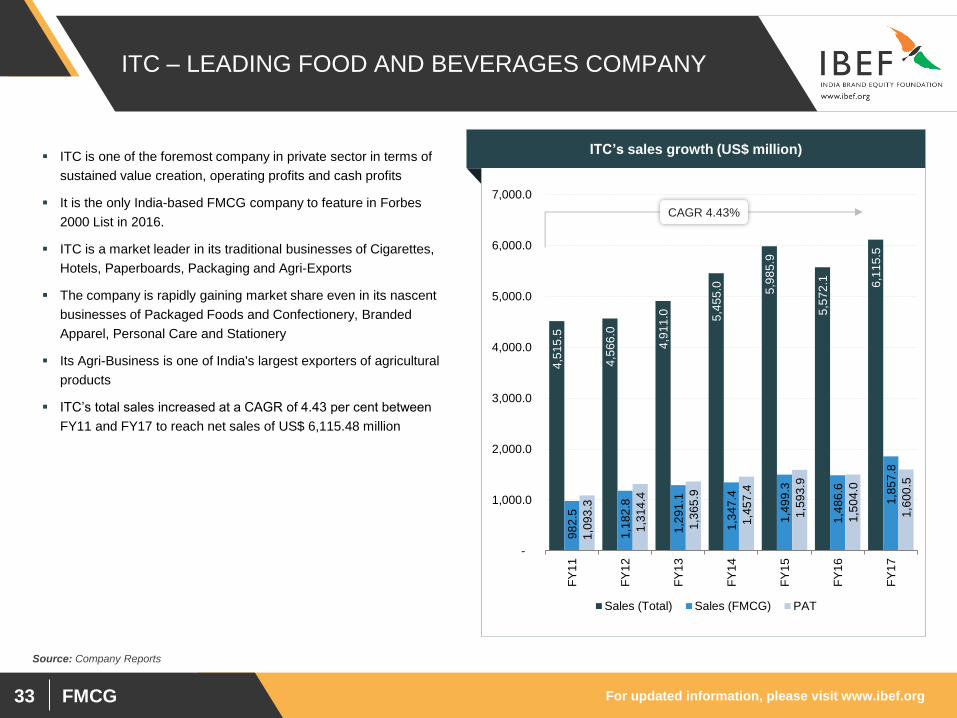
ITC is one of the foremost company in private sector in terms of
sustained value creation, operating profits and cash profits
It is the only India-based FMCG company to feature in Forbes
2000 List in 2016.
ITC is a market leader in its traditional businesses of Cigarettes,
Hotels, Paperboards, Packaging and Agri-Exports
The company is rapidly gaining market share even in its nascent
businesses of Packaged Foods and Confectionery, Branded
Apparel, Personal Care and Stationery
Its Agri-Business is one of India's largest exporters of agricultural
products
ITC’s total sales increased at a CAGR of 4.43 per cent between
FY11 and FY17 to reach net sales of US$ 6,115.48 million
FMCG
KEY INDUSTRY
ORGANISATIONS
For updated information, please visit www.ibef.org FMCG 35
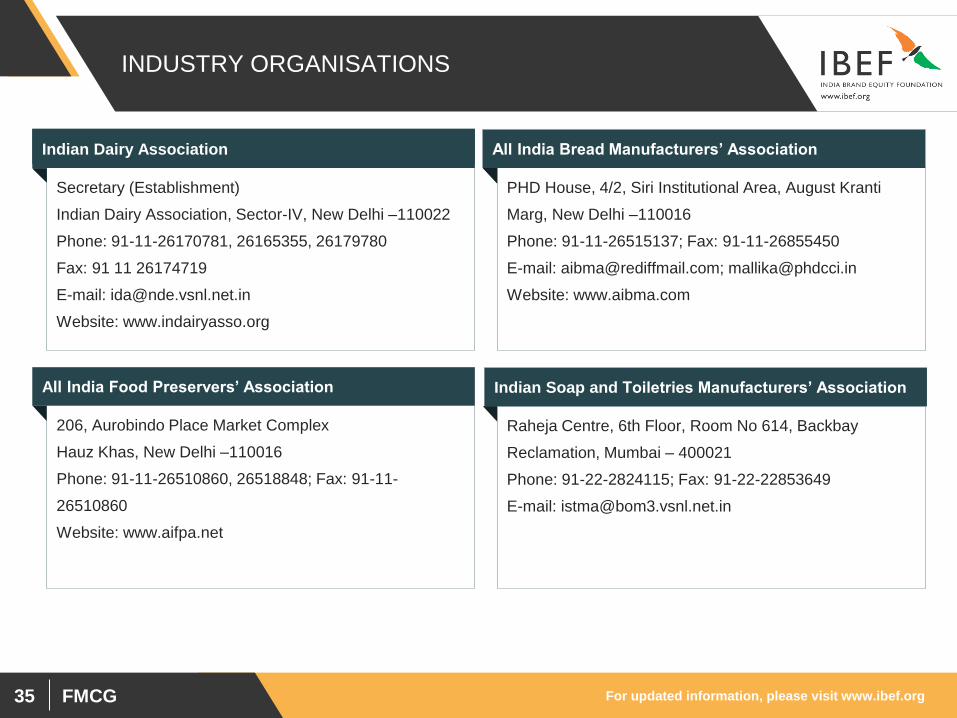
INDUSTRY ORGANISATIONS
Visakhapatnam port traffic (million tonnes) Indian Dairy Association All India Bread Manufacturers’ Association
PHD House, 4/2, Siri Institutional Area, August Kranti
Marg, New Delhi –110016
Phone: 91-11-26515137; Fax: 91-11-26855450
E-mail: [email protected]; [email protected]
Website: www.aibma.com
Secretary (Establishment)
Indian Dairy Association, Sector-IV, New Delhi –110022
Phone: 91-11-26170781, 26165355, 26179780
Fax: 91 11 26174719
E-mail: [email protected]
Website: www.indairyasso.org
All India Food Preservers’ Association
206, Aurobindo Place Market Complex
Hauz Khas, New Delhi –110016
Phone: 91-11-26510860, 26518848; Fax: 91-11-
26510860
Website: www.aifpa.net
Indian Soap and Toiletries Manufacturers’ Association
Raheja Centre, 6th Floor, Room No 614, Backbay
Reclamation, Mumbai – 400021
Phone: 91-22-2824115; Fax: 91-22-22853649
E-mail: [email protected]
FMCG
USEFUL
INFORMATION
For updated information, please visit www.ibef.org FMCG 37
GLOSSARY
FDI: Foreign Direct Investment
MSP: Minimum Selling Price
NREGA: National Rural Employment Guarantee Act
FY: Indian Financial Year (April to March)
- So FY09 implies April 2008 to March 2009
SEZ: Special Economic Zone
MoU: Memorandum of Understanding
Wherever applicable, numbers have been rounded off to the nearest whole number
For updated information, please visit www.ibef.org FMCG 38
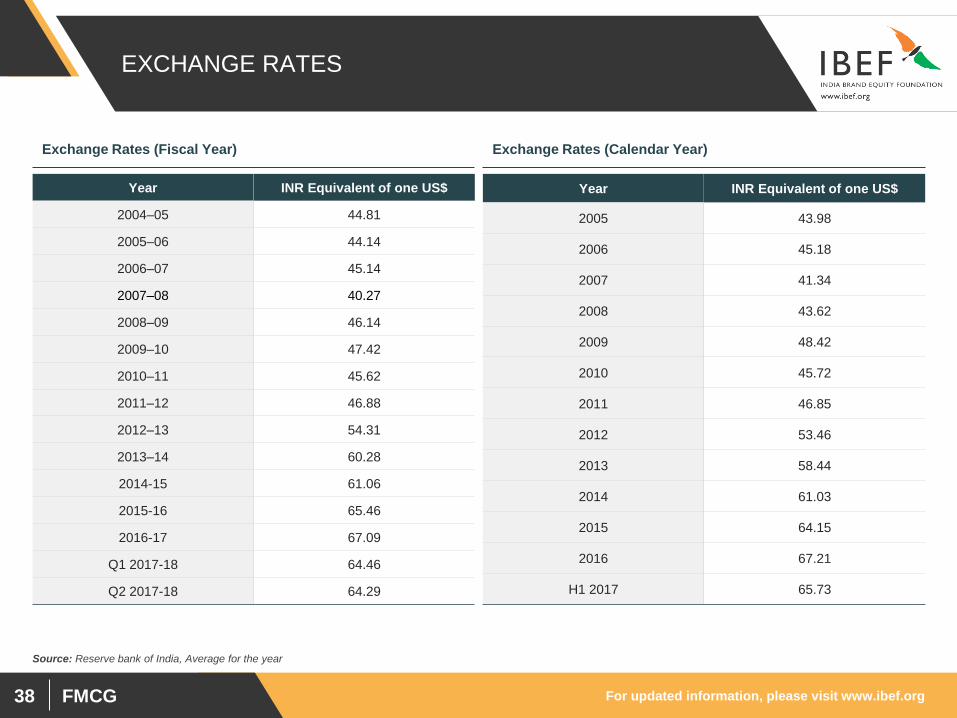
EXCHANGE RATES
Year INR Equivalent of one US$
2004–05 44.81
2005–06 44.14
2006–07 45.14
2007–08 40.27
2008–09 46.14
2009–10 47.42
2010–11 45.62
2011–12 46.88
2012–13 54.31
2013–14 60.28
2014-15 61.06
2015-16 65.46
2016-17 67.09
Q1 2017-18 64.46
Q2 2017-18 64.29
Year INR Equivalent of one US$
2005 43.98
2006 45.18
2007 41.34
2008 43.62
2009 48.42
2010 45.72
2011 46.85
2012 53.46
2013 58.44
2014 61.03
2015 64.15
2016 67.21
H1 2017 65.73
Exchange Rates (Fiscal Year) Exchange Rates (Calendar Year)
Source: Reserve bank of India, Average for the year
For updated information, please visit www.ibef.org FMCG 39
DISCLAIMER
India Brand Equity Foundation (IBEF) engaged Aranca to prepare this presentation and the same has been prepared by Aranca in consultation
with IBEF.
All rights reserved. All copyright in this presentation and related works is solely and exclusively owned by IBEF. The same may not be reproduced,
wholly or in part in any material form (including photocopying or storing it in any medium by electronic means and whether or not transiently or
incidentally to some other use of this presentation), modified or in any manner communicated to any third party except with the written approval
of IBEF.
This presentation is for information purposes only. While due care has been taken during the compilation of this presentation to ensure that the
information is accurate to the best of Aranca and IBEF’s knowledge and belief, the content is not to be construed in any manner whatsoever as a
substitute for professional advice.
Aranca and IBEF neither recommend nor endorse any specific products or services that may have been mentioned in this presentation and nor do
they assume any liability or responsibility for the outcome of decisions taken as a result of any reliance placed on this presentation.
Neither Aranca nor IBEF shall be liable for any direct or indirect damages that may arise due to any act or omission on the part of the user due to any
reliance placed or guidance taken from any portion of this presentation.