
Fast Evaluation of the Fatigue Lifetime of Elastomers ...
27
HAL Id: hal-00493227 https://hal.archives-ouvertes.fr/hal-00493227 Submitted on 23 Aug 2011 HAL is a multi-disciplinary open access archive for the deposit and dissemination of sci- entific research documents, whether they are pub- lished or not. The documents may come from teaching and research institutions in France or abroad, or from public or private research centers. L’archive ouverte pluridisciplinaire HAL, est destinée au dépôt et à la diffusion de documents scientifiques de niveau recherche, publiés ou non, émanant des établissements d’enseignement et de recherche français ou étrangers, des laboratoires publics ou privés. Fast Evaluation of the Fatigue Lifetime of Elastomers Based on a Heat Build-up Protocol and Micro-tomography Measurements V. Le Saux, Yann Marco, Sylvain Calloch, Cédric Doudard, P. Charrier To cite this version: V. Le Saux, Yann Marco, Sylvain Calloch, Cédric Doudard, P. Charrier. Fast Evaluation of the Fatigue Lifetime of Elastomers Based on a Heat Build-up Protocol and Micro-tomography Measurements. In- ternational Journal of Fatigue, Elsevier, 2010, 32 (10), pp.1582-1590. 10.1016/j.ijfatigue.2010.02.014. hal-00493227
Transcript of Fast Evaluation of the Fatigue Lifetime of Elastomers ...

HAL Id: hal-00493227https://hal.archives-ouvertes.fr/hal-00493227
Submitted on 23 Aug 2011
HAL is a multi-disciplinary open accessarchive for the deposit and dissemination of sci-entific research documents, whether they are pub-lished or not. The documents may come fromteaching and research institutions in France orabroad, or from public or private research centers.
L’archive ouverte pluridisciplinaire HAL, estdestinée au dépôt et à la diffusion de documentsscientifiques de niveau recherche, publiés ou non,émanant des établissements d’enseignement et derecherche français ou étrangers, des laboratoirespublics ou privés.
Fast Evaluation of the Fatigue Lifetime of ElastomersBased on a Heat Build-up Protocol and
Micro-tomography MeasurementsV. Le Saux, Yann Marco, Sylvain Calloch, Cédric Doudard, P. Charrier
To cite this version:V. Le Saux, Yann Marco, Sylvain Calloch, Cédric Doudard, P. Charrier. Fast Evaluation of the FatigueLifetime of Elastomers Based on a Heat Build-up Protocol and Micro-tomography Measurements. In-ternational Journal of Fatigue, Elsevier, 2010, 32 (10), pp.1582-1590. �10.1016/j.ijfatigue.2010.02.014�.�hal-00493227�

Fast evaluation of the fatigue lifetime of rubber-like
materials based on a heat build-up protocol and
micro-tomography measurements
V. Le Sauxa, Y. Marco∗,a, S. Callocha, C. Doudarda, P. Charrierb
aLaboratoire Brestois de Mecanique et des Systemes (EA 4325),ENSIETA/Universite de Brest/ENIB, 2 rue F. Verny 29806 Brest Cedex 9, FrancebTrelleborg Modyn, Z.I. Nantes Carquefou BP 419, 44474 Carquefou Cedex, France
Abstract
The temperature of rubber-like materials increases under cyclic loadings, dueto their dissipative behaviour and low thermal conductivity. This well-knownphenomenon, called heat build-up, has attracted the attention of researchersfor a long time. But, to our knowledge, no published studies have tried tolink this temperature rise to fatigue life behaviour, as already done for manymetallic materials. Two main points are discussed in this paper. The first oneis dedicated to heat-build up measurements: a specific experimental protocolwas developed to capture the instantaneous heat build-up and, based on thisprotocol, a ”heat build-up test” was defined in order to link the temperaturerise to the principal maximum strain, which is a commonly used variable forfatigue life criterion. A discussion on the correlation between these resultsand the fatigue life behaviour is opened. This relation is illustrated for severalindustrial materials by a comparison between heat build-up measurementsand fatigue life duration. The second point investigates the ability to coupleX-ray tomography measurements presented elsewhere [1] to the former heatbuild-up results in order to predic the initiation lifetime. An approach basedon a critical energy criterion was proposed and the comparison to a classicWohler curve approach gave very good results.
Key words: rubber-like materials, heat build-up, infrared thermography,X-ray micro-tomography, critical energy criterion
∗Corresponding author. Tel.: 33 (0)2 98 34 89 11; Fax: 33 (0)2 98 34 87 30Email address: [email protected] (Y. Marco)
Preprint submitted to International Journal of Fatigue December 17, 2009

Introduction
Rubber-like materials are extensively used in industrial applications be-cause of their ability to undergo large deformations and of their dampingbehaviour. Elastomeric components used in the automotive industry, suchas engine mounts or torque rod, are submitted to cyclic loadings and a goodconception towards fatigue phenomenon is therefore mandatory to ensurethe safety of these structures. Fatigue initiation properties are studied bysubmitting specimens of a given geometry to a given cyclic load and measur-ing the number of cycles needed to reach an end-of-life criterion (presence ofa crack of a given length, fracture of the specimen or stiffness loss). Fromthese results, the so-called Wohler curve, or ”S/N” curve (Stress or Strainvs Number of cycles) is built. To be reliable, this classical method presentsat least two main disadvantages: it requires long duration tests and a largenumber of specimens (usually a minimum of 25 specimens is required) in or-der to have a good estimation of the fatigue intrinsic dispersion. These twodisadvantages obviously limit the study of fatigue life properties and the de-termination of the influences of some parameters (i.e. mean load, amplitudeload, etc.) on these properties. To reduce this cost (of time and money),other methods have to be developed.
For several years, different methods for the rapid estimation of mean fa-tigue limits of metallic materials, based on temperature measurements, havebeen developed [2] and references therein. The aim of this paper is to in-vestigate the opportunity to use these methods for rubber-like materials. Ina first part, a heat build-up experiment and the associated analysis suitablefor metallic materials is reminded. Based on this protocol, a heat build-upexperiment suitable for rubber-like materials is proposed in a second part.Taking into account the specific aspects of this kind of materials, the experi-ment links the temperature rise to the maximum principal strain. In a thirdpart, the relevance of a link between thermal measurements and fatigue lifeproperties is discussed from the results measured on fifteen industrial mate-rials. Even if this empirical approach gave some interesting results, it wasalso observed that, as expected, the viscosity has a first order influence onthe temperature rise. It was therefore difficult to identify the dissipated en-ergy only related to the fatigue mechanisms. These fatigue mechanisms arestrongly linked to the flaw population and to the cavities created along a
2

fatigue test. In a forth part we consequently use the microstructural infor-mation obtained from a X-ray computed micro-tomography investigation [1]to evaluate the ratio of the global dissipated energy to the one related tothe fatigue damage. A critical energy criterion is applied and the results arecompared to a Wohler curve obtained classically. This comparison exhibitsa very good correlation, opening a very promising field of investigation.
1. Material and testing
1.1. Material and specimens
A wide range of elastomeric materials, based on industrial standard recipesare used in this study. The aim was to cover a wide range of materials, crys-tallizing, non crystallizing, unfilled, monomer or copolymers matrix with awide range of mechanical properties (fatigue lifetime, tan δ). More than 15materials were tested. Hourglass shaped specimens were manufactured froma single batch in order to ensure the reliability of mixing and moulding con-ditions. The geometry of the specimen is given on figure 1. This kind ofspecimen (called AE2 in the following) was chosen for two main reasons: itis classically used to obtain Wohler curves and the initiation and break zoneis well controlled and is located in the thinner section.
Figure 1: AE2 specimen
1.2. Heat build-up based protocol for metallic materials
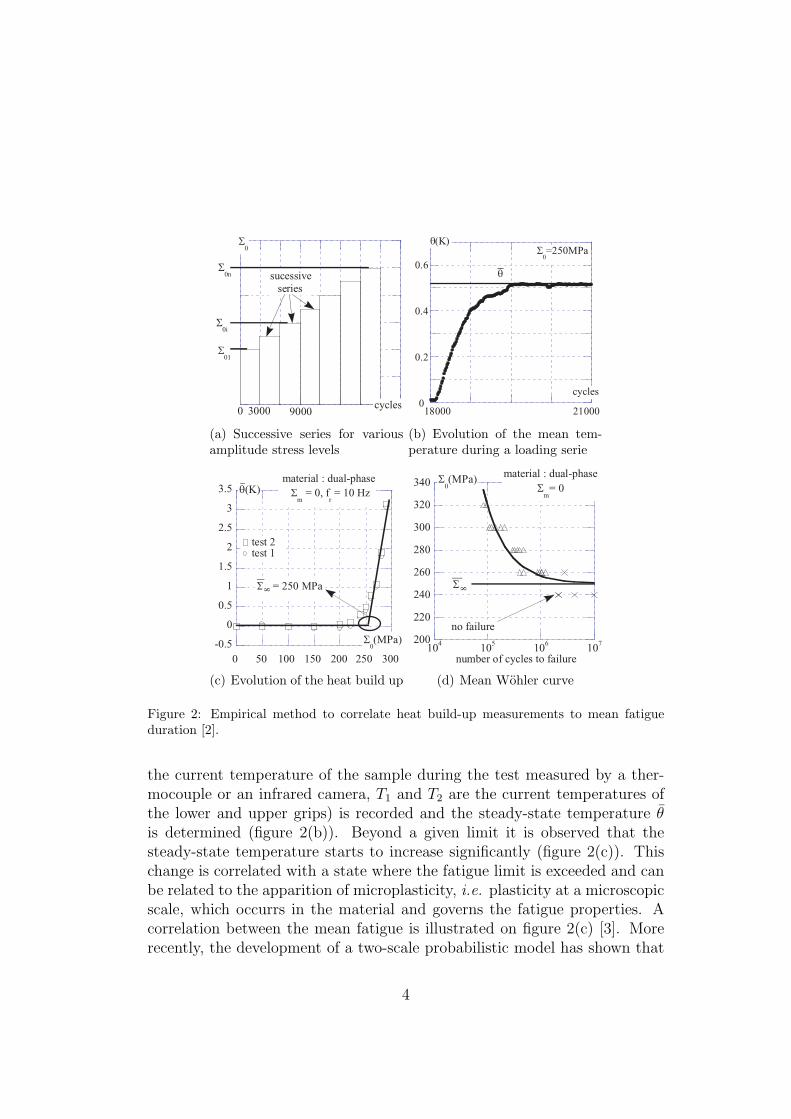
For several years, different methods for the rapid estimation of mean fa-tigue limits of metallic materials based on temperature measurements havebeen developed [2]. They consist in applying successive sets of a given num-ber of cycles for different increasing stress levels (figure 2(a)). For each stresslevel, the change of the temperature difference θ = T −
T1+T2
2(where T is
3
Σ0
Σ0n
Σ0i
Σ01
cycles30000
sucessive
series
9000
(a) Successive series for variousamplitude stress levels
cycles
θ
θ(K)Σ
0=250MPa
18000 210000
0.4
0.2
0.6
(b) Evolution of the mean tem-perature during a loading serie
-0.5
0
0.5
1
1.5
2
2.5
3
3.5
0 50 100 150 200 250 300
θ(K)
test 2test 1
material : dual-phase
Σm
= 0, fr = 10 Hz
Σ
= 250 MPa
Σ0(MPa)
8
(c) Evolution of the heat build up
200
220
240
260
280
300
320
340
104
105
106
107
number of cycles to failure
no failure
Σ0(MPa)
Σ 8material : dual-phase
Σm
= 0
(d) Mean Wohler curve
Figure 2: Empirical method to correlate heat build-up measurements to mean fatigueduration [2].
the current temperature of the sample during the test measured by a ther-mocouple or an infrared camera, T1 and T2 are the current temperatures ofthe lower and upper grips) is recorded and the steady-state temperature θ
is determined (figure 2(b)). Beyond a given limit it is observed that thesteady-state temperature starts to increase significantly (figure 2(c)). Thischange is correlated with a state where the fatigue limit is exceeded and canbe related to the apparition of microplasticity, i.e. plasticity at a microscopicscale, which occurrs in the material and governs the fatigue properties. Acorrelation between the mean fatigue is illustrated on figure 2(c) [3]. Morerecently, the development of a two-scale probabilistic model has shown that
4

heat build-up tests permit to identify not only the mean fatigue limit butalso the scatter of classical fatigue results. Indeed, by using the two-scaleprobabilistic model and an energetic criterion based on a constant criticaldissipated energy, it is possible to predict the S/N curves for any given prob-ability of failure using a single specimen in less than half a day [2].
1.3. Measurement protocol developed for rubber-like materials
1.3.1. Temperature measurement
A heat build-up experiment can be defined as a succession of cyclic testsof increasing loading conditions during which the temperature of the spec-imen is measured. The number of cycles used for each loading condition isthe number of cycles needed for the temperature to stabilize (for example,2000 cycles at 2 Hz are sufficient). For the temperature measurement, wewere facing two major technical problems: we have to set up an experimentthat takes into account the large displacements of the specimen during a fa-tigue test and to properly define a heat build-up temperature. The responsesto these problems were depending on the technological solution we retain forthe temperature measurements. The use of thermocouples is possible but itpresents some technological limitations (fixation on the specimen, responsetime of about 1 s for classical thermocouples) and the main point is thatit only gives a local information. We have chosen to use an infrared cam-era, which gives access to a 2D measurement with a high acquisition rate(50 frames/seconds) and a very good precision (about 30 mK), even if it willonly be a surface measurement. However, AE2 specimen are thinner enoughto avoid a too high core/skin temperature ratio.
The infrared camera that has been used is a Flir Systems camera (refer-ence Phoenix MWIR 9705) with a Stirling-cycle cooled Indium Antimonide(InSb) Focal Plane Array (FPA). The FPA is a 320×256 array of detectorsdigitized on 14 bits, sensitive in the 3µm-5µm spectral band. A preliminarycalibration operation allows the conversion of the thermosignal (proportionalto the thermal radiation) into a temperature in Celcius degree (◦C).
Figure 4 presents one example of temperature evolution of the centralzone of the specimen during cyclic solicitation (20 cycles). We can note amean rise of the temperature due to an intrinsic dissipation and an oscillationof the temperature during one cycle which is caused by the thermomechani-cal couplings (mainly thermoelastic effects). The amplitude of these couplingeffects could attain one Celsius degree. We consequently had to make surethat the temperature is measured for a given position of the specimen to
5
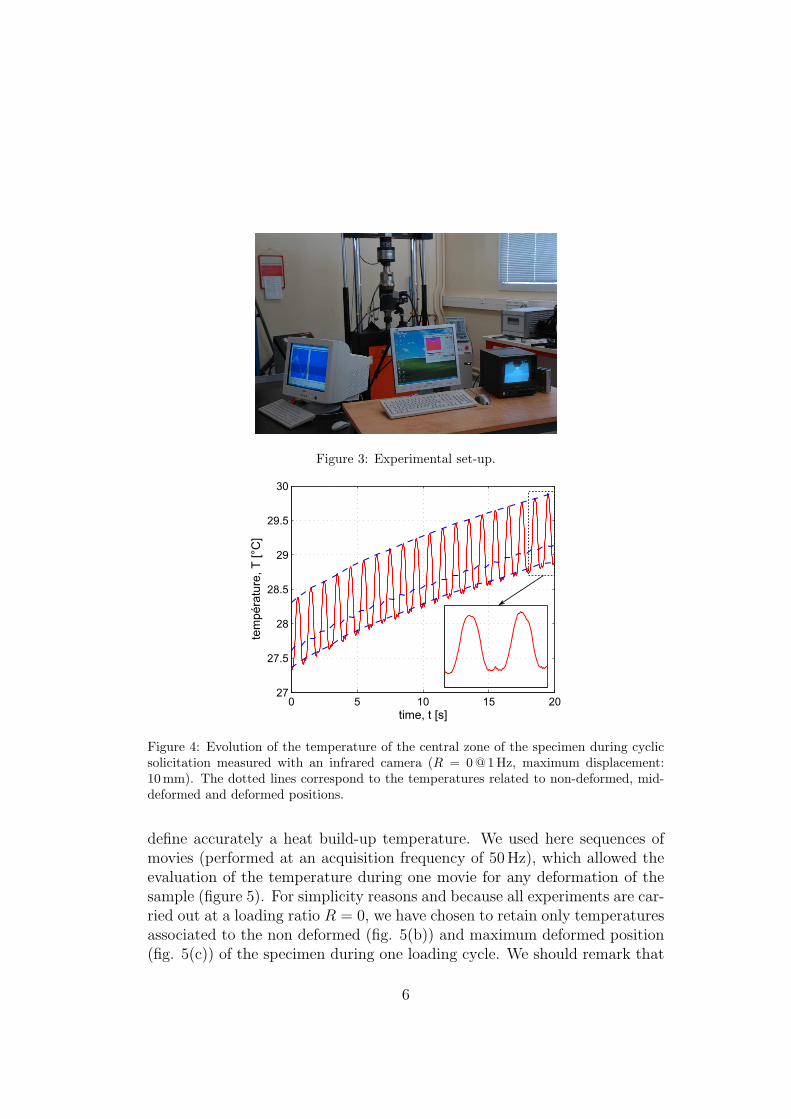
Figure 3: Experimental set-up.
Figure 4: Evolution of the temperature of the central zone of the specimen during cyclicsolicitation measured with an infrared camera (R = 0 @ 1Hz, maximum displacement:10 mm). The dotted lines correspond to the temperatures related to non-deformed, mid-deformed and deformed positions.
define accurately a heat build-up temperature. We used here sequences ofmovies (performed at an acquisition frequency of 50 Hz), which allowed theevaluation of the temperature during one movie for any deformation of thesample (figure 5). For simplicity reasons and because all experiments are car-ried out at a loading ratio R = 0, we have chosen to retain only temperaturesassociated to the non deformed (fig. 5(b)) and maximum deformed position(fig. 5(c)) of the specimen during one loading cycle. We should remark that
6

0 500 1000 1500 20000
0.2
0.4
0.6
0.8
1
1.2
1.4
number of cycles, N
tem
pera
ture
var
iatio
n, θ
[°C
] θd
θnd
(a) Evolution of the temperature variation
(b) non deformed posi-tion
(c) maximum deformedposition
Figure 5: Evolution of the temperature variation envelope for a value of displacementamplitude of 0.6 mm.
the temperatures associated to these positions are not necessarily the min-imum and maximum temperatures reached during one cycle because of thethermoelastic inversion phenomenon which can be clearly seen on figure 4[4–6].
For each loading block, we get an envelope of temperature (figure 5(a))and we evaluate the amplitude of the thermomechanical coupling effects (dif-ference between the temperatures measured in the maximum deformed po-sition and non-deformed position). The temperature variation is calculatedfrom the current temperature T and the initial temperature T0 using theequation θ = T − T0. To take into account the global heating of the ma-chine test, the temperature gradient of the specimen and the low thermal
7
conductivity of rubber-like materials, a pause of 15 min is performed at theend of each loading block in order to ensure the temperature stabilizationand homogeneity.
1.3.2. Heat build-up curve construction
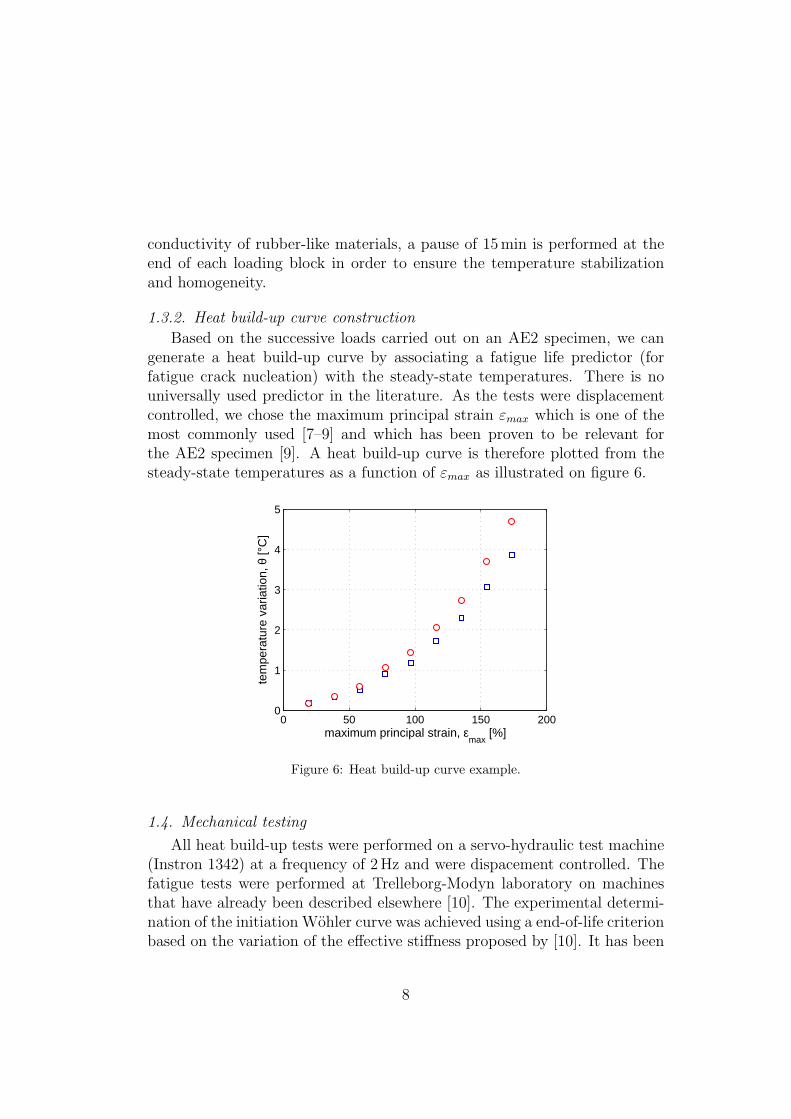
Based on the successive loads carried out on an AE2 specimen, we cangenerate a heat build-up curve by associating a fatigue life predictor (forfatigue crack nucleation) with the steady-state temperatures. There is nouniversally used predictor in the literature. As the tests were displacementcontrolled, we chose the maximum principal strain εmax which is one of themost commonly used [7–9] and which has been proven to be relevant forthe AE2 specimen [9]. A heat build-up curve is therefore plotted from thesteady-state temperatures as a function of εmax as illustrated on figure 6.
0 50 100 150 2000
1
2
3
4
5
maximum principal strain, εmax
[%]
tem
pera
ture
var
iatio
n, θ
[°C
]
Figure 6: Heat build-up curve example.
1.4. Mechanical testing
All heat build-up tests were performed on a servo-hydraulic test machine(Instron 1342) at a frequency of 2 Hz and were dispacement controlled. Thefatigue tests were performed at Trelleborg-Modyn laboratory on machinesthat have already been described elsewhere [10]. The experimental determi-nation of the initiation Wohler curve was achieved using a end-of-life criterionbased on the variation of the effective stiffness proposed by [10]. It has been
8
shown that the criterion is equivalent to the apparition of crack of 2 mm onthe surface of the specimen [9].
1.5. Tan δ measurements
Tan δ is an indicator of the viscous potential of a material. Its valueis not an intrinsic characteristic of a material but depends on the loadingconditions. Consequently, it is very important to mention the test conditionsrelated to the value of tan δ that are used. All measurements are performedon compression specimens (diameter: 29 mm and height: 12 mm). A staticcompression strain of 10% is applied and the dynamic load condition is astrain amplitude of 0.5% at 2 Hz. The tan δ value is then computed from thestress-strain response.
2. Results and discussion on the thermal measurements
2.1. First observations
In this paper, up to fifteen industrial materials have been tested. Itwas therefore mandatory to evaluate if the tests were repeatable in order toensure the reliability of the differences between the different materials. Thisrequirement was checked for several materials tested with small variations ofthe ambient temperature and for different loading histories (different numbersof loading blocks, with different increasing amplitudes). Figure 7 illustrateswell that the heat build-up tests gave the same curves for these differenttesting conditions.
2.2. A direct link with fatigue?
At this stage of the study, we were evaluating if a quick empirical protocolsimilar to the one used for metallic materials could be used. In order totake into account several kinds of material and different thermo-mechanicalproperties, a wide range of materials was investigated (more than fifteenindustrial materials were tested). We followed here a threefold approach:
• identify an empirical protocol giving the maximum strain leading to adamage initiation after 106 cycles for a given material;
• apply this protocol on several materials in order to test its validity;
• investigate its sensitivity to the material viscosity.
9

0 20 40 60 80 100 120 1400
2
4
6
8
10
12
14
16
maximum principal strain, εmax
[%]
min
imal
tem
pera
ture
var
iatio
n, θ
nd [°
C]
M1
M2
M3
Figure 7: Comparison, for threee materials (referenced as M1, M2 and M3) of the heatbuild-up curves of two different specimens submitted to different loading conditions. Forlegibility reasons, only the temperatures associated to the non-deformed positions of thespecimens are plotted.
Figure 8 presents the temperature measurements obtained for material G(cf. table 1) and a proposal of empirical analysis, similar to the one proposedfor metallic materials. The material G was chosen because it presents a tan δ
0 50 100 150 2000
2
4
6
8
10
12
maximum principal strain, εmax
[%]
tem
pera
ture
var
iatio
n, θ
[°C
]
ε=50%
Figure 8: Empirical processing performed on material G.
10
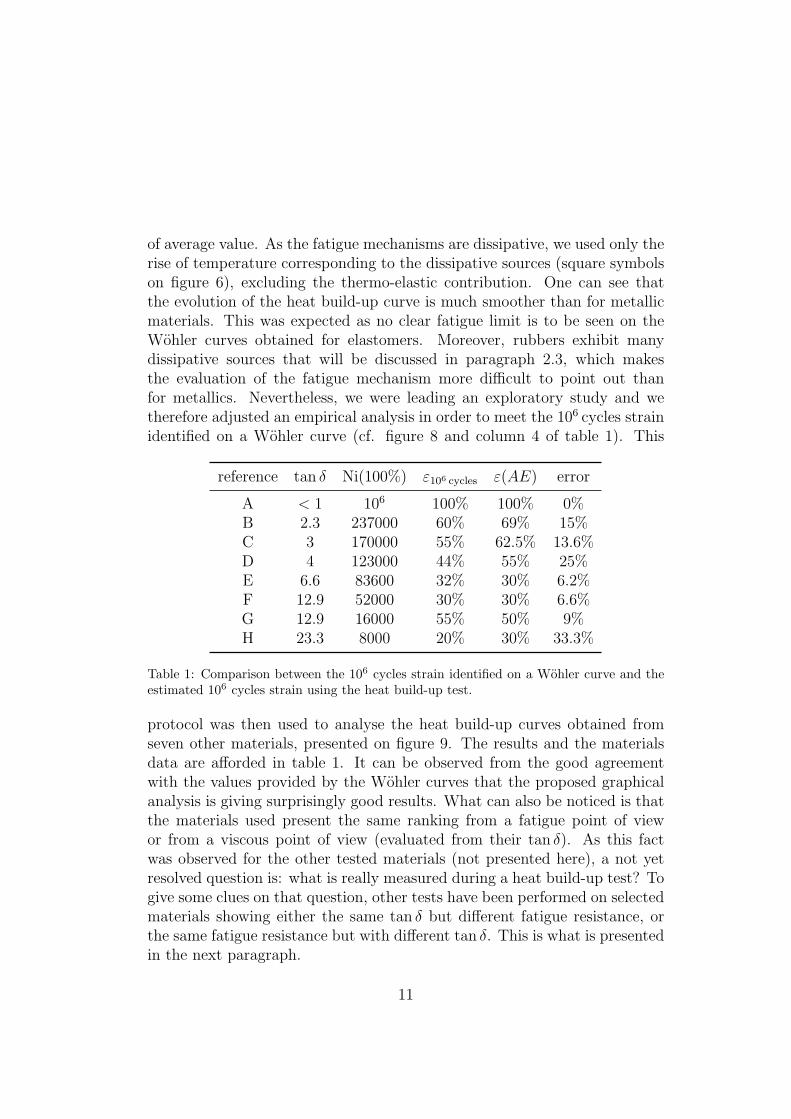
of average value. As the fatigue mechanisms are dissipative, we used only therise of temperature corresponding to the dissipative sources (square symbolson figure 6), excluding the thermo-elastic contribution. One can see thatthe evolution of the heat build-up curve is much smoother than for metallicmaterials. This was expected as no clear fatigue limit is to be seen on theWohler curves obtained for elastomers. Moreover, rubbers exhibit manydissipative sources that will be discussed in paragraph 2.3, which makesthe evaluation of the fatigue mechanism more difficult to point out thanfor metallics. Nevertheless, we were leading an exploratory study and wetherefore adjusted an empirical analysis in order to meet the 106 cycles strainidentified on a Wohler curve (cf. figure 8 and column 4 of table 1). This
reference tan δ Ni(100%) ε106 cycles ε(AE) error
A < 1 106 100% 100% 0%B 2.3 237000 60% 69% 15%C 3 170000 55% 62.5% 13.6%D 4 123000 44% 55% 25%E 6.6 83600 32% 30% 6.2%F 12.9 52000 30% 30% 6.6%G 12.9 16000 55% 50% 9%H 23.3 8000 20% 30% 33.3%
Table 1: Comparison between the 106 cycles strain identified on a Wohler curve and theestimated 106 cycles strain using the heat build-up test.
protocol was then used to analyse the heat build-up curves obtained fromseven other materials, presented on figure 9. The results and the materialsdata are afforded in table 1. It can be observed from the good agreementwith the values provided by the Wohler curves that the proposed graphicalanalysis is giving surprisingly good results. What can also be noticed is thatthe materials used present the same ranking from a fatigue point of viewor from a viscous point of view (evaluated from their tan δ). As this factwas observed for the other tested materials (not presented here), a not yetresolved question is: what is really measured during a heat build-up test? Togive some clues on that question, other tests have been performed on selectedmaterials showing either the same tan δ but different fatigue resistance, orthe same fatigue resistance but with different tan δ. This is what is presentedin the next paragraph.
11

0 50 100 150 200 250 300 3500
2
4
6
8
10
maximum principal strain, εmax
[%]
min
imal
tem
pera
ture
var
iatio
n, θ
nd [°
C]
ABCDEFGH
Figure 9: Heat build-up curves for materials A to H.
2.3. Sensitivity of the empirical protocol to the viscous dissipation
Rubber-like materials are known to be hysteretic materials at a macro-scopic scale, which means that some energy is dissipated and/or stored duringone loading cycle. This hysteresis is not well explained and can be justifiedby several explanations:
(a) Mullins effect [11]
(b) crystallization under strain [12]
(c) viscosity [13]
(d) plasticity [14]
(e) damage [15]
The contribution of each of these sources is not clearly defined yet but it isgenerally assumed that viscosity is one of the most important [13] and is afirst order parameter. To check this assumption, we performed heat build-upexperiments on specifically selected materials that have equivalent viscousdissipation potential (evaluated from the tan δ value) and different fatiguelifetimes and materials that have different viscous dissipation potentials (eval-uated from the tan δ value) and equivalent fatigue lifetimes. The figure 10shows the experimental curves obtained on materials having different tan δ
but the same fatigue lifetime. It seems that the empirical protocol is workingquite well. Considering now materials that have the same tan δ but differentfatigue lifetimes (see figure 11), the curves obtained are very similar and can
12

0 20 40 60 80 100 120 1400
2
4
6
8
10
12
maximum principal strain, εmax
[%]
min
imal
tem
pera
ture
var
iatio
n, θ
nd [°
C]
tan δ=15.6tan δ=12.9tan δ=7
Figure 10: Heat build-up curves for materials having the same fatigue lifetime but differenttan δ.
not lead to isolate the fatigue lifetime. It can therefore be concluded that
0 20 40 60 80 100 120 1400
2
4
6
8
10
maximum principal strain, \varepsilon_{max} [%]
min
imal
tem
pera
ture
var
iatio
n, θ
nd [°
C]
N
i(100%)=187000
Ni(100%)=188000
Ni(100%)=52000
Figure 11: Heat build-up curves for materials having the same tan δ but different fatiguelifetime.
even if the rough estimation analysis presented above has proven to be quiteeffective for several materials, a clear separation between viscous dissipationand a dissipation related to the fatigue resistance is far less easy to identify
13
for rubber-like materials than for metallic materials. Moreover, this protocolis giving only one point of the Wohler curve, which is clearly not enough asthe slopes of these curves may be quite different depending on the natureof the tested rubber [16]. Nevertheless, the heat build-up measurements areuseful to identify the parameters of constitutive models including some dis-sipation sources (viscosity, plasticity, damage) because these tests provideboth mechanical and thermal data. Moreover, a stabilization of the temper-ature increase was always observed (at the limited frequency imposed) andthis stabilization means that the dissipation source is nearly constant: anequilibrium between what is lost by conduction and convection and inducedby cyclic loadings is reached. It is also clear that the global dissipated energycould not be directly related to the fatigue damage and that the descriptionof the damage at lower scales is mandatory. In paragraph 3 we present howthe temperature measurements can be useful if some more information onthe fatigue damage evolution at a microscopic scale is provided.
3. Evolution of fatigue damage using X-ray microtomography
3.1. Principle of the critical energy criterion and scope of the investigation
Basically, fatigue design of rubber componentsrequires two steps: firstchoose a mechanical parameter: strain [7, 10], stress [17–19], strain energy[18, 20], . . . (see paragraph 1.3.2), and second perform several fatigue tests onsamples of different geometries, under different sollicitations, in order to gen-erate Wohler curves, plotting the value of the chosen parameter with respectto the number of cycles needed to break the sample or to initiate a crack. Apower law is then usually identified, relating the parameter to the number ofcycles and is to be applied to design industrial components. It is important tonote that the fatigue parameter can be different from the initiation criterion.This initiation criterion is usually a damage parameter, chosen for its abilityto be summed in order to analyze variable fatigue solicitations. Dependingon the materials, this parameter could be the dissipated energy [21–23], thecumulated plastic strain [24] or a scalar damage parameter associated withan evolution law [25]. Here, we will keep the maximal strain chosen formerlyas the fatigue parameter and we will use an initiation criterion based on thecumulated dissipated energy. The principle of the approach is therefore veryclassic and simple: whatever the fatigue parameter may be, the cumulateddissipative energy needed to initiate a crack will be a constant, called hereCDE (Critical Dissipated Energy). This energy based approach is close to
14

the one proposed by [26] based on a Cracking Energy Density (CED) whichis cumulated along the cycles and aims at being representative of the crackopening. It can also be related to the approach proposed by [15].
In elastomers, the energy dissipated evolves during the fatigue tests butreaches a stabilized value after the number of cycles needed to stabilize therise of temperature induced by the heat build-up. Once this stabilizationstep is achieved, the dissipated energy measured along the fatigue test isalmost a constant, for a given global displacement. This is confirmed bythe stabilization of the heat build-up along a fatigue test, showing that thedissipation sources are constant (see figure 5(a)). It is therefore possible towrite that:
CDE = N · Efatigue,diss/cycle (1)
with CDE the Critical Dissipated Energy considered as an intrinsic constant,N the number of fatigue cycles needed to reach the initiation (according to agiven experimental criterion) and Efatigue,diss/cycle the energy dissipated percycle by the fatigue mechanisms, which is a function of the maximum strain.
As illustrated in paragraph 2, the dissipated energy is not easy to re-late to the fatigue durability of elastomers as it does not depend only onthe fatigue mechanisms. Several materials exhibiting the same dissipatedenergy per cycle will not necessarily have the same fatigue lifetime. It isconsequently difficult to propose an experimental evaluation of the value ofEfatigue,diss/cycle introduced in equation 1 since both a global evaluation ofthe dissipated energy and reliable micro-structural data on the fatigue mech-anisms are required. The proposed approach is therefore:
• to use micro-structural measurements of the fatigue defect population,as it is well stated in the literature that the fatigue mechanisms forboth initiation and propagation at a micro-scale are strongly related tothe defect population [16, 27–32];
• to use the heat build-up measurements as an evaluation of the dissi-pated energy during cyclic and fatigue tests.
We focus here on a polychloroprene rubber, which was studied during theheat build-up campaign and which fatigue damage evolution was followed byX-ray computed tomography [1]. The samples used for the fatigue tests, theheat build-up tests and the X-ray tomography measurements were obtainedfrom the same batch of material. The complex shape of the specimen (see
15
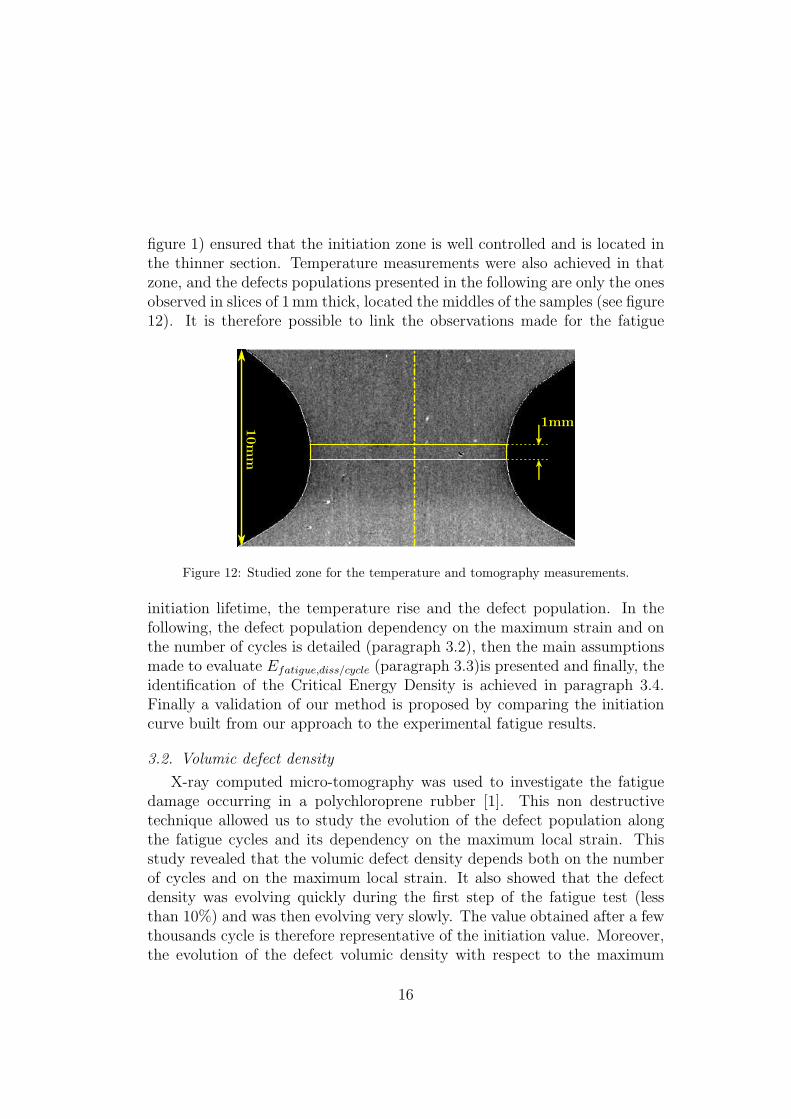
figure 1) ensured that the initiation zone is well controlled and is located inthe thinner section. Temperature measurements were also achieved in thatzone, and the defects populations presented in the following are only the onesobserved in slices of 1 mm thick, located the middles of the samples (see figure12). It is therefore possible to link the observations made for the fatigue
Figure 12: Studied zone for the temperature and tomography measurements.
initiation lifetime, the temperature rise and the defect population. In thefollowing, the defect population dependency on the maximum strain and onthe number of cycles is detailed (paragraph 3.2), then the main assumptionsmade to evaluate Efatigue,diss/cycle (paragraph 3.3)is presented and finally, theidentification of the Critical Energy Density is achieved in paragraph 3.4.Finally a validation of our method is proposed by comparing the initiationcurve built from our approach to the experimental fatigue results.
3.2. Volumic defect density
X-ray computed micro-tomography was used to investigate the fatiguedamage occurring in a polychloroprene rubber [1]. This non destructivetechnique allowed us to study the evolution of the defect population alongthe fatigue cycles and its dependency on the maximum local strain. Thisstudy revealed that the volumic defect density depends both on the numberof cycles and on the maximum local strain. It also showed that the defectdensity was evolving quickly during the first step of the fatigue test (lessthan 10%) and was then evolving very slowly. The value obtained after a fewthousands cycle is therefore representative of the initiation value. Moreover,the evolution of the defect volumic density with respect to the maximum
16

strain was measured. This curve is plotted on figure 13 and was obtainedfrom several samples and for several fatigue test durations. We also checked
0 20 40 60 80 100 120 1400
1
2
3
4
5
6
7
maximum local strain [%]
defe
cts
volu
mic
den
sity
[mm
−3 ]
0−2mm0−4mm0−6mm
Figure 13: Evolution of the defect population density with respect to the maximum prin-cipal strain. The legend values correspond to the macroscopic displacement applied to thespecimen.
that the average radius of the defects was not evolving much along the fatiguetest and was not dependent on the maximum strain. The defect density isused here to be more precise but as the studied volume is the same for allthe samples, it can also be seen as the number of defects. We therefore knowthe dependency of the defects density on the maximum strain but we still donot know how the material dissipates energy.
3.3. Evaluation of the energy dissipated by a defect population
Once the defect population and its evolution along the maximum localstrain are described, a first way to evaluate the Efatigue,diss/cycle would be towrite that :
Efatigue,diss/cycle =∑
defects
Eddiss/cycle (2)
with Edfatigue,diss/cycle being the dissipated energy by each defect.
The next step combines Finite Element simulations [28, 33] and homo-geneization techniques [34]. This is maybe the closest approach from themicroscopic mechanisms but it is still meeting very big difficulties. The first
17

problem comes from the assumed equivalence between a given population ofdefects exhibiting different sizes and shapes and a homogeneous populationof an equivalent defect. Then, the evaluation of the energy dissipated by agiven defect meets the complexity of elastomeric materials (shape of inclu-sions, matrix visco-hyper-elasticity, low compressible behaviour, difficulty toidentify the interphase behaviour, necessity to take the inclusion interactionsinto account, . . . ). At last, the dissipative sources related to a defect in anelastomeric matrix are still not well identified (growth of the cavity, matrixinelasticity, friction at the interface . . . ) and are therefore difficult to eval-uate. Here, we have chosen a much more phenomenological approach: wechose to relate the total dissipated energy (evaluated from the stabilized riseof temperature) to the energy dissipated by the defect population.
The first hypothesis assumes that the ratio between the total dissipatedenergy and the one related to the fatigue mechanisms (whatever the kind ofdissipation it leads to) is linearly dependant on the defect density. It wouldthen come:
Efatigue,diss/cycle = A · DVD · V · Ediss/cycle (3)
With A being a constant, DVD the Defects Volumic Density in the centralzone of the sample, V the considered volume and Ediss/cycle the total dissi-pated energy during one fatigue cycle in that volume. The second hypothesisis that the total dissipated energy is evaluated from the temperature rise only.This strong assumption is supported by the very low thermal conductivityof the material and because we consider here only the rise of temperaturelinked to the dissipation, with no thermoelastic couplings (see paragraph1.3.1). This point will of course be further investigated but this assumptionis taken as a first rough evaluation. We could consequently write that:
Ediss/cycle = B · ∆T (4)
With B a constant parameter and T the stabilized rise of temperature in thecentral zone of the sample, which is dependant on the maximum imposeddeformation. This global evaluation is also required because:
• the rise of temperature, measured at the skin, is an average value ofthe dissipation sources that are located in the volume underneath;
• the defect volumic density is also defined as an average value for a givenvolume.
18

From equations 1, 3 and 4, it would then come:
CDE = N · A · DVD · V · B · ∆T (5)
Which can also be written as:
N · DVD · ∆T = cste (6)
for a given volume.
3.4. Experimental validation of our approach
In the following we will use the figure 13, 14 and 15 in order to evaluate thenumerical values of the terms in equation 6. The initiation lifetime is takenfrom the Wohler curve, the defect volumic density is obtained from the curvefitted on the X-ray tomography measurements and the rise of temperatureis obtained from the heat-build up curve. The first step is to identify thevalue of the constant of equation 6, that is given in table 2. In order to
103
104
105
106
107
20
40
60
80
100
120
number of cycles, N
max
imum
prin
cipa
l str
ain,
εm
ax [%
]
Figure 14: Wohler curve of the studied polychloroprene rubber.
validate the approach, we then evaluate the product of equation 6 for severallocal maximum strains. It can be observed from table 2 that the valuesobtained are very similar. The second step of validation was to build aninitiation curve from equation 6, using one of the constant evaluated (forexample 440000, obtained for a 2 mm displacement) and power laws fitted
19

0 20 40 60 80 100 1200
5
10
15
20
maximum principal strain, εmax
[%]
min
imal
tem
pera
ture
var
iatio
n, θ
nd [°
C]
specimen 1specimen 2
Figure 15: Heat build-up curve of the studied polychloroprene rubber.
εmax Ni DVD θnd evaluated energy based constant
30% 106 cycles 0.2 mm−3 2.2◦C 44000070% 3.5·104 cycles 1.5 mm−3 8.2◦C 430500110% 6.5·103 cycles 4.5 mm−3 15.2◦C 444600
Table 2: Evaluation of the Critical Dissipated Energy
on the curves of figure 13 (defects density) and 14 (stabilized temperaturerise). The curve obtained is plotted on figure 16 and exhibits a very goodcorrelation with the other experimental points. As the value obtained fromequation 6 was varying a little from a condition to another, we also plot thesame curve, obtained with a variation of 15% from the value of the constantused to build the curve. It illustrates that the variations observed in table 2lead to very few differences of the reconstructed initiation lifetime curve.
Despite the very strong hypotheses used here and that need to be furtherinvestigated, this approach leads to convincing results and seems thereforevery promising because it could shorten very much the determination of thefatigue properties of an elastomeric material. With about 6 samples in orderto propose a reliable fit of the evolution of the defects population along themaximum strain (5 submitted to an interrupted heat build-up protocol andthen analysed by X-ray tomography, 1 that is pushed untill the initiationin order to have a value for the energy constant) and within 3 days (one
20

103
104
105
106
107
20
40
60
80
100
120
140
number of cycles, N
max
imum
prin
cipa
l str
ain,
εm
ax [%
]
constant (eq. 6)constant +15%constant −15%
Figure 16: Prediction of the Wohler curve using the proposed approach.
day for mechanical testing and 2 for X-ray measurements and analysis) itcould be possible to evaluate the full initiation lifetime curve. The dispersionobserved for fatigue tests might also be deduced from the dispersion on thedefect density, as the rise of temperature is very repeatable. Nevertheless,the proposed approach is of course to be validated on several materials, whichis currently undertaken.
Conclusions
In this study we focused on the development of a heat build-up test,which relates the maximum principal strain to the temperature rise. A veryfirst step was to propose an accurate measurement protocol suitable for largedisplacements and that could discriminate the temperature rise induced bycumulative dissipation from the thermo-elastic contribution. More than fif-teen industrial materials were tested in order to experiment the ability ofthat kind of test to be representative of the fatigue resistance of elastomers.These tests provided promising results but a quick analysis is still made del-icate by the highly viscous nature of these materials . In order to proposea physically based evaluation of the dissipated energy related to the fatiguedefects, we used here the results from another paper [1]. The defect volu-mic density was used to evaluate the ratio of the total dissipated energy,deduced from the heat build-up measurements, that could be related to the
21
damage. An energy based fatigue criterion is then proposed and validatedfor a polychloroprene rubber. The correlation between the fatigue results ob-tained from a classical Wohler curve and those from the proposed approachis excellent and clearly calls further developments and validations on othermaterials. This study also illustrated that the heat build-up test seems to bean appropriate tool to identify the parameters of constitutive models includ-ing dissipation, as both mechanical and thermal responses are analysed. Italso proved how valuable micro-tomography measurements can be in orderto understand what happens during the heat build-up tests and to feed themechanical models with damage kinetics.
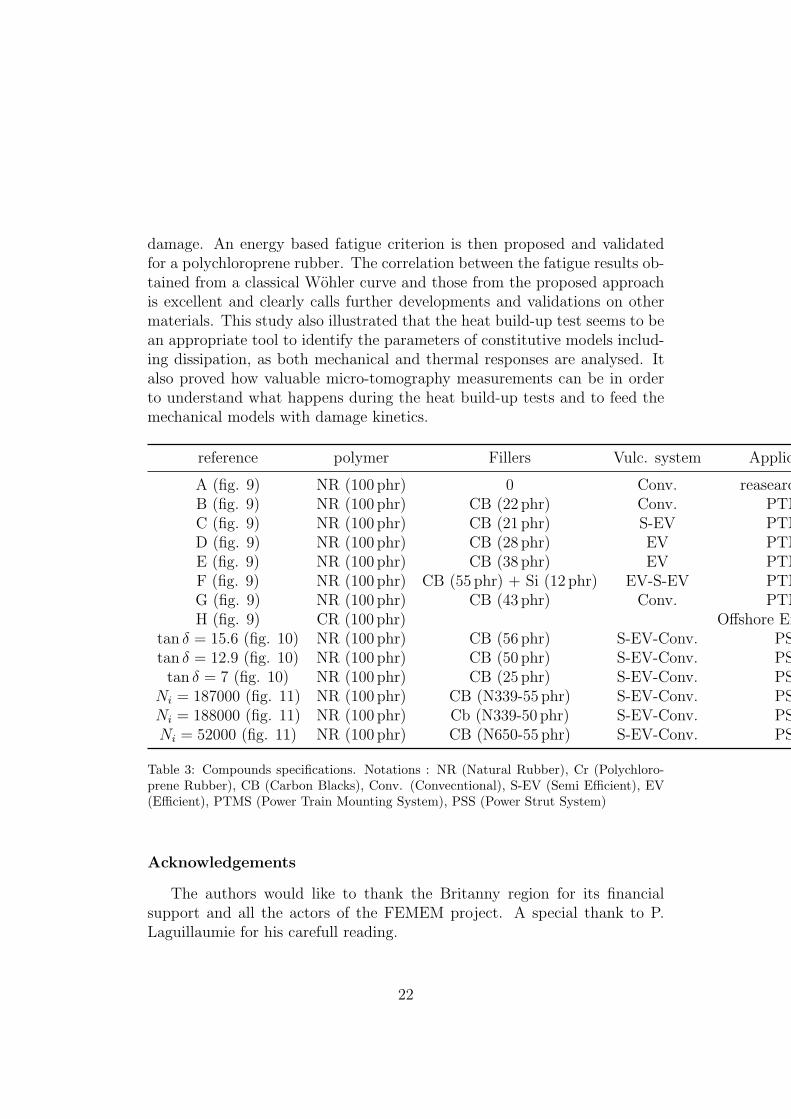
reference polymer Fillers Vulc. system Application
A (fig. 9) NR (100 phr) 0 Conv. reasearcB (fig. 9) NR (100 phr) CB (22 phr) Conv. PTMSC (fig. 9) NR (100 phr) CB (21 phr) S-EV PTMSD (fig. 9) NR (100 phr) CB (28 phr) EV PTMSE (fig. 9) NR (100 phr) CB (38 phr) EV PTMSF (fig. 9) NR (100 phr) CB (55 phr) + Si (12 phr) EV-S-EV PTMSG (fig. 9) NR (100 phr) CB (43 phr) Conv. PTMSH (fig. 9) CR (100 phr) Offshore Engineering
tan δ = 15.6 (fig. 10) NR (100 phr) CB (56 phr) S-EV-Conv. PSStan δ = 12.9 (fig. 10) NR (100 phr) CB (50 phr) S-EV-Conv. PSStan δ = 7 (fig. 10) NR (100 phr) CB (25 phr) S-EV-Conv. PSS
Ni = 187000 (fig. 11) NR (100 phr) CB (N339-55 phr) S-EV-Conv. PSSNi = 188000 (fig. 11) NR (100 phr) Cb (N339-50 phr) S-EV-Conv. PSSNi = 52000 (fig. 11) NR (100 phr) CB (N650-55 phr) S-EV-Conv. PSS
Table 3: Compounds specifications. Notations : NR (Natural Rubber), Cr (Polychloro-prene Rubber), CB (Carbon Blacks), Conv. (Convecntional), S-EV (Semi Efficient), EV(Efficient), PTMS (Power Train Mounting System), PSS (Power Strut System)
Acknowledgements
The authors would like to thank the Britanny region for its financialsupport and all the actors of the FEMEM project. A special thank to P.Laguillaumie for his carefull reading.
22

References
[1] V. Le Saux, Y. Marco, S. Calloch, P. Charrier, Evaluation of the fa-tigue defects population in an elastomer using X-ray computed micro-tomography, International Journal of Fatigue Submitted (July 2009).
[2] C. Doudard, S. Calloch, P. Cugy, A. Galtier, F. Hild, A probabilistic two-scale model for high-cycle fatigue life predictions, Fatigue & Fracture ofEngineering Materials & Structures 28 (2005) 279–288.
[3] M. Luong, Infrared thermography of fatigue in metals, SPIE 1682 (1992)222–233.
[4] J. Joule, On some thermodynamics properties of solids, PhilosophicalTransactions of the Royal Society of London 149 (1859) 91–131.
[5] R. Anthony, R. Caston, E. Guth, Equations of state for natural andsynthetic rubber-like materials. I. Unaccelerated natural soft rubber,The Journal of Physical Chemistry 46 (1942) 826–840.
[6] L. Treloar, The physics of rubber elasticity (third edition), Oxford (UK): Oxford University Press, 1975.
[7] S. Cadwell, R. Merrill, C. Sloman, F. Yost, Dynamic fatigue life ofrubber, Industrial and Engineering Chemistry 12 (1940) 19–23.
[8] B. Roberts, J. Benzies, The relationship between uniaxial and equibiax-ial fatigue in gum and carbon black filled vulcanizates, Proceedings ofRubbercon’77 (1977) 2.1–2.13.
[9] E. Ostoja Kuczynski, Comportement en fatigue des elastomeres : ap-plication aux structures antivibratoires pour l’automobile, Ph.D. thesis,Ecole Centrale de Nantes, Universite de Nantes, 2005.
[10] E. Ostoja Kuczynski, P. Charrier, E. Verron, L. Gornet, G. Marck-mann, Crack initiation in filled natural rubber: experimental databaseand macroscopic observations, in: Constitutive Model for Rubber III,London (UK), 3–10, 2003.
[11] J. Diani, B. Fayolle, P. Gilormini, A review on the Mullins effect, Euro-pean Polymer Journal 45 (2009) 601–612.
23

[12] J. Marchal, Cristallisation des caoutchoucs charges et non charges souscontraintes : effet sur les chaınes amorphes, Ph.D. thesis, Universite deParis XI Orsay, 2006.
[13] J. Bergstrom, M. Boyce, Constitutive modeling of the large strain time-dependend behavior of elastomers, Journal of the Mechanics and Physicsof Solids 46 (1998) 931–954.
[14] C. Miehe, J. Keck, Superimposed finite elastic-viscoelastic-plastoelasticstress response with damage in filled rubbery polymers. Experiments,modelling and algorithmic implementation, Journal of the Mechanicsand Physics of Solids 48 (2000) 323.365.
[15] J. Grandcoin, Contribution a la modelisation du comportement dissi-patif des elastomeres charges : d’une modelisation micro-physiquementmotivee vers la caracterisation de la fatigue, Ph.D. thesis, Universited’Aix-Marseille II, 2008.
[16] W. Mars, A. Fatemi, A literature survey on fatigue analysis approachesfor rubbers, International Journal of Fatigue 24 (2002) 949–961.
[17] C. Lu, Etude du comportement mecanique et des mecanismesd’endommagement des elastomeres en fatigue et en fissuration par fa-tigue, Ph.D. thesis, CNAM, 1991.
[18] F. Abraham, T. Alshuth, S. Jerrams, The effect of minimum stress andstress amplitude on the fatigue life of non strain crystallising elastomers,Materials & Design 26 (2005) 239–245.
[19] N. Saintier, G. Cailletaud, R. Piques, Multiaxial fatigue life predictionfor a natural rubber, International Journal of Fatigue 28 (2006) 530–539.
[20] F. Lacroix, S. Meo, G. Berton, F. Chalon, A. Tougui, N. Ranganathan,A local criterion for fatigue crack initiation on chloroprene rubber :approach in dissipation, in: ECCMR IV, Stockholm (Sweden), 2005.
[21] F. Ellyin, K. Golos, Multiaxial fatigue damage criterion, Journal of En-gineering Materials and Technology 110 (1988) 63–68.
[22] G. Fargione, A. Geraci, G. La Rosa, A. Risitano, Rapid determinationof the fatigue curve by the thermographic method, International Journalof Fatigue 24 (2002) 11–19.
24

[23] E. Charkaluk, A. Bigonnet, A. Constantinescu, K. Dang Van, Fatiguedesign of structures under thermomechanical loadings, Fatigue & Frac-ture of Engineering Materials and Structures 25 (12) (2002) 1199–1206.
[24] I. Papadopoulos, Fatigue polycyclique des metaux: une nouvelle ap-proche, Ph.D. thesis, Ecole Nationale des Ponts et Chaussees, 1987.
[25] J. Lemaitre, J. Chaboche, Aspect phenomenologique de la rupture parendommagement, Journal de Mecanique Appliquee 2 (3) (1978) 317–365.
[26] W. Mars, Multiaxial fatigue of rubber, Ph.D. thesis, University ofToledo, 2001.
[27] J. Busfield, A. Thomas, M. Ngah, Application of fracture mechanics forthe fatigue life prediction of carbon black filled elastomers, in: Consti-tutive Model for Rubber, Rotterdam (The Netherlands), 249–256, 1999.
[28] N. Saintier, Fatigue multiaxiale dans un elastomere de type NR charge: mecanismes d’endommagement et critere local d’amorcage de fissure,Ph.D. thesis, Ecole Nationale Superieure des Mines de Paris, 2001.
[29] J. Le Cam, B. Huneau, E. Verron, L. Gornet, Mechanism of fatiguecrack growth in carbon black filled rubber, Macromolecules 37 (2004)5011–5017.
[30] J. Le Cam, E. Verron, B. Huneau, L. Gornet, Micro-mechanism of fa-tigue crack growth: comparison between carbon black filled NR SBR,in: Constitutive model for rubber IV, Stockholm (Sweden), 115–120,2005.
[31] N. Saintier, G. Cailletaud, R. Piques, Crack initiation and propagationunder multiaxial fatigue in a natural rubber, International Journal ofFatigue 28 (2006) 61–72.
[32] K. Le Gorgu Jago, Fatigue life of rubber components: 3D damage evo-lution from X-ray computed microtomography, in: Constitutive Modelfor Rubber V, Paris (France), 173–177, 2007.
25

[33] Y. Fukahori, W. Seki, Stress analysis of elastomeric materials at largeextensions using the finite elements methods. II: Stress and strain dis-tribution around rigid spherical particles, Journal of Materials Science28 (1993) 4471–4482.
[34] B. Omnes, S. Thuillier, P. Pilvin, G. Gillet, Non-linear mechanical be-havior of carbon black reinfored elastomers: experiments and multiscalemodelling, Plastics, Rubber and Composites 37 (2008) 251–258.
26


![Understanding of Fatigue Strength Improvement of Steel … · 2017-01-23 · technique as a method of repair with fatigue crack closure by hammering [3] and lifetime extension of](https://static.fdocuments.net/doc/165x107/5e8d13b074cc313ab15436a9/understanding-of-fatigue-strength-improvement-of-steel-2017-01-23-technique-as.jpg)


