School oftrade day trading crude oil gold euro emini newsletter 06 08 15

The following describes a successful trading strategy developed for the weekly US DOE Crude Oil Inventory reports.
Background:Every week, the American Petroleum Institute (API) and the US Department of Energy (DOE) release their findings on Crude Oil Inventories. We do not have access to the API reports, but we do provide the DOE reports. Both of these entities report and collect virtually the same data. These reports are very tradable in the futures market on the “CL OIL” instrument. Furthermore, decent price action as a result of this released data is usually seen each week. Several problems exist to trade the DOE report with predictable outcomes. First, there are generally no forecasts or estimates available for the API reports which come out on Tuesday of each week; and second, the forecasts / estimates that are generally available for the DOE reports don’t seem to be useful to set tradable deviations around.
Research:We have performed extensive research on market reaction to the API and the DOE Crude Oil Inventory reports for 2016, and have arrived at a simple methodology to trade the DOE report in a very reliable manner. The following document shows detailed results of each of the last several months of market reactions to both the API and DOE reports being released along with some analysis. Additionally, we will be providing a weekly trigger email for the DOE Reports providing all the information needed to effectively trade it. All of the chart data provided below is available from our website, http://www.fasteconomicnews.com/fx_calendar.aspx using the “Find” feature on that page.
The Short Answer:We have found that if you simply use the Actual number that was released for the API Crude Oil Inventory on Tuesday and then use that as the new forecast for the DOE Crude Oil Inventory report on Wednesday, coupled with a symmetrical set of standard triggers in the range of say +- 1000, then you are going to see predictable price action about 90% of the time. To arrive at a trading methodology that is any more precise than this would simply overcomplicate the trading scenario and perhaps prevent some viable trades.
Important Notes:1 – Secret News Weapon Elite and Enterprise provide the ability to change default forecast values. SNW Professional does not. When the DOE Crude Oil Inventory Report appears on the SNW grid, simply double-click on its Forecast value and you will be able to provide your own Forecast value.
2 – Secret News Weapon Enterprise is much faster than Elite on this report. It would be very worthwhile to
Fast Economic News - A Successful US DOE Crude Oil Trading Strategy
(c) Fast Economic News

2 – Secret News Weapon Enterprise is much faster than Elite on this report. It would be very worthwhile to use Enterprise to trade this report as futures brokers aren’t going to get in the way of your fills like a lot of currency brokers do; however, speed will definitely matter in the futures environment. Take a look here to see how much faster Enterprise is than Elite. http://www.fasteconomicnews.com/speediseverything.aspx
The following document will detail each of these reports released from May 3, 2016 through until Dec 14, 2016 along with charts. Then finally, on the last page, a one page spreadsheet is provided to summarize all report releases from December 23, 2015 to April 27, 2016 - without charts.
Full Story:Here were some thoughts from Crazy Cat as he was researching this issue:
I received quite a few questions about the possibility of trading DOE Crude Oil Inventories with Secret News Weapon, and if I could provide triggers for these reports. A few months ago I included this report on a weekly schedule, and I was going to provide triggers for the October 5, 2016 release. However, as I was researching this report for optimal triggers, I was very puzzled that sometimes it worked really well and sometimes it failed badly, for no apparent reason. I eventually decided that I would not provide triggers for that release, and that was an excellent call. The following day DOE Crude Oil Inventories came out with a big -4476 deviation, yet the price action went the opposite way. Had I provided triggers for that report on that day, it would not have worked out and you would had lost money. A “No trade” signal is always better than a losing trade.
That failure didn't stop me from researching this report. After all, it's a weekly report with frequent significant deviations and very nice price action. After spending some time on this project, I think I found a workable solution I wanted to share with you. It's not perfect, but I believe that it's much safer and more effective way to trade this event. I noticed that the day before DOE Crude Oil Inventories is being released, we have API Crude Oil Inventories coming out. We do not provide this report in SNW but that report is still released every week by the API. API Crude Oil is usually being released at 16:30 New York time, about 16 hours prior the DOE counterpart release. Both reports are very similar. Since they are so close to each other, and since both deal with the same subject, perhaps it's more reliable to substitute the DOE forecast value with API actual release number from the previous day. My reasoning is that after all, the actual value from API rather than a consensus of economists' educated guess may more accurately predict what we can expect to see from the DOE report. Moreover, since the market moves based on the API report, that means that the actual value from the API report is already priced-in when the DOE report comes out.
I didn’t provide the signal for the October 05 DOE release, but here is how it worked: (c) Fast Economic News

Starting on October 04, 2016 at 16:30 NY Time the US API Crude Oil Inventories was released, and the actual value was -7600. Using the DOE forecast value of +1500 (which may not be the best source for the forecast value), the deviation calculation for the API report was: -7600 [API actual value] -1500 [DOE forecast] = -9100 deviation.
Negative deviations for oil inventories move the price higher, and it was a very nice deviation. Crude Oil went up like crazy, initially by 40 ticks but over the next 16 hours even higher.
Everything was great so far. Then the DOE report comes 16 hours later:
October 05, 2016 at 10:30 NY Time: US DOE Crude Oil Inventories Forecast value: +1500October 05, 2016 at 10:30 NY Time: US DOE Crude Oil Inventories Actual value: -2976
Therefore, DOE Crude Oil deviation calculation was: -2976 [DOE actual value] - 1500 [DOE forecast] = -4476 deviation.
Normally with negative deviations the price should go up, but, as I had said above, the price actually went down, big time. Disaster.
Then I thought, let’s then substitute the DOE forecast value with the API actual value as a new baseline to determine a new deviation: -2976 [actual DOE] - (-7600) [actual API] = +4624 deviation (in case you are not good in Math, -2976 - (-7600) = -2976 + 7600 = 7600 - 2976 = 4624). A +4624 deviation is a strong sell signal on Crude Oil Inventories, and indeed the price fell by 40 ticks. Very promising, and a very good trade.
I then analyzed every release for 2016, and I'm pleased to announce that in my opinion this new methodology significantly improved theoretical trading results. As no trading strategy is perfect, in 2016 it somehow failed once (on August 24) and perhaps additional two or three times it could have worked better. Nevertheless, it worked a vast majority of the time, and on several occasions, this new methodology converted theoretically very badly losing trades into a very profitable ones. On many more occasions, it significantly improved the outcome.
In a few rare cases when it didn’t work, like on August 24, the price action may have been affected by some other exceptional market forces, such as OPEC dynamics. Only what I know is this new approach worked very well on many other occasions this year. Please browse this document and take a look yourself.
(c) Fast Economic News

In the following pages, I included 28 recent API and DOE releases, with screenshots of the charts and my comments. Don't miss the last page where for the remainder of 2016 not covered with the charts, I provided a nice summary table. They are great examples too with really amazing results.
When working with the summary table, please go to our website to see the charts. Simply go to our calendar page, find for DOE Crude Oil Inventories, and see historic charts. You will be amazed.
When you look at the pages with the charts, the upper chart is for API release and the lower chart is for DOE release. We don't really need API charts for this analysis, but I included them anyways for your own enjoyment. Additionally, since there are no generally available forecasts for API reports, I used the ones that come from the DOE. Deviation values in a red background mean selling pressure while in a green background - buying pressure. Additionally, I though of using a baseline set of triggers of +/- 1,000 but, of course, the exact triggers would depend on your risk appetite.
My method might probably be improved by perhaps making averages (or even weighted averages) between DOE forecast values and API actual values, or doing some other clever tricks. For example, you can compute your own new forecast value by taking 67% from the Actual API value and 33% for the DOE forecast. My intention was to share with you what I have found, and perhaps make room for a discussion or to share ideas. If you have better ways to trade this report or suggestions for further improvements, please let me know. If you like my approach as is, please let me know as well.
Of course, as is always the case, there is risk in trading financial instruments... and we are not giving financial advice or recommendations... any decisions to pursue this strategy must be done with the knowledge that risks are being assumed…
As always, thank you for being our customer, and I wish you all the best with your trading.
Thanks,M. Wojakowski(Crazy Cat)www.fasteconomicnews.com
(c) Fast Economic News

Date and Time Report Actual Forecast Deviation Actual API as New Forecast for DOE
Deviation From Actual API and Actual DOE
Dec 13, 2016 16:30 US API Crude Oil Inventories 4680 -1500 6180
Dec 14, 2016 10:30 US DOE Crude Oil Inventories -2563 -1500 -1063 4680 -7243
A deviation of -1063 was a very weak buy signal, and perhaps even a no trade if triggers were tightened a bit more. A new deviation of -7243 signaled a very strong buy signal, perhaps Buy 2, and in fact the spike was very strong.
Notes for ALL of the following chart examples: 1) There are no easily available forecast values for US API Crude Oil Inventory reports. 2) The forecast values shown above are simply the US DOE Crude Oil Inventories forecast for the following day.
(c) Fast Economic News

Date and Time Report Actual Forecast Deviation Actual API as New Forecast for DOE
Deviation From Actual API and Actual DOE
Dec 6, 2016 16:30 US API Crude Oil Inventories -2210 -1500 -710
Dec 7, 2016 10:30 US DOE Crude Oil Inventories -2389 -1500 -889 -2210 -179
While a deviation of -889 would most likely be a no trade, a new calculated deviation of just -179 (no trade) was even better given how the price reacted. It was for sure a no trade.
(c) Fast Economic News

Date and Time Report Actual Forecast Deviation Actual API as New Forecast for DOE
Deviation From Actual API and Actual DOE
Nov 29, 2016 16:30 US API Crude Oil Inventories -717 1500 -2217
Nov 30, 2016 10:30 US DOE Crude Oil Inventories -884 1500 -2384 -717 -167
With a deviation of -2384, it should be a really nice buy signal; however, a new calculated deviation of -167 was basically a no trade. That is correct, the price action was very bad, and a no trade was a correct call in this case. It worked really well by preventing entering a bad trade.
(c) Fast Economic News

Date and Time Report Actual Forecast Deviation Actual API as New Forecast for DOE
Deviation From Actual API and Actual DOE
Nov 22, 2016 16:30 US API Crude Oil Inventories -1280 1000 -2280
Nov 23, 2016 10:30 US DOE Crude Oil Inventories -1255 1000 -2255 -1280 25
With a deviation of 25, It was a no trade instead of a buy, which is good given that strange temporary down spike. Better safe than sorry.
(c) Fast Economic News

Date and Time Report Actual Forecast Deviation Actual API as New Forecast for DOE
Deviation From Actual API and Actual DOE
Nov 15, 2016 16:30 US API Crude Oil Inventories 3650 1000 2650
Nov 16, 2016 10:30 US DOE Crude Oil Inventories 5274 1000 4274 3650 1624
My new deviation of 1624 correctly suggested that the price action may not be as big as it could be if the deviation was 4274. While it was still a sell action, the price action was somewhat muted, and the revised deviation could potentially help to make a decision to exit the trade sooner than later. It could also mean it was a Sell 1 instead of Sell 2 (meaning smaller position size for better risk management).
(c) Fast Economic News
Date and Time Report Actual Forecast Deviation Actual API as New Forecast for DOE
Deviation From Actual API and Actual DOE
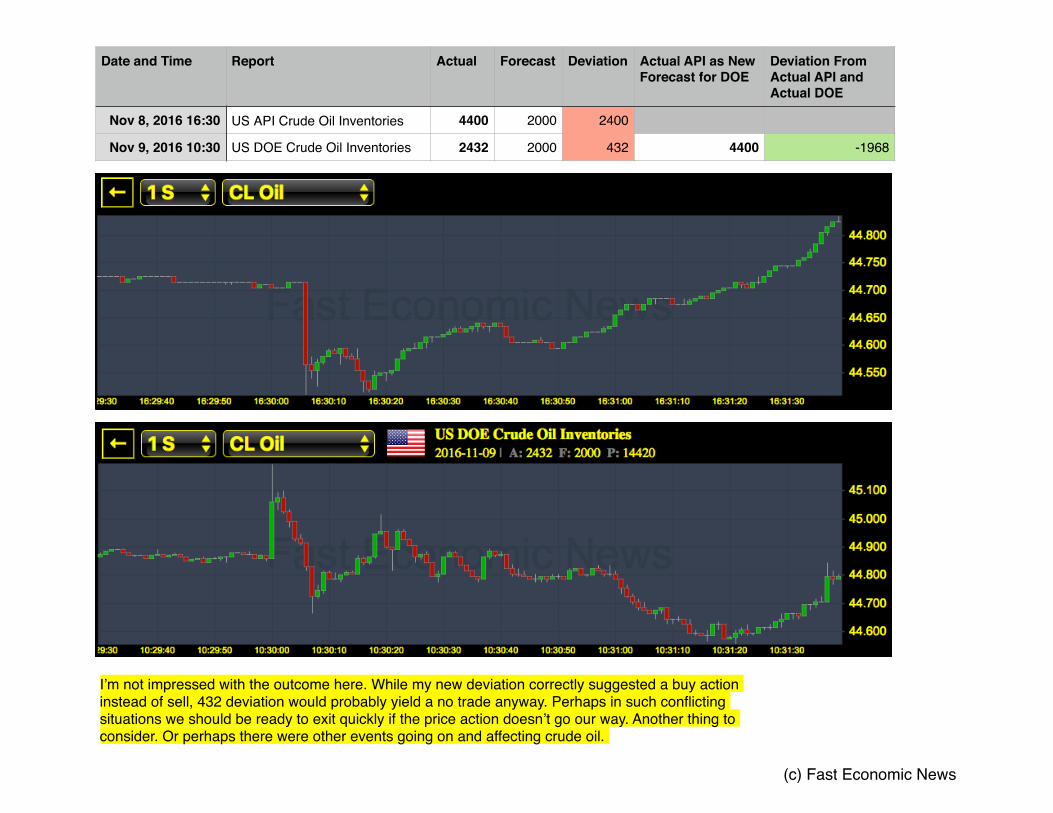
Nov 8, 2016 16:30 US API Crude Oil Inventories 4400 2000 2400
Nov 9, 2016 10:30 US DOE Crude Oil Inventories 2432 2000 432 4400 -1968
I’m not impressed with the outcome here. While my new deviation correctly suggested a buy action instead of sell, 432 deviation would probably yield a no trade anyway. Perhaps in such conflicting situations we should be ready to exit quickly if the price action doesn’t go our way. Another thing to consider. Or perhaps there were other events going on and affecting crude oil.
(c) Fast Economic News

Date and Time Report Actual Forecast Deviation Actual API as New Forecast for DOE
Deviation From Actual API and Actual DOE
Nov 1, 2016 16:30 US API Crude Oil Inventories 9300 2000 7300
Nov 2, 2016 10:30 US DOE Crude Oil Inventories 14420 2000 12420 9300 5120
Either way it was a sell. While my 5,120 deviation was more than twice smaller that 12,420, it was still a very big deviation, justifying a nice sell action.
(c) Fast Economic News

Date and Time Report Actual Forecast Deviation Actual API as New Forecast for DOE
Deviation From Actual API and Actual DOE
Oct 25, 2016 16:30 US API Crude Oil Inventories 4800 2000 2800
Oct 26, 2016 10:30 US DOE Crude Oil Inventories -553 2000 -2553 4800 -5353
I like this result. My new deviation is twice bigger than the original deviation, suggesting possible stronger price action. In fact, it was a very good price action. Perhaps it was a Buy 2 instead of Buy 1 (meaning you would have a bigger trade size).
(c) Fast Economic News

Date and Time Report Actual Forecast Deviation Actual API as New Forecast for DOE
Deviation From Actual API and Actual DOE
Oct 18, 2016 16:30 US API Crude Oil Inventories -3800 2100 -5900
Oct 19, 2016 10:30 US DOE Crude Oil Inventories -5247 2100 -7347 -3800 -1447
While this price action looks nice, the my new deviation of -1447 is considerably smaller than -7347, and in my opinion this price action correctly reflects that. I would expect much stronger price action if the deviation was in fact more than -7000.
(c) Fast Economic News

Date and Time Report Actual Forecast Deviation Actual API as New Forecast for DOE
Deviation From Actual API and Actual DOE
Oct 12, 2016 16:30 US API Crude Oil Inventories 2700 2000 700
Oct 13, 2016 11:00 US DOE Crude Oil Inventories 4850 2000 2850 2700 2150
Either way it was a sell, with both deviations being quite close to each other.
(c) Fast Economic News

Date and Time Report Actual Forecast Deviation Actual API as New Forecast for DOE
Deviation From Actual API and Actual DOE
Oct 4, 2016 16:30 US API Crude Oil Inventories -7600 1500 -9100
Oct 5, 2016 10:30 US DOE Crude Oil Inventories -2976 1500 -4476 -7600 4624
This is a winning trade. The original deviation suggested a strong buy but my revised deviation suggested a strong sell. While they conflict with each other (and therefore we see a quite choppy price action), being on a sell side meant making money while on a buy side losing money (unless you waited long enough for the retracement - which is very risky thing to do, especially with a leveraged trade size). Improvement ideas: in case of conflicts like this, exit rather quickly.
(c) Fast Economic News
Date and Time Report Actual Forecast Deviation Actual API as New Forecast for DOE
Deviation From Actual API and Actual DOE
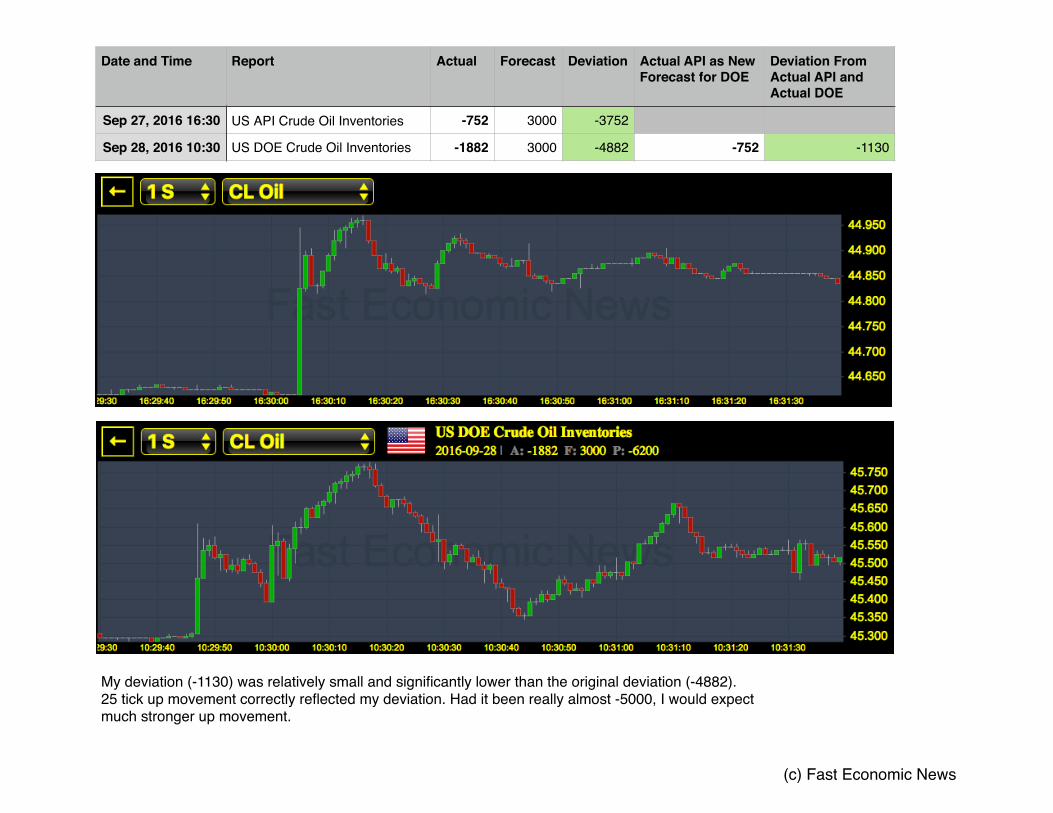
Sep 27, 2016 16:30 US API Crude Oil Inventories -752 3000 -3752
Sep 28, 2016 10:30 US DOE Crude Oil Inventories -1882 3000 -4882 -752 -1130
My deviation (-1130) was relatively small and significantly lower than the original deviation (-4882). 25 tick up movement correctly reflected my deviation. Had it been really almost -5000, I would expect much stronger up movement.
(c) Fast Economic News

Date and Time Report Actual Forecast Deviation Actual API as New Forecast for DOE
Deviation From Actual API and Actual DOE
Sep 13, 2016 16:30 US API Crude Oil Inventories 1440 4000 -2560
Sep 14, 2016 10:30 US DOE Crude Oil Inventories -559 4000 -4559 1440 -1999
For some reasons this trade just didn’t work but it’s nice to see that the my deviation was less than half of the original deviation. If that was a loss, at least probably on a smaller trade (perhaps Buy 1 instead of Buy 2) so this methodology was still helpful. Again, there could very well have been something else going on on the market that affected crude oil.
(c) Fast Economic News

Date and Time Report Actual Forecast Deviation Actual API as New Forecast for DOE
Deviation From Actual API and Actual DOE
Sep 7, 2016 16:30 US API Crude Oil Inventories -12080 905 -12985
Sep 8, 2016 10:30 US DOE Crude Oil Inventories -14513 905 -15418 -12080 -2433
While my new deviation was significantly smaller, it was still a buy. The price action was enormous, probably due to huge original deviation. With such unusual huge vales it’s hard to predict exact price action.
(c) Fast Economic News

Date and Time Report Actual Forecast Deviation Actual API as New Forecast for DOE
Deviation From Actual API and Actual DOE
Aug 30, 2016 16:30 US API Crude Oil Inventories 942 1300 -358
Aug 31, 2016 10:30 US DOE Crude Oil Inventories 2276 1300 976 942 1334
If the threshold was 1000, my new deviation triggered a sell instead of having a no trade. It was a nice sell action but in my opinion too nice for this kind of deviation.
(c) Fast Economic News

Date and Time Report Actual Forecast Deviation Actual API as New Forecast for DOE
Deviation From Actual API and Actual DOE
Aug 23, 2016 16:30 US API Crude Oil Inventories 4464 -850 5314
Aug 24, 2016 10:30 US DOE Crude Oil Inventories 2502 -850 3352 4464 -1962
This is the only time this new methodology failed in 2016. My new deviation suggested a buy action while the old deviation suggested a strong sell action. Nevertheless, while the price action did go down, it was not a typical spike you would normally see. This price action was very weird but you had several seconds to exit within 10 ticks so it wasn’t that bad. Plus, you can’t be right 100% times. Again, there could have been other things affecting crude oil prices in that particular day.
(c) Fast Economic News

Date and Time Report Actual Forecast Deviation Actual API as New Forecast for DOE
Deviation From Actual API and Actual DOE
Aug 16, 2016 16:30 US API Crude Oil Inventories -1000 950 -1950
Aug 17, 2016 10:30 US DOE Crude Oil Inventories -2509 950 -3459 -1000 -1509
Either way it was a buy.
(c) Fast Economic News

Date and Time Report Actual Forecast Deviation Actual API as New Forecast for DOE
Deviation From Actual API and Actual DOE
Aug 9, 2016 16:30 US API Crude Oil Inventories 2090 -1500 3590
Aug 10, 2016 10:30 US DOE Crude Oil Inventories 1055 -1500 2555 2090 -1035
That was very weird because either way it was a not a good trade. For a 2555 you would expect a nice sell price action (that didn’t happen for sure), and for a -1035 probably some up movement although if the threshold was -1000, it would be a bare minimum buy tigger or for a slightly higher threshold even a no trade. I can’t say it worked well, but I can’t also say it didn’t work. If anything, after all within a few seconds the price went higher (notice one bar = 1 second). Probably a break even trade or with a profit if you waited a few seconds.
(c) Fast Economic News

Date and Time Report Actual Forecast Deviation Actual API as New Forecast for DOE
Deviation From Actual API and Actual DOE
Aug 2, 2016 16:30 US API Crude Oil Inventories -1300 -1750 450
Aug 3, 2016 10:30 US DOE Crude Oil Inventories 1413 -1750 3163 -1300 2713
Either way a sell, similar deviations.
(c) Fast Economic News

Date and Time Report Actual Forecast Deviation Actual API as New Forecast for DOE
Deviation From Actual API and Actual DOE
Jul 26, 2016 16:30 US API Crude Oil Inventories -8270 -2000 -6270
Jul 27, 2016 10:30 US DOE Crude Oil Inventories 1671 -2000 3671 -8270 9941
Much higher deviation, a nice price action but either way it would be a nice sell although perhaps Sell 2, with my deviation, instead of Sell 1.
(c) Fast Economic News

Date and Time Report Actual Forecast Deviation Actual API as New Forecast for DOE
Deviation From Actual API and Actual DOE
Jul 19, 2016 16:30 US API Crude Oil Inventories -2300 -2000 -300
Jul 20, 2016 10:30 US DOE Crude Oil Inventories -2342 -2000 -342 -2300 -42
Either way a no trade.
(c) Fast Economic News

Date and Time Report Actual Forecast Deviation Actual API as New Forecast for DOE
Deviation From Actual API and Actual DOE
Jul 12, 2016 16:30 US API Crude Oil Inventories 2207 -3000 5207
Jul 13, 2016 10:30 US DOE Crude Oil Inventories -2546 -3000 454 2207 -4753
A weird price action but since the price action went up within 1 second, it was probably OK as long as you decided to exit relatively quickly.
(c) Fast Economic News

Date and Time Report Actual Forecast Deviation Actual API as New Forecast for DOE
Deviation From Actual API and Actual DOE
Jul 6, 2016 16:30 US API Crude Oil Inventories -6736 -2500 -4236
Jul 7, 2016 10:30 US DOE Crude Oil Inventories -2223 -2500 277 -6736 4513
A very good sell signal instead of a no trade.
(c) Fast Economic News

Date and Time Report Actual Forecast Deviation Actual API as New Forecast for DOE
Deviation From Actual API and Actual DOE
Jun 28, 2016 16:30 US API Crude Oil Inventories -3860 -2500 -1360
Jun 29, 2016 10:30 US DOE Crude Oil Inventories -4053 -2500 -1553 -3860 -193
No trade instead of buying - which was good given how weird the price action was. Most likely it saved you some headache. After all, when trading leveraged trade sizes, you need to have confidence and avoid any weak price actions.
(c) Fast Economic News

Date and Time Report Actual Forecast Deviation Actual API as New Forecast for DOE
Deviation From Actual API and Actual DOE
Jun 21, 2016 16:30 US API Crude Oil Inventories -5224 -1500 -3724
Jun 22, 2016 10:30 US DOE Crude Oil Inventories -917 -1500 583 -5224 4307
Another nice sell signal instead of a no trade.
(c) Fast Economic News

Date and Time Report Actual Forecast Deviation Actual API as New Forecast for DOE
Deviation From Actual API and Actual DOE
Jun 14, 2016 16:30 US API Crude Oil Inventories 1158 -2325 3483
Jun 15, 2016 10:30 US DOE Crude Oil Inventories -933 -2325 1392 1158 -2091
A nice buy signal instead of a terrible sell trade. This really made a difference between a very bad trade and a very good trade. Excellent.
(c) Fast Economic News

Date and Time Report Actual Forecast Deviation Actual API as New Forecast for DOE
Deviation From Actual API and Actual DOE
Jun 7, 2016 16:30 US API Crude Oil Inventories -3569 -3000 -569
Jun 8, 2016 10:30 US DOE Crude Oil Inventories -3226 -3000 -226 -3569 343
Either way it was a no trade but it’s nice to see some selling pressure instead of a buying pressure.
(c) Fast Economic News

Date and Time Report Actual Forecast Deviation Actual API as New Forecast for DOE
Deviation From Actual API and Actual DOE
Jun 1, 2016 16:30 US API Crude Oil Inventories 2351 -2500 4851
Jun 2, 2016 11:00 US DOE Crude Oil Inventories -1366 -2500 1134 2351 -3717
Another winner here. Rather than having a big losing trade, we ended up with a nice winning trade. I’m pleased with the results here.
(c) Fast Economic News

Date and Time Report Actual Forecast Deviation Actual API as New Forecast for DOE
Deviation From Actual API and Actual DOE
May 17, 2016 16:30 US API Crude Oil Inventories -1141 -3500 2359
May 18, 2016 10:30 US DOE Crude Oil Inventories 1310 -3500 4810 -1141 2451
Either way a sell action although the new deviation suggested less selling pressure.
(c) Fast Economic News

Date and Time Report Actual Forecast Deviation Actual API as New Forecast for DOE
Deviation From Actual API and Actual DOE
May 10, 2016 16:30 US API Crude Oil Inventories 3448 750 2698
May 11, 2016 10:30 US DOE Crude Oil Inventories -3410 750 -4160 3448 -6858
Either way a buy action but the new deviation suggested bigger buying pressure, and could also trigger Buy 2 instead of Buy 1 - depending on the settings.
(c) Fast Economic News

Date and Time Report Actual Forecast Deviation Actual API as New Forecast for DOE
Deviation From Actual API and Actual DOE
May 3, 2016 16:30 US API Crude Oil Inventories 1265 750 515
May 4, 2016 10:30 US DOE Crude Oil Inventories 2784 750 2034 1265 1519
Either way a sell action.
(c) Fast Economic News

Date US API Crude Oil Actual
US DOE Crude Oil Actual
DOE Crude Oil Forecast
DOE Crude Oil Deviation
Deviation From Actual API and Actual DOE
Comments / action plan Did this new method work?
Did this new method saved us from losing trade?
April 26/27 2016 -1,076 1,999 1,750 249 3,075 Nice spike down, selling instead of a no trade
YES N/A
April 19/20 2016 3,102 2,080 3,000 -920 -1,022 Nice spike up, buying instead of a no trade.
YES N/A
April 12/13 2016 6,223 6,634 1,000 5,634 411 Spike up and down, probably no trade
YES - by staying away
YES
April 05/06 2016 -4,319 -4,937 2,850 -7,787 -618 Medium up spike, muted, could be a no trade
Better safe than sorry, yes
This method hinted muted price action
March 29/30 2016 2,642 2,299 3,100 -801 -343 Spike down and up, even smaller deviation, probably no trade
YES Possibly due to staying away (no trade) instead of going aggressive with sell
March 22/23 2016 8,796 9,357 2,525 6,832 561 Spike down, muted, probably no trade
Better safe than sorry
correctly hinted possible muted price action
March 15/16 2016 1,497 1,317 3,200 -1,883 -180 No chart available N/A N/A
March 08/09 2016 4,397 3,880 3,500 380 -517 Spike up and then down, no trade anyway
YES YES but it would probably be a no trade anyway
March 01/02 2016 9,906 10,374 3,400 6,974 468 Nice down movement, could be a no trade
Better safe than sorry
N/A
Feb 23/24 2016 7,102 3,502 3,250 252 -3,600 Nice up spike, retracement, buying instead of no trade
YES N/A
Feb 17/18 2016 -3,262 2,147 3,500 -1,353 5,409 Very nice spike down, selling instead of buying
YES! YES!
Feb 09/10 2016 2,357 -754 3,200 -3,954 -3,111 Nice up movement no difference N/A
Feb 02/03 2016 3,837 7,792 4,000 3,792 3,955 Down spike no difference N/A
Jan 26/27 2016 11,374 8,383 4,000 4,383 -2,991 Nice spike up, retracement, buying instead of selling
YES YES
Jan 20/21 2016 4,608 3,979 2,200 1,779 -629 Spike up, fast retracement, no trade instead of sell
YES YES
Jan 12/13 2016 -3,918 234 2,000 -1,766 4,152 Very nice spike down, selling instead of buying
YES! YES! Big time!
Jan 05/06 2016 -5,635 -5,085 500 -5,585 550 Spike down, choppy price action; no trade instead of a buy!
YES! YES! Big time!
Dec 29/30 2015 2,939 2,629 -2,500 5,129 -310 Spike down but based on a new deviation it would be a no trade
Better safe than sorry
n/a because it would be a no trade, correctly predicted muted price action
Dec 22/23 2015 -3,579 -5,877 1,200 -7,077 -2,298 Spike up helped correctly hinted possible muted price action given original huge (-7077) deviation
Please visit our calendar page to view price actions charts for these reports. http://www.fasteconomicnews.com/fx_calendar.aspx
These are additional releases. Please visit our website to see charts for these releases. A few of them are prime examples why this new method is worthy to give a try.
(c) Fast Economic News