Fast and precise targeting of single tumor cells in vivo...
37
Journal of Cell Science • Supplementary information © 2015. Published by The Company of Biologists Ltd. This is an Open Access article distributed under the terms of the Creative Commons Attribution License (http://creativecommons.org/licenses/by/3.0), which permits unrestricted use, distribution and reproduction in any medium provided that the original work is properly attributed. Fast and precise targeting of single tumor cells in vivo by multimodal correlative microscopy Matthia A. Karreman 1 , Luc Mercier 2-5 , Nicole L. Schieber 1 , Gergely Solecki 6 , Guillaume Allio 2-5 , Frank Winkler 6 , Bernhard Ruthensteiner 7 , Jacky G. Goetz 2-5,* and Yannick Schwab 1,* . 1. Cell Biology and Biophysics Unit, European Molecular Biology Laboratory, Heidelberg, 69117, Germany. 2. MN3T, Inserm U1109, Strasbourg, 67200, France. 3. Université de Strasbourg, Strasbourg, 67000, France. 4. LabEx Medalis, Université de Strasbourg, Strasbourg, 67000, France. 5. Fédération de Médecine Translationnelle de Strasbourg (FMTS), Université de Strasbourg, Strasbourg, 67000, France. 6. Department of Neurooncology, University Hospital Heidelberg, Heidelberg, 69120, Germany and Clinical Cooperation Unit Neurooncology, German Cancer Research Center (DKFZ), Heidelberg, 69120, Germany. 7. Zoologische Staatssammlung München, Munich, 81247, Germany. *Contact: Jacky G. Goetz, INSERM U1109, 3 avenue Molière, 6700 Strasbourg, France, tel. +33 38 82 77 727, fax. +33 38 82 63 538, [email protected]. Yannick Schwab, EMBL Heidelberg, Meyerhofstrasse 1, 69117 Heidelberg, Germany, tel. +49 62 21 38 78 256, fax. +49 62 21 38 78 306, [email protected]. JCS Advance Online Article. Posted on 11 December 2015
Transcript of Fast and precise targeting of single tumor cells in vivo...
Jour
nal o
f Cel
l Sci
ence
• S
uppl
emen
tary
info
rmat
ion
© 2015. Published by The Company of Biologists Ltd.
This is an Open Access article distributed under the terms of the Creative Commons Attribution License
(http://creativecommons.org/licenses/by/3.0), which permits unrestricted use, distribution and reproduction
in any medium provided that the original work is properly attributed.
Fast and precise targeting of single tumor cells in vivo by
multimodal correlative microscopy
Matthia A. Karreman1, Luc Mercier2-5, Nicole L. Schieber1, Gergely Solecki6,
Guillaume Allio2-5, Frank Winkler6, Bernhard Ruthensteiner7, Jacky G. Goetz2-5,* and
Yannick Schwab1,*.
1. Cell Biology and Biophysics Unit, European Molecular Biology Laboratory, Heidelberg, 69117,
Germany.
2. MN3T, Inserm U1109, Strasbourg, 67200, France.
3. Université de Strasbourg, Strasbourg, 67000, France.
4. LabEx Medalis, Université de Strasbourg, Strasbourg, 67000, France.
5. Fédération de Médecine Translationnelle de Strasbourg (FMTS), Université de Strasbourg,
Strasbourg, 67000, France.
6. Department of Neurooncology, University Hospital Heidelberg, Heidelberg, 69120, Germany and
Clinical Cooperation Unit Neurooncology, German Cancer Research Center (DKFZ), Heidelberg,
69120, Germany.
7. Zoologische Staatssammlung München, Munich, 81247, Germany.
*Contact:
Jacky G. Goetz, INSERM U1109, 3 avenue Molière, 6700 Strasbourg, France, tel.
+33 38 82 77 727, fax. +33 38 82 63 538, [email protected].
Yannick Schwab, EMBL Heidelberg, Meyerhofstrasse 1, 69117 Heidelberg,
Germany, tel. +49 62 21 38 78 256, fax. +49 62 21 38 78 306, [email protected].
JCS Advance Online Article. Posted on 11 December 2015
Jour
nal o
f Cel
l Sci
ence
• S
uppl
emen
tary
info
rmat
ion
Abstract
Intravital microscopy provides dynamic understanding of multiple cell biological
processes, but its limited resolution has so far precluded structural analysis. Because it
is difficult to capture rare and transient events, only few attempts were made to
observe specific developmental and pathological processes in animal models by
electron microscopy. The multimodal correlative approach that we propose here
combines intravital microscopy, microscopic X-ray computed tomography and three-
dimensional electron microscopy. It enables a rapid (c.a. 2 weeks) and accurate (< 5
µm) correlation of functional imaging to ultrastructural analysis of single cells in a
relevant context. We demonstrate the power of our approach by capturing single
tumor cells in the vasculature of the cerebral cortex and in subcutaneous tumors,
providing unique insights into metastatic events. Providing a significantly improved
throughput, our workflow enables multiple sampling, a prerequisite for making
correlative imaging a relevant tool to study cell biology, in vivo. The versatility of this
workflow allows envisioning broad applications in various fields of biological
research such as cancer or developmental biology.
Jour
nal o
f Cel
l Sci
ence
• S
uppl
emen
tary
info
rmat
ion
Introduction
Metastasis relies on a series of steps, including invasion of the tissue and circulation
through the vasculature to reach a secondary distant site (Valastyan and Weinberg,
2011). Although relevant in vitro models were created to study these processes
(Gligorijevic et al., 2014), they have failed so far to recapitulate the complexity of
living tissues. Intravital microscopy (IVM) of invasive tumor cells has enabled in vivo
studies of the metastatic cascade (Gligorijevic et al., 2014; Kienast et al., 2010). Here,
tumor progression can be imaged in various animal models upon, for example,
orthotopic, subcutaneous or intra-circulation injection of tumor cells (Karreman et al.,
2014; Leong et al., 2014; Sahai, 2007; Stoletov et al., 2010). For that purpose,
implementation of an imaging window allows for long-term deep-tissue monitoring of
invasive behavior of tumor cells in living animals (Alexander et al., 2008; Beerling et
al., 2011; Gligorijevic et al., 2014; Ritsma et al., 2013). We, and others, have
successfully studied key steps of extravasation by performing IVM through a cranial
window (Kienast et al., 2010). Extravasation is a crucial, yet rare and inefficient step
in metastasis, which makes it difficult to study in vivo. There is, for example, no
direct evidence as to how tumor cells arrest, adhere to the endothelium wall and cross
the blood-brain barrier in vivo (Reymond et al., 2013). In addition, tumor cells use
distinct mechanisms for invading the neighboring tissue (Friedl and Alexander, 2011).
Understanding how cytoskeletal behavior, cell adhesion and proteolytic activity are
integrated in vivo requires studying these events at the scale of a single cell, within its
pathological context. IVM can capture dynamic metastatic events, but its resolution is
insufficient to reveal subcellular events, or the interactions of tumor cells with the
surrounding tissue.
Correlating functional IVM to three-dimensional electron microscopy (3DEM) carries
great potential in revealing the in vivo features of patho-physiological processes at
nanometer resolution. The power of combining these imaging techniques is well
established (Bishop et al., 2011; Briggman and Bock, 2012; Durdu et al., 2014; Goetz
et al., 2014; Kolotuev et al., 2010; Maco et al., 2013). Because of a low throughput
however (Karreman et al., 2014), intravital correlative microscopy has failed to
provide the quantitative sampling needed for translational research.
The main bottleneck for intravital correlative microscopy is retrieving single objects
in the EM-processed sample. Unfortunately, processing tissue for 3DEM generally
Jour
nal o
f Cel
l Sci
ence
• S
uppl
emen
tary
info
rmat
ion
results in a loss of fluorescent signal, prohibiting the use of fluorescence microscopy
to determine the position of the ROI in the volume of the EM sample. Moreover, the
major sample distortions that result from fixation and resin embedding complicate the
registration of the IVM into the EM datasets (Karreman et al., 2014). As a result, the
targeted volume needs to be retrieved by correlating native or artificial landmarks
encountered while serial-sectioning the sample, which, in our experience (Karreman
et al., 2014), can easily take more than 3 months. Moreover, such an approach is
limited to relatively thin tissue samples, such as brain slices (Bishop et al., 2011;
Maco et al., 2013) or skin (Karreman et al., 2014). Collecting quantitative EM data on
multiple metastatic events in vivo therefore requires new strategies, endowed with an
enhanced throughput. Here, we describe a novel method that exploits microscopic X-
ray computed tomography (microCT) to precisely correlate the IVM volume with the
EM-processed resin-embedded sample, enabling to move from in vivo imaging to
3DEM within two weeks (Fig. 1). We developed and applied this approach to study
single tumor cells xenografted in a living mouse, showing its potential for revealing
key aspects of the plasticity and complexity of tumor cell invasion and metastasis.
The versatility of this workflow is expected to enable a large range of applications in
biology.
Jour
nal o
f Cel
l Sci
ence
• S
uppl
emen
tary
info
rmat
ion
Results
Intravital microscopy of metastasizing cells in the mouse brain cortex
vasculature
Correlative imaging of the initial steps of tumor cell extravasation was performed on
our established mouse model, in which we could reliably identify fluorescently
labeled metastasizing tumor cells and track them over time. Upon intra-cardiac
injection of GFP-labeled HER2-positive breast cancer cells (Jimt1), IVM of the brain
cortex was performed through a cranial window (Fig. 1, Fig. 2A). We labeled the
blood vessel network with fluorescent dextran to create a stable 3D reference map of
the area around the tumor cell. Tumor cells were arrested through physical occlusion
in vessel bifurcations prior to extravasation (Kienast et al., 2010), and could be
tracked over days by IVM (Fig. 2B, supplementary material Movie 1). IVM imaging
of the volume allows recording the position of the tumor cell relative to the local
vasculature at the ROI. At a later stage in the workflow, the complex vessel network
is exploited as a 3D roadmap to retrieve the tumor cell with 3DEM.
After fixation by intra-cardiac perfusion, the position of the ROI was immediately
marked at the cortex surface using near-infrared branding (NIRB) (Bishop et al.,
2011; Karreman et al., 2014; Maco et al., 2013) (Fig. 2C, supplementary material
Movie 1) enabling precise dissection of a small biopsy (<1 mm3) containing the ROI.
The sample was then processed for EM and embedded in resin. This shows that we
can reliably track metastatic events in the brain vasculature and, based on NIRB
marking, biopsy the imaged region after fixation.
Retrieval of the tumor cell following EM processing
The high x-ray attenuation of the heavy metals used during EM processing (i.e.
osmium tetroxide and uranyl acetate) enables to image the resin-embedded sample
with microCT (Bushong et al., 2014; Handschuh et al., 2013; Keene et al., 2014;
Metscher, 2009; Sengle et al., 2013). MicroCT volumes of the samples were rendered
in 3D to display the resin block surface, the embedded tissue and its vascular network
(Fig. 2D, supplementary material Fig. S1). The models of the vascular network
obtained from the IVM and the microCT datasets were then processed for non-linear
3D registration (Fig. 2E, supplementary material Movie 2). Corresponding structural
features, visible in both datasets, are used to seed pairs of landmarks (Fig. 2E, yellow
Jour
nal o
f Cel
l Sci
ence
• S
uppl
emen
tary
info
rmat
ion
and blue spheres) and are overlaid in 3D (see Experimental Procedures for further
details). Coarse 3D registration between the IVM (red) and the microCT (gray)
volumes (Fig. 2E) was followed by fine registration using higher magnification IVM
acquisitions (supplementary material Fig. S2). Docking of the IVM model into the
microCT dataset then enabled to predict the position of the tumor cell, visible in the
green IVM channel, within the resin block (Fig. 2F, supplementary material Movie
2).
Knowing the distance between the block-surface and the predicted position of the
tumor cell allowed accurate block-trimming to rapidly approach the ROI (Fig. 2F,
bottom panel). This efficiently enabled to expose the targeted cell to Focused Ion
Beam-Scanning Electron Microscopy (FIB-SEM). Because FIB-SEM can only
effectively mill depth of up to 60-90 µm into the resin sample, we trimmed the flank
of the block (perpendicular to the FIB beam) to ~20 µm from the targeted tumor cell.
Similarly, the distance between the block face and the ROI (Fig. 2D,F) should be
trimmed to less then 5 µm (Bushong et al., 2014) to prevent unnecessary long milling
times before reaching the cell of interest (supplementary material Movie 3). To target
the ROI with such precision, we collected a few thick sections as intermediate ‘check-
points’ while manually trimming to the targeted depth (supplementary material Fig.
S3). These sections were inspected by light microscopy and compared to virtual
sections extracted from the microCT dataset, thereby assessing the exact progression
of the trimming. For trimming depth in the range of 500 µm, 3-5 check points were
sufficient to correct for potential trimming inaccuracy (estimated between 5 and 10%,
compared to the nominal settings of the ultramicrotome) and allowed a targeting
precision of <5 µm. Thus, using microCT-based registration, we can accurately target
a cell of interest within a millimeter-thick resin-embedded tissue.
3DEM of metastasizing cells arrested in the brain vasculature
We used FIB-SEM to collect 6350 serial images (8 nm pixel size in x, y and 8 nm
milling depth in z) of the tumor cell within the blood capillary (Fig. 3A,B,
supplementary material Movie 4). In addition, we acquired key frames (Fig. 3A)
every 1 µm (50x50 µm2, pixel size 24.4 nm, acquired every 1 µm) to obtain low-
magnification overviews of the ROI showing surrounding cell nuclei and blood
vessels (Narayan et al., 2014). To illustrate the efficiency of the multimodal
correlation, the predicted position of the tumor cell within the resin block (as
Jour
nal o
f Cel
l Sci
ence
• S
uppl
emen
tary
info
rmat
ion
determined by registering the IVM volume into the microCT volume, Fig. 3C, top
panel) was compared to the manual segmentation of the keyframe-volume (Fig. 3C,
bottom panel).
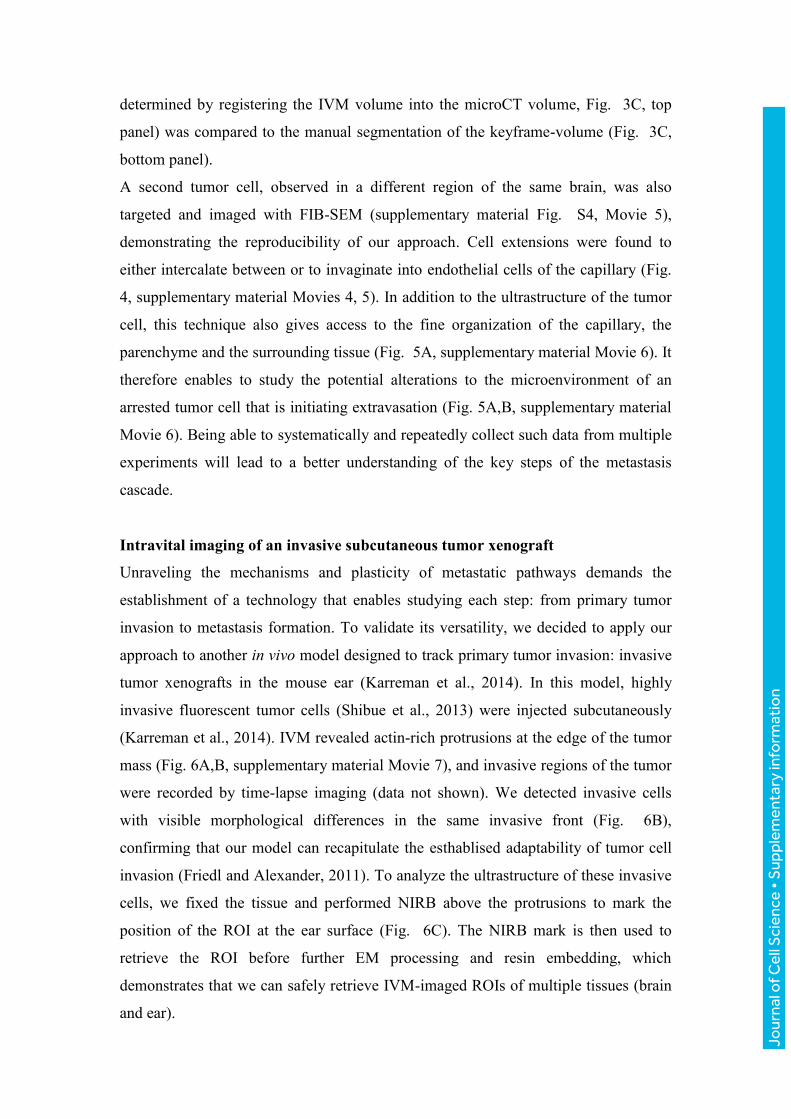
A second tumor cell, observed in a different region of the same brain, was also
targeted and imaged with FIB-SEM (supplementary material Fig. S4, Movie 5),
demonstrating the reproducibility of our approach. Cell extensions were found to
either intercalate between or to invaginate into endothelial cells of the capillary (Fig.
4, supplementary material Movies 4, 5). In addition to the ultrastructure of the tumor
cell, this technique also gives access to the fine organization of the capillary, the
parenchyme and the surrounding tissue (Fig. 5A, supplementary material Movie 6). It
therefore enables to study the potential alterations to the microenvironment of an
arrested tumor cell that is initiating extravasation (Fig. 5A,B, supplementary material
Movie 6). Being able to systematically and repeatedly collect such data from multiple
experiments will lead to a better understanding of the key steps of the metastasis
cascade.
Intravital imaging of an invasive subcutaneous tumor xenograft
Unraveling the mechanisms and plasticity of metastatic pathways demands the
establishment of a technology that enables studying each step: from primary tumor
invasion to metastasis formation. To validate its versatility, we decided to apply our
approach to another in vivo model designed to track primary tumor invasion: invasive
tumor xenografts in the mouse ear (Karreman et al., 2014). In this model, highly
invasive fluorescent tumor cells (Shibue et al., 2013) were injected subcutaneously
(Karreman et al., 2014). IVM revealed actin-rich protrusions at the edge of the tumor
mass (Fig. 6A,B, supplementary material Movie 7), and invasive regions of the tumor
were recorded by time-lapse imaging (data not shown). We detected invasive cells
with visible morphological differences in the same invasive front (Fig. 6B),
confirming that our model can recapitulate the esthablised adaptability of tumor cell
invasion (Friedl and Alexander, 2011). To analyze the ultrastructure of these invasive
cells, we fixed the tissue and performed NIRB above the protrusions to mark the
position of the ROI at the ear surface (Fig. 6C). The NIRB mark is then used to
retrieve the ROI before further EM processing and resin embedding, which
demonstrates that we can safely retrieve IVM-imaged ROIs of multiple tissues (brain
and ear).
Jour
nal o
f Cel
l Sci
ence
• S
uppl
emen
tary
info
rmat
ion
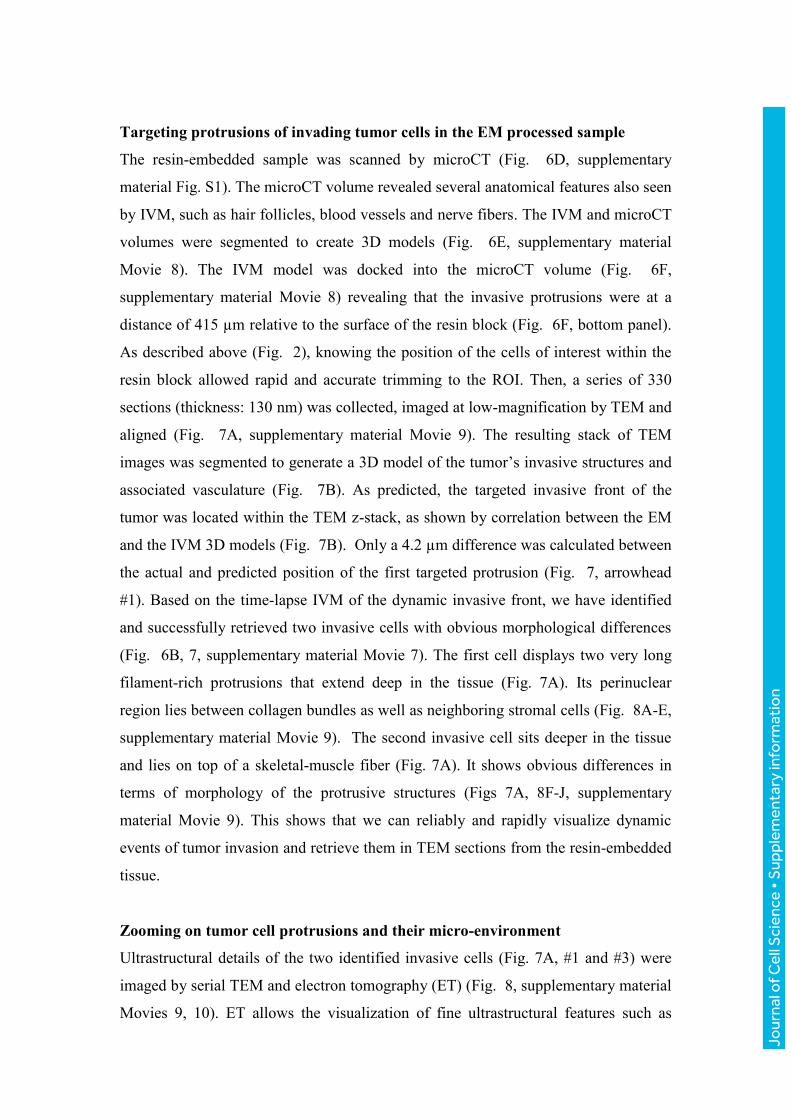
Targeting protrusions of invading tumor cells in the EM processed sample
The resin-embedded sample was scanned by microCT (Fig. 6D, supplementary
material Fig. S1). The microCT volume revealed several anatomical features also seen
by IVM, such as hair follicles, blood vessels and nerve fibers. The IVM and microCT
volumes were segmented to create 3D models (Fig. 6E, supplementary material
Movie 8). The IVM model was docked into the microCT volume (Fig. 6F,
supplementary material Movie 8) revealing that the invasive protrusions were at a
distance of 415 µm relative to the surface of the resin block (Fig. 6F, bottom panel).
As described above (Fig. 2), knowing the position of the cells of interest within the
resin block allowed rapid and accurate trimming to the ROI. Then, a series of 330
sections (thickness: 130 nm) was collected, imaged at low-magnification by TEM and
aligned (Fig. 7A, supplementary material Movie 9). The resulting stack of TEM
images was segmented to generate a 3D model of the tumor’s invasive structures and
associated vasculature (Fig. 7B). As predicted, the targeted invasive front of the
tumor was located within the TEM z-stack, as shown by correlation between the EM
and the IVM 3D models (Fig. 7B). Only a 4.2 µm difference was calculated between
the actual and predicted position of the first targeted protrusion (Fig. 7, arrowhead
#1). Based on the time-lapse IVM of the dynamic invasive front, we have identified
and successfully retrieved two invasive cells with obvious morphological differences
(Fig. 6B, 7, supplementary material Movie 7). The first cell displays two very long
filament-rich protrusions that extend deep in the tissue (Fig. 7A). Its perinuclear
region lies between collagen bundles as well as neighboring stromal cells (Fig. 8A-E,
supplementary material Movie 9). The second invasive cell sits deeper in the tissue
and lies on top of a skeletal-muscle fiber (Fig. 7A). It shows obvious differences in
terms of morphology of the protrusive structures (Figs 7A, 8F-J, supplementary
material Movie 9). This shows that we can reliably and rapidly visualize dynamic
events of tumor invasion and retrieve them in TEM sections from the resin-embedded
tissue.
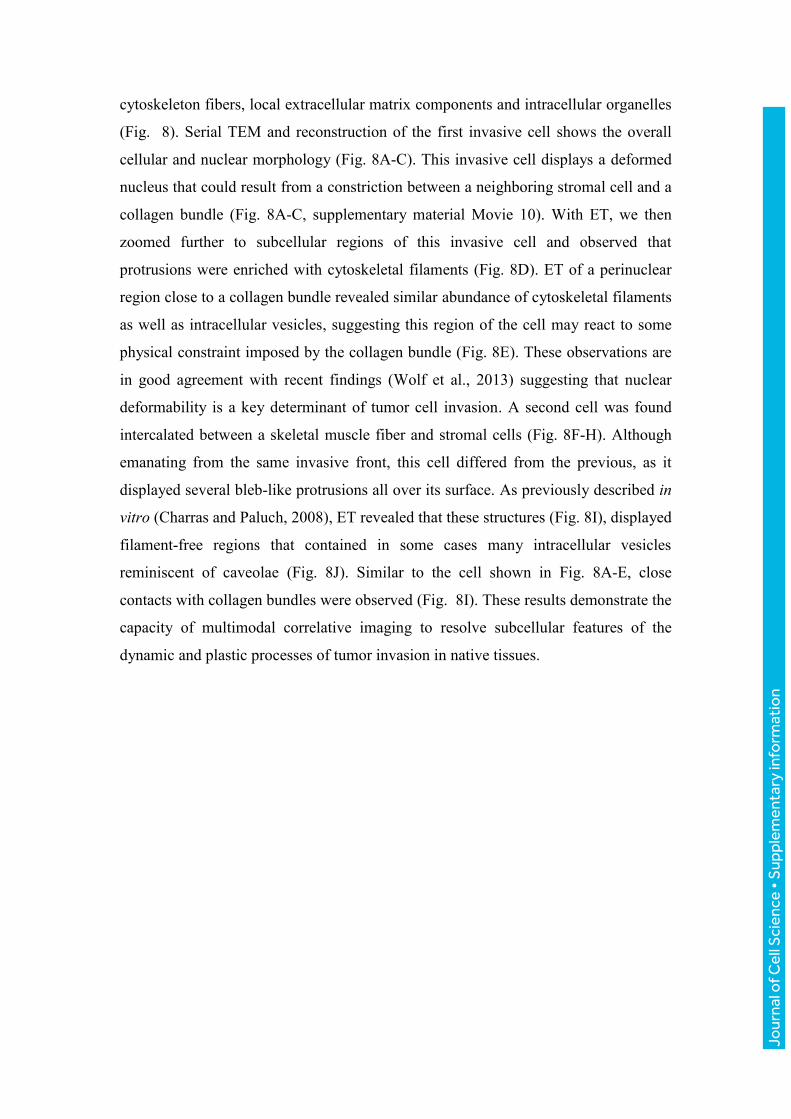
Zooming on tumor cell protrusions and their micro-environment
Ultrastructural details of the two identified invasive cells (Fig. 7A, #1 and #3) were
imaged by serial TEM and electron tomography (ET) (Fig. 8, supplementary material
Movies 9, 10). ET allows the visualization of fine ultrastructural features such as
Jour
nal o
f Cel
l Sci
ence
• S
uppl
emen
tary
info
rmat
ion
cytoskeleton fibers, local extracellular matrix components and intracellular organelles
(Fig. 8). Serial TEM and reconstruction of the first invasive cell shows the overall
cellular and nuclear morphology (Fig. 8A-C). This invasive cell displays a deformed
nucleus that could result from a constriction between a neighboring stromal cell and a
collagen bundle (Fig. 8A-C, supplementary material Movie 10). With ET, we then
zoomed further to subcellular regions of this invasive cell and observed that
protrusions were enriched with cytoskeletal filaments (Fig. 8D). ET of a perinuclear
region close to a collagen bundle revealed similar abundance of cytoskeletal filaments
as well as intracellular vesicles, suggesting this region of the cell may react to some
physical constraint imposed by the collagen bundle (Fig. 8E). These observations are
in good agreement with recent findings (Wolf et al., 2013) suggesting that nuclear
deformability is a key determinant of tumor cell invasion. A second cell was found
intercalated between a skeletal muscle fiber and stromal cells (Fig. 8F-H). Although
emanating from the same invasive front, this cell differed from the previous, as it
displayed several bleb-like protrusions all over its surface. As previously described in
vitro (Charras and Paluch, 2008), ET revealed that these structures (Fig. 8I), displayed
filament-free regions that contained in some cases many intracellular vesicles
reminiscent of caveolae (Fig. 8J). Similar to the cell shown in Fig. 8A-E, close
contacts with collagen bundles were observed (Fig. 8I). These results demonstrate the
capacity of multimodal correlative imaging to resolve subcellular features of the
dynamic and plastic processes of tumor invasion in native tissues.
Jour
nal o
f Cel
l Sci
ence
• S
uppl
emen
tary
info
rmat
ion
Discussion
Here, we report an efficient, rapid and robust approach for 3DEM imaging of tumor
cells in critical stages of the metastasis cascade, as determined by IVM. Our
multimodal correlative microscopy integrates microCT to accurately predict the
position of in vivo imaged single cells inside large resin blocks. This enabled the
routine retrieval of single tumor cells (Figs 3, 7, supplementary material Fig. S4) and
their sub-cellular structures (Figs 4, 5, 8) for 3DEM analysis in tissue samples. In this
study, we show the results from two different regions in one mouse brain, and from
one region in a mouse ear skin sample.
Our approach combines well-established imaging modalities and sample preparation
techniques. As a consequence, it suffers from the limitations brought by each one of
them. Intravital imaging, for example, relies on imaging of fluorescently labeled
structures, and thus requires the introduction of dyes or genetically encoded
fluorescent proteins. Xenografts of genetically engineered fluorescent cells can be
extremely efficient tools to accurately mimick patho-physiological situations, but
these models may be a source of artifacts. Furthermore, preparing the samples for
visualization by EM requires dedicated protocols. High-pressure freezing is the
method of choice to preserve the sample’s ultrastructure, but is currently restricted to
small samples (thickness 200 µm). Large samples, like organisms, requires chemical
fixation, but it is known to introduce important modifications of the sample (Korogod
et al., 2015).
Intravital multimodal correlative microscopy provides unique insights in
metastatic processes
Linking functional IVM of tumor cells, and their microenvironment, to high-
resolution imaging by EM will contribute to understanding the various cellular
processes that lead to the spreading of cancer. Using this workflow, we observed
important sub-cellular features of arrested tumor cells. For example, in tumor cells
that appeared trapped in a blood vessel, we observed cellular extensions towards the
vascular wall (Fig. 4). These observations suggest that tumor cells could use active
cellular protrusions for crossing the physical barrier imposed by the endothelium and
basal lamina. The protrusions could not be resolved by intravital imaging in the
mouse brain (supplementary material Movie 1), due to the limited resolution of IVM.
The formation of cellular extensions, and the observed drastic remodeling of the
Jour
nal o
f Cel
l Sci
ence
• S
uppl
emen
tary
info
rmat
ion
endothelial layer close to the tumor cell (Fig. 5), are potentially the earliest steps in
extravasation. Recently, invadopodia have been identified as key players in tumor cell
extravasation in the Chick Chorioallantoic Membrane model (Leong et al., 2014).
ET of invading tumor cells revealed protrusions that were massively populated with
bundles of filaments, and we showed their tight interactions with the local
extracellular matrix (Fig. 8). Furthermore, in the migrating tumor cells we observed a
clear diversion of the normal spindle-shape morphology of the nuclei (Fig. 8 A-C, D
and F). Other studies (Wolf and Friedl, 2011) elegantly showed that cell migration
through interstitial tissues is mostly controlled by the architecture of the extracellular
matrix, in particular its pore size. Nuclear deformability of cells can compensate for
the small pore size and thus regulate invasion abilities of cells (Friedl et al., 2011).
These observations confirm that this workflow has great potential in unraveling
metastatic events at the nanoscale.
Practical Considerations of the Intravital Multimodal Correlative Microscopy
Although the presented workflow significantly speeds up the correlation between
IVM and EM, obtaining a significantly relevant number of observations still demands
several months of work. To reveal the structural changes to a cell during extravasation
for example, may require 20 to 30 independent experiments. We estimate that such a
study would take at least 7 months of full-time work for a single person, taking into
account that some steps in the workflow can be performed in parallel. We believe,
however, that for many in vivo studies the unique gain in resolution will be worth the
time-investment. Importantly, every single tumor cell (n=5, 4 are shown here) that
was targeted so far was successfully retrieved and imaged with EM, illustrating the
high success-rate of the approach.
The multimodal correlative workflow requires access to a set of high-end equipments
(intravital microscopy, microCT scanner, TEM tomography and/or FIB-SEM). After
the intravital imaging, however, the sample is fixed and can be sent to collaborating
laboratories where specific imaging could be performed. Therefore, if a laboratory
does not possess the whole set of equipment, like in our case, this workflow is still
achievable by establishing collaborations with other research groups or industry.
Jour
nal o
f Cel
l Sci
ence
• S
uppl
emen
tary
info
rmat
ion
Intravital multimodal correlative microscopy: other approaches and applications
Studying complex 3D samples with EM requires knowing the position of the ROI in
x, y and z. In order to identify the ROI within resin blocks, others have preserved the
signal of fluorescent markers during EM processing (Lucas et al., 2012; Nixon et al.,
2009). However, weak fluorescence signal will be quenched when conventional EM
processing methods are used. Moreover, the limited imaging depth and z-resolution of
fluorescence microscopy hinders accurate visualization of the ROI inside the resin
block. The approach presented here does not require a compromise in the EM
processing protocols; by registration of the IVM volume into the microCT scan of the
processed sample we could predict the position of our target with a < 5 µm accuracy.
MicroCT imaging of resin embedded samples was used in previous studies to identify
a ROI inside the resin block, in order to specifically target this area with EM (Burnett
et al., 2014; Sengle et al., 2013). In these studies, however, the targeted ROIs were
either clearly visible in the microCT scans or revealed by electron-dense markers
(Bushong et al., 2014). The first approach is therefore restricted to rather large and
contrasted features while the second approach relies on the photo-oxydation or
enzymatic reaction. This leads to dense precipitates (e.g. DAB) that mask the
ultrastructure of the targeted cells. Our approach, however, predicts the position of the
target without requiring its direct visualization by microCT. Here, for the first time,
microCT is employed to bridge IVM to EM, and 3D registration is performed to
retrieve and in vivo observed event in a resin-embedded sample.
Other correlative methods successfully targeted individual synapses within the mouse
brain by introducing artificial landmarks with laser branding (Bishop et al., 2011;
Maco et al., 2013). In this powerful approach, the retrieval of the ROI in x, y and z
solely relies on the positioning of the NIRB mark in the tissue, i.e. the branding was
performed either right above or in the same plane as the ROI. NIRB efficiency,
however, is highly sensitive to scattering of light in deeper regions of the tissue.
Therefore, the NIRB can only be done on 60-100 µm vibratome tissue sections that
contain the ROI. Our method skips obtaining and screening such sections, and can
address bulkier tissue pieces. We believe therefore that our approach can provide a
complementary yet more versatile way to correlate intravital imaging with
ultrastructure.
Jour
nal o
f Cel
l Sci
ence
• S
uppl
emen
tary
info
rmat
ion
In conclusion, we have established a versatile and precise multimodal imaging
approach allowing efficient correlating in vivo imaging with volume EM. Applied
here to cancer biology, this workflow already provided informative and unexpected
observations on metastatic behaviors of single tumor cells within realistic
pathological situations. We demonstrated our multimodal correlative imaging
approach on mouse brain and skin tissue, but the workflow can be applied to many
other cell-biological events that can be imaged in vivo. The enhanced throughput of
the method will allow a routine use in translational research on animal models and
holds great potential for understanding multiple biological processes at the
ultrastructural level.
Jour
nal o
f Cel
l Sci
ence
• S
uppl
emen
tary
info
rmat
ion
Materials and Methods
Mouse Handling:
Mounting the cranial window, intracardiac injection of tumor cells and anesthesia
To perform intravital imaging of the cerebral cortex, a cranial window was grafted on
an 8-10 week old, immuno-deficient female M. musculus (Nu/Nu Nude Mouse,
Charles River Laboratories International Inc., Sulzfeld, Germany) as previously
described. After a three-week healing period, the mouse received a 100 µL solution of
cytoplasmic GFP-expressing Jimt1 cells (1x10⁷ cells/mL in PBS) via intracardiac
injection through the left ventricle. Intravital imaging was performed immediately
following injection, and on the second and third day post-injection. For imaging the
mouse was anesthetized by isoflurane. To visualize the blood vessels, 100 µL of
TRITC-dextran (500 kDa, Sigma-Aldrich Chemie GmbH, Munich, Germany) was
administrated to the mouse via injection in the tail vein. The mouse was placed on a
custom-made holder (Deutsches Krebsforschungszentrum, Heidelberg, Germany) and
remained anesthetized via an isoflurane gas anesthesia system. All animal
experiments were conducted in agreement with the regulations for animal
experimentation dictated by the state Baden-Württemberg (Germany), and were
approved by the state authorities.
Subcutaneous injection of tumor cells:
An immuno-deficient adult 8-10 week old mouse (Rj :NMRI-Foxn1nu/Fox1nu,
Janvier labs, Saint-Berthevin, France) was injected with D2A1 Lifeact-YPet cell line
as previously described (Karreman et al., 2014).
Intravital Two-Photon Excitation Microscopy (IVM) and Near-Infrared
Branding (NIRB)
IVM and NIRB through the cranial window
The mouse was mounted on an upright confocal microscope (Zeiss LSM 7, operating
under Zen 2012 Carl Zeiss Microscopy GmbH, Jena, Germany) and kept at a steady
temperature of 32°C by means of a heating pad. The holder kept the mouse head
immobile and allowed retrieval of the same imaging area over days by keeping track
of the x/y-coordinates of the microscope stage. IVM was performed at an excitation
wavelength of 850 nm (680-1080 nm Chameleon Ultra II, Coherent, Santa Clara,
California, United States) using a 20X Zeiss W Plan Apochromat N.A. 1 objective
Jour
nal o
f Cel
l Sci
ence
• S
uppl
emen
tary
info
rmat
ion
(Carl Zeiss Microscopy GmbH, Jena, Germany). The GFP and TRITC emission
wavelengths (510 and 573 nm, respectively) were collected by two hybrid non-
descanned detectors. As the perfusion fixation leads to a wash out of the TRITC-
dextran, fluorescent lectin from Lycopersicon esculentum (Sigma-Aldrich Chemie
GmbH, Munich, Germany) was injected into the mouse tail vein in order to record the
3D organization of the blood vessels after fixation. The mouse was perfusion-fixed by
intracardiac injection with 2.5% glutaraldehyde (GA, Electron Microscopy Sciences,
Hatfield, Pennsylvania, United States) and 2% formaldehyde (FA, Electron
Microscopy Sciences, Hatfield, Pennsylvania, United States) in 0.1 M PHEM buffer
(composed of 60 mM PIPES, 25 mM HEPES, 10 mM EGTA and 2 mM MgCl, pH
adjusted to 6.9). Following fixation, the ROI was imaged again based on the stored
stage x/y-coordinates. NIRB was performed with the same laser used for IVM, tuned
to a 750 nm wavelength. Above the ROIs, at the level of the brain surface, a 150x150
µm2 area was scanned in a single focal plane until the NIRB square became clearly
visible through emission of autofluorescence in the green channel. Around the ROI,
three bigger 300x300 µm2 NIRB squares were drawn in non-symmetric positions to
facilitate orientation and retrieval of the ROI upon dissection (Fig. 2). The brain was
removed from the skull and post-fixed by immersion in the same fixative at 4oC
overnight. The following day, the fixative was replaced with 0.1 M PHEM buffer and
the brain was stored at 4°C until further processing.
IVM and NIRB of subcutaneous tumors in the mouse ear
IVM and NIRB were performed as previously described5 on the anesthetized mouse.
After the IVM acquisition, the mouse was fixed by intracardiac perfusion of 2,5% GA
and 2% FA in 0.1 M PHEM buffer. The ear was dissected and immersed in the same
fixative at 4°C overnight. The next day, the ear biopsy was transferred to 0.1 M
PHEM buffer and stored at 4°C until further processing.
Processing for Electron Microscopy
To improve the penetration of the chemicals during processing, small samples (< 1
mm3) needed to be selected from the large brain and ear biopsies. Fixation and storage
had not influenced the visibility of the NIRB markings on the surface and small
samples could be dissected around these square-shapes. The samples were processed
in a PELCO Biowave Pro microwave (Ted Pella, Inc., Redding, California, United
Jour
nal o
f Cel
l Sci
ence
• S
uppl
emen
tary
info
rmat
ion
States), using a protocol based on previous work (Cantoni et al., 2010). The samples
were washed four times five minutes in cacodylate buffer (pH 7.4), in the hood.
Primary post-fixation with 1% OsO4 (Electron Microscopy Sciences, Hatfield,
Pennsylvania, United States) and 1.5% K4Fe(CN)6 (Merck) in 0.1 M cacodylate
buffer was performed in the microwave under vacuum, in seven consecutive two-
minute steps, cycling between 100 W power on/off stages. The samples were then
rinsed thoroughly in the hood and twice for 40 seconds at 250 W in the microwave.
Secondary post-fixation with 1% OsO4 in 0.1 M cacodylate buffer was then
performed in the same conditions as the primary post-fixation. Staining with 1%
uranyl acetate (Serva Electrophoresis GmbH, Heidelberg, Germany), dehydration in
ethanol, and resin embedding were performed in the microwave as described before
(Karreman et al., 2014). The mouse brain samples were mounted in commonly used
resin molds and left to polymerize for three to four days at 60oC. The ear skin tissue
was flat embedded between two sheets of aclar, and mounted on an empty resin block
the following day as described before5. Following polymerization, the front face and
the sides of the resin blocks were trimmed using a trimming diamond knife (20 o,
Diatome AG, Biel, Switzerland) to create a reference surface for future measurements
(see text and below).
MicroCT imaging and reconstruction
Microscopic X-ray computed tomography (microCT) scanning was performed with a
Phoenix Nanotom m (GE Sensing & Inspection Technologies, Fairfield, Connecticut,
United States) operating under xs control and Phoenix datos|x acquisition software
(both GE Sensing & Inspection Technologies, Fairfield, Connecticut, United States).
The resin-embedded biopsies were cut from the large resin block to achieve a small (<
3 mm3) sample. This allowed mounting the sample as close as possible to the x-ray
source, which resulted in a higher magnification/resolution upon imaging. Scanning
of the brain samples was performed at 50 kV and 500 µA, for one hour (1440 frames,
average of 2, exposure time: 1000 ms). The skin sample was scanned in similar
conditions, but with higher image averaging, which results in noise-reduction and
extended the scan-time to two hours. The voxel size of the resulting datasets was 0.75
µm in x, y and z for the brain samples and 0.77 µm in x, y and z for the ear skin
sample. Reconstruction of the microCT volume was performed using Phoenix datos|x
reconstruction software (GE Sensing & Inspection Technologies, Fairfield,
Jour
nal o
f Cel
l Sci
ence
• S
uppl
emen
tary
info
rmat
ion
Connecticut, United States) and the volume was then further processed in VGStudio
MAX software (Volume Graphics, Heidelberg, Germany).
3D Registration of the IVM and microCT volumes in Amira software
The z-stacks (supplementary material Fig. S1) were loaded in Amira (FEI Company,
Hillsboro, Oregon, United States)’s digital space, and semi-automatically segmented
using the Segmentation editor. Hereto, pixels representing the features of interest
were selected by global or local (using the ‘magic wand’) thresholding of grey-values.
Gaussian filtering and masking facilitated the automatic segmentation. The Amira
feature “Normalize Image” helped dealing with the intensity gradient in the dataset
caused by incomplete penetration of the heavy metals in deeper parts of the tissue.
Segmentation artifacts were corrected by manual segmentation.
3D surface models were generated from the label files, and were simultaneously
visualized in Amira. First, the IVM model was roughly fitted into the microCT model
by manual displacement in 3D (rotation and translation). This first fitting helped
identifying common features in both datasets. Second, using the Landmark (2 sets)
module, the corresponding points in both datasets were selected (10-20 points). Using
the Landmarksurfacewarp module, the surface model of the IVM dataset was then
warped into the microCT volume using rigid (affine) transformations. Generally, this
first registration revealed more common points between both datasets, which could
then be added to the Landmark set, improving the final 3D registration.
Where the IVM dataset provided the position of the ROI with respect to the structural
features within the biopsy, the microCT volume revealed the orientation of the biopsy
inside the resin block (see text). By combining both datasets, the location of the ROI
inside the resin block could thus be predicted. Using Amira, the distance between the
ROI and the surface and sides of the resin block was measured.
Trimming and approach at the ultramicrotome
The sample was mounted on a Leica Ultracut S ultramicrotome (Leica Microsystems,
Wetzlar, Germany) and trimmed using a 20 o trimming diamond knife (Diatome AG,
Biel, Switzerland). Prior to microCT scanning, a flat surface block face with parallel
straight sides was trimmed. Following microCT and 3D registration of both datasets,
the front face was trimmed to the calculated depth of the ROI. While trimming, the
approach to the ROI could be monitored by obtaining a few thick sections (500 nm)
Jour
nal o
f Cel
l Sci
ence
• S
uppl
emen
tary
info
rmat
ion
from the sample. The sections were mounted on a Superfrost ++ glass slide, toluidine
blue stained and imaged with light microscopy (LM). The LM sections were
correlated to the microCT virtual sections. To achieve this, an obliqueslice was
created in Amira software and aligned to be perfectly parallel with the trimmed block-
face in the microCT dataset, and thus also parallel to the trimming angle. The
orientation of the obliqueslice virtual sections then corresponded to the physical thick
sections (500 nm) produced at the ultramicrotome.
It was determined, by visual inspection, which virtual section matched the best to the
LM section. The position of this selected virtual section within the microCT dataset
then enabled us to measure the distance between the newly trimmed surface and the
ROI (supplementary material Fig. S3). In practice, a small number of checkpoints are
sufficient to obtain an accuracy of about 5 µm for the targeting. We have used from 2
to 5, evenly spread throughout the trimmed volume. Collecting more checkpoints may
lead to higher accuracy, but will also slow down the whole procedure.
For FIB-SEM imaging, both the front face and one flank of the block needed to be
trimmed very close to the region of interest (see “Results” and supplementary
material Fig. S3). To achieve this, the front was trimmed to several micrometers (20-
30 µm) just before reaching the tumor cell (as estimated from the microCT 3D map).
Next, one flank was trimmed as close as possible to the tumor cell (max 20-30 µm), a
new thick section was produced and compared to the microCT tomogram, to check
the progression towards the ROI (supplementary material Fig. S3). The front face,
which would be the imaged surface in the FIB-SEM, was then trimmed further to
approach the cell as close as possible (3-5 µm). To enable mounting on the SEM stub,
the trimmed tip of the resin block was cut away with a double-edged razor blade. The
sample was mounted with an adhesive conductive carbon tab (PELCO Tabs, Ted
Pella, Inc., Redding, California, United States) on a 0.5 ” SEM pin stub (Agar
Scientific, Essex, United Kingdom) and stabilized with colloidal silver (liquid, Ted
Pella, Inc., Redding, California, United States). The sample on the stub was then
sputter-coated with gold (60 seconds, at 30 mA).
For serial sectioning of the resin embedded subcutaneous tumor sample, the front face
of the resin block was trimmed to the calculated depth of the region of interest. The
flanks of the samples were trimmed to create a block-face of approximately 300 by
600 µm2. About 330 thick serial sections (130 nm) were produced with a 45 o histo
Jour
nal o
f Cel
l Sci
ence
• S
uppl
emen
tary
info
rmat
ion
diamond-knife (Diatome AG, Biel, Switzerland) and mounted on formvar-coated slot
grids.
Electron Microscopy and Image Analysis
The mouse brain samples were imaged in an Auriga 60 FIB-SEM (Carl Zeiss
Microscopy GmbH, Jena, Germany) operating under SmartSEM (Carl Zeiss
Microscopy GmbH, Jena, Germany) and Atlas3D software (Fibics Incorporated,
Ottowa, Ontario, Canada). The resulting datasets were aligned using TrakEM
(Cardona et al., 2012)(ImageJ, (Schindelin et al., 2012), http://imagej.nih.gov/ij/) and
the image stack was segmented in 3dmod, part of the IMOD software package
(Mastronarde, 2005) (Boulder Laboratory, University of Colorado, Denver, Colorado,
United States). The serial sections of the mouse ear skin tissue were screened and
imaged with a Biotwin CM120 (120 kV, FEI Company, Hillsboro, Oregon, United
States) equipped with a bottom-mounted 1K Keen View CCD Camera (Olympos Soft
Imaging Solutions, Münster, Germany). Montaged images and tomograms were
acquired with a Tecnai F30 Field Emission Gun TEM (300 kV, FEI Company,
Hillsboro, Oregon, United States) equipped with an Eagle 4K camera (FEI Company,
Hillsboro, Oregon, United States). The F30 was controlled by Tecnai User Interface
(PEOUI) and Tecnai Acquisition (TIA) software. Tomograms and image-montages
were obtained using SerialEM (Mastronarde, 2005), and the tomograms were
reconstructed in eTomo, part of the IMOD software package (Kremer et al., 1996)
(Boulder Laboratory, University of Colorado, Denver, Colorado, United States). The
EM images were processed using ImageJ (Schindelin et al., 2012), and Photoshop
CS6 (Adobe). The figures were created in Illustrator CS6 (Adobe, San Jose,
California, United States) and the supplementary material movies were made with Fiji
(ImageJ, http://imagej.nih.gov/ij/), IMOD (Boulder Laboratory, University of
Colorado, Denver, Colorado, United States) and Amira (FEI Company, Hillsboro,
Oregon, United States).
Jour
nal o
f Cel
l Sci
ence
• S
uppl
emen
tary
info
rmat
ion
Acknowledgements
The authors would like to thank the IGBMC platform for their assistance with IVM
imaging, and the INSERM U1109 animal facility for the mouse care. We are grateful
to Tsukasa Shibue for providing the D2A1 Lifeact-YPet cell line. We thank Robert
Brandt for his advice on Amira software. We are very much obliged to Anna Steyer,
Wim Hagen, Rachel Mellwig and the Electron Microscopy Core Facility at EMBL for
their help with electron microscopy. We thank Brunilde Gril and Patricia Steeg (NCI,
Bethesda) for providing the JIMT1 cell line. We are very much obliged to Jan
Ellenberg for critically reading the manuscript and providing helpful comments. This
work has been supported by research grants from the French National Cancer Institute
(INCa) and the Ligue Contre le Cancer (J.G.G.), by institutional funding from Inserm
and the University of Strasbourg (J.G.G.) and by EMBL funds (Y.S.). M.A.K. is
supported by an EMBL Interdisciplinary Post-doctoral fellowship (EIPOD) under
Marie Curie Actions (COFUND), L.M. is supported by an INSERM/Région Alsace
Ph.D fellowship and G.A. is supported by a FRM engineer fellowship.
Author Contributions
Y.S., J.G.G. and M.A.K. designed the research, M.A.K., L.M., N.L.S., G. S. and G.A.
conducted the experiments, B.R. performed the microCT scans, F.W. established the
cranial window mouse model. L.M. established the intravital imaging on the mouse
ear. M.A.K. and L.M. processed and analyzed the data. M.A.K., J.G.G. and Y.S.
wrote the manuscript, all authors commented on the manuscript.
Jour
nal o
f Cel
l Sci
ence
• S
uppl
emen
tary
info
rmat
ion
References
Alexander, S., Koehl, G. E., Hirschberg, M., Geissler, E. K. and Friedl, P. (2008).
Dynamic imaging of cancer growth and invasion: a modified skin-fold chamber
model. Histochem Cell Biol 130, 1147–1154.
Beerling, E., Ritsma, L., Vrisekoop, N., Derksen, P. W. B. and van Rheenen, J.
(2011). Intravital microscopy: new insights into metastasis of tumors. Journal of
Cell Science 124, 299–310.
Bishop, D., Nikić, I., Brinkoetter, M., Knecht, S., Potz, S., Kerschensteiner, M.
and Misgeld, T. (2011). Near-infrared branding efficiently correlates light and
electron microscopy. Nature Methods 8, 568–570.
Briggman, K. L. and Bock, D. D. (2012). Volume electron microscopy for neuronal
circuit reconstruction. Curr. Opin. Neurobiol. 22, 154–161.
Burnett, T. L., McDonald, S. A., Gholinia, A., Geurts, R., Janus, M., Slater, T.,
Haigh, S. J., Ornek, C., Almuaili, F., Engelberg, D. L., et al. (2014).
Correlative Tomography. Sci. Rep. 4.
Bushong, E. A., Johnson, D. D., Kim, K.-Y., Terada, M., Hatori, M., Peltier, S.
T., Panda, S., Merkle, A. and Ellisman, M. H. (2014). X-Ray Microscopy as an
Approach to Increasing Accuracy and Efficiency of Serial Block-Face Imaging
for Correlated Light and Electron Microscopy of Biological Specimens. Microsc.
Microanal. 21, 231–238.
Cantoni, M., Genoud, C., Hébert, C. and Knott, G. (2010). Large volume,
isotropic, 3D imaging of cell structure on the nanometer scale. Microscopy and
Analysis.
Cardona, A., Saalfeld, S., Schindelin, J., Arganda-Carreras, I., Preibisch, S.,
Longair, M., Tomancak, P., Hartenstein, V. and Douglas, R. J. (2012).
TrakEM2 Software for Neural Circuit Reconstruction. PLoS ONE 7, e38011.
Charras, G. and Paluch, E. (2008). Blebs lead the way: how to migrate without
lamellipodia. Nat. Rev. Mol. Cell Biol. 9, 730–736.
Jour
nal o
f Cel
l Sci
ence
• S
uppl
emen
tary
info
rmat
ion
Durdu, S., Iskar, M., Revenu, C., Schieber, N., Kunze, A., Bork, P., Schwab, Y.
and Gilmour, D. (2014). Luminal signalling links cell communication to tissue
architecture during organogenesis. Nature 1–18.
Friedl, P. and Alexander, S. (2011). Cancer Invasion and the Microenvironment:
Plasticity and Reciprocity. Cell 147, 992–1009.
Friedl, P., Wolf, K. and Lammerding, J. (2011). Nuclear mechanics during cell
migration. Current Opinion in Cell Biology 23, 55–64.
Gligorijevic, B., Bergman, A. and Condeelis, J. (2014). Multiparametric
Classification Links Tumor Microenvironments with Tumor Cell Phenotype. Plos
Biol 12, e1001995.
Goetz, J. G., Steed, E., Ferreira, R. R., Roth, S., Ramspacher, C., Boselli, F.,
Charvin, G., Liebling, M., Wyart, C., Schwab, Y., et al. (2014). Endothelial
Cilia Mediate Low Flow Sensing during Zebrafish Vascular Development.
CellReports 6, 799–808.
Handschuh, S., Baeumler, N., Schwaha, T. and Ruthensteiner, B. (2013). A
correlative approach for combining microCT, light and transmission electron
microscopyin a single 3D scenario. Frontiers in Zoology 10, 1–1.
Karreman, M. A., Mercier, L., Schieber, N. L., Shibue, T., Schwab, Y. and
Goetz, J. G. (2014). Correlating Intravital Multi-Photon Microscopy to 3D
Electron Microscopy of Invading Tumor Cells Using Anatomical Reference
Points. PLoS ONE 9, e114448.
Keene, D. R., Tufa, S. F., Wong, M. H., Smith, N. R., Sakai, L. Y. and Horton,
W. A. (2014). Correlation of the Same Fields Imaged in the TEM, Confocal, LM,
and MicroCT by Image Registration: From Specimen Preparationto Displaying a
Final Composite Image. In Methods in Cell Biology (eds. Mueller-Reichert, T.
and Verkade, P., pp. 391–417. Elsevier Inc.
Kienast, Y., Baumgarten, von, L., Fuhrmann, M., Klinkert, W. E. F.,
Goldbrunner, R., Herms, J. and Winkler, F. (2010). Realtime imaging reveals
the single steps of brain metastasis formation. Nature Medicine 16, 116–122.
Jour
nal o
f Cel
l Sci
ence
• S
uppl
emen
tary
info
rmat
ion
Kolotuev, I., Schwab, Y. and Labouesse, M. (2010). A precise and rapid mapping
protocol for correlative light and electron microscopy of small invertebrate
organisms. Biol. Cell 102, 121–132.
Korogod, N., Petersen, C. C. H. and Knott, G. W. (2015). Ultrastructural analysis
of adult mouse neocortex comparing aldehyde perfusion with cryo fixation. Elife
4.
Kremer, J. R., Mastronarde, D. N. and McIntosh, J. R. (1996). Computer
visualization of three-dimensional image data using IMOD. Journal of Structural
Biology 116, 71–76.
Leong, H. S., Robertson, A. E., Stoletov, K., Leith, S. J., Chin, C. A., Chien, A.
E., Hague, M. N., Ablack, A., Carmine-Simmen, K., McPherson, V. A., et al.
(2014). Invadopodia Are Required for Cancer Cell Extravasation and Are a
Therapeutic Target for Metastasis. Cell Reports 8, 1558–1570.
Lucas, M. S., Günthert, M., Gasser, P., Lucas, F. and Wepf, R. (2012). Bridging
Microscopes: 3D Correlative Light and Scanning Electron Microscopy of
Complex Biological Structures. (eds. Mueller-Reichert, T. and Verkade, P.
Elsevier.
Maco, B., Holtmaat, A., Cantoni, M., Kreshuk, A., Straehle, C. N., Hamprecht,
F. A. and Knott, G. W. (2013). Correlative In Vivo 2 Photon and Focused Ion
Beam Scanning Electron Microscopy of Cortical Neurons. PLoS ONE 8, e57405.
Mastronarde, D. N. (2005). Automated electron microscope tomography using
robust prediction of specimen movements. Journal of Structural Biology 152, 36–
51.
Metscher, B. D. (2009). MicroCT for comparative morphology: simple staining
methods allow high-contrast 3D imaging of diverse non-mineralized animal
tissues. BMC Physiol 9, 11.
Narayan, K., Danielson, C. M., Lagarec, K., Lowekamp, B. C., Coffman, P.,
Laquerre, A., Phaneuf, M. W., Hope, T. J. and Subramaniam, S. (2014).
Journal of Structural Biology. Journal of Structural Biology 185, 278–284.
Jour
nal o
f Cel
l Sci
ence
• S
uppl
emen
tary
info
rmat
ion
Nixon, S. J., Webb, R. I., Floetenmeyer, M., Schieber, N., Lo, H. P. and Parton,
R. G. (2009). A single method for cryofixation and correlative light, electron
microscopy and tomography of zebrafish embryos. Traffic 10, 131–136.
Reymond, N., d'Água, B. B. and Ridley, A. J. (2013). Crossing the endothelial
barrier during metastasis. Nature Publishing Group 13, 858–870.
Ritsma, L., Vrisekoop, N. and van Rheenen, J. (2013). In vivo imaging and
histochemistry are combined in the cryosection labelling and intravital
microscopy technique. Nat Commun 4, 1–8.
Sahai, E. (2007). Illuminating the metastatic process. Nature Publishing Group 7,
737–749.
Sahai, E., Wyckoff, J., Philippar, U., Segall, J. E., Gertler, F. and Condeelis, J.
(2005). Simultaneous imaging of GFP, CFP and collagen in tumors in vivo using
multiphoton microscopy. BMC Biotechnol. 5, 14.
Schindelin, J., Arganda-Carreras, I., Frise, E., Kaynig, V., Longair, M., Pietzsch,
T., Preibisch, S., Rueden, C., Saalfeld, S., Schmid, B., et al. (2012). Fiji: an
open-source platform for biological-image analysis. Nature Methods 9, 676–682.
Sengle, G., Tufa, S. F., Sakai, L. Y., Zulliger, M. A. and Keene, D. R. (2013). A
correlative method for imaging identical regions of samples by micro-CT, light
microscopy, and electron microscopy: imaging adipose tissue in a model system.
Journal of Histochemistry & Cytochemistry 61, 263–271.
Shibue, T., Brooks, M. W. and Weinberg, R. A. (2013). An Integrin-Linked
Machinery of Cytoskeletal Regulation that Enables Experimental Tumor
Initiation and Metastatic Colonization. CCELL 24, 481–498.
Stoletov, K., Kato, H., Zardouzian, E., Kelber, J., Yang, J., Shattil, S. and
Klemke, R. (2010). Visualizing extravasation dynamics of metastatic tumor cells.
Journal of Cell Science 123, 2332–2341.
Valastyan, S. and Weinberg, R. A. (2011). Tumor Metastasis: Molecular Insights
and Evolving Paradigms. Cell 147, 275–292.

Jour
nal o
f Cel
l Sci
ence
• S
uppl
emen
tary
info
rmat
ion
Wolf, K. and Friedl, P. (2011). Extracellular matrix determinants of proteolytic and
non-proteolytic cell migration. Trends in Cell Biology 21, 736–744.
Wolf, K., Lindert, te, M., Krause, M., Alexander, S., Riet, te, J., Willis, A. L.,
Hoffman, R. M., Figdor, C. G., Weiss, S. J. and Friedl, P. (2013). Physical
limits of cell migration: Control by ECM space and nuclear deformation and
tuning by proteolysis and traction force. The Journal of Cell Biology 201, 1069–
1084.
Jour
nal o
f Cel
l Sci
ence
• S
uppl
emen
tary
info
rmat
ion
Figures
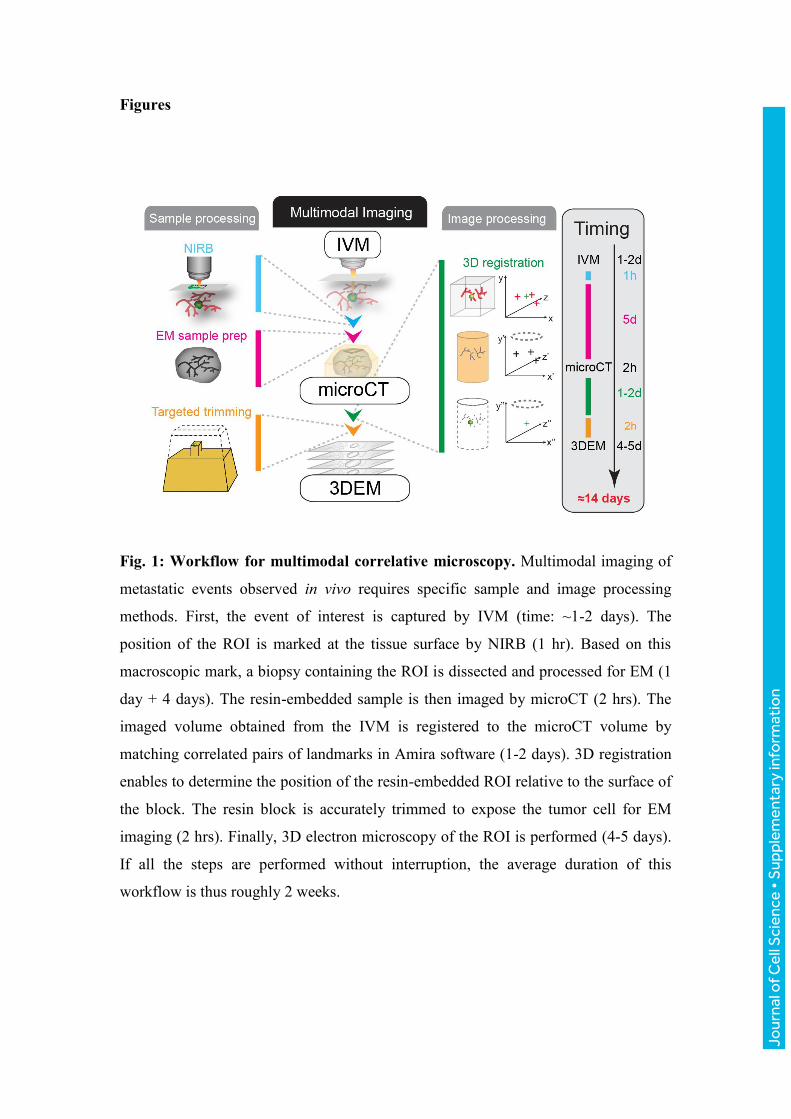
Fig. 1: Workflow for multimodal correlative microscopy. Multimodal imaging of
metastatic events observed in vivo requires specific sample and image processing
methods. First, the event of interest is captured by IVM (time: ~1-2 days). The
position of the ROI is marked at the tissue surface by NIRB (1 hr). Based on this
macroscopic mark, a biopsy containing the ROI is dissected and processed for EM (1
day + 4 days). The resin-embedded sample is then imaged by microCT (2 hrs). The
imaged volume obtained from the IVM is registered to the microCT volume by
matching correlated pairs of landmarks in Amira software (1-2 days). 3D registration
enables to determine the position of the resin-embedded ROI relative to the surface of
the block. The resin block is accurately trimmed to expose the tumor cell for EM
imaging (2 hrs). Finally, 3D electron microscopy of the ROI is performed (4-5 days).
If all the steps are performed without interruption, the average duration of this
workflow is thus roughly 2 weeks.
Jour
nal o
f Cel
l Sci
ence
• S
uppl
emen
tary
info
rmat
ion
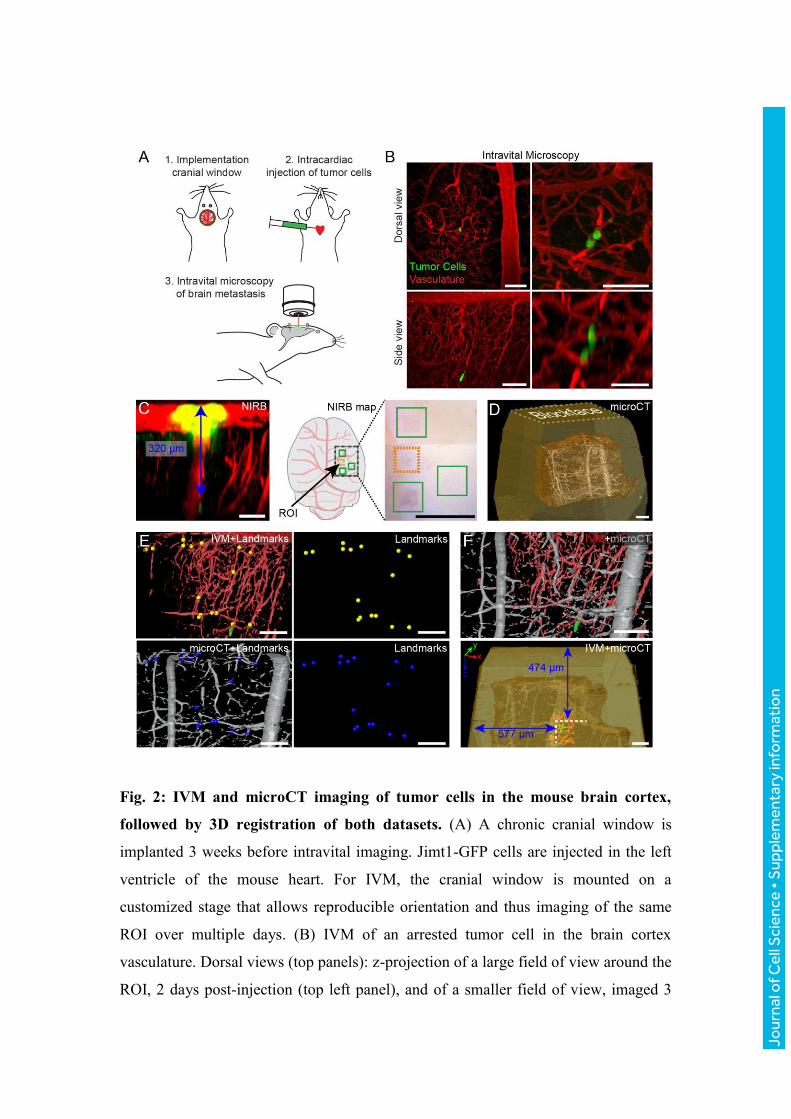
Fig. 2: IVM and microCT imaging of tumor cells in the mouse brain cortex,
followed by 3D registration of both datasets. (A) A chronic cranial window is
implanted 3 weeks before intravital imaging. Jimt1-GFP cells are injected in the left
ventricle of the mouse heart. For IVM, the cranial window is mounted on a
customized stage that allows reproducible orientation and thus imaging of the same
ROI over multiple days. (B) IVM of an arrested tumor cell in the brain cortex
vasculature. Dorsal views (top panels): z-projection of a large field of view around the
ROI, 2 days post-injection (top left panel), and of a smaller field of view, imaged 3
Jour
nal o
f Cel
l Sci
ence
• S
uppl
emen
tary
info
rmat
ion
days post-injection (top right panel). Side views (bottom panels): x/z projection of the
ROI, 2 days (left bottom panel) and 3 days (right bottom panel) post-injection. Scale
bars: 100 μm in left panels, 50 μm in right panels. (C) After IVM acquisition and
perfusion fixation, the position of the ROI is marked by NIRB at the surface of the
brain, producing auto-fluorescence in the green channel. The x/z projection shows
how the NIRB landmark is confined to the surface of the brain, distant to the tumor
cell (blue arrow). A cartoon and an image of the mouse brain show the relative
position of several NIRB landmarks. Aside from the landmark positioned above the
ROI (orange box), 3 additional marks were created as references (green boxes), to
facilitate targeting the selected ROIs when dissecting the biopsies. Scale bars: 100 μm
(left panel), 1 mm (right panel). (D) The microCT dataset shows the tissue biopsy
(brown) within the resin block (yellow) and the blood vessels (grey). Scale bar: 100
μm. (E) 3D registration of the vasculature as segmented from the two imaging
modalities: IVM (red) and microCT (gray). Corresponding points in both datasets are
located and marked (yellow spheres for IVM and blue spheres for microCT). Scale
bars: 100 μm. (F) Based on the landmarks shown in panel E, the IVM volume is
registered into the microCTdataset with Amira software, which enables to precisely
determine the position of the tumor cell (green) within the resin block and relative to
its surface (bottom right panel). Scale bars: 100 μm.
Jour
nal o
f Cel
l Sci
ence
• S
uppl
emen
tary
info
rmat
ion
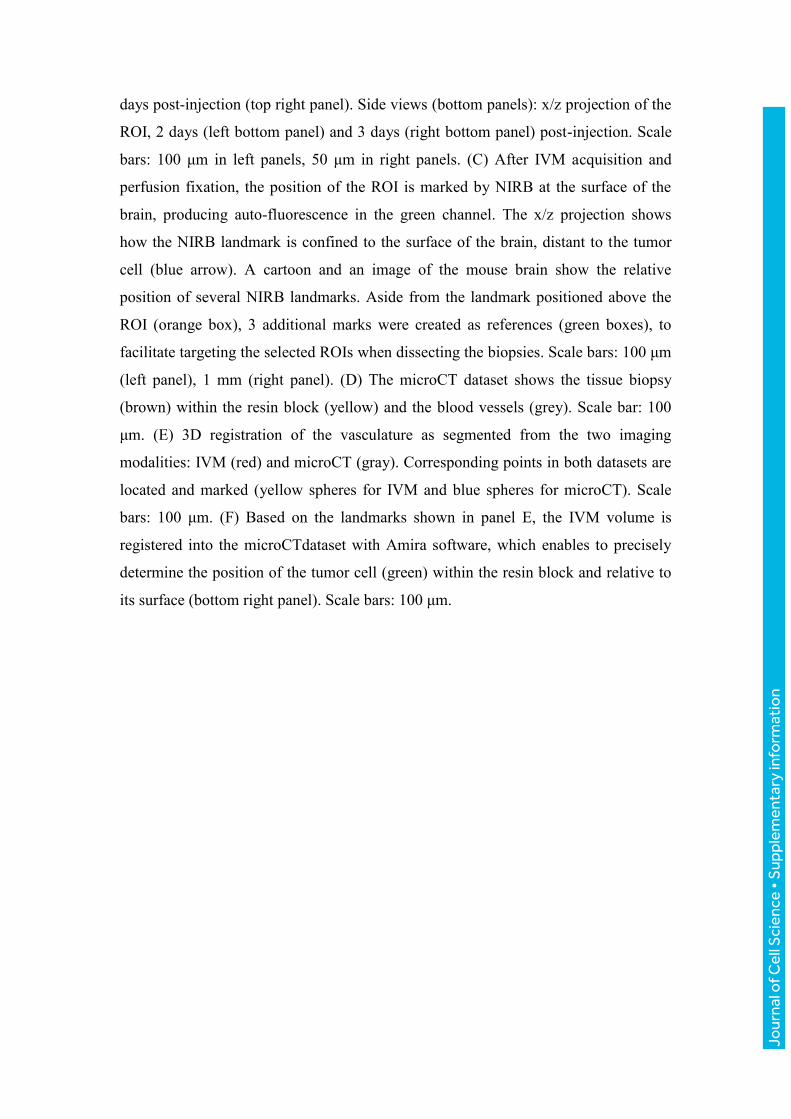
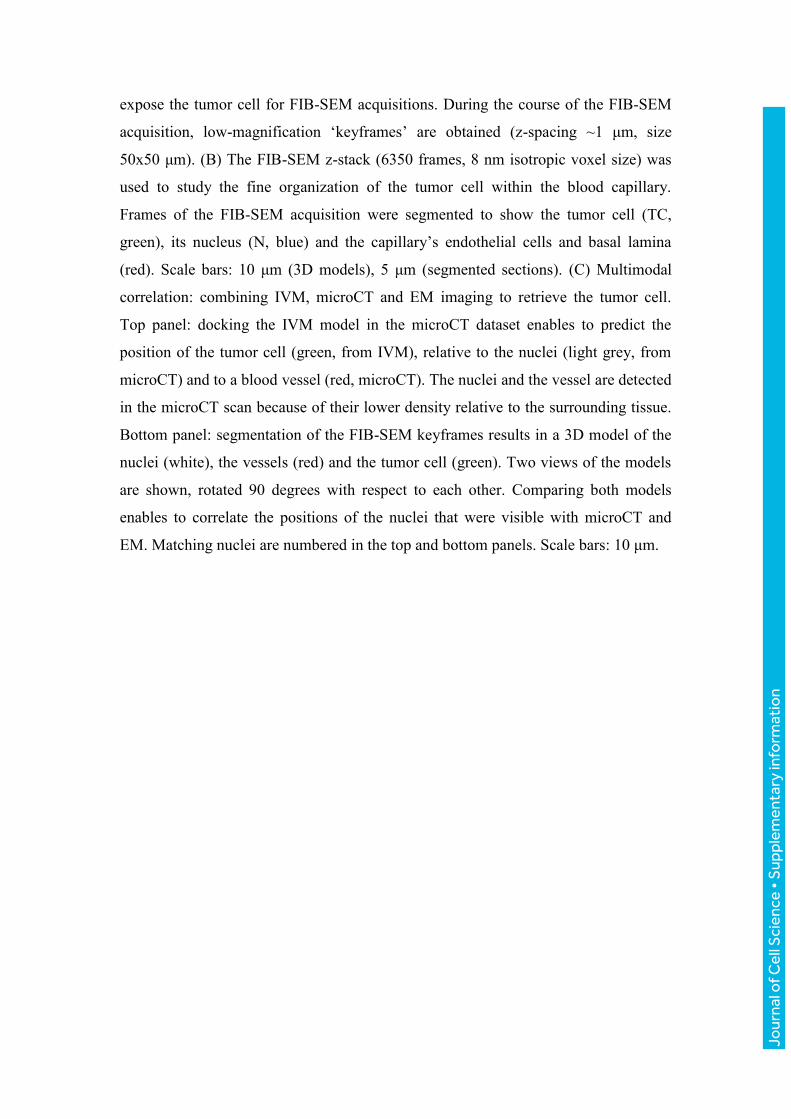
Fig. 3: FIB-SEM imaging of a tumor cell arrested in the vasculature of the brain.
(A) Automated 3D Electron Microscopy. The resin block was precisely trimmed to
Jour
nal o
f Cel
l Sci
ence
• S
uppl
emen
tary
info
rmat
ion
expose the tumor cell for FIB-SEM acquisitions. During the course of the FIB-SEM
acquisition, low-magnification ‘keyframes’ are obtained (z-spacing ~1 μm, size
50x50 μm). (B) The FIB-SEM z-stack (6350 frames, 8 nm isotropic voxel size) was
used to study the fine organization of the tumor cell within the blood capillary.
Frames of the FIB-SEM acquisition were segmented to show the tumor cell (TC,
green), its nucleus (N, blue) and the capillary’s endothelial cells and basal lamina
(red). Scale bars: 10 μm (3D models), 5 μm (segmented sections). (C) Multimodal
correlation: combining IVM, microCT and EM imaging to retrieve the tumor cell.
Top panel: docking the IVM model in the microCT dataset enables to predict the
position of the tumor cell (green, from IVM), relative to the nuclei (light grey, from
microCT) and to a blood vessel (red, microCT). The nuclei and the vessel are detected
in the microCT scan because of their lower density relative to the surrounding tissue.
Bottom panel: segmentation of the FIB-SEM keyframes results in a 3D model of the
nuclei (white), the vessels (red) and the tumor cell (green). Two views of the models
are shown, rotated 90 degrees with respect to each other. Comparing both models
enables to correlate the positions of the nuclei that were visible with microCT and
EM. Matching nuclei are numbered in the top and bottom panels. Scale bars: 10 μm.
Jour
nal o
f Cel
l Sci
ence
• S
uppl
emen
tary
info
rmat
ion
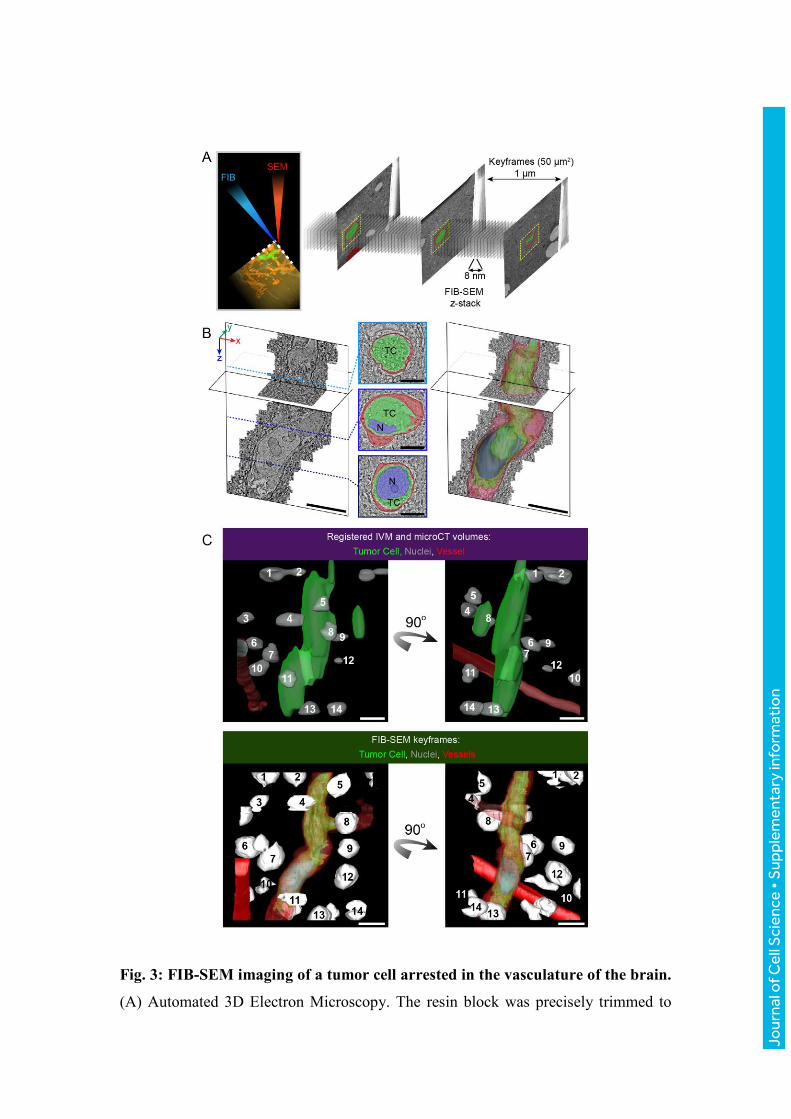
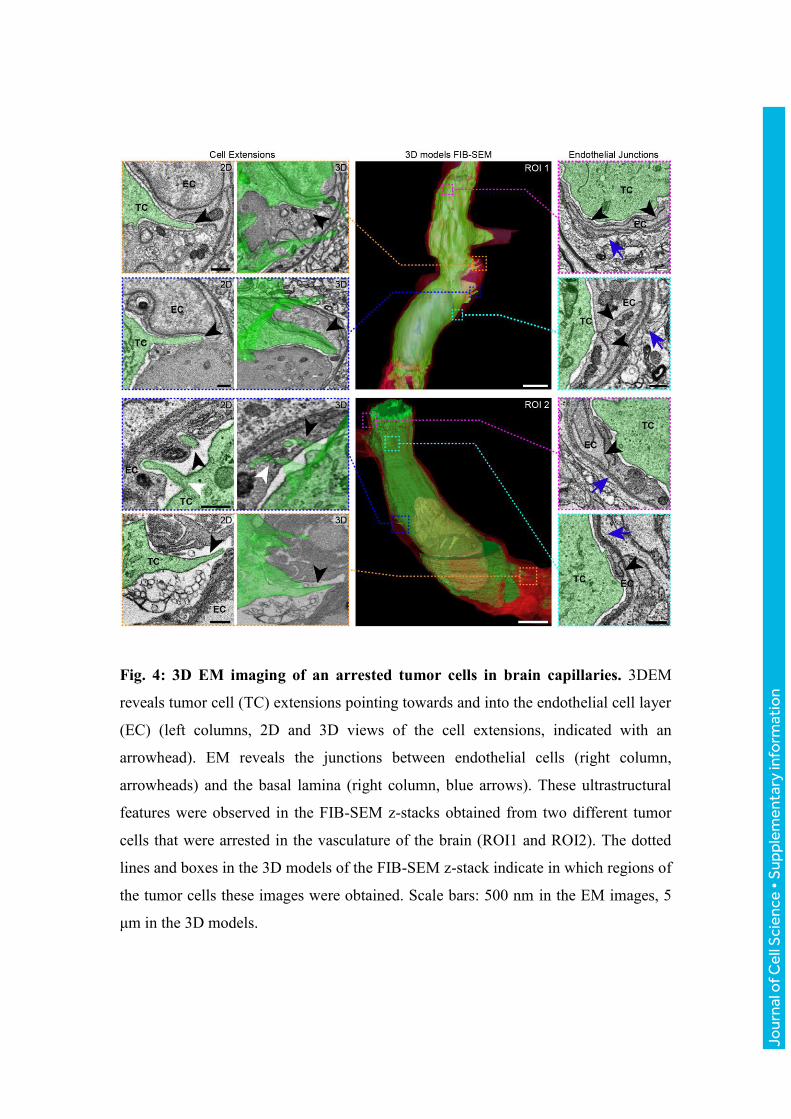
Fig. 4: 3D EM imaging of an arrested tumor cells in brain capillaries. 3DEM
reveals tumor cell (TC) extensions pointing towards and into the endothelial cell layer
(EC) (left columns, 2D and 3D views of the cell extensions, indicated with an
arrowhead). EM reveals the junctions between endothelial cells (right column,
arrowheads) and the basal lamina (right column, blue arrows). These ultrastructural
features were observed in the FIB-SEM z-stacks obtained from two different tumor
cells that were arrested in the vasculature of the brain (ROI1 and ROI2). The dotted
lines and boxes in the 3D models of the FIB-SEM z-stack indicate in which regions of
the tumor cells these images were obtained. Scale bars: 500 nm in the EM images, 5
μm in the 3D models.
Jour
nal o
f Cel
l Sci
ence
• S
uppl
emen
tary
info
rmat
ion
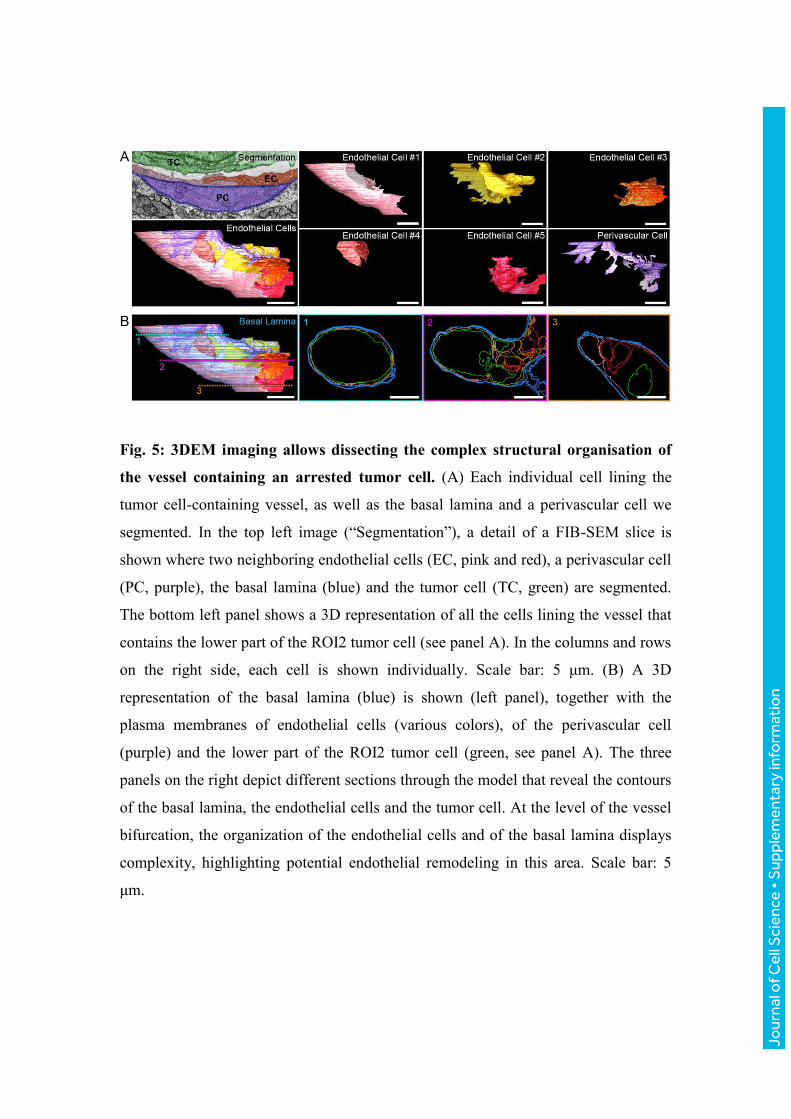
Fig. 5: 3DEM imaging allows dissecting the complex structural organisation of
the vessel containing an arrested tumor cell. (A) Each individual cell lining the
tumor cell-containing vessel, as well as the basal lamina and a perivascular cell we
segmented. In the top left image (“Segmentation”), a detail of a FIB-SEM slice is
shown where two neighboring endothelial cells (EC, pink and red), a perivascular cell
(PC, purple), the basal lamina (blue) and the tumor cell (TC, green) are segmented.
The bottom left panel shows a 3D representation of all the cells lining the vessel that
contains the lower part of the ROI2 tumor cell (see panel A). In the columns and rows
on the right side, each cell is shown individually. Scale bar: 5 μm. (B) A 3D
representation of the basal lamina (blue) is shown (left panel), together with the
plasma membranes of endothelial cells (various colors), of the perivascular cell
(purple) and the lower part of the ROI2 tumor cell (green, see panel A). The three
panels on the right depict different sections through the model that reveal the contours
of the basal lamina, the endothelial cells and the tumor cell. At the level of the vessel
bifurcation, the organization of the endothelial cells and of the basal lamina displays
complexity, highlighting potential endothelial remodeling in this area. Scale bar: 5
μm.
Jour
nal o
f Cel
l Sci
ence
• S
uppl
emen
tary
info
rmat
ion
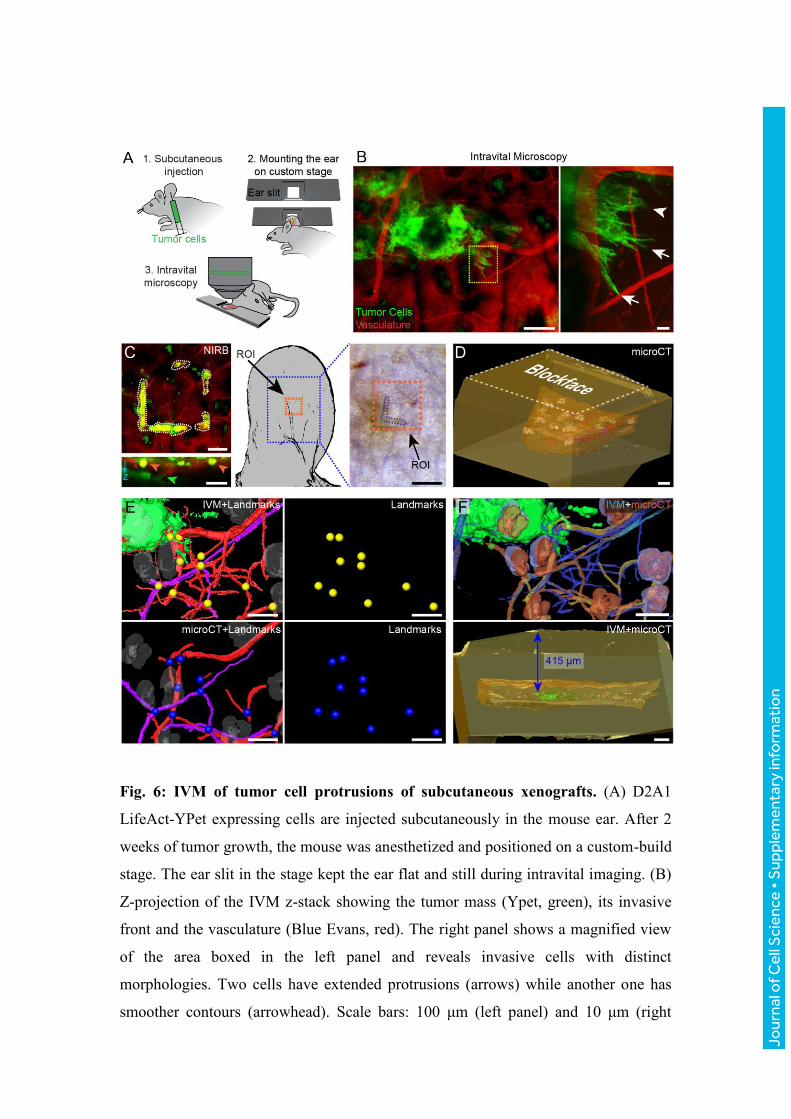
Fig. 6: IVM of tumor cell protrusions of subcutaneous xenografts. (A) D2A1
LifeAct-YPet expressing cells are injected subcutaneously in the mouse ear. After 2
weeks of tumor growth, the mouse was anesthetized and positioned on a custom-build
stage. The ear slit in the stage kept the ear flat and still during intravital imaging. (B)
Z-projection of the IVM z-stack showing the tumor mass (Ypet, green), its invasive
front and the vasculature (Blue Evans, red). The right panel shows a magnified view
of the area boxed in the left panel and reveals invasive cells with distinct
morphologies. Two cells have extended protrusions (arrows) while another one has
smoother contours (arrowhead). Scale bars: 100 μm (left panel) and 10 μm (right
Jour
nal o
f Cel
l Sci
ence
• S
uppl
emen
tary
info
rmat
ion
panel). (C) After IVM, the area of interest was marked by NIRB (white dotted line) at
the skin surface. Bottom panel: x/z projection of the z-stack. A green arrowhead
points to a tumor cell protrusion. The NIRB markings (orange arrowheads) are
confined to the surface of the skin, and distant from the invasive front of the tumor
mass. Following perfusion fixation, the NIRB markings (orange box) remain visible
on the skin biopsy. Scale bar: 100 μm (left panels) and 50 μm (right panel). (D) The
resin embedded samples was scanned by microCT. The microCT dataset shows the
skin tissue biopsy (brown), with the hair follicles (grey), nerves (purple) and blood
vessels (red), within the resin block (yellow). Scale bar: 100 μm. (E) 3D registration
of the tissue features as segmented from the two imaging modalities: IVM (top left
panel) and microCT (bottom left panel). Corresponding points in both datasets are
located and marked (yellow spheres for IVM and blue spheres for microCT, left and
middle panels). Scale bar: 100 μm. (F) Top panel: based on the reference points
shown in panel E, the IVM model (shown in blue and green) is registered to the
microCT dataset (yellow/orange), which enables to determine the position of the ROI
inside the resin block (bottom panel) and relative to its surface (415 µm). Scale bars:
100 μm.
Jour
nal o
f Cel
l Sci
ence
• S
uppl
emen
tary
info
rmat
ion
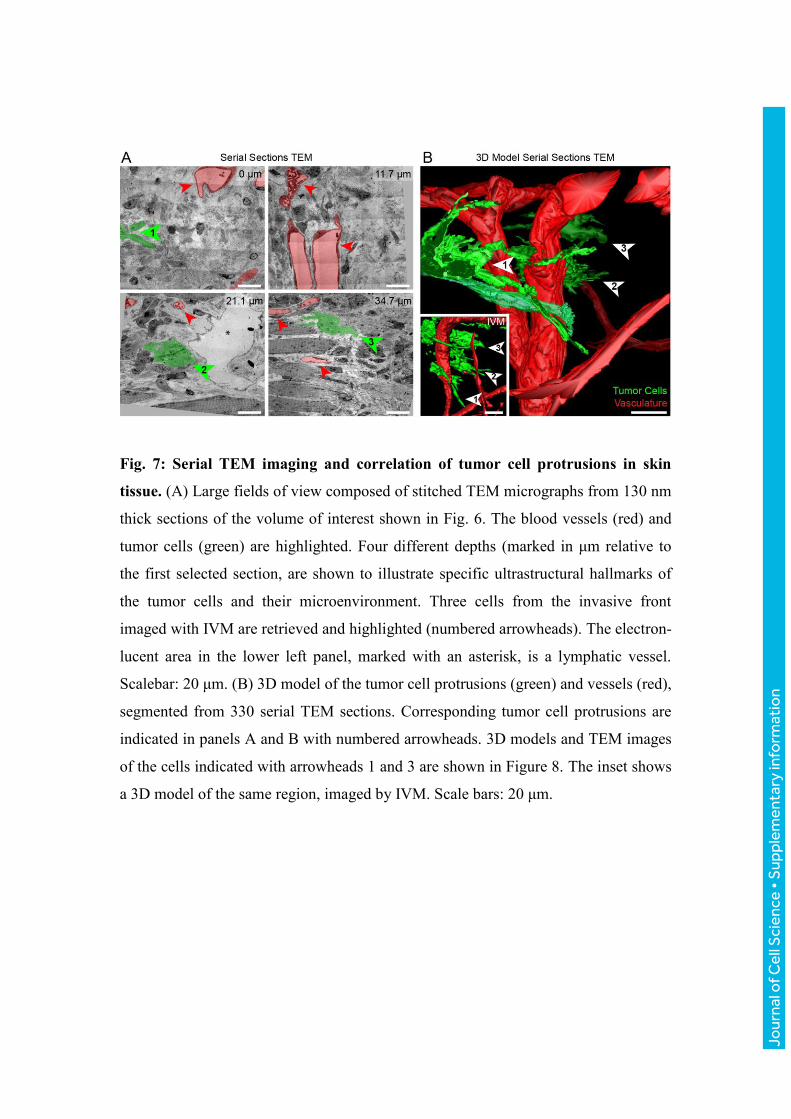
Fig. 7: Serial TEM imaging and correlation of tumor cell protrusions in skin
tissue. (A) Large fields of view composed of stitched TEM micrographs from 130 nm
thick sections of the volume of interest shown in Fig. 6. The blood vessels (red) and
tumor cells (green) are highlighted. Four different depths (marked in μm relative to
the first selected section, are shown to illustrate specific ultrastructural hallmarks of
the tumor cells and their microenvironment. Three cells from the invasive front
imaged with IVM are retrieved and highlighted (numbered arrowheads). The electron-
lucent area in the lower left panel, marked with an asterisk, is a lymphatic vessel.
Scalebar: 20 μm. (B) 3D model of the tumor cell protrusions (green) and vessels (red),
segmented from 330 serial TEM sections. Corresponding tumor cell protrusions are
indicated in panels A and B with numbered arrowheads. 3D models and TEM images
of the cells indicated with arrowheads 1 and 3 are shown in Figure 8. The inset shows
a 3D model of the same region, imaged by IVM. Scale bars: 20 μm.
Jour
nal o
f Cel
l Sci
ence
• S
uppl
emen
tary
info
rmat
ion
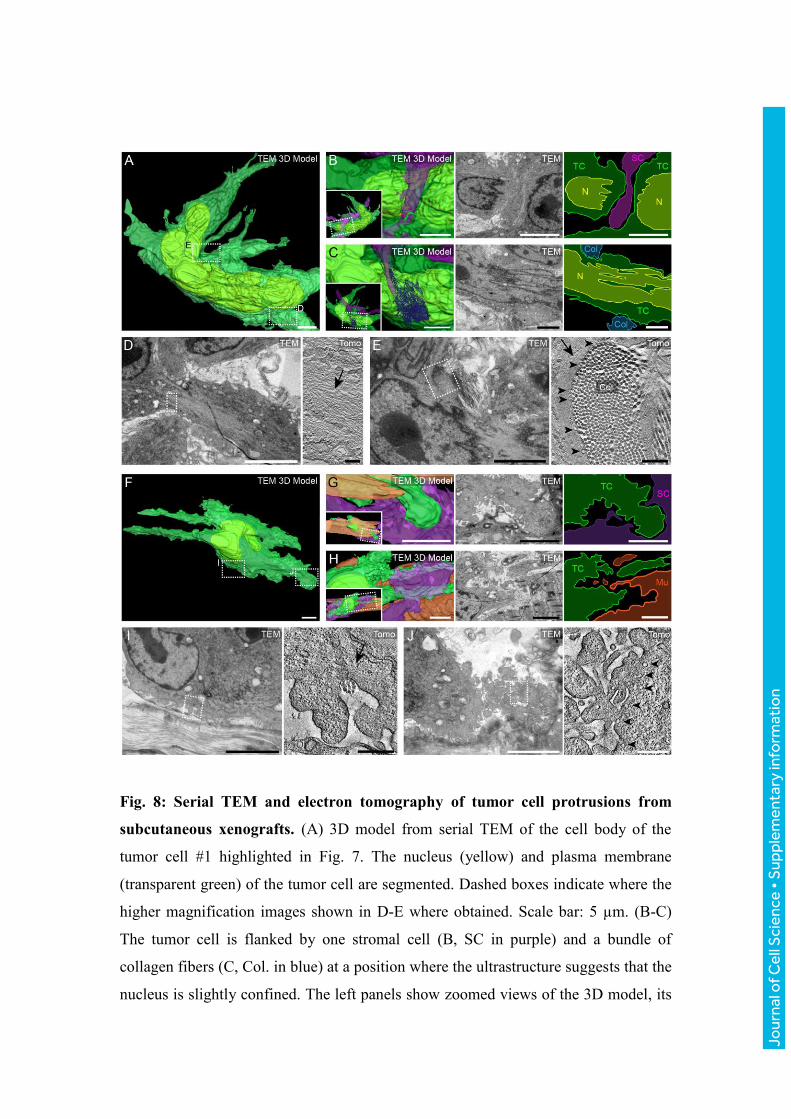
Fig. 8: Serial TEM and electron tomography of tumor cell protrusions from
subcutaneous xenografts. (A) 3D model from serial TEM of the cell body of the
tumor cell #1 highlighted in Fig. 7. The nucleus (yellow) and plasma membrane
(transparent green) of the tumor cell are segmented. Dashed boxes indicate where the
higher magnification images shown in D-E where obtained. Scale bar: 5 µm. (B-C)
The tumor cell is flanked by one stromal cell (B, SC in purple) and a bundle of
collagen fibers (C, Col. in blue) at a position where the ultrastructure suggests that the
nucleus is slightly confined. The left panels show zoomed views of the 3D model, its
Jour
nal o
f Cel
l Sci
ence
• S
uppl
emen
tary
info
rmat
ion
orientation is shown in the insets. The middle panels show TEM images and the right
panels show color-coded maps of the middle panels. Scale bars: 5 µm. (D-E) Electron
tomography (ET) of the boxed areas in panel A. Scale bars: 5 µm (left panels) and
200 nm (right panels). ET reveals the presence of multiple cytoskeletal filaments
(arrows) in a protrusion (D) and underneath the plasma membrane at the cell body
(E). Moreover, groups of vesicles associated to the plasma membrane (arrowheads)
can be recognized in the region where the tumor cells is in close proximity with
collagen fibers (Col), a feature that can be observed in multiple regions. (F) 3D model
from serial TEM of the tumor cell #3 shown in Fig. 7. Dashed boxes indicate where
the higher magnification images shown in I-J where obtained. Scale bar: 10 µm. (G-
H) The tumor cell and its cellular and acellular microenvironment. The left panels
show zoomed views of the 3D model, its orientation is shown in the insets. The
middle panels show TEM images and the right panels show color-coded maps of the
middle panels. Scale bars: 5 µm. (G) A rounded, blebbing protrusion of the tumor cell
(green) is in close proximity to a neighboring stromal cell (purple). Scale bar: 5 µm.
(H) One side of the tumor cell (green) is in close apposition to the skeletal muscle cell
(orange). Scale bar: 5 µm. (I-J) ET of the boxed areas in panel F. ET reveals the
filament network (arrow) at the base of the bleb-like protrusion (I), collagen fibrils
(Col, I) and small intracellular vesicles reminiscent of caveolae (arrowheads, J). Scale
bars: 5 µm (left panels) and 500 nm (right panels).