Fast Analytical Chromatographic Enzyme-assisted ......their size using hydrodynamic chromatography...
23
Bachelor Thesis Chemistry Fast Analytical Chromatographic Enzyme-assisted Polymeric Micelle Analysis Combining Hydrodynamic Chromatography, Immobilized Enzymatic Reactors and Reversed Phase Chromatography by Denice van Herwerden 25 June 2018 Student number 10994270 Research institute Van’t Hoff Institute for Molecular Sciences Research group Analytical Chemistry Group Responsible teacher Prof. dr. ir. P. Schoenmakers Supervisor B.W.J. Pirok MSc
Transcript of Fast Analytical Chromatographic Enzyme-assisted ......their size using hydrodynamic chromatography...
Bachelor Thesis Chemistry
Fast Analytical Chromatographic Enzyme-assisted Polymeric
Micelle Analysis
Combining Hydrodynamic Chromatography, Immobilized Enzymatic Reactors and Reversed Phase Chromatography
by
Denice van Herwerden
25 June 2018
Student number
10994270
Research institute
Van’t Hoff Institute for Molecular Sciences
Research group
Analytical Chemistry Group
Responsible teacher
Prof. dr. ir. P. Schoenmakers
Supervisor
B.W.J. Pirok MSc
2
Abstract To develop a method that is both able to separate nanoparticles on their size and to analyze the degradation product and contents of the nanoparticles, multiple techniques were coupled for this to develop a LCxLC method with a modulator. The nanoparticles were first separated based on their size by using hydrodynamic chromatography (HDC). Then these particles were degraded by an immobilized enzymatic reactor (IMER) and lastly, the degradation products and contents of the IMERs were analyzed with reversed phase chromatography (RPLC). Besides optimizing the second dimension for the LCxLC setup, HDC experiments were also conducted. The results from measuring calibration curves with polystyrene for the columns that can be used for HDC with different particle sizes showed that the lower limit of detection for a column with a packaging size between 1.9 µm and 8.7 µm had a λ value between 0.01 and 0.005 and the upper limit of separation was the point where the transition between HDC and slalom chromatography took place, which was confirmed by measuring calibration curves for one column with different retention time. Furthermore, from the calibration curves was concluded that the C term was dependent on the size of the packaging materials and this relation has not been found in the literature. Besides these results, measurements with nanoparticle standards were conducted with different aqueous mobile phases to eventually conclude that it is possible to perform HDC with deionized water as mobile phase. This was done because the IEMRs did not work when subjected to a buffer with a high amount of salts and surfactant. For the second dimensions different RPLC experiments were performed to find the optimal condition for separation lactic acid, glycolic acid and the hydrophobic contents of the nanoparticles. It was concluded that a column with a length of 150 mm was required and that acetonitrile (ACN) and deionized water were the best options as mobile phase. Also, the ACN concentration should be below 30% when it is transferred from the IMERs to the RPLC column to maintain the separation between LA and GA. Lastly, the overall LCxLC system still has some flaws and requires some optimizations.
3
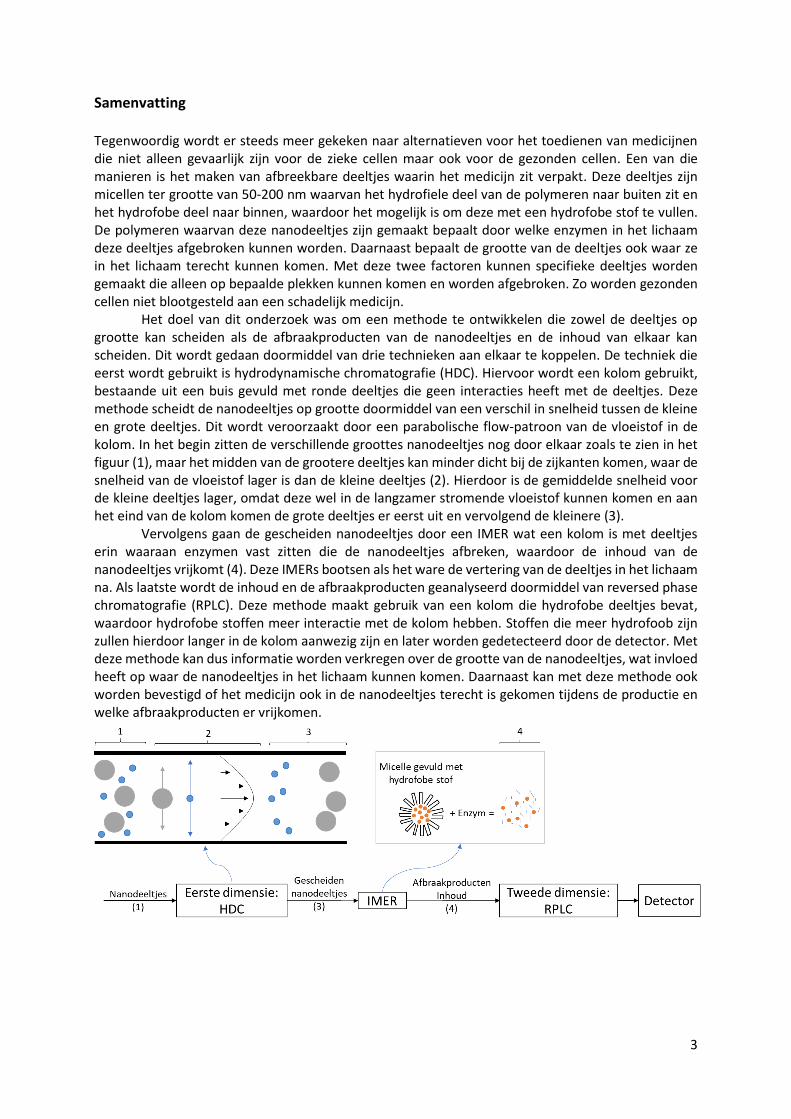
Samenvatting Tegenwoordig wordt er steeds meer gekeken naar alternatieven voor het toedienen van medicijnen die niet alleen gevaarlijk zijn voor de zieke cellen maar ook voor de gezonden cellen. Een van die manieren is het maken van afbreekbare deeltjes waarin het medicijn zit verpakt. Deze deeltjes zijn micellen ter grootte van 50-200 nm waarvan het hydrofiele deel van de polymeren naar buiten zit en het hydrofobe deel naar binnen, waardoor het mogelijk is om deze met een hydrofobe stof te vullen. De polymeren waarvan deze nanodeeltjes zijn gemaakt bepaalt door welke enzymen in het lichaam deze deeltjes afgebroken kunnen worden. Daarnaast bepaalt de grootte van de deeltjes ook waar ze in het lichaam terecht kunnen komen. Met deze twee factoren kunnen specifieke deeltjes worden gemaakt die alleen op bepaalde plekken kunnen komen en worden afgebroken. Zo worden gezonden cellen niet blootgesteld aan een schadelijk medicijn. Het doel van dit onderzoek was om een methode te ontwikkelen die zowel de deeltjes op grootte kan scheiden als de afbraakproducten van de nanodeeltjes en de inhoud van elkaar kan scheiden. Dit wordt gedaan doormiddel van drie technieken aan elkaar te koppelen. De techniek die eerst wordt gebruikt is hydrodynamische chromatografie (HDC). Hiervoor wordt een kolom gebruikt, bestaande uit een buis gevuld met ronde deeltjes die geen interacties heeft met de deeltjes. Deze methode scheidt de nanodeeltjes op grootte doormiddel van een verschil in snelheid tussen de kleine en grote deeltjes. Dit wordt veroorzaakt door een parabolische flow-patroon van de vloeistof in de kolom. In het begin zitten de verschillende groottes nanodeeltjes nog door elkaar zoals te zien in het figuur (1), maar het midden van de grootere deeltjes kan minder dicht bij de zijkanten komen, waar de snelheid van de vloeistof lager is dan de kleine deeltjes (2). Hierdoor is de gemiddelde snelheid voor de kleine deeltjes lager, omdat deze wel in de langzamer stromende vloeistof kunnen komen en aan het eind van de kolom komen de grote deeltjes er eerst uit en vervolgend de kleinere (3). Vervolgens gaan de gescheiden nanodeeltjes door een IMER wat een kolom is met deeltjes erin waaraan enzymen vast zitten die de nanodeeltjes afbreken, waardoor de inhoud van de nanodeeltjes vrijkomt (4). Deze IMERs bootsen als het ware de vertering van de deeltjes in het lichaam na. Als laatste wordt de inhoud en de afbraakproducten geanalyseerd doormiddel van reversed phase chromatografie (RPLC). Deze methode maakt gebruik van een kolom die hydrofobe deeltjes bevat, waardoor hydrofobe stoffen meer interactie met de kolom hebben. Stoffen die meer hydrofoob zijn zullen hierdoor langer in de kolom aanwezig zijn en later worden gedetecteerd door de detector. Met deze methode kan dus informatie worden verkregen over de grootte van de nanodeeltjes, wat invloed heeft op waar de nanodeeltjes in het lichaam kunnen komen. Daarnaast kan met deze methode ook worden bevestigd of het medicijn ook in de nanodeeltjes terecht is gekomen tijdens de productie en welke afbraakproducten er vrijkomen.
4
Abbreviations
ACN Acetonitrile DDS Drugs delivery system ε Porosity GA Glycolic acid HDC Hydrodynamic chromatography IMER Immobilized enzyme reactor LA Lactic acid LCxLC Two-dimensional liquid chromatography Mw Molecular weight PS Polystyrene Reff Effective radius of analyte RPLC Reversed phase liquid chromatography Rh Hydraulic radius SC Slalom chromatography THF Tetrahydrofuran t0 Retention time of mobile phase tp Retention time of analyte

5
Contents 1 Introduction .......................................................................................................................................... 6
2 Theory of hydrodynamic chromatography .......................................................................................... 8
3 Experimental ...................................................................................................................................... 10
3.1 Instrumentation .......................................................................................................................... 10
3.1.1 LC setup ............................................................................................................................... 10
3.1.2 LCxLC setup .......................................................................................................................... 10
3.2 Chemicals .................................................................................................................................... 10
3.3 Samples and buffer preparations................................................................................................ 11
3.3.1 t0 markers ............................................................................................................................ 11
3.3.2 HDC samples and buffer ...................................................................................................... 11
3.3.3 LA, GA and dye samples for RPLC ........................................................................................ 12
3.3.4 Preparation of the dye-filled nanoparticles ......................................................................... 12
3.4 HDC Methods .............................................................................................................................. 12
3.4.1. Separation range of HDC columns with different particle sizes ......................................... 12
3.4.2 HDC slalom effect with polystyrene standards ................................................................... 13
3.4.3 Influence of salt on the HDC separation of nanoparticles ................................................... 13
3.5 RPLC methods ............................................................................................................................. 13
3.5.1 Optimization of LA, GA and dye separation ........................................................................ 13
3.5.2 ACN concentration influence on LA retention ..................................................................... 13
3.6 LCxLC method .............................................................................................................................. 13
3.7 Data processing for HDC ............................................................................................................. 14
4 Results and Discussion........................................................................................................................ 15
4.1 Result of the HDC experiments ................................................................................................... 15
4.1.1 Influence of the size of packaging material on the separation range of HDC ..................... 15
4.1.2 Effect of flow rate on the HDC separation........................................................................... 17
4.1.3 Influence of salt concentration on HDC separation ............................................................ 18
4.3 RPLC ............................................................................................................................................. 20
4.3.1 Optimization of the separation of LA, GA and dyes ............................................................ 20
4.3.2 Influence of ACN on the retention of LA ............................................................................. 21
4.4 Important remarks about the LCxLC method ............................................................................. 22
5 Conclusions ......................................................................................................................................... 23
6 Acknowledgements ............................................................................................................................ 23
7 References .......................................................................................................................................... 23
6
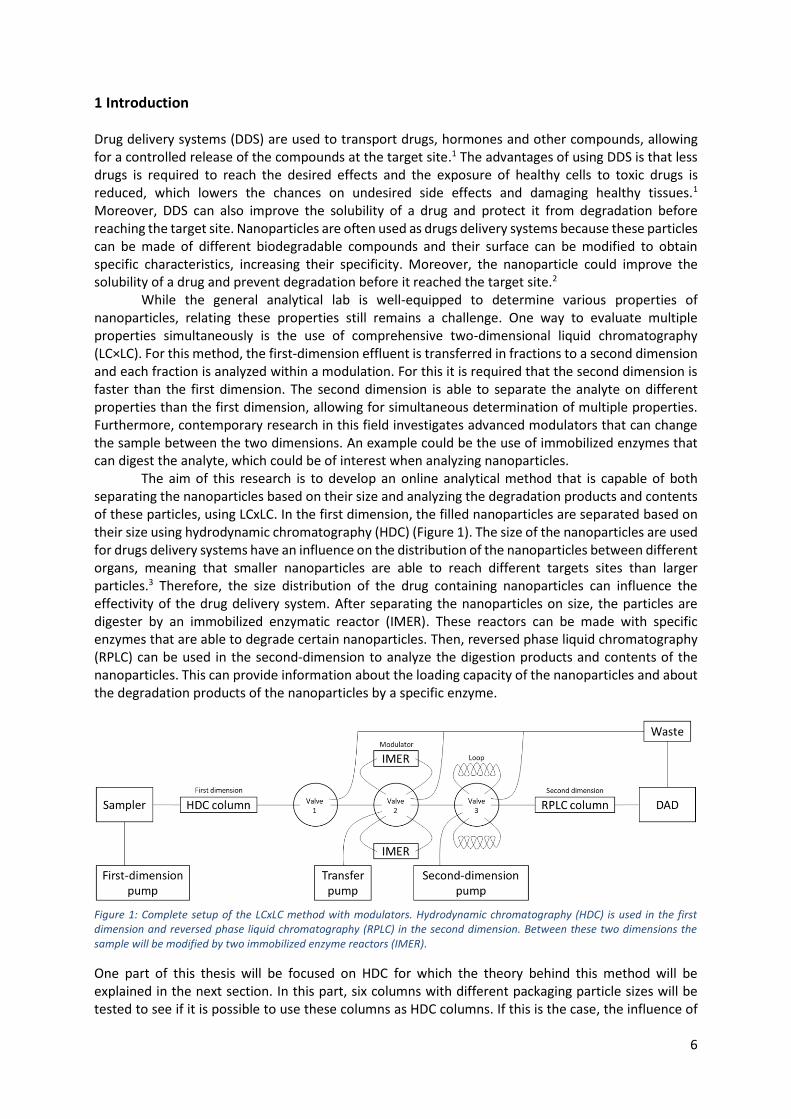
1 Introduction Drug delivery systems (DDS) are used to transport drugs, hormones and other compounds, allowing for a controlled release of the compounds at the target site.1 The advantages of using DDS is that less drugs is required to reach the desired effects and the exposure of healthy cells to toxic drugs is reduced, which lowers the chances on undesired side effects and damaging healthy tissues.1 Moreover, DDS can also improve the solubility of a drug and protect it from degradation before reaching the target site. Nanoparticles are often used as drugs delivery systems because these particles can be made of different biodegradable compounds and their surface can be modified to obtain specific characteristics, increasing their specificity. Moreover, the nanoparticle could improve the solubility of a drug and prevent degradation before it reached the target site.2 While the general analytical lab is well-equipped to determine various properties of nanoparticles, relating these properties still remains a challenge. One way to evaluate multiple properties simultaneously is the use of comprehensive two-dimensional liquid chromatography (LC×LC). For this method, the first-dimension effluent is transferred in fractions to a second dimension and each fraction is analyzed within a modulation. For this it is required that the second dimension is faster than the first dimension. The second dimension is able to separate the analyte on different properties than the first dimension, allowing for simultaneous determination of multiple properties. Furthermore, contemporary research in this field investigates advanced modulators that can change the sample between the two dimensions. An example could be the use of immobilized enzymes that can digest the analyte, which could be of interest when analyzing nanoparticles. The aim of this research is to develop an online analytical method that is capable of both separating the nanoparticles based on their size and analyzing the degradation products and contents of these particles, using LCxLC. In the first dimension, the filled nanoparticles are separated based on their size using hydrodynamic chromatography (HDC) (Figure 1). The size of the nanoparticles are used for drugs delivery systems have an influence on the distribution of the nanoparticles between different organs, meaning that smaller nanoparticles are able to reach different targets sites than larger particles.3 Therefore, the size distribution of the drug containing nanoparticles can influence the effectivity of the drug delivery system. After separating the nanoparticles on size, the particles are digester by an immobilized enzymatic reactor (IMER). These reactors can be made with specific enzymes that are able to degrade certain nanoparticles. Then, reversed phase liquid chromatography (RPLC) can be used in the second-dimension to analyze the digestion products and contents of the nanoparticles. This can provide information about the loading capacity of the nanoparticles and about the degradation products of the nanoparticles by a specific enzyme.
Figure 1: Complete setup of the LCxLC method with modulators. Hydrodynamic chromatography (HDC) is used in the first dimension and reversed phase liquid chromatography (RPLC) in the second dimension. Between these two dimensions the sample will be modified by two immobilized enzyme reactors (IMER) .
One part of this thesis will be focused on HDC for which the theory behind this method will be explained in the next section. In this part, six columns with different packaging particle sizes will be tested to see if it is possible to use these columns as HDC columns. If this is the case, the influence of
7
the size of the packaging material on the separation will be studied. This will be achieved by measuring calibration curves for the columns and investigating the influence of the flow rate on the retention of the standards. Furthermore, the effect of the salt concentration in the mobile phase on the hydrodynamic separation will be investigated to search for an alternative eluent for the first dimension. This research was preformed because the IMERs did not degrade the nanoparticles when a buffer that contained multiple salts and surfactants was used. Secondly, RPLC measurements were performed to optimize the separation of lactic acid (LA), glycolic acid (GA) and two hydrophobic dyes that will be used in the second dimension for the LCxLC method. Also, the influence of the acetonitrile (ACN) concentration on the retention of LA was studied, since it was expected that a higher ACN concentration would decrease the retention of LA. With these results, maximum volume percentage of ACN that can be injected in the second dimension was determined. Lastly, there will be an overview about certain conditions that are needed for the LCxLC method with modulators.
8
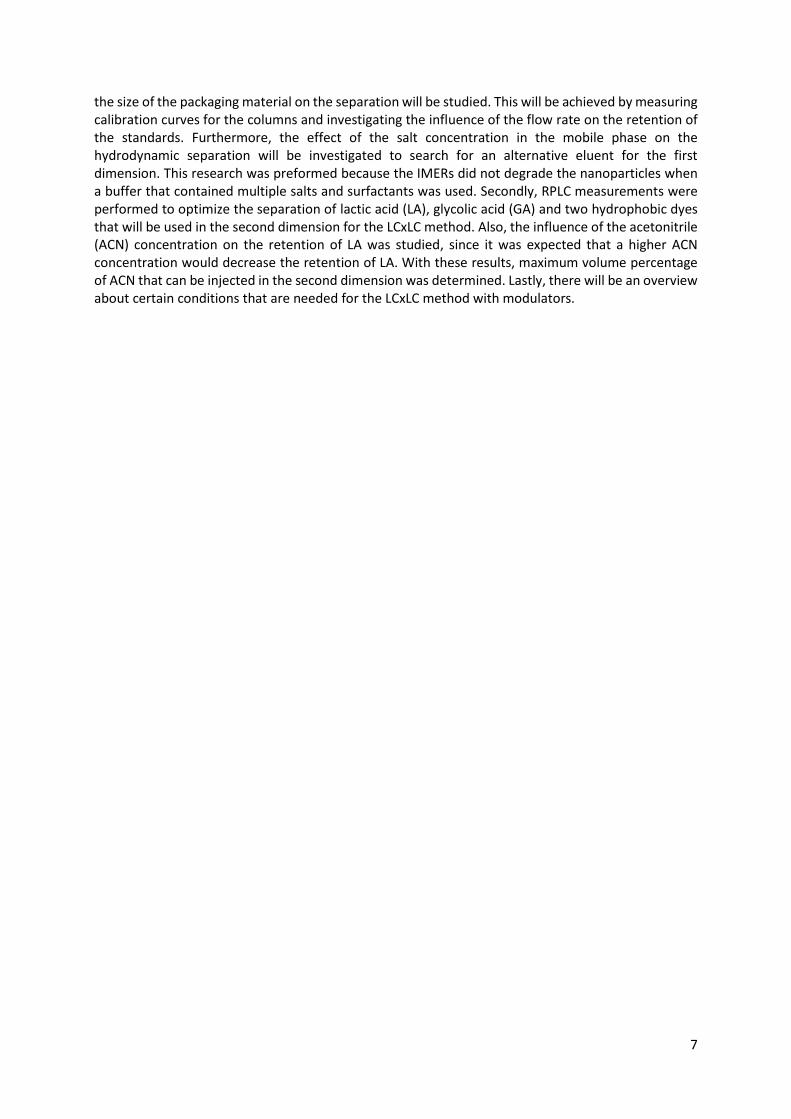
2 Theory of hydrodynamic chromatography HDC columns are packed with spherical particles that create a network of intraparticle pores and the separation in HDC is based on the difference in average flow rate for the analytes and not on the interaction between the analyte and the stationary phase.4,5 The difference in average flow rate is caused by the parabolic or Poiseuille flow profile between the stationary phase particles, for which the slowest flow rate is near the wall and highest flow rate is in the middle of the pores. The center of mass of the smaller analytes can access both the slower flow rates closer and the faster flow rate close to the center of the pores, while the center of mass of larger particles can only access the latter. This results in a slower average velocity for the smaller particles and a faster average velocity for the larger particles, which causes the difference in retention (figure 2). The larger particles will elute first and then the smaller particles will elute, which is also the reason that the mobile phase peak in HDC has the most retention compared to other analytical methods in which the mobile phase peak elutes first.
Figure 2: HDC separation mechanism with the larger particles eluting first due to the faster average linear velocity than the smaller nanoparticles, which is caused by the Poiseuille flow pattern. Left is the mixture of the particles that just entered the column and right displays the separation of the particles according to their size at the end of the column. The orange particle displays the rotation of a particle due to the Poiseuille flow pattern.
Effects that can influence the range of separation of a column is both the particle size and the ionic strength of the mobile phase.5,6 The ionic strength has an influence on the electrostatic interactions between the analyte and the stationary phase.5 When the ionic strength of the solvent is decreased, the thickness of the ionic double layer that is formed around the analyte and stationary phase increases, causing the analyte to be repelled from the stationary phase. This narrows the intraparticle pores through which the analyte can travel, increasing the average velocity of the analyte, since it is pushed in the faster streamlines of the solvent. The retention time of analytes can be expressed in the dimensionless parameter τ, which is the retention time of the analyte (tp) divided by the retention time of the mobile phase (t0).4,6 This parameter can also be written as a function of the variable λ and a constant C. When the constant C is equal to 1, the model is only based on the separation of the particles by the Poiseuille flow pattern and for higher C values, other effects are also considered that could influence the retention of the analytes. According to the works of Striegel et al. and Tijssen et al., the C term takes the analyte permeability and the rotation of the particles under Poiseuille flow into account.4,6 The rotation of the particles is caused by the difference in flow rate for the particle toward the outside and inside of the Poiseuille flow pattern (Figure 2, orange particle). Also, two values for C are given that are not dependent on a different variable, one is used for polymers in good solvents and the other for hard spheres the values are 2.698 and 4.89 respectively. Another model for the determination for the C value was found in the work of Stegeman et al., which related a low value of λ to a low value for the C term.7 In this case the C term is described as a factor that considers the slip velocity of the particles as a factor that has an influence on the retention. The slip velocity described as the delay between the velocity of the center of mass and the eluent velocity.
τ =tp
t0= (1 + 2λ − Cλ2)−1 (1)
The dimensionless parameter λ is the ratio between the effective radius of the particle and the hydraulic radius for a packed bed (Rh). According to the theory the lower limit of separation is reached
9
when the λ values are equal or lower than 0.02.4,6 This is due to the small difference in the effective radius of the analyte and the hydraulic radius, which causes the analyte to elute with the same retention as the mobile phase.4,8 The effective diameter of polystyrene standards can also be calculated with equation 2 by using the molecular weight (Mw) and the constants a = 1,23*10-5 and b = 0.588 for polystyrene in tetrahydrofuran (2).8,9
λ =𝑅𝑒𝑓𝑓
Rh=
a𝑀𝑤𝑏
Rh=
1,23⋅10−5⋅𝑀𝑤0.588
Rh (2)
The hydraulic radius can be calculated from the particle size of the stationary phase (dp) and the porosity (ε). 4,6 The diameter of the packaging material for the column is often given and the porosity of a column can be calculated (4). In the equation for calculating the porosity the F is the flow rate (ml/min), t0 is the retention time of the mobile phase (min), d is the diameter of the column (mm) and L is the length of the column (mm).
𝑅ℎ =ⅆ𝑝
3
𝜀
1−𝜀 (3)
ε =4Ft0
πⅆ2L (4)
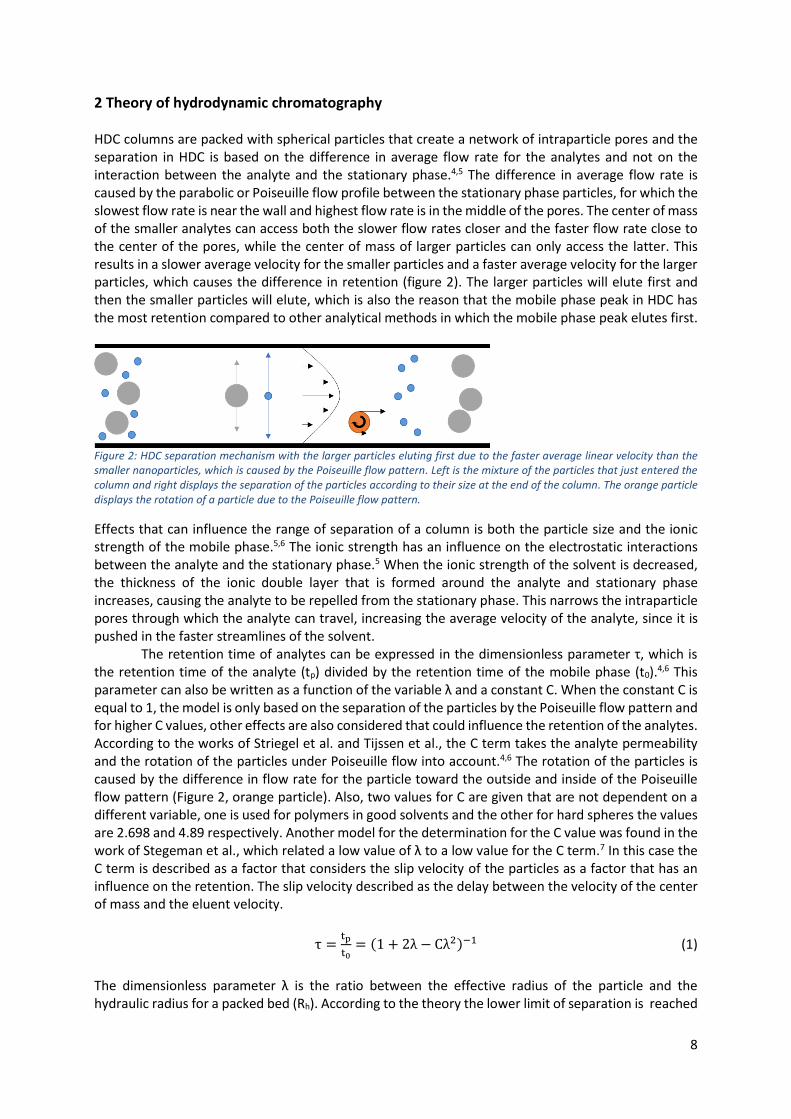
Since there is a lower limit of separation that is related to a λ value of 0.02, there should also be an upper limit of separation. However, this is not related to a λ value, but to the deformation of the polystyrene standards that are caused by shear forces, which is also called slalom chromatography (SC).10,11 This can be influenced by the flow rate because a higher flow rate induces more shearing forces due to a faster laminar flow. These shearing forces deform the large spherical polymer particles and elongates them, making it harder for the particles to pass through the channels and increasing their retention time (figure 3). Therefore, the upper limit of separation for polymers is dependent on the flow rate.
Figure 3: Transition between hydrodynamic chromatography (HDC) and slalom chromatography (SC). The different lines represent the variating retention of the analyte measured with different flow rates. The green line, which does not show any signs of SC, has the lowest flow rate and the blue line the highest flow rate.
10
3 Experimental
3.1 Instrumentation
3.1.1 LC setup For the HDC measurements a degasser (DGU-20Asmall5), a mixer (FCV-10AL), a pump (LC-10AD), a UV-VIS detector (SPD-10A) and a controller (CBM-20A) from Shimadzu where used. The software that was used was Shimadzu LC solutions version 1.21 SP1 and the total extra column volume was approximately 10.1 µL. The used columns for this setup where the HDC test columns and the RPLC column, which are listed in table 1.
3.1.2 LCxLC setup For the 2D-LC setup two binary pumps (G4220A), a sampler (G4226A), two thermostatted column compartments with an 8-port valve (G1316C) and a diode array detector (G4212A) with an Agilent flow cell (G4212-60008, 10mm, V=1 µL) from the Agilent 1290 infinity series, an iso pump (G1310A) from the Agilent 1200 series and a column compartment with a 6-port valve (G1316A) from Hewlett Packard series 1100 where used. The used software for controlling the system was Agilent OpenLAB CDS ChemStation Edition Rev. C.01.04 [35] and the injector was set to a draw and injection speed of 200 μL/min. The columns that were used for this setup were the HDC test column in the first dimension and the RPLC column for the second dimension with an extra column volume of approximately 15.3 μL (table 1) and two lipase IMERs. Table 1: List of used columns with additional information.
Column name Manufacturer P/No. S/No. Dimensions (mm)
Particle size (um)
Pore size (A)
Material
HDC test column 1 Phenomenex 00F-BETA-E0-A 81376 150 × 4.6 1.9 Silica
HDC test column 2 Phenomenex 00F-BETA-E0-A 81367 150 × 4.6 3.1 Silica
HDC test column 3 Phenomenex 00F-BETA-E0-A 81498 150 × 4.6 3.5 Silica
HDC test column 4 Phenomenex 00F-BETA-E0-A 81378 150 × 4.6 5.1 Silica
HDC test column 5 Phenomenex 00F-BETA-E0-A 81379 150 × 4.6 6.5 Silica
HDC test column 6 Phenomenex 00F-BETA-E0-A 81494 150 × 4.6 8.7 Silica
RPLC column Phenomenex 00F-4462-AN 659285-3 150 × 2.1 2.6 100 Silica C18
3.2 Chemicals Tetrahydrofuran (unstabilized) (THF, HPLC grade), toluene (AR grade) and acetonitrile (ACN, LC-MS grade) were obtained from Biosolve BV (Valkenswaard, the Netherlands). Acetone (AR grade) was obtained from Klinipath BV (Duiven, the Netherlands). Sodium nitrate (>99.0%, SigmaUltra, CAS #: 7631-99-4), Sodium azide (≥99,5%, CAS #: 26628-22-8), poly (D,L-lactide-co-glycolide)-block-poly (ethylene glycol)-block-poly (D,L-lactide-co-glycolide) based poly (ether ester urethane) (PLGA-PEG-PLGA, average molecular weight 6000-12000), potassium phosphate monobasic (≥99.0%, CAS #: 7778-77-0), Sodium lauryl sulfate (≥98.5%, CAS #: 151-21-3), Brij® L23 solution (30% (w/v) in H2O, CAS #: 9002-92-0), Nile red (technical grade, CAS #: 7385-76-3), Sudan I (~97%, CAS #: 842-07-9), DL-lactic acid (LA, ~90%, CAS #: 50-21-5), glycolic acid (GA, ≥99.0%, CAS #: 79-14-1) were obtained from Sigma-Aldrich (Darmstadt, Germany). Thiourea (≥99.0%, CAS #: 62-56-6) and Sodium dihydrogen ortho phosphate (CAS #: 10049-21-5) were obtained from Merck KGaA (Darmstadt, Germany) and for making the aqueous solutions and diluting samples deionized water was used (Arium 611UV, Satorius, Germany, R=18.2 MΩ cm). The NanosphereTM size standards were from ThermoFisher ScientificTM (catalogue #: 3030A (30 nm), 3050A (50 nm), 3100A (100 nm), 3220A (220 nm)) and nanoparticles with a size of 40 nm and 350 nm were provided by DSM. The nanoparticles were used for both the calibration curve for the first dimension of the 2D-LC setup and for investigating the influence of the
11
salt concentration in the aqueous buffer on the HDC separation. The polystyrene (PS) standards were from the Polymer Laboratories (currently Agilent Technologies, Church Stretton, Shropshire, UK) and were used for determining the separation range of the HDC test columns from Phenomenex.
3.3 Samples and buffer preparations
3.3.1 t0 markers Two to markers were used for all experiments. For the experiment that used THF as a mobile phase, a toluene marker was used, which was prepared by combining 5 μL of toluene with 995 μL THF. For the other experiments a solution of 250 ppm thiourea in water was used as a t0 marker.
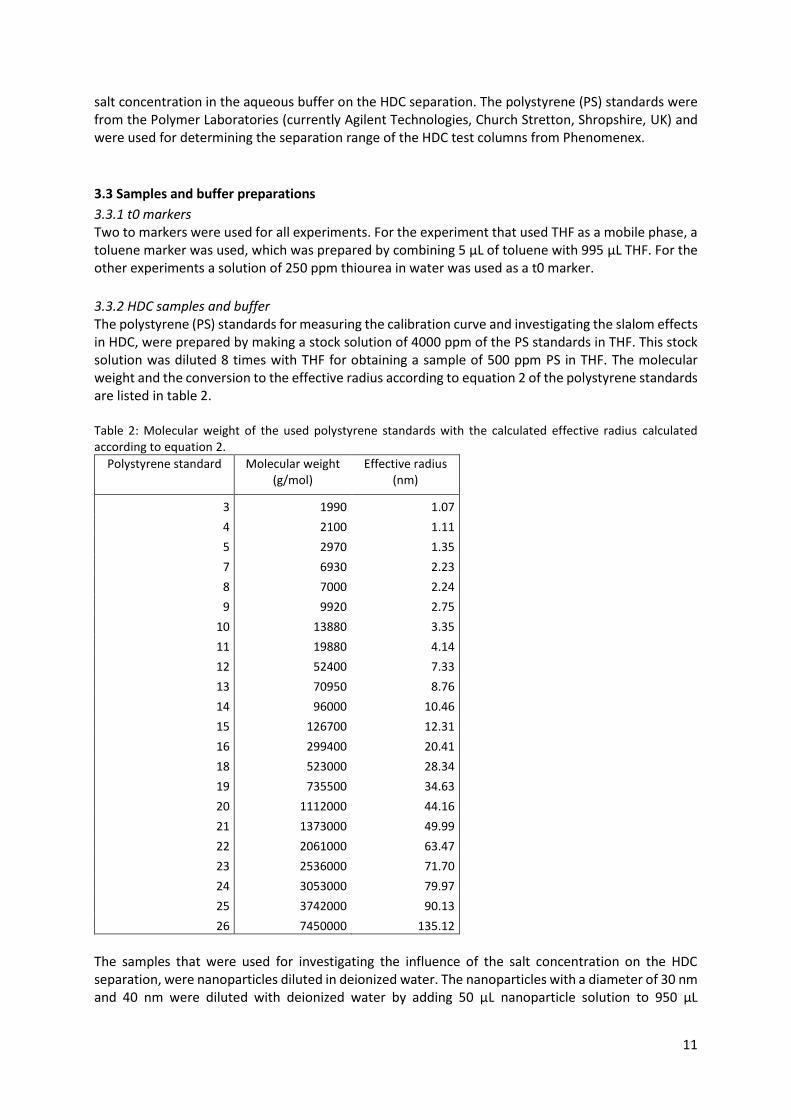
3.3.2 HDC samples and buffer The polystyrene (PS) standards for measuring the calibration curve and investigating the slalom effects in HDC, were prepared by making a stock solution of 4000 ppm of the PS standards in THF. This stock solution was diluted 8 times with THF for obtaining a sample of 500 ppm PS in THF. The molecular weight and the conversion to the effective radius according to equation 2 of the polystyrene standards are listed in table 2. Table 2: Molecular weight of the used polystyrene standards with the calculated effective radius calculated according to equation 2.
Polystyrene standard Molecular weight (g/mol)
Effective radius (nm)
3 1990 1.07
4 2100 1.11
5 2970 1.35
7 6930 2.23
8 7000 2.24
9 9920 2.75
10 13880 3.35
11 19880 4.14
12 52400 7.33
13 70950 8.76
14 96000 10.46
15 126700 12.31
16 299400 20.41
18 523000 28.34
19 735500 34.63
20 1112000 44.16
21 1373000 49.99
22 2061000 63.47
23 2536000 71.70
24 3053000 79.97
25 3742000 90.13
26 7450000 135.12
The samples that were used for investigating the influence of the salt concentration on the HDC separation, were nanoparticles diluted in deionized water. The nanoparticles with a diameter of 30 nm and 40 nm were diluted with deionized water by adding 50 μL nanoparticle solution to 950 μL
12
deionized water. For the nanoparticles with a size of 50 nm, 100 nm, 220 nm and 350 nm, 10 μL of nanoparticle solution was added to 990 μL deionized water.
The HDC buffer concentrate was prepared by adding 134 mL of Brij® L23 solution to 867 mL deionized water. Next, while stirring slowly, 6.2 g sodium di hydrogen orthophosphate was added. Then, after the sodium di hydrogen ortho phosphate was completely dissolved, 4.0 g of sodium azide was added and after that was dissolved 10 g of sodium lauryl sulfate was added. Finally, before use, the HDC buffer concentrate was diluted 20 times with deionized water.
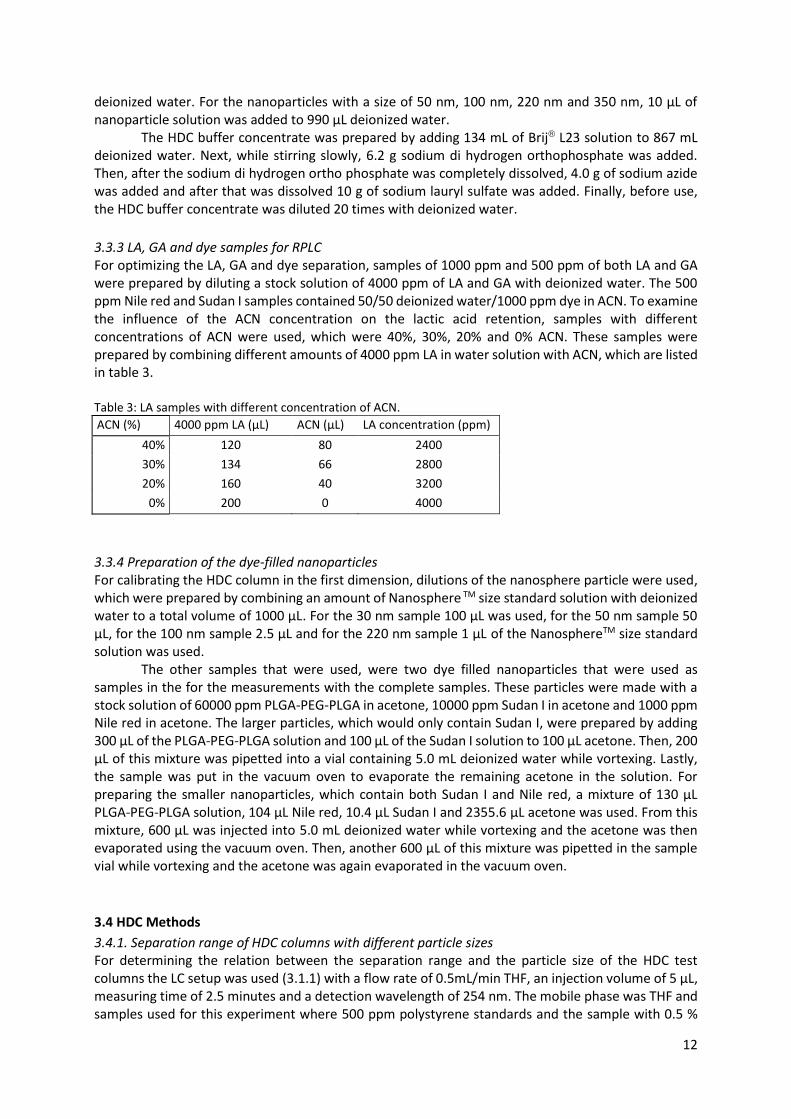
3.3.3 LA, GA and dye samples for RPLC For optimizing the LA, GA and dye separation, samples of 1000 ppm and 500 ppm of both LA and GA were prepared by diluting a stock solution of 4000 ppm of LA and GA with deionized water. The 500 ppm Nile red and Sudan I samples contained 50/50 deionized water/1000 ppm dye in ACN. To examine the influence of the ACN concentration on the lactic acid retention, samples with different concentrations of ACN were used, which were 40%, 30%, 20% and 0% ACN. These samples were prepared by combining different amounts of 4000 ppm LA in water solution with ACN, which are listed in table 3. Table 3: LA samples with different concentration of ACN.
ACN (%) 4000 ppm LA (μL) ACN (μL) LA concentration (ppm)
40% 120 80 2400
30% 134 66 2800
20% 160 40 3200
0% 200 0 4000
3.3.4 Preparation of the dye-filled nanoparticles For calibrating the HDC column in the first dimension, dilutions of the nanosphere particle were used, which were prepared by combining an amount of Nanosphere TM size standard solution with deionized water to a total volume of 1000 μL. For the 30 nm sample 100 μL was used, for the 50 nm sample 50 μL, for the 100 nm sample 2.5 μL and for the 220 nm sample 1 μL of the NanosphereTM size standard solution was used. The other samples that were used, were two dye filled nanoparticles that were used as samples in the for the measurements with the complete samples. These particles were made with a stock solution of 60000 ppm PLGA-PEG-PLGA in acetone, 10000 ppm Sudan I in acetone and 1000 ppm Nile red in acetone. The larger particles, which would only contain Sudan I, were prepared by adding 300 μL of the PLGA-PEG-PLGA solution and 100 μL of the Sudan I solution to 100 μL acetone. Then, 200 μL of this mixture was pipetted into a vial containing 5.0 mL deionized water while vortexing. Lastly, the sample was put in the vacuum oven to evaporate the remaining acetone in the solution. For preparing the smaller nanoparticles, which contain both Sudan I and Nile red, a mixture of 130 μL PLGA-PEG-PLGA solution, 104 μL Nile red, 10.4 μL Sudan I and 2355.6 μL acetone was used. From this mixture, 600 μL was injected into 5.0 mL deionized water while vortexing and the acetone was then evaporated using the vacuum oven. Then, another 600 μL of this mixture was pipetted in the sample vial while vortexing and the acetone was again evaporated in the vacuum oven.
3.4 HDC Methods
3.4.1. Separation range of HDC columns with different particle sizes For determining the relation between the separation range and the particle size of the HDC test columns the LC setup was used (3.1.1) with a flow rate of 0.5mL/min THF, an injection volume of 5 μL, measuring time of 2.5 minutes and a detection wavelength of 254 nm. The mobile phase was THF and samples used for this experiment where 500 ppm polystyrene standards and the sample with 0.5 %
13
toluene in THF for determining the t0, which were all measured once for each of the HDC test columns (table 1).
3.4.2 HDC slalom effect with polystyrene standards For determining if HDC with polystyrene standards also showed slalom effects, the same method was used as for determining the calibration curves (3.3.1.1) except for the and flow rate, which were 1.0 mL/min, 0.5 mL/min and 0.25 mL/min for this experiment. For this method the toluene sample and 500 ppm polystyrene standards 16,18,19,20,21,22,23,24 and 25 were used (table 2) and these samples were all measured once with each flow rate with the HDC test column 1 was used (table 1).
3.4.3 Influence of salt on the HDC separation of nanoparticles For investigating the influence of the salt concentration, the LC setup was used with a flow rate of 0.5 mL/min with deionized water, HDC buffer and different aqueous mobile phases with sodium nitrate concentrations of 2 mM, 0.5 mM, 0.25 mM, 0.125 mM, 0.050 mM and 0.010 mM. The injection volume was 5 µl and the detection wavelength of 254 nm. The nanoparticle samples with a diameter of 350 nm, 220 nm and 100 nm were measured with all mobile phases, the nanoparticles with a diameter of 50nm, 40nm and 30 nm were measured with deionized water, 2 mM and 0.5 mM sodium nitrate and HDC buffer and the 30 nm and 40 nm were also measured with the 0.25 mM and 0.125 mM sodium nitrate mobile phase.
3.5 RPLC methods
3.5.1 Optimization of LA, GA and dye separation For optimizing the separation of LA, GA, Nile red and Sudan I, the LC setup was used with a flow rate of 0.3 mL/min and an injection volume of 5 μL. The mobile phases were different aqueous solvents or deionized water(A) and ACN (B). The mobile phase composition during the run started isocratic from 0.0 to 0.7 minutes with 97/3 A/B. Then there was a linear gradient from 0.7 to 1.2 minutes that ended with a composition of 3/97 A/B, which was followed by an isocratic 3/97 A/B from 1.2 to 7.5 minutes. Lastly, there was an isocratic flow with the composition of 97/3 A/B from 7.51 to 9.5 minutes. The samples that were measured with this method were the 1000 and 500 ppm LA and GA samples, the 500 ppm Nile red and Sudan I samples and a t0 marker. The LA and GA samples were measured with a wavelength of 210 nm, the dye samples were measured with a wavelength of 475 and 550 nm.
3.5.2 ACN concentration influence on LA retention For investigating the influence of the ACN concentration on the retention of LA, an isocratic method was used with a mobile phase composition of 97% deionized water with 3 % ACN. In this case the LC setup was also used with an injection volume of 5 μL, a flow rate of 0.3 mL/min and a detection wavelength of 210 nm. The samples that were measured were the samples of LA with different concentrations of ACN that are listed in table 3 and the t0 marker. To compare the separation between the LA and GA the measurement with 1000 ppm GA of the experiment for optimizing the LA, GA and dye separation was used.
3.6 LCxLC method The autosampler was set to inject a volume of and the first-dimension binary pump started with a flow rate of 60 µL/min deionized water for the first 6.3 minutes. Then the flow was reduced to 10 μL/min with a gradient within 0.1 minutes and this flow rate was maintained until the end of the run. The first valve was set to switch only once at 6.4 minutes from the connection of the HDC column with the waste to the connection with the IMERs. The second-dimension valve was set to switch every 1.5 minutes starting from 6.4 minutes and the transfer pump, which was the isocratic pump, was set to a flow rate of 20 μL/min with 80% ACN and 20% deionized water. The third valve was also set to switch
14
every 1.5 minutes and the second-dimension binary pump was set to a flow rate of 0.6 mL/min with a gradient for each modulation of deionized water (A) and ACN (B). For the first 0.2 minutes the mobile phase composition was 100/0 A/B and then a gradient was applied from 0.2 to 0.7 minutes that adjusted the composition from 100/0 to 0/100 A/B. This composition was kept for 1.2 minutes and then until 1.5 minutes the mobile phase composition was 100/0 A/B. The injection volume for the second dimension is the same as the size of the loops that were used, which is 40 μL. The detection wavelengths were 210 nm, 254 nm, 475 nm and 550 nm.
3.7 Data processing for HDC For all HDC results, the time scale is converted to τ by dividing the retention time of the t0 marker by the retention time of the samples and the Rh was calculated with equation 3. For the y-axis the molecular weight of the polystyrene standards is either converted to the log of the molecular weight or to lambda according to equation 2 and these values were plotted with a logarithmic scale. To determine the C value in equation 1 for each column, the excel solver was used with the GRG nonlinear method. The solver was used to minimalize the sum of the total difference between the measured and the theoretical τ value, which was calculated with equation 1, by adjusting the C value that had an initial guess of C=1.
15
4 Results and Discussion
4.1 Result of the HDC experiments
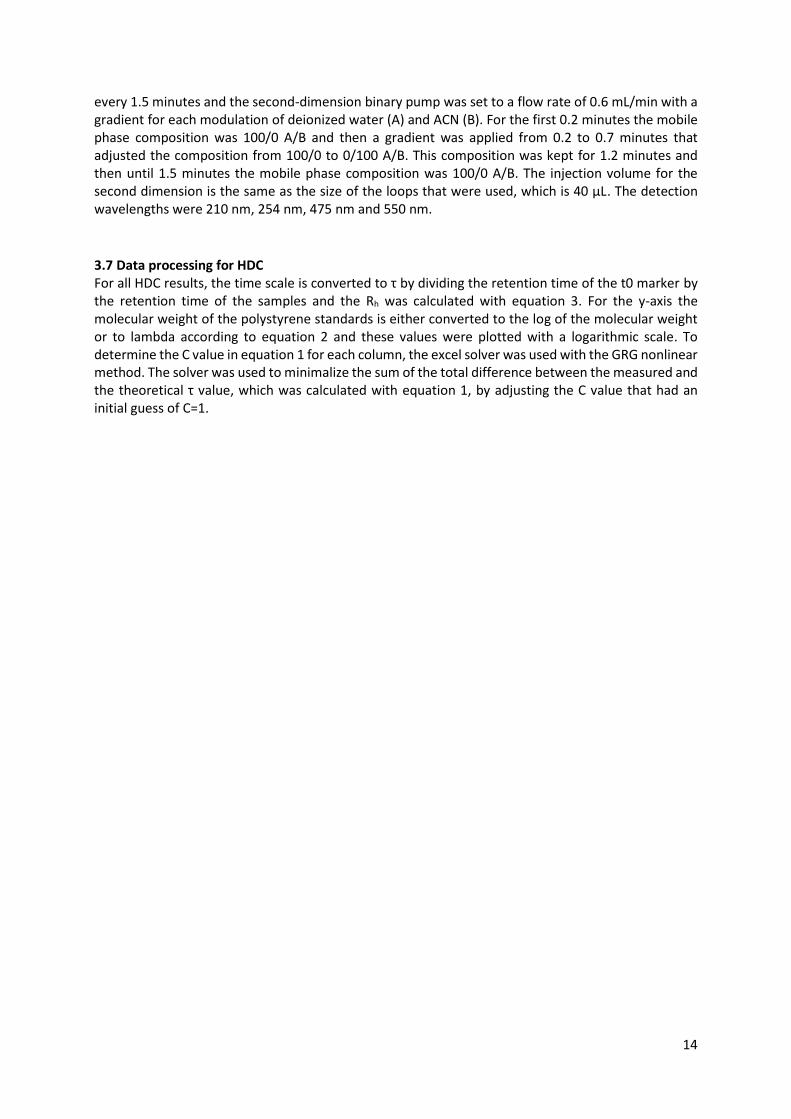
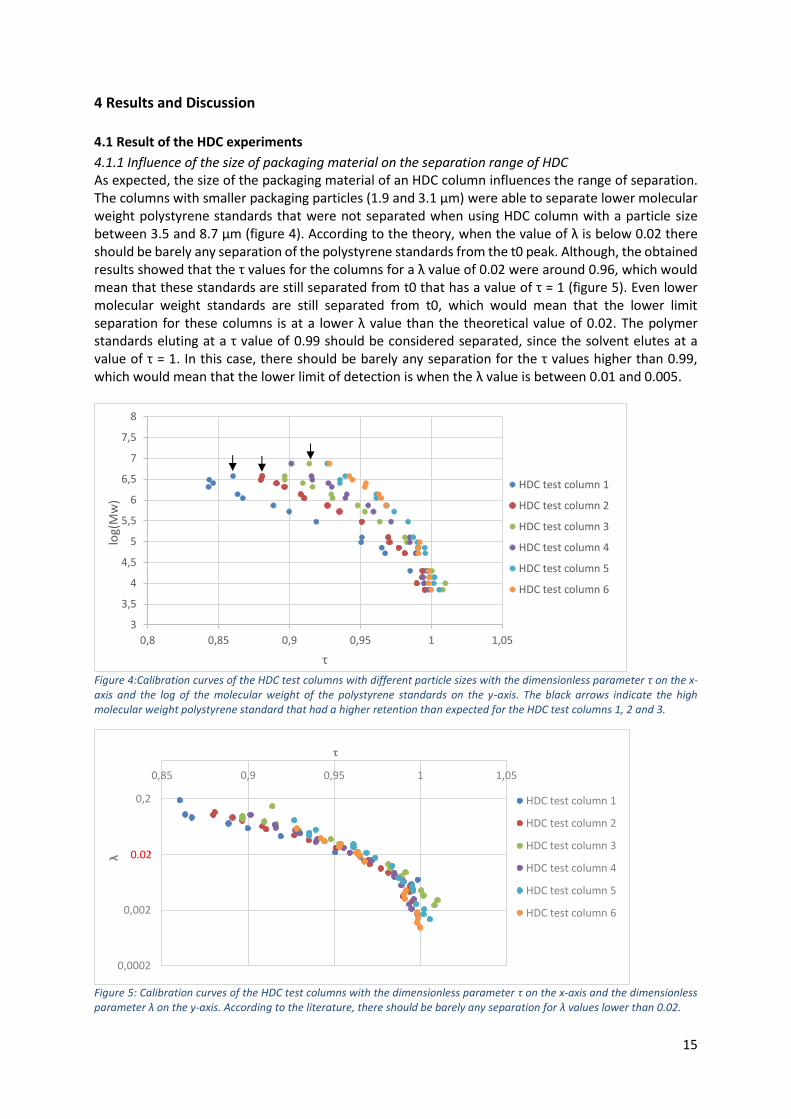
4.1.1 Influence of the size of packaging material on the separation range of HDC As expected, the size of the packaging material of an HDC column influences the range of separation. The columns with smaller packaging particles (1.9 and 3.1 µm) were able to separate lower molecular weight polystyrene standards that were not separated when using HDC column with a particle size between 3.5 and 8.7 µm (figure 4). According to the theory, when the value of λ is below 0.02 there should be barely any separation of the polystyrene standards from the t0 peak. Although, the obtained results showed that the τ values for the columns for a λ value of 0.02 were around 0.96, which would mean that these standards are still separated from t0 that has a value of τ = 1 (figure 5). Even lower molecular weight standards are still separated from t0, which would mean that the lower limit separation for these columns is at a lower λ value than the theoretical value of 0.02. The polymer standards eluting at a τ value of 0.99 should be considered separated, since the solvent elutes at a value of τ = 1. In this case, there should be barely any separation for the τ values higher than 0.99, which would mean that the lower limit of detection is when the λ value is between 0.01 and 0.005.
Figure 4:Calibration curves of the HDC test columns with different particle sizes with the dimensionless parameter τ on the x-axis and the log of the molecular weight of the polystyrene standards on the y-axis. The black arrows indicate the high molecular weight polystyrene standard that had a higher retention than expected for the HDC test columns 1, 2 and 3.
Figure 5: Calibration curves of the HDC test columns with the dimensionless parameter τ on the x-axis and the dimensionless parameter λ on the y-axis. According to the literature, there should be barely any separation for λ values lower than 0.02.
3
3,5
4
4,5
5
5,5
6
6,5
7
7,5
8
0,8 0,85 0,9 0,95 1 1,05
log(
Mw
)
τ
HDC test column 1
HDC test column 2
HDC test column 3
HDC test column 4
HDC test column 5
HDC test column 6
0,0002
0,002
0,02
0,2
0,85 0,9 0,95 1 1,05
λ
τ
HDC test column 1
HDC test column 2
HDC test column 3
HDC test column 4
HDC test column 5
HDC test column 6
0.02

16
However, the upper limit of separation could not be determined from this data. This was not possible for the HDC test columns 4, 5 and 6 due to the lack of higher molecular weight polystyrene standards and for the HDC test columns 1, 2 and 3 the retention for the high molecular weight polystyrene standard increased at a certain point (figure 4, black arrows). It was expected that this effect could be caused by slalom chromatography and to confirm this the influence of the flow rate on the retention was studied and the results will be discussed in the next section. Besides the separation range, the factor C in equation 1 has also been investigated for the HDC test columns. The results showed that the C value increased with increasing particle size and hydraulic radius (Table 4). However, this was not what the theory from the work of Stegeman et all. Predicted, which was that lower values of λ would give a lower C value.7 Since the results show that the λ values for the polymer standards decrease with increasing particle size of the packaging, which is because the Rh increases with larger particles and it is inversely proportional to λ (equation 2), and the C term is increasing. This theoretical relation between C and λ also seems unlikely, because λ has a different value for every polymer standard for each column since its related to the effective diameter of the polymer standard and the hydraulic radius (equation 2). If this is the case, it would mean that the C term will also have a different value for each polymer standard and then, C will no longer be a constant anymore in equation 1 to calculate τ. Also, the other theory from Striegel et al. and Tijssen et al. gave a general value for calibration curves that were measured with polymers in a good solvent, which was 2.698.4,6 Even the column with a particle size of 1.9 µm had a C value of 5.4 under these conditions. Also, if the C term is related to the rotation of the particles under the Poiseuille flow profile, it would mean that the rotation would increase when the particle size of the column increases. Whether this is true or not could be confirmed by simulating the flow profiles for packed columns with different particle sizes. Another reason for the increasing C values could be that the C term compensates for the decrease in λ due to the increasing Rh for increasing packaging size. This was considered because the theoretical τ was only dependent on C and λ and it would make sense that when λ is five times smaller for the column with a particle size of 8.7 µm than the column with 1.9 µm particles that C will increase so the model will still fit the calibration curves (equation 1). However, these results show that the particle size of a column has an influence on the C term that is not considered in the models provided by the literature and the cause of this should be investigated further. Table 4: HDC test columns with their packaging particle sizes and calculated C values and hydraulic radii.
column dp (µm) C Rh
HDC test column 1 1.9 5.40 0.24
HDC test column 2 3.1 6.86 0.78
HDC test column 3 3.5 8.79 0.92
HDC test column 4 5.1 8.94 1.32
HDC test column 5 6.5 14.09 1.63
HDC test column 6 8.7 18.27 2.32
17
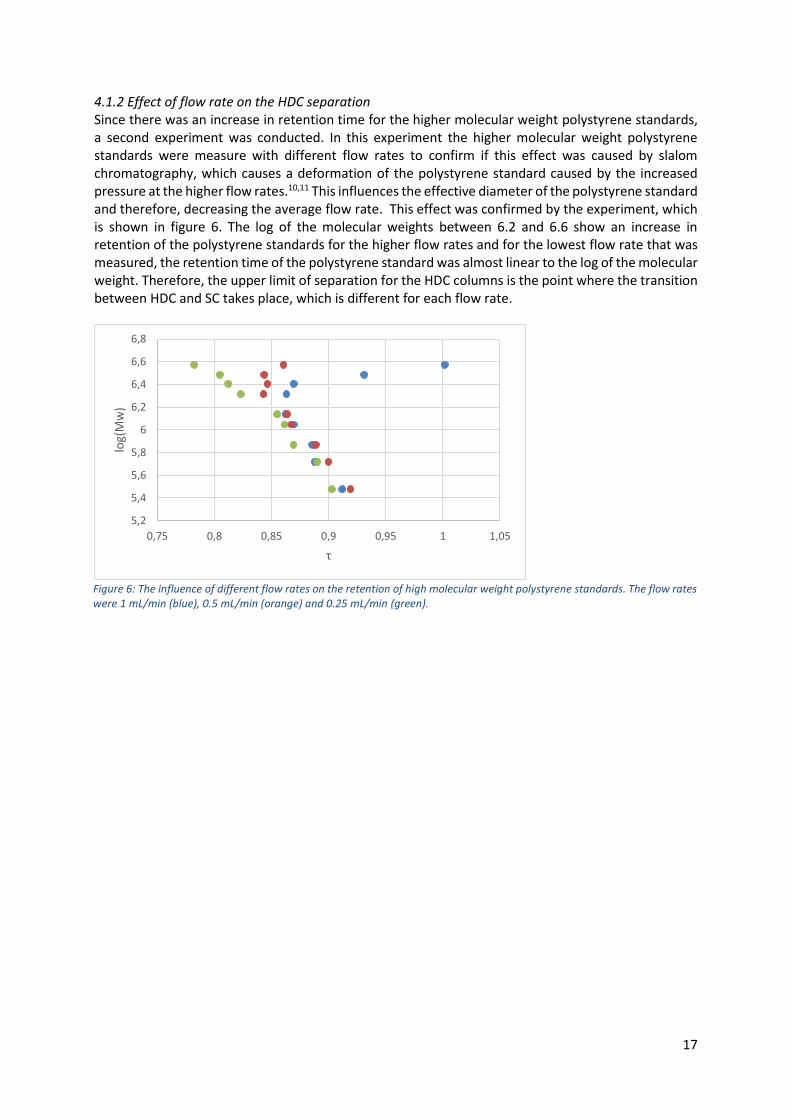
4.1.2 Effect of flow rate on the HDC separation Since there was an increase in retention time for the higher molecular weight polystyrene standards, a second experiment was conducted. In this experiment the higher molecular weight polystyrene standards were measure with different flow rates to confirm if this effect was caused by slalom chromatography, which causes a deformation of the polystyrene standard caused by the increased pressure at the higher flow rates.10,11 This influences the effective diameter of the polystyrene standard and therefore, decreasing the average flow rate. This effect was confirmed by the experiment, which is shown in figure 6. The log of the molecular weights between 6.2 and 6.6 show an increase in retention of the polystyrene standards for the higher flow rates and for the lowest flow rate that was measured, the retention time of the polystyrene standard was almost linear to the log of the molecular weight. Therefore, the upper limit of separation for the HDC columns is the point where the transition between HDC and SC takes place, which is different for each flow rate.
5,2
5,4
5,6
5,8
6
6,2
6,4
6,6
6,8
0,75 0,8 0,85 0,9 0,95 1 1,05
log(
Mw
)
τ
Figure 6: The influence of different flow rates on the retention of high molecular weight polystyrene standards. The flow rates were 1 mL/min (blue), 0.5 mL/min (orange) and 0.25 mL/min (green).
18
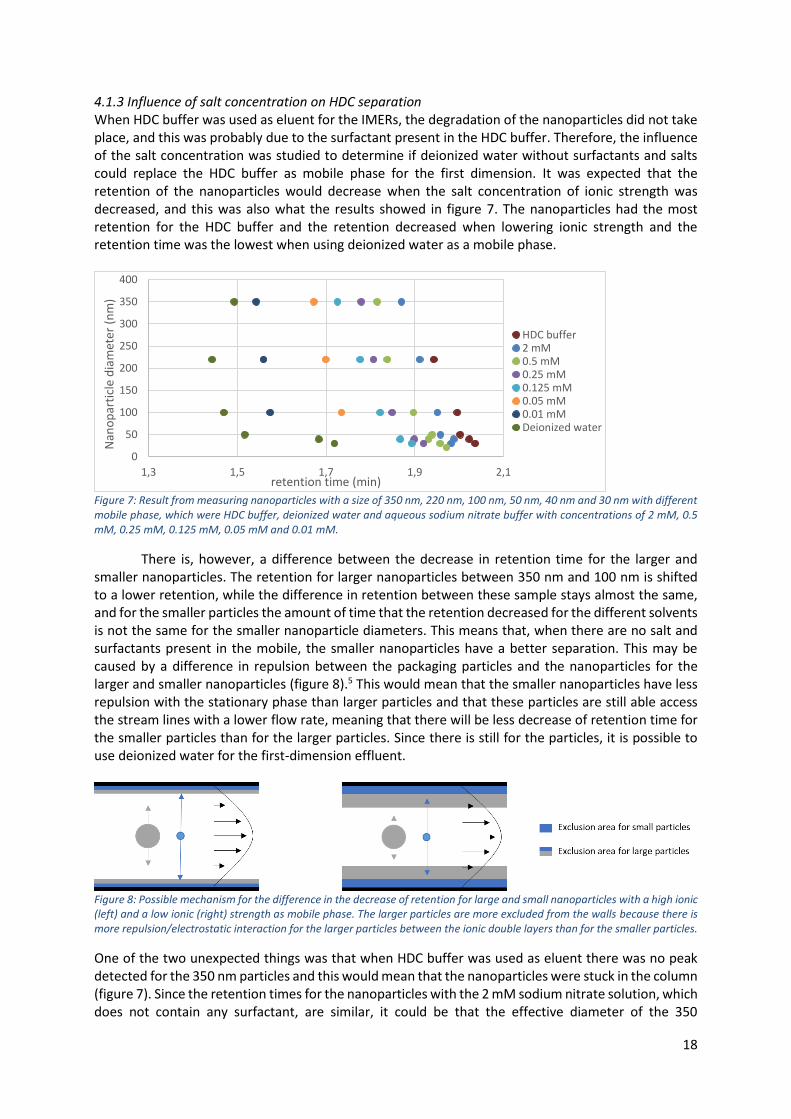
4.1.3 Influence of salt concentration on HDC separation When HDC buffer was used as eluent for the IMERs, the degradation of the nanoparticles did not take place, and this was probably due to the surfactant present in the HDC buffer. Therefore, the influence of the salt concentration was studied to determine if deionized water without surfactants and salts could replace the HDC buffer as mobile phase for the first dimension. It was expected that the retention of the nanoparticles would decrease when the salt concentration of ionic strength was decreased, and this was also what the results showed in figure 7. The nanoparticles had the most retention for the HDC buffer and the retention decreased when lowering ionic strength and the retention time was the lowest when using deionized water as a mobile phase.
Figure 7: Result from measuring nanoparticles with a size of 350 nm, 220 nm, 100 nm, 50 nm, 40 nm and 30 nm with different mobile phase, which were HDC buffer, deionized water and aqueous sodium nitrate buffer with concentrations of 2 mM, 0.5 mM, 0.25 mM, 0.125 mM, 0.05 mM and 0.01 mM.
There is, however, a difference between the decrease in retention time for the larger and smaller nanoparticles. The retention for larger nanoparticles between 350 nm and 100 nm is shifted to a lower retention, while the difference in retention between these sample stays almost the same, and for the smaller particles the amount of time that the retention decreased for the different solvents is not the same for the smaller nanoparticle diameters. This means that, when there are no salt and surfactants present in the mobile, the smaller nanoparticles have a better separation. This may be caused by a difference in repulsion between the packaging particles and the nanoparticles for the larger and smaller nanoparticles (figure 8).5 This would mean that the smaller nanoparticles have less repulsion with the stationary phase than larger particles and that these particles are still able access the stream lines with a lower flow rate, meaning that there will be less decrease of retention time for the smaller particles than for the larger particles. Since there is still for the particles, it is possible to use deionized water for the first-dimension effluent.
Figure 8: Possible mechanism for the difference in the decrease of retention for large and small nanoparticles with a high ionic (left) and a low ionic (right) strength as mobile phase. The larger particles are more excluded from the walls because there is more repulsion/electrostatic interaction for the larger particles between the ionic double layers than for the smaller particles.
One of the two unexpected things was that when HDC buffer was used as eluent there was no peak detected for the 350 nm particles and this would mean that the nanoparticles were stuck in the column (figure 7). Since the retention times for the nanoparticles with the 2 mM sodium nitrate solution, which does not contain any surfactant, are similar, it could be that the effective diameter of the 350
0
50
100
150
200
250
300
350
400
1,3 1,5 1,7 1,9 2,1
Nan
op
arti
cle
dia
met
er (
nm
)
retention time (min)
HDC buffer2 mM0.5 mM0.25 mM0.125 mM0.05 mM0.01 mMDeionized water

19
nanoparticles is even more increased because of the surfactants that are present in the HDC buffer that it gets stuck in the column between packaging particles. Secondly, the retention for the 350 nm nanoparticles was higher than for the 220 nm particles when deionized water was used as eluent (figure 7). This would mean that the 350 nm sample is retained and is undergoing another effect beside the Poiseuille flow pattern and the electrostatic repulsion. What the factor is that retains these larger nanoparticles is something that needs to be investigated further. Thus, it would be possible to use deionized water as eluent for HDC, but the upper limit of separation would decrease for the column because the larger diameter nanoparticles had a later retention time than the particles with a diameter of 220 nm.

20
4.3 RPLC
4.3.1 Optimization of the separation of LA, GA and dyes In the beginning a column with a length of 50 mm was used for separating lactic acid (LA) and glycolic acid (GA). However, the length of the column was too short to sufficiently retain LA for a separation between LA and GA. Besides an RPLC silica C18 column, a RPLC F5 column was also tested. This column has a stationary phase to which carbon skeletons are attached that have aromatic 6-rings at the end with fluor atoms instead of hydrogen atoms. This type of stationary phase is supposed to encourage hydrophobic interaction. However, there was no increase in retention for lactic acid. Instead of changing columns to promote the separation, the mobile phase could also be adjusted. One approach was to lower the pH of the deionized water to 2.5, causing the LA and GA to protonate, since they both have a pKa around 3.8. This could retain LA more because a negatively charged oxygen atom will have more repulsion with the stationary phase than a hydroxy group. Nevertheless, this did not increase the elution rate of LA. Moreover, adding an ion pair to the mobile phase with a pH of 6.5 also did not increase the retention. The pH of 6.5 should give LA and GA a negative charge and the ion pair a positively charged molecule with hydrophobic chains. The LA and GA would interact with the ion pair and due to the hydrophobic chains, their retention should increase even for GA. However, no increase in retention for either of the compounds was observed.
In addition, the elution of the hydrophobic dyes was also important for the LCxLC setup. Instead of a gradient with ACN, a gradient with methanol was also used. Although, the elution strength of methanol was not strong enough for a fast elution of the dyes. This was important because the second dimension of the LCxLC method has very short modulations of 1.5 minutes, meaning that a faster elution of the dyes is better and that ACN would be the better option. From these results it was concluded that the best option would be to use a column with a length of 150 mm and that the mobile phases should be deionized water and ACN.
21
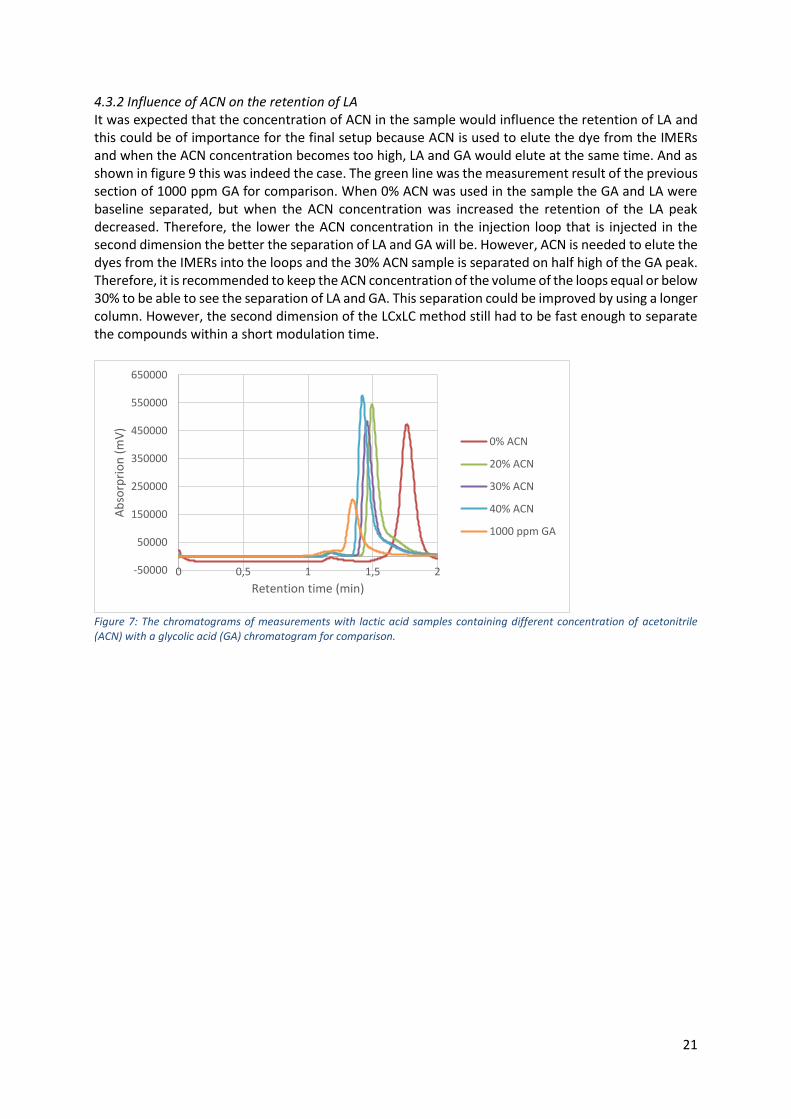
4.3.2 Influence of ACN on the retention of LA It was expected that the concentration of ACN in the sample would influence the retention of LA and this could be of importance for the final setup because ACN is used to elute the dye from the IMERs and when the ACN concentration becomes too high, LA and GA would elute at the same time. And as shown in figure 9 this was indeed the case. The green line was the measurement result of the previous section of 1000 ppm GA for comparison. When 0% ACN was used in the sample the GA and LA were baseline separated, but when the ACN concentration was increased the retention of the LA peak decreased. Therefore, the lower the ACN concentration in the injection loop that is injected in the second dimension the better the separation of LA and GA will be. However, ACN is needed to elute the dyes from the IMERs into the loops and the 30% ACN sample is separated on half high of the GA peak. Therefore, it is recommended to keep the ACN concentration of the volume of the loops equal or below 30% to be able to see the separation of LA and GA. This separation could be improved by using a longer column. However, the second dimension of the LCxLC method still had to be fast enough to separate the compounds within a short modulation time.
Figure 7: The chromatograms of measurements with lactic acid samples containing different concentration of acetonitrile (ACN) with a glycolic acid (GA) chromatogram for comparison.
-50000
50000
150000
250000
350000
450000
550000
650000
0 0,5 1 1,5 2
Ab
sorp
rio
n (
mV
)
Retention time (min)
0% ACN
20% ACN
30% ACN
40% ACN
1000 ppm GA
22
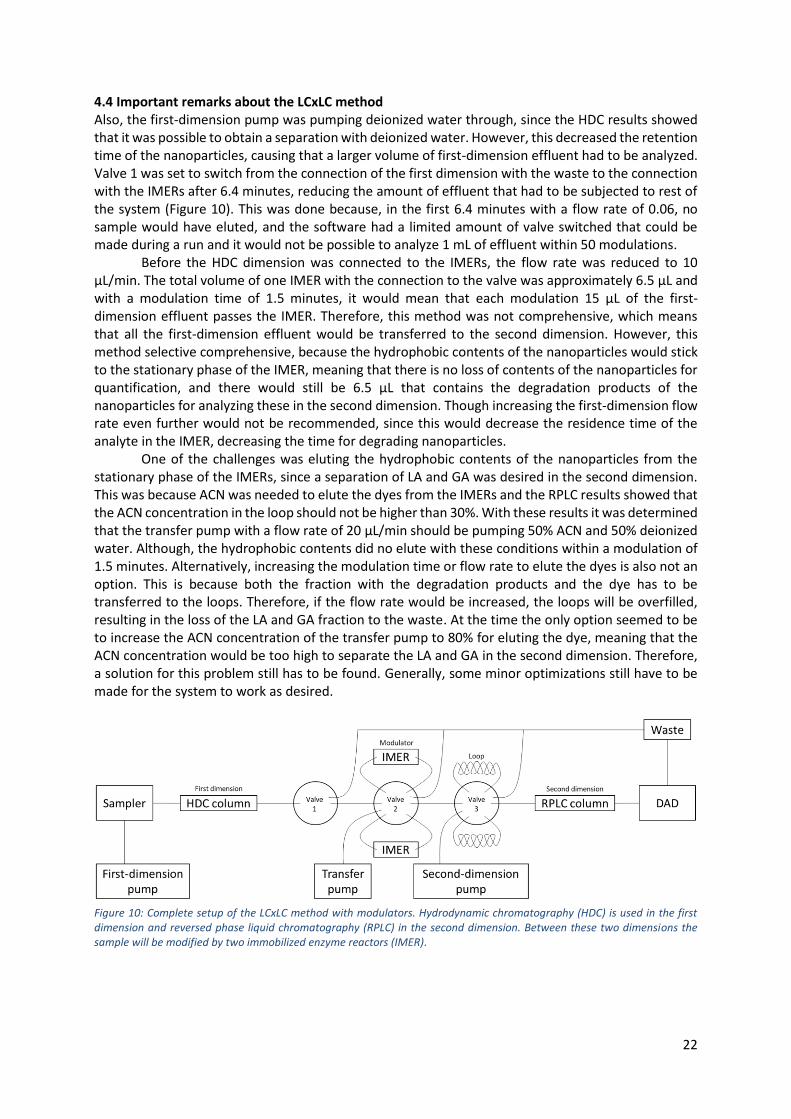
4.4 Important remarks about the LCxLC method Also, the first-dimension pump was pumping deionized water through, since the HDC results showed that it was possible to obtain a separation with deionized water. However, this decreased the retention time of the nanoparticles, causing that a larger volume of first-dimension effluent had to be analyzed. Valve 1 was set to switch from the connection of the first dimension with the waste to the connection with the IMERs after 6.4 minutes, reducing the amount of effluent that had to be subjected to rest of the system (Figure 10). This was done because, in the first 6.4 minutes with a flow rate of 0.06, no sample would have eluted, and the software had a limited amount of valve switched that could be made during a run and it would not be possible to analyze 1 mL of effluent within 50 modulations. Before the HDC dimension was connected to the IMERs, the flow rate was reduced to 10 µL/min. The total volume of one IMER with the connection to the valve was approximately 6.5 µL and with a modulation time of 1.5 minutes, it would mean that each modulation 15 µL of the first-dimension effluent passes the IMER. Therefore, this method was not comprehensive, which means that all the first-dimension effluent would be transferred to the second dimension. However, this method selective comprehensive, because the hydrophobic contents of the nanoparticles would stick to the stationary phase of the IMER, meaning that there is no loss of contents of the nanoparticles for quantification, and there would still be 6.5 µL that contains the degradation products of the nanoparticles for analyzing these in the second dimension. Though increasing the first-dimension flow rate even further would not be recommended, since this would decrease the residence time of the analyte in the IMER, decreasing the time for degrading nanoparticles. One of the challenges was eluting the hydrophobic contents of the nanoparticles from the stationary phase of the IMERs, since a separation of LA and GA was desired in the second dimension. This was because ACN was needed to elute the dyes from the IMERs and the RPLC results showed that the ACN concentration in the loop should not be higher than 30%. With these results it was determined that the transfer pump with a flow rate of 20 µL/min should be pumping 50% ACN and 50% deionized water. Although, the hydrophobic contents did no elute with these conditions within a modulation of 1.5 minutes. Alternatively, increasing the modulation time or flow rate to elute the dyes is also not an option. This is because both the fraction with the degradation products and the dye has to be transferred to the loops. Therefore, if the flow rate would be increased, the loops will be overfilled, resulting in the loss of the LA and GA fraction to the waste. At the time the only option seemed to be to increase the ACN concentration of the transfer pump to 80% for eluting the dye, meaning that the ACN concentration would be too high to separate the LA and GA in the second dimension. Therefore, a solution for this problem still has to be found. Generally, some minor optimizations still have to be made for the system to work as desired.
Figure 10: Complete setup of the LCxLC method with modulators. Hydrodynamic chromatography (HDC) is used in the first dimension and reversed phase liquid chromatography (RPLC) in the second dimension. Between these two dimensions the sample will be modified by two immobilized enzyme reactors (IMER) .
23
5 Conclusions The results of the calibration curves for the HDC experiments showed that the lower limit of detection for a column with a packaging size between 1.9 µm and 8.7 µm had a λ value between 0.01 and 0.005 and the upper limit of separation was the point where the transition between HDC and slalom chromatography took place, which was different for each flowrate. Furthermore, it was found that the C term was dependent on the size of the packaging materials and this relation has not been found in the literature. Besides these results, the experiments with deviating salt concentrations in the mobile phase showed that HDC with deionized water as a mobile phase was possible and even had an increased separation for particles between 100 nm and 30 nm. From the RPLC results, it was concluded that a column with a length of 150 mm and that ACN and deionized water as mobile phase were the best options. Also, the concentration of ACN should be kept below 30% in the loops for the LCxLC setup to maintain a separation between lactic acid and glycolic acid. Furthermore, the elution of the hydrophobic contents of the nanoparticles within a modulation is challenging while still obtaining a separation for lactic acid and glycolic acid in the second dimension.
6 Acknowledgements I would like to thank Bob Pirok and Noor Abdulhussain for providing me this project and for their great daily supervision. Rick van der Hurk and Sander Fokker are thanked for teaching me the basics of the LCxLC system and further assistance throughout the project. Also, I would like to thank Ron Peters for providing his vision on the HDC results. Phenomenex is acknowledged for providing the HDC test columns. Lastly, I would like to thank the head of the group P.J. Schoenmakers and the Analytical Chemistry Group for the nice time during the project.
7 References (1) Wilczewska, A. Z.; Niemirowicz, K.; Markiewicz, K. H.; Car, H. Pharmacol. Reports 2012, 64 (5),
1020–1037. (2) Kumari, A.; Yadav, S. K.; Yadav, S. C. Colloids Surfaces B Biointerfaces 2010, 75 (1), 1–18. (3) Cheng, J.; Teply, B. A.; Sherifi, I.; Sung, J.; Luther, G.; Gu, F. X.; Levy-Nissenbaum, E.; Radovic-
Moreno, A. F.; Langer, R.; Farokhzad, O. C. Biomaterials 2007, 28 (5), 869–876. (4) Striegel, A. M.; Brewer, A. K. Annu. Rev. Anal. Chem 2012, 5, 15–34. (5) Small, H.; Saunders, F. L.; Solc, J. Adv. Colloid Interface Sci. 1976, 6 (4), 237–266. (6) R, T.; J, B.; ME, V. K. Anal. Chem. 1986, 58 (3), 3036. (7) Stegeman, G.; Kraak, J. C.; Poppe, H.; Tijssen, R. J. Chromatogr. A 1993, 657 (2), 283–303. (8) R, T.; J, B.; ME, V. K. Anal. Chem. 1986, 58 (3), 3036. (9) Stegeman, G. On hydrodynamic Chromatography in Packed Columns; 1994. (10) Stegeman, G.; Kraak, J. C.; Poppe, H. J. Chromatogr. A 1991, 550 (C), 721–739. (11) Pirok, B. W. J.; Breuer, P.; Hoppe, S. J. M.; Chitty, M.; Welch, E.; Farkas, T.; Van Der Wal, S.;
Peters, R.; Schoenmakers, P. J. J. Chromatogr. A 2017, 1486, 96–102.