FARMERS’ RISK PERCEPTION AND RISK...
12
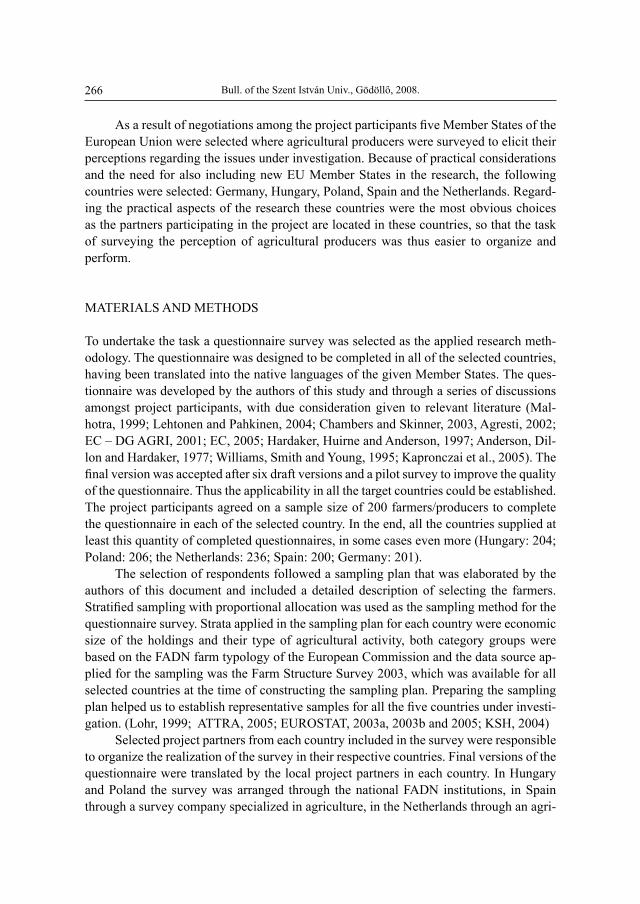
FARMERS’ RISK PERCEPTION AND RISK MANAGEMENT PRACTICES IN INTERNATIONAL COMPARISON PÁLINKÁS P., SZÉKELY CS. Faculty of Economics and Social Sciences, Szent István University, H-2103 Gödöllő, Hungary KEYWORDS: risk perception, risk management, international comparison ABSTRACT The local, regional and global economic and natural phenomena of previous decades collectively empha- size the growing importance of risk factors affecting agricultural production both directly and indirectly. Agricultural producers should not restrict their risk management strategies to offset and relieve the prob- lems caused by climatic and natural phenomena, but the knowledge of up-to-date professional, market, and agricultural policy developments is more and more an indispensable condition of successful farming. Besides what mentioned above, it is at least equally important to answer the question of how farmers perceive the importance of risk factors surrounding their activities, as it strongly influences the shaping of their risk management strategies. The responsibility of professional organizations and policy makers is easily shapeable in this sense because they may play an important role in the orientation and education of farmers, thus making it possible that farmers judge the importance of risk factors properly so they may work out adequate risk management strategies. The European Union has long been aware of the impor- tance of the topic and makes great efforts to investigate the possibilities of an EU level risk management system. The “Design and economic impact of risk management tools for European agriculture” research project 1 conducted under the aegis of the Sixth Framework Programme fits that objective. Within the project the authors of this paper explored the risk perception and applied risk management strategies of farmers in selected EU Member States. INTRODUCTION As an important part of the “Design and economic impact of risk management tools for European agriculture” research project conducted under the 6 th Framework Programme of the European Union, farmers’ perceptions regarding risk (crisis) and risk (crisis) manage- ment have been surveyed in selected Member States of the Union. The process and results of this work are briefly described in this paper.
-
Upload
vuongnguyet -
Category
Documents
-
view
214 -
download
0
Transcript of FARMERS’ RISK PERCEPTION AND RISK...

FARMERS’ RISK PERCEPTION AND RISK MANAGEMENT PRACTICES IN INTERNATIONAL COMPARISON
PÁLINKÁS P., SZÉKELY CS. Faculty of Economics and Social Sciences, Szent István University, H-2103 Gödöllő, Hungary
KEYWORDS: risk perception, risk management, international comparison
AbStRACt
the local, regional and global economic and natural phenomena of previous decades collectively empha-size the growing importance of risk factors affecting agricultural production both directly and indirectly. Agricultural producers should not restrict their risk management strategies to offset and relieve the prob-lems caused by climatic and natural phenomena, but the knowledge of up-to-date professional, market, and agricultural policy developments is more and more an indispensable condition of successful farming. besides what mentioned above, it is at least equally important to answer the question of how farmers perceive the importance of risk factors surrounding their activities, as it strongly influences the shaping of their risk management strategies. the responsibility of professional organizations and policy makers is easily shapeable in this sense because they may play an important role in the orientation and education of farmers, thus making it possible that farmers judge the importance of risk factors properly so they may work out adequate risk management strategies. the European Union has long been aware of the impor-tance of the topic and makes great efforts to investigate the possibilities of an EU level risk management system. the “Design and economic impact of risk management tools for European agriculture” research project1 conducted under the aegis of the Sixth Framework Programme fits that objective. Within the project the authors of this paper explored the risk perception and applied risk management strategies of farmers in selected EU Member States.
INtRODUCtION
As an important part of the “Design and economic impact of risk management tools for European agriculture” research project conducted under the 6th Framework Programme of the European Union, farmers’ perceptions regarding risk (crisis) and risk (crisis) manage-ment have been surveyed in selected Member States of the Union. the process and results of this work are briefly described in this paper.
Bull. of the Szent István Univ., Gödöllő, 2008.266
As a result of negotiations among the project participants five Member States of the European Union were selected where agricultural producers were surveyed to elicit their perceptions regarding the issues under investigation. because of practical considerations and the need for also including new EU Member States in the research, the following countries were selected: Germany, Hungary, Poland, Spain and the Netherlands. Regard-ing the practical aspects of the research these countries were the most obvious choices as the partners participating in the project are located in these countries, so that the task of surveying the perception of agricultural producers was thus easier to organize and perform.
MAtERIALS AND MEtHODS
to undertake the task a questionnaire survey was selected as the applied research meth-odology. the questionnaire was designed to be completed in all of the selected countries, having been translated into the native languages of the given Member States. the ques-tionnaire was developed by the authors of this study and through a series of discussions amongst project participants, with due consideration given to relevant literature (Mal-hotra, 1999; Lehtonen and Pahkinen, 2004; Chambers and Skinner, 2003, Agresti, 2002; EC – DG AGRI, 2001; EC, 2005; Hardaker, Huirne and Anderson, 1997; Anderson, Dil-lon and Hardaker, 1977; Williams, Smith and Young, 1995; Kapronczai et al., 2005). The final version was accepted after six draft versions and a pilot survey to improve the quality of the questionnaire. thus the applicability in all the target countries could be established. The project participants agreed on a sample size of 200 farmers/producers to complete the questionnaire in each of the selected country. In the end, all the countries supplied at least this quantity of completed questionnaires, in some cases even more (Hungary: 204; Poland: 206; the Netherlands: 236; Spain: 200; Germany: 201).
the selection of respondents followed a sampling plan that was elaborated by the authors of this document and included a detailed description of selecting the farmers. Stratified sampling with proportional allocation was used as the sampling method for the questionnaire survey. Strata applied in the sampling plan for each country were economic size of the holdings and their type of agricultural activity, both category groups were based on the FADN farm typology of the European Commission and the data source ap-plied for the sampling was the Farm Structure Survey 2003, which was available for all selected countries at the time of constructing the sampling plan. Preparing the sampling plan helped us to establish representative samples for all the five countries under investi-gation. (Lohr, 1999; ATTRA, 2005; EUROSTAT, 2003a, 2003b and 2005; KSH, 2004)
Selected project partners from each country included in the survey were responsible to organize the realization of the survey in their respective countries. Final versions of the questionnaire were translated by the local project partners in each country. In Hungary and Poland the survey was arranged through the national FADN institutions, in Spain through a survey company specialized in agriculture, in the Netherlands through an agri-

267Farmer’s risk perception and risk management practices
cultural insurance company, while in Germany through a network of professionals having contact with relevant farmers. After the completion of the questionnaires the results were recorded in a computer file that was prepared by the authors. After recording the data in the file it was sent to the authors and the data has been processed using a statistical soft-ware package. the time necessary for completing the questionnaires varied from country to country, but the predefined number of completed questionnaires was received from all selected Member States.
This paper presents some of the findings of the statistical analysis of data. Statistical analysis involved the exploration of overall difference among groups (primarily coun-tries) followed by pair-wise comparisons of groups to elucidate the differences in more detail, although space limitations of this paper do not allow us to show all the detailed results of the statistical analyses. In tables containing and comparing proportions of an-swers in countries, results are based on two-sided tests with significance level 0.05. For each significant pair, the key of the category with the smaller column proportion appears under the category with the larger column proportion. tests are adjusted for all pair-wise comparisons within a row of each innermost sub-table using the bonferroni correction. A similar approach applies to the comparison of interval data where overall differences among groups were revealed by the Kruskal-Wallis test at a significance level of 0.05, fol-lowed by a series of post-hoc tests, using the Mann-Whitney test, to explore differences in pair-wise comparisons of groups (using bonferroni correction). tables representing these results express the differences in a way that the key of the category with the significantly smaller mean appears under the category with the larger column mean. Data labelled “Greater than” refers to these pair-wise comparisons in tables depicting interval data.
In relevant tables (Tables 2 and 3 of this document) the notation “Valid cases” refers to the number of respondents who completed the given multiple response question cor-rectly while “n” in each column means the number of respondents within the valid cases who answered “yes” for the given option within the set of possible responses.
RESULtS
Risk (crisis) perception and risk (crisis) experience
Farming activity is exposed to the influence of different important factors prevailing in agriculture. The effect of some factors may be either beneficial for farmers, for example political measures may provide better circumstances for them, or may also cause newly emerging problems. Farmers’ subjective judgments on these factors determine also the resources and efforts devoted to offset the risks that may arise. In our survey farmers were asked to rate some of these influential factors according to their subjective opinions (Table 1). Factors could be rated from 1 (factor has no effect on farming) to 7 (factor has major effect on farming).

Bull. of the Szent István Univ., Gödöllő, 2008.268
Table 1: Rating sources of risk (country averages; 1-3-No effect, 3-5-Moderate, 5-7-Large effect)
Hungary(A)
MeanGreater than
Poland(b)
MeanGreater than
Netherlands(C)
MeanGreater than
Spain(D)
MeanGreater than
Germany(E)
MeanGreater than
Weather and natural disasters
6.24CDE
6.41CDE
5.06-
5.74CE
5.41-
Animal disease and epidemic
4.91-
5.19-
5.98Ab
3.36-
3.35E
Price volatility 5.68CE
5.55-
5.24-
5.48-
5.35-
Marketing difficul-ties
5.06bDE
4.05-
4.69bE
4.39E
3.95-
Input market 3.98bCE
2.21-
3.27b
3.75b
3.47b
Debt 2.63-
3.42A
4.52AbDE
2.97-
3.04A
Political measures 4.15b
3.31-
4.89AbD
4.07b
5.23AbD
technological processes
4.22b
3.64-
4.31bD
3.62-
4.02b
Source: Own calculations
Overall averages show that weather and natural disasters are considered as the fac-tors with the largest effect followed by volatility of prices. In the case of weather and natural disasters three groups of countries can be observed based on the statistically sig-nificant difference of the average rating of this factor. Polish and Hungarian farmers gave the highest ratings to this factor showing that weather and natural disasters have large effects on farming. Following them the Spanish average rating is somewhat lower but still referring to large effects. the third group consists of Germany and the Netherlands where according to farmers’ opinions the effect of this factor is also considered large but at a lower level. these differences may be explained by the different or similar climatic features of countries.
Regarding volatility of prices, farmers of all selected countries share the same opin-ion, considering its effect as large but Hungarian farmers attribute larger effect to price volatility than Dutch and German respondents.
Animal disease and epidemic (where the farmer was involved in livestock produc-tion) is attributed as having large effects in Poland and the Netherlands, while the same applies to political measures in Germany, and to marketing difficulties in Hungary.
Although farmers try to reduce risks surrounding their activities, sometimes un-expected events may cause serious negative effects on their farming activities that may result in a crisis situation that often threatens farms with bankruptcy. Farmers were asked whether such a situation have ever occurred during their career. Spain proved to be the

269Farmer’s risk perception and risk management practices
most critical country as more than half of Spanish farmers (56.5%) had experienced a cri-sis situation so far, followed by Hungary with the rate of 40.3%. The other three Member States can be considered as secure relative to Spain and Hungary (Figure 1).
Figure 1: Crisis experience among farmers
Source: Own calculations
After analyzing the frequency and magnitude (in terms of affected land and pro-duction percentage, and share of farm revenue affected) of critical events, it could be concluded that on average the most critical losses appeared in Spain so far, both in crop and livestock production. Additionally, as an overall phenomenon it was observed that the higher the share of land/production affected, the higher the proportion of total farm revenue affected.
Risk management strategies
besides knowing farmers’ subjective perceptions on the effect of given factors and expe-riences related to risk or even crisis, the use of specific risk reducing methods applied by farmers is a highly important piece of information. Crop insurance is widespread in Ger-many and Spain where 60-70% of farmers apply this instrument which is more than in the other countries. The use of livestock insurance is significantly higher in the old Member States (around 40%) than in the new ones. Marketing contracts are important in the new Member States and Germany. German farmers are more active in off-farm investments (49.8%) and off-farm employment (36.8%) than those in the other countries. Property insurance is very important in Poland (67.5%), Germany (75.1%) and the Netherlands (66.8%). Avoiding the use of credit (maintaining a conservative debt ratio) is equally im-portant in all countries (around 40%) while holding financial reserves is quite important in Hungary (40.5%), Poland (51.5%) and Germany (61.2%) unlike in the Netherlands
Has the farmer ever had to face any unexpected event that threatened with bankruptcy?
40.317.5 25.5
56.5
21.9
59.782.5 74.5
43.5
78.1
0%
20%
40%
60%
80%
100%
Hungary Poland Netherlands Spain Germany
NoYes

Bull. of the Szent István Univ., Gödöllő, 2008.270
(22.6%) and Spain (22.5%). Looking at individual countries the situation is as follows. Hungary and Poland are identical in the sense that property insurance was indicated as the instrument applied by the highest percentage of farmers (41.5% and 67.5%) followed by holding financial reserves (40.5% and 51.5%). Avoiding use of credit is an important tool also in the Netherlands (38.1%). In Spain crop insurance was the primarily applied risk management instrument (59.2%) while this took second place in Germany (68.7%) pre-ceded by property insurance. In the case of Spain the second place was held by livestock insurance and avoiding the use of credit with 36.6% in case of both (Table 2).
Table 2: Current use of risk management instruments (Number and % of respondents using the instrument)
Valid casesHU – 195PL – 206NL – 226SP – 191GER – 201
Hungary(A)
% of casesGreater than
Poland(b)
% of casesGreater than
Netherlands(C)
% of casesGreater than
Spain(D)
% of casesGreater than
Germany(E)
% of casesGreater than
Crop insurance 21.5%-
14.1%-
30.5%b
59.2%AbC
68.7%AbC
Livestock insurance 4.1%-
6.8%-
37.2%Ab
36.6%Ab
42.8%Ab
Diversification 23.1%C
33.5%CD
11.5%-
18.8%-
28.4%C
Marketing contracts 38.5%CD
35.4%CD
18.6%-
12.6%-
49.3%bCD
Production contracts 15.9%D
16.0%D
20.8%D
5.8%-
16.4%D
Off-farm investment 4.1%-
1.9%-
6.2%-
5.8%-
49.8%AbCD
Off-farm employment
19.0%D
20.4%D
17.7%D
4.7% 36.8%AbCD
Property insurance 41.5%-
67.5%AD
66.8%AD
29.8%-
75.1%AD
Vertical integration 3.6%-
5.8%-
4.4%-
12.6%AC
7.0%-
Avoiding credit 37.9%-
40.3%-
38.1%-
36.6%-
31.3%-
Hedging 1.5%-
2.9%-
1.3%-
1.0%-
5.0%-
Holding financial reserves
40.5%CD
51.5%CD
22.6%-
22.5%-
61.2%ACD
Source: Own calculations
Regarding farmers’ future plans in terms of risk management instruments it can be observed that the majority of respondents in all countries, especially in Germany (80%) and Spain (75.1%), are willing to apply the risk management methods that they use now.
271Farmer’s risk perception and risk management practices
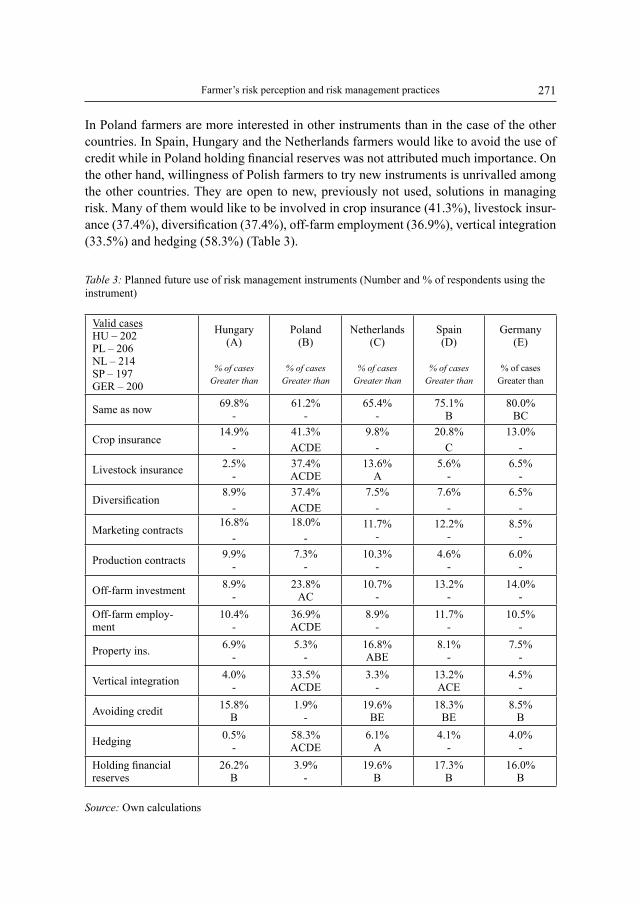
In Poland farmers are more interested in other instruments than in the case of the other countries. In Spain, Hungary and the Netherlands farmers would like to avoid the use of credit while in Poland holding financial reserves was not attributed much importance. On the other hand, willingness of Polish farmers to try new instruments is unrivalled among the other countries. they are open to new, previously not used, solutions in managing risk. Many of them would like to be involved in crop insurance (41.3%), livestock insur-ance (37.4%), diversification (37.4%), off-farm employment (36.9%), vertical integration (33.5%) and hedging (58.3%) (Table 3).
Table 3: Planned future use of risk management instruments (Number and % of respondents using the instrument)
Valid casesHU – 202PL – 206NL – 214SP – 197GER – 200
Hungary(A)
% of casesGreater than
Poland(b)
% of casesGreater than
Netherlands(C)
% of casesGreater than
Spain(D)
% of casesGreater than
Germany(E)
% of casesGreater than
Same as now 69.8%-
61.2%-
65.4%-
75.1%b
80.0%bC
Crop insurance14.9%
-41.3%ACDE
9.8%-
20.8%C
13.0%-
Livestock insurance 2.5%-
37.4%ACDE
13.6%A
5.6%-
6.5%-
Diversification8.9%
-37.4%ACDE
7.5%-
7.6%-
6.5%-
Marketing contracts16.8%
-18.0%
-11.7%
-12.2%
-8.5%
-
Production contracts 9.9%-
7.3%-
10.3%-
4.6%-
6.0%-
Off-farm investment 8.9%-
23.8%AC
10.7%-
13.2%-
14.0%-
Off-farm employ-ment
10.4%-
36.9%ACDE
8.9%-
11.7%-
10.5%-
Property ins. 6.9%-
5.3%-
16.8%AbE
8.1%-
7.5%-
Vertical integration 4.0%-
33.5%ACDE
3.3%-
13.2%ACE
4.5%-
Avoiding credit 15.8%b
1.9%-
19.6%bE
18.3%bE
8.5%b
Hedging 0.5%-
58.3%ACDE
6.1%A
4.1%-
4.0%-
Holding financial reserves
26.2%b
3.9%-
19.6%b
17.3%b
16.0%b
Source: Own calculations

Bull. of the Szent István Univ., Gödöllő, 2008.272
From another approach (tables not presented), among those farmers who would like to maintain the already applied methods, preferred new instruments would include hold-ing financial reserves in Hungary (17%), the Netherlands (14.3%) and Germany (10%), hedging in Poland (60.3%), avoiding use of credit and accumulating financial reserves in Spain (18.2% in both cases). Among those farmers who would like to use some other methods instead of the currently applied ones (or desire to give up the already applied methods) the following instruments are the most prominent: crop insurance in Spain (55.1%), holding financial reserves in Hungary (47.5%), vertical integration (43.8%) and hedging (55%) in Poland, avoiding use of credit in the Netherlands (35.1%), and off-farm investment in Germany (47.5%).
Marketing channels applied by farmers
Selling agricultural products through contracts or cooperatives is less risky due to pro-visional factors and conditions. Selling the products individually is probably the most risky way of marketing the products especially in the case of increased competition if the farmer lacks considerable bargaining power. The majority of Dutch (64.9%) and Spanish (53%) farmers stated they sell their products through cooperatives although individual sales in Spain (43.5%) are also important, as is also the case in Germany where 41.7% of the respondents stated that their primary marketing channel is individual sales. On the other hand, 40.7% of German respondents sell the majority of their products through cooperatives (Figure 2). In Hungary and Poland which are both new Member States of the EU individual sales is still the most important marketing channel with 70% and 60% of respondents applying it respectively. There was no statistically significant difference detected between Poland and Hungary in this sense. the same applies to the group of the Netherlands, Spain and Germany regarding selling through cooperatives except for the Netherlands-Germany comparison where in the Netherlands a significantly higher pro-portion of farmers sell their products through cooperatives than in Germany.
Figure 2: Marketing channels applied by farmers
Source: Own calculations
How do farmers sell the majority of their products?
70.060.2
9.5
64.9
53.0
16.57.2 3.04.0 6.8 6.7
0.5 4.0
41.7
21.2
43.5 40.7
13.119.9
13.6
0.0
20.0
40.0
60.0
80.0
100.0
Hungary Poland Netherlands Spain Germany
Perc
ent (
%)
Individual sales through cooperative through marketing contract through production contract

273Farmer’s risk perception and risk management practices
Financial aspects of farming
taking bank loans may greatly help farmers but may also be a burden for them. the existence of debt refers to legal and financial obligations that may limit the decision au-thority of the farmer and also impose extra risks because the debt has to be repaid within a certain period and thus deprives financial resources from farming activity. Using debt towards bank(s) to finance operations is widespread in Poland and the Netherlands, where 54%-65% of farmers have bank debt with no statistically significant difference between the two countries, although Dutch project partners noted that according to their opinion the Dutch data (54.2%) is not valid because they perceive in reality it is around 90%. The reason for this discrepancy was not revealed in this study. Germany, Poland and Hungary represent one group of countries as there was no statistically significant difference found between them. the share of farmers having bank debt currently in these countries is be-tween 18% and 30% (Figure 3).
Figure 3: Existence of debt towards bank(s) at the time of completing the questionnaire
Source: Own calculations
Farmers were also asked to express their perceptions on the adequacy of access to credit. In the case of Spain and Hungary more than half of Spanish (50.3%) and Hungar-ian farmers (54.5%) stated that there is timely access to credit but only with strict condi-tions and high costs. There was no statistically significant difference found between these two countries. In Poland the largest group of farmers (41.3%) thought that costs and con-ditions of credit access are reasonable but requires a long procedure. In the Netherlands (81.3%) and Germany (78%) the great majority of farmers state that access to credit is timely and involves reasonable costs and conditions (no statistically significant difference detected). This may refer to the highly developed financial markets but it is surprising that this opinion of German farmers is accompanied by only a relatively low proportion of them having bank debt, although banks are not the only source of loans. It is worthwhile to mention that in Hungary 27.3% of farmers indicated that they have no access to credit at all, a rate which is considerably higher than in the other countries where this share of responses was only 1%-3% (Figure 4).
Do farmers have debt at the moment?
22.1
65.054.2
18.029.4
77.9
35.045.8
82.070.6
0%
20%
40%
60%
80%
100%
Hungary Poland Netherlands Spain Germany
NoYes

Bull. of the Szent István Univ., Gödöllő, 2008.274
Figure 4: Farmers’ perceptions of credit access adequacy
Source: Own calculations
Managing risk through assuring quality
besides governmental regulations other standardized frameworks of rules (quality assur-ance methods/systems) can also be applied by farmers, mostly voluntarily. These applica-tions help farmers to reduce production and market risk related primarily to the quality of products. In this respect Germany and the Netherlands are the overall leaders with around 80%-90% of farmers applying any type of quality assurance systems. The difference be-tween these two countries is not statistically significant. The same applies to Spain and Poland where 68%-75% of farmers have such a system. Hungary is lagging behind with only 20.2% of farmers applying quality assurance system(s), which indicates an underde-velopment of the country in this respect (Figure 5).
Figure 5: Application of quality assurance systems
Source: Own calculations
How do farmers perceive the adequacy of access to credit capacity?
27.3
54.5
11.8 6.41.0
24.341.3
33.4
3.7 9.8 5.1
81.4
8.9
50.3
14.026.8
2.611.0 8.4
78.0
0.0
20.0
40.0
60.0
80.0
100.0
there is no access tocredit at all.
there is t imely access butonly with hard conditions
and high costs.
Costs and conditit ions arereasonable but requires a
long procedure.
there is t imely accesswith reasonable conditions
and costs.
Perc
ent (
%)
Hungary Poland Netherlands Spain Germany
Do farmers apply any quality assurance systems?
20.2
68.481.7 74.5
90.0
79.8
31.618.3 25.5
10.0
0%
20%
40%
60%
80%
100%
Hungary Poland Netherlands Spain Germany
NoYes

275Farmer’s risk perception and risk management practices
Human resources riskWith respect to up-to-date knowledge, attending professional educational courses is a very important way of obtaining valuable and directly applicable information. In Germany the vast majority, 76% of farmers have visited such a course recently while this rate is 61.8% in the Netherlands. the situation is different in the other three countries where only less than 30% of farmers attend such courses in order to keep themselves informed on the developments in agriculture – no statistically sound difference detected (Figure 6).
Figure 6: Recent participation in any farming related professional educational program
$Source: Own calculations
CONCLUSIONS
When considering factors that affect farming, it became clear that farmers in the studied countries perceive weather and natural disasters, and price volatility the elements having the largest effects on their farming. based on the relevant results, production and related revenues are the most sensitive to crises in Spain and Hungary, both in crop and livestock production, while the other countries, especially Poland are quite secure relative to these two countries in this respect.
the range of instruments applied by farmers to manage risks related to agriculture show that specific crop and livestock insurance is widespread mainly in the old Member States while property insurance has an important role in both the old and new Member States. Although, the old Member States have well developed financial markets, a high proportion of farmers in all selected countries try to avoid using credit and thus taking on new liabilities. A widespread way to secure sufficient financial resources is to hold finan-cial reserves, especially in the new Member States and Germany. this method is reason-able in new Member States where majority of farmers perceive the adequacy of access to credit in a less positive way that those in the old Member States.
Do farmers participate in any professional educational program related to farming recently?
15.530.6
61.8
18.7
76.0
84.569.4
38.2
81.3
24.0
0%
20%
40%
60%
80%
100%
Hungary Poland Netherlands Spain Germany
NoYes

Bull. of the Szent István Univ., Gödöllő, 2008.276
When future use of risk management instruments are considered, it becomes quite clear that the majority of farmers have already found the instruments they can use are adequate for use in their farming to offset risks, so they are going to continue applying them.
the most important conclusion of our research is that, although high similarity was expected between pairs of countries like Germany-Netherlands and Hungary-Poland in terms of farmers’ risk perception and management strategies, it has to be clearly seen that strong similarity can be concluded only at the level of individual, highly specific issues, because at the general level there are many differences among these given countries. It has to be strongly highlighted that this survey has covered only five Member States out of the twenty seven so there may be many more combinations of similarities and differences among Member States besides the ones revealed. Although in several cases countries with similar conditions (economic, social, natural, etc.) may show more features in common but sometimes surprising differences could be revealed (e.g. Hungary and Poland).
REFERENCES
Agresti, A. (2002). Categorical Data Analysis. 2nd edition. John Wiley & Sons, New YorkAnderson, J.R. – Dillon, J.L. – Hardaker, J.B. (1977): Agricultural Decision Analysis. Iowa State
University Press, AmesATTRA /National Sustainable Agriculture Information Service (2005). Risk Management Survey.
Accessible at:http://www.attra.org/risk_management/Survey/rmsurveyeng.docChambers, R.L. and Skinner, C.J. (ed.) (2003). Analysis of Survey Data. John Wiley & Sons, LondonEuropean Commission – DG AGRI (2001). Risk management tools for EU agriculture with a special
focus on insurance. Working Document, brusselsEuropean Commission (2005). Communication from the Commission to the Council on risk and crisis
management in agriculture. COM (2005) 74. BrusselsEUROSTAT (2003a). Structure and Typology of Agricultural Holdings. Working document.
LuxembourgEUROSTAT (2003b). Farm Structure Survey 2003. http://epp.eurostat.ec.europa.euEUROSTAT (2005). F.A.D.N. http://ec.europa.eu/agriculture/rica/index_en.cfmHardaker, J.B., Huirne, R.B.M. and Anderson, J.R. (2002). Coping with Risk in Agriculture. CAB
International, WallingfordKapronczai, I. (ed.) (2005). Properties of the adapability of agricultural producers (In Hungarian).
Agrárgazdasági Kutatóintézet, budapestKSH /Hungarian Central Statistical Office/ (2004). Agriculture in Hungary – Farm Typology, 2000, 2003
(In Hungarian), KSH, budapest.Lehtonen, R. and Pahkinen, E. (2004). Practical Methods for Design and Analysis of Complex Surveys.
2nd edition. John Wiley & Sons, LondonLohr, S.A. (1999). Sampling: Design and Analysis. Duxbury PressMalhotra, N.K. (1999). Marketing Research: An Applied Orientation. 3rd edition. Thomson Brooks/ColeWilliams, C.A., Smith, M.L., Young, P.C. (1995). Risk Management and Insurance. 7th edition. McGraw-
Hill, New York