FARM-LEVEL INCENTIVES FOR FERTILIZER USE IN...
118
FARM-LEVEL INCENTIVES FOR FERTILIZER USE IN RWANDA’S KIGALI RURAL PROVINCE: A FINANCIAL ANALYSIS By Josaphat R. Mugabo PLAN B PAPER Submitted to Michigan State University in partial fulfillment of the requirements For the degree of MASTER OF SCIENCE Department of Agricultural Economics 2003
Transcript of FARM-LEVEL INCENTIVES FOR FERTILIZER USE IN...

FARM-LEVEL INCENTIVES FOR FERTILIZER USE IN RWANDA’S KIGALI
RURAL PROVINCE: A FINANCIAL ANALYSIS
By
Josaphat R. Mugabo
PLAN B PAPER
Submitted to
Michigan State University
in partial fulfillment of the requirements
For the degree of
MASTER OF SCIENCE
Department of Agricultural Economics
2003

i
TABLE OF CONTENTS LIST OF TABLES............................................................................................................. iii LIST OF FIGURES ........................................................................................................... vi LIST OF ABBREVIATIONS........................................................................................... vii Chapter 1 INTRODUCTION ...............................................................................................................1 1.1 Problem setting ..............................................................................................................1 1.2 Organization of the paper ..............................................................................................5 Chapter 2 BRIEF REVIEW OF AGRICULTURAL INTENSIFICATION LITTERATURE ............6 2.1 General concepts............................................................................................................6 2.1.1 Introduction..............................................................................................................6 2.1.2 Market incentives.....................................................................................................7 2.1.3 Environmental conditions ........................................................................................8 2.1.4 Availability of intensification technologies ...........................................................10 2.1.5 Capacity to invest...................................................................................................11
2.2 Agricultural intensification in Rwanda .......................................................................11
Chapter 3 BACKGROUND ON AGRICULTURE IN KIGALI RURAL PROVINCE..............................15 3.1 Physical environment...................................................................................................15 3.1.1 General characteristics ...........................................................................................16 3.1.2 Agricultural calendar .............................................................................................16
3.2 Farm assets...................................................................................................................17 3.2.1 Human resources....................................................................................................17 3.2.2 Household landholdings ........................................................................................20
3.3 Crops ............................................................................................................................21 3.3.1 Crop production .....................................................................................................21 3.3.2 Patterns of land use by farm size ...........................................................................24

ii
Chapter 4 CROP BUDGETS: ELABORATION AND ANALYSIS.................................................27 4.1 Elaboration of crop budgets .........................................................................................27 4.1.1 Technical module...................................................................................................27 4.1.2 Agricultural inputs .................................................................................................28 4.1.3 Yields 29 4.1.4 Inputs and outputs prices .......................................................................................30
4.2 Crop budget analysis....................................................................................................31 4.2.1 Plateau de l�Est zone..............................................................................................32 4.2.2 Plateau central zone ...............................................................................................40 4.2.3 Bugesera/Mayaga zone ..........................................................................................47 4.3 Farm budgets................................................................................................................51 Chapter 5 SUMMARY OF RESULTS AND POLICY IMPLICATIONS ........................................54 5.1 Summary of results ......................................................................................................54 5.1.1 Farm characteristics ...............................................................................................54 5.1.2 Crop budget analysis..............................................................................................56
5.2 Policy implications.......................................................................................................59
5.3 Limitations and suggestions for future research ..........................................................60 Appendix A DATA FOR CROP BUDGET ANALYSIS ......................................................................61 Appendix B CROP BUDGETS, MARGINS, COST SHARES, ...........................................................63 Appendix C AGRICULTURAL CALENDAR......................................................................................87 Appendix D HOUSEHOLD CHARACTERISTICS..............................................................................90 Appendix E LAND USE PATTERNS AND CROP PRODUCTION...................................................93 REFERENCES ................................................................................................................100

iii
LIST OF TABLES Table 3-1: Mean household size in the three major agro-ecological zones .......................17 Table 4-1: Margin ranking in plateau de l�est agro-ecological zone, Kigali rural province, 2001 ..........................................................................................35 Table 4-2: Margins and v/c ratios in plateau de l�est agro-ecological zone, Kigali rural province, 2001 ..........................................................................................39 Table 4-3: Margin ranking in plateau central agro-ecological zone, Kigali rural province, 2001 .........................................................................................42 Table 4-4: Margins and v/c ratios in plateau central agro-ecological zone, Kigali rural province, 2001 ..........................................................................................46 Table 4-5: Margin ranking in Bugesera agro-ecological zone, Kigali rural province, 2001. ........................................................................................48 Table 4-6: Margins and v/c ratios in Bugesera agro-ecological zone, Kigali rural province, 2001 ..........................................................................................50 Table 4-7: Farm budget type for plateau de l�est zone (100ares): improved techniques�52 Table 4-8: Farm budget type for plateau de l�est zone (100ares): Traditional modes of Production��������������������������..53 Table A-1: Average yields in the three major agro-ecological zones of Kigali rural, 2001�������������������������... 61 Table A-2: Average prices in the three major agro-ecological zones of Kigali Rural province, 2001����������������������61 Table A-3: National average man-days per hectare for crops perceived as profitable with fertilizer use in Kigali rural province���������.. 62 Table B-1: Climbing beans budget for �plateau de l�est agricultural zone�, Traditional module, Kigali rural province, (per hectare) ................................63 Table B-2: Climbing beans budget for �plateau de l�est agricultural zone�, Improved techniques, Kigali rural province, (per hectare) ..............................64 Table B-3: Sorghum budget for �plateau de l�est agricultural zone�, traditional module, Kigali rural province, (per hectare)..................................................................65

iv
Table B-4: Sorghum budget for �plateau de l�est agricultural zone�, improved techniques, Kigali rural province, (per hectare)..................................................................66 Table B-5: Soybeans budget for �plateau de l�est agricultural zone�, traditional module, Kigali rural province, (per hectare)..................................................................67 Table B-6: Soybeans budget for �plateau de l�est agricultural zone�, improved techniques, Kigali rural province, 2001 (per hectare).........................................................68 Table B-7: Maize budget for �plateau de l�est agricultural zone�, Module 1, Kigali rural province, 2001 (per hectare).........................................................69 Table B-8: Maize budget for �plateau de l�est agricultural zone�, improved techniques, Kigali rural province, 2001. (per hectare)........................................................70 Table B-9: Margins in plateau de l�Est agro-ecological zone............................................71 Table B-10: Cost shares in plateau de l�est agro-ecological zone, Kigali rural province, 2001 (percentage).............................................................................72 Table B-11: Climbing beans budget for �plateau central agricultural zone�, traditional module, Kigali rural province, 2001. (per hectare) ......................73 Table B-12: Climbing beans budget for �plateau central agricultural zone�, improved techniques, Kigali rural province, 2001. (per hectare) .................74 Table B-13: Sorghum budget for �plateau de central agricultural zone�, Module 1, Kigali rural province, 2001. (per hectare)......................................................75 Table B-14: Sorghum budget for �plateau central agricultural zone�, improved techniques, Kigali rural province, 2001. (per hectare)......................................................76 Table B-15: Soybeans budget for �plateau central agricultural zone�, Traditional module, Kigali rural province, 2001 (per hectare)........................................................77 Table B-16: Soybeans budget for �plateau central agricultural zone�, improved techniques, Kigali rural province, 2001. (per hectare).....................................................78 Table B-17: Maize budget for �plateau central agricultural zone�, Module 1, Kigali rural province, 2001 (per hectare)..................................................................79 Table B-18: Maize budget for �plateau central agricultural zone�, improved techniques, Kigali rural province, 2001. (per hectare)�������������..80 Table B-19: Margins in plateau central agro-ecological zone ...........................................81

v
Table B-20: Cost shares in plateau central agro-ecological zone, Kigali rural province, Rwanda, 2001 (percentage). ..........................................................82 Table B-21: Sorghum budget for �Bugesera agricultural zone�, Traditional module, Kigali rural province, 2001. (per hectare).......................................................83 Table B-22: Sorghum budget for �Bugesera agricultural zone�, Improved techniques, Kigali rural province, 2001. (per hectare).......................................................84
Table B-23: Margins in Bugesera agro-ecological zone, Kigali rural province, 2001�..85 Table B-24: Cost shares in Bugesera zone, Kigal rural province, 2001 (percentage)�....85 Table B-25: Net revenue of Family labor for selected crops with traditional (M1) and improved practices(M2) in Kigali rural province, 2001. ..........................86 Table B-26: Remuneration rate for selected crops with traditional (M1) and improved practices(M2) in Kigali rural province, 2001(Percentage). ...........................86 Table C-1: Agricultural calendars for the three major agricultural zones of Kigali rural Province, 2001.........................................................................................89 Table D-1: Age and gender of the household head for the three major agro-ecological zones, Kigali rural province, 2001 (Percentage)..............................................92 Table D-2: Level of education of the household head for the three major agro- Ecological zones, Kigali rural province, 2001.................................................93 Table D-3: Distribution of farmland area per household by quartile (in hectares)............94 Table D-4: Distribution of farmland area per household adult equivalents by quartile ....95 Table E-1: Land use by farm size in the plateau de l�est zone, Kigali rural, 2001���97 Table E-2: Land use by farm size in the Bugesera agro-ecological zone..........................98 Table E-3: Land use by farm size in the plateau central zone, Kigali rural, 2001���99 Table E-4: Crop shares by farm size in the plateau de l�est agro-ecological zone ..........100 Table E-5: Crop shares by farm size in the Bugesera agro-ecological zone ...................101 Table E-6: Crop shares by farm size in the Plateau central agro-ecological zone...........102 Table E-7: Annual crop production per household for main crops in Kigali rural
province, Rwanda, Average 2000-2002.........................................................103

vi
LIST OF FIGURES
Figure 3-1: Distribution of households (percent of households per category of household size), Kigali rural, 2001 .................................................................18 Figure 3-2: Distribution of households (percent of households per category of household�s number of adults equivalent)�������������..23 Figure 3-3: Annual crop productions per household for main crops in Kigali rural province, Average 2000-2002..........................................................................23 Figure 3-4: Total energy produced, available per day per household in the three major agricultural zones in Kigali rural province����������....23 Figure 4-1: Margins in plateau de l�est agro-ecological zone, Kigali rural province��33 Figure 4-2: Returns to family labor on household land for selected crops in plateau de l�est agro-ecological zone, Kigali rural province. ........................34 Figure 4-3: Remuneration rate for selected crops in plateau de l�est agro- ecological zone, Kigali rural province, Rwanda, 2001. ..................................34 Figure 4-4: Cost shares for climbing beans production with traditional and improved practices in plateau de l�est agro-ecological zone ...........................35 Figure 4-5: Cost shares for sorghum production with traditional and improved practices in plateau de l�Est agro-ecological zone..........................................35 Figure 4-6: Cost shares for soybeans production with traditional and improved practices in plateau de l�Est agro-ecological zone..........................................36 Figure 4-7: Cost shares for maize production with traditional and improved practices in plateau de l�Est agro-ecological zone...........................................36 Figure 4-8: Margins in plateau central agro-ecological zone, Kigali rural province��.38 Figure 4-9: Net revenue of family labor on household land for selected crops in plateau central agro-ecological zone, Kigali rural province. .......................39 Figure 4-10: Remuneration rate for selected crops in plateau central agro-ecological zone, Kigali rural province, 2001. ...................................................................39 Figure 4-11: Cost shares for climbing beans production with traditional and improved practices in plateau central agro-ecological zone ............................40

vii
Figure 4-12: Cost shares for sorghum production with traditional and improved practices in plateau central agro-ecological zone .........................................40 Figure 4-13: Cost shares for soybeans production with traditional and improved practices in plateau central agro-ecological zone .........................................41 Figure 4-14: Cost shares for maize production with traditional and improved practices in plateau central agro-ecological zone ..........................................41 Figure 4-15: Margins in plateau de l�est agro-ecological zone, Kigali rural province�..43 Figure 4-16: Net revenue of family labor on household land for selected crops in Bugesera agro-ecological zone .....................................................................44 Figure 4-17: Remuneration rate for sorghum with traditional (M1) and improved (M2) practices in Bugesera agro-ecological zone...................................................44 Figure 4-18: Cost shares for sorghum production with traditional (M1) and improved Practices (M2) in Bugesera agro-ecological zone .........................................45

viii
LIST OF ABBREVIATIONS AE Adult equivalent DAP Diammonium phosphate FAO Food and Agriculture Organization of the United Nations Frw Rwanda francs (550Frws = $1)
FSRP Food Security Research Project
GOR Government of Rwanda
ISAR National Agricultural Research Institute of Rwanda LISA Low-Input Sustainable Agriculture MINAGRI (Rwanda�s) Ministry of Agriculture, Forestry and Livestock MINECOFIN (Rwanda�s) Ministry of Finance and Economic Planning PASAR Projet d�appui à la sécurité alimentaire au Rwanda (Food security support project)
1
CHAPTER 1
INTRODUCTION
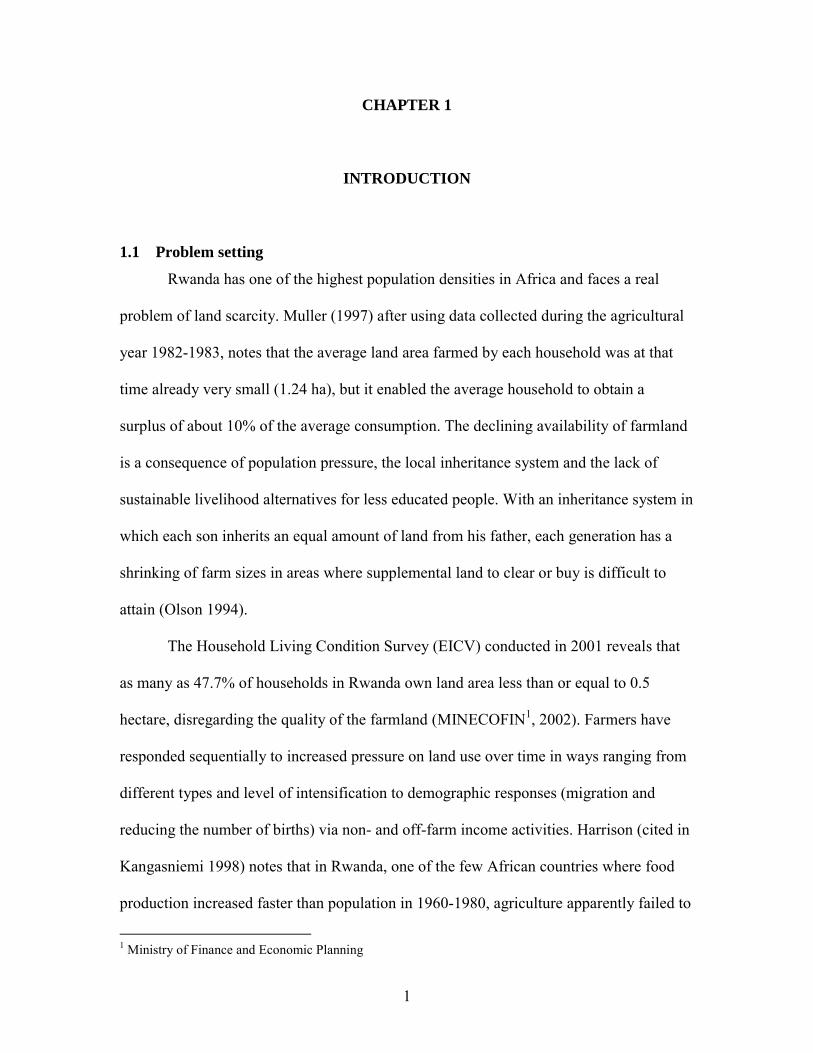
1.1 Problem setting
Rwanda has one of the highest population densities in Africa and faces a real
problem of land scarcity. Muller (1997) after using data collected during the agricultural
year 1982-1983, notes that the average land area farmed by each household was at that
time already very small (1.24 ha), but it enabled the average household to obtain a
surplus of about 10% of the average consumption. The declining availability of farmland
is a consequence of population pressure, the local inheritance system and the lack of
sustainable livelihood alternatives for less educated people. With an inheritance system in
which each son inherits an equal amount of land from his father, each generation has a
shrinking of farm sizes in areas where supplemental land to clear or buy is difficult to
attain (Olson 1994).
The Household Living Condition Survey (EICV) conducted in 2001 reveals that
as many as 47.7% of households in Rwanda own land area less than or equal to 0.5
hectare, disregarding the quality of the farmland (MINECOFIN1, 2002). Farmers have
responded sequentially to increased pressure on land use over time in ways ranging from
different types and level of intensification to demographic responses (migration and
reducing the number of births) via non- and off-farm income activities. Harrison (cited in
Kangasniemi 1998) notes that in Rwanda, one of the few African countries where food
production increased faster than population in 1960-1980, agriculture apparently failed to
1 Ministry of Finance and Economic Planning

2
keep pace with population growth after the mid-1980s, when the land frontier became
virtually exhausted.
In spite of the problem of land scarcity, agriculture and livestock are still
considered as the primary engine of economic growth in Rwanda. It is assumed indeed
that increased agricultural incomes must be achieved by transforming Rwanda�s
traditional agriculture through the use of new and improved inputs. The Government of
Rwanda in its �poverty reduction strategy paper� (MINECOFIN 2001) refers to recent
studies (Kelly and Murekezi 2000, Kelly et al. 2001, Mellor 2001) when expressing its
motivation on promoting the use of chemical fertilizer. These studies show that as so
little fertilizer is used (five percent of farmers on three percent of total cultivated area) it
has very high marginal returns and, if correctly used, would be highly profitable for
farmers. The increase and more efficient use of fertilizer is expected to contribute 4% of
the 5.3% growth of the agriculture sector. The GOR2 intends to rely on a selected range
of commodities to achieve economic growth. Key among these commodities are climbing
beans, maize, sorghum and soybeans which are selected because of their high nutritional
value, their importance in the cropping pattern of the country and adaptability to the
country�s agro-climatic zones, and for their potential to respond to organic and chemical
inputs.
Land scarcity in Rwanda and its potential improvements have been the subject of
many studies and many questions have been answered in the past, but the answers must
be constantly reexamined in light of the changes that occur with time. The purpose of this
study is to inform agricultural policies in Rwanda by evaluating the profitability of some
food crops in the context of the current government policy of promoting the use by 2 GOR �Government of Rwanda�

3
farmers of improved inputs. More specifically, we ask what are the magnitudes of costs
associated with the use of fertilizer on climbing beans, maize, sorghum and soybeans
grown in the province of Kigali rural and whether revenues are big enough to generate
attractive margins. We also analyze some recent survey data seeking to put crop
production in a wider perspective of the household�s limitations and/or opportunities
when dealing with the issue of improving crop yields on farmer�s land.
Previous studies on fertilizer profitability in Rwanda, in particular the Kelly and
Murekezi (2000) study, used the value/cost ratio approach to estimate the probable
financial returns to the use of fertilizer for selected crop/zone combinations. The
value/cost ratio calculated in this study is the incremental gross revenue due to the use of
mineral fertilizer divided by the incremental cost of fertilizers. The data needed to
estimate this criterion are then the gross revenues and the fertilizer costs from without
and with mineral fertilizer alternatives. Treatments are classified as profitable at the farm
level when v/c ratio equals or exceeds 2. The above mentioned authors� opinion is that
cases where the v/c ratio is 3 or better are cases where fertilizer promotion is most likely
to succeed in short-run. The analysis in their study was done with prices prevailing from
1995 to 1999 whereas this paper uses 2000- 2001 prices. The decline of output prices
since then would explain some of the differences in the results
The v/c ratio approach like any other analytical tool has strengths and
weaknesses. It is the more appropriate when the profitability study deals with a high
number of crop/zone combinations since it is not very demanding in terms of quantity of
data. The most important weakness of this approach is then the fact that it is very
sensitive to the change of inputs and output prices since very few items are considered.

4
When comparing profits or profitability among different crops, the budget analysis
approach is stronger than v/c ratio since it takes into account all income and costs of a
specific crop to provide a more thorough estimate of its profit.
The contribution of this paper is twofold. First, fertilizer profitability is analyzed
with full budget analysis and conclusions are drawn about what technology choices
farmers are likely to make given differences in returns to limited resources such as labor
and cash. Second, the study focuses on the province of Kigali rural and draws
conclusions about what the different profitability results imply about possible needed
changes in extension recommendations for that province.
This paper has focused on Kigali rural province for two major reasons. First,
according to the Government of Rwanda�s Poverty Reduction Strategy Paper, regionally,
the increased input use would be concentrated in three provinces, Gisenyi, Ruhengeri and
Kigali rural. Second, Kigali rural province includes some of the poorest areas in the
country and has the lowest level of fertilizer use compared to the two other provinces.
Gisenyi and Ruhengeri provinces have the highest level of fertilizer use in Rwanda due
mostly to potato production.
5
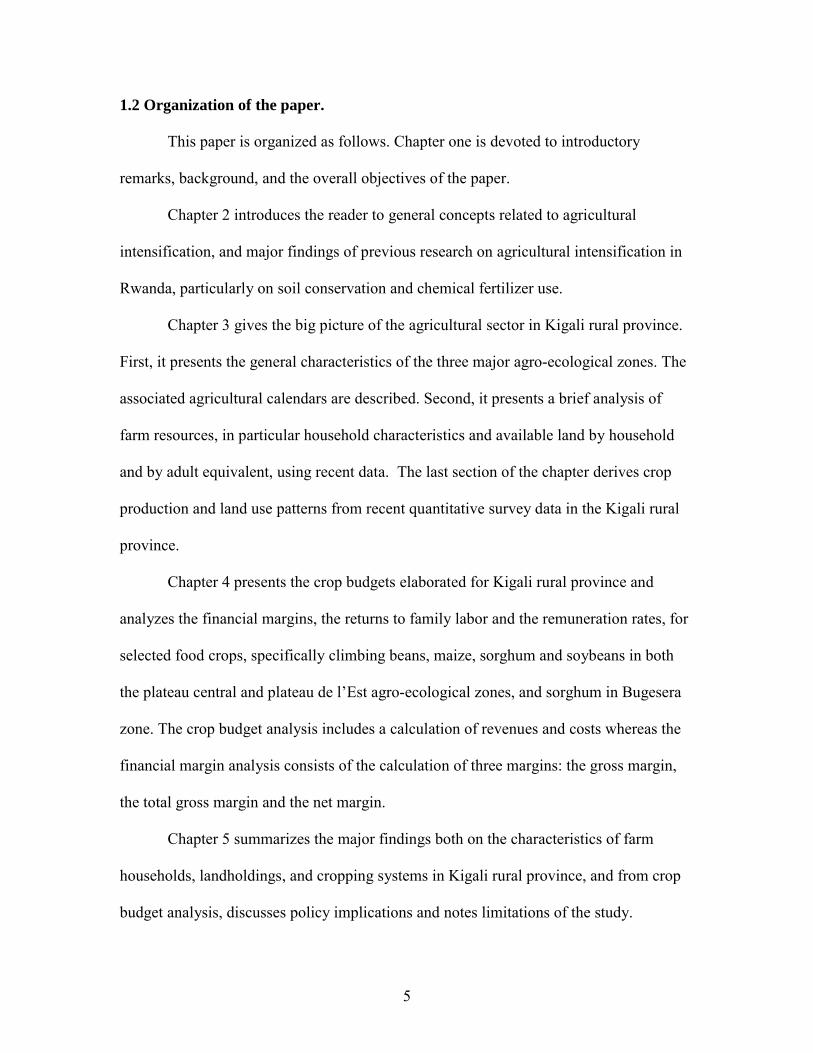
1.2 Organization of the paper.
This paper is organized as follows. Chapter one is devoted to introductory
remarks, background, and the overall objectives of the paper.
Chapter 2 introduces the reader to general concepts related to agricultural
intensification, and major findings of previous research on agricultural intensification in
Rwanda, particularly on soil conservation and chemical fertilizer use.
Chapter 3 gives the big picture of the agricultural sector in Kigali rural province.
First, it presents the general characteristics of the three major agro-ecological zones. The
associated agricultural calendars are described. Second, it presents a brief analysis of
farm resources, in particular household characteristics and available land by household
and by adult equivalent, using recent data. The last section of the chapter derives crop
production and land use patterns from recent quantitative survey data in the Kigali rural
province.
Chapter 4 presents the crop budgets elaborated for Kigali rural province and
analyzes the financial margins, the returns to family labor and the remuneration rates, for
selected food crops, specifically climbing beans, maize, sorghum and soybeans in both
the plateau central and plateau de l�Est agro-ecological zones, and sorghum in Bugesera
zone. The crop budget analysis includes a calculation of revenues and costs whereas the
financial margin analysis consists of the calculation of three margins: the gross margin,
the total gross margin and the net margin.
Chapter 5 summarizes the major findings both on the characteristics of farm
households, landholdings, and cropping systems in Kigali rural province, and from crop
budget analysis, discusses policy implications and notes limitations of the study.

6
CHAPTER 2
BRIEF REVIEW OF AGRICULTURAL INTENSIFICATION LITERATURE
AND ITS RELEVANCE TO RWANDA
2.1 General Concepts
2.1.1 Introduction
Two major views characterize the literature on the idea of diminishing returns, the
neo-Malthusian and the Boserupian. Malthus along with other classical economists
believed that when population grows, farmers increase production either by cultivating
poor lands (extensive margins) or by adopting practices previously considered too
laborious (intensive margin), resulting finally in a reduction in access to food. Although
classical economists such as Malthus were well aware that as population densities grew,
people would innovate and adopt more productive methods, they failed to appreciate how
technical progress could help to increase the frequency of cropping by reducing the need
for fallows (Boserup 1989). Boserup (1965, 1981), states that while population pressure
first leads to diminishing returns, inducing people to adopt more labor-intensive
practices, it also enables and encourages them to develop and adopt innovations that
mitigate or even reverse the decline in labor productivity that would otherwise follow.
She recognizes, however, that if people fail to invent or adopt other measures of fertility
restoration when they shorten the period of fallow, they may mine their soils and be left
with the choice between starvation and/or migration.
The invention or adoption of innovations that help to restore soil fertility is
induced by a couple of factors. Boserup (1989) demonstrates how changes in population

7
density in a variety of environments had pushed agricultural societies from one farming
system to another. Kates, Hyden and Turner II (1993) consider the relationship between
population and agricultural intensification as being modified by two sets of variables:
market access and environmental conditions. They hypothesize that the success of
agricultural intensification in responding to demographic change depends crucially on the
environmental and market conditions in which it is taking place. Harrison et al. (1987)
found that improvements in agricultural productivity are dependent on simultaneous
fulfillment of several conditions. They said that farmers must have a reasonable
expectation of a remunerative market outlet, and have access to new and more productive
technologies and physical inputs (land, labor, and capital goods) needed to produce under
more efficient arrangements. In this section we discuss in brief how some of the above
factors affect intensification, especially market incentives, environmental conditions,
availability of intensification techniques and capacity to invest.
2.1.2 Market incentives
Farm-level incentives to invest are determined by returns (financial or physical)
on investments that households make to generate an income from farm assets. Better
returns to agriculture lead in general to more land conservation and soil fertility
investments. Schultz (1964) and Hayami and Ruttan (1985) argued that small farmers
respond to market incentives. Reasons behind farmers� responses are threefold. First,
output markets can make intensification profitable and provide farmers with resources to
invest in land. Second, access to markets and relative market prices influence crop
choice. Third, input markets may promote or discourage specific forms of intensification.

8
In general all input use (except for land) contributes to intensification. However
some of them may be unsustainable, bringing short-term gains at the expense of long-
term production losses. Chemical fertilizer is often regarded as such an input. Cheap
mineral fertilizer may encourage farmers to neglect soil conservation or the organic
fertilizers that would provide both the nutrients and the humus. This neglect results in the
loss of organic matter. On the other hand, ceteris paribus, mineral fertilizer increases
crop biomass, which means better crop cover against erosion and more organic matter
that can be used to improve soil quality. A German project (PAP) that sponsored research
on �ecofarming� in Rwanda and which originally had been quite critical of �artificial
fertilizer,� found that the leguminous plants were difficult to establish on degraded lands
without mineral fertilizer (Egger and Rottach, cited in Kangasniemi 1998).
Briefly said, paraphrasing Reardon et al. (1995), market conditions that reward
farmers for investing in their lands, for using inputs and techniques that maintain or
improve land fertility, and for choosing crops that provide high returns without mining
the soil contribute to sustainable intensification.
2.1.3 Environmental conditions
Ruthenberg�s classical work on farming systems (1980) reveals that while
population growth leads to the evolution of farming systems, environment limits the
options. When discussing LISA3 and intensification technologies that combine elements
of LISA with the use of fertilizer and equipment as a technological option for African
agriculture development, Reardon (1998) demonstrates how the relative emphasis given
3 LISA is a broad technological option for intensification that uses little inorganic fertilizer and equipment: Low-Input Sustainable Agriculture.

9
to each path differs by agroecological zone. He shows that in the more fragile
agroclimates, LISA is more appropriate, while in the more favorable agroclimates, crop
output growth and soil fertility needs are best served by supplementing the organic matter
application and soil conservation techniques of LISA with capital-using intensification.
The warmer and more humid the climate, the greater is the degradation of tropical
soils under permanent upland cultivation without mineral or organic fertilizer. In fact,
high temperature promotes rapid decomposition and high rainfall contributes to leaching
and erosion. The loss of organic matter increases the leaching of nutrients to the subsoil,
while reducing infiltration. Soils located on steep slopes, impoverished in organic matter
and water infiltration capacity, and not protected against erosive impact of raindrops, are
more vulnerable to large soil losses.
On the other hand, the fertility loss is generally less severe on the cool, tropical
highlands, in semi-arid climates, and on fertile volcanic soils. Continuous cultivation of
annual crops can be sustainable in these environments if some anti-erosive techniques are
implemented. Although cooler climates make tropical highlands more conducive to
permanent cultivation than lowlands, suggesting better prospects for intensification,
many of the highlands already have high population densities. Moreover, highlands often
have steep slopes and poor, shallow soils, which make them vulnerable to erosion.
Uwizeyimana cited in Kangasniemi (1998) describes how intensification is failing in
Rwanda on the chain of mountains that form the divide between the basins of the Congo
and the Nile, concluding that agricultural intensification there is reaching a dead end. In
contrast to the generally impoverished Congo-Nile divide highlands, the volcanic part of

10
the divide is Rwanda�s potato basket with high yields, reasonable incomes and moderate
level of soil losses.
In sum, environmental conditions such as rainfall, soil type, steepness of slope,
and temperature constitute strong determinants of agricultural intensification. Prospects
are good for regions with fertile soils, abundant rainfall and modest rates of organic
matter decomposition.
2.1.4 Availability of intensification techniques
All other factors held constant, prospects for sustainable agriculture are good for
populations that have a variety of attractive intensification techniques to choose from.
Lipton (1990) argues forcefully that the principal constraint of agricultural growth in
much of Africa is the poor supply of improved agricultural technologies.
Technical innovations that save scarce factors of production are relatively
profitable for agricultural producers. Farmers are induced by shifts in relative prices of
these innovations. Ruttan and Hayami (1998) have found that farmers press the public
research institutions to develop the new technologies and demand that agricultural supply
firms supply modern technical inputs that substitute for the more scarce factors. In
Ruhengeri, Rwanda, progress had been partly based on the development of improved
potato varieties by ISAR4, the provision of fungicides they needed, and the construction
of a paved road from the region to the capital, the main market for potatoes.
4 Rwanda Agricultural Research Institute

11
2.1.5 Capacity to invest
While the incentive to invest in land and to adopt the appropriate intensification
techniques is in place, households may not have resources to invest (Clay et al., 1998).
Resources include cash for purchase, human capital, and own-labor sources for home
production of capital goods.
Kelly et al. (2001b) illustrate the concept of capacity to invest when trying to
explain the big gap between potential fertilizer demand and fertilizer effective demand in
Rwanda. They say that �if farmers do not know about the economic incentives
associated with fertilizer, there is a human capital constraint that needs to be lifted by
improving knowledge; if farmers do not purchase fertilizer because they do not have the
financial capital, there is a need to build financial capital through savings and credit
programs; if farmers do not purchase fertilizer because they do not have the physical
capital to use it properly (anti-erosion investments, animals to provide complementary
manure, farming tools and equipment, etc.), the constraint needs to be addressed for agro-
economic potential to be translated into effective demand.�
In sum, relatively small differences in initial conditions may put households and
communities on diverging paths towards strikingly dissimilar outcomes. For instance, a
household fortunate enough to own a head of cattle may reach higher incomes with the
manure and be able to invest in fertilizer use. Similarly, off-farm incomes may be the
source of liquidity that allows households to invest in intensification (Reardon 1997).
2.2 Agricultural intensification in Rwanda
This section does not discuss either the current policy on agricultural
intensification or the evolution over time of agriculture development in Rwanda. It just

12
reviews briefly the literature that directly relates to the subsequent understanding of
agricultural intensification in Rwanda, implicitly highlights the challenges that policy
makers face and gives a brief explanation of how this paper makes a contribution to the
understanding of fertilizer use in Rwanda.
The GOR through the Ministry of Agriculture completed in the late 90s the
formulation of the agricultural strategy that focused, among other things, on: (a) the
intensification of agriculture through complete restructuring of input provision services,
(b) support to farmer groups in order to strengthen farmers� participation in technology
generation and dissemination, (c) institutional reforms for enhanced extension and
research services, (d) the rehabilitation of traditional export crops for greater
competitiveness, (e) the rehabilitation of marshland and hillside farming to achieve
greater efficiency and sustainability of production and (f) the promotion of regional
specialization, coupled with product and market diversification.
Jayne et al. (2001), citing Gugert and Timmer, note that structural transformation
requires broad-based rural income growth, and a broad-based rural income growth is
facilitated by relatively egalitarian distribution of rural assets within the small farm
population. They observe that around 50% of the rural small farm population cultivates
less than 0.15 hectares per capita in densely populated countries such as Rwanda and
Ethiopia, and less than 0.3 hectares per capita in supposedly land-abundant countries such
as Zambia and Mozambique. They then notice that without major changes in access to
land the following processes in these countries are likely to continue: (1) farm sizes are
likely to decline over time; (2) landlessness and near landlessness will emerge as
increasingly important social and economic problems unless growth in the non-farm

13
sectors can be substantially increased; and (3) given existing agricultural technology and
realistic projections of future productivity growth potential, large segments of the rural
population will be unable to climb out of poverty through agricultural growth on their
own.
Farmers everywhere have responded to land use pressure and concomitant
declining productivity by intensifying agriculture and used new efficient technologies.
Empirical research on intensification in Africa has illustrated two intensification paths
initially described by Boserup (1965) and labeled by Clay et al. (1998) as capital-led and
labor-led paths. In Rwanda capital farm inputs include (1) land conservation
infrastructure, (2) organic inputs, and (3) chemical inputs.
Clay et al. (1998) using a nationwide sample of Rwandan farm households found
that (1) the vast majority of farmers fall between the two extremes of the labor-led and
the capital-led intensification paths in their pure form, (2) in general, investments in land
conservation and fertility are greater on land owned (not rented) by farmers, where slopes
are of medium steepness, where land is less fragmented and is cultivated for a shorter
time, and on small farms and those with little land in fallow, woodlot, and pasture, (3)
nonfarm income affects farm investment and enhances the capacity of households to
follow the capital-led intensification path, (4) short-term relative economic profitability
of cropping, commercialization, lower price risk, and more accessible infrastructure
promote the use of organic and chemical inputs to enhance soil fertility, and (5) the
knowledge farmers gained from extension encouraged sustainable production practices,
specifically the use of organic matter and the building of terraces.

14
Along with the landholding and household-level intersectoral links, issues that
need strong and appropriate policy, agricultural intensification in Rwanda is determined
by differences in the capacity to invest. As partially mentioned in a previous section,
Kelly et al. (2001a and 2001b) found that the most common reason of not using inorganic
fertilizer in Rwanda is the lack of knowledge and the next most common is the high
fertilizer prices. The interpretation they give to the first reason is that farmers� knowledge
of the benefits and of how to use the fertilizers is not strong enough to stimulate use. The
second reason is more related to investment constraints than to fertilizer prices per se. In
fact, in Kelly and Murekezi. (2000), results on fertilizer value/cost ratios show that
commodities such as maize, sorghum, Irish potato, sweet potato and cabbage show
profitable returns to fertilizer in one or more agro-ecological zones of Rwanda. However
only Irish potatoes are grown with mineral fertilizer by many farmers in Rwanda,
especially in the northwestern provinces, mostly in Ruhengeri and Gisenyi.

15
CHAPTER 3
BACKGROUND ON AGRICULTURE IN KIGALI RURAL PROVINCE
In this chapter, especially in its second part, data are analyzed from two recent
surveys on nationwide stratified-random samples. The Ministry of Finance and Economic
Planning implemented one of them, the Rwandan Integrated Household Living Condition
Survey (EICV) between July 2000 and July 2001. The Food Security Research Project
(FSRP) conducted the other one, the seasonal agricultural production surveys, from the
agricultural year 2000 to the agricultural year 2002, on a sub-sample of the EICV survey.
3.1 Physical environment
The Kigali rural province has five natural regions, the hautes terres du
Buberuka (5B), the plateau central (4D), the plateau de l�Est (4F), the Bugesera (6A) and
the Mayaga (6B) (Berdinger 1993). The first one represents just a small portion of the
province and has very little economic role for the Kigali rural province. The last two are
most of the time taken together given their similarities in term of agricultural crop
production systems. Hence, three agro-ecological zones, that is, Bugesera/Mayaga zone,
Plateaux de l�Est and Plateau central, are of major interest and constitute focal points of
different analyses in this study.

16
3.1.1 General Characteristics
The Bugesera agro-ecological zone is a region with less fertile soils
(xerokaolisols) on plateaus separated by small lakes and wetlands. Plateaus are covered
by dry shrub savannahs. The altitude varies between 1,400 and 1,500. The annual
average rainfall is about of 900mm, with contrasting dry seasons and rainy seasons, but
irregular from year to year, with very long dry periods.
The plateau de l�Est zone is characterized by mean altitude of 1500m, mean
rainfall of 1000mm, and deep soils with medium to good nutrient levels. Two dry seasons
(mid-June to mid-September and December-January) alternate with two rainy seasons.
Mean temperatures vary between 19 and 22.5 C degrees and are stable through the year.
The plateau central is a zone whose altitude varies from 1460 m to 2250 m with
steep slopes that cause severe soil erosion. Clay-sandy soils, most of the time laterites,
are in general less deep and highly impoverished in nutrients because of the erosion.
Rainfall is an average of 1100mm/year, varying from 1000 to 1300mm/year.
3.1.2 Agricultural calendar
The agricultural year has two major seasons, season A (September-February) and
season B (March-July) (Table C-1). A third one that takes place during the June-August
dry season concerns crop production in marshlands. The agricultural calendar presented
in this section considers mostly crop production during the two major seasons for the
three major agro-ecological zones in Kigali rural province. Furthermore, for a semi-
subsistence agriculture where the farming system is characterized by mixed crops and no
specialization in crop production, the farmer produces a number of crops that can be
grouped in major, intermediate and minor crops, in terms of area allocated on each crop.

17
3.2 Household assets
The farm is described in this section in term of demography, landholding and use,
and crop production.
3.2.1 Human resources
In a semi-subsistence rural economy as is the case for Rwanda, the size of the
household, the gender and age of the head of the household, and the level of education of
the household head are some of the very important characteristics of the farm.
3.2.1.1 Household population
A average household in Kigali rural province has approximately 5 people (Table
3-1). Figure 1 shows explicitly that most of the farms have a size of 2 to 8 people and the
aggregate of those with 3 to 6 people constitutes more than 50% of total households. This
is very important in the context of shortage of land. When land is scarce, as the size of
the household increases, competition for land use between food crop and cash crop
increases and the result is a decrease in household cash income.
Table 3-1: Mean household size in the three major agro-ecological zones
Mean household size Mean adult equivalent
Plateau de l�Est 4.7 4.3
Bugesera 4.8 4.3
Plateau central 5.1 4.6
Source: Computed from EICV data/ MINECOFIN survey (July 2000 � July 2001)

18
Figure 3-1: Distribution of households (percent of households per category of household size), Kigali rural, Rwanda, 2001
0
5
10
15
20
25
1 2 3 4 5 6 7 8 9 10 11 12Size of household
% o
f hou
seho
lds
P.de l'EstBugeseraP.central
Source: Generated from EICV data/ MINECOFIN survey (July 2000 � July 2001)

19
3.2.1.2 Household head characteristics
A. Age and gender of the household head
The nongovernmental organization �Human rights watch� (2001) notes that
following the 1994 war in Rwanda, a substantial number of heads of household are drawn
from vulnerable sectors of the society, that is, women, children, and elderly. Figures in
table D-1 confirm that observation for Kigali rural province. The Plateau central agro-
ecological zone has both the highest proportion of female-headed households and the
highest elderly-headed households.
The comparison of the 2001 data (Table D-1) to those of a study done in the early
1980s reveals a substantial increase of female-headed households. A socioeconomic
study for the region of Bugesera (MINAGRI 1981) found that 93% of households were
headed by males, suggesting a decrease of about 30% compared to the 63% of
households headed by male in 2001. The proportions of elderly household heads are in
the same range (9% for 1981 and 11 for 2001) but diverge for the gender of those
household heads. In 1981, 7 out of the 9% were male whereas in 2001, 8 out of the 11 %
were females.
B. Level of education of the household head
The proportion of illiterate household heads is more than 50% (Table D-2) in the
three agro-ecological zones and constitutes a very big constraint to the diffusion and
adoption of improved technologies. These results show also that the proportion of female
illiterate households is relatively high compared that of male household heads. From 100
households in the plateau de l�Est agro-ecological zone, 40 of them are headed by female
and 37 out of those 40 females are illiterates whereas only 17 out of the 60 male

20
household heads are illiterate. The proportion of female illiterate household heads is
lower in the two other agro-ecological zones but still higher than that of males.
3.2.2 Household landholdings
Rwanda and in particular Kigali rural province has limited natural resources,
including a shortage of land due to the mostly hilly and mountainous terrain and costly-
to-use wetlands. According to the EICV results, on average, 79.4% of households in
Rwanda own some farmland (MINECOFIN, 2001). The practices of land renting, share
cropping and lending are common in Kigali rural province.
3.2.2.1 Size of household landholdings
The average farm in Kigali rural province (1.22 hectares) is higher than the
average at the national level (0.86 hectares) (Table D-3), with some variation by agro-
ecological zone. The largest average farm size appears in Plateau central, with the
smallest in Bugesera.
The land distribution patterns shown by the data in table D-3 and D-4 indicate that
land is somewhat concentrated in the upper income quartile households. On a per farm
basis, the upper 25% (large landowners) of households hold 61 and 54 percent of land,
respectively, at the national level and in Kigali rural province. A very similar pattern
persists even when the size of the household in terms of adult equivalents is taken into
account (Table D-4). Within the Kigali rural province the same trend is observed across
the agro-ecological zones. The fourth quartile of households (large landowners) holds
47%, 52% and 62% of land, respectively in Bugesera, plateau de l�est and plateau central
agro-ecological zones.

21
For the lowest quartile of households (small landowners), the farm size is very
small, on average about one-third of a hectare in Kigali rural province and less than
one-fifth at the national level. The first quartile of households (small landowners) in the
three agro-ecological zones of Kigali province hold less than 10% of land when we
consider both the land area farmed by a household (Table D-3) and the land area farmed
by an adult equivalent (Table D-5).
The Plateau central agro-ecological zone has both the highest average farmland
area per household (1.58 hectares) and average farmland area per adult equivalent (0.35
hectare) (Tables D-3 and D-4).
3.3 Crops
3.3.1 Crop productions
As said in a previous chapter, Rwanda has two main agricultural seasons per year,
although bananas, roots and tubers, and to some extent other crops are harvested
throughout the year. Figure 3 shows the Kigali rural province mean production estimates
per year of major crops and some minor crops during three agricultural years (2000 �
2002). For cross-crop comparability, all production is expressed in terms of food energy.
Cassava and sweet potato contribute 53%, 54.6% and 57.3% of total household
food energy, respectively, for plateau de l�est, Bugesera, and plateau central agro-
ecological zones. Beans constitute the third contributor to the household food energy just
before sorghum and maize in plateau de l�est and Bugesera, and before sorghum and
minor crops all together in plateau central agroecological zone (Figure 3-3).

22
Compared to the needs of the average household (10,330 kcal)5, household crop
production in the Plateau de l�Est and Bugesera/Mayaga cover all the needs of the
household, suggesting that the household has some extra production for the market
(Figure 3-4). On the other hand, a household in the Plateau central zone has to buy some
food on the market as a complement to its own production since it produces less than
what is needed.
5 The coefficients used to compute the needs of the average household (5 people) are: 2600 kcal for a male of 10 years old or more, 2350 for a female of 10 years old or more, 2190 for a child of 7 to 9 years old, 1830 for a child of 4 to 6 years old and 1090 for a child of 1 to 3 years old (MINAGRI 1981)

23
Figure 3-2: Annual crop production (in kcal) per household for main crops in Kigali rural province, Rwanda, Average 2000-2002.
Source: Table E-7
Figure 3-3: Total energy produced, available per day per household in the three major agricultural zones in Kigali rural province, Rwanda, Average 2000-2002.
Source: Table E-7
0.00.20.40.60.81.01.21.41.6
Beans
Sorghu
mMaiz
e
Cassa
va
Sweet P
otato
Cookin
g Ban
ana
Beer B
anan
a
Table
Banan
a
Peanu
ts
Other c
rops
Milli
ons
Tota
l kca
l/yea
r/HH
Plateau de l'estBugeseraPlateau central
14.2613.55
9.87
0
2
4
6
8
10
12
14
16
Plateau de l'est Bugesera Plateau central
Thou
sand
s
Tota
l kca
l/day
/HH
24
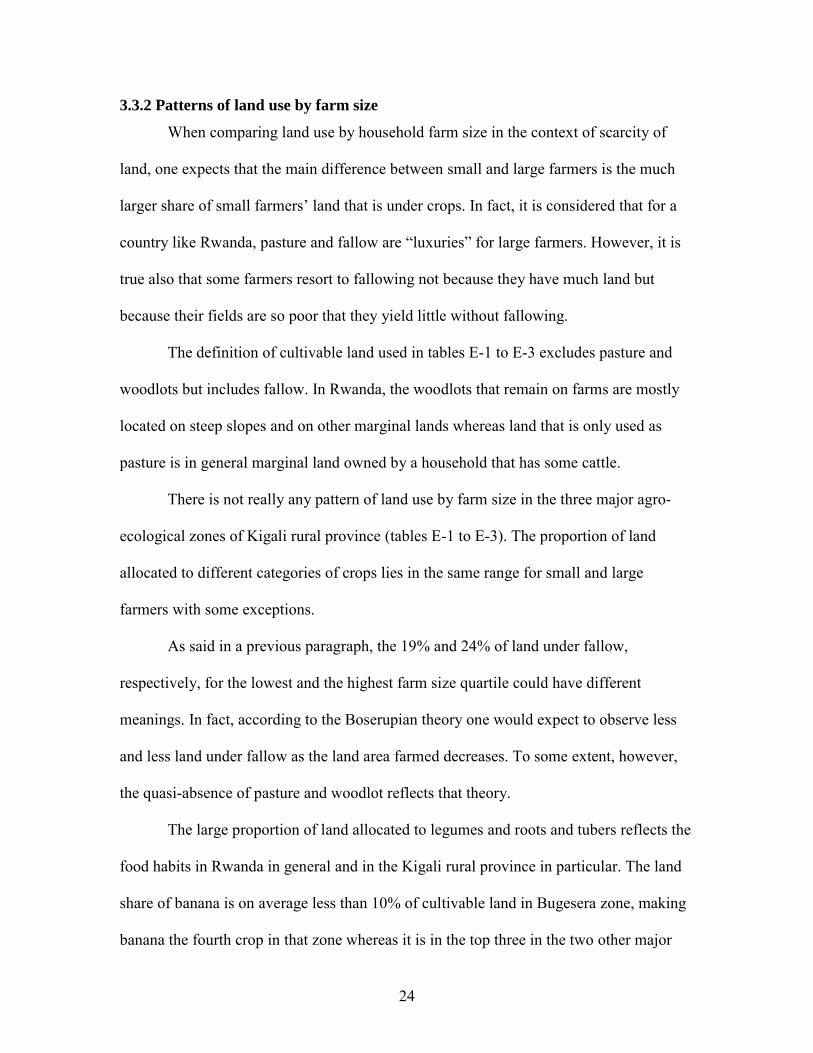
3.3.2 Patterns of land use by farm size
When comparing land use by household farm size in the context of scarcity of
land, one expects that the main difference between small and large farmers is the much
larger share of small farmers� land that is under crops. In fact, it is considered that for a
country like Rwanda, pasture and fallow are �luxuries� for large farmers. However, it is
true also that some farmers resort to fallowing not because they have much land but
because their fields are so poor that they yield little without fallowing.
The definition of cultivable land used in tables E-1 to E-3 excludes pasture and
woodlots but includes fallow. In Rwanda, the woodlots that remain on farms are mostly
located on steep slopes and on other marginal lands whereas land that is only used as
pasture is in general marginal land owned by a household that has some cattle.
There is not really any pattern of land use by farm size in the three major agro-
ecological zones of Kigali rural province (tables E-1 to E-3). The proportion of land
allocated to different categories of crops lies in the same range for small and large
farmers with some exceptions.
As said in a previous paragraph, the 19% and 24% of land under fallow,
respectively, for the lowest and the highest farm size quartile could have different
meanings. In fact, according to the Boserupian theory one would expect to observe less
and less land under fallow as the land area farmed decreases. To some extent, however,
the quasi-absence of pasture and woodlot reflects that theory.
The large proportion of land allocated to legumes and roots and tubers reflects the
food habits in Rwanda in general and in the Kigali rural province in particular. The land
share of banana is on average less than 10% of cultivable land in Bugesera zone, making
banana the fourth crop in that zone whereas it is in the top three in the two other major

25
agro-ecological zones. The low land share of banana is not explained by the
incompatibility of the ecological conditions to that crop but by the destruction of the
banana plantations by a two-year drought.
Compared to the two other agro-ecological zones, the Plateau central has two
particular aspects. First, as one would expect, the proportion of cultivable land under crop
decreases with the increase of land available per adult equivalent. Second, a quite high
proportion of land is used for woodlots. The plateau central is a region with steep slopes
and hence with more land not suited for crops.
In table E-4 to E-6 legumes, cereals and roots and tubers are disaggregated in
specific showing the main crops in terms of proportion of land allocated to each one of
them. The percentage of cultivated land is used in these tables instead of cultivable land
which is used the three preceding tables.
Beans constitute the major legume in the three major agro-ecological zones. Other
legumes are almost nonexistent in plateau de l�est zone. Peanuts and soybeans are grown
in Bugesera but at a very low land share whereas peas constitute the second legume after
beans in the plateau central zone.
Cereals in Kigali rural province include sorghum and maize. Sorghum has the
lion�s share of the land allocated to cereals in the three agro-ecological zones. Maize is
not a staple food in Kigali rural province and in most other provinces in Rwanda. The
maize share of cultivated land is on average less than 5%, whereas the average sorghum
share is more than 10%, in Kigali rural province.
Roots and tubers include two major crops, sweet potato and cassava and, two
minor crops, white potato and taro (colocasia). One-fifth of cultivated land is allocated to

26
cassava in Bugesera zone (table E-5) making it the second most important crop in that
zone, after beans. The importance of cassava in the three major agro-ecological zones of
Kigali rural province is mostly explained by the fact that it provides higher income
returns than other crops on less fertile soils.

27
CHAPTER 4
CROP BUDGETS: ELABORATION AND ANALYSIS
A crop budget lists all income and costs of a specific crop to provide an estimate
of its profits. Crop profits are expressed in terms of gross or net margin. Calculations are
developed on a single common unit, in general the �hectare�. A crop budget allows not
only comparison of profitability among different crops on the same farm but also
comparison of profitability of a given crop under either different levels of the same single
technology or different technologies.
In this chapter crop budgets are elaborated for the three major agro-ecological
zones of Kigali rural province. Climbing beans, maize, sorghum and soybeans budgets
are elaborated for both the plateau central and plateau de l�est agro-ecological zones
whereas only sorghum budgets are elaborated for the Bugesera zone.
4.1 Elaboration of crop budgets
4.1.1 Technical modules
Two major types of modules are distinguished:
- Traditional module
This module represents the traditional mode of production. Fertilizer consists of
compost and/or animal manure used most of the time at a very low level, compared to
what research recommends. Seeds are mostly from farmers� own production, sometimes
bought from other farmers in local markets. This module is almost the only one used by
farmers in Kigali rural province.

28
- Improved techniques
This module corresponds to the use of organic and chemical fertilizer, pesticides,
improved seeds and other improved cultivation techniques. This module is almost
nonexistent on land area farmed by individual farmers. It appears mostly in lands used by
farmer associations that get inputs from rural development projects as loans.
4.1.2 Agricultural inputs
The costs of small agricultural equipment, seeds, fertilizer, crop protection
products and labor were incorporated in the budgets. The seasonal cost of small
agricultural equipment (tools) was estimated in two steps. Assuming that for a hectare of
a crop a given number of tools can be replaced after three years of use, that number was
estimated and then the associated cost was divided by six (six agricultural seasons in
three years) to get the seasonal cost. Labor cost was evaluated using the wage of
agricultural labor.
The cost of seeds, fertilizer and crop protection products were determined from
their local market prices. For some crops such as beans and soybeans, household own-
production is so low that the next season the household buys the seed in the local market,
whereas households use in general seed from their own production for sorghum and
maize. Beans and soybeans seeds are then classified as monetary variable costs when
sorghum and maize seeds are considered as non-monetary variable costs. The costs of all
improved seeds are monetary variable costs. Since there is no real market for improved
seeds in Rwanda for the crops considered in this study, their costs per hectare were those
used by the improved seeds project in Rwanda (ASSR), a government institution that
produces and disseminate those seeds.

29
4.1.3 Yields
Traditional module yields were estimated from data collected by the Food
Security Research Project on crop production and area cultivated. The survey was
designed to be representative at the province level with the �cellule� as the survey unit,
each cellule having twelve households. To estimate yields at a lower level than the
province, that is, at an agro-ecological level, data from farmers in cellules falling in the
agroecological zone within Kigali rural province were used. Considering the topography
of Rwanda and the fact that households at the cellule level were randomly selected, crop
yield estimates are likely to be close to the actual ones.
The yields for �improved techniques� were estimated from a study done in 1997
by an agricultural specialist of the Ministry of Agriculture, using FAO data (improved
techniques based on NPK) (MINAGRI 1997) and from Kelly and Murekezi (2000) for
improved techniques based on DAP. The first study came up with a range of yields that
can be achieved using the fertilizer �NPK� for each crop at the national level, and
average yields for low, medium and high fertility sites. In this study, crops in plateau de
l�est and Bugesera were assigned medium average yields whereas plateau central zone
was assigned low average yields, given the quality of soils in these zone mentioned in a
previous chapter or the agronomic performance of specific crops (Sorghum in Bugesera
zone). Kelly and Murekezi study has the fertilizer (DPA6 + Urea) response for selected
crops and agro-ecological zones in Rwanda.
Yields in these two studies are assumed to be higher than farmers� yields because
of higher management, smaller plot size, precision in harvesting date, and better
harvesting methods. 6 Diammonium Phosphate

30
The yields from the above two studies were scaled down by 20% to approximate
the yields that farmers can obtain on their farms. The difference between yields from
experimental fields and those from farmers� fields in similar cropping conditions would be
the basis for the scaling down. For example, if an experimental yield is 3000 kg/ha7 and
those from farmers� practice are 2700 kg/ha, the difference is 300 kg/ha, corresponding to a
10% reduction.
The lack of information that could be used to generate more accurate scaling down
proportions and to estimate the probability of the occurrence of the yields constitutes the
main reason for the conservative assumptions on yields for improved agricultural
techniques.
4.1.4 Input and output prices
Input and output prices used in the budgets are average local market prices for the
agricultural year 2000-2001, ignoring the seasonality of crop output prices in Rwanda, for
practical reasons. Household labor was valued at a cost similar to the agricultural wage but
reduced by 20% (to 240 Frw) to reflect the relative low percentage of off-farm agricultural
and non-agricultural jobs in rural areas in Rwanda and the fact that a peasant usually works
on his farm for a rate of return less than the wage paid to hired labor. As said in a previous
section hired labor was valued using the agricultural wage.
In the traditional mode of production farmers use own-produced manure. However
that production is far lower than required quantity for improved agricultural technology. It
was then assumed that the two-thirds of the required manure for improved techniques
would be bought by the household and is then considered as monetary variable cost. 7 ha = hectare

31
4.2 Crop budget analysis
In order to identify the most profitable crops and technical modules at the farm
level, crop margins were calculated on the basis of 2001 agricultural year input and
output local market prices. Three crop margins (Crawford and Lambrecht, 1985) were
calculated for each of the two modules in each of the three agricultural zones:
- The gross monetary margin, i.e., gross revenue minus monetary variable
input costs;
- The total gross margin, i.e., gross revenue minus total variable input cost;
- The net margin, i.e., gross revenue minus total input costs.
All these margins were estimated on a per hectare basis and ranked in two ways.
First, they were ranked for each combination of crop and zone to identify the more
profitable module of the 2 or 3 considered. Second, the ranking was made including all
crops and all technical modules for a given zone to find the most profitable crops and
modules overall in that zone. These rankings aimed to give answers to two important
questions:
- Is production intensification by fertilizer use financially attractive?
- Which crop gives the best returns to the combination of organic and mineral
fertilizer?
The crop budget analysis considers three more criteria in this section:
- Remuneration rate, i.e., total gross margin divided by total variable costs;
- Returns to family labor per day, i.e., total gross margin (family labor
cost not included) divided by the number of family man-days;

32
- Cost share, i.e., proportion of each cost item included in the budget in
the total cost.
The remuneration rate, known also as �rate of return on capital,� indicates the net
benefit the farmer gets per unit of capital invested, after reimbursement of costs engaged
in crop production, whereas the net revenue of family labor indicates the remuneration of
a family man-day on the family land.
4.2.1 Crop budget analysis for Plateau de l’Est zone
Family labor constitutes the major cost item for almost all crops and modules,
where its cost share is over 60% and 30% for the traditional modes of production and the
improved modes, respectively (figures 4-4 to 4-7). Mineral fertilizer followed by sticks
and organic fertilizer for climbing beans (figure 4-4), organic fertilizer for sorghum,
soybeans and maize (figure 4-5 to 4-7) constitutes the second most important cost item
with more than 20 % cost share except for soybeans. Since family labor is a non-
monetary cost item, mineral fertilizer constitutes the critical factor in the improved crop
production process in the plateau de l�Est agro-biological zone.
The importance of these cost items combined with the level of yield and the
market price of the production determine the level of the remuneration rate and the
returns to family labor. From the ten combinations of crops and modules, the
remuneration rate, that is, the net returns the farmer gets per �100Frw8 � invested after
reimbursement of costs engaged in crop production, is negative for four (all the three
beans/modules combinations and sorghum grown with NPK), almost zero for one
(soybeans/traditional modes of production), less than 30Frw for three of them (soybean 8 Frw = Rwanda francs (local currency)

33
and sorghum grown with DAP and sorghum without fertilizer) and more than 30Frw for
two others (maize without and with fertilizer use) (figure 4-3). These results reveal that,
compared to traditional modes of production, the use of chemical fertilizer improves the
remuneration rate for soybeans and sorghum, in the plateau de l�Est agro-ecological zone.
Soybean is however a minor crop with less than one percent land share in plateau de
l�Est zone. Since this crop is one of the key commodities the GOR has chosen to achieve
economic growth, more extension and education activities are needed for its promotion.
The above results are consistent with those of the three categories of margins in
table 4-1 and figure 4-1 and the returns to family labor per day in figure 4-2. The four
combinations of crop and module with the highest remuneration rate constitute also the
four top combinations in terms of returns to family labor and rankings based on margins;
all the four combinations exhibit returns to family labor per day greater than the
agricultural wage, that is, higher than 300 Frw. The remaining combinations generate
returns to family labor lower than the wage rate assumed acceptable by farmers when
working on their own farms, except maize produced without any use of chemical
fertilizer. Overall the use of fertilizer improves the margins. However, the crop that
would give the best returns (in Frw) to fertilizer use is soybeans, which has the highest
difference between the margin with fertilizer use and that without fertilizer.
The comparisons, first, between the traditional modes of production and improved
agricultural techniques (based on chemical fertilizer NPK and DAP) and second, between
the two chemical fertilizer treatments, show that:
- The margins from the traditional modes of production are in general
lower than those from improved agricultural techniques;

34
- The use of DAP improves the margins for all the three crops on which it
was applied whereas NPK improves only one of the three crops grown
with it.
Results in table 4-2 show that margin analysis and v/c ratio give different results.
First, climbing bean grown with DAP has the highest v/c ratio (3.8) but has negative total
gross and net margins. Second, soybean has a higher v/c ratio than maize (2.3 vs. 1.3),
but lower margins (especially total gross and net margins). Hence, based on v/c ratio
fertilizer use is profitable for climbing bean and soybean but not for maize. Margin
analysis, on the other hand favors maize against climbing bean and soybean though it
shows that fertilizer use is profitable for both maize and soybean. These differences are
due to the quantity of data used in each of the two analytical tools. As said in Chapter
one, the v/c ratio approach uses the incremental gross revenue and costs associated with
the technology being assessed. On the other hand, with the margin analysis approach, all
the costs associated with the implementation of a technology are considered. The margin
analysis approach, compared to the v/c ratio approach, is a better guide to profitability
since it takes into account a more complete set of costs.

35
Table 4-1. Margin ranking in plateau de l�Est agro-ecological zone, Kigali rural province, Rwanda, 2001.
Rank Gross Margin Total gross margin Net margin 1 Maize (Module 2a) Maize (Module 2a) Maize (Module 2a) 2 Soybeans (Module 2b) Soybeans (Module 2a) Soybeans (Module 2a) 3 Maize (Module 1) Maize (Module 1) Maize (Module 1) 4 Sorghum (Module 2b) Sorghum (Module 2b) Sorghum (Module 2b) 5 Cl. beans (Module 2b) Sorghum (Module 1) Sorghum (Module 1) 6 Sorghum (Module 1)
Source: Data in table B-9
Note: Crops/modules with negative margins are not shown
Figure 4-1: Margins in plateau de l�Est agro-ecological zone, Kigali rural province, Rwanda, 2001.
-80,000
-60,000
-40,000
-20,000
0
20,000
40,000
60,000
80,000
100,000
120,000
GM TGM NM
Mar
gins
per
hec
tare
(Frw
)
Maize 2aSoybeans 2bMaize 1Sorghum 2bSorghum 1Cl. Beans 2bSoybeans 1Sorghum 2aBeans 1Cl. Beans 2a
Source: Data in table B-9
GM= Gross margin TGM= Total gross margin NM= Net margin 1= Traditional mode of production
2a= Module 2 (improved techniques) with NPK 2b= Module 2 (improved techniques) with �DAP + urea�

36
Figure 4-2: Returns to family labor (Frw) on household land for selected crops in plateau de l�Est agro-ecological zone, Kigali rural province, Rwanda, 2001.
050
100150200250300350400450500
Maize2a
Maize1
Soybea
ns2b
Sorghu
m2b
Sorghu
m 1
Soybea
ns 1
Beans
1
Cl, bea
ns 2b
Sorghu
m 2a
Cl. bea
ns 2aR
etur
ns to
fam
ily la
bor p
er d
ay (F
rw)
Source: Data in table B-22 * Agricultural wage rate: 300 Frw per day Figure 4-3: Remuneration rate for selected crops in plateau de l�Est agro-ecological zone, Kigali rural province, Rwanda, 2001.
-40-30-20-10
0102030405060
Mai
ze 1
Mai
ze 2
aS
oybe
ans
2bS
orgh
um 1
Sor
ghum
2b
Soy
bean
s 1
Sor
ghum
2a
Cl.
bean
s 2b
Bea
ns1
Cl.
bean
s 2a
Rem
uner
atio
n ra
te (%
)
Source: Data in table B-23
1= Traditional mode of production 2a= Module 2 (improved techniques) with NPK
2b= Module 2 (improved techniques) with �DAP + urea�

37
Figure 4-5: Cost shares for climbing beans production with traditional and improved practices in plateau de l�Est agro-ecological zone, Kigali rural province, Rwanda, 2001.
01020304050607080
Mineral fe
rtilize
r
Organic f
ertiliz
er
Hired lab
orStic
ks
Small ag
r. Equipmen
tSeed
s
Household lab
or
Capita
l cost
cost
sha
res
(%)
Beans M1Cl.Beans M2aCl.Beans M2b
Source : Data in table B-10
Figure 4-6: Cost shares for sorghum production with traditional and improved practices in plateau de l�Est agro-ecological zone, Kigali rural province, Rwanda, 2001.
01020304050607080
Mineral fe
rtilize
r
Organic fert
ilizer
Hired lab
or
Small agr. E
quipment
Pesticid
eSeed
s
Household lab
or
Capital co
st
cost
sha
res
(%)
Sorghum M1Sorghum M2aSorghum M2b
Source : Data in table B-10
M1 = Module 1: Traditional modes of production. M2 = Module 2: Improved agricultural technology techniques.

38
Figure 4-7: Cost shares for soybeans production with traditional and improved practices in plateau de l�Est agro-ecological zone, Kigali rural province, Rwanda, 2001.
Source: Data in table B-10
Figure 4-8: Cost shares for maize production with traditional and improved practices in plateau de l�Est agro-ecological zone, Kigali rural province, Rwanda, 2001.
Source : Data in table B-10
M1 = Module 1: Traditional modes of production. M2 = Module 2: Improved agricultural techniques.
01020304050607080
Mineral
fertil
izer
Organic
fertil
izer
Hired l
abor
Sticks
Small ag
r. equ
ipmen
ts
Pestic
ide
Seeds
House
hold
labor
Capita
l cos
t
cost
sha
res
(%)
Soybeans M1
Soybeans M2
0102030405060708090
100
Mineral
fertil
izer
Organic
fertili
zer
Hired l
abor
Sticks
Small ag
r. equip
ments
Pestic
ide
Seeds
Househo
ld lab
or
Capital c
ost
cost
sha
res(
%)
Maize M1Maize M2

39
Table 4-2. Margins and v/c ratios in plateau de l�Est agro-ecological zone, Kigali rural province, Rwanda, 2001 GM TGM NM v/c ratio
Cl. Beans 2a 23,400 -75,790 -77,107 1.1
Beans 2b 72,620 -20,880 -22,197 3.8
Sorghum 2a 58,650 -10,745 -15,778 0.7
Sorghum 2b 88,102 23,284 18,251 1.6
Soybeans 2b 109,568 35,536 34,219 2.3
Maize 2a 110,538 45,831 44,514 1.3
Source: Table B-2, B-4, B-6 and B-8

40
4.2.2 Crop budget analysis for Plateau central zone
The analysis of the cost shares in the plateau central agro-ecological zone reveals
the same trends as in the plateau de l�Est. Family labor, mineral fertilizer, sticks and
organic fertilizer for climbing beans (figure 4-11), family labor and organic fertilizer for
sorghum, and soybeans and maize (figure 4-12 to 4-14) constitute the most important cost
items.
Cost items combined with the level of yield and the market price of the
production in the plateau central agro-ecological zone lead to levels of the remuneration
rate and the return to family labor far different from those observed in plateau de l�Est
agro-ecological zone. From the eleven combinations of crop and modules, the
remuneration rate the farmer gets per �100Frw9� invested after reimbursement of costs
engaged in crop production, is negative for eight of them (all four selected crops when
grown without fertilizer, all three crops grown with NPK and climbing beans grown with
DAP), and positive and equal or less than 30Frw for the three remaining (sorghum,
soybeans and maize grown with DAP) (figure 4-10).
The margins ranking shows that the above three combinations of crops and
modules with the highest remuneration rate also have the highest margins, two of them
(sorghum and soybean grown with DAP) being the only ones that remain positive at all
three levels of margin (table 4-2 and figure 4-8). The last mentioned combinations
constitute also the only ones that generate returns to family labor higher than the wage
rate assumed acceptable by farmers when working on their farms, that is, 240Frws.
9Frw = Rwanda francs

41
The comparison between the traditional modes of production and improved
agricultural techniques (based on chemical fertilizer NPK and DAP) and between the two
chemical fertilizer treatments, shows that:
- The margins from the traditional modes of production are lower than
those from improved agricultural techniques based on the use of DAP;
- DAP sole or combined with urea depending on the type of crop
improves margins and the two other financial criteria whereas NPK in
general decreases the magnitude of all the three criteria, compared to the
traditional modes of production.
In plateau central, the two crop/module combinations (sorghum and soybeans
grown with DAP) that exhibit higher margins have also higher v/c ratios (table 4-2).
However, once again there is a conflict between the implications of the two criteria
regarding on which of the two crops fertilizer is more profitable. Soybeans would be
ranked number 1 based on v/c ratio criterion whereas it would be ranked second if we
consider the magnitude of margins, sorghum grown with DAP being the crop with the
highest margins.

42
Table 4-3: Margin ranking in Plateau central agro-ecological zone, Kigali rural province, Rwanda, 2001
Rank Gross Margin Total gross margin Net margin 1 Sorghum (Module 2b) Sorghum (Module 2b) Sorghum (Module 2b)
2 Soybeans (Module 2b) Soybeans (Module 2b) Soybeans (Module 2b)
3 Maize (Module 1)
4 Sorghum (Module 1)
5 Cl. beans (Module 1)
6 Maize (Module 2a)
Source: Data in table B-19
Note: Crops/modules with negative margins are not shown
Figure 4-8: Margins in Plateau central agro-ecological zone, Kigali rural province, Rwanda, 2001.
-120,000-100,000-80,000-60,000-40,000-20,000
020,00040,00060,00080,000
100,000
GM TGM NM
Mar
gins
per
hec
tare
(Frw
)
Sorghum 2bSoybeans 2bMaize 2bMaize 1Sorghum 1Beans 1Maize 2aSoybeans 1Sorghum 2aCl. Beans 2bCl. Beans 2a
Source: Data in table B-19
GM= Gross margin TGM= Total gross margin NM= Net margin 1= Traditional mode of production
2a= Module 2 (improved techniques) with NPK 2b= Module 2 (improved techniques) with �DAP + urea�

43
Figure 4-9: Returns to family labor (Frw) per day on household land for selected crops in plateau central agro-ecological zone, Kigali rural province, Rwanda, 2001.
-150-100-50
050
100150200250300350400
Sor
ghum
2b
Soy
bean
s 2b
Mai
ze 2
b
Mai
ze 1
Sor
ghum
1
Bea
ns 1
Mai
ze 2
aS
oybe
ans
1C
l. be
ans
2bS
orgh
um 2
aC
l. be
ans
2a
Ret
urns
to fa
mily
labo
r per
day
(Frw
)
Source: Data in table B-22 * Agricultural wage rate: 300 Frw per day Figure 4-10: Remuneration rate for selected crops in plateau central agro-ecological zone, Kigali rural province, Rwanda, 2001.
-60-50-40-30-20-10
010203040
Sorg
hum
2b
Soyb
eans
2b
Mai
ze 2
b
Mai
ze 1
Sorg
hum
1
Mai
ze 2
a
Sorg
hum
2a
Bean
s 1
Soyb
eans
1
Cl. b
eans
2b
Cl. b
eans
2a
Rem
uner
atio
n ra
te (%
)
Source: Data in table B-23
1= Traditional mode of production 2a= Module 2 (improved techniques) with NPK
2b= Module 2 (improved techniques) with �DAP + urea�

44
Figure 4-11: Cost shares for beans production with traditional and improved practices in plateau central agro-ecological zone, Kigali rural province, Rwanda, 2001.
01020304050607080
Minera
l fertil
izer
Organ
ic fer
tilize
r
Hired l
abor
Sticks
Small ag
r. equ
ipmen
ts
Pestic
ide
Seeds
House
hold
labor
Capita
l cos
t
Cos
t sha
res
(%)
Beans M1C.Beans M2
Source: Data in table B-20
Figure 4-12: Cost shares for sorghum production with traditional and improved practices in plateau central agro-ecological zone, Kigali rural province, Rwanda, 2001.
Source: Data in table B-20
M1 = Module 1: Traditional modes of production. M2 = Module 2: Improved agricultural technology techniques.
01020304050607080
Mineral
fertil
izer
Organic
fertili
zer
Hired l
abor
Sticks
Small ag
r. equip
ments
Pestic
ide
Seeds
Househo
ld lab
or
Capital c
ost
cost
sha
res
(%)
Sorghum M1
Sorghum M2

45
Figure 4-13: Cost shares for soybeans production with traditional and improved practices in plateau central agro-ecological zone, Kigali rural province, Rwanda, 2001.
01020304050607080
Minera
l fertil
izer
Organ
ic fer
tilize
r
Hired l
abor
Small ag
r. equ
ipmen
ts
Seeds
House
hold
labor
Capita
l cos
t
Cos
t sha
res
(%)
Soybeans M1Soybeans M2aSoybeans M2b
Source: Data in table B-20
Figure 4-14: Cost shares for maize production with traditional and improved practices in plateau central agro-ecological zone, Kigali rural province, Rwanda, 2001.
Source: Data in table B-20
M1 = Module 1: Traditional modes of production. M2 = Module 2: Improved agricultural techniques.
0
20
40
60
80
Mineral
fertil
izer
Organic
fertili
zer
Hired l
abor
Sticks
Small ag
r. equip
ments
Pestic
ide
Seeds
Househo
ld lab
or
Capital c
ost
cost
sha
res
(%)
Maize M1Maize M2

46
Table 4-4 Margins and v/c ratios in plateau central agro-ecological zone, Kigali rural province, Rwanda, 2001 GM TGM NM v/c ratio
Cl.beans 2a -17,300 -116,490 -117,807 0.8
Cl. beans 2b 3,000 -90,600 -91,917 1.4
Sorghum 2a 6,502 -63,167 -68,200 0.6
Sorghum 2b 99,388 34,254 29,221 2.7
Soybeans 2b 85,876 13,331 12,014 4.3
Maize 2a 31,410 -33,543 -34,860 0.8
Maize 2b 56,476 -5,528 -6,84 1.2
Source: Table B-12, B-14, B-16 and B-18

47
4.2.3 Crop budget analysis for Bugesera /Mayaga zone
The analysis of the sorghum budget with the remuneration rate (figure 4-16), the
returns to family labor (figure 4-17) and the margins (table 4-3 and figure 4-15) shows
that the two fertilizer-based treatments, that is, NPK and DAP + Urea, have different
outcomes on sorghum production in Bugesera/Mayaga agro-ecological zone. The first
chemical fertilizer decreases the margins whereas the second (combination of DAP and
Urea) improves the margins. For all three criteria the traditional modes of production are
superior to the use of NPK but inferior to the use of the combination DAP and urea. The
superiority of the traditional modes of production of sorghum over the improved
techniques based on the use of NPK can partially be explained by the fact that the
increase in revenue (61,920 Frws) is far less than the extra monetary variable costs
(76,510 Frws) needed to generate it.
The comparison of margin analysis and c/v ratio criteria from the data in table 4-3
shows that the crop/module combination with highest margins (sorghum grown with
DAP) has also the highest v/c ratio. The interpretation of figures would, however, have
different meaning. With a v/c ratio fertilizer can be said to be moderately profitable
whereas it would be highly profitable if we consider a net margin of 95,291 Frws per
hectare.
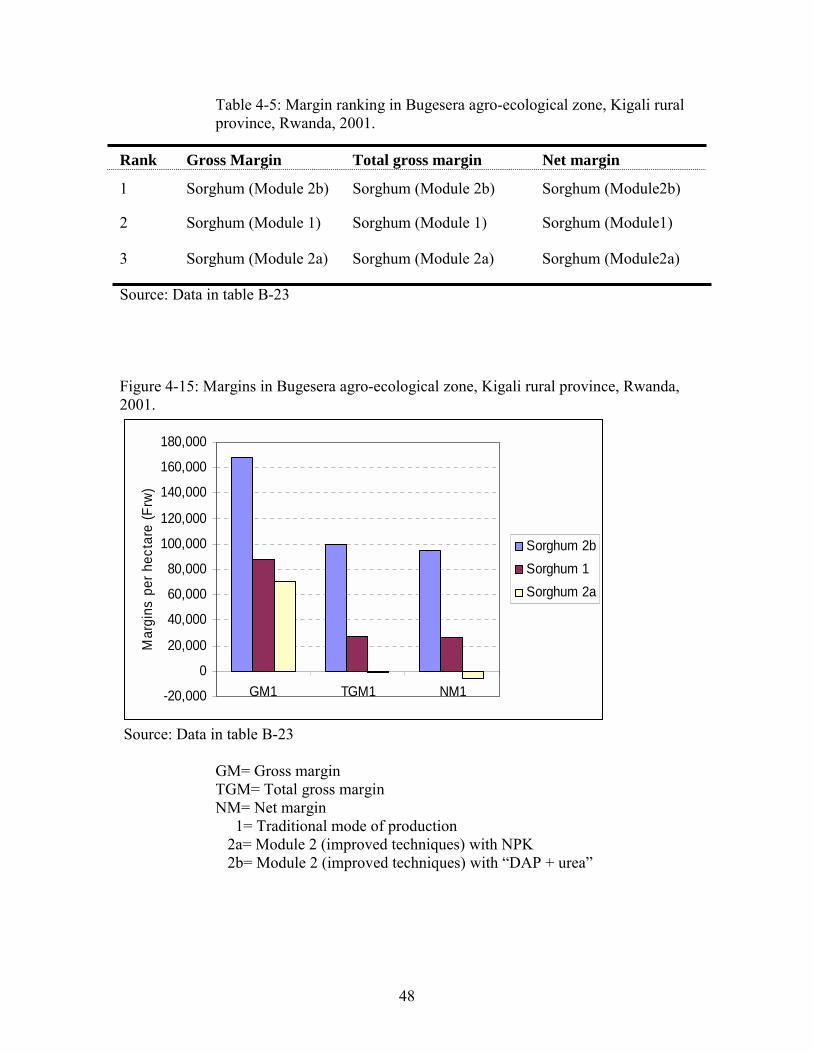
48
Table 4-5: Margin ranking in Bugesera agro-ecological zone, Kigali rural province, Rwanda, 2001.
Rank Gross Margin Total gross margin Net margin
1 Sorghum (Module 2b) Sorghum (Module 2b) Sorghum (Module2b)
2 Sorghum (Module 1) Sorghum (Module 1) Sorghum (Module1)
3 Sorghum (Module 2a) Sorghum (Module 2a) Sorghum (Module2a)
Source: Data in table B-23
Figure 4-15: Margins in Bugesera agro-ecological zone, Kigali rural province, Rwanda, 2001.
-20,000
0
20,000
40,000
60,000
80,000
100,000
120,000
140,000
160,000
180,000
GM1 TGM1 NM1
Mar
gins
per
hec
tare
(Frw
)
Sorghum 2bSorghum 1Sorghum 2a
Source: Data in table B-23
GM= Gross margin TGM= Total gross margin NM= Net margin 1= Traditional mode of production
2a= Module 2 (improved techniques) with NPK 2b= Module 2 (improved techniques) with �DAP + urea�

49
Figure 4-16: Remuneration rate for sorghum with traditional (M1) and improved (M2) practices in Bugesera/Mayaga agro-ecological zone, Kigali rural province, Rwanda, 2001.
0
10
20
30
40
50
60
70
80
90
Sorghum 2b Sorghum 1 Sorghum 2a
Rem
uner
atio
n ra
te (%
)
Source: Data in table B-26
Figure 4-17: Returns to family labor (Frw) on household land for selected crops in Bugesera/Mayaga agro-ecological zone, Kigali rural province, Rwanda, 2001.
0
100
200
300
400
500
600
700
Sorghum M2b Sorghum M1 Sorghum M2a
Ret
urns
to fa
mily
labo
r per
day
(Frw
)
Source: Data in table B-25
Agricultural wage rate: 300 Frw per day
Notes: GM= Gross margin TGM= Total gross margin NM= Net margin 1= Traditional mode of production
2a= Module 2 (improved techniques) with NPK 2b= Module 2 (improved techniques) with �DAP + urea�

50
Figure 4-24: Cost shares for sorghum production with traditional and improved practices in Bugesera/Mayaga agro-ecological zone, Kigali rural province, Rwanda, 2001.
01020304050607080
Mineral
fertil
izer
Organic
fertili
zer
Hired l
abor
Small ag
r. equip
ments
Pestic
ideSee
ds
Househo
ld lab
or
Capital c
ost
Cos
t sha
res
(%)
Sorghum M1Sorghum M2aSorghum M2b
Source: Data in table B-21
Table 4-6 Margins and v/c ratios in Bugesera/Mayaga agro-ecological zone, Kigali rural province, Rwanda, 2001 GM TGM NM v/c ratio
Sorghum 2a 70140 -1438 -6471 0.9
Sorghum 2b 168,226 100,066 95,033 3.2
Source: Table B-22
Notes: GM = Gross margin TGM = Total gross margin NM = Net margin 1= Traditional mode of production 2a= Module 2 (improved techniques) with NPK 2b= Module 2 (improved techniques) with �DAP + urea

51
4.3 Farm budgets
A Farm budget is a quantitative expression of the farm plan summarizing the
income, costs, and profit. In the farm budget, the unit of analysis is the entire farm that
may consist of several enterprises. A whole-farm budget is the one that includes all
enterprises.
In this section, farm budgets are elaborated using the crop budgets discussed in
the previous section. The budgets cover an area of 48 ares (0.48ha), which is the portion
of a typical one hectare farm that allocated to the crops analyzed in this study (beans,
sorghum, soybean, and maize). The average crop shares used in these farm budgets are
averages at the province level whereas the gross revenues, costs and margins are from
plateau de l�est zone crop budgets. A scenario with an increase of area for soybean
against climbing bean is considered. Table 4-7 shows the margins and returns to labor for
the two scenarios, using traditional modes of production.
Results in table 4-8 show that all things being constant for all enterprises not
considered in the farm budgets, the use of fertilizer generates an incremental rate of
return of 28%. An increase of the area allocated to soybean production from 1 are to 10
ares against a decrease of climbing bean from 30 ares to 21 ares, increases the
incremental rate of return to 41%. It also increases the return per day of family labor. The
substitution of bean by soybean can be motivated by the fact that both of them are
legumes with high nutritional value. That substitution needs, however, support measures
not only in terms of more extension and education to farmers but also in terms of soybean
market promotion.

52
Table 4-7. Farm budget type for plateau de l'est zone (100ares): Traditional modes of production Scenario 1: Existing crop pattern Scenario 2: Increased Soybean Area
Beans Sorghum Soybeans Maize Beans Sorghum Soybeans Maize Total S1 Total S2
Area cultivated (ares) 30 14 1 3 21 14 10 3 48 48
Gross revenue 21,090 11,760 838 3,013 14,763 11,760 8,380 3,013 36,701 37,916
Monetary variable costs 4,320 966 173 198 3,024 966 1,730 198 5,657 5,918
Non-monetary variable costs 20,538 8,758 665 1,744 14,377 8,758 6,650 1,744 31,705 31,529
Fixed costs 395 184 132 40 277 184 1,320 40 751 1,821
Gross margin 16,770 10,794 665 2,815 11,739 10,794 6,650 2,815 31,044 31,998
Total gross margin -3,768 2,036 0 1,071 -2,638 2,036 0 1,071 -661 469
Net margin -4,163 1,852 -132 1,031 -2,914 1,852 -1,320 1,031 -1,412 -1,351
Return to labor per day 184 235 413 184 316 235 413 238 247 Source: Tables B-1, B-3, B-5 and B-7 Note: 100 ares = 1hectare

53
Table 4-8. Farm budget type for plateau de l'est zone (100ares): Improved techniques
Scenario 1: Existing crop pattern Scenario 2: Increased Soybean Area
Beans Sorghum Soybeans Maize Beans Sorghum Soybeans Maize Total S1 Total S2
Area cultivated (ares) 30 14 1 3 21 14 10 3 48 48
Gross revenue 44,346 18,995 1,635 5,736 31,042 18,995 16,350 5,736 70,712 72,123
Monetary var. costs 22,560 6,661 539 2,420 15,792 6,661 5,390 2,420 32,180 30,263
Non-monetary variable costs 28,050 9,075 740 1,941 19,635 9,075 7,400 1,941 39,806 38,051
Fixed costs 395 705 132 40 277 705 1,320 40 1,272 2,342
Gross margin 21,786 12,334 1,096 3,316 15,250 12,334 10,960 3,316 38,532 41,860
Total gross margin -6,264 3,259 356 1,375 -4,385 3,259 3,560 1,375 -1,274 3,809
Net margin -6,659 2,554 224 1,335 -4,661 2,554 2,240 1,335 -2,546 1,468
Return to labor 172 323 371 451 172 323 371 451 238 275
Net Gain per hectare
7,488 9,862
Incremental Rate of Return
28 41 Change in Return to labor/day 0 28
Source: Tables B-2, B-4, B-6 and B-8 Notes : 100 ares = 1hectare (1) Total Return to labor per day = (ΣReturn to labor per day cropi * Cultivated area cropi)/Total cultivated area
(2) Net Gain per hectare = Gross margin Improved techniques � Gross margin traditional mode of production (3) Incremental Rate of return = 100 * (GMI - GMT)/(Monetary variable costsI - Monetary variable costsT) (4) Change in Return to labor per day = Return to labor per dayI -Return to labor per dayT

54
CHAPTER 5
SUMMARY OF RESULTS AND POLICY IMPLICATIONS
The objective of this study was to evaluate the profitability of the main food crops
in the context of the current government policy of promoting the use by farmers of
improved inputs. This study tried to estimate the magnitudes of costs associated with the
use of chemical fertilizer on climbing beans, maize, sorghum and soybeans grown in the
province of Kigali rural and the benefits farmers would get by investing their labor and
money in these crops. In less detail, this study analyzed some recent survey data seeking
to put crop production in a wider perspective of the household�s limitations and/or
opportunities when dealing with the issue of improving crop yields on its land. This
chapter first provides a summary of the major findings both on agriculture in Kigali rural
province and on the crop budgets analysis, second, discusses policy implications briefly
and, third, notes limitations of the study and suggestions for future research.
5.1 Summary of results
5.1.1 Farm characteristics
The size of the household, the gender and age of the head of the household, and
the level of education of the household head are some of the very important
characteristics of the farm. The results of this study reveal that a household in Kigali rural
province has on average 5 people; male-headed households have decreased about 30%,
from 93% in 1981 to 63% in 2001; and the proportion of illiterate household heads

55
exceeds 50%, the proportion of female illiterate households being relatively high
compared to that of male household heads. The proportions of elderly household heads
did not change a lot but diverges by gender: in 2001, the majority of elderly household
heads were female whereas in 1981 most of the elderly household heads were male. The
Plateau central agro-ecological zone has the highest proportion of both female-headed
households and of elderly-headed households.
Kigali rural province has limited natural resources, including a shortage of land
due mostly to hilly and mountainous terrain and costly-to-use wetlands. The average farm
size in Kigali rural province (1.22 hectares) is higher than the average at the national
level (0.86 hectares) with some variation by agro-ecological zone. The largest average
farm size appears in Plateau central, the smallest in Bugesera. The land distribution
patterns indicate that land is somewhat concentrated in the upper quartile households. On
a per farm basis, the fourth quartile (large landowners) holds some 54 percent of land in
Kigali rural province. A very similar pattern persists even when the size of the household
is expressed in terms of adult equivalents. At the lowest quartile of households the
farmland size is very small, on average about one-third of a hectare. The first quartile
households in Kigali rural province hold less than 10% of land both in terms of land area
farmed by a household and land area farmed by an adult equivalent. The Plateau central
agro-ecological zone has both the highest average area per household (1.58 hectares) and
average area per adult equivalent (0.35 hectare).
Results in this study show that the pattern of land use does not vary by farm size
in Kigali rural province. The proportion of land allocated to different categories of crops
lies in the same range for small and large farmers with some exceptions. A large

56
proportion of land is allocated to legumes, mostly beans and roots and tubers, reflecting
the food habits in Rwanda in general and in the Kigali rural province in particular.
Six crops appear to be the most important farm activities in Kigali rural province.
Beans, sweet potato and cassava are the major staple foods whereas banana, sorghum and
peanuts are grown as cash crops. Beans and sorghum are ranked in the top three crops in
the three agro-ecological zones suggesting that the two crops are perceived by farmers in
Kigali rural province as important crops.
Cassava and sweet potato constitute the major source of calories in Kigali rural
province, contributing more than 50% of total household food energy. Beans constitute
the third contributor to the household food energy just before sorghum and maize in
Plateau de l�Est and Bugesera, and before sorghum in Plateau central agro-ecological
zone. Results in this study reveal that household crop production in the Plateau de l�Est
and Bugesera/Mayaga cover all the needs of the household whereas a household in the
Plateau central zone has to buy some food on the market to complement its own
production.
5.1.2 Crop budget analysis
5.1.2.1 Plateau de l’Est zone
The remuneration rate is negative for all the three combinations of beans/modules
(traditional modes of production, climbing beans production with NPK and climbing
beans production with DAP) and sorghum grown with NPK and, almost zero for
soybeans with traditional modes of production. It is positive for all other combinations
that is, soybean and sorghum grown with DAP, sorghum without fertilizer and, maize

57
without and with fertilizer use. Since agriculture in Rwanda is more labor and land
intensive rather than capital intensive, criteria such as interest rate of bank savings or
opportunity cost of capital has less meaning to determine the desirable level of
remuneration rate. In this context, a positive remuneration rate indicates that the
production process of interest is good. Compared to the traditional modes of production,
the use of fertilizer improves the remuneration rate only for soybean and sorghum, in the
plateau de l�Est agro-ecological zone.
Of the four crops selected in plateau de l�Est zone, the use of fertilizer would
generate returns to family labor equal to or greater than the local agricultural labor wage
for three of them, that is, maize, soybeans and sorghum. Even though all of these three
crops have positive margins at all the three margin levels, the difference between with
and without fertilizer margins seems to be significant only for soybeans and sorghum.
The comparison of the two types of fertilizer shows that the DAP is superior to NPK for
all crops.
In sum, soybeans, sorghum and maize provide the best returns to the combination
of organic and mineral fertilizer in the Kigali Est zone but production intensification by
fertilizer use would be financially more attractive for soybeans and sorghum production.
5.1.2.2 Plateau central zone
In this zone, results on the three crop budget analysis criteria have some
similarities but also some differences with those in the plateau de l�Est agro-ecological
zone. Three combinations, that is, sorghum, soybeans and maize grown with DAP, have a
positive net benefit; all other combinations have negative benefit. For the three crops with

58
positive net benefit, two of them, sorghum and soybeans, have margins that are positive at all
three levels of margin, implying that the use of DAP on these crops generates enough revenue
to cover all costs, monetary and non-monetary, engaged in the production process.
The returns to family labor are greater than the agricultural labor wage for sorghum
production with the combination �DAP + urea� as mineral fertilizer, and almost equal to the
labor wage for soybeans with fertilizer DAP. For all other combinations, returns to family
labor are not only less than the labor wage but also less than the minimum rate assumed
acceptable by farmers when working on their own land.
In sum, sorghum and soybeans would give the best returns to the combination of
organic and mineral fertilizer in the Kigali central zone and their intensification by fertilizer
use would be financially attractive.
5.1.2.3 Bugesera zone
Sorghum is the only crop perceived by previous studies (Kelly and Murekezi, 2000) as
potentially profitable with fertilizer use in Bugesera zone. The remuneration rate, the returns
to family labor and the margins generated with the available data do not support that
assumption for NPK but they do for the combination DAP + urea. For all of these three
criteria, the traditional modes of production are superior to the use of NPK, due partially to the
higher cost share (34.5%) of that chemical fertilizer. In contrast, the use of the combination
�DAP + urea� improves all three crop budget analysis criteria, compared to the traditional
modes of production.
In sum, improved agricultural techniques would be more profitable than the traditional
modes of production, when based on the use of �DAP + Urea� as fertilizer.

59
5.2 Policy implications
Previous studies on fertilizer profitability in Rwanda had used the v/c ratio
approach. The full budget analysis approach used in this study to assess the profitability
of fertilizer use in Kigali rural province has the advantages of considering the whole crop
production process and incorporating the full range of costs when calculating the profits
that can be obtained by farmers. Indeed, it is easy for an extension agent to convince a
farmer to adopt new technology by showing him a more complete estimate of his
potential profit rather than the estimated profit drawn from v/c ratio approach.
The intensification of agriculture in Rwanda in general and in Kigali rural
province through improved agricultural inputs (fertilizer, seeds, pesticides, etc.)
constitutes an obvious way of solving the complex agricultural problem in the context of
land scarcity. The solution is not that simple, however. There is a real need for a multi-
sectoral remedy.
Findings reviewed in the previous section call not only for more agricultural
research but also for socio-economic research. Agricultural research must develop
technologies (more productive varieties and improved practices) which are so profitable
that farmers do not hesitate to switch to them. Socio-economic research (e.g., capacity
constraints studies, adoption of improved technologies studies) is needed first, to help
agronomists to produce technologies that meet the real needs of farmers and to promote
current minor but more profitable crops such as soybeans and second, to improve
fertilizer use efficiency.

60
5.3 Limitations and suggestions for further research
The data used in this study as said in the previous chapter came from typical
budgets prepared by agricultural specialists of the Ministry of Agriculture, using cost
prices prepared by the improved seeds government agency ( Projet de Semences
Selectionées) and information from farm surveys and an agricultural market prices
project (PASAR). The major limitations related to these data are:
- Labor data for different agricultural operations are national-level
averages;
- Yields for research recommendations are broken down for three broad
categories of land quality, that is, high, medium and low fertility;
- The individual effect of chemical fertilizer cannot be differentiated from
that of organic fertilizer.
Further research on the profitability of crops based on data from on-farm trials
designed to distinguish the separate effects of chemical and organic fertilizer for all agro-
ecological zones would not only produce more accurate estimates of crop profits through
crop budgets but also, through partial budgets, indicate which technological packages are
agronomically different and economically superior to other alternatives, and socially
acceptable to farmers.
Improved agricultural technologies can meet the above objectives and still be
unused by farmers. Well-designed studies on farmers� capacity to invest in technologies
that are economically attractive would be good complements to the profitability studies
by providing recommendations on realistic solutions to capacity constraints faced by
farmers.

APPENDIX A
DATA FOR CROP BUDGETS ELABORATION

61
Table A-1: Average yields (kg/ha) in the three major agro-ecological zones of Kigali rural, Rwanda , 2001 Agro-ecological zones
Plateau de l�Est Plateau central Bugesera Mod. 1* Mod. 2a** Mod. 2b Mod. 1 Mod.2a Mod.2b Mod. 1 Mod. 2a Mod. 2b Beans
740
1650 1020
500
1650 865
-
- -
Sorghum
1050
2000 807
620
2000 1977
1100
2000 1864
Soybeans
640
- 1400
300
- 1108
-
- -
Maize
1300
2300 -
800
1400 1547
-
- -
Source: MINAGRI/FSRP survey data (for module 1), MINAGRI 1997 and Kelly and
Murekezi, 2000 (for module 2).
* Traditional modes of production.
**Improved agricultural techniques (2a = NPK, 2b = DAP). Table A-2: Average prices (Frw) in the three major agro-ecological zones of Kigali rural, Rwanda , 2001 Agro-ecological zones
Plateau de l�Est Plateau central Bugesera Beans 95 100 - Sorghum 80 88 86 Soybeans 131 141 - Maize 93 92 - Mineral fertilizer(NPK) 223 233 222 Mineral fertilizer(DAP) 203 213 200 Mineral fertilizer(Urea) 225 239 219 Source: MINAGRI/PASAR10
10 PASAR is a market information project

62
Table A-3: Standards of person-days per hectare for crops perceived as profitable with
fertilizer use in Kigali rural province
Maize Sorghum Climbing beans Soybeans
Clearing - - 10 10
First plow 66 66 66 66
Second plow 50 50 50 50
Leveling 10 10 10 10
Seeding 12 12 17 20
Weeding 33 33 66 66
Mounding 20 20 - -
Pesticide appl. 8 8 25 8
Fertilizer 10 10 10 10
Selection 2 2 4 4
Sticking - - 50 -
Harvesting 25 20 20 20
Threshing 60 - - -
Winnowing 15 13 5 4
Drying 5 5 3 3
Sorting - - 1.5 1
Storage 6 5 3 2
Others 130 130 130 130
Source: MINAGRI, 1997

APPENDIX B
CROP BUDGETS, MARGINS, COST SHARES, RETURNS TO HOUSEHOLD
LABOR AND REMUNERATION RATE

63
Table B-1. Beans(a) budget for plateau de l�est agricultural zone, Module 1, Kigali rural province, Rwanda. (per hectare)
ITEMS UNIT QUANTITY UNIT PRICE
MONETARY VALUE
(Frw)
PRODUCTION
-Legume Kg 740 95 70300 (1)Gross revenue 70300 Monetary variable input costs Seeds Kg 60 100 6000 Hired labor M.D 28 300 8400 (2) Total M.V.I.C 14400 Non-monet. variable input costs Organic fertilizer Kg 3,750 2 7500 Household labor M.D 248 240 59520 Capital cost - - - 1440 (3) Total N.V.I.C 68460 Fixed costs Small agr. equipment - - - 1,317 (4) Total F.C 1,317 (5)Total variable input cost (2+3) 82860 (6)Total costs (2 + 3 + 4) 84,177 (7)Gross Margin[Monetary] (1- 2) 55900 (8)Total Gross Margin (1 � 5) -12560 (9)Net Margin (1� 6) -13,877 Returns to family labor per day(b) 184 Remuneration rate (8/5 * 100) -15%
(a) The data used do not differentiate the two bean categories, climbing and dwarf bean; most farmers grow the second category which does not need sticks. (b) Returns to family labor per day = (Net Margin + Monetary value of household labor)/ Quantity of household labor.

64
Table B-2. Climbing beans budget for plateau de l�est agricultural zone, Improved techniques, Kigali rural province, Rwanda. (per hectare)
ITEMS UNIT QUANTITY UNIT
PRICE Module 2a (Frw)
Module 2b (Frw)
PRODUCTION -Legume Kg 1,460 95 138700 Kg 1556 95 147820 (1)Gross revenue 138700 147820Monetary variable input costs Seeds Kg 60 235 14100 14100 Mineral fertilizer (NPK) Kg 200 223 44600 Mineral fertilizer (DAP) Kg 100 203 20300 Organic fertilizer Kg 7750 2 15500 Hired labor (module 2a) M.D 37 300 11100 Hired labor (Module 2b) M.D 36 300 10800 Sticks 22500 8 30000 30000 (2) Total M.V.I.C 115300 75200Non-monet. variable input costs Organic fertilizer Kg 3750 2 7500 7500 Household labor (module 2a) M.D 334 240 80160 Household labor (module 2b) M.D 327 240 78480 Capital cost - - - 11530 7520 (3) Total N.V.I.C 99190 93500Fixed costs Small agr. equipment - - - 1317 1317 (4) Total F.C 1317 1317(5)Total variable input cost (2+3) 214490 168700(6)Total costs (2 + 3 + 4) 215807 170017(7)Gross Margin[Monetary] (1- 2) 23400 72620(8) Total Gross Margin (1 � 5) -75790 -20880(9)Net Margin (1� 6) -77107 -22197Returns to family labor per day(b) 9 172Remuneration rate (8/5 * 100) -35 -12%V/C ratio(c) 1.14 3.8
(a) Sticks are used for three years and for two seasons per year; hence the total charge
has to be divided by six. (b) Returns to family labor per = (Net Margin + Monetary value of household labor)/
Quantity of household labor. (c) v/c ratio = (Gross revenue module 2 - Gross revenue module 1)/ (Total mineral and
organic fertilizer module 2 � Organic fertilizer module 1)

65
Table B-3. Sorghum budget for plateau de l�est agricultural zone, Module 1, Kigali rural province, Rwanda. (per hectare)
ITEMS UNIT QUANTITY UNIT PRICE
MONETARY VALUE
(Frw)
PRODUCTION -Grain Kg 1,050 80 84000 (1)Gross revenue 84000 Monetary variable input costs Hired labor M.D 23 300 6900 (2) Total M.V.I.C 6900 Non-monet. variable input costs Seeds Kg 30 80 2400 Organic fertilizer Kg 3750 2 7500 Household labor MD 206 240 49440 Capital cost - - - 690 (3) Total N.V.I.C 60030 Fixed costs Small agr. equipment - - - 1317 (4) Total F.C 1317 (5)Total variable input cost (2+3) 66930 (6)Total costs (2 + 3 + 4) 68247 (7)Gross Margin[Monetary] (1- 2) 77100 (8) Total Gross Margin (1 � 5) 17070 (9)Net Margin (1� 6) 15753 Returns to family labor per day(a) 316 Remuneration rate (8/5 * 100) 26%
(a) Returns to family labor per day = (Net Margin + Monetary value of household labor)/ Quantity of household labor.

66
Table B-4. Sorghum budget for plateau de l�est agricultural zone, Modules 2, Kigali rural province, Rwanda (per hectare).
ITEMS UNIT QUANTITY UNIT PRICE
Module 2a (Frw)
Module 2b (Frw)
PRODUCTION -Grain Kg 1,810 80 144800 Kg 1696 80 135680 (1)Gross revenue 144800 135680Monetary variable input costs Mineral fertilizer (NPK) Kg 250 223 55750 Mineral fertilizer (DAP) Kg 76 203 15428 Mineral fertilizer (Urea) Kg 78 225 17550 Organic fertilizer Kg 7,750 2 15500 Hired labor (Module 2a) M.D 25 300 7500 Seeds Kg 30 80 2400 2400 Hired labor (Module 2b) M.D 24 300 7200 Pesticide (Dursiban) Kg 20 250 5000 5000 (2) Total M.V.I.C 86150 47578Non-monet. variable input costs Organic fertilizer Kg 3,750 2 7500 7500 Household labor (module 2a) M.D 222 240 53280 Household labor (module 2b) M.D 219 240 52560 Capital cost 8615 4758 (3) Total N.V.I.C 69395 64818Fixed costs Small agr. equipment - - - 5033 5033 (4) Total F.C 5033 5033(5)Total variable input cost (2+3) 155545 112396(6)Total costs (2 + 3 + 4) 160578 117429(7)Gross Margin[Monetary] (1- 2) 58650 88102(8)Total Gross Margin (1 � 5) -10745 23284(9)Net Margin (1� 6) -15778 18251Returns to family labor per day(a) 169 323Remuneration rate (8/5 * 100) -6.9% 21%V/C ratio(b) 0.85 1.6
(a) Returns to family labor per day= (Net Margin + Monetary value of household labor)/ Quantity of household labor.
(b) v/c ratio = (Gross revenue module 2 - Gross revenue module 1)/ (Total mineral
and organic fertilizer module 2 � Organic fertilizer module 1)

67
Table B-5. Soybeans budget for plateau de l�est agricultural zone, Traditional module, Kigali rural province, Rwanda (per hectare).
ITEMS UNIT QUANTITY UNIT PRICE
MONETARY VALUE
(Frw)
PRODUCTION -Legume Kg 640 131 83840 (1)Gross revenue 83840Monetary variable input costs Seeds Kg 70 131 9170 Hired labor M.D 27 300 8100 (2) Total M.V.I.C 17270Non-monet. variable input costs Organic fertilizer Kg 3,000 2 6000 Household labor M.D 245 240 58800 Capital cost 1727 (3) Total N.V.I.C 66527Fixed costs Small agr. equipment - - - 1,317 (4) Total F.C 1,317(5)Total variable input cost (2+3) 83797(6)Total costs (2 + 3 + 4) 85114(7)Gross Margin[Monetary] (1- 2)
66570
(8) Total Gross Margin (1 � 5) 43(9)Net Margin (1� 6) -1274Returns to family labor per day(a) 235Remuneration rate (8/5 * 100) 0.05%
(a) Returns to family labor per day = (Net Margin + Monetary value of household labor)/ Quantity of household labor.

68
Table B-6. Soybeans budget for plateau de l�est agricultural zone, Module 2, Kigali rural province, Rwanda (per hectare).
ITEMS UNIT QUANTITY UNIT PRICE
MONETARY VALUE
(Frw)
PRODUCTION -Legume Kg 1,248 131 163488 (1)Gross revenue 163488 Monetary variable input costs Seeds Kg 70 156 10920 Mineral fertilizer (DAP) Kg 100 203 20300 Organic fertilizer Kg 7000 2 14000 Hired labor M.D 29 300 8700 (2) Total M.V.I.C 53920 Non-monet. variable input costs Organic fertilizer Kg 3,000 2 6000 Household labor M.D 261 240 62640 Capital cost 5392 (3) Total N.V.I.C 74032 Fixed costs Small agr. equipment - 1317 (4) Total F.C 1317 (5)Total variable input cost (2+3) 127952 (6)Total costs (2 + 3 + 4) 129269 (7)Gross Margin[Monetary] (1- 2) 109568 (8)Total Gross Margin (1 � 5) 35536 (9)Net Margin (1� 6) 34219 Returns to family labor per day(a) 371 Remuneration rate (8/5 * 100) 28% V/C ratio(b) 2.3
(a) Returns to family labor per day = (Net Margin + Monetary value of household labor)/ Quantity of household labor.
(b) v/c ratio = (Gross revenue module 2 - Gross revenue module 1)/ (Total mineral
and organic fertilizer module 2 � Organic fertilizer module 1)

69
Table B-7. Maize budget for plateau de l�est agricultural zone, Traditional module,
Kigali rural province, Rwanda. (per hectare)
ITEMS UNIT QUANTITY UNIT PRICE
MONETARY VALUE
(Frw)
PRODUCTION
-Legume Kg 1,080 93 100440 (1)Gross revenue 100440 Monetary variable input costs Hired labor M.D 22 300 6600 (2) Total M.V.I.C 6600 Non-monet. variable input costs Seeds Kg 40 93 3720 Organic fertilizer Kg 3,000 2 6000 Household labor M.D 199 240 47760 Capital cost 660 (3) Total N.V.I.C 58140 Fixed costs Small agr. equipment - 1317 (4) Total F.C 1317 (5)Total variable input cost (2+3) 64740 (6)Total costs (2 + 3 + 4) 66057 (7)Gross Margin[Monetary] (1- 2) 93840 (8)Total Gross Margin (1 � 5) 35700 (9)Net Margin (1� 6) 34383 Returns to family labor per day(a) 413 Remuneration rate (8/5 * 100) 55%
(a) Returns to family labor per day = (Net Margin + Monetary value of household labor)/Quantity of household

70
Table B-8. Maize budget for plateau de l�est agricultural zone, Module 2, Kigali rural
province, Rwanda. (per hectare)
ITEMS UNIT QUANTITY UNIT PRICE
MONETARY VALUE
(Frw)
PRODUCTION -Grain Kg 2,056 93 191208 (1)Gross revenue 191208Monetary variable input costs Mineral fertilizer (NPK) Kg 250 223 55750 Organic fertilizer Kg 7,000 2 14000 Hired labor M.D 24 300 7200 Seeds Kg 40 93 3720 (2) Total M.V.I.C 80670Non-monet. variable input costs Organic fertilizer Kg 3,000 2 6000 Household labor M.D 211 240 50640 Capital cost - - - 8067 (3) Total N.V.I.C 64707Fixed costs Small agr. equipment - 1317 (4) Total F.C 1317(5)Total variable input cost (2+3) 145377(6)Total costs (2 + 3 + 4) 146694(7)Gross Margin [Monetary](1- 2) 110538(8)Total Gross Margin (1 � 5) 45831(9)Net Margin (1� 6) 44514Returns to family labor per day(a) 451Remuneration rate (8/5 * 100) 32%V/C ratio(b) 1.3
(a) Returns to family labor per day = (Net Margin + Monetary value of household
labor)/ Quantity of household labor. (b) v/c ratio = (Gross revenue module 2 - Gross revenue module 1)/ (Total mineral
and organic fertilizer module 2 � Organic fertilizer module 1)

71
Table B-9: Margins in Plateau de l�Est agro-ecological zone, Kigali rural province, Rwanda, 2001.
Beans Sorghum Soybeans Maize GM1 55,900 77,100 66,570 93,840 TGM1 -12,560 17,070 43 35,700 NM1 -13,877 15,753 -1,274 34,383 GM2a 23,400 58,650 - 110,538TGM2a -75,790 -10,745 - 45,831 NM2a -77,107 -15,778 - 44,514 GM2b 72,620 88,102 109,568 - TGM2b -20,880 23,284 35,536 - NM2b -22,197 18,251 34,219 -
Source: Grouped from crop budgets in tables B-1 to B-8
Notes: GM1= Gross margin for Traditional module TGM1= Total gross margin for traditional module NM1= Net margin for traditional module GM2= Gross margin for Improved techniques TGM2= Total gross margin for improved techniques NM2= Net margin for improved techniques

72
Table B-10: Cost shares in plateau de l�Est agro-ecological zone, Kigali rural province, Rwanda, 2001 (percentage).
C.Beans
M1* C.Beans M2a**
C.Beans M2b**
Sorghum M1
Sorghum M2a
Sorghum M2b
Soybeans M1
Soybeans M2
Maize M1
Maize M2
Mineral fertilizer 0 21.9 12.7 0 34.7 29.1 0 17.4 0 38.7 Organic fertilizer 8.2 11.3 4.7 14.1 14.4 6.6 7 15.6 9.1 13.9 Hired labor 10.0 5.3 6.7 9.7 4.6 6.5 9.6 6.7 10 4.7 Sticks 0 14.7 18.7 0 0 0 0 0 0 0 Small agr. equipments 1.4 0.6 0.8 1.9 3.1 4.4 1.5 1 2 0.9 Pesticide 0 0 0 0 3.1 4.4 0 0 0 0 Seeds 6.2 2.8 3.6 3.4 1.5 2.1 10.8 7.2 5.6 2.6 Household labor 72.3 38.2 48.6 69.8 33.2 47.1 68.9 47.9 86.8 33.8 Capital cost 1.8 5.3 4.3 1.2 5.2 4.0 2.2 4.3 1.2 5.4
Source: Grouped from crop budgets in tables B-1 to B-8
* Traditional modes of production. **Improved agricultural techniques

73
Table B-11. Beans(a) budget for �Plateau central agricultural zone�, traditional module, Kigali rural province, Rwanda. (per hectare)
ITEMS UNIT QUANTITY UNIT
PRICE MONETARY
VALUE (Frw)
PRODUCTION
-Legume Kg 500 100 50000 (1)Gross revenue 50000Monetary variable input costs Seeds Kg 60 100 6000 Hired labor M.D 28 300 8400 (2) Total M.V.I.C 14400Non-monet. variable input costs Organic fertilizer Kg 3,750 2 7500 Household labor M.D 248 240 59520 Capital cost - - - 1440 (3) Total N.V.I.C 68460Fixed costs Small agr. equipments - - - 1317 (4) Total F.C 1317(5)Total variable input cost (2+3) 82860(6)Total costs (2 + 3 + 4) 84177(7)Gross Margin[Monetary] (1- 2) 35600(8)Total Gross Margin (1 � 5) -32860(9)Net Margin (1� 6) -34177Returns to family labor(b) 102Remuneration rate (8/5 * 100) -40%
(a) The data used do not differentiate the two bean categories, climbing and dwarf bean; most of farmers grow the second category that does not need sticks. (b) Returns to family labor = (Net Margin + Monetary value of household labor)/ Quantity of household labor.

74
Table B-12. Climbing beans budget for �Plateau central agricultural zone�, improved techniques, Kigali rural province, Rwanda. (per hectare)
ITEMS UNIT QUANTITY UNIT
PRICE Module 2a
(Frw) Module 2b
(Frw) PRODUCTION -Legume Kg 980 100 98000 Kg 792 100 79200 (1)Gross revenue 98000 79200Monetary variable input costs Seeds Kg 60 235 14100 14100 Mineral fertilizer (NPK) Kg 200 223 44600 Mineral fertilizer (DAP) Kg 100 213 21300 Organic fertilizer Kg 7,750 2 15500 Hired labor (NPK) M.D 37 300 11100 Hired labor (DAP) M.D 36 300 10800 Sticks 22,500 8 30000 30000 (2) Total M.V.I.C 115300 76200Non-monet. variable input costs Organic fertilizer Kg 3,750 2 7500 7500 Household labor (NPK) M.D 334 240 80160 Household labor (DAP) M.D 327 240 78480 Capital cost - - - 11530 7620 (3) Total N.V.I.C 99190 93600Fixed costs Small agr. equipment - - - 1317 1317 (4) Total F.C 1317 1317(5)Total variable input cost (2+3) 214490 169800(6)Total costs (2 + 3 + 4) 215807 171117(7)Gross Margin[Monetary] (1- 2) -17300 3000(8)Total Gross Margin (1 � 5) -116490 -90600(9)Net Margin (1� 6) -117807 -91917Returns to family labor per day(b) -113 -41Remuneration rate (8/5 * 100) -54% -53%V/C ratio(c) 0.8 1.4
(a) Sticks are used for three years and then for six seasons, hence the total charge has to be divided by six. (b) Returns to family labor per day = (Net Margin + Monetary value of household labor)/ Quantity of household labor. (c) v/c ratio = (Gross revenue module 2 - Gross revenue module 1)/ (Total mineral and organic fertilizer module 2 � Organic fertilizer module 1)

75
Table B-13: Sorghum budget for plateau de central agricultural zone, traditional
module, Kigali rural province, Rwanda (per hectare).
ITEMS UNIT QUANTITY UNIT PRICE
MONETARY VALUE
(Frw)
PRODUCTION
-Grain Kg 620 88 54560 (1)Gross revenue 54560 Monetary variable input costs Hired labor M.D 23 300 6900 (2) Total M.V.I.C 6900 Non-monet. variable input costs Seeds Kg 30 88 2640 Organic fertilizer Kg 5000 2 10000 Household labor M.D 206 240 49440 Capital cost - - - 690 (3) Total N.V.I.C 62770 Fixed costs Small agr. equipment - - - 1317 (4) Total F.C 1317 (5)Total variable input cost (2+3) 69670 (6)Total costs (2 + 3 + 4) 70987 (7)Gross Margin[Monetary] (1- 2) 47660 (8)Total Gross Margin (1 � 5) -15110 (9)Net Margin (1� 6) -16427 Returns to family labor per day(a) 160 Remuneration rate (8/5 * 100) -22%
(a) Returns to family labor per day = (Net Margin + Monetary value of household labor)/ Quantity of household labor.

76
Table B-14. Sorghum budget for plateau central agricultural zone, improved techniques, Kigali rural province, Rwanda(per hectare).
ITEMS UNIT QUANTITY UNIT
PRICE Module 2a (Frw)
Module 2b (Frw)
PRODUCTION -Grain Kg 1084 88 95392 Kg 1,706 88 150128 (1)Gross revenue 95392 150128Monetary variable input costs Mineral fertilizer (NPK) Kg 250 233 58250 Mineral fertilizer (DAP) Kg 90 213 19170 Mineral fertilizer (Urea) Kg 70 239 16730 Organic fertilizer Kg 7,750 2 15500 Hired labor (Module 2a) M.D 25 300 7500 Hired labor (Module 2b) M.D 24 300 7200 Pesticide (Dursiban) Kg 20 250 5000 5000 Seeds Kg 30 88 2640 2640 (2) Total M.V.I.C 88890 50740Non-monet. variable input costs Organic fertilizer Kg 3,750 2 7500 7500 Household labor (module 2a) M.D 222 240 53280 Household labor (module 2b) M.D 219 240 52560 Capital cost - - - 8889 5074 (3) Total N.V.I.C 69669 65134Fixed costs Small agr. equipments - - - 5033 5033 (4) Total F.C 5033 5033(5)Total variable input cost (2+3) 158559 115874(6)Total costs (2 + 3 + 4) 163592 120907(7)Gross Margin[Monetary](1- 2) 6502 99388(8)Total Gross Margin (1 � 5) -63167 34254(9)Net Margin (1� 6) -68200 29221Returns to family labor per day(a) -67 373Remuneration rate (8/5 * 100) -40% 30%V/C ratio(b) 0.6 2.86
(a) Returns to family labor per day = (Net Margin + Monetary value of household labor)/ Quantity of household labor.
(b) v/c ratio = (Gross revenue module 2 - Gross revenue module 1)/ (Total mineral and organic fertilizer module 2 � Organic fertilizer module 1)

77
Table B-15. Soybeans budget for plateau central agricultural zone, traditional module, Kigali rural province, Rwanda (per hectare).
ITEMS UNIT QUANTITY UNIT PRICE
MONETARY VALUE
(Frw)
PRODUCTION
-Legume Kg 300 141 42300 (1)Gross revenue 42300Monetary variable input costs Seeds Kg 70 141 9870 Hired labor M.D 27 300 8100 (2) Total M.V.I.C 17970Non-monet. variable input costs Organic fertilizer Kg 3,000 2 6000 Household labor M.D 245 240 58800 Capital cost - 1797 (3) Total N.V.I.C 66597Fixed costs Small agr. equipment - - - 1317 (4) Total F.C 1317(5)Total variable input cost (2+3) 84567(6)Total costs (2 + 3 + 4) 85884(7)Gross Margin[Monetary] (1- 2) 24330(8)Total Gross Margin (1 � 5) -42267(9)Net Margin (1� 6) -43584Returns to family labor per day(a) 62Remuneration rate (8/5 * 100) -50%
(a) Returns to family labor per day = (Net Margin + Monetary value of household labor)/ Quantity of household labor.

78
Table B-16. Soybeans budget for plateau central agricultural zone, improved techniques, Kigali rural province, Rwanda (per hectare).
ITEMS UNIT QUANTITY UNIT PRICE
MONETARY VALUE
(Frw)
PRODUCTION -Legume Kg 886 141 124926 (1)Gross revenue 124926 Monetary variable input costs Seeds Kg 70 156 10920 Mineral fertilizer (DAP) Kg 80 213 17040 Mineral fertilizer (Urea) Kg 10 239 2390 Hired labor M.D 29 300 8700 (2) Total M.V.I.C 39050 Non-monet. variable input costs Organic fertilizer Kg 3,000 2 6000 Household labor M.D 261 240 62640 Capital cost - - - 3905 (3) Total N.V.I.C 72545 Fixed costs Small agr. equipments - - - 1317 (4) Total F.C 1317 (5)Total variable input cost (2+3) 111595 (6)Total costs (2 + 3 + 4) 112912 (7)Gross Margin[Monetary] (1- 2) 85876 (8)Total Gross Margin (1 � 5) 13331 (9)Net Margin (1� 6) 12014 Returns to family labor per day(a) 286 Remuneration rate (8/5 * 100) 12% V/C ratio(b) 4.3
(a) Returns to family labor per day = (Net Margin + Monetary value of household labor)/ Quantity of household labor.
(b) v/c ratio = (Gross revenue module 2 - Gross revenue module 1)/ (Total mineral
and organic fertilizer module 2 � Organic fertilizer module 1)

79
Table B-17. Maize budget for plateau central agricultural zone, traditional module, Kigali rural province, Rwanda (per hectare).
ITEMS UNIT QUANTITY UNIT PRICE
MONETARY VALUE
(Frw)
PRODUCTION - Grain kg 625 92 57500 (1)Gross revenue 57500 Monetary variable input costs Hired labor M.D 22 300 6600 (2) Total M.V.I.C 6600 Non-monet. variable input costs Seeds Kg 40 92 3680 Organic fertilizer Kg 3,000 2 6000 Household labor M.D 199 240 47760 Capital cost - 660 (3) Total N.V.I.C 58100 Fixed costs Small agr. equipment - 1317 (4) Total F.C 1317 (5)Total variable input cost (2+3) 64700 (6)Total costs (2 + 3 + 4) 66017 (7)Gross Margin[Monetary] (1- 2) 50900 (8)Total Gross Margin (1 � 5) -7200 (9)Net Margin (1� 6) -8517 Returns to family labor per day(a) 197 Remuneration rate (8/5 * 100) -11%
(a) Returns to family labor per day = (Net Margin + Monetary value of household labor)/ Quantity of household labor.

80
Table B-18. Maize budget for �Plateau central agricultural zone�, improved techniques, Kigali rural province, Rwanda (per hectare).
ITEMS UNIT QUANTITY UNIT PRICE
Module 2a (Frw)
Module 2b (frw)
PRODUCTION -Grain Kg 1245 92 114540 Kg 1223 92 112516 (1)Gross revenue 114540 112516Monetary variable input costs Mineral fertilizer (NPK) Kg 250 233 58250 Mineral fertilizer (DAP) Kg 90 213 19170 Mineral fertilizer (urea) Kg 110 239 26290 Organic fertilizer Kg 7,000 2 14000 Hired labor (module 2a) M.D 24 300 7200 Hired labor (module 2b) M.D 23 300 6900 Seeds Kg 40 92 3680 3680 (2) Total M.V.I.C 83130 56040Non-monet. variable input costs Organic fertilizer Kg 3,000 2 6000 6000 Household labor (module 2a) M.D 211 240 50640 Household labor M.D 210 240 50400 Capital cost - 8313 5604 (3) Total N.V.I.C 64953 62004Fixed costs Small agr. equipment - 1317 1317 (4) Total F.C 1317 1317(5)Total variable input cost (2+3) 148083 118044(6)Total costs (2 + 3 + 4) 149400 119361(7)Gross Margin[Monetary] (1- 2) 31410 56476(8)Total Gross Margin (1 � 5) -33543 -5528(9)Net Margin (1� 6) -34860 -6845Returns to family labor per day(a) 75 214Remuneration rate (8/5 * 100) -23% -5%V/C ratio(b) 0.8 1.2
(a) Returns to family labor per day= (Net Margin + Monetary value of household labor)/ Quantity of household labor.
(b) v/c ratio = (Gross revenue module 2 - Gross revenue module 1)/ (Total mineral and organic fertilizer module 2 � Organic fertilizer module 1)

81
Table B-19: Margins in Plateau central agro-ecological zone, Kigali rural province, Rwanda, 2001.
Beans Sorghum Soybeans Maize GM1 35,600 47660 24330 50,900 TGM1 -32,860 -15110 -42267 -7,200 NM1 -34,177 -16427 -43584 -8,517 GM2a -17,300 6,502 - 31,410 TGM2a -116,490 -63,167 - -33,543 NM2a -117,807 -68,200 - -34,860 GM2b 3,000 99,388 85,876 56,476 TGM2b -90,600 34,254 13,331 -5,528 NM2b -91,917 29,221 12,014 -6,845
Source: Grouped from crop budgets in tables B-11 to B-18
Notes:
GM1= Gross margin for Traditional module TGM1= Total gross margin for traditional module NM1= Net margin for traditional module GM2= Gross margin for Improved techniques TGM2= Total gross margin for improved techniques
NM2= Net margin for improved techniques

82
Table B-20: Cost shares in plateau central agro-ecological zone, Kigali rural province, Rwanda, 2001 (percentage).
C.Beans
M1* C.Beans M2**
Sorghum M1
Sorghum M2
Soybeans M1
Soybeans M2a
Soybeans M2b
Maize M1
Maize M2
Mineral fertilizer 0 21.8 0 35.6 0 17.9 17.6 0 39.7 Organic fertilizer 8.2 11.3 14.1 14.1 7 15.4 5.4 9.1 13.6 Hired labor 10.0 5.3 9.7 4.5 9.5 6.6 7.7 10 4.6 Sticks 0 14.7 0 0 0 0 0 0 0 Small agr. equipments 1.4 0.6 1.9 3.1 1.5 1 1.2 2 0.9 Pesticide 0 0 0 3.1 0 0 0 0 0 Seeds 6.5 2.9 3.7 1.6 11.5 7.6 8.9 5.6 2.5 Household labor 72.1 38.1 69.6 32.6 68.3 47.2 55.6 72.2 33.1 Capital cost 1.8 5.3 1.2 5.6 2.3 4.4 3.5 1.2 5.5
Source: computed from crop budgets in tables B-11 to B-18
* Traditional modes of production. **Improved agricultural techniques

83
Table B-21. Sorghum budget for Bugesera agricultural zone, traditional module, Kigali rural province, Rwanda (per hectare). ITEMS UNIT QUANTITY UNIT
PRICE MONETARY
VALUE (Frw)
PRODUCTION
-Grain Kg
1,100 86 94600
(1)Gross revenue 94600Monetary variable input costs Hired labor M.D 23 300 6900 (2) Total M.V.I.C 6900Non-monet. variable input costs Seeds Kg 30 86 2580 Organic fertilizer Kg 3,750 2 7500 Household labor M.D 206 240 49440 Capital cost - - - 690 (3) Total N.V.I.C 60210Fixed costs Small agr. equipment - - - 1317 (4) Total F.C 1317(5)Total variable input cost (2+3) 67110(6)Total costs (2 + 3 + 4) 68427(7)Gross Margin[Monetary] (1- 2) 87700(8)Total Gross Margin (1 � 5) 27490(9)Net Margin (1� 6) 26173Returns to family labor per day(a) 367Remuneration rate (8/5 * 100) 41%
(a) Returns to family labor per day = (Net Margin + Monetary value of household labor)/ Quantity of household labor.

84
Table B-22: Sorghum budget for Bugesera agricultural zone, Modules 2, Kigali rural province, Rwanda(per hectare).
ITEMS UNIT QUANTITY UNIT PRICE
Module 2a (Frw)
Module 2b (Frw)
PRODUCTION -Grain Kg 1,820 86 156520 Kg 2591 86 222826 (1)Gross revenue 156520 222826Monetary variable input costs Mineral fertilizer (NPK) Kg 250 222 55500 Mineral fertilizer (DAP) Kg 110 200 22000 Mineral fertilizer (Urea) Kg 80 219 17520 Organic fertilizer 7,750 2 15500 Hired labor (module 2a) M.D 26 300 7800 Hired labor (module 2b) M.D 25 300 7500 Seeds Kg 30 86 2580 2580 Pesticide (Dursiban) Kg 20 250 5000 5000 (2) Total M.V.I.C 86380 54600Non-monet. variable input costs Organic fertilizer Kg 3,750 2 7500 7500 Household labor (module 2a) M.D 231 240 55440 Household labor (module 2b) M.D 230 240 55200 Capital cost - - - 8638 5460 (3) Total N.V.I.C 71578 68160Fixed costs Small agr. equipment - - - 5033 5033 (4) Total F.C 5033 5033(5)Total variable input cost (2+3) 157958 122760(6)Total costs (2 + 3 + 4) 162991 127793(7)Gross Margin[Monetary] (1- 2) 70140 168226(8)Total Gross Margin (1 � 5) -1438 100066(9)Net Margin (1� 6) -6471 95033Returns to family labor per day(a) 212 653Remuneration rate (8/5 * 100) -0.9% 82%V/C ratio(b) 0.9 3.2
(a) Returns to family labor per day = (Net Margin + Monetary value of household labor)/ Quantity of household labor.
(b) v/c ratio = (Gross revenue module 2 - Gross revenue module 1)/ (Total mineral and organic fertilizer module 2 � Organic fertilizer module 1)
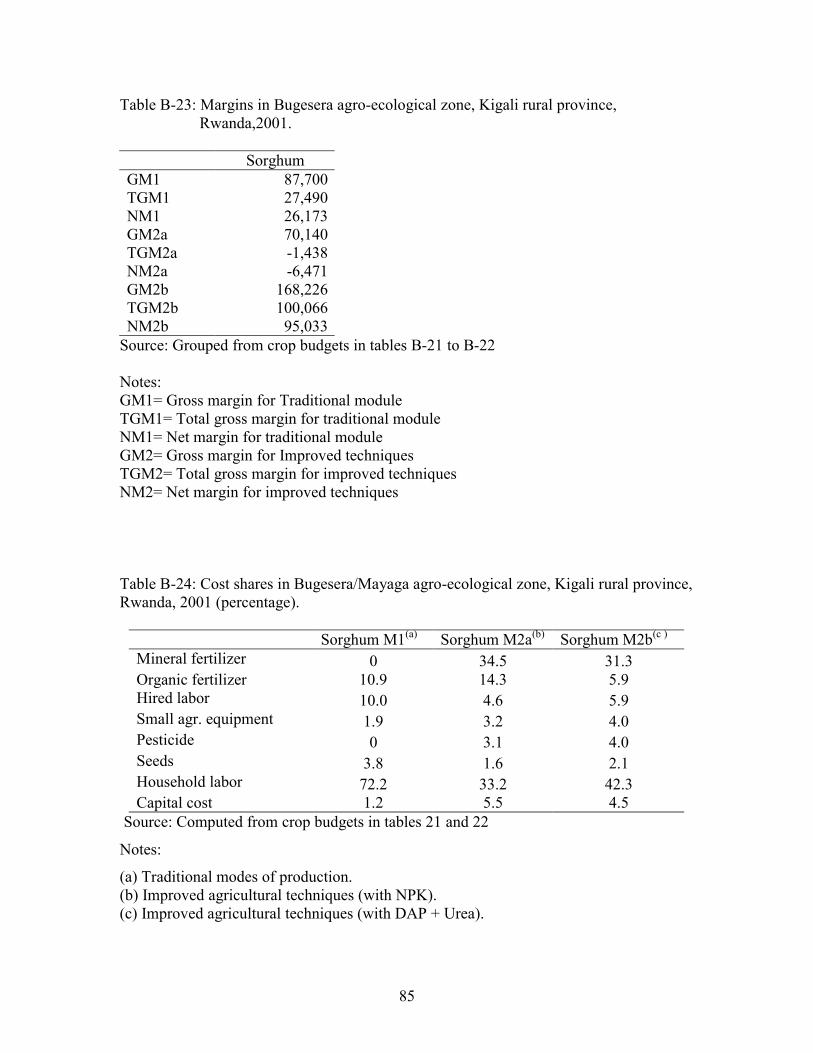
85
Table B-23: Margins in Bugesera agro-ecological zone, Kigali rural province, Rwanda,2001.
Sorghum GM1 87,700TGM1 27,490NM1 26,173GM2a 70,140TGM2a -1,438NM2a -6,471GM2b 168,226TGM2b 100,066NM2b 95,033
Source: Grouped from crop budgets in tables B-21 to B-22 Notes: GM1= Gross margin for Traditional module TGM1= Total gross margin for traditional module NM1= Net margin for traditional module GM2= Gross margin for Improved techniques TGM2= Total gross margin for improved techniques NM2= Net margin for improved techniques
Table B-24: Cost shares in Bugesera/Mayaga agro-ecological zone, Kigali rural province, Rwanda, 2001 (percentage).
Sorghum M1(a) Sorghum M2a(b) Sorghum M2b(c )
Mineral fertilizer 0 34.5 31.3 Organic fertilizer 10.9 14.3 5.9 Hired labor 10.0 4.6 5.9 Small agr. equipment 1.9 3.2 4.0 Pesticide 0 3.1 4.0 Seeds 3.8 1.6 2.1 Household labor 72.2 33.2 42.3 Capital cost 1.2 5.5 4.5
Source: Computed from crop budgets in tables 21 and 22
Notes:
(a) Traditional modes of production. (b) Improved agricultural techniques (with NPK). (c) Improved agricultural techniques (with DAP + Urea).

86
Table B-25: Returns to Family labor per day for selected crops with traditional (M1) and improved practices (M2) in Kigali rural province, Rwanda, 2001(FRW)
Plateau de l'Est Plateau central Bugesera Beans M1 184 102 - Climbing beans M2a 11 -113 - Climbing beans M2b 172 -41 - Sorghum M1 304 164 367 Sorghum M2a 169 -67 214 Sorghum M2b 323 373 653 Soybeans M1 235 73 - Soybeans M2a - - - Soybeans M2b 371 286 Maize M1 412 197 - Maize M2a 451 75 - Maize M2b - 207 -
Source: Grouped from crop budgets in tables B-1 to B-8, B-11 to B-18 and B-21 to B-22
Note: Normal agricultural wage = 300Frw/day
Table B-26: Remuneration rate for selected crops with traditional (M1) and improved practices(M2) in Kigali rural province, Rwanda, 2001(Percentage)
Plateau de l'Est Plateau central Bugesera Beans M1 -15 -40 - Climbing beans M2a -35 -54 - Climbing beans M2b -12 -53 - Sorghum M1 21 -21 41 Sorghum M2a -7 -40 0.6 Sorghum M2b 21 30 82 Soybeans M1 0.1 -47 - Soybeans M2a - - - Soybeans M2b 28 12 Maize M1 55 -11 - Maze M2a 32 -23 - Maize M2b - -5 -
Source: Grouped from crop budgets in tables B-1 to B-8, B-11 to B-18 and B-21 to B-22
M1: Traditional modes of production. M2: Improved agricultural techniques.

APPENDIX C
AGRICULTURAL CALENDA

87
Table C-1: Agricultural calendars for the three major agricultural zones of Kigali rural Province (Adapted from �Calendriers culturaux�, MINAGRI 1986) AGRICULTURAL DISTRICTS CROP SEASON A SEASON B ZONE Sept. Octob. Nov. Dec. Jan. Feb. March April May June July Aug. ooooooooooo Bugesera Gashora Beans /////////////// xxxxxxxx /////////// xx xxxxx & ##### Mayaga Ngenda Peanuts //// /////////// xxxxx xxx Nyamata /// ////////// xxxxxx Soybeans //// /////////// xxxx xxxxxx /////////////// xx xxxxx Sorghum ////////// xxxxxxxxxx Maize /// /////////// xxxxxx xxxxxx Rice xxxxxxxxxxxx ////////// ///////// //////// ///////////// Sweet potato xxxxxxxxxxxx oooooooooooooo ////////// /////////// ########## ///////////////////// xxxxxxxx Cassava ////////// ///////////harvesting after 18 months///////////////////// harvesting after 18 months Banana ////////// /////////// harvesting is gradual ///////////////////// �///� = seedling or planting ; �xxx� = harvesting period; �ooo�= seeding or planting and harvesting; �###�=harvesting in marshland

88
Table C-1 cont. AGRICULTURAL DISTRICT CROP SEASON A SEASON B ZONE Sept. Octob. Nov. Dec. Jan. Feb. March April May June July Aug. ///////// xxxxxx xxxxxx Plateau Rushashi Beans /////////// xxxxxx //////// ////// //////// xx central xx Shyorongi Peanuts ////// ///// xxxxx xx Buliza ///////////// xxxxx Rulindo Soybeans ////// ////// xxxxxx ////////// xxxx Sorghum /////////// xxxxxx xxxxxx//////// Maize ///// ////// xxxxxx /// /////// xxxxx Peas ////////// xxxxxxx ////////// xxxxxx ########### xxxxxxxxxxxxxxxxx Sweet potato xxxxxxxxxxxx ooooooooooo ///////////////////// /////////////////////////////// Potato ##### ooooo ////////// xxxxx xxx //////////// xxxxx Cassava ////////// ///////////harvesting after 18 ////////////////////// //////////harvesting after18 Months to 2 years months to 2 years Bananes ///////////////////// harvesting is gradually ///////////////////// done Colocasia ////////////////////// xxxxxxxxxxxx �///� = seedling or planting ; �xxx� = harvesting period; �ooo�= seedling or planting and harvesting; �###�=harvesting in marshland

89
Table C-1 cont. AGRICULTURAL DISTRICT CROP SEASON A SEASON B ZONE Sept. Octob. Nov. Dec. Jan. Feb. March April May June July Aug. /////////////////// xxxxxxxxx ////////// oooooooooo Plateau Gasabo Beans ##### xxxxx xxxxxxxx de l�Est Bicumbi Peanuts ///////////////// xxxxxxxxxx /////////////////// xxxxxx Soybeans ////////////////// xxxxx////////!////////// xxxxxx Sorghum ////////// xxxxxxxxxx Maize /////////// xxxxxxxx Peas ////////// xxxxxxx xxxxxxxxxxxxxxxxxx Sweet potato xxxxxxxxxxxx ############## oooooooooooo ///////////////////// ///////////////////// xxxxxxxxxx Rice xxxxxxxxxx /////////////////// ///////////////////// xxxxxxxxxxxx Cassava //////////!//////////harvesting after 18 ////////////////////////////////harvesting after18 months months Bananas //////////!///////////harvesting is gradual ///////////!/////// Colocasia ////////////////////// xxxxxxxxxxxx �///� = seedling or planting ; �xxx� = harvesting period; �ooo�= seedling or planting and harvesting; �###�=harvesting in marshland Source: Adapted from MINAGRI(FAO/PASAR), Calendriers culturaux, 1986

APPENDIX D
HOUSEHOLD CHARACTERISTICS

90
Table D-1: Age and gender of the household head for the three major agro-ecological zones, Kigali rural province, Rwanda, 2001 (Percentage) Less than from 20 to more than 19 years 60 years 60 years Total
Plateau de l'Est Male 0 60 0 60
Female 0 33 7 40
Total 0 93 7 100
Bugesera Male 3 58 3 63
Female 0 29 8 37
Total 3 87 11 100
Plateau central Male 0 49 9 58
Female 0 33 9 42
Total 0 82 18 100
Source: Estimated from MINAGRI (FSRP/DSA) survey data (2001) Table D-2. Level of education of the household head for the three major agro-ecological

91
zones, Kigali rural province, Rwanda, 2001 (Percentage of total households in the agro-ecological zone).
Agro-ecological zone
Plateau de l'est Bugesera Plateau central
Level of education Male Female Total Male Female Total Male Female Total
Illiterate 17 37 53 29 24 53 39 31 70
Never in school but literate 3 0 3 3 3 5 6 3 9
Some elementary School 30 0 30 11 8 18 3 6 9
Complete elementary school 10 3 13 21 3 24 3 3 6
Some High school 0 0 0 0 0 0 6 0 6
Total 60 40 100 63 37 100 58 42 100 Source: Estimated from MINAGRI (FSRP/DSA) survey data (2001)

92
Table D-3: Distribution of farmland area per household by quartile (in hectares), Kigali rural province, Rwanda, 2001 Quartile 1 Quartile 2 Quartile 3 Quartile 4 % of Average % of Average % of Average % of Average Agro-ecol. Land area Land area Land area Land area Overall zone per HH per HH per HH per HH Mean Plateau de l�Est 5 0.26 14 0.74 28 1.36 53 2.84 1.30
Bugesera 8 0.36 14 0.7 31 1.08 47 2.05 1.05
Plateau central 5 0.31 12 0.67 21 1.35 62 3.99 1.58
Kigali ngari Province 6 0.3 14 0.66 26 1.21 54 2.7 1.22
Rwanda 5 0.17 12 0.4 23 0.79 61 3.44 0.86
Source: Estimated from MINAGRI (FSRP/DSA) survey data (2001)
Table D-4: Distribution of farmland area per household adult equivalents by quartile (in Hectares), Kigali rural, Rwanda, 2001. Quartile 1 Quartile 2 Quartile 3 Quartile 4 % of Average % of Average % of Average % of Average Agro-ecological Land area Land area Land area Land area Overall zone per HH per HH per HH per HH Mean Plateau de l�Est 5 0.07 14 0.15 26 0.29 56 0.70 0.30
Bugesera 7 0.09 19 0.20 27 0.33 47 0.57 0.30
Plateau central 6 0.08 12 0.15 20 0.28 63 0.89 0.35
Kigali ngari province 6 0.08 15 0.16 24 0.29 55 0.65 0.30
Source: Estimated from MINAGRI (FSRP/DSA) survey data (2001

APPENDIX E
LAND USE PATTERNS AND CROP PRODUCTION
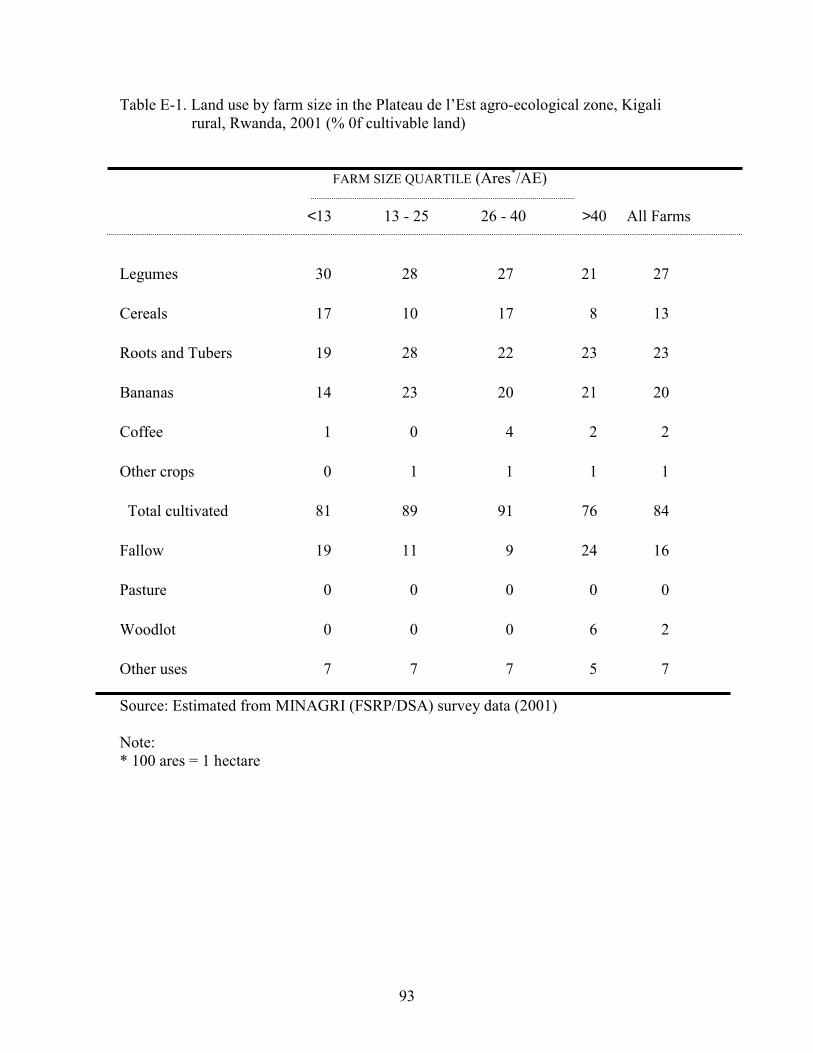
93
Table E-1. Land use by farm size in the Plateau de l�Est agro-ecological zone, Kigali rural, Rwanda, 2001 (% 0f cultivable land) FARM SIZE QUARTILE (Ares*/AE)
<13 13 - 25 26 - 40 >40 All Farms
Legumes 30 28 27 21 27
Cereals 17 10 17 8 13
Roots and Tubers 19 28 22 23 23
Bananas 14 23 20 21 20
Coffee 1 0 4 2 2
Other crops 0 1 1 1 1
Total cultivated 81 89 91 76 84
Fallow 19 11 9 24 16
Pasture 0 0 0 0 0
Woodlot 0 0 0 6 2
Other uses 7 7 7 5 7 Source: Estimated from MINAGRI (FSRP/DSA) survey data (2001)
Note: * 100 ares = 1 hectare

94
Table E-2: Land use by farm size in the Bugesera/Mayaga agro-ecological zone, Kigali rural province, 2001. % OF CULTIVABLE LAND FARM SIZE QUARTILE (Ares/AE) All Farms
<13 13 - 21 22 - 61 >61
Legumes 33 18 20 29 25
Cereals 16 14 22 16 17
Roots and Tubers 34 34 27 19 29
Bananas 5 8 7 10 8
Coffee 1 2 1 3 2
Other crops 0 0 1 3 1
Total cultivated 90 76 78 80 81
Fallow 10 24 22 20 19
Pasture 0 0 0 0 0
Woodlot 0 0 0 0 0
Other uses 7 3 5 3 5 Source: Estimated from MINAGRI (FSRP/DSA) survey data (2001)

95
Table E-3: Land use by farm size in the Plateau central agro-ecological zone, Kigali rural, Rwanda, 2001 % OF CULTIVABLE LAND FARM SIZE QUARTILE (Ares/AE) All Farms
<11 11 - 20 21 - 31 >31
Legumes 28 22 24 22 24
Cereals 13 11 9 11 11
Roots and Tubers 23 26 28 24 25
Bananas 26 23 21 14 21
Coffee 4 3 6 4 4
Other crops 1 7 2 6 4
Total cultivated 95 94 89 82 90
Fallow 5 6 11 18 10
Pasture 0 0 4 0 1
Woodlot 1 0 6 11 4
Other uses 11 6 4 4 6 Source: Estimated from MINAGRI (FSRP/DSA) survey data (2001)

96
Table E-4: Crop shares by farm size in the Plateau de l�Est agro-ecological zone, Kigali rural, 2001. % OF CULTIVATED LAND FARM SIZE QUARTILE (Ares/AE) All Farms
<13 13 - 25 26 - 40 >40 Beans 37 36 33 29 33Peas 1 0 1 1 1Peanuts 2 1 2 0 1Soybeans 0 0 0 0 0Total Legumes 39 37 36 30 35Sorghum 21 7 19 10 14Maize 2 6 3 1 3 Total Cereals 23 13 21 11 17Cassava 7 9 13 12 11White potato 4 5 4 11 6Sweet Potato 13 21 10 14 14Taro 0 2 1 4 2Total Roots and Tubers 25 37 27 40 33Banana 12 13 12 16 14Coffee 1 0 2 1 1Other Crops 0 1 1 1 1 Source: Estimated from MINAGRI (FSRP/DSA) survey data (2001)

97
Table E-5: Crop shares by farm size in the Bugesera/Mayaga agro-ecological zone, Kigali rural, Rwanda, 2001 % OF CULTIVATED LAND FARM SIZE QUARTILE (Ares/AE) All Farms
<13 13 - 25 26 - 40 >40 Beans 29 19 24 31 25Peanuts 9 3 1 8 5Soybeans 0 3 3 2 2 Total legumes 39 25 28 41 32Sorghum 16 16 21 17 18Maize 3 4 9 5 5 Total cereals 19 20 30 22 23Cassava 23 29 23 11 21White Potato 2 0 0 2 1Sweet potato 15 18 13 11 14Taro 0 0 1 2 1 Total Roots and Tubers 40 47 36 26 37Banana 3 6 4 6 5Coffee 1 2 0 2 1Others Crops 0 0 1 4 2 Source: Estimated from MINAGRI (FSRP/DSA) survey data (2001)

98
Table E-6: Crop shares by farm size in the Plateau central agro-ecological zone, Kigali rural province, Rwanda, 2001
% OF CULTIVATED LAND FARM SIZE QUARTILE (Ares/AE) All Farms
<13 13 - 25 26 - 40 >40 Beans 26 26 30 27 28Peas 3 2 1 3 2Soybeans 0 2 1 2 1 Total Legumes 28 30 31 32 31Sorghum 15 9 11 14 13Maize 3 1 1 2 2 Total Cereals 18 10 12 16 14Cassava 13 9 15 13 13White Potato 2 2 2 2 2Sweet Potato 15 14 15 16 15Taro 0 3 6 2 3 Total Roots and Tubers 30 28 38 34 33Banana 18 19 13 8 13Coffee 3 3 3 3 3Other Crops 2 9 3 8 6 Source: Estimated from MINAGRI (FSRP/DSA) survey data (2001)

99
Table E-7: Annual crop production per household for main crops in Kigali rural province, Rwanda, Average 2000-2002.
Agro-ecological zone
Plateau de l�Est Bugesera Plateau central
Quantity Energy Quantity Energy Quantity Energy produced (kcal) produced (kcal) produced (kcal) (kg) (kg) (kg)
Beans 348 980,942 288 811,814 236 665,237
Sorghum 160 305,136 243 463,425 120 228,852
Maize 123 390,808 116 368,561 37 117,560
Cassava 1,307 1,403,718 1,333 1,431,642 752 807,648
Sweet Potato 1,072 1,355,973 1,005 1,271,225 992 1,254,781
Cooking Banana 847 29,349 278 9,633 221 7,658
Beer Banana 1,728 299,981 747 129,679 782 135,755
Table Banana 222 5,057 76 1,731 202 4,601
Peanuts 56 180,632 82 264,497 0 0
Other crops 333 254,745 255 195,075 495 378,675
Total kcal/year/HH 5,206,341 4,947,288 3,600,767
Total kcal/day/HH 14,261 13,554 9,865 Source: Estimated from MINAGRI (FSRP/DSA) survey data (2000, 2001 and 2002)

100
References
Alimini, T. and V.M. Manyong. 2000. Partial budget analysis for on-farm research. International Institute of Tropical Agriculture. Research guide 65. Berdinger, F. 1993. Régions de protection et d�amélioration de la fertilité des sols: Propositionnde regroupement des régions agro-bioclimatiques sur la base de caractéristiques communes. MINAGRI, Direction du Genie Rural et de la Conservation des sols. Kigali, Rwanda. Boserup, Esther. 1965. The condition of agricultural growth. Chicago: Aldine.
---. 1981. Population and technological change: A study of long-term trends. Chicago: University of Chicago Press. ---. 1989. Agricultural growth and population change. In the new Palgrave: Economic development., ed. John Eatwell, Murray Milgate, and Peter Newman. London: W.W.Norton. First published in �The new Palgrave: A dictionary of economics� by the same editors (1987, Macmillan) Byiringiro, F. and Reardon T. 1996. Farm productivity in Rwanda: Effects of farm size, erosion, and soil conservation investment. In Agricultural Economics 15, no. 2, pp, 127-36. Clay, D. C., Reardon T. and Kangasniemi J. 1998. Sustainable intensification in the highland tropics: Rwanda farmers� investments in land conservation and soil fertility. In Economic Development and Cultural Change 46 no 2, pp, 351-77. Crawford, E., and Lambrecht, P. 1985. Note méthodologique sur la préparation des budgets de culture. Département Systèmes, Institut Sénégalais de Recherches Agricoles, Dakar, Senegal. Harrison, Paul. 1987. The greening of Africa. London: Palading Grafton Books.
Human Right Watch, � Uprooting the Rural Poor in Rwanda�, May 2001.
Jayne, T.S., Takashi Yamano, Michael Weber, David Tschirley, Rui Benefica, David Neven, Anthony Chapoto, and Ballard Zulu.2001. Smallholder income Distribution in Africa: Implications for poverty reduction strategies. International Development Paper 24. East Lansing, MI: Michigan state University, Department of agricultural economics. Kangasniemi, Jaakko. 1998. People and bananas on steep slopes: Agricultural Intensification and food security under demographic pressure and environmental Degradation in Rwanda. Ph.D. Dissertation, Michigan State University, East Lansing, MI.

101
Kates, Robert W., Goran Hyden, and B. L. Turner II. 1993. Theory, evidence, study design. In Population growth and agricultural change in Africa, ed. B. L. Turner. Goran Hyden, and Robert W. Kates. Gainesville: University Press of Florida. Kelly, V. and A. Murekezi. 2000. Fertilizer Response and Profitability in Rwanda: A Synthesis of Findings from MINAGRI Studies conducted by the Food Security Research Project and the FAO Soil Fertility Initiative. Kigali: Food Security Research, MINAGRI. Kelly, V., E. Mpyisi., E. Shingiro and J.B. Nyarwaya. 2001a. Agricultural intensification in Rwanda: An elusive goal; Fertilizer use and conservation investments. Kigali: Food Security Research, MINAGRI. Kelly, V, E. Mpyisi, A. Murekezi and D. Neven. 2001b. Fertilizer consumption in Rwanda: Past trend, future potential, and determinants. Kigali: Food Security Research, MINAGRI. Kelly, V. and J. Nyirimana. 2002. Apprentissage par expérience: L�utilisation des Résultats des démonstrations du MINAGRI et du PDMAR pour améliorer les Programmes de stimulation de la demande d�engrais au Rwanda. Kigali, Rwanda: Ministry of Agriculture and Livestock, Division of Agricultural Statistics. Lipton, Michael. 1990. Responses to rural population growth: Malthus and the moderns. In Rural development and population: Institute and policy., ed. Geoffrey McNicoll and Mead Cain. A supplement to Population and Development Review 15. New York: Oxford University Press and the Population Council. Loveridge, Scott. 1992. Sources of household revenue, farm exports, and their impact on Food availability among agricultural households in rural Rwanda. Kigali, Rwanda: Ministry of Agriculture and Livestock, Division of Agricultural Statistics. Martin, Frederic. 1988. Food security and comparative advantage in Senegal : A micro- macro approach. Ph.D. Dissertation, Michigan State University, East Lansing, MI. MINAGRI. 1981. Etude socio-économique de la région du Bugesera. Institut Africain et Mauricien de statisitique et d�economie appliquée, Centre de recherche. MINAGRI. 1986. Calendrier culturaux. Programme de coopération FAO/Gouvernement. Assistance pour la sécurité alimentaire au Rwanda. MINAGRI. 1997. Amafaranga atangwa k�umusaruro w�ibihingwa: Ibirayi, ibishyimbo, amasaka, ibigori, soya n�ingano. Ministry of agriculture, Kigali, Rwanda.

102
MINECOFIN. The Governement of Rwanda poverty reduction Strategy paper. National Poverty Reduction Program, Ministry of Finance and Economic Planning, December 2001
MINECOFIN. A Profile of Poverty in Rwanda. National Poverty Reduction
Program & Statistics Department, Ministry of Finance and Economic Planning, Republic of Rwanda, February 2002.
Muller, C. Transient Seasonal and Chronic Poverty of Peasants: Evidence from Rwanda. CSAE Working Paper series 97-8, 1997.
Okurut, N., F. et al. Determinants of Regional Poverty in Uganda. Economic Policy
Research Center, Research Series No. 8, 1999.
Olson, M. J. �Demographic Responses to Resource Constraints in Rwanda.’ Rwanda Society-Environment Project Working Paper 7, Department of Geography and CASID, Michigan State University. USA. 1994.
Reardon, T., Eric Crawford and Valerie Kelly. 1995. Promoting farm investment for sustainable intensification of African agriculture. International Development Paper 18. East Lansing, MI: Michigan state University, Department of agricultural economics. Reardon, Thomas. 1997. using evidence of household income diversification to inform study of the rural nonfarm labor market in Africa. World Development 25:735-47. Reardon, Thomas. 1998. African agriculture: Productivity and sustainability issues. In International agricultural development., ed. C. K. Eicher and J. M. Staatz. The Jonhs Hopkins University Press. Ruthenberg, Hans. 1980. Farming systems in the tropics. 3rd ed. Oxford: Clarendon Press.
Ruttan, V. W. and Yujiro Hayami. 1998. Induced innovation model of agricultural development. In International agricultural development., ed. C. K. Eicher and J. M. Staatz. The Jonhs Hopkins University Press. Schultz, T. W. 1964. Transforming traditional agriculture. New haven: Yale University Press

103