Land Utilization, Cropping Intensity and Cropping Pattern ...

ORIGINAL ARTICLE
Farm-based cropping pattern optimization and conjunctive useplanning using piece-wise genetic algorithm (PWGA): a case study
Mohammad Mehdi Ghasemi1 • Mohammad Karamouz2,3 • Lee Teang Shui1
Received: 13 November 2015 / Accepted: 9 January 2016 / Published online: 25 January 2016
� Springer International Publishing Switzerland 2016
Abstract So far, several agro-economic optimization
models have been developed in order to deal with agri-
cultural water resources planning and management, among
which the cropping pattern and water allocation opti-
mization models are of significant importance. However,
these models usually consider the land as a plain entirety
and fail to account for a number of important contributing
factors, including the private ownership of agricultural
lands and the unique characteristics of each land parcel.
Hence, the solutions provided by these models are not fully
applicable in real-world and are only meant to help the
decision-maker in analyses. In the present study, a new
model is developed in order to incorporate farm-level data,
and to propose optimal cropping pattern and conjunctive
use decisions at farm level. Furthermore, a modified
genetic algorithm has been developed by piecewise reor-
ganization of chromosome structure, namely piecewise
genetic algorithm (PWGA), and is presented in order to
tackle the nonlinearity and the high number of variables
involved in the model. A URM-based groundwater model
is also coupled with PWGA in order to improve the com-
putational efficiency of the framework. The proposed
model is then run for various scenarios and the results are
compared with those of the general approaches. The results
of this study demonstrate that the general plain-level
models tend to overestimate the expected net benefits.
Moreover, the proposed model is able to optimize the
cropping pattern and water allocation rules over the area
while supporting each land parcel with appropriate
decisions.
Keywords Conjunctive use � Cropping pattern
optimization � Genetic algorithm
Introduction
The optimal use of land and water for agriculture appears
to be a vital and unavoidable task due to water and land
limitations globally. Cropping pattern is one of the most
influential factors in irrigation management which is in
direct relationship with the optimal allocation of land and
water resources. With regards to cropping patterns man-
agement, two questions must be answered: (1) ‘‘Which
crop(s) should be planted?’’ and (2) ‘‘How much area
should be allocated to each crop?’’ Optimal use of water
resources and minimal damage to the environment should
also be considered when providing answers to these
questions. Therefore, the amount of irrigational water to be
applied is usually determined as a by-product of cropping
patterns optimization process.
A number of approaches including benefit-cost, func-
tional, programming, and simulation are often used in order
to determine the best cropping pattern and the amount of
water to be allocated for each crop (Noory et al. 2012;
Parsinejad et al. 2013; Sadegh and Kerachian 2011; Singh
2012). Meanwhile, the cost-benefit approach is quite
& Mohammad Mehdi Ghasemi
Mohammad Karamouz
Lee Teang Shui
1 Department of Biological and Agricultural Engineering,
Faculty of Engineering, University Putra Malaysia, Serdang,
Malaysia
2 Polytechnic institute of NYU, Brooklyn, NY, USA
3 University of Tehran, Tehran, Iran
123
Model. Earth Syst. Environ. (2016) 2:25
DOI 10.1007/s40808-016-0076-z

popular, as most researchers aim at maximization of the
expected net income resulting from the proposed pattern
(Ghahraman and Sepaskhah 2002; Karamouz et al. 2008b).
Nevertheless, a number of models are intended to maxi-
mize the net social benefits (Soltani et al. 2009).
In order to construct cropping pattern models, various
modeling approaches have been employed, including linear
(Faramarzi et al. 2010; Haddad et al. 2009; Kehkha et al.
2005; Ramezani Etedali et al. 2013; Salami et al. 2009;
Soltani et al. 2009) and nonlinear models (Ghahraman and
Sepaskhah 2002, 2004; Kiani 2009; Montazar and Rahi-
mikob 2008). However, the high computational load
associated with solving complex environmental and water
resources models has led many researchers to use various
types of Evolutionary Algorithms (EA) for such purposes
(Afshar et al. 2009; Bazargan et al. 2011; Haddad et al.
2008; Monem and Namdarian 2005; Noory et al. 2011).
Among EAs, Genetic Algorithm (GA) has been the most
commonly applied EA within water resources planning and
management literature, due to its great ability to solve
nonlinear, non-convex, multimodal, and discrete problems
for which deterministic search techniques incur difficulty
or fail completely (Nicklow et al. 2009). To date, various
contributions have been made to improve the efficiency
and applicability of GA for agricultural water resources
planning (Karamouz et al. 2008a, b; Malekmohammadi
et al. 2009, 2011; Nagesh Kumar et al. 2006; Raju and
Kumar 2004; Raju et al. 2012; Zahraie et al. 2003, 2008).
Despite their implications, however, the cropping pat-
tern and water allocation optimization models tend to omit
the existence of land parcels and consider the agricultural
land as an entirety without any fragmentations. That is, the
area under investigation is considered as one single piece
of land with constant characteristics regardless of its extent
(i.e., farm, plain, or region). Nevertheless, this simplifica-
tion often results in neglecting a number of significant
contributing factors, including land and water resources
ownership, hydrological and agronomical characteristics of
fields, and investment capabilities of farmers, which all
vary from farm to farm. This is while most of the above-
mentioned field data—e.g., ownership, location and area of
parcels, availability of water resources to each, and the
present cropping patterns—are routinely collected by
agricultural management bodies in the form of multi-pur-
pose cadaster data.
On the other hand, high computational load associated
with incorporation of such a high level of details when
providing decisions at farm level is a limiting factor in the
development of farm-based cropping pattern and water
allocation optimization models.
In this paper, we present a simulation–optimization
framework which takes advantage of a novel algorithm,
namely piece-wise genetic algorithm (PWGA), in order to
model each farm separately and to support farm-based
cropping pattern and conjunctive use decisions. The pro-
posed framework is comprised of a groundwater modeling
module taking advantage of unit response matrix in order
to reduce the computational load, coupled with PWGA
cropping pattern optimization algorithm. As it will be
shown in the following, our proposed algorithm is able to
address the problems arising from incorporation of high
number of decision variables.
Materials and methods
Model formulation
Aproper and realistic model for optimization of the cropping
patterns and water allocation is a model that might optimally
allocate land andwater to various crops. In this vein, themain
objective of the proposed model is to maximize the differ-
ence between gross benefit of crop production and all costs
associated with agricultural activities. These costs are usu-
ally consist of the costs of planting, growing, and harvesting
crops, in addition to the costs of applied irrigational water.
Thus, the objective function of the optimization model could
be defined as Eq. (1):
Maximize Z ¼ B� C ð1Þ
where: Z = total net benefit of the cultivation plan during
the planning horizon, B = sum of gross benefits resulting
from cultivation plan, C = sum of costs associated with
cultivation plan.
Nevertheless, the novelty of the approach lies in the way
that the benefits and costs are calculated separately for each
farm, instead of each crop. The model constraints are
presented by Eqs. (2)–(18):
B ¼XF
f¼1
XCr
c¼1
ðYafc � Prc � afc � Af Þ ð2Þ
C ¼XF
f¼1
XCr
c¼1
Ccf � afc � Af þXT
t¼1
gfct � Pg þ sfct � Ps
!
ð3Þ
where: F = number of fields, Cr = number of crops,
Yafc = actual crop production per area of crop c in field f,
Prc = market price of crop c, afc = percentage of allo-
cated area to specified crop c in field f, Af = agricultural
area in field f, Ccf = crop production cost of crop c in field
f, T = number of time periods in planning horizon.
gfct = allocated groundwater during period t to crop c in
field f. Pg = groundwater price per volume, Sfct = allo-
cated surface water during period t to crop c in field f,
Ps = surface water price per volume.
25 Page 2 of 12 Model. Earth Syst. Environ. (2016) 2:25
123
Xfc ¼1 crop c is planted in field f
0 otherwise
� �ð4Þ
XCr
c¼1
afc � 1 8 f ð5Þ
XCr
c¼1
Xfc � 1 8 f ð6Þ
0� afc �Xfc ð7Þ
0� sfct �ðSmaxÞftXfc 8 f ; c; t ð8Þ
0�XCr
c¼1
sfct �ðSmaxÞftXfc 8 f ; t ð9Þ
0� gfct �ðGmaxÞftXfc 8 f ; c; t ð10Þ
0�XCr
c¼1
gfct �ðGmaxÞftxfc 8 f ; t ð11Þ
where: Xfc = decision variable determining whether crop
c is cultivated in field f, (Smin)ft and (Smax)ft = minimum
and maximum volume of available surface water for farm
f during time-step t. (Gmin)ft and (Gmax)ft = minimum and
maximum volume of available groundwater for farm
f during time-step t. It is worthy to note that Eq. 6 is
intended to restrict the model to allocate each farm to one
crop at a time. Nevertheless, by removing this constraint,
the model would be able to plant each farm with multiple
crops.
In order to calculate the amount of actual crop produc-
tion (Yafc ), a production function developed by Doorenbos
and Kassam (1979) and later extended by Ghahraman and
Sepaskhah (2004) is used, as follows:
ðYaÞfc ¼ xfc � ðYpÞcYT
t¼1
1� Kyt 1�ðWaÞfctðWpÞfct
!" # !8f ¼ 1; . . .;F
8c ¼ 1; . . .;C
� �
ð12Þwafct ¼ 1000ðsfct þ gfctÞ=ðafc � Af Þ8 f ; c; t ð13Þ
ðWpÞfct ¼Ifct
ðEaÞf8 f ; c; t ð14Þ
Ifct ¼ ðETaÞct � ðPeÞt8 f ; c; t ð15Þ
0� 1�ðWaÞfctðWpÞfct
� xct8 f ; c; t ð16Þ
where: (Wa)fct = depth of water applied to crop c in farm f
during time-step t. (Wp)fct = actual irrigation requirement
of crop c in farm f during time-step t, Ifct = irrigation water
requirement of crop c in period t, (Ea)f = irrigation effi-
ciency in farm f, ðETaÞct = actual evapotranspiration of
crop c in period t, ðPeÞt = effective precipitation in period
t, xct = maximum tolerance of crop c to deficit irrigation in
period t.
Finally, the last constraint of the model restricts the
model to maintain the groundwater drawdown at each well
to a level lower than a preset boundary:
Dhkt ¼ Pðg1;1; g2;1; . . .; gk;1; g1;2; . . .; gk;tÞ ð17Þ
Dhkt � Dhð Þallowable ð18Þ
where: P = groundwater modeling function, g1,1 to
gk,t = volumes of groundwater pumped from well 1 to k in
period 1 to t, Dhkt = calculated drawdown of well k in
time-step t, Dhð Þallowable = maximum level of allowable
groundwater table drawdown.
As it could clearly be seen in Eqs. (2)–(18), this opti-
mization model allocates water from groundwater and
surface resources to each of the farms separately. Besides,
the cultivation fraction is exclusively addressed for each
farm, in contrast to defining the cultivation fraction for
each of the crops, which is general in cropping patterns
optimization models.
Simulation–optimization framework
As demonstrated in Eq. (17), the proposed optimization
model relies on a groundwater simulation model in order to
calculate water table drawdown. MODFLOW is a widely
recognized groundwater model (Harbaugh 2005) which has
been frequently used in conjunction with conjunctive use
optimization models (Bazargan-Lari et al. 2009; Karamouz
et al. 2005; Khare et al. 2007; Safavi et al. 2010). However,
the high computational load associated with the use of this
model makes it difficult to couple it with iterative-based
optimization algorithms. Larroque et al. (2008) and
Alimohammadi et al. (2005) were among those who
demonstrated that the use of Unit Response Matrix (URM)
is an efficient way of incorporating groundwater models in
optimization procedure, since URMs could significantly
reduce the computational run-time.
Figure 1 illustrates the architecture of the proposed
framework. As depicted in this figure, the base level of the
framework is made up roughly of two types of data. The
first strand is more or less related to farms characteristics,
and could be supplied through agricultural cadaster or
similar campaigns. The second strand, however, includes
the data that are generic and could be associated with all
farms (e.g., meteorological data, crop coefficients, and
economic data). Further, the data nested in the base level of
the framework supply all of the parameters presented in
‘‘Model formulation’’ (excluding the decision variables).
The next module of the framework is the GA-based
optimization model, which is comprised of the
Model. Earth Syst. Environ. (2016) 2:25 Page 3 of 12 25
123

optimization algorithms bearing the responsibility of
searching for the optimal cropping pattern with regards to
the parameters derived from data module and the ground-
water model.
For the groundwater model, MODFLOW is used as the
main groundwater simulation model. However, an
embedded URM function is employed in conjunction with
the optimization algorithm for calculating water
table drawdown with respect to well discharge values.
Based on the additively principle, the URM function for
total of k wells is calculated as:
S k; tð Þ ¼XT
t¼1
Xk
j¼1
bk k; j; T � t þ 1ð Þq j; tð Þ ð19Þ
where: S(k, t) = change of water table level at well k at the
end of the time period of t, bk(k, j, T - t ? 1) = the unit
response coefficient, which is defined as the unit change of
the water table at well k during t, due to the excitation
(withdrawal/recharge) at well j during t.
b is a function of the distance between wells, the well
diameters, the hydraulic conductivity of the aquifer, the
recharge of the aquifer, boundary conditions, and the
starting heads (Maddock 1972). The above equations could
also be used for multi-aquifer systems (Yazicigil 1990).
Piece-wise genetic algorithm
Genetic algorithms are a strand of evolutionary algorithms
that use a random search technique that ‘‘evolve’’ a
potential solution for a given system using the genetic
operators (Karamouz et al. 2007). GAs are usually char-
acterized by: (1) generation of an initial population of
potential solutions, each identified as a chromosome; (2)
computation of the objective function value, or fitness
metric of each solution and subsequent ranking of chro-
mosomes according to this metric; (3) some aspect of
chromosome ranking and selection of candidate solutions
to participate in a mating operator, where information from
two or more parent solutions are combined to create off-
spring solutions; and (4) mutation of each individual off-
spring to maintain diversity and prevent premature
convergence to local optima. These elements are repeated
in sequential generations until a suitable solution is
obtained (Nicklow et al. 2009).
The general structure of chromosomes used in most
cropping patterns optimization models is a vector consist-
ing of the following decision variables: number of Cr
variables, each representing the plantation fraction of a
crop, followed by T sequences of St and Gt which form the
Fig. 1 Architecutre of Farm-
based cropping pattern and
water allocation optimization
model
25 Page 4 of 12 Model. Earth Syst. Environ. (2016) 2:25
123
water allocation scheme. Alternatively, St and Gt could
exclusively be defined for each of the crops. However, the
use of such vector-based approach would be problematic in
detailed models, since the incorporation of decision vari-
ables for each farm would result in a rather large vector.
The proposed chromosome structure to curb this issue is
a matrix-based chromosome, in which each row of the
matrix encodes the decision variables corresponding to a
farm. In such a structure, assuming that the farm decision
variables consist of a crop choice variable, a crop planta-
tion percentage variable, and 72 water allocation variables,
each of which correspond to either surface water or
groundwater decisions during 10 days, the chromosome
would be a matrix of n 9 74, instead of a relatively large
vector of 1 9 (n 9 74) length.
GA operators
The use of matrix to encode chromosomes allows for easier
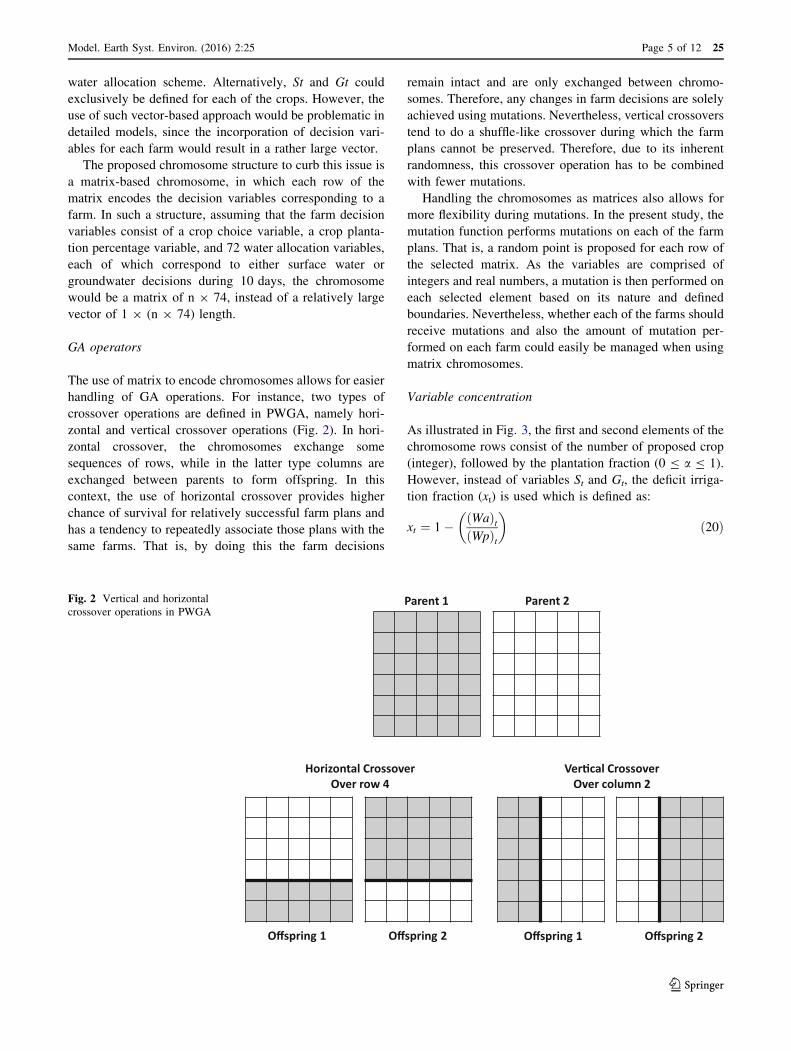
handling of GA operations. For instance, two types of
crossover operations are defined in PWGA, namely hori-
zontal and vertical crossover operations (Fig. 2). In hori-
zontal crossover, the chromosomes exchange some
sequences of rows, while in the latter type columns are
exchanged between parents to form offspring. In this
context, the use of horizontal crossover provides higher
chance of survival for relatively successful farm plans and
has a tendency to repeatedly associate those plans with the
same farms. That is, by doing this the farm decisions
remain intact and are only exchanged between chromo-
somes. Therefore, any changes in farm decisions are solely
achieved using mutations. Nevertheless, vertical crossovers
tend to do a shuffle-like crossover during which the farm
plans cannot be preserved. Therefore, due to its inherent
randomness, this crossover operation has to be combined
with fewer mutations.
Handling the chromosomes as matrices also allows for
more flexibility during mutations. In the present study, the
mutation function performs mutations on each of the farm
plans. That is, a random point is proposed for each row of
the selected matrix. As the variables are comprised of
integers and real numbers, a mutation is then performed on
each selected element based on its nature and defined
boundaries. Nevertheless, whether each of the farms should
receive mutations and also the amount of mutation per-
formed on each farm could easily be managed when using
matrix chromosomes.
Variable concentration
As illustrated in Fig. 3, the first and second elements of the
chromosome rows consist of the number of proposed crop
(integer), followed by the plantation fraction (0 B a B 1).
However, instead of variables St and Gt, the deficit irriga-
tion fraction (xt) is used which is defined as:
xt ¼ 1� Wað ÞtWpð Þt
� �ð20Þ
Parent 1 Parent 2
Offspring 1 Offspring 2 Offspring 1 Offspring 2
Horizontal CrossoverOver row 4
Ver�cal CrossoverOver column 2
Fig. 2 Vertical and horizontal
crossover operations in PWGA
Model. Earth Syst. Environ. (2016) 2:25 Page 5 of 12 25
123

In this scheme, the use of deficit irrigation with 5 time-
steps corresponding to 5 growth stages of crop Cf
(Ghahraman and Sepaskhah 2004) reduces the number of
decision variables from f 9 (2 ? 72) to the far smaller
value of f 9 (2 ? 5). Based on Eq. (20), and given the fact
that Wp is known, Wa could be derived from xt. Due to the
low price of the surface waters and the critical condition of
groundwater resources, the priority of each farm is to
consume all of its surface resources and then try to reach
the proposed deficit irrigation plan using groundwater
resources (if any). Hence, the corresponding Gt and Stcould be evaluated for each farm, based on Cf, af, and x1 to
x5.
Stall handling
The proposed PWGA takes advantage of a semi-adaptive
stall handling mechanism. In order to prevent premature
convergence of the population and to avoid being trapped
in local optima—as this is expectable due to the non-con-
vex nature of the problem—the algorithm is able to
increase the population diversity when a persistent stall
occurs. To this end, the algorithm reduces the probabilities
of crossover and elitism and increases the rate of muta-
tions. In this context, elites are highly fit individuals
reaching the next generation without participating in
crossover or mutations. During the stall handling process,
the increased randomness due to the increased probability
of mutations helps to maintain population diversity. Nev-
ertheless, the best solutions are still preserved, since few
elites are still allowed to reach the next generations. Once
the desired level of diversity is achieved, the crossover
probability and the number of elites return to the previous
state.
Case study
The study area is Mobarakabad district, settled on Qader-
abad-Madarsoleiman plain in Fars province, Iran. As pre-
cipitation is limited due to the semi-arid climate of the
central parts of Iran, a large portion of the irrigational water
is withdrawn from the groundwater resources. Uncon-
trolled growth of the agricultural activities in the area has
caused the water table to drop 1.2 m per annum (Pouyan-
Shiraz-Consultants 2012).
Figure 4 shows the location and the cropping pattern of
Mobarakabad in 2007. The study area is comprised of 126
land parcels with 63 owners. The total cultivated area is
207.8 ha with an average of 1.647 ha per field (Ghasemi
et al. 2010). The majority of the farms are under the cul-
tivation of wheat. The only surface water resource is
Mobarakabad aqueduct’s fountain which is located outside
of the case study area and groundwater extraction is
determined to not have any effects on it. One aqueduct and
17 wells supply the agricultural water in this area. The
discharge of the aqueduct depends on climatic conditions
and ranges from 20 l/s during droughts up to 150 l/s in wet
years. The 10-day share of each field from surface water is
currently determined based on the area of each field.
In this study, various conditions are simulated bymeans of
altering the model parameters. Further, the results acquired
from PWGA are compared with those of the general plain-
level optimization models run for the same conditions. To
this end, the effects of wet, normal, and drought climatic
conditions are simulated by altering the meteorological
parameters and the availability of surface waters. Various
levels of allowable groundwater table drawdown formed the
second group of scenarios. Finally, various water priceswere
defined in order to investigate the effects ofwater price on the
Fig. 3 Proposed chromosome
structure for cropping pattern
planning
25 Page 6 of 12 Model. Earth Syst. Environ. (2016) 2:25
123

model’s output. However, since no water market was
established between the farmers, the market price for
groundwater was unknown. Thus, the base groundwater
price was calculated as the sum of the fixed and variable
annual costs of operating pumping wells. This value was
determined to be 109.7 Rials/m3, and four water price sce-
narios included 100 and 200 % increase of the groundwater
price (219.4 and 329.1 Rials/m3), in addition to 1000 and
2500 Rials/m3 fees.
Results and discussion
Cropping patterns optimization
The results for nine scenarios in both cases of using PWGA
and the general form of cropping pattern optimization
model which was solved using GA are provided in Table 1.
As it could be seen at first glance, the net benefits resulting
from more restrictive scenarios tend to be lower in com-
parison to those acquired from more permissive scenarios
(e.g., Dh B 1 m in comparison with Dh B 3 m).
Nevertheless, the most notable occurrence is the dif-
ferences between the results of PWGA and the plain-level
model. Table 1 clearly demonstrates that the plain-level
model has a tendency to overestimate the net benefits in all
of the nine cases. This is partially due to the fact that in
contrast with the real-world situations, the plain model has
been able to favorably allocate groundwater from all of the
17 wells to large areas of land. However, in real-world, the
private ownership of the wells would limit the areas that
enjoy using the groundwater resources. Moreover, given
the current situation in the study area, the withdrawal rate
of each farm from surface waters cannot exceed its pre-
determined share of water. Hence, the results acquired
from PWGA could be considered as more realistic in
comparison with those of the plain model.
Due to the spatial nature of the optimal decisions pro-
vided by PWGA, these results could easily be linked with
spatial databases and be presented in the form of maps/
spatial services. Figures 5 and 6 illustrate the proposed
cropping pattern, and plantation fractions obtained for the
first scenario (Dh B 1 m).
It is worthy to note that, due to the fact that a number of
parameters are calculated for chromosomes during the
optimization procedure, these parameters could also be
extracted for each desired chromosome when required.
These parameters include St, Gt, (Ya)f, Bf, Cf, and Dhk,t.
Fig. 4 Location and cropping pattern of the study area (Mokhtarabad) in 2007
Model. Earth Syst. Environ. (2016) 2:25 Page 7 of 12 25
123

Table
1Resultsofcroppingpattern
optimization,PWGA
versusplain
models
Scenario
Model
Gross
Benefit
Cost
Net
benefit
Plantationfraction
Wh
Br
Cu
Mai
Cn
On
Sb
To
Pe
Wm
Af
Total
DH
B1m
PWGA
4,201,848,486
1,832,396,257
2,369,452,230
0.007
0.009
0.039
0.005
0.007
0.039
0.008
0.009
00.282
0.008
0.414
Conv.
3,814,079,733
1,407,600,737
2,406,478,996
00
0.17
00.12
00
00
00
0.3
DH
B2m
PWGA
4,411,940,911
19,147,338,395
2,497,202,516
0.007
0.009
0.04
0.005
0.007
0.041
0.009
0.009
00.296
0.008
0.434
Conv.
4,344,513,988
1,637,265,883
2,707,248,105
00.0
0.19
00.2
00
00
00
0.39
DH
B3m
PWGA
5,740,722,358
2,542,567,964
3,198,157,394
0.009
0.009
0.042
0.007
0.01
0.023
0.011
0.012
0.01
0.398
0.015
0.547
Conv.
5,193,179,277
1,931,615,697
3,261,563,581
0.01
0.0
0.21
00.19
0.01
00.01
00.01
0.01
0.45
Pg=
219.4
PWGA
4,423,438,987
2,041,165,841
2,382,273,146
0.007
0.006
0.037
0.007
0.011
0.047
0.006
0.011
00.293
0.011
0.438
Conv.
3,334,736,291
946,936,607.2
2,387,799,683
00.0
0.04
00.11
0.02
00
00.1
00.27
Pg=
329.1
PWGA
3,969,959,526
1,798,511,192
2,171,448,333
0.008
0.009
0.038
0.005
0.007
0.039
0.008
0.009
00.265
0.008
0.399
Conv.
3,335,706,490
953,538,030.4
2,382,168,459
00.0
0.04
00.11
0.02
00
00.1
00.27
Pg=
1000
PWGA
3,959,162,292
2,066,337,383
1,892,824,908
0.007
0.009
0.032
0.005
0.007
0.04
0.009
0.009
00.268
0.008
0.395
Conv.
3,334,736,291
1,007,416,967
2,327,319,324
00.0
0.05
00.08
0.02
00
00.1
00.25
Pg=
2500
PWGA
3,626,011,819
1,742,824,805
1,883,187,014
0.01
0.009
0.033
0.012
0.009
0.024
0.005
0.007
00.259
0.003
0.373
Conv.
3,375,980,210
1,101,483,752
2,274,496,458
00.0
0.05
00.08
0.02
00
00.1
00.25
Norm
alclim
ate
PWGA
5,871,070,860
2,971,866,591
2,899,204,269
0.006
00.037
0.005
0.011
0.04
0.003
0.026
0.02
0.365
0.032
0.541
Conv.
8,755,946,958
3,247,667,678
5,508,279,280
0.5
0.0
0.11
00.02
0.02
00
00.29
00.93
Wet
clim
ate
PWGA
6,820,649,459
2,765,113,053
4,055,536,406
0.006
0.008
0.051
0.006
0.002
0.034
0.005
0.019
0.01
0.408
0.009
0.555
Conv.
16,866,961,629
3,668,272,241
13,198,689,387
00.0
0.05
00.08
0.02
00
00.85
01
Whwheat,Brbarley,CuCucumber,MaiMaize,CnCanola,OnOnion,SbSugar
beet,ToTomato,PePeas,
Wm
Watermelon,AfAlfalfa,PWGA
Piece-w
isegenetic
algorithm,Conv
Conventional
plain
model,24,790IR.Rials
=1USD
25 Page 8 of 12 Model. Earth Syst. Environ. (2016) 2:25
123

That is to say, although the conjunctive use decisions are
not directly incorporated as decision variables, they could
be easily derived from the chromosomes. For instance, due
to limited space in this paper, only the conjunctive use
decisions obtained for farms 18 and 77 under the second
scenario (Dh B 2 m) are presented in Fig. 7.
Stall handling
Figure 8 illustrates the convergence process of PWGA
populations and makes comparison between the algorithms
in presence and absence of the stall handling code. As
shown on the left side of Fig. 8, the mean fitness of the
population rapidly approaches the best fitness, showing that
the population is gradually dominated by highly fit indi-
viduals (premature convergence). In contrast, in case the
stall handling mechanism is enabled, the mutation rate is
increased and the mean fitness of the population drops
when encountering a persistent stall. This increase has led
to increase of the gene diversity within the population, and
the algorithm could eventually find better solutions. The
repetition of this process has contributed to a wavy form
noticeable in mean fitness of the population, and an overall
improvement in the algorithm’s efficiency.
Fig. 5 Parcel-level optimal
cropping pattern decisions for
the study area (Dh B 1 m)
Model. Earth Syst. Environ. (2016) 2:25 Page 9 of 12 25
123

Summary and conclusion
In this paper, a novel approach to cropping patterns and
water allocation optimization was presented. The proposed
model aimed at supporting optimal cropping pattern and
conjunctive use decisions at land parcel level. For this
purpose, a URM groundwater model is coupled with a
modified genetic algorithm. The matrix-based genetic
algorithm, namely PWGA, was used in order to tackle the
large number of decision variables incorporated in such a
detailed model. As expected, the use of PWGA showed
that general cropping pattern optimization models tend to
overestimate the optimal net benefits, due to having an
unrealistic modeling approach to allocation of water
resources.
The proposed PWGA algorithm provides superior
capabilities for handling large numbers of decision vari-
ables, including the easier and more flexible crossover and
mutation operations. Besides, the dimensions of the prob-
lem are reduced by condensation of the water allocation
variables using a new approach.
The use of a semi-adaptive mechanism for handling
persistent generation stalls has also improved the perfor-
mance of the proposed optimization model in avoiding
convergence to local optimums. Nevertheless, this mech-
anism could be further developed in such a way that the
Fig. 6 Optimal plantation
fraction of Mokhtarabad farms
(Dh B 1 m)
25 Page 10 of 12 Model. Earth Syst. Environ. (2016) 2:25
123

operation probabilities are dynamically determined for
each generation, based on the diversity estimates obtained
from the populations.
Although two crossover operations are presented in this
paper, PWGA used in this study could only use one of the
two types at a time. Nevertheless, the codes could be
extended to perform both crossover operations simultane-
ously and with different probabilities. Furthermore, the
authors did not incorporate any dynamism in severity of the
mutation and/or crossover operations.
Finally, in the present study we only tried to maximize
the overall net income of the plain by proposing decisions
at land parcel level, while maintaining a certain level of
groundwater exploitation. Nevertheless, the incorporation
of cadastral data including detailed ownership data has
made it possible to evaluate metrics regarding the equality
of water usages, distribution of income, and many other
factors for each of the proposed decision sets. The authors
conclude that incorporation of such disparity metrics in the
objective function would result in improving the applica-
bility of the optimization model in real-world scenarios.
References
Afshar A, Sharifi F, Jalali MR (2009) Non-dominated archiving
multi-colony ant algorithm for multi-objective optimization:
application to multi-purpose reservoir operation. Eng Optim
41:313–325
Alimohammadi S, Afshar A, Ghaheri A (2005) Unit response matrix
coefficients Development: ANN approach. In: Proceedings of the
5th WSEAS/IASME International Conference on Systems
Fig. 7 Optimal conjunctive use decisions under Dh B 2 m scenario: a farm number 18 is planted with barley and has no access to groundwater;
b farm number 77 is planted with watermelon and has access to groundwater
Fig. 8 The effects of absence/presence of stall handling code on PWGA performance
Model. Earth Syst. Environ. (2016) 2:25 Page 11 of 12 25
123

Theory and Scientific Computation. World Scientific and
Engineering Academy and Society Greece, Greece, pp 17–25
Bazargan J, Hashemi H, Mousavi S, Zamani Sabzi H (2011) Optimal
operation of single-purpose reservoir for irrigation projects under
deficit irrigation using particle swarm algorithms. Can J Environ
Constr Civil Eng 2:164–171
Bazargan-Lari MR, Kerachian R, Mansoori A (2009) A conflict-
resolution model for the conjunctive use of surface and
groundwater resources that considers water-quality issues: a
case study. Environ Manage 43:470–482
Doorenbos J, Kassam AH (1979) Yield response to water, in: 33,
F.I.D.P.N. (ed) FAO, Rome, Italy, p 193
Faramarzi M, Yang H, Mousavi J, Schulin R, Binder CR, Abbaspour
KC (2010) Analysis of intra-country virtual water trade strategy
to alleviate water scarcity in Iran. Hydrol Earth Syst Sci Dis
7:2609–2649
Ghahraman B, Sepaskhah A-R (2002) Optimal allocation of water
from a single purpose reservoir to an irrigation project with pre-
determined multiple cropping patterns. Irrig Sci 21:127–137
Ghahraman B, Sepaskhah A-R (2004) Linear and non-linear
optimization models for allocation of a limited water supply.
Irrig Drain 53:39–54
Ghasemi MM, Bardideh M, Jahanafrooz A (2010) A simple method
for preparing farms spatial database (A case study on the district
of Pasargad in Fars Province) MRSS 6th International Remote
Sensing & GIS Conference and Exhibition, Putra World Trade
Center, Kuala Lumpur, Malaysia
Haddad OB, Afshar A, Marino MA (2008) Honey-bee mating
optimization (HBMO) algorithm in deriving optimal operation
rules for reservoirs. J Hydroinformatics 10:257
Haddad OB, Moradi-Jalal M, Mirmomeni M, Kholghi MK, Marino
MA (2009) Optimal cultivation rules in multi-crop irrigation
areas. Irrig Drain 58:38–49
Harbaugh AW (2005) MODFLOW-2005, the U.S. Geological Survey
modular ground-water model—the Ground-Water Flow Process.
US Geol Surv Tech Methods 6-A16, Reston, VA, United States
Karamouz M, Tabari MR, Kerachian R, Zahraie B (2005) Conjunc-
tive use of surface and groundwater resources with emphasis on
water quality. In: Proceedings of the World Water and Environ-
mental Resources Congress, Anchorage, Alaska, United States,
p 360
Karamouz M, Tabari MMR, Kerachian R (2007) Application of
genetic algorithms and artificial neural networks in conjunctive
use of surface and groundwater resources. Water Int 32:163–176
Karamouz M, Abesi O, Moridi A, Ahmadi A (2008a) Development of
optimization schemes for floodplain management; a case study.
Water Resour Manage 23:1743–1761
Karamouz M, Zahraie B, Kerachian R, Eslami A (2008b) Crop
pattern and conjunctive use management: a case study. Irrig
Drain 59:161–173
Kehkha AA, Soltani Mohammadi G, Villano R (2005) Agricultural
risk analysis in the Fars Province of Iran: a risk-programming
approach. Agric Resour, Economics 2Khare D, Jat M, Sunder J (2007) Assessment of water resources
allocation options: conjunctive use planning in a link canal
command. Resour Conserv Recycl 51:487–506
Kiani GH (2009) Potential gains from water markets construction:
Saveh region case study. Environ Sci 6:65–72
Larroque F, Treichel W, Dupuy A (2008) Use of unit response
functions for management of regional multilayered aquifers:
application to the North Aquitaine Tertiary system (France).
Hydrogeol J 16:215–233
Maddock T (1972) Algebraic technological function from a simula-
tion model. Water Resour Res 8:129–134
Malekmohammadi B, Kerachian R, Zahraie B (2009) Developing
monthly operating rules for a cascade system of reservoirs:
Application of Bayesian Networks. Environ Model Softw
24:1420–1432
Malekmohammadi B, Zahraie B, Kerachian R (2011) Ranking
solutions of multi-objective reservoir operation optimization
models using multi-criteria decision analysis. Expert Syst Appl
38:7851–7863
Monem MJ, Namdarian R (2005) Application of simulated annealing
(SA) techniques for optimal water distribution in irrigation
canals. Irrig Drain 54:365–373
Montazar A, Rahimikob A (2008) Optimal water productivity of
irrigation networks in arid and semi-arid regions. Irrig Drain
57:411–423
Nagesh Kumar D, Raju KS, Ashok B (2006) Optimal reservoir
operation for irrigation of multiple crops using genetic algo-
rithms. J Irrig Drain Eng 132:123–129
Nicklow J, Reed P, Savic D, Dessalegne T, Harrell L, Chan-Hilton A,
Karamouz M, Minsker B, Ostfeld A, Singh A (2009) State of the
art for genetic algorithms and beyond in water resources planning
and management. J Water Resour Plann Manag 136:412–432
Noory H, Liaghat AM, Parsinejad M, Haddad OB (2011) Optimizing
irrigation water allocation and multicrop planning using discrete
PSO algorithm. J Irrig Drain Eng 138:437–444
Noory H, Liaghat AM, Parsinejad M, Haddad OB (2012) Optimizing
irrigation water allocation and multicrop planning using discrete
PSO Algorithm. J Irrig Drain Eng 138:437–444
Parsinejad M, Yazdi AB, Araghinejad S, Nejadhashemi AP, Tabrizi
MS (2013) Optimal water allocation in irrigation networks based
on real time climatic data. Agric Water Manag 117:1–8
Pouyan-Shiraz-Consultants (2012) A survey of water resources in
Qaderabad-Madar Soleiman in Bakhtegan basin for the Power
ministry. Fars, Boushehr, and Kohgilouye-Bouyr-Ahmad Regio-
nal Water Authority
Raju KS, Kumar DN (2004) Irrigation planning using genetic
algorithms. Water Resour Manage 18:163–176
Raju KS, Vasan A, Gupta P, Ganesan K, Mathur H (2012) Multi-
objective differential evolution application to irrigation planning.
ISH J Hydraul Eng 18:54–64
Ramezani Etedali H, Liaghat A, Parsinejad M, Tavakkoli AR, Bozorg
Haddad O, Ramezani Etedali M (2013) Water allocation
optimization for supplementary irrigation in rainfed lands to
increase total income case study: upstream Karkheh River Basin.
Irrig Drain 62:74–83. doi:10.1002/ird.1700
Sadegh M, Kerachian R (2011) Water resources allocation using
solution concepts of fuzzy cooperative games: fuzzy least core
and fuzzy weak least core. Water Resour Manage 25:2543–2573
Safavi HR, Darzi F, Marino MA (2010) Simulation-optimization
modeling of conjunctive use of surface water and groundwater.
Water Resour Manage 24:1965–1988
Salami H, Shahnooshi N, Thomson KJ (2009) The economic impacts
of drought on the economy of Iran: an integration of linear
programming and macroeconometric modelling approaches.
Ecol Econ 68:1032–1039
Singh A (2012) An overview of the optimization modelling appli-
cations. J Hydrol 466–467:167–182
Soltani GR, Bakhshoodeh M, Zibaei M (2009) Optimization of
agricultural water use and Trade Patterns: The Case of Iran,
Economic Research Forum Working Papers, pp 508
Yazicigil H (1990) Optimal planning and operation of multiaquifer
system. J Water Resour Plann Manag 116:435–454
Zahraie B, Behzadian K, Kerachian R, Karamouz M (2003) An
evolutionary model for operation of hydropower reservoirs.
World Water Environ Resour Congress 2003:1–10
Zahraie B, Kerachian R, Malekmohammadi B (2008) Reservoir
operation optimization using adaptive varying chromosome
length genetic algorithm. Water Int 33:380–391
25 Page 12 of 12 Model. Earth Syst. Environ. (2016) 2:25
123