
FAO Statistical Yearbook 2014 Near East and North Africa Food and Agriculture
174
Transcript of FAO Statistical Yearbook 2014 Near East and North Africa Food and Agriculture
8/12/2019 FAO Statistical Yearbook 2014 Near East and North Africa Food and Agriculture
http://slidepdf.com/reader/full/fao-statistical-yearbook-2014-near-east-and-north-africa-food-and-agriculture 1/174

8/12/2019 FAO Statistical Yearbook 2014 Near East and North Africa Food and Agriculture
http://slidepdf.com/reader/full/fao-statistical-yearbook-2014-near-east-and-north-africa-food-and-agriculture 2/174
8/12/2019 FAO Statistical Yearbook 2014 Near East and North Africa Food and Agriculture
http://slidepdf.com/reader/full/fao-statistical-yearbook-2014-near-east-and-north-africa-food-and-agriculture 3/174
FAO STATISTICAL YEARBOOK
2014
Near East and North Africa
Food and Agriculture
Food and Agriculture Organization of the United Nations
Regional Office for the Near East and North Africa
Cairo, 2014
8/12/2019 FAO Statistical Yearbook 2014 Near East and North Africa Food and Agriculture
http://slidepdf.com/reader/full/fao-statistical-yearbook-2014-near-east-and-north-africa-food-and-agriculture 4/174
The designations employed and the presentation of material in this information
product do not imply the expression of any opinion whatsoever on the part of theFood and Agriculture Organization of the United Nations (FAO) concerning the legal
or development status of any country, territory, city or area or of its authorities, orconcerning the delimitation of its frontiers or boundaries. The mention of specific
companies or products of manufacturers, whether or not these have been patented,
does not imply that these have been endorsed or recommended by FAO in preferenceto others of a similar nature that are not mentioned.
The views expressed in this information product are those of the author(s) and do not
necessarily reflect the views or policies of FAO.
ISBN 978-92-5-108147-1 (print)E-ISBN 978-92-5-108148-8 (PDF)
© FAO, 2014
FAO encourages the use, reproduction and dissemination of material in this informationproduct. Except where otherwise indicated, material may be copied, downloaded and
printed for private study, research and teaching purposes, or for use in non-commercialproducts or services, provided that appropriate acknowledgement of FAO as the source
and copyright holder is given and that FAO’s endorsement of users’ views, products orservices is not implied in any way.
All requests for translation and adaptation rights, and for resale and other commercial
use rights should be made via www.fao.org/contact-us/licence-request or addressed to
FAO information products are available on the FAO website (www.fao.org/publications)and can be purchased through [email protected].
8/12/2019 FAO Statistical Yearbook 2014 Near East and North Africa Food and Agriculture
http://slidepdf.com/reader/full/fao-statistical-yearbook-2014-near-east-and-north-africa-food-and-agriculture 5/174
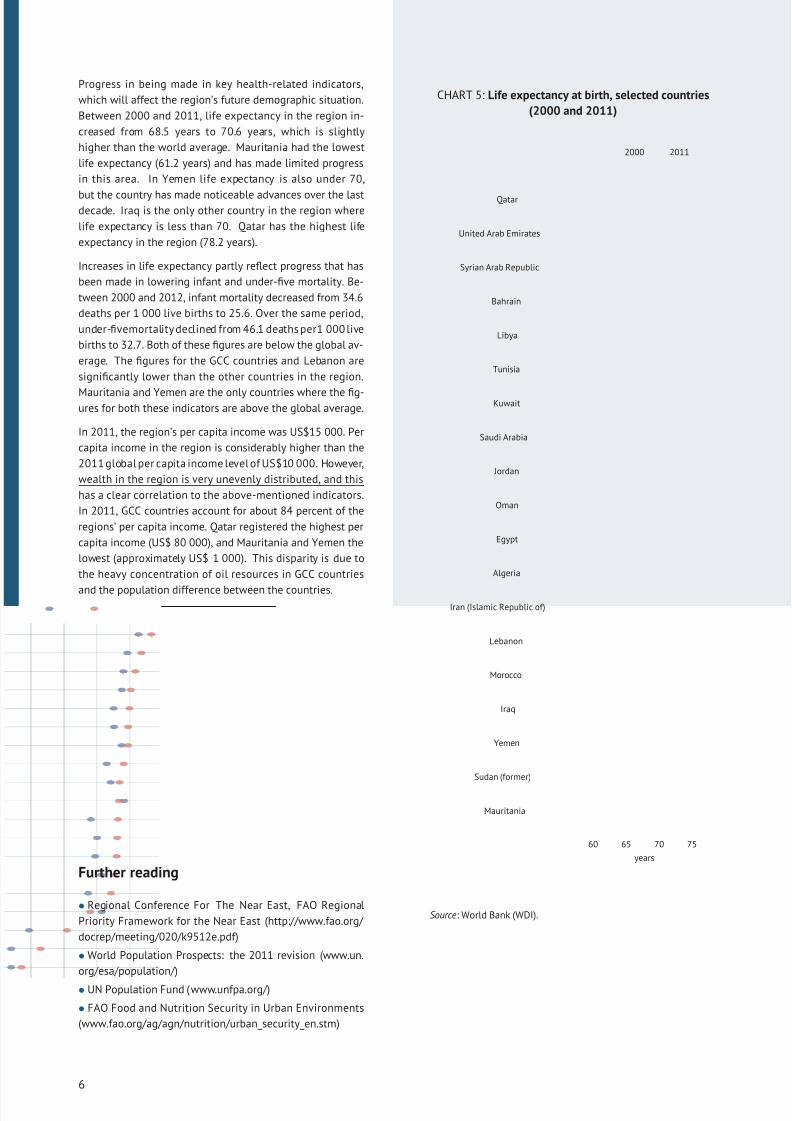
ForewordThe Near East and North Africa region includes 19 countries that share a common culturalheritage but are very distinct from one another in their levels of development, their resourceendowments and their potential for food and agricultural production. There are extremesof wealth and poverty among these countries. However, they are all addressing a commonset of problems and challenges that could threaten their development prospects.
One of the primary challenges facing the region is overcoming hunger, food insecurity andmalnutrition. Currently, there are 43.7 million undernourished people in the Near East andNorth Africa. Most of these people live in rural areas and rely on agriculture for their liveli-hoods. A wide range of interconnected issues challenge the region, including dwindlingwater and land resources, the gap between food needs and food production, increasing dif-
ficulties in balancing employment and income generation as populations expand, declininginvestment in the rural sector, increasing threats from environmental strain, natural andhuman-induced disasters, as well as the impacts of climate change.
Meeting these challenges with evidence-based policymaking will require timely statisticalinformation from a wide range of fields. As a contribution to this effort, the Food and Agri-culture Organization of the United Nations has prepared this Regional Yearbook for the NearEast and North Africa. The Yearbook presents a visual synthesis of the major trends and fac-tors shaping the regional food and agricultural landscape and their interplay with broaderenvironmental, social and economic dimensions. In doing so, it serves as a reference doc-ument on regional food and agriculture for policymakers, donor agencies, researchers andanalysts, and the general public.
Reliable data and information are fundamental prerequisites for rigorous analysis and hencesound strategy for development and equitable distribution of income to the various sectorsof the economy according to national priorities. For this reason it is crucial that statisticsand information be collected, compiled, analyzed and disseminated using the best method-ologies, concepts and classifications at national, subnational, regional and global levels.
FAO’s preparation of regional and global Yearbooks is part of a much broader effort by theorganization and its national and international partners to improve the quality of statisti-cal data related to food insecurity, agriculture and the sustainable management of naturalresources. At the 31st session of the FAO Regional Conference for the Near East in 2012,the organization unveiled its plans for the development of a regional strategy to improveagricultural statistics. The regional strategy – which is being developed by regional stake-holders and countries – is an integral part of the Global Strategy to Improve Agricultural andRural Statistics, a long-term project promoted by FAO and international partners. The GlobalStrategy is built on three major pillars: producing a minimum set of core data and determin-ing national priorities, integrating agricultural statistics into national statistical systems,and fostering the sustainability of agricultural statistics through governance and statisticalcapacity development.
This 2014 edition of the Near East and North Africa Statistical Yearbook of food and agri-
culture contains a breadth of data and topics related to food security and agriculture. FAOremains committed to working with partners and Member States in the Near East and NorthAfrica to improve agricultural and rural statistics and facilitate the process of transformingthis information into policies that will strengthen food security in the region and ensuremore sustainable food production.
Abdessalam Ould Ahmed Pietro GennariAssistant Director-General FAO Chief Statistician,
and Regional Representative and Director,for the Near East and Nor th Africa Statistics Division
iii

8/12/2019 FAO Statistical Yearbook 2014 Near East and North Africa Food and Agriculture
http://slidepdf.com/reader/full/fao-statistical-yearbook-2014-near-east-and-north-africa-food-and-agriculture 6/174iv
8/12/2019 FAO Statistical Yearbook 2014 Near East and North Africa Food and Agriculture
http://slidepdf.com/reader/full/fao-statistical-yearbook-2014-near-east-and-north-africa-food-and-agriculture 7/174
AcknowledgementsThis publication was prepared by the Statistics Division (ESS) and the Near East and NorthAfrica Office (RNENA) of the Food and Agriculture Organization of the United Nations. Thework was carried under the guidance of Pietro Gennari (Chief Statistician, FAO, and Director,ESS) and Abdessalam Ould Ahmed (Regional Representative and Assistant Director General,RNENA). Production was managed by Amy Heyman (ESS) and Mohamed Barre (RNENA), andthe work was carried out by Filippo Gheri (ESS) andShira Fano (ESS). Hadi Fathallah (RNENA)was a principal contributor. Contributors include Nienke Beintema (the International FoodPolicy Research Institute – IFPRI), Riccardo Biancalani (NRC), Andrea Borlizzi (ESS), ChiaraBrunelli (ESS), Carlo Cafiero (ESS), Cinzia Cerri (ESS), Rocio Condor-Golec (Climate, Energyand Tenure Division – NRC), Piero Conforti (ESS), Elisenda Estruch (Gender, Equity and Rural
Employment Division – ESW), Alessandro Ferrara (NRC), Karen Frenken (Land and Water Di-vision – NRL), Nandini Gunewardena (FAOLOW) , Gary Jones (International Monetary Fund –IMF), Arvydas Lebedys (Forest Economics, Policy and Products Division – FOE) , Erdgin Mane(ESS), Robert Mayo (ESS), Verena Nowak (Nutrition Division – ESN), Michael Rahija (IFPRI),Simone Rossi (NRC), Mirella Salvatore (NRC), Nadia Scialabba (NRC), Gert-Jan Stads (IFPRI),Nathalie Troubat (ESS), Sachiko Tsuji (Statistics and Information Service – FIPS), FrancescoTubiello (NRC), Stefania Vannuccini (FIPS),NathanWanner (ESS) and Firas Yassin (ESS). A spe-cial thanks goes to Andrea Alcibiade (ESS), Guido Barbaglia (ESS), Giorgia DeSantis (ESS), James Edge (ESS), Carola Fabi (ESS), Amanda Gordon (ESS), Nicola Graziani (ESS), Fabio Grita(ESS), Francesca Loiacono, Michelle Kendrick (ESA), Adam Prakash (ESS), Gordon Ramsay,Nicholas Sakoff (ESS), Nicola Selleri (ESS), Sylvaine Thomas (ESS), and Boris Veytsman.
v

8/12/2019 FAO Statistical Yearbook 2014 Near East and North Africa Food and Agriculture
http://slidepdf.com/reader/full/fao-statistical-yearbook-2014-near-east-and-north-africa-food-and-agriculture 8/174vi
8/12/2019 FAO Statistical Yearbook 2014 Near East and North Africa Food and Agriculture
http://slidepdf.com/reader/full/fao-statistical-yearbook-2014-near-east-and-north-africa-food-and-agriculture 9/174
How to use this book
The structure
The FAO Statistical Yearbook products build on the process that began with the 2012
edition. The book has been created from beginning to end with the statistical software
R and the typesetting language LATEX: from data retrieval, to data processing, indicator
construction, and blueprint-ready pdf file for distribution. This technique has circum-
vented the traditional route of manual production, involving costly software licences,
significant labour costs and inefficiencies associated with a lack of integration.
Using data from global statistical providers, including FAO, the publication presents
a visual synthesis of major trends and factors shaping the global food and agricul-
tural landscape, and their interplay with broader environmental, social and economic
dimensions. In doing so, it serves as a unique reference point of world food and agricul-
ture for policy-makers, donor agencies, researchers, analysts and the general public.
The book is divided into four thematic parts, in an attempt to present the full spectrum
of issues relevant to the subject matter:
Part 1 The setting measures the state of the agricultural resource base by assessing
the supply of land, labour, capital and inputs, and examining the pressure on the
world food system stemming from demographic and macroeconomic change.
Part 2 Hunger dimensions gauges the state of food insecurity and malnutrition, mea-
suring the multitude of dimensions that give rise to hunger and shape under-
nourishment.
Part 3 Feeding the world evaluates the past and present productive capacity of world
agriculture, together with the role of trade in meeting changing food, feed and
other demands.
Part 4 Sustainability dimensions examines the sustainability of agriculture in the con-
text of the pressureit exertson theenvironment, including theinteraction of agri-
culture with climate change, and how it can provide ecosystem services through
the bio-based economy.
Several page spreads are used to present each thematic issue. Each spread contains
visualizations of the data in maps and charts, along with text providing background to
the salient issues and an assessment of current trends. Tables are provided at the end
of each part. A list of indicators used throughout the book and a section on concepts
and methods can be found in Part 5.
vii
8/12/2019 FAO Statistical Yearbook 2014 Near East and North Africa Food and Agriculture
http://slidepdf.com/reader/full/fao-statistical-yearbook-2014-near-east-and-north-africa-food-and-agriculture 10/174
Country definitions and classification
The publication follows the FAO Regional Office for the Near East and North Africa
composition (see “Table: Country list” or http://neareast.fao.org/).
Aggregations
Two types of aggregations are used in the book: sum and weighted mean. Two restric-
tions are imposed when computing the aggregation: i) the sufficiency condition – the
aggregation is computed only when sufficient countries have reported data, and the
current threshold is set at 50 percent of the variable and the weighting variable, if
present; and ii) the comparability condition – as aggregations are usually computed
over time, this condition is designed to ensure that the number of countries is com-
parable over several years; under the current restriction the number of countries may
not vary by more than 15 over time.
Data presentation conventions
The cutoff date for the data is 30 September 2013.
• When country data have not been reported forthe reference year, an asterisk (*) on
the year label indicates that the value for the most recent year available is shown.
For example, 2008–2010* means that the most recent value for the period from
2008 to 2010 is shown. When a growth rate is computed, the specified interval
always refers to available data.
• A billion is 1 000 million.
• A trillion is 1 000 billion.
• A blank means that data are not available or that aggregates cannot be calculated
because of missing data for the years shown.
• In tables, 0 or 0.0 means zero or a number that is small enough to round to zero
at the displayed number of decimal places.
• A ~ in the maps refers to the range specified in the class intervals.
viii
8/12/2019 FAO Statistical Yearbook 2014 Near East and North Africa Food and Agriculture
http://slidepdf.com/reader/full/fao-statistical-yearbook-2014-near-east-and-north-africa-food-and-agriculture 11/174
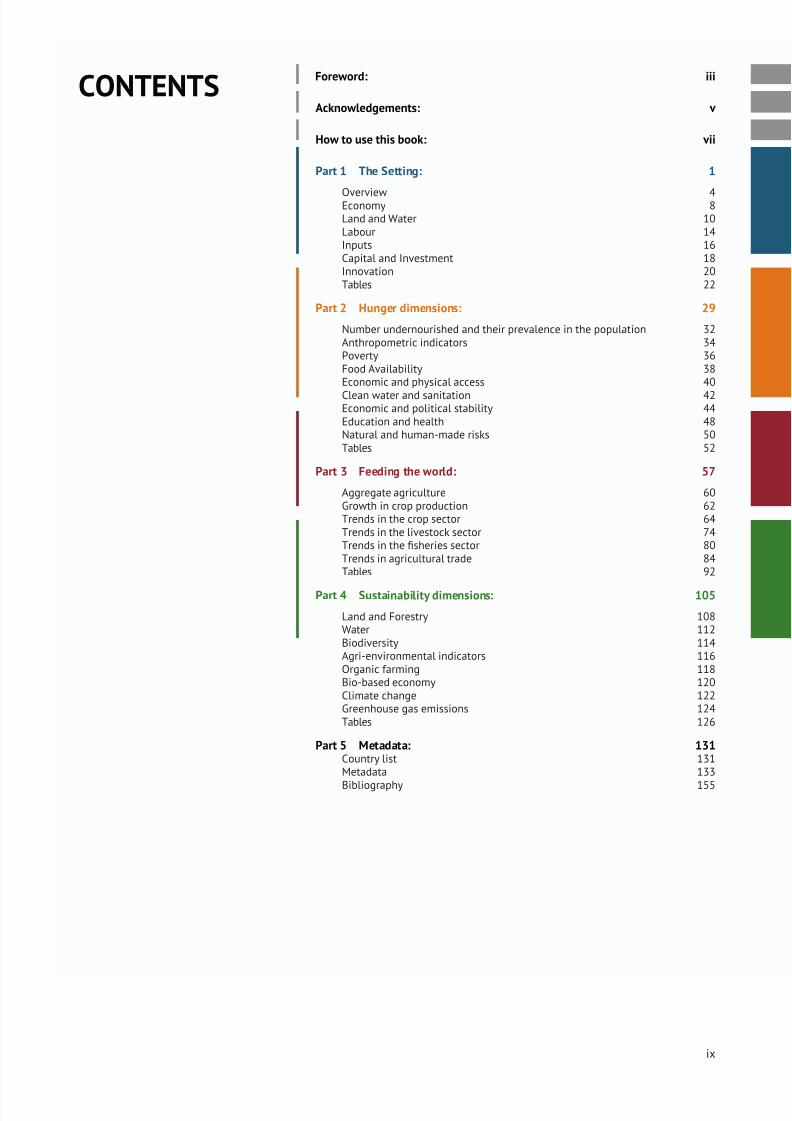
CONTENTS Foreword: iii
Acknowledgements: v
How to use this book: vii
Part 1 The Setting: 1
Overview 4Economy 8Land and Water 10Labour 14Inputs 16Capital and Investment 18Innovation 20Tables 22
Part 2 Hunger dimensions: 29
Number undernourished and their prevalence in the population 32Anthropometric indicators 34Poverty 36Food Availability 38Economic and physical access 40
Clean water and sanitation 42Economic and political stability 44Education and health 48Natural and human-made risks 50Tables 52
Part 3 Feeding the world: 57
Aggregate agriculture 60Growth in crop production 62Trends in the crop sector 64Trends in the livestock sector 74Trends in the fisheries sector 80Trends in agricultural trade 84Tables 92
Part 4 Sustainability dimensions: 105
Land and Forestry 108Water 112Biodiversity 114Agri-environmental indicators 116Organic farming 118Bio-based economy 120Climate change 122Greenhouse gas emissions 124Tables 126
Part 5 Metadata: 131Country list 131Metadata 133
Bibliography 155
ix
8/12/2019 FAO Statistical Yearbook 2014 Near East and North Africa Food and Agriculture
http://slidepdf.com/reader/full/fao-statistical-yearbook-2014-near-east-and-north-africa-food-and-agriculture 12/174
List of Charts
1 Near East and North Africa rural and urban population (1960-2050) . . . . . . . . . . . . . . . . . . . . . . . . . . . . . . . . 42 Rural and urban population, share of total population (2011) . . . . . . . . . . . . . . . . . . . . . . . . . . . . . . . . . . . . . 43 Agricultural population, share of total population (1990 and 2012) . . . . . . . . . . . . . . . . . . . . . . . . . . . . . . . . . 54 Population ages 0-14, 15-64 and 65+, share of total (2010) . . . . . . . . . . . . . . . . . . . . . . . . . . . . . . . . . . . . . . 55 Life expectancy at birth, selected countries (2000 and 2011) . . . . . . . . . . . . . . . . . . . . . . . . . . . . . . . . . . . . . 66 Value added in agriculture, industry, and services as shares of GDP (2008) . . . . . . . . . . . . . . . . . . . . . . . . . . . . . 87 Near East and North Africa trade, FDI, and ODA as shares of GDP (2000-2010) . . . . . . . . . . . . . . . . . . . . . . . . . . 88 Arable land per capita (2000 and 2011) . . . . . . . . . . . . . . . . . . . . . . . . . . . . . . . . . . . . . . . . . . . . . . . . . . 109 Land area (2011) . . . . . . . . . . . . . . . . . . . . . . . . . . . . . . . . . . . . . . . . . . . . . . . . . . . . . . . . . . . . . . . . 1110 Agricultural area (2011) . . . . . . . . . . . . . . . . . . . . . . . . . . . . . . . . . . . . . . . . . . . . . . . . . . . . . . . . . . . . 1111 Irrigation potential, selected countries (2012) . . . . . . . . . . . . . . . . . . . . . . . . . . . . . . . . . . . . . . . . . . . . . . 1212 Total equipped area (2009) . . . . . . . . . . . . . . . . . . . . . . . . . . . . . . . . . . . . . . . . . . . . . . . . . . . . . . . . . . 1213 Female employment in agriculture, share of female employment, selected countries (2005-2010*) . . . . . . . . . . . . . 1414 Labor force participation rate by gender, ages 15+ (2011) . . . . . . . . . . . . . . . . . . . . . . . . . . . . . . . . . . . . . . . 1415 Near East and North Africa fertilizer consumption per ha of arable area and permanent crops (2002-2011) . . . . . . . . 1616 Fertilizer consumption per ha of arable area and permanent crops (2011) . . . . . . . . . . . . . . . . . . . . . . . . . . . . . 1617 Credit to agriculture, share of added value in agriculture, selected countries (2005-2010) . . . . . . . . . . . . . . . . . . . 1818 ODA received in agriculture, total share of ODA (2002 and 2010) . . . . . . . . . . . . . . . . . . . . . . . . . . . . . . . . . . 1819 Share of components in capital stock (2007) . . . . . . . . . . . . . . . . . . . . . . . . . . . . . . . . . . . . . . . . . . . . . . . 1920 Government expenditures in agriculture, forestry, fishing, and hunting, selected countries (2010) . . . . . . . . . . . . . . 1921 Total public agricultural research expenditure, share of agricultural GDP, selected countries (2008) . . . . . . . . . . . . . 2022 Mobile cellular, broadband internet, and telephone lines subscribers (2012) . . . . . . . . . . . . . . . . . . . . . . . . . . . 2023 Undernourishment in the developing world (1990-1992 to 2011-2013) . . . . . . . . . . . . . . . . . . . . . . . . . . . . . . 3224 Number of people undernourished (1990-1992 and 2011-2013) . . . . . . . . . . . . . . . . . . . . . . . . . . . . . . . . . . . 32
25 Percentage of children under 5 years of age who are stunted (2005-2011*) . . . . . . . . . . . . . . . . . . . . . . . . . . . . 3426 Percentage of children under 5 years of age who underweight (2005-2011*) . . . . . . . . . . . . . . . . . . . . . . . . . . . 3427 People in the world living on less than 2005 PPP $1.25 and $2 a day (1981-2005) . . . . . . . . . . . . . . . . . . . . . . . 3628 Gini coefficient for Near East countries (1995-2000 and 2007-2010) . . . . . . . . . . . . . . . . . . . . . . . . . . . . . . . . 3629 Average dietary supply adequacy (1990-1992 and 2011-2013) . . . . . . . . . . . . . . . . . . . . . . . . . . . . . . . . . . . . 3830 Trend of the value of food production (1992-2011) . . . . . . . . . . . . . . . . . . . . . . . . . . . . . . . . . . . . . . . . . . . 3831 Share of energy supply derived from cereals, roots and tubers (1990-1992 and 2008-2010) . . . . . . . . . . . . . . . . . . 3932 Relative change in average protein supply (between 1990-1992 and 2008-2010) . . . . . . . . . . . . . . . . . . . . . . . . 3933 Relative change in average protein supply from animal origin (between 1990-1992 and 2008-2010) . . . . . . . . . . . . 3934 Relative change in average fat supply (between 1990-1992 and 2008-2010) . . . . . . . . . . . . . . . . . . . . . . . . . . . 3935 Rail-lines density (2011) . . . . . . . . . . . . . . . . . . . . . . . . . . . . . . . . . . . . . . . . . . . . . . . . . . . . . . . . . . . 4036 Relative price of food (2000-2010) . . . . . . . . . . . . . . . . . . . . . . . . . . . . . . . . . . . . . . . . . . . . . . . . . . . . . 4037 Percentage of population without reasonable access to improved water sources (1992 and 2011) . . . . . . . . . . . . . . 4238 Percentage of population without reasonable access to improved sanitation facilities (1992 and 2011) . . . . . . . . . . . 4239 Value of food imports over total merchandise exports (1992 and 2010) . . . . . . . . . . . . . . . . . . . . . . . . . . . . . . 44
40 Cereal import dependency ratio (1992 and 2009) . . . . . . . . . . . . . . . . . . . . . . . . . . . . . . . . . . . . . . . . . . . . 4441 Domestic food price volatility (1995-2013) . . . . . . . . . . . . . . . . . . . . . . . . . . . . . . . . . . . . . . . . . . . . . . . . 4542 Per capita food production variability (1990-2011) . . . . . . . . . . . . . . . . . . . . . . . . . . . . . . . . . . . . . . . . . . . 4543 Domestic food price volatility (2000 and 2013) . . . . . . . . . . . . . . . . . . . . . . . . . . . . . . . . . . . . . . . . . . . . . 4644 Domestic food price volatility (2000 and 2013) . . . . . . . . . . . . . . . . . . . . . . . . . . . . . . . . . . . . . . . . . . . . . 4645 Per capita food supply variability (1995-2010) . . . . . . . . . . . . . . . . . . . . . . . . . . . . . . . . . . . . . . . . . . . . . . 4746 Girls’ and boys’ enrolment in primary education (2011) . . . . . . . . . . . . . . . . . . . . . . . . . . . . . . . . . . . . . . . . . 4847 Total health expenditure, share of GDP (1995-2011) . . . . . . . . . . . . . . . . . . . . . . . . . . . . . . . . . . . . . . . . . . 4848 Droughts, floods, extreme temperatures - share of population affected (2009) . . . . . . . . . . . . . . . . . . . . . . . . . . 5049 Refugees in Near East and North Africa region (2000-2011) . . . . . . . . . . . . . . . . . . . . . . . . . . . . . . . . . . . . . . 5050 Food supply in crops primary equivalent (2000-2009) . . . . . . . . . . . . . . . . . . . . . . . . . . . . . . . . . . . . . . . . . 6051 Near East and North Africa protein and fat supply in crops primary equivalent (2000-2009) . . . . . . . . . . . . . . . . . . 6052 Protein supply in crops primary equivalent (2009) . . . . . . . . . . . . . . . . . . . . . . . . . . . . . . . . . . . . . . . . . . . . 6153 Fat supply in crops primary equivalent (2009) . . . . . . . . . . . . . . . . . . . . . . . . . . . . . . . . . . . . . . . . . . . . . . 6154 Crops, gross per capita production index number (2004-2006 = 100) (2000-2011) . . . . . . . . . . . . . . . . . . . . . . . . 62
55 Growth in cereal production (2012) . . . . . . . . . . . . . . . . . . . . . . . . . . . . . . . . . . . . . . . . . . . . . . . . . . . . . 6256 Per capita cereal production (2000-2011) . . . . . . . . . . . . . . . . . . . . . . . . . . . . . . . . . . . . . . . . . . . . . . . . . 6457 Per capita coarse grain production (2000-2011) . . . . . . . . . . . . . . . . . . . . . . . . . . . . . . . . . . . . . . . . . . . . . 6458 Per capita rice production, selected countries (2011) . . . . . . . . . . . . . . . . . . . . . . . . . . . . . . . . . . . . . . . . . . 6659 Per capita wheat production (2000-2011) . . . . . . . . . . . . . . . . . . . . . . . . . . . . . . . . . . . . . . . . . . . . . . . . . 66
x
8/12/2019 FAO Statistical Yearbook 2014 Near East and North Africa Food and Agriculture
http://slidepdf.com/reader/full/fao-statistical-yearbook-2014-near-east-and-north-africa-food-and-agriculture 13/174
LIST OF CHARTS
60 Per capita oil crop production (2000-2011) . . . . . . . . . . . . . . . . . . . . . . . . . . . . . . . . . . . . . . . . . . . . . . . . 6861 Per capita pulse production (2000-2011) . . . . . . . . . . . . . . . . . . . . . . . . . . . . . . . . . . . . . . . . . . . . . . . . . 6862 Per capita root and tuber production (2000-2011) . . . . . . . . . . . . . . . . . . . . . . . . . . . . . . . . . . . . . . . . . . . . 7063 Per capita citrus fruit production (2000-2011) . . . . . . . . . . . . . . . . . . . . . . . . . . . . . . . . . . . . . . . . . . . . . . 7064 Per capita fruit production, excluding melons (2000-2011) . . . . . . . . . . . . . . . . . . . . . . . . . . . . . . . . . . . . . . 7265 Per capita vegetable production, including melons (2000-2011) . . . . . . . . . . . . . . . . . . . . . . . . . . . . . . . . . . . 7266 Near East and North Africa stocks of cattle and buffaloes, and sheep and goats (2000-2011) . . . . . . . . . . . . . . . . . 7467 Stock of poultry birds (2000-2011) . . . . . . . . . . . . . . . . . . . . . . . . . . . . . . . . . . . . . . . . . . . . . . . . . . . . . 7468 Stocks of cattle and buffaloes, and sheep and goats (2011) . . . . . . . . . . . . . . . . . . . . . . . . . . . . . . . . . . . . . . 7569 Stock of poultry birds (2011) . . . . . . . . . . . . . . . . . . . . . . . . . . . . . . . . . . . . . . . . . . . . . . . . . . . . . . . . . 7570 Near East and North Africa meat production (2000-2011) . . . . . . . . . . . . . . . . . . . . . . . . . . . . . . . . . . . . . . . 7671 Meat production by type (2010) . . . . . . . . . . . . . . . . . . . . . . . . . . . . . . . . . . . . . . . . . . . . . . . . . . . . . . . 7672 Near East and North Africa per capita meat production (2000-2010) . . . . . . . . . . . . . . . . . . . . . . . . . . . . . . . . 7773 Per capita total meat production (2010) . . . . . . . . . . . . . . . . . . . . . . . . . . . . . . . . . . . . . . . . . . . . . . . . . . 7774 Egg production (2000-2011) . . . . . . . . . . . . . . . . . . . . . . . . . . . . . . . . . . . . . . . . . . . . . . . . . . . . . . . . . 7875 Cheese production (2000-2011) . . . . . . . . . . . . . . . . . . . . . . . . . . . . . . . . . . . . . . . . . . . . . . . . . . . . . . . 7876 Capture fish production, per capita (2000-2011) . . . . . . . . . . . . . . . . . . . . . . . . . . . . . . . . . . . . . . . . . . . . . 8077 Aquaculture fish production, per capita (2000-2011) . . . . . . . . . . . . . . . . . . . . . . . . . . . . . . . . . . . . . . . . . . 8078 State of the world’s fishery stocks (1974-2010) . . . . . . . . . . . . . . . . . . . . . . . . . . . . . . . . . . . . . . . . . . . . . . 8279 World composition of fish products (2010) . . . . . . . . . . . . . . . . . . . . . . . . . . . . . . . . . . . . . . . . . . . . . . . . 8280 Per capita world fish food supply (1990-2011) . . . . . . . . . . . . . . . . . . . . . . . . . . . . . . . . . . . . . . . . . . . . . . 8381 Sugar and honey net trade (2000-2011) . . . . . . . . . . . . . . . . . . . . . . . . . . . . . . . . . . . . . . . . . . . . . . . . . . 8482 Sugar and honey net trade (2010) . . . . . . . . . . . . . . . . . . . . . . . . . . . . . . . . . . . . . . . . . . . . . . . . . . . . . . 84
83 Near East and North Africa composition of global exports (2000-2011) . . . . . . . . . . . . . . . . . . . . . . . . . . . . . . 8584 Cereal net trade (2000-2011) . . . . . . . . . . . . . . . . . . . . . . . . . . . . . . . . . . . . . . . . . . . . . . . . . . . . . . . . . 8685 Cereal net trade (2010) . . . . . . . . . . . . . . . . . . . . . . . . . . . . . . . . . . . . . . . . . . . . . . . . . . . . . . . . . . . . 8686 Major export flows of oranges from Near East and North African countries (US$, 2011) . . . . . . . . . . . . . . . . . . . . . 8787 Fruit and vegetables net trade (2000-2011) . . . . . . . . . . . . . . . . . . . . . . . . . . . . . . . . . . . . . . . . . . . . . . . . 8888 Fruit and vegetables net trade (2010) . . . . . . . . . . . . . . . . . . . . . . . . . . . . . . . . . . . . . . . . . . . . . . . . . . . 8889 Major export flows of sugar refined from Near East and North African countries (US$, 2011) . . . . . . . . . . . . . . . . . 8990 Animal fats, oilseeds and veg. oils net trade (2000-2011) . . . . . . . . . . . . . . . . . . . . . . . . . . . . . . . . . . . . . . . 9091 Animal fats, oilseeds and veg. oils net trade (2010) . . . . . . . . . . . . . . . . . . . . . . . . . . . . . . . . . . . . . . . . . . . 9092 Annual growth rate in forest area (1990-2011) . . . . . . . . . . . . . . . . . . . . . . . . . . . . . . . . . . . . . . . . . . . . . . 10893 Forest characteristics (2010) . . . . . . . . . . . . . . . . . . . . . . . . . . . . . . . . . . . . . . . . . . . . . . . . . . . . . . . . . 10894 Near East and North Africa production of selected forest products (1970-2012) . . . . . . . . . . . . . . . . . . . . . . . . . 11095 Near East and North Africa production of selected forest products (1970-2012) . . . . . . . . . . . . . . . . . . . . . . . . . 11096 Exports of forest products (2000 and 2012) . . . . . . . . . . . . . . . . . . . . . . . . . . . . . . . . . . . . . . . . . . . . . . . . 11197 Imports of forest products (2000 and 2012) . . . . . . . . . . . . . . . . . . . . . . . . . . . . . . . . . . . . . . . . . . . . . . . . 111
98 Freshwater withdrawal by agricultural sector, shares of total (2000-2010*) . . . . . . . . . . . . . . . . . . . . . . . . . . . . 11299 Freshwater withdrawal by industrial sector, shares of total (2000-2010*) . . . . . . . . . . . . . . . . . . . . . . . . . . . . . 112100 Species threatened in Near East and North Africa (2012) . . . . . . . . . . . . . . . . . . . . . . . . . . . . . . . . . . . . . . . 114101 Terrestrial protected areas, share of total land area (1990 and 2010) . . . . . . . . . . . . . . . . . . . . . . . . . . . . . . . . 114102 Livestock density per ha of agricultural land, cattle and buffaloes, sheep and goats (2011) . . . . . . . . . . . . . . . . . . 116103 Agricultural land, share of total land area (1995 and 2010) . . . . . . . . . . . . . . . . . . . . . . . . . . . . . . . . . . . . . . 116104 Organic water pollutant (BOD) emissions (2005) . . . . . . . . . . . . . . . . . . . . . . . . . . . . . . . . . . . . . . . . . . . . . 117105 Organic water pollutant (BOD) emissions per worker (2005) . . . . . . . . . . . . . . . . . . . . . . . . . . . . . . . . . . . . . 117106 Organic agriculture area (2011) . . . . . . . . . . . . . . . . . . . . . . . . . . . . . . . . . . . . . . . . . . . . . . . . . . . . . . . 118107 Organic agriculture, share of total agricultural area (2011) . . . . . . . . . . . . . . . . . . . . . . . . . . . . . . . . . . . . . . 118108 World area under bioenergy crops (2005-2010) . . . . . . . . . . . . . . . . . . . . . . . . . . . . . . . . . . . . . . . . . . . . . 120109 Biofuel production (1990-2009) . . . . . . . . . . . . . . . . . . . . . . . . . . . . . . . . . . . . . . . . . . . . . . . . . . . . . . . 120110 Share of food crop usage in world bio-based economy (2009) . . . . . . . . . . . . . . . . . . . . . . . . . . . . . . . . . . . . 121111 Global land-ocean temperature index, base period 1951-1980 (1880-2012) . . . . . . . . . . . . . . . . . . . . . . . . . . . . 122112 Global land-ocean temperature index for three latitude bands, base period 1951-1981 (1880-2011) . . . . . . . . . . . . 122
113 Net emissions/removals from net forest conversions (1990, 2000 and 2010) . . . . . . . . . . . . . . . . . . . . . . . . . . . 124114 Agricultural greenhouse gas emissions (1990-2010) . . . . . . . . . . . . . . . . . . . . . . . . . . . . . . . . . . . . . . . . . . 124115 Near East and North Africa agricultural greenhouse gas emissions by sector (2010) . . . . . . . . . . . . . . . . . . . . . . . 125
xi
8/12/2019 FAO Statistical Yearbook 2014 Near East and North Africa Food and Agriculture
http://slidepdf.com/reader/full/fao-statistical-yearbook-2014-near-east-and-north-africa-food-and-agriculture 14/174
List of Maps
1 Population annual growth (percent, 2000-2012) . . . . . . . . . . . . . . . . . . . . . . . . . . . . . . . . . . . . . . . . . . . . . 52 GNI per capita (current US$, 2010-2011*) . . . . . . . . . . . . . . . . . . . . . . . . . . . . . . . . . . . . . . . . . . . . . . . . . 73 Under-5 mortality rate (per 1000 live births, 2010-2011*) . . . . . . . . . . . . . . . . . . . . . . . . . . . . . . . . . . . . . . . 74 Agriculture, value added per worker annual growth (percent, 2000-2010) . . . . . . . . . . . . . . . . . . . . . . . . . . . . . 95 Agriculture, value added as share of GDP (percent, 2008-2012*) . . . . . . . . . . . . . . . . . . . . . . . . . . . . . . . . . . . 96 Cropland per capita (ha/cap, 2011) . . . . . . . . . . . . . . . . . . . . . . . . . . . . . . . . . . . . . . . . . . . . . . . . . . . . . 117 Share of equipped area actually irrigated (percent, 2000-2012*) . . . . . . . . . . . . . . . . . . . . . . . . . . . . . . . . . . . 138 Water resources per capita (m3 /yr/cap, 2010) . . . . . . . . . . . . . . . . . . . . . . . . . . . . . . . . . . . . . . . . . . . . . . . 139 Employment in agriculture, share of total employment (percent, 2005-2010*) . . . . . . . . . . . . . . . . . . . . . . . . . . 1510 Children in employment, share or children ages 7-14 (percent, 2000-2011*) . . . . . . . . . . . . . . . . . . . . . . . . . . . 1511 Nitrogen and phosphate fertilizers consumption per ha of arable area and permanent crops (kg/ha, 2011) . . . . . . . . . 1712 Agricultural tractors, total (tractors, 2000-2010*) . . . . . . . . . . . . . . . . . . . . . . . . . . . . . . . . . . . . . . . . . . . . 1713 FDI (inward flows) to agriculture (million US$, 2010-2011*) . . . . . . . . . . . . . . . . . . . . . . . . . . . . . . . . . . . . . . 1914 Access to mobile cellular phone subscriptions annual growth (percent, 2000-2012) . . . . . . . . . . . . . . . . . . . . . . . 2115 Total public agricultural research expenditure, share of agricultural GDP (percent, 2006-2010*) . . . . . . . . . . . . . . . 2116 Map of hunger (percent, prevalence of undernourishment 2011-2013) . . . . . . . . . . . . . . . . . . . . . . . . . . . . . . . 3317 Prevalence of food inadequacy (percent, 2011-2013) . . . . . . . . . . . . . . . . . . . . . . . . . . . . . . . . . . . . . . . . . . 3318 Percentage of children under 5 years of age who are stunted (percent, 2005-2011*) . . . . . . . . . . . . . . . . . . . . . . 3519 Percentage of children under 5 years of age who are underweight (percent, 2005-2011*) . . . . . . . . . . . . . . . . . . . 3520 Poverty gap at national poverty line (percent, 2005-2012*) . . . . . . . . . . . . . . . . . . . . . . . . . . . . . . . . . . . . . . 3721 Poverty headcount ratio at national poverty line, share of population (percent, 2005-2011*) . . . . . . . . . . . . . . . . . 3722 Road density (km per 100 square km of land area, 2005-2010*) . . . . . . . . . . . . . . . . . . . . . . . . . . . . . . . . . . . 4123 Percent of paved roads over total roads (percent, 2005-2010*) . . . . . . . . . . . . . . . . . . . . . . . . . . . . . . . . . . . . 4124 Share of population without reasonable access to improved water sources (percent, 2011) . . . . . . . . . . . . . . . . . . 43
25 Share of population without reasonable access to improved sanitation facilities (percent, 2011) . . . . . . . . . . . . . . . 4326 Political stability and absence of violence/terrorism (index, 2009) . . . . . . . . . . . . . . . . . . . . . . . . . . . . . . . . . . 4727 Literacy rate, adult female - share of females ages 15 and above (percent, 2005-2010*) . . . . . . . . . . . . . . . . . . . . 4928 Primary completion rate, total (percent, 2005-2010*) . . . . . . . . . . . . . . . . . . . . . . . . . . . . . . . . . . . . . . . . . . 4929 Droughts, floods, extreme temperatures - share of population affected (average 1990-2009) (percent, 2009) . . . . . . . 5130 UNHCR total population of concern (thousand people, 2011) . . . . . . . . . . . . . . . . . . . . . . . . . . . . . . . . . . . . . 5131 Food supply in crops primary equivalent (kcal/cap/day, 2009) . . . . . . . . . . . . . . . . . . . . . . . . . . . . . . . . . . . . 6132 Crops, net per capita production index number (2004-2006 = 100) (index, 2011) . . . . . . . . . . . . . . . . . . . . . . . . . 6333 Food, net per capita production index number (2004-2006 = 100) (index, 2011) . . . . . . . . . . . . . . . . . . . . . . . . . 6334 Cereal producing countries (million tonnes, 2011) . . . . . . . . . . . . . . . . . . . . . . . . . . . . . . . . . . . . . . . . . . . . 6535 Coarse grain producing countries (million tonnes, 2011) . . . . . . . . . . . . . . . . . . . . . . . . . . . . . . . . . . . . . . . . 6536 Rice producing countries (million tonnes, 2011) . . . . . . . . . . . . . . . . . . . . . . . . . . . . . . . . . . . . . . . . . . . . . 6737 Wheat producing countries (million tonnes, 2011) . . . . . . . . . . . . . . . . . . . . . . . . . . . . . . . . . . . . . . . . . . . . 6738 Oil crop producing countries (million tonnes, 2011) . . . . . . . . . . . . . . . . . . . . . . . . . . . . . . . . . . . . . . . . . . . 6939 Pulse producing countries (million tonnes, 2011) . . . . . . . . . . . . . . . . . . . . . . . . . . . . . . . . . . . . . . . . . . . . 69
40 Root and tuber producing countries (million tonnes, 2011) . . . . . . . . . . . . . . . . . . . . . . . . . . . . . . . . . . . . . . 7141 Per capita citrus fruit production (tonne/cap, 2011) . . . . . . . . . . . . . . . . . . . . . . . . . . . . . . . . . . . . . . . . . . . 7142 Fruit producing countries, excluding melons (million tonnes, 2011) . . . . . . . . . . . . . . . . . . . . . . . . . . . . . . . . . 7343 Vegetable producing countries, including melons (million tonnes, 2011) . . . . . . . . . . . . . . . . . . . . . . . . . . . . . . 7344 Stock of cattle and buffaloes (million heads, 2011) . . . . . . . . . . . . . . . . . . . . . . . . . . . . . . . . . . . . . . . . . . . 7545 Meat producing countries (million tonnes, 2011) . . . . . . . . . . . . . . . . . . . . . . . . . . . . . . . . . . . . . . . . . . . . 7746 Milk production (million tonnes, 2011) . . . . . . . . . . . . . . . . . . . . . . . . . . . . . . . . . . . . . . . . . . . . . . . . . . . 7947 Butter and ghee production (million tonnes, 2011) . . . . . . . . . . . . . . . . . . . . . . . . . . . . . . . . . . . . . . . . . . . 7948 Capture fish producing countries (thousand tonnes, 2010-2011) . . . . . . . . . . . . . . . . . . . . . . . . . . . . . . . . . . . 8149 Aquaculture producing countries (thousand tonnes, 2010-2011) . . . . . . . . . . . . . . . . . . . . . . . . . . . . . . . . . . . 8150 Geo-location of harvests by capture and aquaculture (thousand tonnes, 2010) . . . . . . . . . . . . . . . . . . . . . . . . . . 8351 Import value index (index, 2010) . . . . . . . . . . . . . . . . . . . . . . . . . . . . . . . . . . . . . . . . . . . . . . . . . . . . . . 8552 Major export flows of cheese from whole cow milk from Near East and North African countries (US$, 2011) . . . . . . . . 9153 Global distribution of risks associated with main agricultural production systems . . . . . . . . . . . . . . . . . . . . . . . . 10954 Forest area as share of total land area (percent, 2011) . . . . . . . . . . . . . . . . . . . . . . . . . . . . . . . . . . . . . . . . . 109
55 Roundwood production (thousand m3, 2012) . . . . . . . . . . . . . . . . . . . . . . . . . . . . . . . . . . . . . . . . . . . . . . . 11156 Total water withdrawal per capita (m3 /yr/cap, 2000-2010*) . . . . . . . . . . . . . . . . . . . . . . . . . . . . . . . . . . . . . . 11357 Renewable freshwater resources withdrawn by agriculture (percent, 2000-2010*) . . . . . . . . . . . . . . . . . . . . . . . . 11358 Terrestrial protected areas, share of total land area (percent, 2010) . . . . . . . . . . . . . . . . . . . . . . . . . . . . . . . . . 11559 Marine protected areas, share of territorial waters (percent, 2010) . . . . . . . . . . . . . . . . . . . . . . . . . . . . . . . . . . 115
xii
8/12/2019 FAO Statistical Yearbook 2014 Near East and North Africa Food and Agriculture
http://slidepdf.com/reader/full/fao-statistical-yearbook-2014-near-east-and-north-africa-food-and-agriculture 15/174
LIST OF MAPS
60 Nitrogen fertilizer consumption per ha of arable area and permanent crops (kg/ha, 2009) . . . . . . . . . . . . . . . . . . . 11761 Organic agriculture area (ha, 2011) . . . . . . . . . . . . . . . . . . . . . . . . . . . . . . . . . . . . . . . . . . . . . . . . . . . . . 11962 Organic agriculture, share of total agricultural area (percent, 2011) . . . . . . . . . . . . . . . . . . . . . . . . . . . . . . . . . 11963 Biofuel production (kilotonne of oil equivalent, 2009) . . . . . . . . . . . . . . . . . . . . . . . . . . . . . . . . . . . . . . . . . 12164 Surface temperature, anomaly versus 1951-1980 (degrees Celsius, 2012) . . . . . . . . . . . . . . . . . . . . . . . . . . . . . 12365 Share of population living in areas with elevation of 5 meters or less (percent, 2000) . . . . . . . . . . . . . . . . . . . . . . 12366 Total agricultural greenhouse gas emissions (gigagrams CO2eq, 2010) . . . . . . . . . . . . . . . . . . . . . . . . . . . . . . . 125
xiii
8/12/2019 FAO Statistical Yearbook 2014 Near East and North Africa Food and Agriculture
http://slidepdf.com/reader/full/fao-statistical-yearbook-2014-near-east-and-north-africa-food-and-agriculture 16/174
List of Tables
1 Population and structure . . . . . . . . . . . . . . . . . . . . . . . . . . . . . . . . . . . . . . . . . . . . . . . . . . . . . . . . . . . 222 Demographic indicators . . . . . . . . . . . . . . . . . . . . . . . . . . . . . . . . . . . . . . . . . . . . . . . . . . . . . . . . . . . . 223 Economy . . . . . . . . . . . . . . . . . . . . . . . . . . . . . . . . . . . . . . . . . . . . . . . . . . . . . . . . . . . . . . . . . . . . . 234 Land . . . . . . . . . . . . . . . . . . . . . . . . . . . . . . . . . . . . . . . . . . . . . . . . . . . . . . . . . . . . . . . . . . . . . . . . 235 Water resources per capita and irrigation . . . . . . . . . . . . . . . . . . . . . . . . . . . . . . . . . . . . . . . . . . . . . . . . . 246 Labour . . . . . . . . . . . . . . . . . . . . . . . . . . . . . . . . . . . . . . . . . . . . . . . . . . . . . . . . . . . . . . . . . . . . . . . 247 Inputs . . . . . . . . . . . . . . . . . . . . . . . . . . . . . . . . . . . . . . . . . . . . . . . . . . . . . . . . . . . . . . . . . . . . . . . 258 Agricultural capital stock . . . . . . . . . . . . . . . . . . . . . . . . . . . . . . . . . . . . . . . . . . . . . . . . . . . . . . . . . . . 259 Foreign direct investment and official development assistance . . . . . . . . . . . . . . . . . . . . . . . . . . . . . . . . . . . . 2610 Government expenditures . . . . . . . . . . . . . . . . . . . . . . . . . . . . . . . . . . . . . . . . . . . . . . . . . . . . . . . . . . . 26
11 Innovation . . . . . . . . . . . . . . . . . . . . . . . . . . . . . . . . . . . . . . . . . . . . . . . . . . . . . . . . . . . . . . . . . . . . 2712 Outcomes: Inadequate access to food . . . . . . . . . . . . . . . . . . . . . . . . . . . . . . . . . . . . . . . . . . . . . . . . . . . 5213 Utilization . . . . . . . . . . . . . . . . . . . . . . . . . . . . . . . . . . . . . . . . . . . . . . . . . . . . . . . . . . . . . . . . . . . . 5214 Poverty . . . . . . . . . . . . . . . . . . . . . . . . . . . . . . . . . . . . . . . . . . . . . . . . . . . . . . . . . . . . . . . . . . . . . . 5315 Determinants: Availability . . . . . . . . . . . . . . . . . . . . . . . . . . . . . . . . . . . . . . . . . . . . . . . . . . . . . . . . . . 5316 Determinants: Physical and economic access . . . . . . . . . . . . . . . . . . . . . . . . . . . . . . . . . . . . . . . . . . . . . . . 5417 Vulnerability/Stability . . . . . . . . . . . . . . . . . . . . . . . . . . . . . . . . . . . . . . . . . . . . . . . . . . . . . . . . . . . . . 5418 Health and education . . . . . . . . . . . . . . . . . . . . . . . . . . . . . . . . . . . . . . . . . . . . . . . . . . . . . . . . . . . . . 5519 Population at risk . . . . . . . . . . . . . . . . . . . . . . . . . . . . . . . . . . . . . . . . . . . . . . . . . . . . . . . . . . . . . . . . 5520 Cereal producers and their productivity . . . . . . . . . . . . . . . . . . . . . . . . . . . . . . . . . . . . . . . . . . . . . . . . . . 9221 Coarse grain producers and their productivity . . . . . . . . . . . . . . . . . . . . . . . . . . . . . . . . . . . . . . . . . . . . . . 9222 Rice producers and their productivity . . . . . . . . . . . . . . . . . . . . . . . . . . . . . . . . . . . . . . . . . . . . . . . . . . . . 9323 Wheat producers and their productivity . . . . . . . . . . . . . . . . . . . . . . . . . . . . . . . . . . . . . . . . . . . . . . . . . . 9324 Oilcrop producers and their productivity . . . . . . . . . . . . . . . . . . . . . . . . . . . . . . . . . . . . . . . . . . . . . . . . . . 9425 Pulse producers and their productivity . . . . . . . . . . . . . . . . . . . . . . . . . . . . . . . . . . . . . . . . . . . . . . . . . . . 94
26 Root and tuber producers and their productivity . . . . . . . . . . . . . . . . . . . . . . . . . . . . . . . . . . . . . . . . . . . . . 9527 Vegetable producers and their productivity . . . . . . . . . . . . . . . . . . . . . . . . . . . . . . . . . . . . . . . . . . . . . . . . 9528 Sugar producers and their productivity . . . . . . . . . . . . . . . . . . . . . . . . . . . . . . . . . . . . . . . . . . . . . . . . . . . 9629 Treenut producers and their productivity . . . . . . . . . . . . . . . . . . . . . . . . . . . . . . . . . . . . . . . . . . . . . . . . . 9630 Fruit producers and their productivity . . . . . . . . . . . . . . . . . . . . . . . . . . . . . . . . . . . . . . . . . . . . . . . . . . . 9731 Citrus fruit producers and their productivity . . . . . . . . . . . . . . . . . . . . . . . . . . . . . . . . . . . . . . . . . . . . . . . 9732 Fibre crop producers and their productivity . . . . . . . . . . . . . . . . . . . . . . . . . . . . . . . . . . . . . . . . . . . . . . . . 9833 Jute and jute-like producers and their productivity . . . . . . . . . . . . . . . . . . . . . . . . . . . . . . . . . . . . . . . . . . . 9834 Meat producers . . . . . . . . . . . . . . . . . . . . . . . . . . . . . . . . . . . . . . . . . . . . . . . . . . . . . . . . . . . . . . . . . 9935 Eggs, milk, and processed milk . . . . . . . . . . . . . . . . . . . . . . . . . . . . . . . . . . . . . . . . . . . . . . . . . . . . . . . . 9936 Fish production . . . . . . . . . . . . . . . . . . . . . . . . . . . . . . . . . . . . . . . . . . . . . . . . . . . . . . . . . . . . . . . . . 10037 Volume of total cereal trade . . . . . . . . . . . . . . . . . . . . . . . . . . . . . . . . . . . . . . . . . . . . . . . . . . . . . . . . . 10038 Volume of total oilseeds . . . . . . . . . . . . . . . . . . . . . . . . . . . . . . . . . . . . . . . . . . . . . . . . . . . . . . . . . . . . 10139 Volume of total sugar and honey trade . . . . . . . . . . . . . . . . . . . . . . . . . . . . . . . . . . . . . . . . . . . . . . . . . . . 10140 Volume of total meat trade . . . . . . . . . . . . . . . . . . . . . . . . . . . . . . . . . . . . . . . . . . . . . . . . . . . . . . . . . . 10241 Volume of total dairy products trade . . . . . . . . . . . . . . . . . . . . . . . . . . . . . . . . . . . . . . . . . . . . . . . . . . . . 10242 Value of fish trade . . . . . . . . . . . . . . . . . . . . . . . . . . . . . . . . . . . . . . . . . . . . . . . . . . . . . . . . . . . . . . . 10343 Land and Forestry . . . . . . . . . . . . . . . . . . . . . . . . . . . . . . . . . . . . . . . . . . . . . . . . . . . . . . . . . . . . . . . . 12644 Forestry production and trade . . . . . . . . . . . . . . . . . . . . . . . . . . . . . . . . . . . . . . . . . . . . . . . . . . . . . . . . 12645 Forestry production: finished products . . . . . . . . . . . . . . . . . . . . . . . . . . . . . . . . . . . . . . . . . . . . . . . . . . . 12746 Water withdrawal and pressure on renewable water resources . . . . . . . . . . . . . . . . . . . . . . . . . . . . . . . . . . . . 12747 Species threatened and nationally protected areas . . . . . . . . . . . . . . . . . . . . . . . . . . . . . . . . . . . . . . . . . . . 12848 Agri-environmental indicators . . . . . . . . . . . . . . . . . . . . . . . . . . . . . . . . . . . . . . . . . . . . . . . . . . . . . . . . 12849 Water pollution . . . . . . . . . . . . . . . . . . . . . . . . . . . . . . . . . . . . . . . . . . . . . . . . . . . . . . . . . . . . . . . . . 12950 Renewable feedstocks . . . . . . . . . . . . . . . . . . . . . . . . . . . . . . . . . . . . . . . . . . . . . . . . . . . . . . . . . . . . . 12951 Agricultural emissions . . . . . . . . . . . . . . . . . . . . . . . . . . . . . . . . . . . . . . . . . . . . . . . . . . . . . . . . . . . . . 130
xiv
8/12/2019 FAO Statistical Yearbook 2014 Near East and North Africa Food and Agriculture
http://slidepdf.com/reader/full/fao-statistical-yearbook-2014-near-east-and-north-africa-food-and-agriculture 17/174
PART
The Setting
The countries of the Near East and North Africa , as with the rest of theworld, are in a situation where they must find ways of feeding moreand more people with a limited amount of land and water and othernatural resources. Transforming the agricultural sector so that it canmeet the growing demand for safe and nutritious food, reduce ruralpoverty and at the same time contribute to environmentally sustain-able development is the challenge the region, and the entire world,is facing.
To meet this challenge, attention will need to be paid to the commu-
nities whose livelihoods depend on agriculture, forestry and fisheries,particularly smallholder farmers. In the Near East, rural communitiesmust cope with dry conditions and face chronic outmigration and highlevels of poverty. Within the region, there are wide variations amongcountries in terms of their economic and agricultural development.The region includes the oil-exporting countries of the Gulf Coopera-tion Council (GCC) and Yemen on the Arabian Peninsula, the Maghrebsub-region, which includes Algeria, Libya, Mauritania, Morocco, and
1
8/12/2019 FAO Statistical Yearbook 2014 Near East and North Africa Food and Agriculture
http://slidepdf.com/reader/full/fao-statistical-yearbook-2014-near-east-and-north-africa-food-and-agriculture 18/174
Tunisia, and the Oriental Near East countries (the Islamic Republic of Iran, Iraq, Egypt, Jordan, Lebanon, the former Sudan and Syria). Butwhatever the level of agricultural development, every country will
need to invest in agriculture and food supply systems to ensure thatproduction can be sustained for future generations and that agricul-ture can continue to be a motor for sustainable economic growth,particularly in rural areas.
Recent years have seen upheavals that have affected the agriculturalsector: food prices have soared and then declined on volatile inter-national commodity markets and a global financial crisis has sloweddown economic growth. For many countries in the region, agricul-ture can provide an important haven against global economic andfinancial turmoil, often more effectively than other sectors.
Downward trends in the global economy are slowly turning, withimproved accessibility to financial resources. Recent events havecreated a greater understanding among governments and donoragencies that agriculture must be the mainstay of any developmentagenda and of policies promoting economic growth. The reaffirma-tion of the sector’s role in development and growth provides fresh im-petus for fostering investments that raise productivity and incomesin agriculture.
In order to formulate effective evidence based policies, decisionsmust be based on sound data on a wide range of subjects. There
needs to be complete picture of the overall context in which sustain-able agriculture development is to take place. This involves gather-ing information on agriculture, forestry and fisheries, as well as onthe natural resource base that supports these activities and the com-peting demands on these resources from other sectors. Informationon livelihoods in agricultural communities is essential for determin-ing the best possible options for achieving sustainable food produc-tion and reducing hunger and malnutrition. This includes a greaterunderstanding the demographic trends and the labour situation inrural communities. Although women make significant contributionsto the rural economy, they often have less access to productive re-sources than men, and families often rely on children’s work for sur-vival. For this reason, gender-sensitive data on the different rolesmen and women play in agricultural production and the alleviationof hunger and malnutrition is also required.
2
8/12/2019 FAO Statistical Yearbook 2014 Near East and North Africa Food and Agriculture
http://slidepdf.com/reader/full/fao-statistical-yearbook-2014-near-east-and-north-africa-food-and-agriculture 19/174
Key Resources
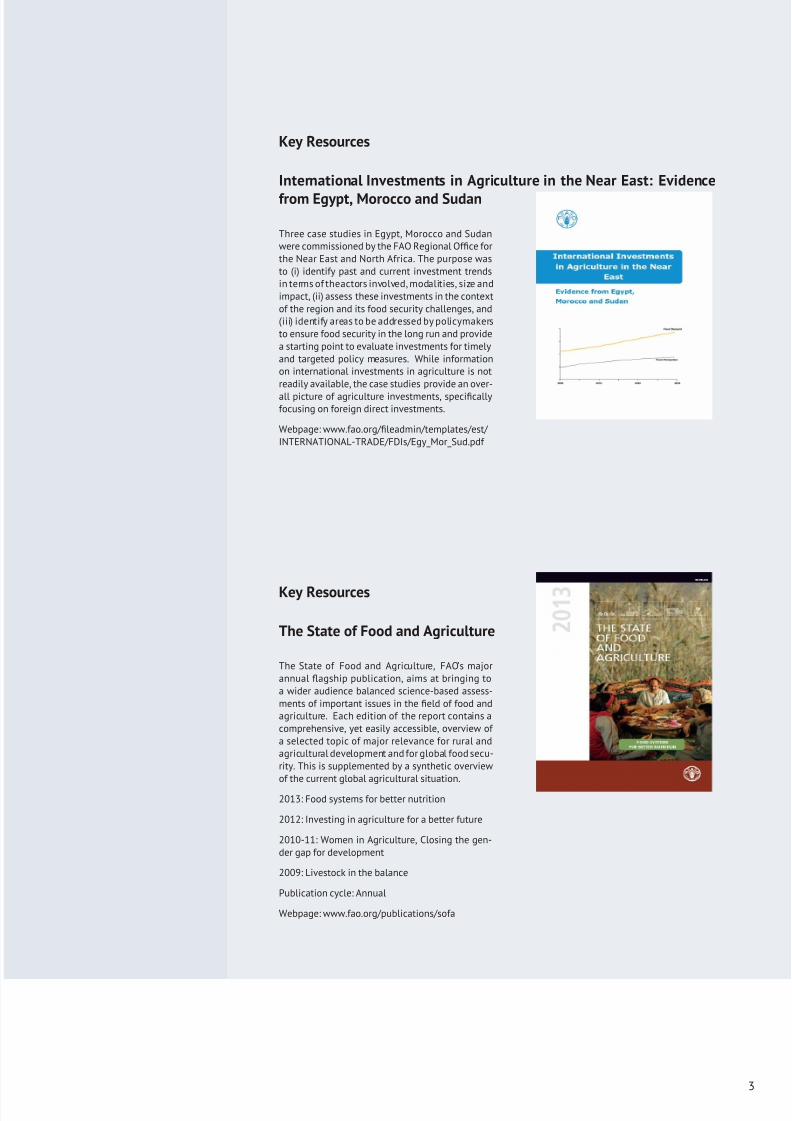
International Investments in Agriculture in the Near East: Evidence
from Egypt, Morocco and Sudan
Three case studies in Egypt, Morocco and Sudanwere commissioned by the FAO Regional Office forthe Near East and North Africa. The purpose wasto (i) identify past and current investment trendsin terms of theactors involved, modalities, size andimpact, (ii) assess these investments in the contextof the region and its food security challenges, and(iii) identify areas to be addressed by policymakersto ensure food security in the long run and providea starting point to evaluate investments for timelyand targeted policy measures. While informationon international investments in agriculture is notreadily available, the case studies provide an over-
all picture of agriculture investments, specificallyfocusing on foreign direct investments.
Webpage: www.fao.org/fileadmin/templates/est/ INTERNATIONAL-TRADE/FDIs/Egy_Mor_Sud.pdf
Key Resources
The State of Food and Agriculture
The State of Food and Agriculture, FAO’s majorannual flagship publication, aims at bringing toa wider audience balanced science-based assess-ments of important issues in the field of food andagriculture. Each edition of the report contains acomprehensive, yet easily accessible, overview of a selected topic of major relevance for rural andagricultural development and for global food secu-rity. This is supplemented by a synthetic overviewof the current global agricultural situation.
2013: Food systems for better nutrition
2012: Investing in agriculture for a better future
2010-11: Women in Agriculture, Closing the gen-der gap for development
2009: Livestock in the balance
Publication cycle: Annual
Webpage: www.fao.org/publications/sofa
3
8/12/2019 FAO Statistical Yearbook 2014 Near East and North Africa Food and Agriculture
http://slidepdf.com/reader/full/fao-statistical-yearbook-2014-near-east-and-north-africa-food-and-agriculture 20/174
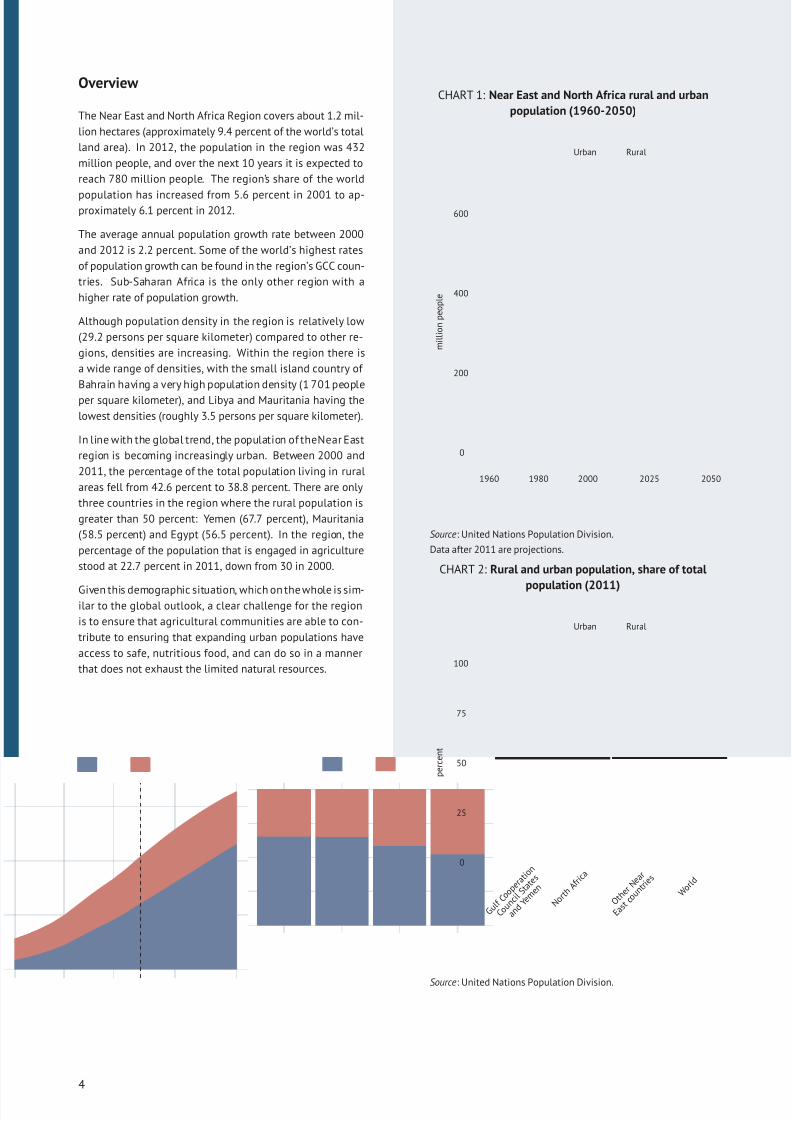
Overview
The Near East and North Africa Region covers about 1.2 mil-
lion hectares (approximately 9.4 percent of the world’s total
land area). In 2012, the population in the region was 432
million people, and over the next 10 years it is expected to
reach 780 million people. The region’s share of the world
population has increased from 5.6 percent in 2001 to ap-proximately 6.1 percent in 2012.
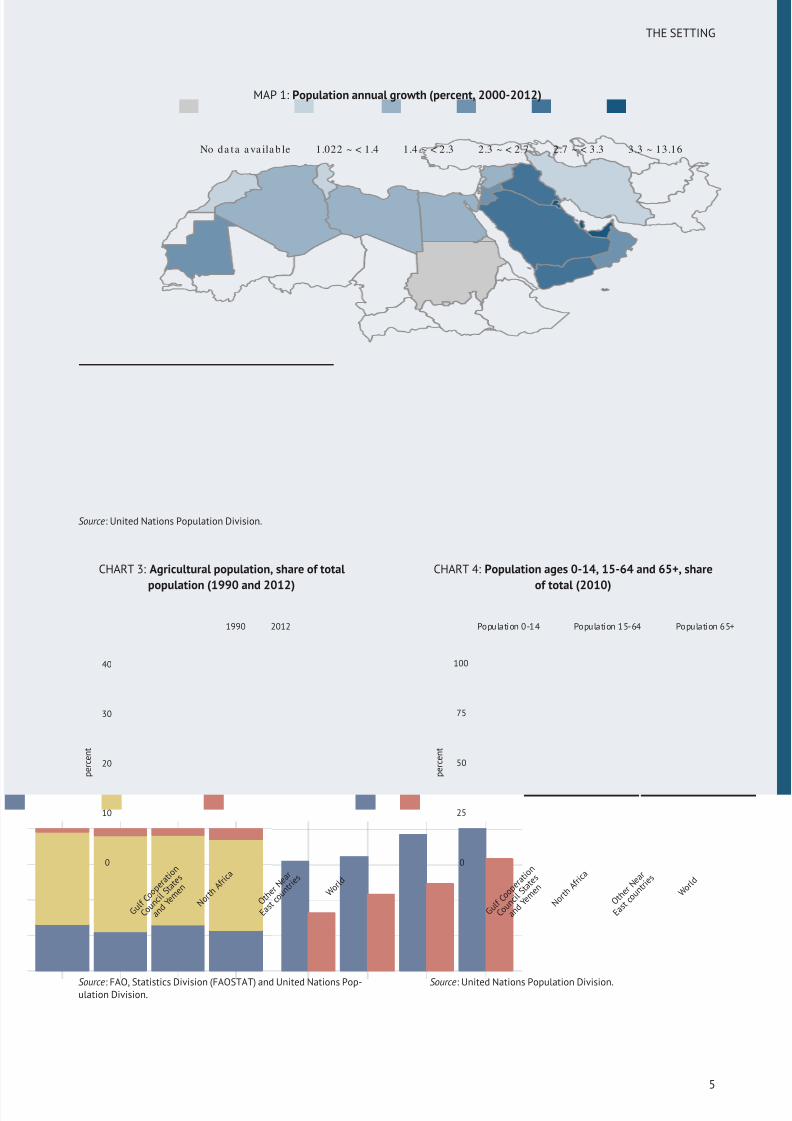
The average annual population growth rate between 2000
and 2012 is 2.2 percent. Some of the world’s highest rates
of population growth can be found in the region’s GCC coun-
tries. Sub-Saharan Africa is the only other region with a
higher rate of population growth.
Although population density in the region is relatively low
(29.2 persons per square kilometer) compared to other re-
gions, densities are increasing. Within the region there is
a wide range of densities, with the small island country of
Bahrain having a very high population density (1 701 people
per square kilometer), and Libya and Mauritania having the
lowest densities (roughly 3.5 persons per square kilometer).
In line with the global trend, the population of theNear East
region is becoming increasingly urban. Between 2000 and
2011, the percentage of the total population living in rural
areas fell from 42.6 percent to 38.8 percent. There are only
three countries in the region where the rural population is
greater than 50 percent: Yemen (67.7 percent), Mauritania
(58.5 percent) and Egypt (56.5 percent). In the region, the
percentage of the population that is engaged in agriculture
stood at 22.7 percent in 2011, down from 30 in 2000.
Given this demographic situation, which on the whole is sim-ilar to the global outlook, a clear challenge for the region
is to ensure that agricultural communities are able to con-
tribute to ensuring that expanding urban populations have
access to safe, nutritious food, and can do so in a manner
that does not exhaust the limited natural resources.
CHART 1: Near East and North Africa rural and urban
population (1960-2050)
0
200
400
600
1960 1980 2000 2025 2050
m i l l i o n p e o p l e
Urban Rural
Source: United Nations Population Division.
Data after 2011 are projections.
CHART 2: Rural and urban population, share of total
population (2011)
0
25
50
75
100
G u l f
C o o p
e r a t
i o n
C o u n
c i l S t a t
e s
a n d Y e
m e n
N o r t h
A f r i c
a
O t h e
r N e a
r
E a s t
c o u n
t r i e s
W o r l d
p e r c e n t
Urban Rural
Source: United Nations Population Division.
4
8/12/2019 FAO Statistical Yearbook 2014 Near East and North Africa Food and Agriculture
http://slidepdf.com/reader/full/fao-statistical-yearbook-2014-near-east-and-north-africa-food-and-agriculture 21/174
THE SETTING
MAP 1: Population annual growth (percent, 2000-2012)
No da ta a va ila b le 1.022 ~ < 1.4 1.4 ~ < 2.3 2.3 ~ < 2.7 2.7 ~ < 3.3 3.3 ~ 13.16
Source: United Nations Population Division.
CHART 3: Agricultural population, share of total
population (1990 and 2012)
0
10
20
30
40
G u l f
C o o p
e r a t
i o n
C o u n
c i l S t a t
e s
a n d
Y e m e
n
N o r t h
A f r i c
a
O t h e
r N e a
r
E a s t
c o u n
t r i e s
W o r l d
p e r c e n t
1990 2012
Source: FAO, Statistics Division (FAOSTAT) and United Nations Pop-ulation Division.
CHART 4: Population ages 0-14, 15-64 and 65+, share
of total (2010)
0
25
50
75
100
G u l f
C o o p
e r a t
i o n
C o u n
c i l S t a t
e s
a n d
Y e m e
n
N o r t h
A f r i c
a
O t h e
r N e a
r
E a s t
c o u n
t r i e s
W o r l d
p e r c e n t
Population 0-14 Population 15-64 Population 65+
Source: United Nations Population Division.
5
8/12/2019 FAO Statistical Yearbook 2014 Near East and North Africa Food and Agriculture
http://slidepdf.com/reader/full/fao-statistical-yearbook-2014-near-east-and-north-africa-food-and-agriculture 22/174
8/12/2019 FAO Statistical Yearbook 2014 Near East and North Africa Food and Agriculture
http://slidepdf.com/reader/full/fao-statistical-yearbook-2014-near-east-and-north-africa-food-and-agriculture 23/174
THE SETTING
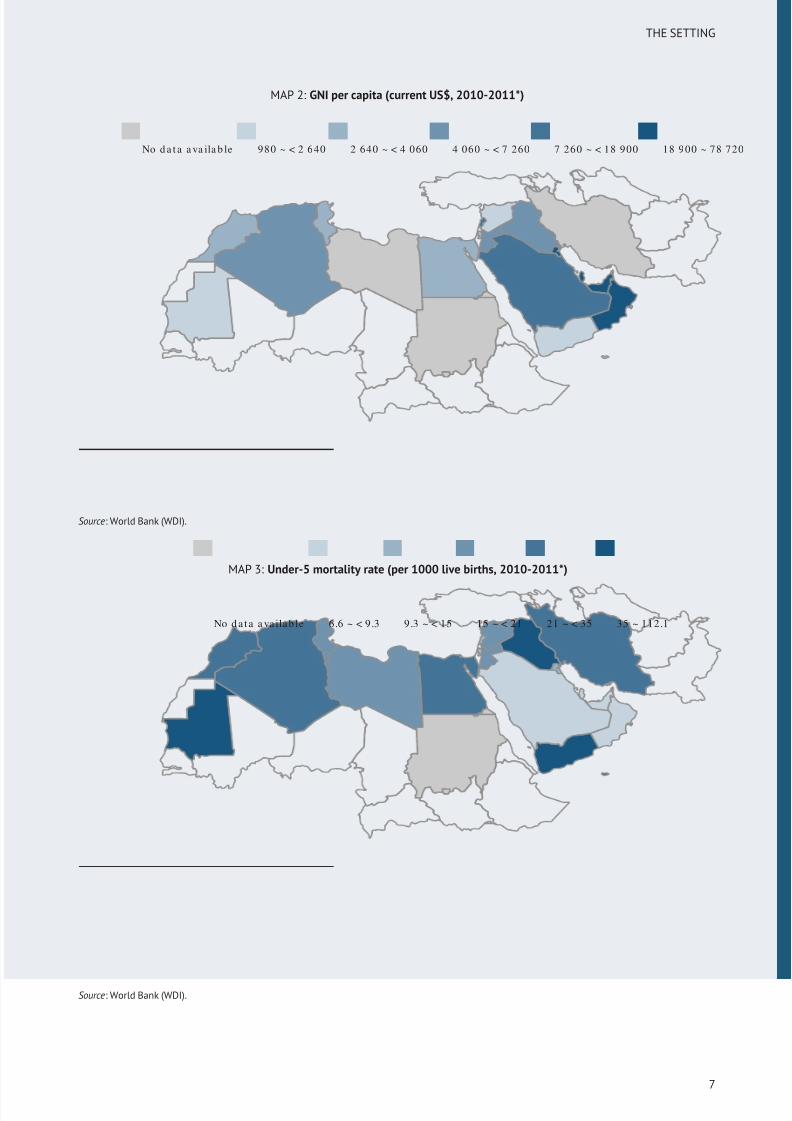
MAP 2: GNI per capita (current US$, 2010-2011*)
No da t a a va ila b le 980 ~ < 2 640 2 640 ~ < 4 060 4 060 ~ < 7 260 7 260 ~ < 18 900 18 900 ~ 78 720
Source: World Bank (WDI).
MAP 3: Under-5 mortality rate (per 1000 live births, 2010-2011*)
No d a ta a va ilab le 6.6 ~ < 9.3 9.3 ~ < 15 15 ~ < 21 21 ~ < 35 35 ~ 112.1
Source: World Bank (WDI).
7
8/12/2019 FAO Statistical Yearbook 2014 Near East and North Africa Food and Agriculture
http://slidepdf.com/reader/full/fao-statistical-yearbook-2014-near-east-and-north-africa-food-and-agriculture 24/174
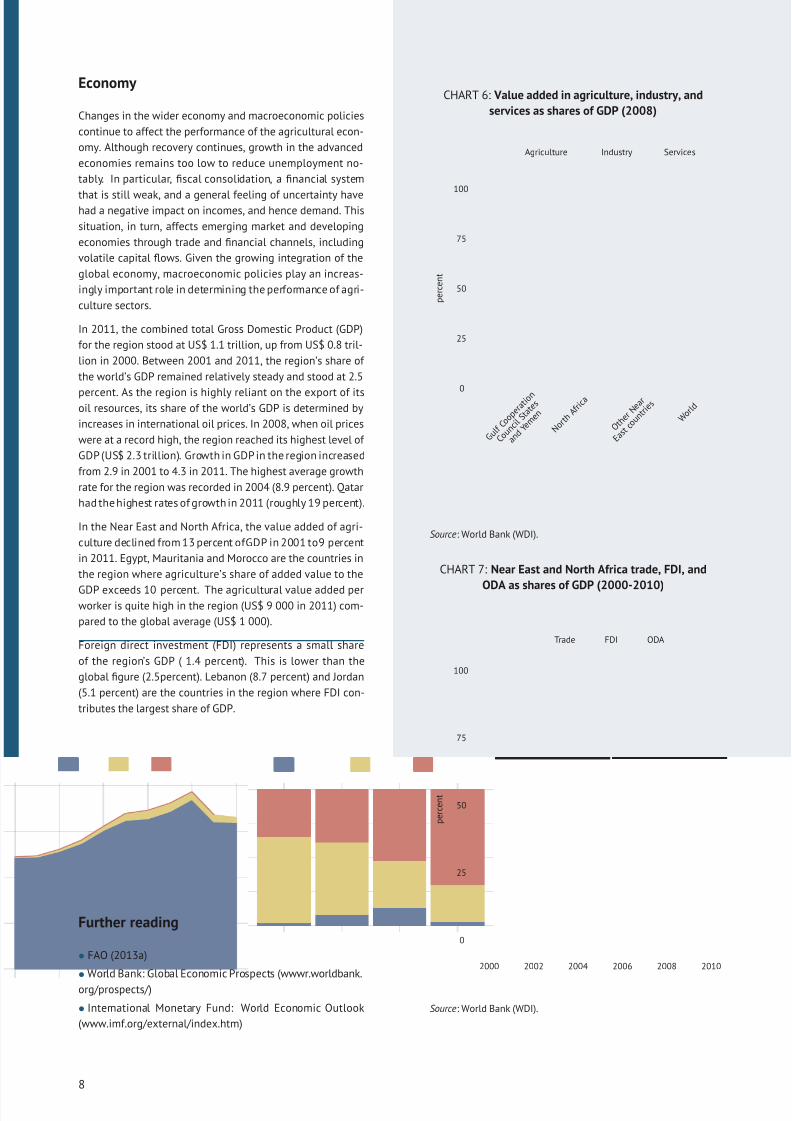
Economy
Changes in the wider economy and macroeconomic policies
continue to affect the performance of the agricultural econ-
omy. Although recovery continues, growth in the advanced
economies remains too low to reduce unemployment no-
tably. In particular, fiscal consolidation, a financial system
that is still weak, and a general feeling of uncertainty havehad a negative impact on incomes, and hence demand. This
situation, in turn, affects emerging market and developing
economies through trade and financial channels, including
volatile capital flows. Given the growing integration of the
global economy, macroeconomic policies play an increas-
ingly important role in determining the performance of agri-
culture sectors.
In 2011, the combined total Gross Domestic Product (GDP)
for the region stood at US$ 1.1 trillion, up from US$ 0.8 tril-
lion in 2000. Between 2001 and 2011, the region’s share of
the world’s GDP remained relatively steady and stood at 2.5
percent. As the region is highly reliant on the export of itsoil resources, its share of the world’s GDP is determined by
increases in international oil prices. In 2008, when oil prices
were at a record high, the region reached its highest level of
GDP (US$ 2.3 trillion). Growth in GDP in the region increased
from 2.9 in 2001 to 4.3 in 2011. The highest average growth
rate for the region was recorded in 2004 (8.9 percent). Qatar
had the highest rates of growth in 2011 (roughly 19 percent).
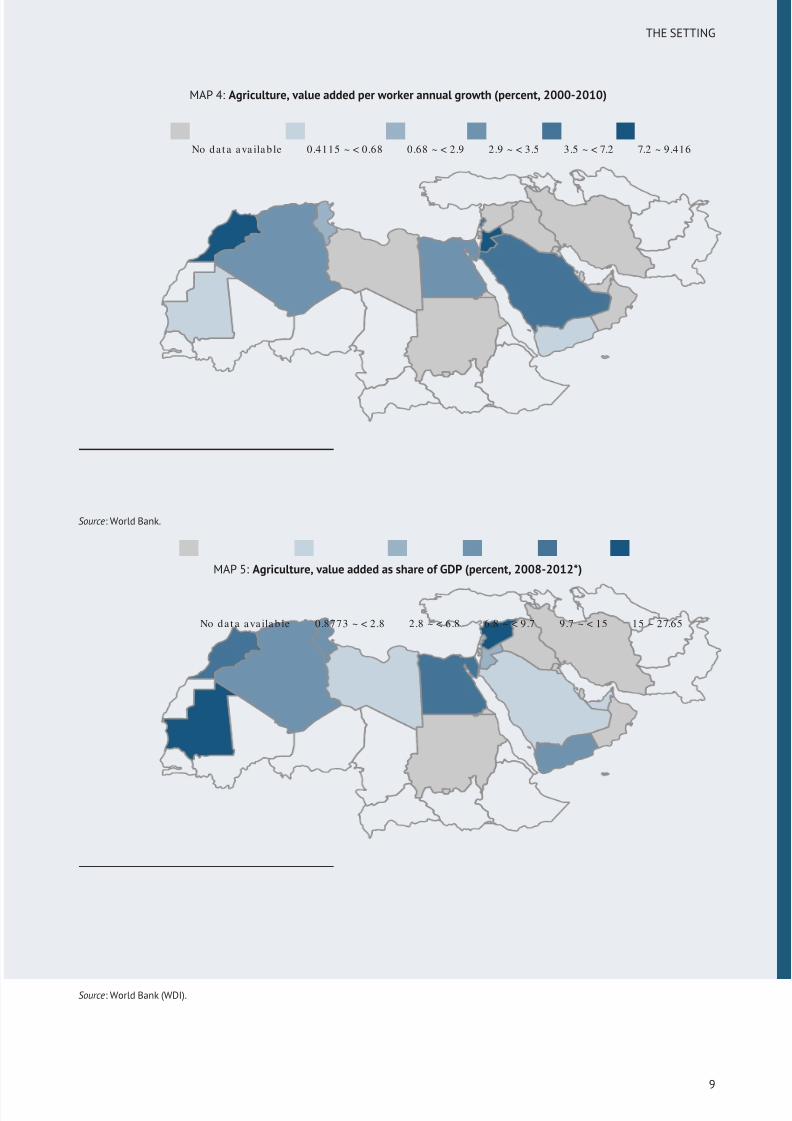
In the Near East and North Africa, the value added of agri-
culture declined from 13 percent ofGDP in 2001 to9 percent
in 2011. Egypt, Mauritania and Morocco are the countries in
the region where agriculture’s share of added value to the
GDP exceeds 10 percent. The agricultural value added perworker is quite high in the region (US$ 9 000 in 2011) com-
pared to the global average (US$ 1 000).
Foreign direct investment (FDI) represents a small share
of the region’s GDP ( 1.4 percent). This is lower than the
global figure (2.5percent). Lebanon (8.7 percent) and Jordan
(5.1 percent) are the countries in the region where FDI con-
tributes the largest share of GDP.
Further reading
• FAO (2013a)
• World Bank: Global Economic Prospects (wwwr.worldbank.
org/prospects/)
• International Monetary Fund: World Economic Outlook
(www.imf.org/external/index.htm)
CHART 6: Value added in agriculture, industry, and
services as shares of GDP (2008)
0
25
50
75
100
G u l f
C o o p
e r a t
i o n
C o u n
c i l S t a t
e s
a n d Y e
m e n
N o r t h
A f r i c
a
O t h e
r N e a
r
E a s t
c o u n
t r i e s
W o r l d
p e r c e n t
Agriculture Industry Services
Source: World Bank (WDI).
CHART 7: Near East and North Africa trade, FDI, and
ODA as shares of GDP (2000-2010)
0
25
50
75
100
2000 2002 2004 2006 2008 2010
p e r c e n t
Trade FDI ODA
Source: World Bank (WDI).
8
8/12/2019 FAO Statistical Yearbook 2014 Near East and North Africa Food and Agriculture
http://slidepdf.com/reader/full/fao-statistical-yearbook-2014-near-east-and-north-africa-food-and-agriculture 25/174
THE SETTING
MAP 4: Agriculture, value added per worker annual growth (percent, 2000-2010)
No da t a ava ila b le 0.4115 ~ < 0.68 0.68 ~ < 2.9 2.9 ~ < 3.5 3.5 ~ < 7.2 7.2 ~ 9.416
Source: World Bank.
MAP 5: Agriculture, value added as share of GDP (percent, 2008-2012*)
No da t a ava ila b le 0.8773 ~ < 2.8 2.8 ~ < 6.8 6.8 ~ < 9.7 9.7 ~ < 15 15 ~ 27.65
Source: World Bank (WDI).
9
8/12/2019 FAO Statistical Yearbook 2014 Near East and North Africa Food and Agriculture
http://slidepdf.com/reader/full/fao-statistical-yearbook-2014-near-east-and-north-africa-food-and-agriculture 26/174
8/12/2019 FAO Statistical Yearbook 2014 Near East and North Africa Food and Agriculture
http://slidepdf.com/reader/full/fao-statistical-yearbook-2014-near-east-and-north-africa-food-and-agriculture 27/174
THE SETTING
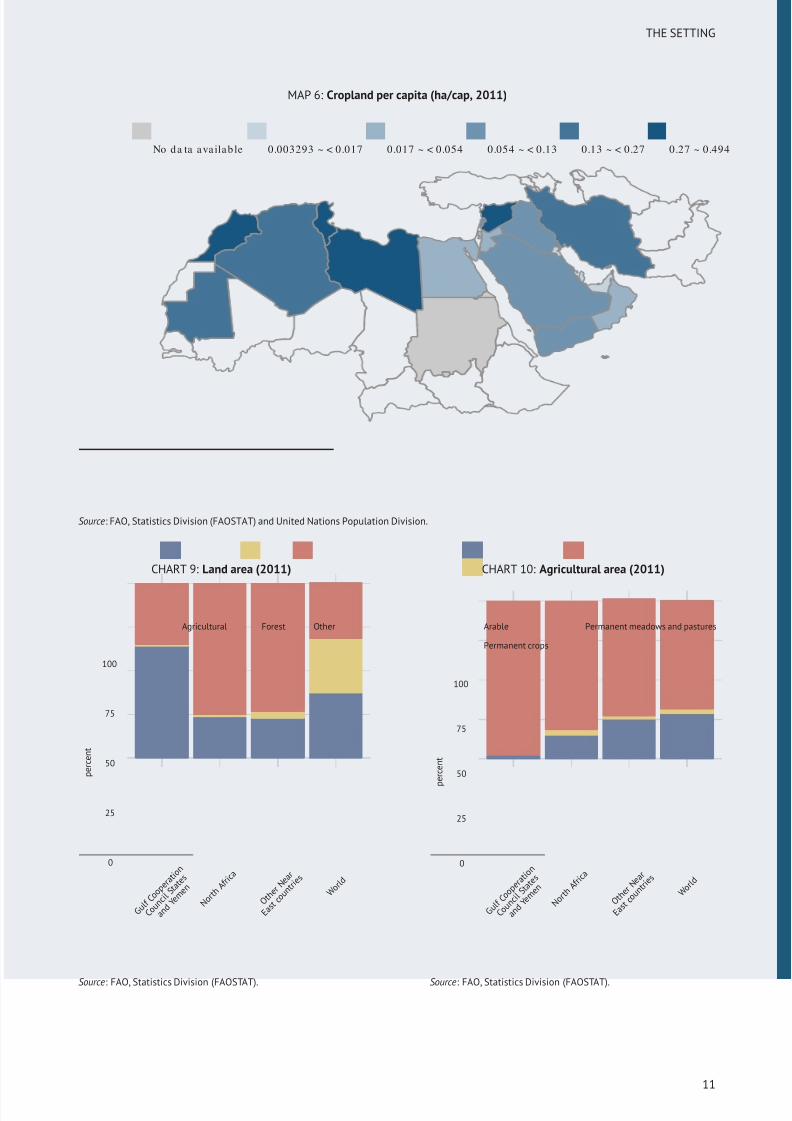
MAP 6: Cropland per capita (ha/cap, 2011)
No da ta ava ilab le 0.003293 ~ < 0.017 0.017 ~ < 0.054 0.054 ~ < 0.13 0.13 ~ < 0.27 0.27 ~ 0.494
Source: FAO, Statistics Division (FAOSTAT) and United Nations Population Division.
CHART 9: Land area (2011)
0
25
50
75
100
G u l f
C o o p
e r a t
i o n
C o u n
c i l S t a t
e s
a n d
Y e m e
n
N o r t h
A f r i c
a
O t h e
r N e a
r
E a s t
c o u n
t r i e s
W o r l d
p e r c e n t
Agricultural Forest Other
Source: FAO, Statistics Division (FAOSTAT).
CHART 10: Agricultural area (2011)
0
25
50
75
100
G u l f
C o o p
e r a t
i o n
C o u n
c i l S t a t
e s
a n d
Y e m e
n
N o r t h
A f r i c
a
O t h e
r N e a
r
E a s t
c o u n
t r i e s
W o r l d
p
e r c e n t
Arable
Permanent crops
Permanent meadows and pastures
Source: FAO, Statistics Division (FAOSTAT).
11
8/12/2019 FAO Statistical Yearbook 2014 Near East and North Africa Food and Agriculture
http://slidepdf.com/reader/full/fao-statistical-yearbook-2014-near-east-and-north-africa-food-and-agriculture 28/174
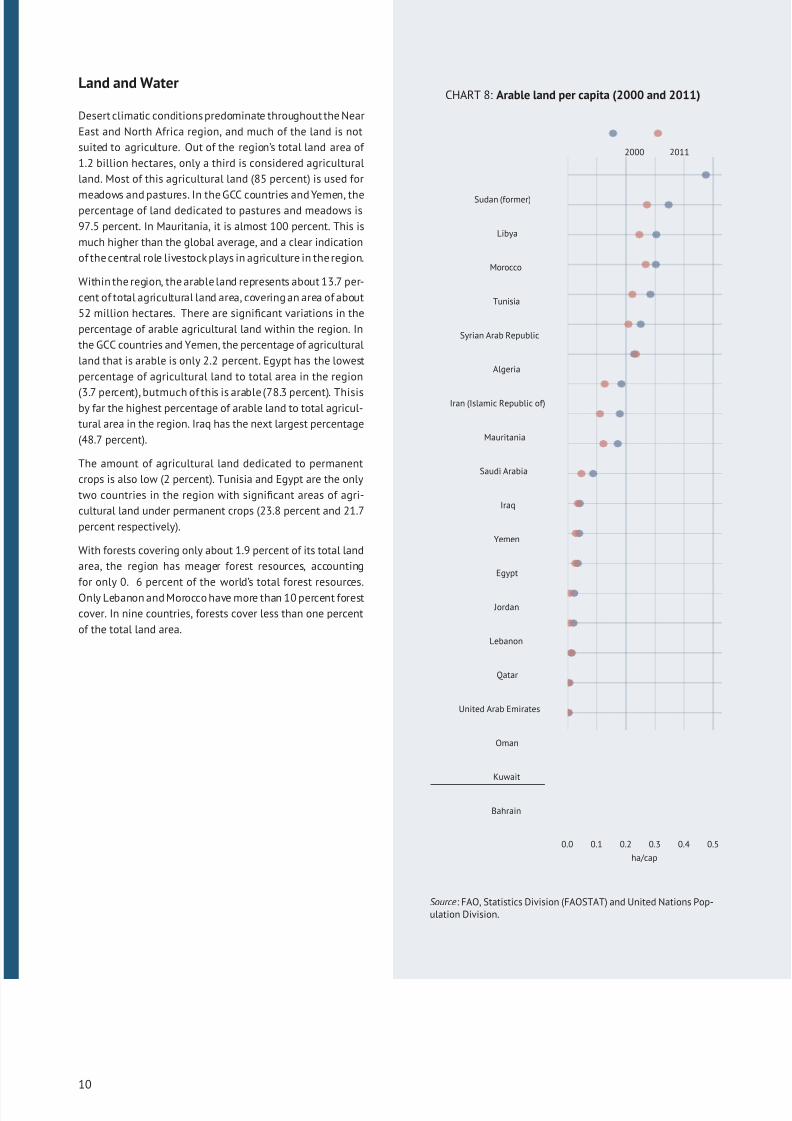
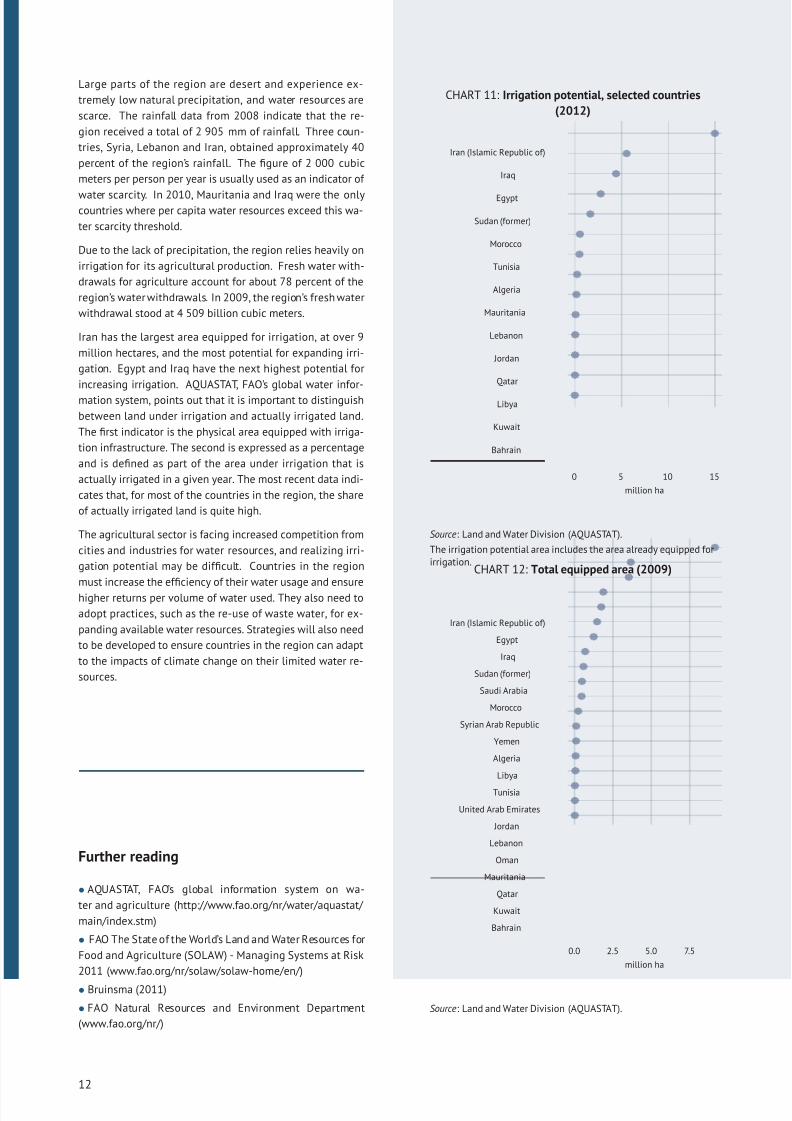
Large parts of the region are desert and experience ex-
tremely low natural precipitation, and water resources are
scarce. The rainfall data from 2008 indicate that the re-
gion received a total of 2 905 mm of rainfall. Three coun-
tries, Syria, Lebanon and Iran, obtained approximately 40
percent of the region’s rainfall. The figure of 2 000 cubic
meters per person per year is usually used as an indicator of
water scarcity. In 2010, Mauritania and Iraq were the onlycountries where per capita water resources exceed this wa-
ter scarcity threshold.
Due to the lack of precipitation, the region relies heavily on
irrigation for its agricultural production. Fresh water with-
drawals for agriculture account for about 78 percent of the
region’s water withdrawals. In 2009, the region’s fresh water
withdrawal stood at 4 509 billion cubic meters.
Iran has the largest area equipped for irrigation, at over 9
million hectares, and the most potential for expanding irri-
gation. Egypt and Iraq have the next highest potential for
increasing irrigation. AQUASTAT, FAO’s global water infor-
mation system, points out that it is important to distinguish
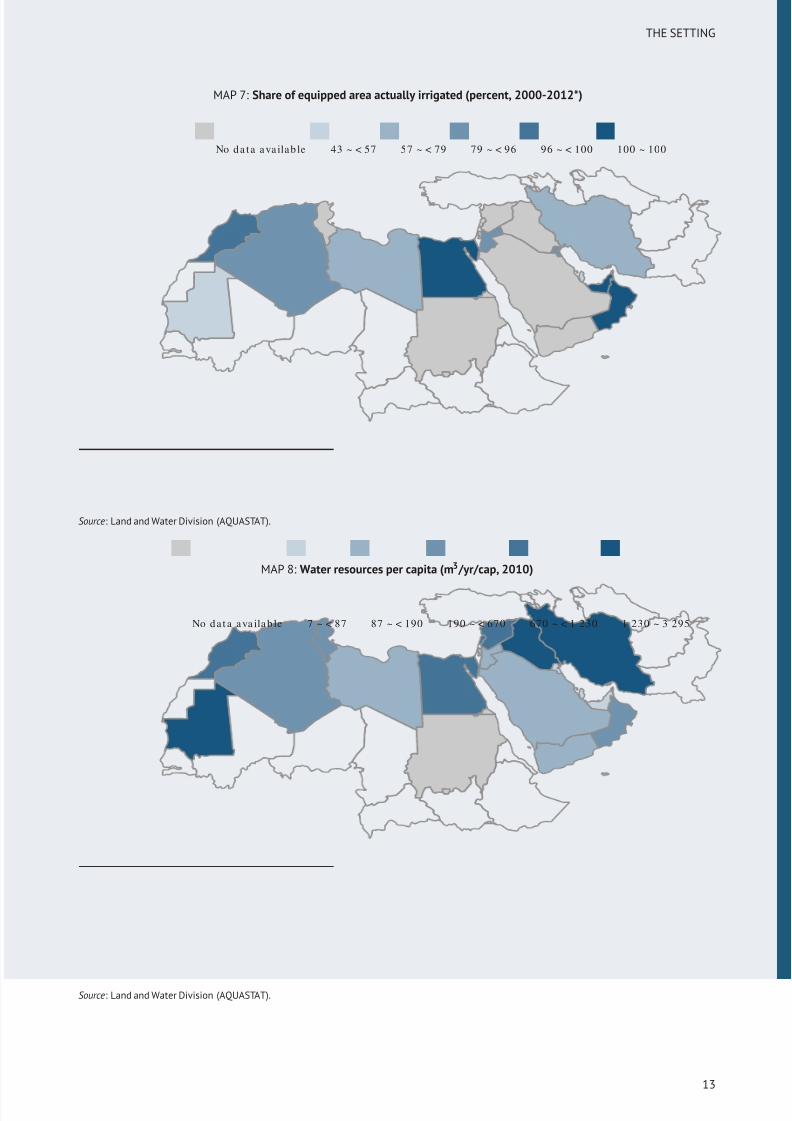
between land under irrigation and actually irrigated land.
The first indicator is the physical area equipped with irriga-
tion infrastructure. The second is expressed as a percentage
and is defined as part of the area under irrigation that is
actually irrigated in a given year. The most recent data indi-
cates that, for most of the countries in the region, the share
of actually irrigated land is quite high.
The agricultural sector is facing increased competition from
cities and industries for water resources, and realizing irri-
gation potential may be difficult. Countries in the region
must increase the efficiency of their water usage and ensure
higher returns per volume of water used. They also need to
adopt practices, such as the re-use of waste water, for ex-
panding available water resources. Strategies will also need
to be developed to ensure countries in the region can adapt
to the impacts of climate change on their limited water re-
sources.
Further reading
• AQUASTAT, FAO’s global information system on wa-
ter and agriculture (http://www.fao.org/nr/water/aquastat/
main/index.stm)
• FAO The State of the World’s Land and Water Resources for
Food and Agriculture (SOLAW) - Managing Systems at Risk
2011 (www.fao.org/nr/solaw/solaw-home/en/)
• Bruinsma (2011)
• FAO Natural Resources and Environment Department
(www.fao.org/nr/)
CHART 11: Irrigation potential, selected countries
(2012)
Bahrain
Kuwait
Libya
Qatar
Jordan
Lebanon
Mauritania
Algeria
Tunisia
Morocco
Sudan (former)
Egypt
Iraq
Iran (Islamic Republic of)
0 5 10 15
million ha
Source: Land and Water Division (AQUASTAT).
The irrigation potential area includes the area already equipped forirrigation.
CHART 12: Total equipped area (2009)
Bahrain
Kuwait
Qatar
Mauritania
Oman
Lebanon
Jordan
United Arab Emirates
Tunisia
Libya
Algeria
Yemen
Syrian Arab Republic
Morocco
Saudi Arabia
Sudan (former)
Iraq
Egypt
Iran (Islamic Republic of)
0.0 2.5 5.0 7.5
million ha
Source: Land and Water Division (AQUASTAT).
12
8/12/2019 FAO Statistical Yearbook 2014 Near East and North Africa Food and Agriculture
http://slidepdf.com/reader/full/fao-statistical-yearbook-2014-near-east-and-north-africa-food-and-agriculture 29/174
THE SETTING
MAP 7: Share of equipped area actually irrigated (percent, 2000-2012*)
No da ta ava ilab le 43 ~ < 57 57 ~ < 79 79 ~ < 96 96 ~ < 100 100 ~ 100
Source: Land and Water Division (AQUASTAT).
MAP 8: Water resources per capita (m3 /yr/cap, 2010)
No da t a ava ila b le 7 ~ < 87 87 ~ < 190 190 ~ < 670 670 ~ < 1 230 1 230 ~ 3 295
Source: Land and Water Division (AQUASTAT).
13
8/12/2019 FAO Statistical Yearbook 2014 Near East and North Africa Food and Agriculture
http://slidepdf.com/reader/full/fao-statistical-yearbook-2014-near-east-and-north-africa-food-and-agriculture 30/174
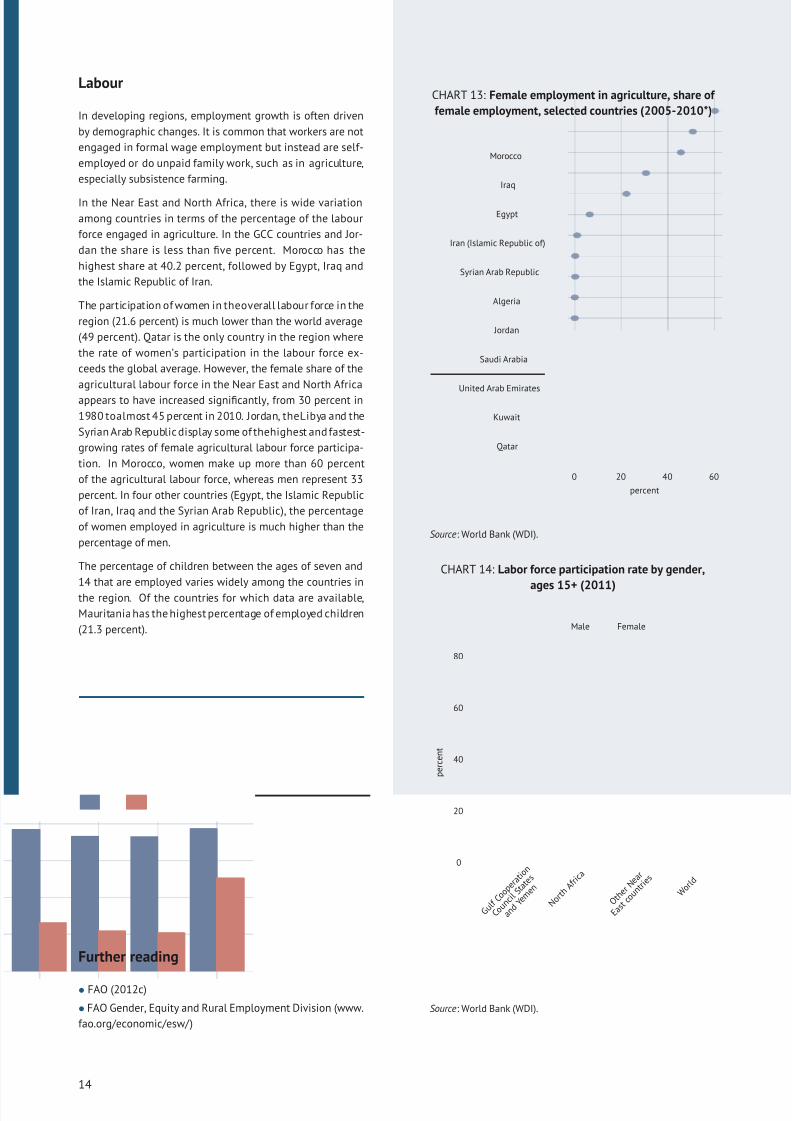
Labour
In developing regions, employment growth is often driven
by demographic changes. It is common that workers are not
engaged in formal wage employment but instead are self-
employed or do unpaid family work, such as in agriculture,
especially subsistence farming.
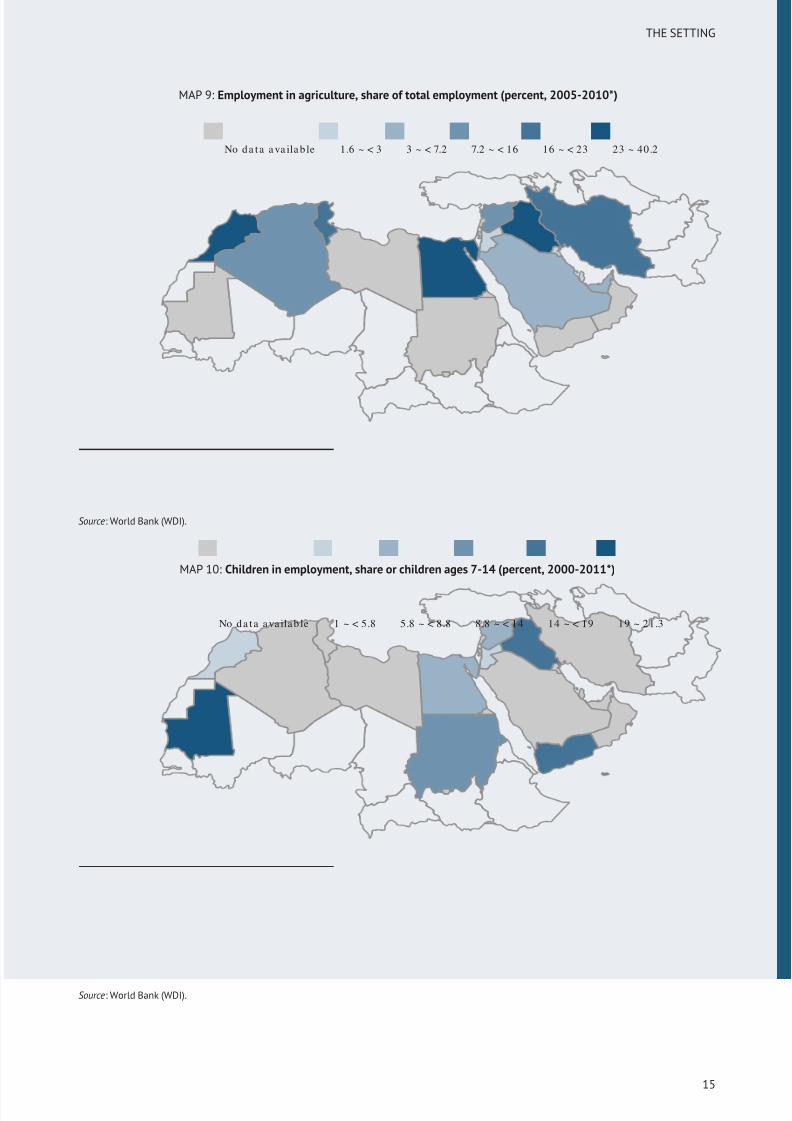
In the Near East and North Africa, there is wide variation
among countries in terms of the percentage of the labour
force engaged in agriculture. In the GCC countries and Jor-
dan the share is less than five percent. Morocco has the
highest share at 40.2 percent, followed by Egypt, Iraq and
the Islamic Republic of Iran.
The participation of women in theoverall labour force in the
region (21.6 percent) is much lower than the world average
(49 percent). Qatar is the only country in the region where
the rate of women’s participation in the labour force ex-
ceeds the global average. However, the female share of the
agricultural labour force in the Near East and North Africa
appears to have increased significantly, from 30 percent in
1980 toalmost 45 percent in 2010. Jordan, theLibya and the
Syrian Arab Republic display some of thehighest and fastest-
growing rates of female agricultural labour force participa-
tion. In Morocco, women make up more than 60 percent
of the agricultural labour force, whereas men represent 33
percent. In four other countries (Egypt, the Islamic Republic
of Iran, Iraq and the Syrian Arab Republic), the percentage
of women employed in agriculture is much higher than the
percentage of men.
The percentage of children between the ages of seven and
14 that are employed varies widely among the countries in
the region. Of the countries for which data are available,
Mauritania has the highest percentage of employed children
(21.3 percent).
Further reading
• FAO (2012c)
• FAO Gender, Equity and Rural Employment Division (www.
fao.org/economic/esw/ )
CHART 13: Female employment in agriculture, share of
female employment, selected countries (2005-2010*)
Qatar
Kuwait
United Arab Emirates
Saudi Arabia
Jordan
Algeria
Syrian Arab Republic
Iran (Islamic Republic of)
Egypt
Iraq
Morocco
0 20 40 60
percent
Source: World Bank (WDI).
CHART 14: Labor force participation rate by gender,
ages 15+ (2011)
0
20
40
60
80
G u l f
C o o p
e r a t
i o n
C o u n
c i l S t a t
e s
a n d Y e
m e n
N o r t h
A f r i c
a
O t h e
r N e a
r
E a s t
c o u n
t r i e s
W o r l d
p e r c e n t
Male Female
Source: World Bank (WDI).
14
8/12/2019 FAO Statistical Yearbook 2014 Near East and North Africa Food and Agriculture
http://slidepdf.com/reader/full/fao-statistical-yearbook-2014-near-east-and-north-africa-food-and-agriculture 31/174
THE SETTING
MAP 9: Employment in agriculture, share of total employment (percent, 2005-2010*)
No da ta a va ila b le 1.6 ~ < 3 3 ~ < 7.2 7.2 ~ < 16 16 ~ < 23 23 ~ 40.2
Source: World Bank (WDI).
MAP 10: Children in employment, share or children ages 7-14 (percent, 2000-2011*)
No da ta ava ilab le 1 ~ < 5.8 5.8 ~ < 8.8 8.8 ~ < 14 14 ~ < 19 19 ~ 21.3
Source: World Bank (WDI).
15
8/12/2019 FAO Statistical Yearbook 2014 Near East and North Africa Food and Agriculture
http://slidepdf.com/reader/full/fao-statistical-yearbook-2014-near-east-and-north-africa-food-and-agriculture 32/174
Inputs
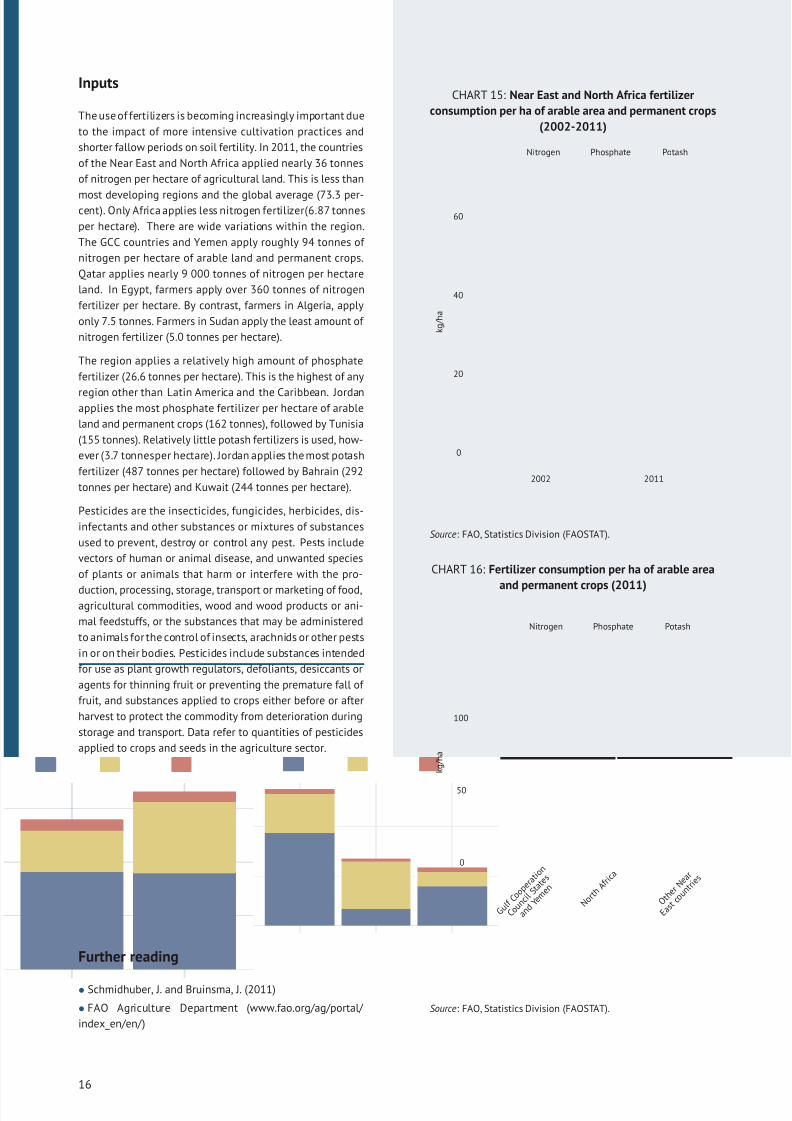
The use of fertilizers is becoming increasingly important due
to the impact of more intensive cultivation practices and
shorter fallow periods on soil fertility. In 2011, the countries
of the Near East and North Africa applied nearly 36 tonnes
of nitrogen per hectare of agricultural land. This is less than
most developing regions and the global average (73.3 per-cent). Only Africa applies less nitrogen fertilizer(6.87 tonnes
per hectare). There are wide variations within the region.
The GCC countries and Yemen apply roughly 94 tonnes of
nitrogen per hectare of arable land and permanent crops.
Qatar applies nearly 9 000 tonnes of nitrogen per hectare
land. In Egypt, farmers apply over 360 tonnes of nitrogen
fertilizer per hectare. By contrast, farmers in Algeria, apply
only 7.5 tonnes. Farmers in Sudan apply the least amount of
nitrogen fertilizer (5.0 tonnes per hectare).
The region applies a relatively high amount of phosphate
fertilizer (26.6 tonnes per hectare). This is the highest of any
region other than Latin America and the Caribbean. Jordanapplies the most phosphate fertilizer per hectare of arable
land and permanent crops (162 tonnes), followed by Tunisia
(155 tonnes). Relatively little potash fertilizers is used, how-
ever (3.7 tonnesper hectare). Jordan applies the most potash
fertilizer (487 tonnes per hectare) followed by Bahrain (292
tonnes per hectare) and Kuwait (244 tonnes per hectare).
Pesticides are the insecticides, fungicides, herbicides, dis-
infectants and other substances or mixtures of substances
used to prevent, destroy or control any pest. Pests include
vectors of human or animal disease, and unwanted species
of plants or animals that harm or interfere with the pro-
duction, processing, storage, transport or marketing of food,agricultural commodities, wood and wood products or ani-
mal feedstuffs, or the substances that may be administered
to animals for the control of insects, arachnids or other pests
in or on their bodies. Pesticides include substances intended
for use as plant growth regulators, defoliants, desiccants or
agents for thinning fruit or preventing the premature fall of
fruit, and substances applied to crops either before or after
harvest to protect the commodity from deterioration during
storage and transport. Data refer to quantities of pesticides
applied to crops and seeds in the agriculture sector.
Further reading
• Schmidhuber, J. and Bruinsma, J. (2011)
• FAO Agriculture Department (www.fao.org/ag/portal/
index_en/en/ )
CHART 15: Near East and North Africa fertilizer
consumption per ha of arable area and permanent crops
(2002-2011)
0
20
40
60
2002 2011
k g / h a
Nitrogen Phosphate Potash
Source: FAO, Statistics Division (FAOSTAT).
CHART 16: Fertilizer consumption per ha of arable area
and permanent crops (2011)
0
50
100
G u l f
C o o p
e r a t
i o n
C o u n
c i l S t a t
e s
a n d Y e
m e n
N o r t h
A f r i c
a
O t h e
r N e a
r
E a s t
c o u n
t r i e s
k g / h a
Nitrogen Phosphate Potash
Source: FAO, Statistics Division (FAOSTAT).
16
8/12/2019 FAO Statistical Yearbook 2014 Near East and North Africa Food and Agriculture
http://slidepdf.com/reader/full/fao-statistical-yearbook-2014-near-east-and-north-africa-food-and-agriculture 33/174
THE SETTING
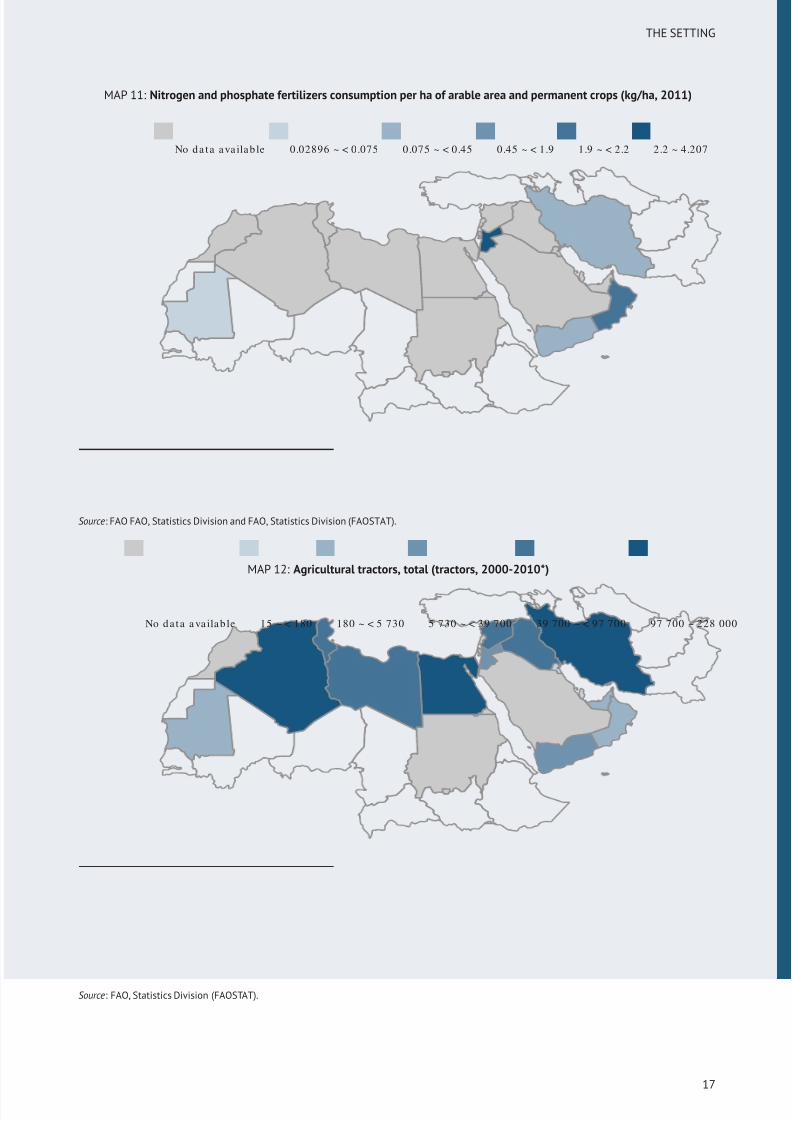
MAP 11: Nitrogen and phosphate fertilizers consumption per ha of arable area and permanent crops (kg/ha, 2011)
No da ta ava ilab le 0.02896 ~ < 0.075 0.075 ~ < 0.45 0.45 ~ < 1.9 1.9 ~ < 2.2 2.2 ~ 4.207
Source: FAO FAO, Statistics Division and FAO, Statistics Division (FAOSTAT).
MAP 12: Agricultural tractors, total (tractors, 2000-2010*)
No da ta a va ilab le 15 ~ < 180 180 ~ < 5 730 5 730 ~ < 39 700 39 700 ~ < 97 700 97 700 ~ 228 000
Source: FAO, Statistics Division (FAOSTAT).
17
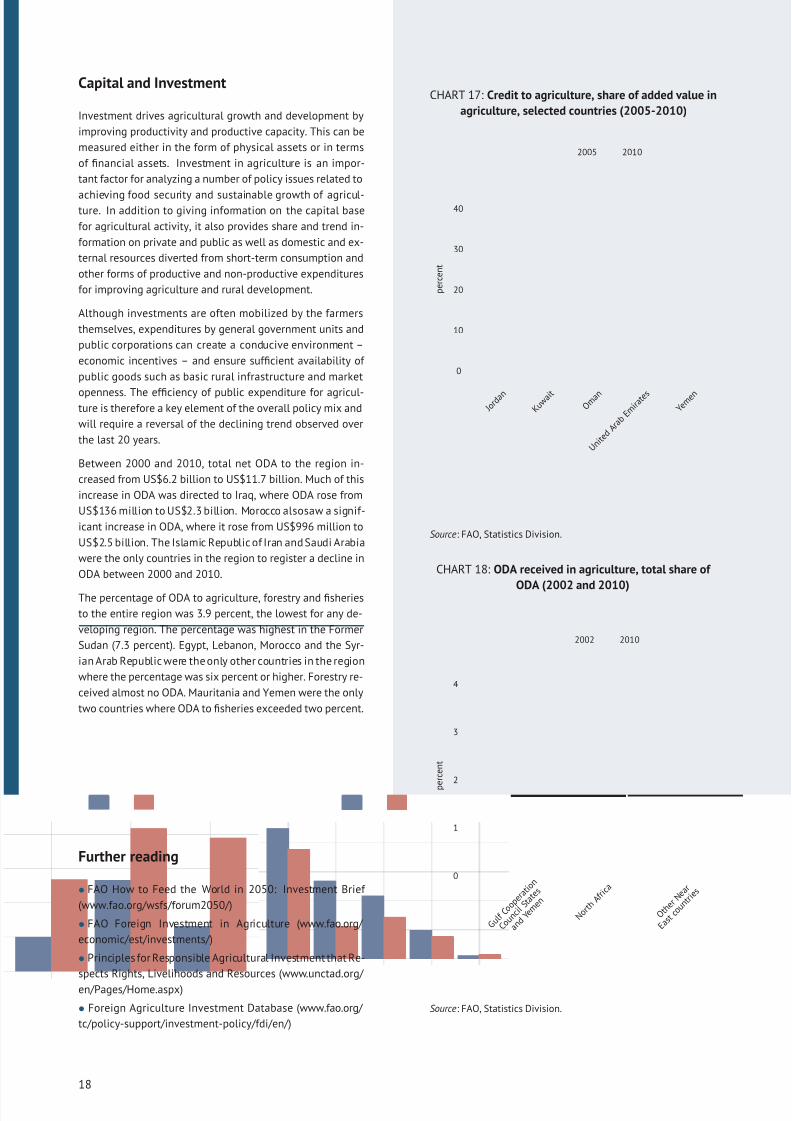
8/12/2019 FAO Statistical Yearbook 2014 Near East and North Africa Food and Agriculture
http://slidepdf.com/reader/full/fao-statistical-yearbook-2014-near-east-and-north-africa-food-and-agriculture 34/174
Capital and Investment
Investment drives agricultural growth and development by
improving productivity and productive capacity. This can be
measured either in the form of physical assets or in terms
of financial assets. Investment in agriculture is an impor-
tant factor for analyzing a number of policy issues related to
achieving food security and sustainable growth of agricul-ture. In addition to giving information on the capital base
for agricultural activity, it also provides share and trend in-
formation on private and public as well as domestic and ex-
ternal resources diverted from short-term consumption and
other forms of productive and non-productive expenditures
for improving agriculture and rural development.
Although investments are often mobilized by the farmers
themselves, expenditures by general government units and
public corporations can create a conducive environment –
economic incentives – and ensure sufficient availability of
public goods such as basic rural infrastructure and market
openness. The efficiency of public expenditure for agricul-ture is therefore a key element of the overall policy mix and
will require a reversal of the declining trend observed over
the last 20 years.
Between 2000 and 2010, total net ODA to the region in-
creased from US$6.2 billion to US$11.7 billion. Much of this
increase in ODA was directed to Iraq, where ODA rose from
US$136 million to US$2.3 billion. Morocco alsosaw a signif-
icant increase in ODA, where it rose from US$996 million to
US$2.5 billion. The Islamic Republic of Iran and Saudi Arabia
were the only countries in the region to register a decline in
ODA between 2000 and 2010.
The percentage of ODA to agriculture, forestry and fisheries
to the entire region was 3.9 percent, the lowest for any de-
veloping region. The percentage was highest in the Former
Sudan (7.3 percent). Egypt, Lebanon, Morocco and the Syr-
ian Arab Republic were the only other countries in the region
where the percentage was six percent or higher. Forestry re-
ceived almost no ODA. Mauritania and Yemen were the only
two countries where ODA to fisheries exceeded two percent.
Further reading
• FAO How to Feed the World in 2050: Investment Brief
(www.fao.org/wsfs/forum2050/)
• FAO Foreign Investment in Agriculture (www.fao.org/
economic/est/investments/)
• Principles for Responsible Agricultural Investment that Re-
spects Rights, Livelihoods and Resources (www.unctad.org/
en/Pages/Home.aspx)
• Foreign Agriculture Investment Database (www.fao.org/
tc/policy-support/investment-policy/fdi/en/)
CHART 17: Credit to agriculture, share of added value in
agriculture, selected countries (2005-2010)
0
10
20
30
40
J o r d a n
K u w a i t O m
a n
U n i t e
d A r a b
E m i r a
t e s Y e
m e n
p e r c e n t
2005 2010
Source: FAO, Statistics Division.
CHART 18: ODA received in agriculture, total share of
ODA (2002 and 2010)
0
1
2
3
4
G u l f
C o o p
e r a t
i o n
C o u n
c i l S t a t
e s
a n d
Y e m e
n
N o r t h
A f r i c
a
O t h e
r N e a
r
E a s t
c o u n
t r i e s
p e r c e n t
2002 2010
Source: FAO, Statistics Division.
18
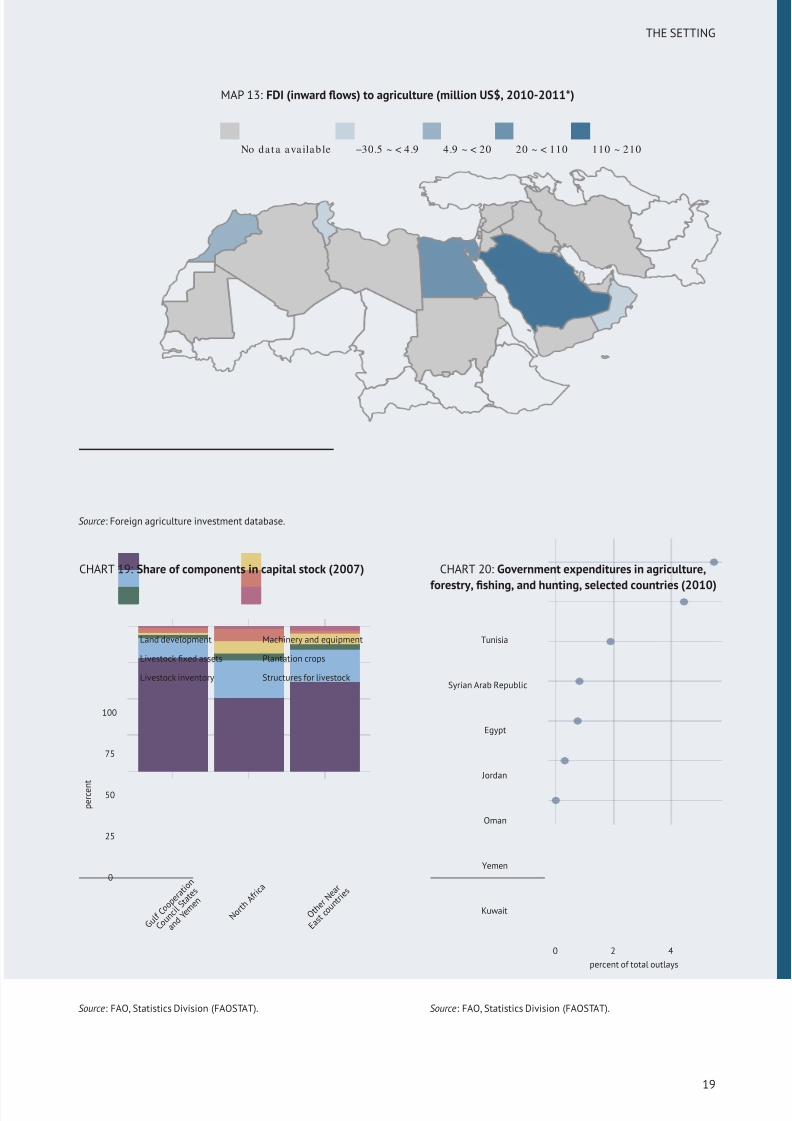
8/12/2019 FAO Statistical Yearbook 2014 Near East and North Africa Food and Agriculture
http://slidepdf.com/reader/full/fao-statistical-yearbook-2014-near-east-and-north-africa-food-and-agriculture 35/174
THE SETTING
MAP 13: FDI (inward flows) to agriculture (million US$, 2010-2011*)
No da t a ava ilab le −30.5 ~ < 4.9 4.9 ~ < 20 20 ~ < 110 110 ~ 210
Source: Foreign agriculture investment database.
CHART 19: Share of components in capital stock (2007)
0
25
50
75
100
G u l f
C o o p
e r a t
i o n
C o u n
c i l S t a t
e s
a n d Y e
m e n
N o r t h
A f r i c
a
O t h e
r N e a
r
E a s t
c o u n
t r i e s
p e r c e n
t
Land development
Livestock fixed assets
Livestock inventory
Machinery and equipment
Plantation crops
Structures for livestock
Source: FAO, Statistics Division (FAOSTAT).
CHART 20: Government expenditures in agriculture,
forestry, fishing, and hunting, selected countries (2010)
Kuwait
Yemen
Oman
Jordan
Egypt
Syrian Arab Republic
Tunisia
0 2 4
percent of total outlays
Source: FAO, Statistics Division (FAOSTAT).
19
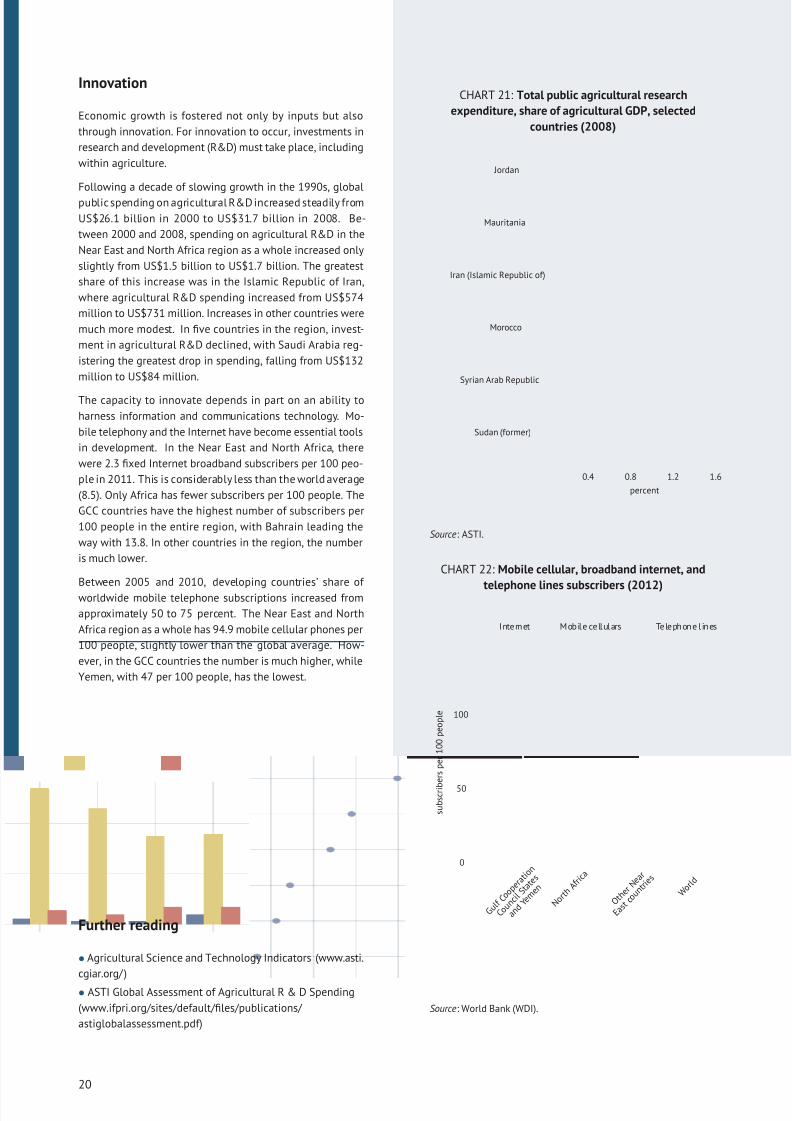
8/12/2019 FAO Statistical Yearbook 2014 Near East and North Africa Food and Agriculture
http://slidepdf.com/reader/full/fao-statistical-yearbook-2014-near-east-and-north-africa-food-and-agriculture 36/174
Innovation
Economic growth is fostered not only by inputs but also
through innovation. For innovation to occur, investments in
research and development (R&D) must take place, including
within agriculture.
Following a decade of slowing growth in the 1990s, global
public spending on agricultural R&D increased steadily from
US$26.1 billion in 2000 to US$31.7 billion in 2008. Be-
tween 2000 and 2008, spending on agricultural R&D in the
Near East and North Africa region as a whole increased only
slightly from US$1.5 billion to US$1.7 billion. The greatest
share of this increase was in the Islamic Republic of Iran,
where agricultural R&D spending increased from US$574
million to US$731 million. Increases in other countries were
much more modest. In five countries in the region, invest-
ment in agricultural R&D declined, with Saudi Arabia reg-
istering the greatest drop in spending, falling from US$132
million to US$84 million.
The capacity to innovate depends in part on an ability to
harness information and communications technology. Mo-
bile telephony and the Internet have become essential tools
in development. In the Near East and North Africa, there
were 2.3 fixed Internet broadband subscribers per 100 peo-
ple in 2011. This is considerably less than the world average
(8.5). Only Africa has fewer subscribers per 100 people. The
GCC countries have the highest number of subscribers per
100 people in the entire region, with Bahrain leading the
way with 13.8. In other countries in the region, the number
is much lower.
Between 2005 and 2010, developing countries’ share of
worldwide mobile telephone subscriptions increased from
approximately 50 to 75 percent. The Near East and North
Africa region as a whole has 94.9 mobile cellular phones per
100 people, slightly lower than the global average. How-
ever, in the GCC countries the number is much higher, while
Yemen, with 47 per 100 people, has the lowest.
Further reading
• Agricultural Science and Technology Indicators (www.asti.
cgiar.org/ )
• ASTI Global Assessment of Agricultural R & D Spending
(www.ifpri.org/sites/default/files/publications/
astiglobalassessment.pdf)
CHART 21: Total public agricultural research
expenditure, share of agricultural GDP, selected
countries (2008)
Sudan (former)
Syrian Arab Republic
Morocco
Iran (Islamic Republic of)
Mauritania
Jordan
0.4 0.8 1.2 1.6
percent
Source: ASTI.
CHART 22: Mobile cellular, broadband internet, and
telephone lines subscribers (2012)
0
50
100
G u l f
C o o p
e r a t
i o n
C o u n
c i l S t a t
e s
a n d Y e
m e n
N o r t h
A f r i c
a
O t h e
r N e a
r
E a s t
c o u n
t r i e s
W o r l d
s u b s c r i b
e r s p e r 1 0 0 p e o p l e
Internet Mobile cellulars Telephone l ines
Source: World Bank (WDI).
20
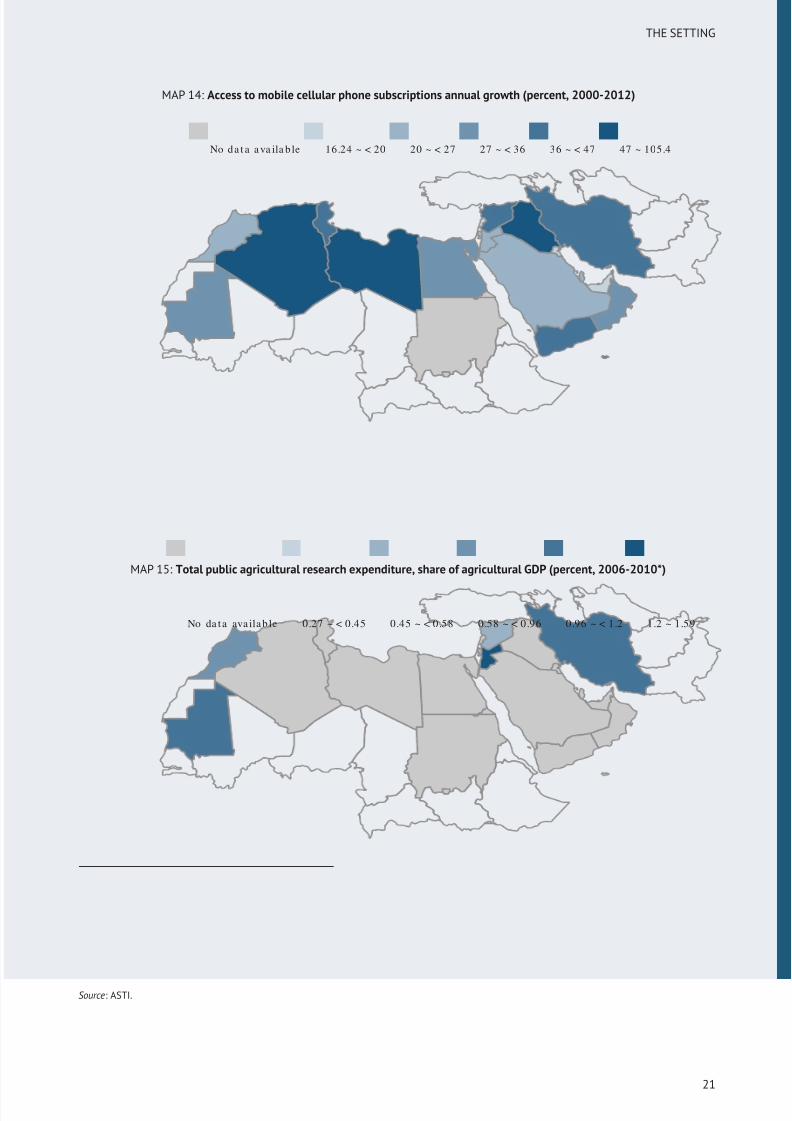
8/12/2019 FAO Statistical Yearbook 2014 Near East and North Africa Food and Agriculture
http://slidepdf.com/reader/full/fao-statistical-yearbook-2014-near-east-and-north-africa-food-and-agriculture 37/174
THE SETTING
MAP 14: Access to mobile cellular phone subscriptions annual growth (percent, 2000-2012)
No da t a a va ila b le 16.24 ~ < 20 20 ~ < 27 27 ~ < 36 36 ~ < 47 47 ~ 105.4
MAP 15: Total public agricultural research expenditure, share of agricultural GDP (percent, 2006-2010*)
No da ta ava ilab le 0.27 ~ < 0.45 0.45 ~ < 0.58 0.58 ~ < 0.96 0.96 ~ < 1.2 1.2 ~ 1.59
Source: ASTI.
21
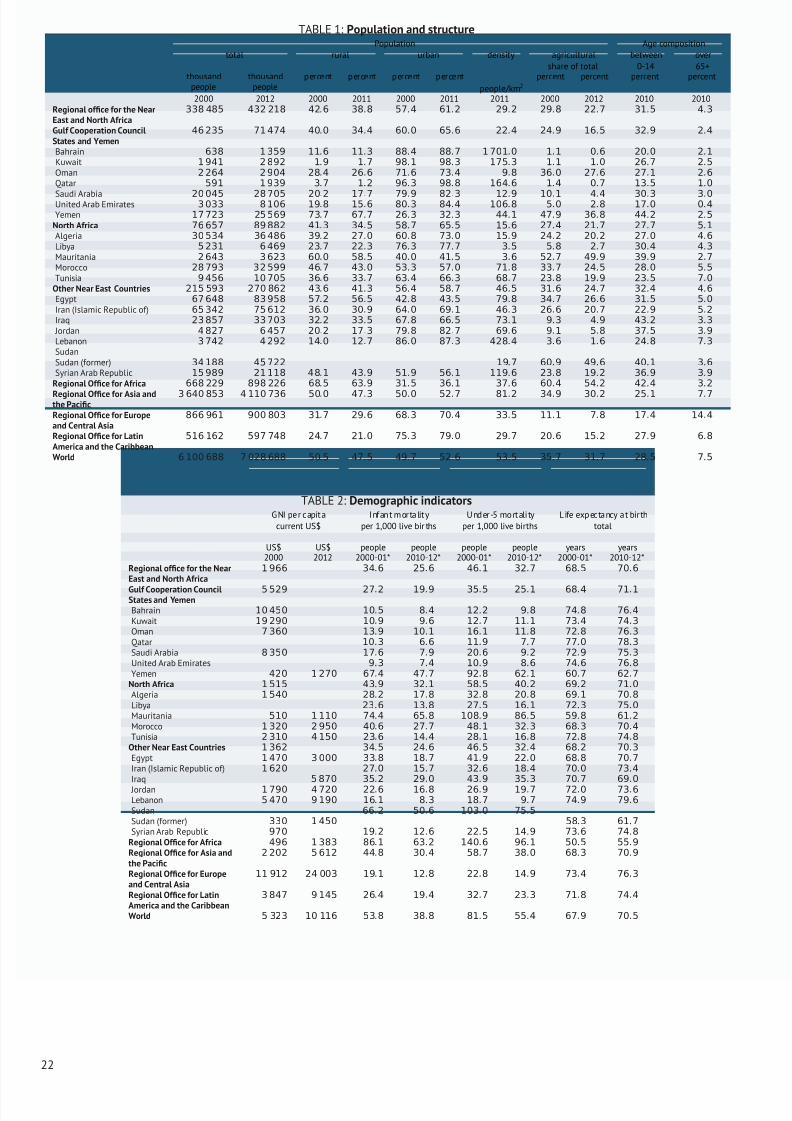
8/12/2019 FAO Statistical Yearbook 2014 Near East and North Africa Food and Agriculture
http://slidepdf.com/reader/full/fao-statistical-yearbook-2014-near-east-and-north-africa-food-and-agriculture 38/174
TABLE 1: Population and structurePopulation Age composition
total rural urban density agricultural between over
share of total 0-14 65+thousand
peoplethousand
peoplepercent percent percent percent
people/km2
percent percent percent percent
2000 2012 2000 2011 2000 2011 2011 2000 2012 2010 2010Regional office for the NearEast and North Africa
338 485 432 218 42.6 38.8 57.4 61.2 29.2 29.8 22.7 31.5 4.3
Gulf Cooperation CouncilStates and Yemen
46 235 71 474 40.0 34.4 60.0 65.6 22.4 24.9 16.5 32.9 2.4
Bahrain 638 1 359 11.6 11.3 88.4 88.7 1 701.0 1.1 0.6 20.0 2.1
Kuwait 1 941 2 892 1.9 1.7 98.1 98.3 175.3 1.1 1.0 26.7 2.5
Oman 2 264 2 904 28.4 26.6 71.6 73.4 9.8 36.0 27.6 27.1 2.6
Qatar 591 1 939 3.7 1.2 96.3 98.8 164.6 1.4 0.7 13.5 1.0
Saudi Arabia 20 045 28 705 20.2 17.7 79.9 82.3 12.9 10.1 4.4 30.3 3.0United Arab Emirates 3 033 8 106 19.8 15.6 80.3 84.4 106.8 5.0 2.8 17.0 0.4
Yemen 17 723 25 569 73.7 67.7 26.3 32.3 44.1 47.9 36.8 44.2 2.5
North Africa 76 657 89 882 41.3 34.5 58.7 65.5 15.6 27.4 21.7 27.7 5.1
Algeria 30 534 36 486 39.2 27.0 60.8 73.0 15.9 24.2 20.2 27.0 4.6
Libya 5 231 6 469 23.7 22.3 76.3 77.7 3.5 5.8 2.7 30.4 4.3
Mauritania 2 643 3 623 60.0 58.5 40.0 41.5 3.6 52.7 49.9 39.9 2.7
Morocco 28 793 32 599 46.7 43.0 53.3 57.0 71.8 33.7 24.5 28.0 5.5
Tunisia 9 456 10 705 36.6 33.7 63.4 66.3 68.7 23.8 19.9 23.5 7.0
Other Near East Countries 215 593 270 862 43.6 41.3 56.4 58.7 46.5 31.6 24.7 32.4 4.6
Egypt 67 648 83 958 57.2 56.5 42.8 43.5 79.8 34.7 26.6 31.5 5.0
Iran (Islamic Republic of) 65 342 75 612 36.0 30.9 64.0 69.1 46.3 26.6 20.7 22.9 5.2
Iraq 23 857 33 703 32.2 33.5 67.8 66.5 73.1 9.3 4.9 43.2 3.3
Jordan 4 827 6 457 20.2 17.3 79.8 82.7 69.6 9.1 5.8 37.5 3.9
Lebanon 3 742 4 292 14.0 12.7 86.0 87.3 428.4 3.6 1.6 24.8 7.3
SudanSudan (former) 34 188 45 722 19.7 60.9 49.6 40.1 3.6
Syrian Arab Republic 15 989 21 118 48.1 43.9 51.9 56.1 119.6 23.8 19.2 36.9 3.9
Regional Office for Africa 668 229 898 226 68.5 63.9 31.5 36.1 37.6 60.4 54.2 42.4 3.2
Regional Office for Asia andthe Pacific
3 640 853 4 110 736 50.0 47.3 50.0 52.7 81.2 34.9 30.2 25.1 7.7
Regional Office for Europeand Central Asia
866 961 900 803 31.7 29.6 68.3 70.4 33.5 11.1 7.8 17.4 14.4
Regional Office for LatinAmerica and the Caribbean
516 162 597 748 24.7 21.0 75.3 79.0 29.7 20.6 15.2 27.9 6.8
World 6 100 688 7 028 688 50.5 47.5 49.7 52.6 53.5 35.7 31.7 28.5 7.5
TABLE 2: Demographic indicatorsGNI per capita Infant mortality Under-5 mortali ty Life exp ectancy at birth
current US$ per 1,000 live bir ths per 1,000 live births total
US$ US$ people people people people years years2000 2012 2000-01* 2010-12* 2000-01* 2010-12* 2000-01* 2010-12*
Regional office for the NearEast and North Africa
1 966 34.6 25.6 46.1 32.7 68.5 70.6
Gulf Cooperation CouncilStates and Yemen
5 529 27.2 19.9 35.5 25.1 68.4 71.1
Bahrain 10 450 10.5 8.4 12.2 9.8 74.8 76.4
Kuwait 19 290 10.9 9.6 12.7 11.1 73.4 74.3
Oman 7 360 13.9 10.1 16.1 11.8 72.8 76.3
Qatar 10.3 6.6 11.9 7.7 77.0 78.3
Saudi Arabia 8 350 17.6 7.9 20.6 9.2 72.9 75.3
United Arab Emirates 9.3 7.4 10.9 8.6 74.6 76.8
Yemen 420 1 270 67.4 47.7 92.8 62.1 60.7 62.7
North Africa 1 515 43.9 32.1 58.5 40.2 69.2 71.0
Algeria 1 540 28.2 17.8 32.8 20.8 69.1 70.8
Libya 23.6 13.8 27.5 16.1 72.3 75.0
Mauritania 510 1 110 74.4 65.8 108.9 86.5 59.8 61.2
Morocco 1 320 2 950 40.6 27.7 48.1 32.3 68.3 70.4
Tunisia 2 310 4 150 23.6 14.4 28.1 16.8 72.8 74.8
Other Near East Countries 1 362 34.5 24.6 46.5 32.4 68.2 70.3
Egypt 1 470 3 000 33.8 18.7 41.9 22.0 68.8 70.7
Iran (Islamic Republic of) 1 620 27.0 15.7 32.6 18.4 70.0 73.4
Iraq 5 870 35.2 29.0 43.9 35.3 70.7 69.0
Jordan 1 790 4 720 22.6 16.8 26.9 19.7 72.0 73.6
Lebanon 5 470 9 190 16.1 8.3 18.7 9.7 74.9 79.6
Sudan 66.2 50.6 103.0 75.5
Sudan (former) 330 1 450 58.3 61.7
Syrian Arab Republic 970 19.2 12.6 22.5 14.9 73.6 74.8
Regional Office for Africa 496 1 383 86.1 63.2 140.6 96.1 50.5 55.9
Regional Office for Asia andthe Pacific
2 202 5 612 44.8 30.4 58.7 38.0 68.3 70.9
Regional Office for Europeand Central Asia
11 912 24 003 19.1 12.8 22.8 14.9 73.4 76.3
Regional Office for LatinAmerica and the Caribbean
3 847 9 145 26.4 19.4 32.7 23.3 71.8 74.4
World 5 323 10 116 53.8 38.8 81.5 55.4 67.9 70.5
22
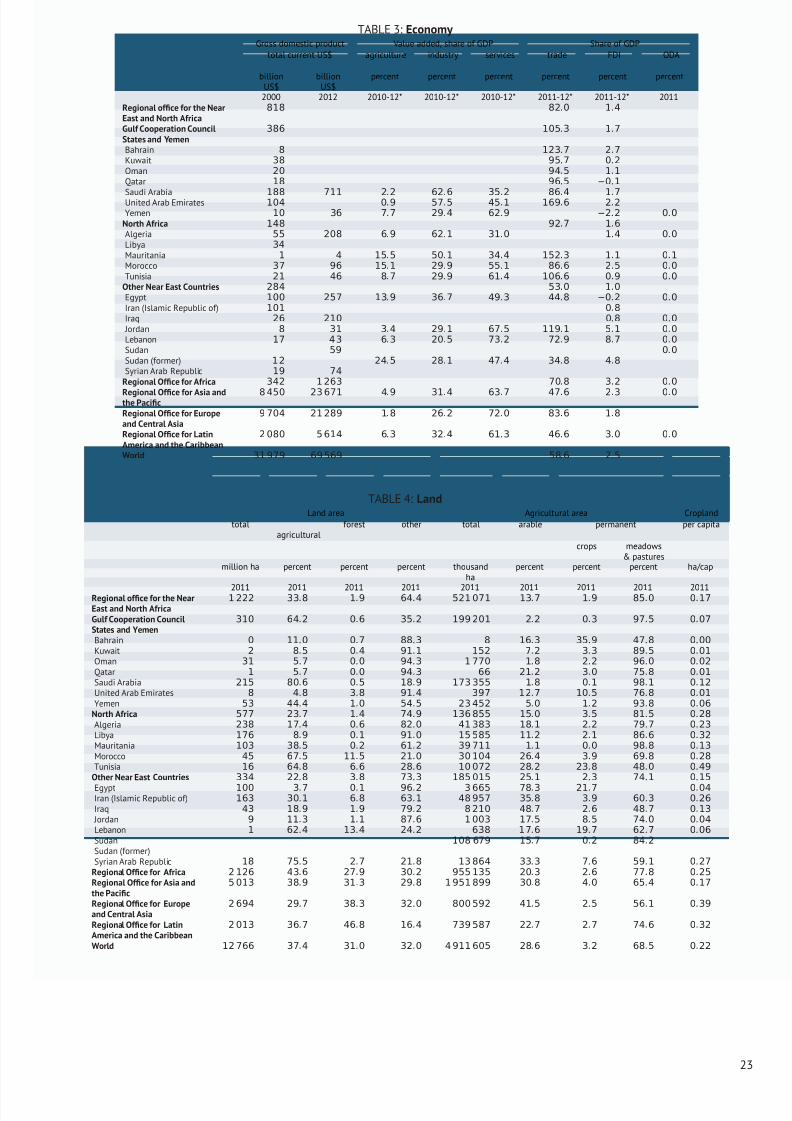
8/12/2019 FAO Statistical Yearbook 2014 Near East and North Africa Food and Agriculture
http://slidepdf.com/reader/full/fao-statistical-yearbook-2014-near-east-and-north-africa-food-and-agriculture 39/174
TABLE 3: Economy Gross domestic product Value added, share of GDP Share of GDP
total current US$ agriculture industry services trade FDI ODA
billionUS$
billionUS$
percent percent percent percent percent percent
2000 2012 2010-12* 2010-12* 2010-12* 2011-12* 2011-12* 2011Regional office for the NearEast and North Africa
818 82.0 1.4
Gulf Cooperation CouncilStates and Yemen
386 105.3 1.7
Bahrain 8 123.7 2.7
Kuwait 38 95.7 0.2
Oman 20 94.5 1.1
Qatar 18 96.5 −0.1
Saudi Arabia 188 711 2.2 62.6 35.2 86.4 1.7
United Arab Emirates 104 0.9 57.5 45.1 169.6 2.2
Yemen 10 36 7.7 29.4 62.9 −2.2 0.0
North Africa 148 92.7 1.6
Algeria 55 208 6.9 62.1 31.0 1.4 0.0
Libya 34
Mauritania 1 4 15.5 50.1 34.4 152.3 1.1 0.1
Morocco 37 96 15.1 29.9 55.1 86.6 2.5 0.0
Tunisia 21 46 8.7 29.9 61.4 106.6 0.9 0.0
Other Near East Countries 284 53.0 1.0
Egypt 100 257 13.9 36.7 49.3 44.8 −0.2 0.0
Iran (Islamic Republic of) 101 0.8
Iraq 26 210 0.8 0.0
Jordan 8 31 3.4 29.1 67.5 119.1 5.1 0.0
Lebanon 17 4 3 6.3 20.5 73.2 72.9 8.7 0.0
Sudan 59 0.0
Sudan (former) 1 2 24.5 28.1 47.4 34.8 4.8
Syrian Arab Republic 19 74
Regional Office for Africa 342 1 263 70.8 3.2 0.0
Regional Office for Asia andthe Pacific
8 450 23 671 4.9 31.4 63.7 47.6 2.3 0.0
Regional Office for Europeand Central Asia
9 704 21 289 1.8 26.2 72.0 83.6 1.8
Regional Office for LatinAmerica and the Caribbean
2 080 5 614 6.3 32.4 61.3 46.6 3.0 0.0
World 31 979 69 569 58.6 2.5
TABLE 4: LandLand area Agricultural area Cropland
totalagricultural
forest other total arable permanent per capita
crops meadows& pastures
million ha percent percent percent thousandha
percent percent percent ha/cap
2011 2011 2011 2011 2011 2011 2011 2011 2011Regional office for the NearEast and North Africa
1 222 33.8 1.9 64.4 521 071 13.7 1.9 85.0 0.17
Gulf Cooperation CouncilStates and Yemen
310 64.2 0.6 35.2 199 201 2.2 0.3 97.5 0.07
Bahrain 0 11.0 0.7 88.3 8 16.3 35.9 47.8 0.00
Kuwait 2 8.5 0.4 91.1 152 7.2 3.3 89.5 0.01
Oman 31 5.7 0.0 94.3 1 770 1.8 2.2 96.0 0.02
Qatar 1 5.7 0.0 94.3 66 21.2 3.0 75.8 0.01
Saudi Arabia 215 80.6 0.5 18.9 173 355 1.8 0.1 98.1 0.12
United Arab Emirates 8 4.8 3.8 91.4 397 12.7 10.5 76.8 0.01
Yemen 53 44.4 1.0 54.5 23 452 5.0 1.2 93.8 0.06
North Africa 577 23.7 1.4 74.9 136 855 15.0 3.5 81.5 0.28
Algeria 238 17.4 0.6 82.0 41 383 18.1 2.2 79.7 0.23
Libya 176 8.9 0.1 91.0 15 585 11.2 2.1 86.6 0.32
Mauritania 103 38.5 0.2 61.2 39 711 1.1 0.0 98.8 0.13
Morocco 45 67.5 11.5 21.0 30 104 26.4 3.9 69.8 0.28
Tunisia 16 64.8 6.6 28.6 10 072 28.2 23.8 48.0 0.49
Other Near East Countries 334 22.8 3.8 73.3 185 015 25.1 2.3 74.1 0.15
Egypt 100 3.7 0.1 96.2 3 665 78.3 21.7 0.04Iran (Islamic Republic of) 163 30.1 6.8 63.1 48 957 35.8 3.9 60.3 0.26
Iraq 43 18.9 1.9 79.2 8 210 48.7 2.6 48.7 0.13
Jordan 9 11.3 1.1 87.6 1 003 17.5 8.5 74.0 0.04
Lebanon 1 62.4 13.4 24.2 638 17.6 19.7 62.7 0.06
Sudan 108 679 15.7 0.2 84.2
Sudan (former)Syrian Arab Republic 18 75.5 2.7 21.8 13 864 33.3 7.6 59.1 0.27
Regional Office for Africa 2 126 43.6 27.9 30.2 955 135 20.3 2.6 77.8 0.25
Regional Office for Asia andthe Pacific
5 013 38.9 31.3 29.8 1 951 899 30.8 4.0 65.4 0.17
Regional Office for Europeand Central Asia
2 694 29.7 38.3 32.0 800 592 41.5 2.5 56.1 0.39
Regional Office for LatinAmerica and the Caribbean
2 013 36.7 46.8 16.4 739 587 22.7 2.7 74.6 0.32
World 12 766 37.4 31.0 32.0 4 911 605 28.6 3.2 68.5 0.22
23
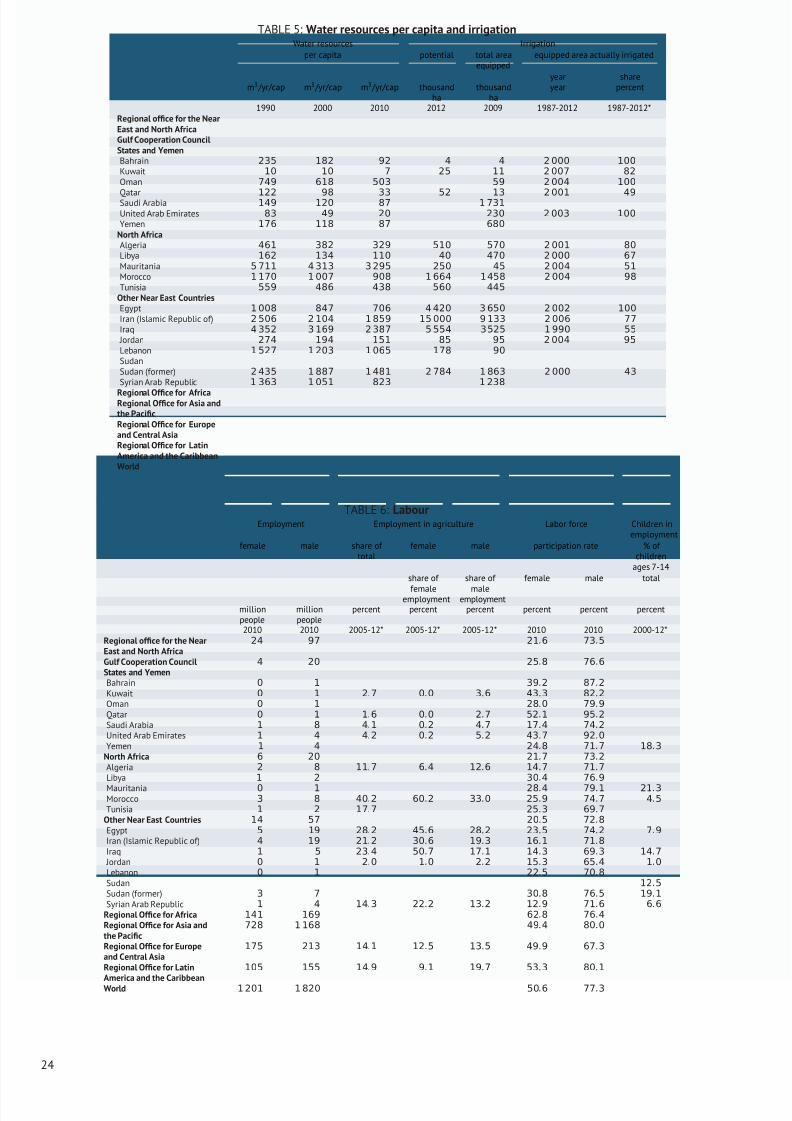
8/12/2019 FAO Statistical Yearbook 2014 Near East and North Africa Food and Agriculture
http://slidepdf.com/reader/full/fao-statistical-yearbook-2014-near-east-and-north-africa-food-and-agriculture 40/174
TABLE 5: Water resources per capita and irrigationWater resources Irrigation
per capita potential total areaequipped
equipped area actually irrigated
year sharem3 /yr/cap m3 /yr/cap m3 /yr/cap thousand
hathousand
hayear percent
1990 2000 2010 2012 2009 1987-2012 1987-2012*Regional office for the NearEast and North AfricaGulf Cooperation CouncilStates and YemenBahrain 235 182 92 4 4 2 000 100
Kuwait 10 10 7 25 11 2 007 82
Oman 749 618 503 59 2 004 100
Qatar 122 98 33 52 13 2 001 49
Saudi Arabia 149 120 87 1 731
United Arab Emirates 83 49 20 230 2 003 100
Yemen 176 118 87 680
North AfricaAlgeria 461 382 329 510 570 2 001 80
Libya 162 134 110 40 470 2 000 67
Mauritania 5 711 4 313 3 295 250 45 2 004 51
Morocco 1 170 1 007 908 1 664 1 458 2 004 98
Tunisia 559 486 438 560 445
Other Near East CountriesEgypt 1 008 847 706 4 420 3 650 2 002 100
Iran (Islamic Republic of) 2 506 2 104 1 859 15 000 9 133 2 006 77
Iraq 4 352 3 169 2 387 5 554 3 525 1 990 55
Jordan 274 194 151 85 95 2 004 95
Lebanon 1 527 1 203 1 065 178 90
SudanSudan (former) 2 435 1 887 1 481 2 784 1 863 2 000 43
Syrian Arab Republic 1 363 1 051 823 1 238
Regional Office for AfricaRegional Office for Asia andthe PacificRegional Office for Europeand Central AsiaRegional Office for LatinAmerica and the CaribbeanWorld
TABLE 6: LabourEmployment Employment in agriculture Labor force Children in
employment
female male share of total
female male participation rate % of children
ages 7-14share of
femaleemployment
share of
maleemployment
female male total
millionpeople
millionpeople
percent percent percent percent percent percent
2010 2010 2005-12* 2005-12* 2005-12* 2010 2010 2000-12*Regional office for the NearEast and North Africa
24 97 21.6 73.5
Gulf Cooperation CouncilStates and Yemen
4 20 25.8 76.6
Bahrain 0 1 39.2 87.2
Kuwait 0 1 2.7 0.0 3.6 43.3 82.2
Oman 0 1 28.0 79.9
Qatar 0 1 1.6 0.0 2.7 52.1 95.2
Saudi Arabia 1 8 4.1 0.2 4.7 17.4 74.2
United Arab Emirates 1 4 4.2 0.2 5.2 43.7 92.0
Yemen 1 4 24.8 71.7 18.3
North Africa 6 20 21.7 73.2
Algeria 2 8 11.7 6.4 12.6 14.7 71.7
Libya 1 2 30.4 76.9
Mauritania 0 1 28.4 79.1 21.3
Morocco 3 8 40.2 60.2 33.0 25.9 74.7 4.5
Tunisia 1 2 17.7 25.3 69.7
Other Near East Countries 14 57 20.5 72.8
Egypt 5 19 28.2 45.6 28.2 23.5 74.2 7.9
Iran (Islamic Republic of) 4 19 21.2 30.6 19.3 16.1 71.8
Iraq 1 5 23.4 50.7 17.1 14.3 69.3 14.7
Jordan 0 1 2.0 1.0 2.2 15.3 65.4 1.0
Lebanon 0 1 22.5 70.8
Sudan 12.5
Sudan (former) 3 7 30.8 76.5 19.1
Syrian Arab Republic 1 4 14.3 22.2 13.2 12.9 71.6 6.6
Regional Office for Africa 141 169 62.8 76.4
Regional Office for Asia andthe Pacific
728 1 168 49.4 80.0
Regional Office for Europeand Central Asia
175 213 14.1 12.5 13.5 49.9 67.3
Regional Office for Latin
America and the Caribbean
105 155 14.9 9.1 19.7 53.3 80.1
World 1 201 1 820 50.6 77.3
24
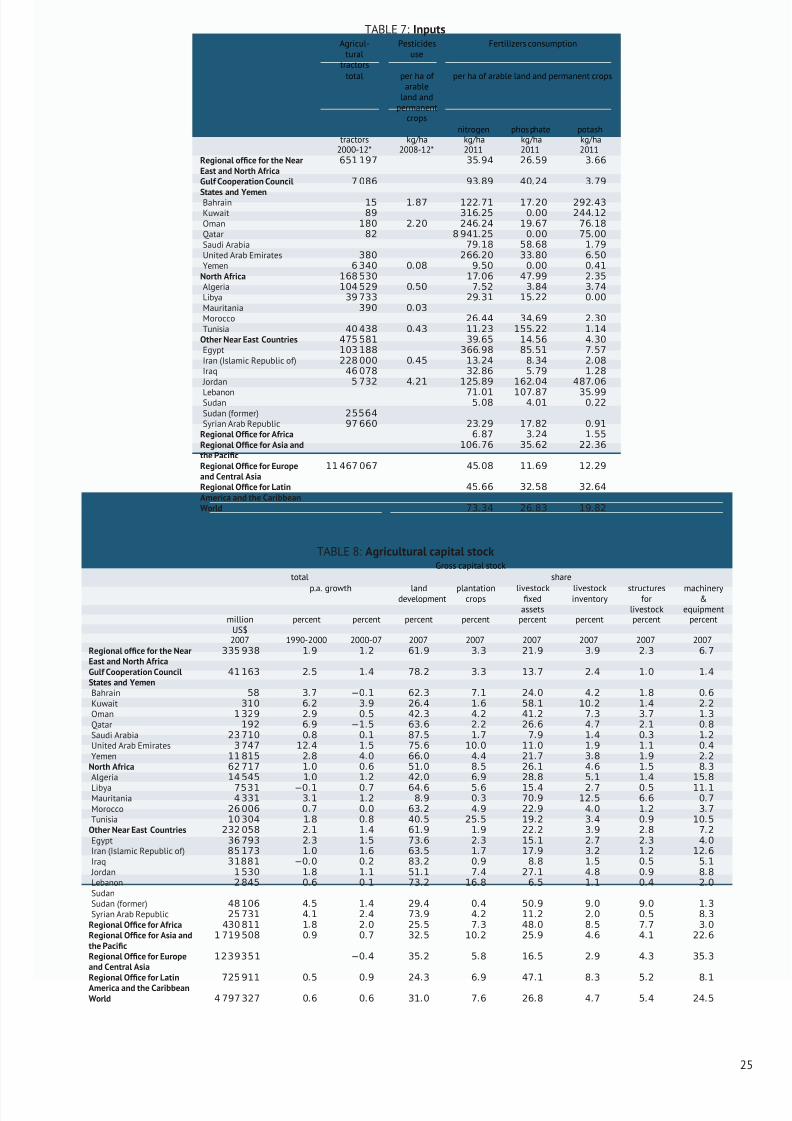
8/12/2019 FAO Statistical Yearbook 2014 Near East and North Africa Food and Agriculture
http://slidepdf.com/reader/full/fao-statistical-yearbook-2014-near-east-and-north-africa-food-and-agriculture 41/174
TABLE 7: InputsAgricul-
turaltractors
Pesticidesuse
Fertilizers consumption
total per ha of arable
land andpermanent
crops
per ha of arable land and permanent crops
nitrogen phos phate potashtractors kg/ha kg/ha kg/ha kg/ha
2000-12* 2008-12* 2011 2011 2011Regional office for the NearEast and North Africa
651 197 35.94 26.59 3.66
Gulf Cooperation Council
States and Yemen
7 086 93.89 40.24 3.79
Bahrain 15 1.87 122.71 17.20 292.43
Kuwait 89 316.25 0.00 244.12
Oman 180 2.20 246.24 19.67 76.18
Qatar 82 8 941.25 0.00 75.00
Saudi Arabia 79.18 58.68 1.79
United Arab Emirates 380 266.20 33.80 6.50
Yemen 6 340 0.08 9.50 0.00 0.41
North Africa 168 530 17.06 47.99 2.35
Algeria 104 529 0.50 7.52 3.84 3.74
Libya 39 733 29.31 15.22 0.00
Mauritania 390 0.03
Morocco 26.44 34.69 2.30
Tunisia 40 438 0.43 11.23 155.22 1.14
Other Near East Countries 475 581 39.65 14.56 4.30
Egypt 103 188 366.98 85.51 7.57
Iran (Islamic Republic of) 228 000 0.45 13.24 8.34 2.08
Iraq 46 078 32.86 5.79 1.28
Jordan 5 732 4.21 125.89 162.04 487.06
Lebanon 71.01 107.87 35.99Sudan 5.08 4.01 0.22
Sudan (former) 25564
Syrian Arab Republic 97 660 23.29 17.82 0.91
Regional Office for Africa 6.87 3.24 1.55
Regional Office for Asia andthe Pacific
106.76 35.62 22.36
Regional Office for Europeand Central Asia
11 467 067 45.08 11.69 12.29
Regional Office for LatinAmerica and the Caribbean
45.66 32.58 32.64
World 73.34 26.83 19.82
TABLE 8: Agricultural capital stockGross capital stock
total share
p.a. growth landdevelopment
plantationcrops
livestockfixed
assets
livestockinventory
structuresfor
livestock
machinery&
equipmentmillion
US$percent percent percent percent percent percent percent percent
2007 1990-2000 2000-07 2007 2007 2007 2007 2007 2007Regional office for the NearEast and North Africa
335 938 1.9 1.2 61.9 3.3 21.9 3.9 2.3 6.7
Gulf Cooperation CouncilStates and Yemen
41 163 2.5 1.4 78.2 3.3 13.7 2.4 1.0 1.4
Bahrain 58 3.7 −0.1 62.3 7.1 24.0 4.2 1.8 0.6
Kuwait 310 6.2 3.9 26.4 1.6 58.1 10.2 1.4 2.2
Oman 1 329 2.9 0.5 42.3 4.2 41.2 7.3 3.7 1.3
Qatar 192 6.9 −1.5 63.6 2.2 26.6 4.7 2.1 0.8
Saudi Arabia 23 710 0.8 0.1 87.5 1.7 7.9 1.4 0.3 1.2
United Arab Emirates 3 747 12.4 1.5 75.6 10.0 11.0 1.9 1.1 0.4
Yemen 11 815 2.8 4.0 66.0 4.4 21.7 3.8 1.9 2.2
North Africa 62 717 1.0 0.6 51.0 8.5 26.1 4.6 1.5 8.3
Algeria 14 545 1.0 1.2 42.0 6.9 28.8 5.1 1.4 15.8
Libya 7531 −0.1 0.7 64.6 5.6 15.4 2.7 0.5 11.1Mauritania 4 331 3.1 1.2 8.9 0.3 70.9 12.5 6.6 0.7
Morocco 26 006 0.7 0.0 63.2 4.9 22.9 4.0 1.2 3.7
Tunisia 10 304 1.8 0.8 40.5 25.5 19.2 3.4 0.9 10.5
Other Near East Countries 232 058 2.1 1.4 61.9 1.9 22.2 3.9 2.8 7.2
Egypt 36 793 2.3 1.5 73.6 2.3 15.1 2.7 2.3 4.0
Iran (Islamic Republic of) 85 173 1.0 1.6 63.5 1.7 17.9 3.2 1.2 12.6
Iraq 31881 −0.0 0.2 83.2 0.9 8.8 1.5 0.5 5.1
Jordan 1 530 1.8 1.1 51.1 7.4 27.1 4.8 0.9 8.8
Lebanon 2 845 0.6 0.1 73.2 16.8 6.5 1.1 0.4 2.0
SudanSudan (former) 48 106 4.5 1.4 29.4 0.4 50.9 9.0 9.0 1.3
Syrian Arab Republic 25 731 4.1 2.4 73.9 4.2 11.2 2.0 0.5 8.3
Regional Office for Africa 430 811 1.8 2.0 25.5 7.3 48.0 8.5 7.7 3.0
Regional Office for Asia andthe Pacific
1 719 508 0.9 0.7 32.5 10.2 25.9 4.6 4.1 22.6
Regional Office for Europeand Central Asia
1239351 −0.4 35.2 5.8 16.5 2.9 4.3 35.3
Regional Office for LatinAmerica and the Caribbean725 911 0.5 0.9 24.3 6.9 47.1 8.3 5.2 8.1
World 4 797 327 0.6 0.6 31.0 7.6 26.8 4.7 5.4 24.5
25
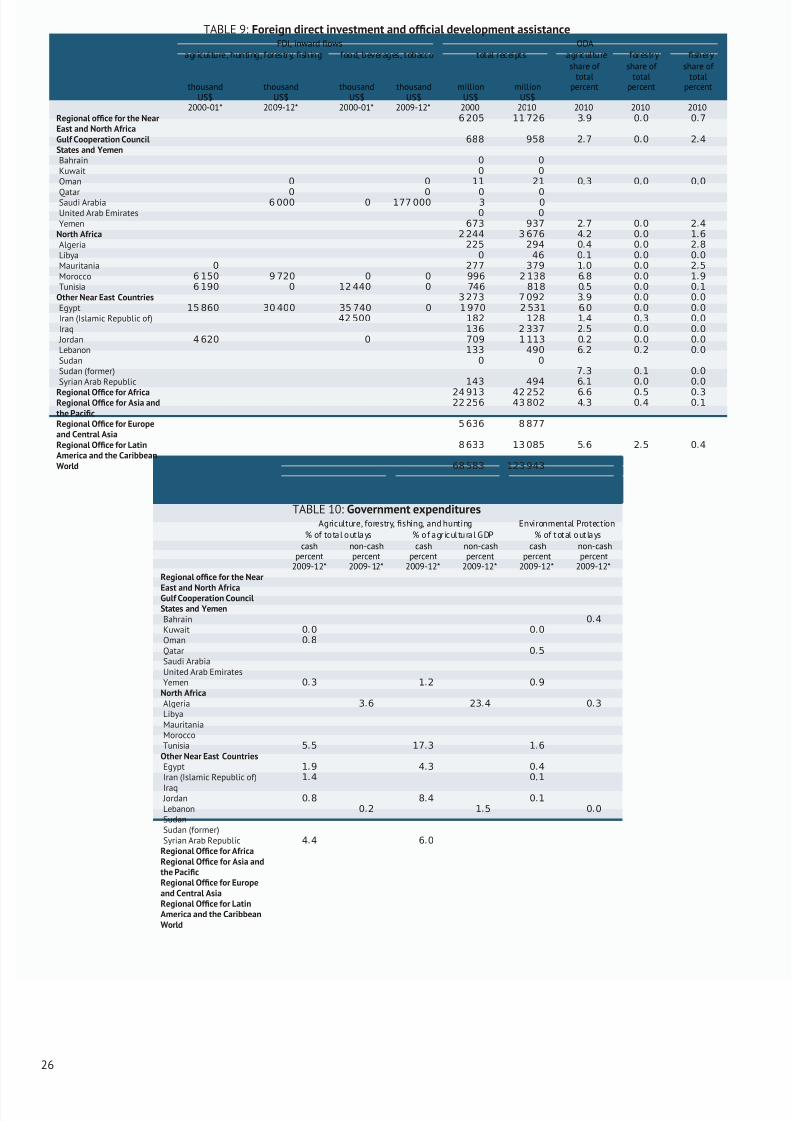
8/12/2019 FAO Statistical Yearbook 2014 Near East and North Africa Food and Agriculture
http://slidepdf.com/reader/full/fao-statistical-yearbook-2014-near-east-and-north-africa-food-and-agriculture 42/174
TABLE 9: Foreign direct investment and official development assistanceFDI, inward flows ODA
agriculture, hunting, forestry, fishing food, beverages, tobacco total receipts agriculture forestry fishery
share of total
share of total
share of total
thousandUS$
thousandUS$
thousandUS$
thousandUS$
millionUS$
millionUS$
percent percent percent
2000-01* 2009-12* 2000-01* 2009-12* 2000 2010 2010 2010 2010Regional office for the NearEast and North Africa
6 205 11 726 3.9 0.0 0.7
Gulf Cooperation CouncilStates and Yemen
688 958 2.7 0.0 2.4
Bahrain 0 0
Kuwait 0 0
Oman 0 0 11 21 0.3 0.0 0.0
Qatar 0 0 0 0
Saudi Arabia 6 000 0 177 000 3 0
United Arab Emirates 0 0
Yemen 673 937 2.7 0.0 2.4
North Africa 2 244 3 676 4.2 0.0 1.6
Algeria 225 294 0.4 0.0 2.8
Libya 0 46 0.1 0.0 0.0
Mauritania 0 277 379 1.0 0.0 2.5
Morocco 6 150 9 720 0 0 996 2 138 6.8 0.0 1.9
Tunisia 6 190 0 12 440 0 746 818 0.5 0.0 0.1
Other Near East Countries 3 273 7 092 3.9 0.0 0.0
Egypt 15 860 30 400 35 740 0 1 970 2 531 6.0 0.0 0.0
Iran (Islamic Republic of) 42 500 182 128 1.4 0.3 0.0
Iraq 136 2 337 2.5 0.0 0.0
Jordan 4 620 0 709 1 113 0.2 0.0 0.0
Lebanon 133 490 6.2 0.2 0.0
Sudan 0 0
Sudan (former) 7.3 0.1 0.0
Syrian Arab Republic 143 494 6.1 0.0 0.0
Regional Office for Africa 24 913 42 252 6.6 0.5 0.3Regional Office for Asia andthe Pacific
22 256 43 802 4.3 0.4 0.1
Regional Office for Europeand Central Asia
5 636 8 877
Regional Office for LatinAmerica and the Caribbean
8 633 13 085 5.6 2.5 0.4
World 68 583 123 943
TABLE 10: Government expendituresAgriculture, forestry, fishing, and hunting Environmental Protection
% of total outlays % of agricultural GDP % of total outlays
cash non-cash cash non-cash cash non-cashpercent percent percent percent percent percent
2009-12* 2009- 12* 2009-12* 2009-12* 2009-12* 2009-12*Regional office for the Near
East and North AfricaGulf Cooperation CouncilStates and YemenBahrain 0.4
Kuwait 0.0 0.0
Oman 0.8
Qatar 0.5
Saudi ArabiaUnited Arab EmiratesYemen 0.3 1.2 0.9
North AfricaAlgeria 3.6 23.4 0.3
LibyaMauritaniaMoroccoTunisia 5.5 17.3 1.6
Other Near East CountriesEgypt 1.9 4.3 0.4
Iran (Islamic Republic of) 1.4 0.1
Iraq Jordan 0.8 8.4 0.1
Lebanon 0.2 1.5 0.0
SudanSudan (former)Syrian Arab Republic 4.4 6.0
Regional Office for AfricaRegional Office for Asia andthe PacificRegional Office for Europeand Central AsiaRegional Office for LatinAmerica and the CaribbeanWorld
26
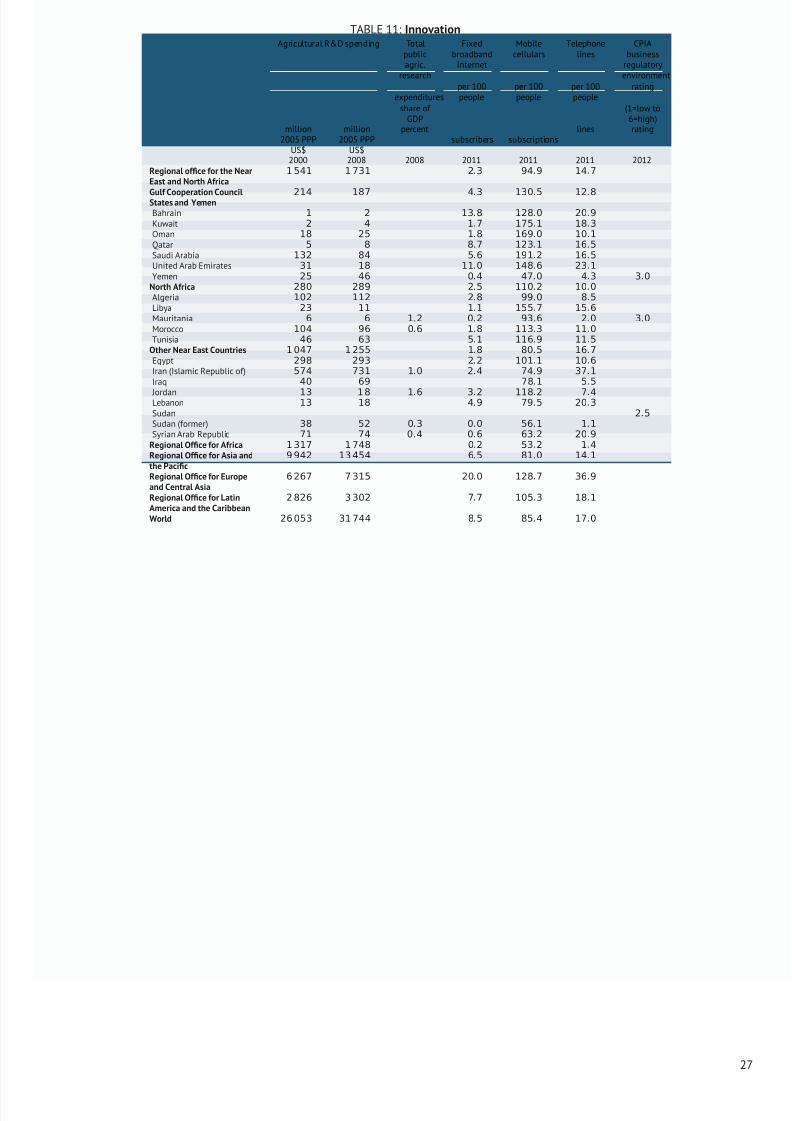
8/12/2019 FAO Statistical Yearbook 2014 Near East and North Africa Food and Agriculture
http://slidepdf.com/reader/full/fao-statistical-yearbook-2014-near-east-and-north-africa-food-and-agriculture 43/174
TABLE 11: InnovationAgricultural R&D spending Total
publicagric.
research
Fixedbroadband
Internet
Mobilecellulars
Telephonelines
CPIAbusiness
regulatoryenvironment
expendituresper 100people
per 100people
per 100people
rating
share of GDP
(1=low to6=high)
million2005 PPP
US$
million2005 PPP
US$
percentsubscribers subscriptions
lines rating
2000 2008 2008 2011 2011 2011 2012Regional office for the NearEast and North Africa
1 541 1 731 2.3 94.9 14.7
Gulf Cooperation CouncilStates and Yemen214 187 4.3 130.5 12.8
Bahrain 1 2 13.8 128.0 20.9
Kuwait 2 4 1.7 175.1 18.3
Oman 18 25 1.8 169.0 10.1
Qatar 5 8 8.7 123.1 16.5
Saudi Arabia 132 84 5.6 191.2 16.5
United Arab Emirates 31 18 11.0 148.6 23.1
Yemen 25 46 0.4 47.0 4.3 3.0
North Africa 280 289 2.5 110.2 10.0
Algeria 102 112 2.8 99.0 8.5
Libya 23 11 1.1 155.7 15.6
Mauritania 6 6 1.2 0.2 93.6 2.0 3.0
Morocco 104 96 0.6 1.8 113.3 11.0
Tunisia 46 63 5.1 116.9 11.5
Other Near East Countries 1 047 1 255 1.8 80.5 16.7
Egypt 298 293 2.2 101.1 10.6
Iran (Islamic Republic of) 574 731 1.0 2.4 74.9 37.1
Iraq 40 69 78.1 5.5
Jordan 13 1 8 1.6 3.2 118.2 7.4Lebanon 13 18 4.9 79.5 20.3
Sudan 2.5
Sudan (former) 38 52 0.3 0.0 56.1 1.1
Syrian Arab Republic 71 74 0 .4 0.6 63.2 20.9
Regional Office for Africa 1 317 1 748 0.2 53.2 1.4
Regional Office for Asia andthe Pacific
9 942 13 454 6.5 81.0 14.1
Regional Office for Europeand Central Asia
6 267 7 315 20.0 128.7 36.9
Regional Office for LatinAmerica and the Caribbean
2 826 3 302 7.7 105.3 18.1
World 26 053 31 744 8.5 85.4 17.0
27

8/12/2019 FAO Statistical Yearbook 2014 Near East and North Africa Food and Agriculture
http://slidepdf.com/reader/full/fao-statistical-yearbook-2014-near-east-and-north-africa-food-and-agriculture 44/174
28
8/12/2019 FAO Statistical Yearbook 2014 Near East and North Africa Food and Agriculture
http://slidepdf.com/reader/full/fao-statistical-yearbook-2014-near-east-and-north-africa-food-and-agriculture 45/174
PART
Hunger dimensions
A total of 842 million people in 2011–13, or more than one in eightpeople in the world, were estimated to be suffering from chronichunger, regularly not getting enough food to conduct an active life.The total number of undernourished has fallen by 17 percent since1990–92. In the Near East and North Africa region, there are 43.7million undernourished people or about 11 percent of the popula-tion.
Although the prevalence of undernourishment offers a first idea of the extent and distribution of hunger in the world, food security is
too complex an issue for all of its dimensions to be caught in a singleindicator. The 2009 Declaration of the World Summit on Food Se-curity states that “Food security exists when all people, at all times,have physical, social and economic access to sufficient, safe and nu-tritious food, which meets their dietary needs and food preferencesfor an active and healthy life.” Based on this definition, four food se-curity dimensions can be identified: food availability, economic andphysical access to food, food utilization and stability (vulnerability
29
8/12/2019 FAO Statistical Yearbook 2014 Near East and North Africa Food and Agriculture
http://slidepdf.com/reader/full/fao-statistical-yearbook-2014-near-east-and-north-africa-food-and-agriculture 46/174
and shocks) over time. To understand the complexity of the problemof food insecurity and identify measures for addressing it, all its di-mensions, manifestations, and underlying factors have to be assessed
and measured.
Food insecurity can be caused by insufficient supply of food or in-sufficient access to the food supply. Poverty plays an important rolein determining access to food, but the relationship between povertyand food insecurity is not always straightforward. Food security isalso conditioned by food prices and other social and economic fac-tors and can be affected, often very significantly, by political insta-bility and the presence of natural hazards. An inadequate diet mayalso result from a lack of vitamins or micronutrients or an imbalancein the availability of macronutrients. Food insecurity can arise evenwhen a sufficient and balanced diet is available, because of unsafeor unhealthy foods.
To understand the complexity of the problem, underlying factors haveto be assessed and measured. FAO has compiled a suite of indica-tors that supplements measurements of the number and prevalenceof undernourishment to capture the multifaceted character of foodinsecurity. Indicator selection is also shaped by the availability of reliable data and the possibility of establishing meaningful compar-isons across regions and time periods. Some indicators look at food
insecurity as an outcome: this is the case of the number of undernour-ished people, the prevalence of undernourishment in the population,the extent of nutrition gaps, and anthropometric evidence. Other in-dicators focus on the conditions that generate food insecurity, suchas poverty; food availability, access, affordability and utilization; andvulnerability and instability.
This chapter presents the main food security indicators computed byFAO, starting from outcomes and moving on to consider the condi-tions that characterize and can generate food insecurity. The pres-
ence of several indicators for one phenomenon poses significant mea-surement challenges. One challenge is consistently summarizing theinformation conveyed by multiple indicators; another is understand-ing how they relate to each other. The following sections outlinesome of the associations and regularities that emerge among differ-ent indicators for the Near East and North Africa region. These aremeant to signal areas for further investigation, and do not necessarilyimply formal or causal relationships.
30
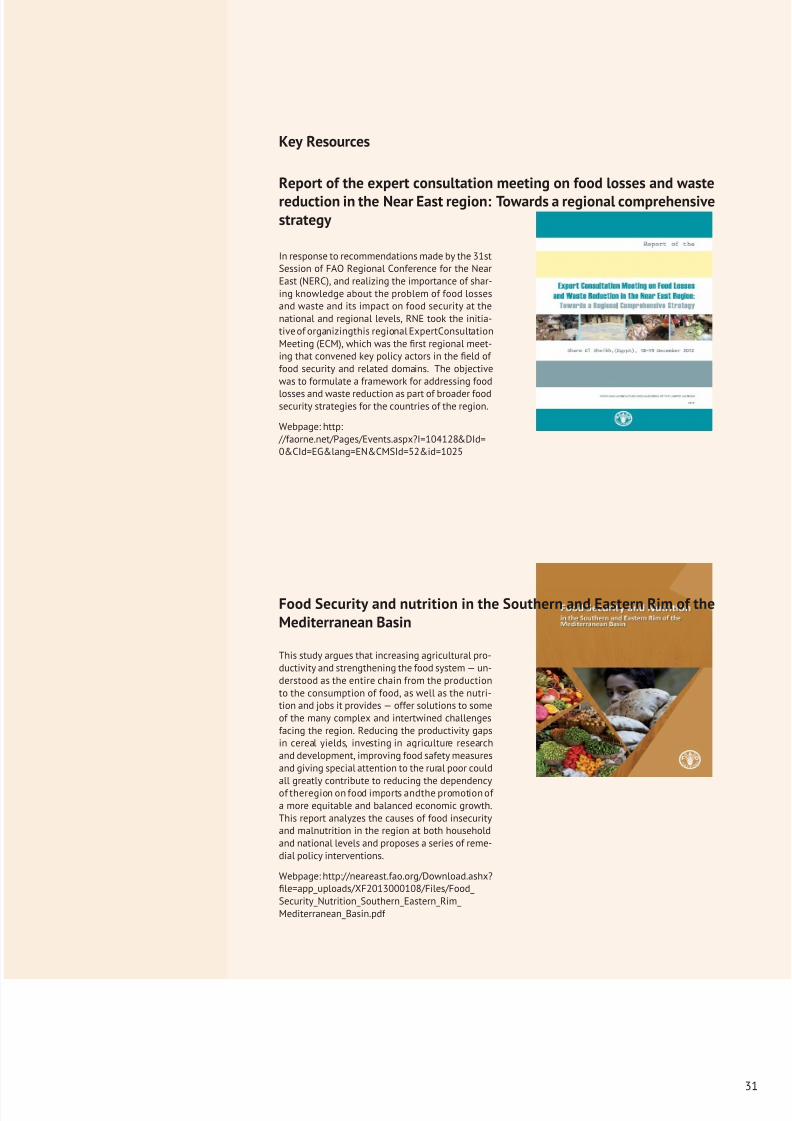
8/12/2019 FAO Statistical Yearbook 2014 Near East and North Africa Food and Agriculture
http://slidepdf.com/reader/full/fao-statistical-yearbook-2014-near-east-and-north-africa-food-and-agriculture 47/174
Key Resources
Report of the expert consultation meeting on food losses and waste
reduction in the Near East region: Towards a regional comprehensivestrategy
In response to recommendations made by the 31stSession of FAO Regional Conference for the NearEast (NERC), and realizing the importance of shar-ing knowledge about the problem of food lossesand waste and its impact on food security at thenational and regional levels, RNE took the initia-tive of organizingthis regional ExpertConsultationMeeting (ECM), which was the first regional meet-ing that convened key policy actors in the field of food security and related domains. The objectivewas to formulate a framework for addressing food
losses and waste reduction as part of broader foodsecurity strategies for the countries of the region.
Webpage: http: //faorne.net/Pages/Events.aspx?I=104128&DId=0&CId=EG&lang=EN&CMSId=52&id=1025
Food Security and nutrition in the Southern and Eastern Rim of theMediterranean Basin
This study argues that increasing agricultural pro-ductivity and strengthening the food system — un-derstood as the entire chain from the productionto the consumption of food, as well as the nutri-tion and jobs it provides — offer solutions to someof the many complex and intertwined challengesfacing the region. Reducing the productivity gapsin cereal yields, investing in agriculture researchand development, improving food safety measuresand giving special attention to the rural poor could
all greatly contribute to reducing the dependencyof theregion on food imports andthe promotion of a more equitable and balanced economic growth.This report analyzes the causes of food insecurityand malnutrition in the region at both householdand national levels and proposes a series of reme-dial policy interventions.
Webpage: http://neareast.fao.org/Download.ashx?file=app_uploads/XF2013000108/Files/Food_Security_Nutrition_Southern_Eastern_Rim_Mediterranean_Basin.pdf
31
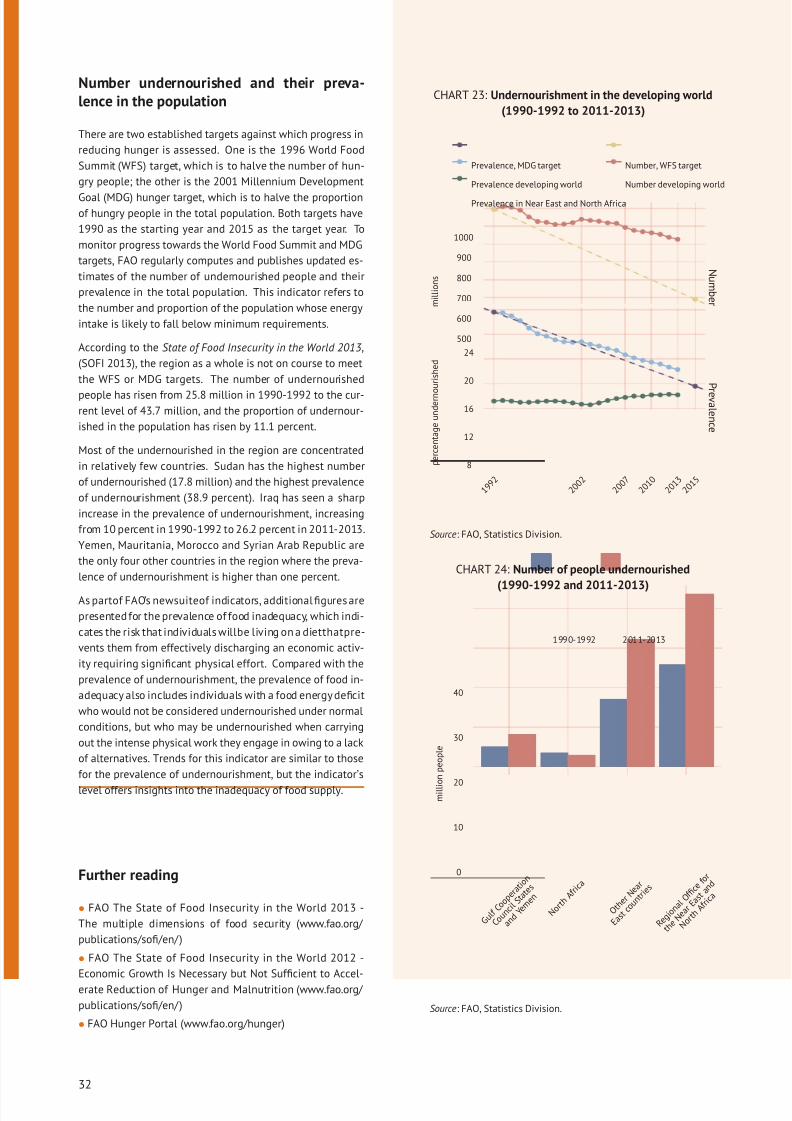
8/12/2019 FAO Statistical Yearbook 2014 Near East and North Africa Food and Agriculture
http://slidepdf.com/reader/full/fao-statistical-yearbook-2014-near-east-and-north-africa-food-and-agriculture 48/174
Number undernourished and their preva-lence in the population
There are two established targets against which progress in
reducing hunger is assessed. One is the 1996 World Food
Summit (WFS) target, which is to halve the number of hun-
gry people; the other is the 2001 Millennium Development
Goal (MDG) hunger target, which is to halve the proportionof hungry people in the total population. Both targets have
1990 as the starting year and 2015 as the target year. To
monitor progress towards the World Food Summit and MDG
targets, FAO regularly computes and publishes updated es-
timates of the number of undernourished people and their
prevalence in the total population. This indicator refers to
the number and proportion of the population whose energy
intake is likely to fall below minimum requirements.
According to the State of Food Insecurity in the World 2013 ,
(SOFI 2013), the region as a whole is not on course to meet
the WFS or MDG targets. The number of undernourished
people has risen from 25.8 million in 1990-1992 to the cur-rent level of 43.7 million, and the proportion of undernour-
ished in the population has risen by 11.1 percent.
Most of the undernourished in the region are concentrated
in relatively few countries. Sudan has the highest number
of undernourished (17.8 million) and the highest prevalence
of undernourishment (38.9 percent). Iraq has seen a sharp
increase in the prevalence of undernourishment, increasing
from 10 percent in 1990-1992 to 26.2 percent in 2011-2013.
Yemen, Mauritania, Morocco and Syrian Arab Republic are
the only four other countries in the region where the preva-
lence of undernourishment is higher than one percent.
As partof FAO’s newsuiteof indicators, additional figures are
presented for the prevalence of food inadequacy, which indi-
cates the risk that individuals willbe living on a dietthatpre-
vents them from effectively discharging an economic activ-
ity requiring significant physical effort. Compared with the
prevalence of undernourishment, the prevalence of food in-
adequacy also includes individuals with a food energy deficit
who would not be considered undernourished under normal
conditions, but who may be undernourished when carrying
out the intense physical work they engage in owing to a lack
of alternatives. Trends for this indicator are similar to those
for the prevalence of undernourishment, but the indicator’s
level offers insights into the inadequacy of food supply.
Further reading
• FAO The State of Food Insecurity in the World 2013 -
The multiple dimensions of food security (www.fao.org/
publications/sofi/en/ )
• FAO The State of Food Insecurity in the World 2012 -
Economic Growth Is Necessary but Not Sufficient to Accel-
erate Reduction of Hunger and Malnutrition (www.fao.org/
publications/sofi/en/ )
• FAO Hunger Portal (www.fao.org/hunger)
CHART 23: Undernourishment in the developing world
(1990-1992 to 2011-2013)
500
600
700
800
900
1000
8
12
16
20
24
N um b e r
P r e v a l e n c e
1 9 9 2
2 0 0 2
2 0 0 7
2 0 1 0
2 0 1 3
2 0 1 5
p e r c e n t a g e u n d e r n o
u r i s h e d
m i l l i o n s
Prevalence, MDG target
Prevalence developing world
Prevalence in Near East and North Africa
Number, WFS target
Number developing world
Source: FAO, Statistics Division.
CHART 24: Number of people undernourished
(1990-1992 and 2011-2013)
0
10
20
30
40
G u l f
C o o p
e r a t
i o n
C o u n
c i l S t a t
e s
a n d
Y e m
e n
N o r t h
A f r i c
a
O t h e
r N e a
r
E a s t
c o u n
t r i e s
R e g i o n
a l O f
fi c e f o r
t h e N e
a r E a
s t a n
d
N o r t h
A f r i c
a
m i l l i o n p e o p l e
1990-1992 2011-2013
Source: FAO, Statistics Division.
32
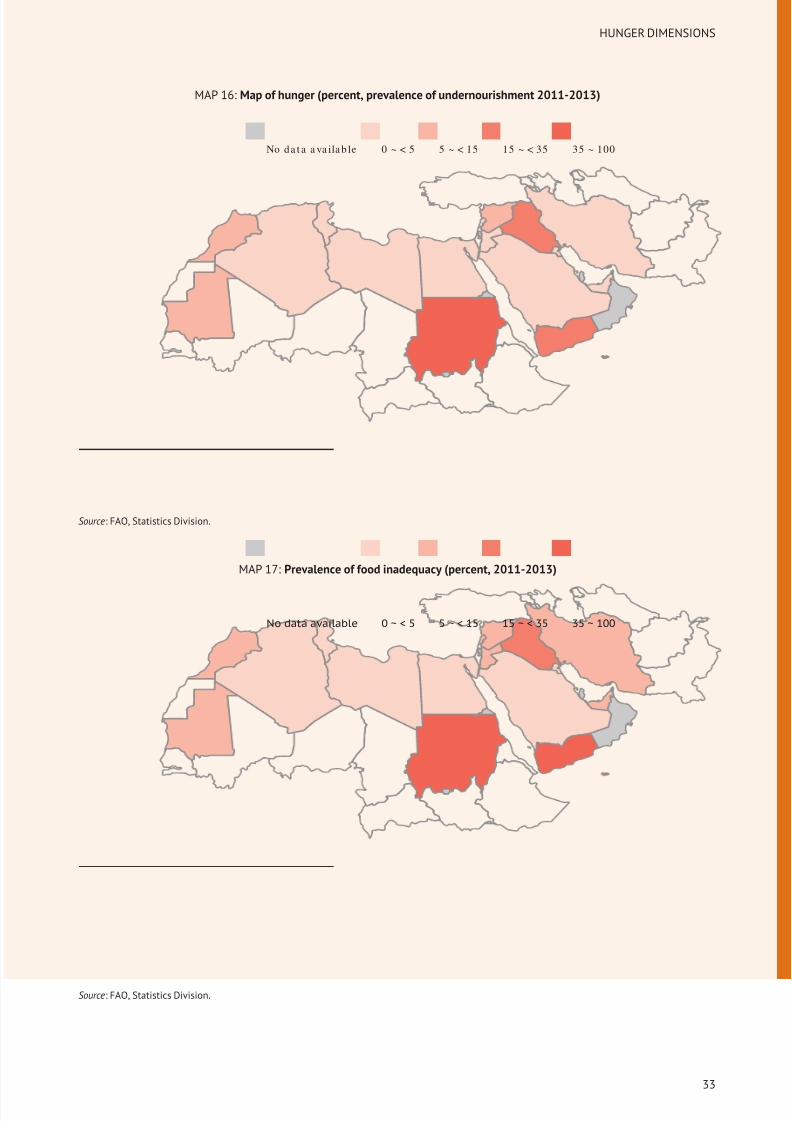
8/12/2019 FAO Statistical Yearbook 2014 Near East and North Africa Food and Agriculture
http://slidepdf.com/reader/full/fao-statistical-yearbook-2014-near-east-and-north-africa-food-and-agriculture 49/174
HUNGER DIMENSIONS
MAP 16: Map of hunger (percent, prevalence of undernourishment 2011-2013)
No da t a a va ila b le 0 ~ < 5 5 ~ < 15 15 ~ < 35 35 ~ 100
Source: FAO, Statistics Division.
MAP 17: Prevalence of food inadequacy (percent, 2011-2013)
No data available 0 ~ < 5 5 ~ < 15 15 ~ < 35 35 ~ 100
Source: FAO, Statistics Division.
33
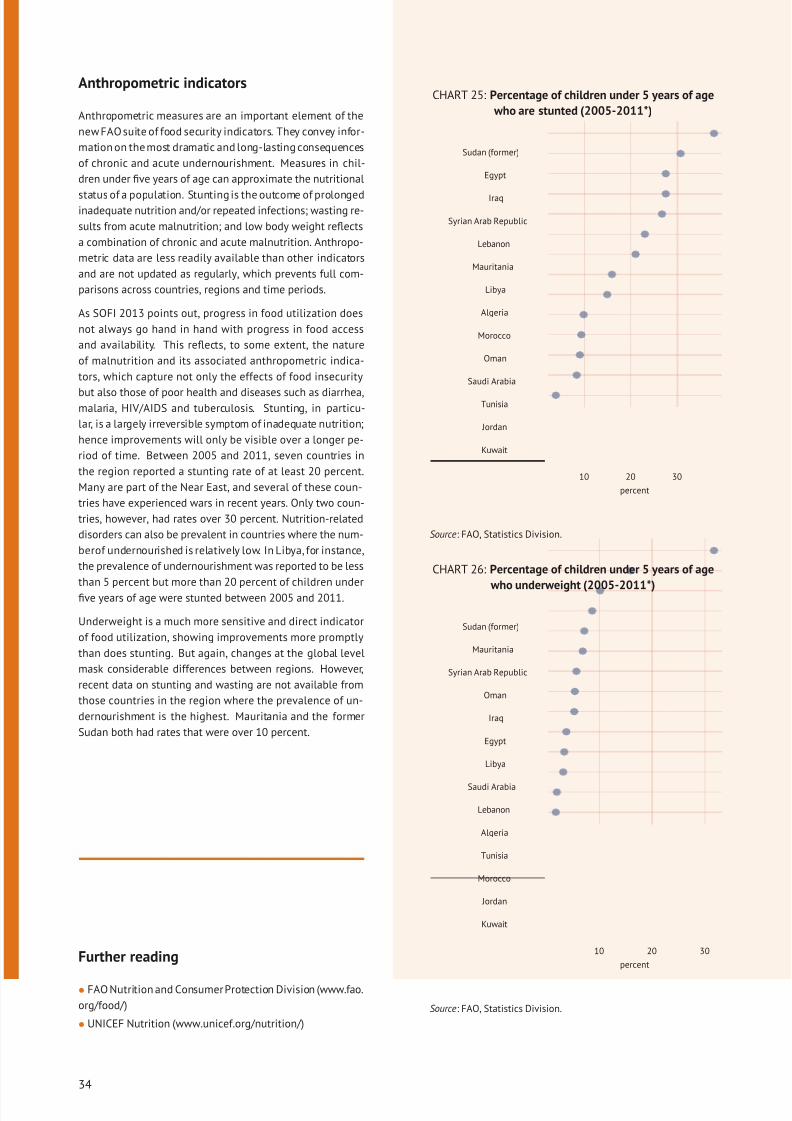
8/12/2019 FAO Statistical Yearbook 2014 Near East and North Africa Food and Agriculture
http://slidepdf.com/reader/full/fao-statistical-yearbook-2014-near-east-and-north-africa-food-and-agriculture 50/174
Anthropometric indicators
Anthropometric measures are an important element of the
new FAO suite of food security indicators. They convey infor-
mation on the most dramatic and long-lasting consequences
of chronic and acute undernourishment. Measures in chil-
dren under five years of age can approximate the nutritional
status of a population. Stunting is the outcome of prolongedinadequate nutrition and/or repeated infections; wasting re-
sults from acute malnutrition; and low body weight reflects
a combination of chronic and acute malnutrition. Anthropo-
metric data are less readily available than other indicators
and are not updated as regularly, which prevents full com-
parisons across countries, regions and time periods.
As SOFI 2013 points out, progress in food utilization does
not always go hand in hand with progress in food access
and availability. This reflects, to some extent, the nature
of malnutrition and its associated anthropometric indica-
tors, which capture not only the effects of food insecurity
but also those of poor health and diseases such as diarrhea,malaria, HIV/AIDS and tuberculosis. Stunting, in particu-
lar, is a largely irreversible symptom of inadequate nutrition;
hence improvements will only be visible over a longer pe-
riod of time. Between 2005 and 2011, seven countries in
the region reported a stunting rate of at least 20 percent.
Many are part of the Near East, and several of these coun-
tries have experienced wars in recent years. Only two coun-
tries, however, had rates over 30 percent. Nutrition-related
disorders can also be prevalent in countries where the num-
berof undernourished is relatively low. In Libya, for instance,
the prevalence of undernourishment was reported to be less
than 5 percent but more than 20 percent of children under
five years of age were stunted between 2005 and 2011.
Underweight is a much more sensitive and direct indicator
of food utilization, showing improvements more promptly
than does stunting. But again, changes at the global level
mask considerable differences between regions. However,
recent data on stunting and wasting are not available from
those countries in the region where the prevalence of un-
dernourishment is the highest. Mauritania and the former
Sudan both had rates that were over 10 percent.
Further reading
• FAO Nutrition and Consumer Protection Division (www.fao.
org/food/)
• UNICEF Nutrition (www.unicef.org/nutrition/)
CHART 25: Percentage of children under 5 years of age
who are stunted (2005-2011*)
Kuwait
Jordan
Tunisia
Saudi Arabia
Oman
Morocco
Algeria
Libya
Mauritania
Lebanon
Syrian Arab Republic
Iraq
Egypt
Sudan (former)
10 20 30
percent
Source: FAO, Statistics Division.
CHART 26: Percentage of children under 5 years of age
who underweight (2005-2011*)
Kuwait
Jordan
Morocco
Tunisia
Algeria
Lebanon
Saudi Arabia
Libya
Egypt
Iraq
Oman
Syrian Arab Republic
Mauritania
Sudan (former)
10 20 30
percent
Source: FAO, Statistics Division.
34
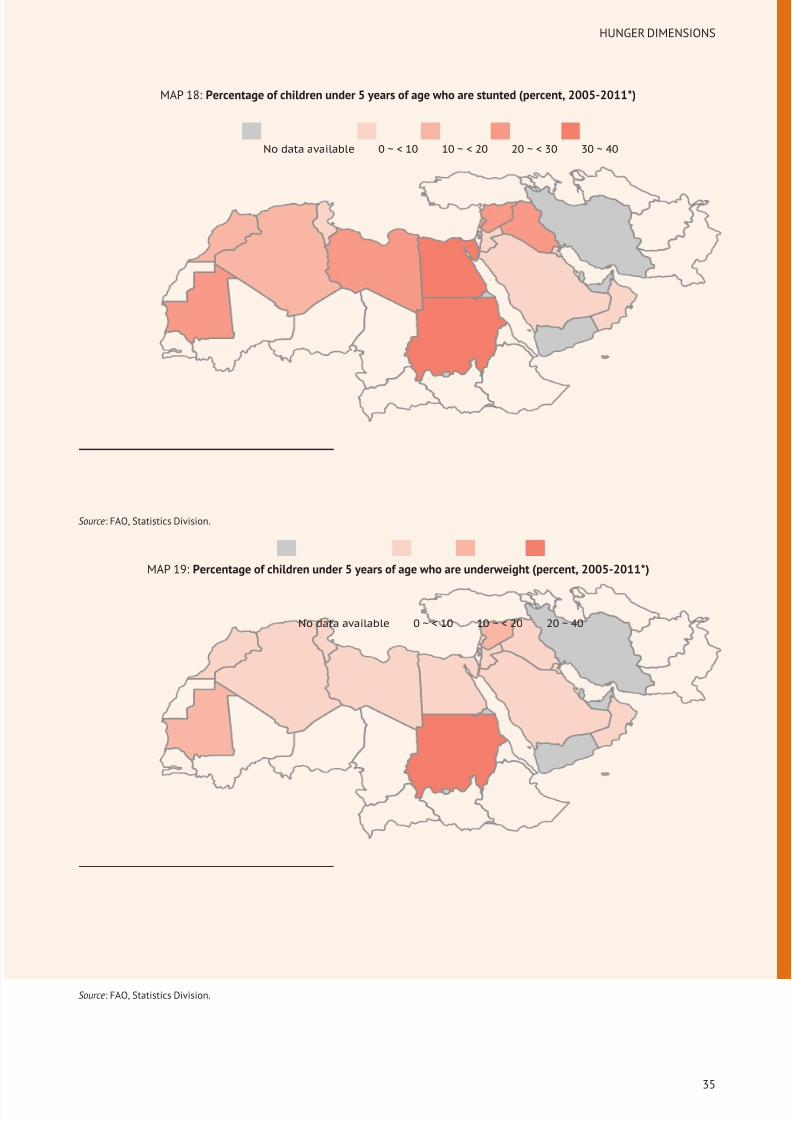
8/12/2019 FAO Statistical Yearbook 2014 Near East and North Africa Food and Agriculture
http://slidepdf.com/reader/full/fao-statistical-yearbook-2014-near-east-and-north-africa-food-and-agriculture 51/174
HUNGER DIMENSIONS
MAP 18: Percentage of children under 5 years of age who are stunted (percent, 2005-2011*)
No data available 0 ~ < 10 10 ~ < 20 20 ~ < 30 30 ~ 40
Source: FAO, Statistics Division.
MAP 19: Percentage of children under 5 years of age who are underweight (percent, 2005-2011*)
No data available 0 ~ < 10 10 ~ < 20 20 ~ 40
Source: FAO, Statistics Division.
35
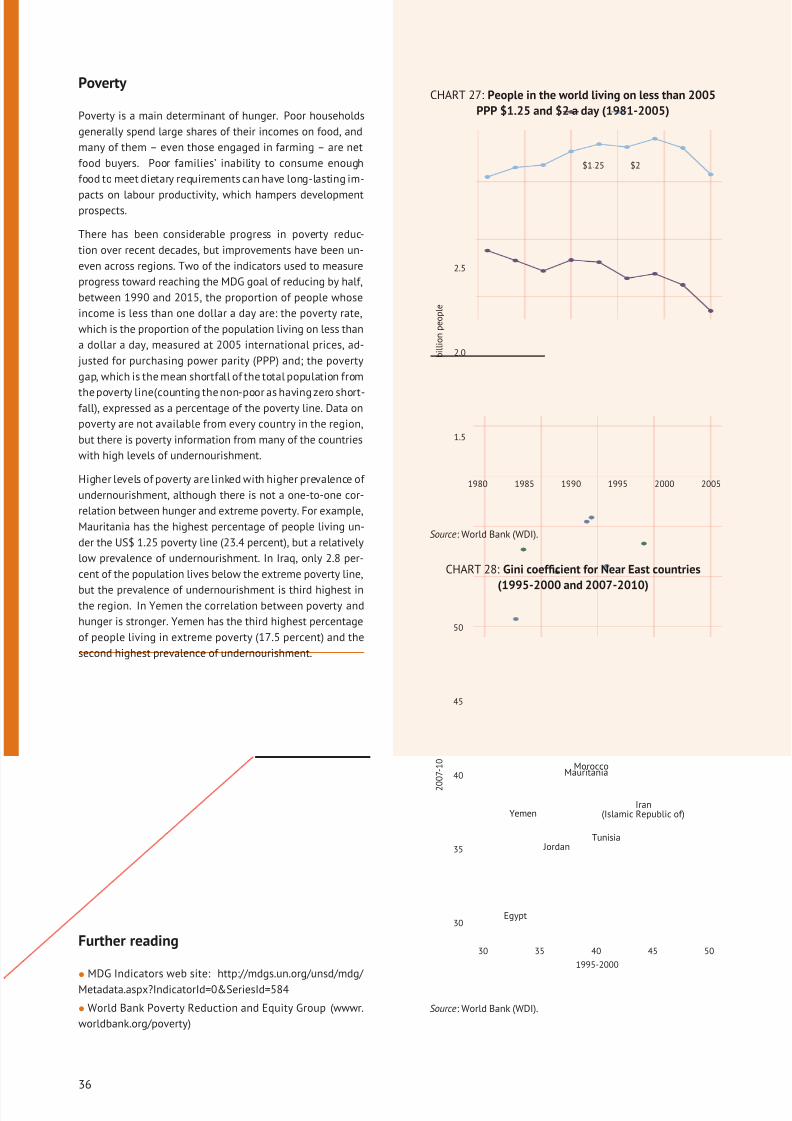
8/12/2019 FAO Statistical Yearbook 2014 Near East and North Africa Food and Agriculture
http://slidepdf.com/reader/full/fao-statistical-yearbook-2014-near-east-and-north-africa-food-and-agriculture 52/174
Poverty
Poverty is a main determinant of hunger. Poor households
generally spend large shares of their incomes on food, and
many of them – even those engaged in farming – are net
food buyers. Poor families’ inability to consume enough
food to meet dietary requirements can have long-lasting im-
pacts on labour productivity, which hampers developmentprospects.
There has been considerable progress in poverty reduc-
tion over recent decades, but improvements have been un-
even across regions. Two of the indicators used to measure
progress toward reaching the MDG goal of reducing by half,
between 1990 and 2015, the proportion of people whose
income is less than one dollar a day are: the poverty rate,
which is the proportion of the population living on less than
a dollar a day, measured at 2005 international prices, ad-
justed for purchasing power parity (PPP) and; the poverty
gap, which is the mean shortfall of the total population from
the poverty line(counting the non-poor as having zero short-fall), expressed as a percentage of the poverty line. Data on
poverty are not available from every country in the region,
but there is poverty information from many of the countries
with high levels of undernourishment.
Higher levels of poverty are linked with higher prevalence of
undernourishment, although there is not a one-to-one cor-
relation between hunger and extreme poverty. For example,
Mauritania has the highest percentage of people living un-
der the US$ 1.25 poverty line (23.4 percent), but a relatively
low prevalence of undernourishment. In Iraq, only 2.8 per-
cent of the population lives below the extreme poverty line,
but the prevalence of undernourishment is third highest inthe region. In Yemen the correlation between poverty and
hunger is stronger. Yemen has the third highest percentage
of people living in extreme poverty (17.5 percent) and the
second highest prevalence of undernourishment.
Further reading
• MDG Indicators web site: http://mdgs.un.org/unsd/mdg/
Metadata.aspx?IndicatorId=0&SeriesId=584
• World Bank Poverty Reduction and Equity Group (wwwr.
worldbank.org/poverty)
CHART 27: People in the world living on less than 2005
PPP $1.25 and $2 a day (1981-2005)
1.5
2.0
2.5
1980 1985 1990 1995 2000 2005
b i l l i o n p e o p l e
$1.25 $2
Source: World Bank (WDI).
CHART 28: Gini coefficient for Near East countries
(1995-2000 and 2007-2010)
Egypt
Iran(Islamic Republic of)
Jordan
MauritaniaMorocco
Tunisia
Yemen
30
35
40
45
50
30 35 40 45 50
1995-2000
2 0
0 7 - 1 0
Source: World Bank (WDI).
36
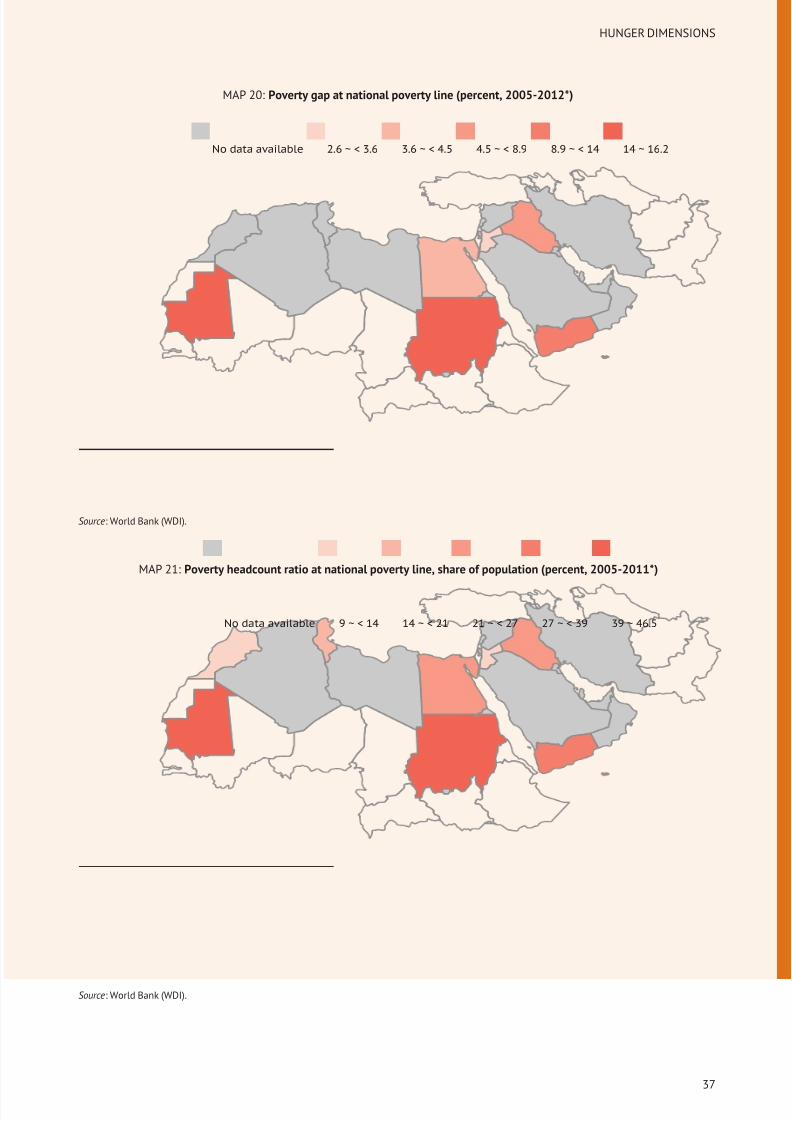
8/12/2019 FAO Statistical Yearbook 2014 Near East and North Africa Food and Agriculture
http://slidepdf.com/reader/full/fao-statistical-yearbook-2014-near-east-and-north-africa-food-and-agriculture 53/174
HUNGER DIMENSIONS
MAP 20: Poverty gap at national poverty line (percent, 2005-2012*)
No data available 2.6 ~ < 3.6 3.6 ~ < 4.5 4.5 ~ < 8.9 8.9 ~ < 14 14 ~ 16.2
Source: World Bank (WDI).
MAP 21: Poverty headcount ratio at national poverty line, share of population (percent, 2005-2011*)
No data available 9 ~ < 14 14 ~ < 21 21 ~ < 27 27 ~ < 39 39 ~ 46.5
Source: World Bank (WDI).
37
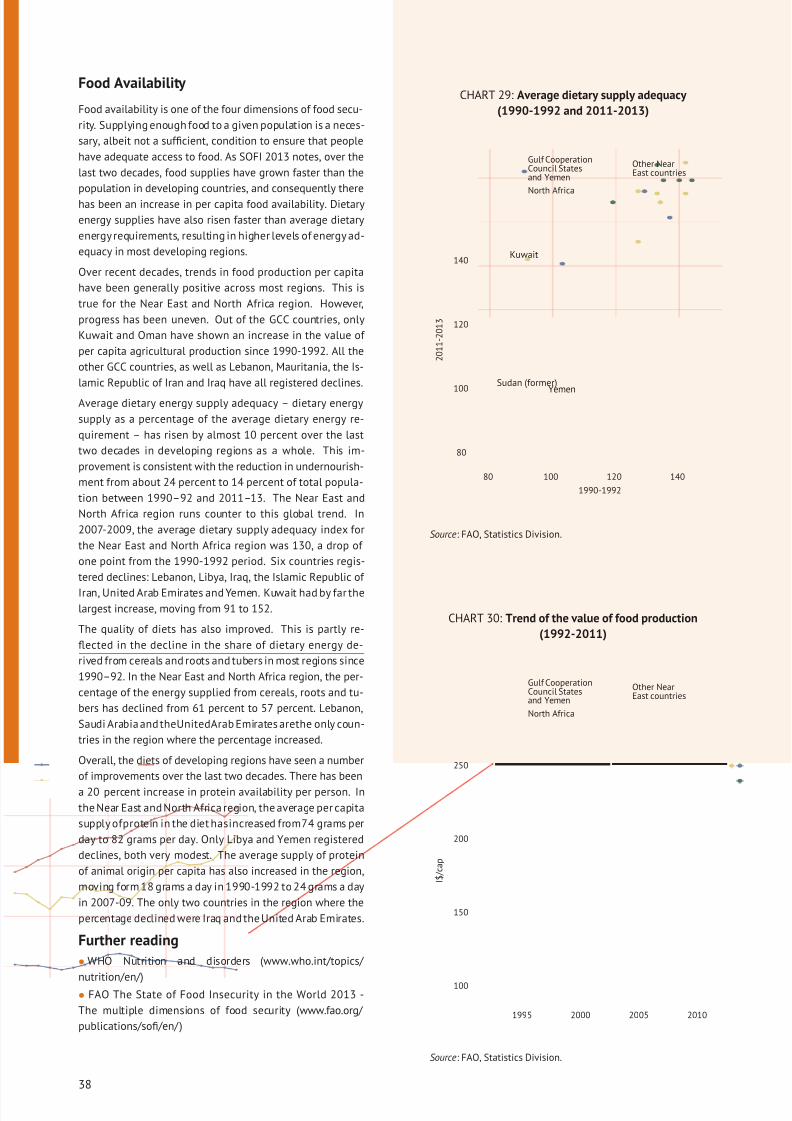
8/12/2019 FAO Statistical Yearbook 2014 Near East and North Africa Food and Agriculture
http://slidepdf.com/reader/full/fao-statistical-yearbook-2014-near-east-and-north-africa-food-and-agriculture 54/174
Food Availability
Food availability is one of the four dimensions of food secu-
rity. Supplying enough food to a given population is a neces-
sary, albeit not a sufficient, condition to ensure that people
have adequate access to food. As SOFI 2013 notes, over the
last two decades, food supplies have grown faster than the
population in developing countries, and consequently there
has been an increase in per capita food availability. Dietary
energy supplies have also risen faster than average dietary
energy requirements, resulting in higher levels of energy ad-
equacy in most developing regions.
Over recent decades, trends in food production per capita
have been generally positive across most regions. This is
true for the Near East and North Africa region. However,
progress has been uneven. Out of the GCC countries, only
Kuwait and Oman have shown an increase in the value of
per capita agricultural production since 1990-1992. All the
other GCC countries, as well as Lebanon, Mauritania, the Is-
lamic Republic of Iran and Iraq have all registered declines.
Average dietary energy supply adequacy – dietary energy
supply as a percentage of the average dietary energy re-
quirement – has risen by almost 10 percent over the last
two decades in developing regions as a whole. This im-
provement is consistent with the reduction in undernourish-
ment from about 24 percent to 14 percent of total popula-
tion between 1990–92 and 2011–13. The Near East and
North Africa region runs counter to this global trend. In
2007-2009, the average dietary supply adequacy index for
the Near East and North Africa region was 130, a drop of
one point from the 1990-1992 period. Six countries regis-
tered declines: Lebanon, Libya, Iraq, the Islamic Republic of
Iran, United Arab Emirates and Yemen. Kuwait had by far thelargest increase, moving from 91 to 152.
The quality of diets has also improved. This is partly re-
flected in the decline in the share of dietary energy de-
rived from cereals and roots and tubers in most regions since
1990–92. In the Near East and North Africa region, the per-
centage of the energy supplied from cereals, roots and tu-
bers has declined from 61 percent to 57 percent. Lebanon,
Saudi Arabia and theUnitedArab Emirates arethe only coun-
tries in the region where the percentage increased.
Overall, the diets of developing regions have seen a number
of improvements over the last two decades. There has been
a 20 percent increase in protein availability per person. In
the Near East and North Africa region, the average per capita
supply ofprotein in the diet hasincreased from74 grams per
day to 82 grams per day. Only Libya and Yemen registered
declines, both very modest. The average supply of protein
of animal origin per capita has also increased in the region,
moving form 18 grams a day in 1990-1992 to 24 grams a day
in 2007-09. The only two countries in the region where the
percentage declined were Iraq and the United Arab Emirates.
Further reading
• WHO Nutrition and disorders (www.who.int/topics/
nutrition/en/)• FAO The State of Food Insecurity in the World 2013 -
The multiple dimensions of food security (www.fao.org/
publications/sofi/en/ )
CHART 29: Average dietary supply adequacy
(1990-1992 and 2011-2013)
Kuwait
Sudan (former)
Yemen
80
100
120
140
80 100 120 140
1990-1992
2 0 1 1 - 2 0 1 3
Gulf CooperationCouncil Statesand Yemen
North Africa
Other NearEast countries
Source: FAO, Statistics Division.
CHART 30: Trend of the value of food production
(1992-2011)
100
150
200
250
1995 2000 2005 2010
I $ / c a p
Gulf CooperationCouncil Statesand Yemen
North Africa
Other NearEast countries
Source: FAO, Statistics Division.
38
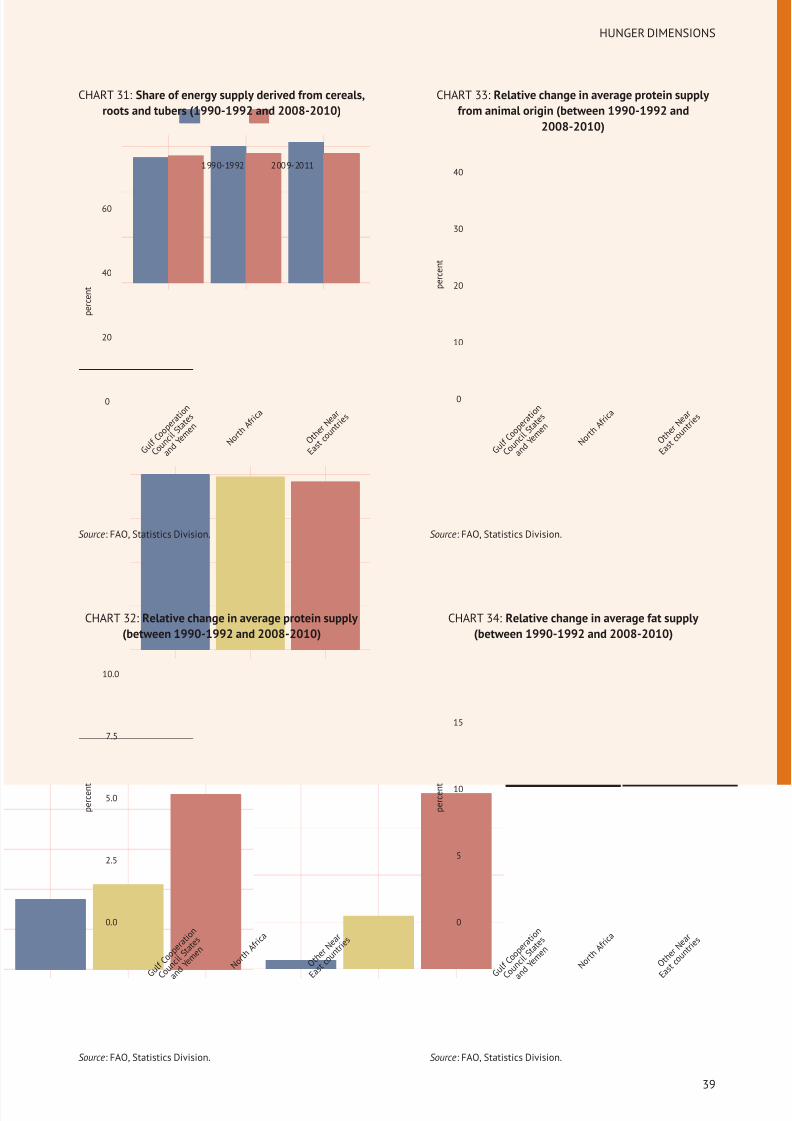
8/12/2019 FAO Statistical Yearbook 2014 Near East and North Africa Food and Agriculture
http://slidepdf.com/reader/full/fao-statistical-yearbook-2014-near-east-and-north-africa-food-and-agriculture 55/174
HUNGER DIMENSIONS
CHART 31: Share of energy supply derived from cereals,
roots and tubers (1990-1992 and 2008-2010)
0
20
40
60
G u l f
C o o p
e r a t
i o n
C o u n
c i l S t a
t e s
a n d
Y e m
e n
N o r t h
A f r i c
a
O t h e
r N e a
r
E a s t
c o u n
t r i e s
p e r c e n t
1990-1992 2009-2011
Source: FAO, Statistics Division.
CHART 32: Relative change in average protein supply
(between 1990-1992 and 2008-2010)
0.0
2.5
5.0
7.5
10.0
G u l f
C o o p
e r a t
i o n
C o u n
c i l S t a
t e s
a n d
Y e m
e n
N o r t h
A f r i c
a
O t h e
r N e a
r
E a s t
c o u n
t r i e s
p e r c e n t
Source: FAO, Statistics Division.
CHART 33: Relative change in average protein supply
from animal origin (between 1990-1992 and
2008-2010)
0
10
20
30
40
G u l f
C o o p
e r a t
i o n
C o u n
c i l S t a
t e s
a n d
Y e m
e n
N o r t h
A f r i c
a
O t h e
r N e a
r
E a s t
c o u n
t r i e s
p e r c e n t
Source: FAO, Statistics Division.
CHART 34: Relative change in average fat supply
(between 1990-1992 and 2008-2010)
0
5
10
15
G u l f
C o o p
e r a t
i o n
C o u n
c i l S t a
t e s
a n d
Y e m
e n
N o r t h
A f r i c
a
O t h e
r N e a
r
E a s t
c o u n
t r i e s
p e r c e n t
Source: FAO, Statistics Division.
39
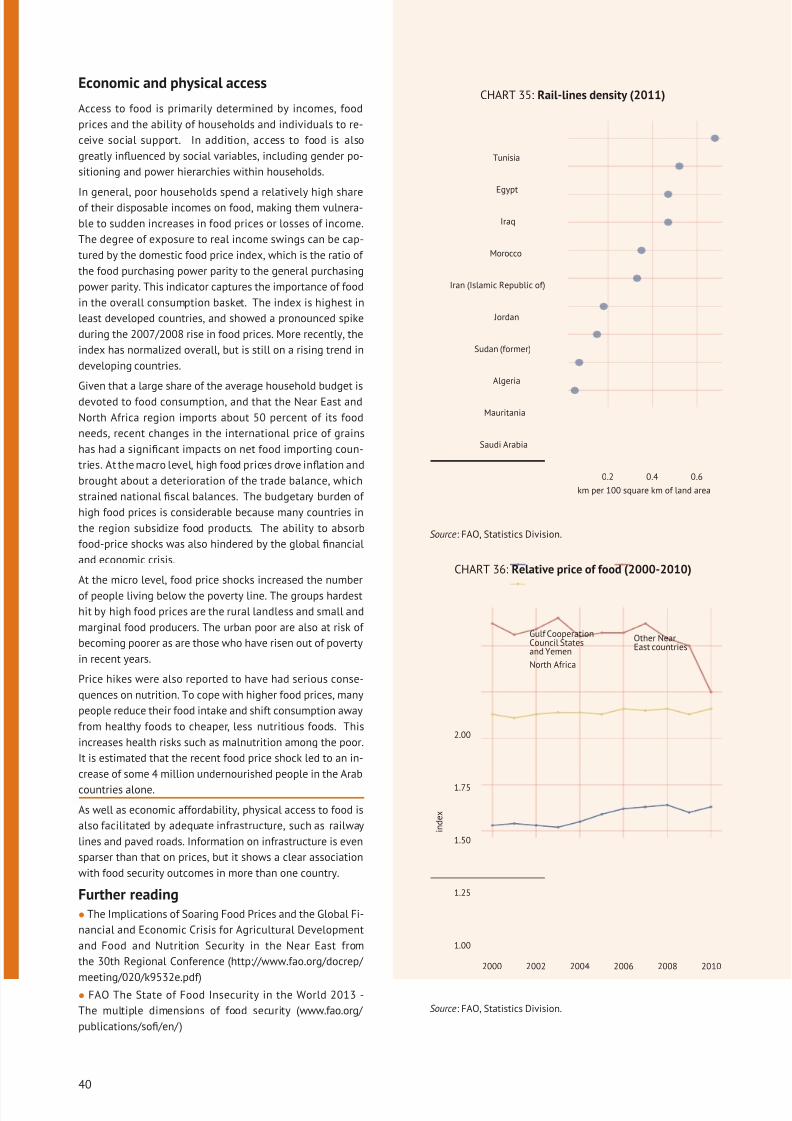
8/12/2019 FAO Statistical Yearbook 2014 Near East and North Africa Food and Agriculture
http://slidepdf.com/reader/full/fao-statistical-yearbook-2014-near-east-and-north-africa-food-and-agriculture 56/174
Economic and physical access
Access to food is primarily determined by incomes, food
prices and the ability of households and individuals to re-
ceive social support. In addition, access to food is also
greatly influenced by social variables, including gender po-
sitioning and power hierarchies within households.
In general, poor households spend a relatively high shareof their disposable incomes on food, making them vulnera-
ble to sudden increases in food prices or losses of income.
The degree of exposure to real income swings can be cap-
tured by the domestic food price index, which is the ratio of
the food purchasing power parity to the general purchasing
power parity. This indicator captures the importance of food
in the overall consumption basket. The index is highest in
least developed countries, and showed a pronounced spike
during the 2007/2008 rise in food prices. More recently, the
index has normalized overall, but is still on a rising trend in
developing countries.
Given that a large share of the average household budget is
devoted to food consumption, and that the Near East and
North Africa region imports about 50 percent of its food
needs, recent changes in the international price of grains
has had a significant impacts on net food importing coun-
tries. At the macro level, high food prices drove inflation and
brought about a deterioration of the trade balance, which
strained national fiscal balances. The budgetary burden of
high food prices is considerable because many countries in
the region subsidize food products. The ability to absorb
food-price shocks was also hindered by the global financial
and economic crisis.
At the micro level, food price shocks increased the number
of people living below the poverty line. The groups hardest
hit by high food prices are the rural landless and small and
marginal food producers. The urban poor are also at risk of
becoming poorer as are those who have risen out of poverty
in recent years.
Price hikes were also reported to have had serious conse-
quences on nutrition. To cope with higher food prices, many
people reduce their food intake and shift consumption away
from healthy foods to cheaper, less nutritious foods. This
increases health risks such as malnutrition among the poor.
It is estimated that the recent food price shock led to an in-
crease of some 4 million undernourished people in the Arab
countries alone.
As well as economic affordability, physical access to food is
also facilitated by adequate infrastructure, such as railway
lines and paved roads. Information on infrastructure is even
sparser than that on prices, but it shows a clear association
with food security outcomes in more than one country.
Further reading• The Implications of Soaring Food Prices and the Global Fi-
nancial and Economic Crisis for Agricultural Development
and Food and Nutrition Security in the Near East from
the 30th Regional Conference (http://www.fao.org/docrep/
meeting/020/k9532e.pdf)• FAO The State of Food Insecurity in the World 2013 -
The multiple dimensions of food security (www.fao.org/
publications/sofi/en/ )
CHART 35: Rail-lines density (2011)
Saudi Arabia
Mauritania
Algeria
Sudan (former)
Jordan
Iran (Islamic Republic of)
Morocco
Iraq
Egypt
Tunisia
0.2 0.4 0.6
km per 100 square km of land area
Source: FAO, Statistics Division.
CHART 36: Relative price of food (2000-2010)
1.00
1.25
1.50
1.75
2.00
2000 2002 2004 2006 2008 2010
i n d e x
Gulf CooperationCouncil Statesand Yemen
North Africa
Other NearEast countries
Source: FAO, Statistics Division.
40
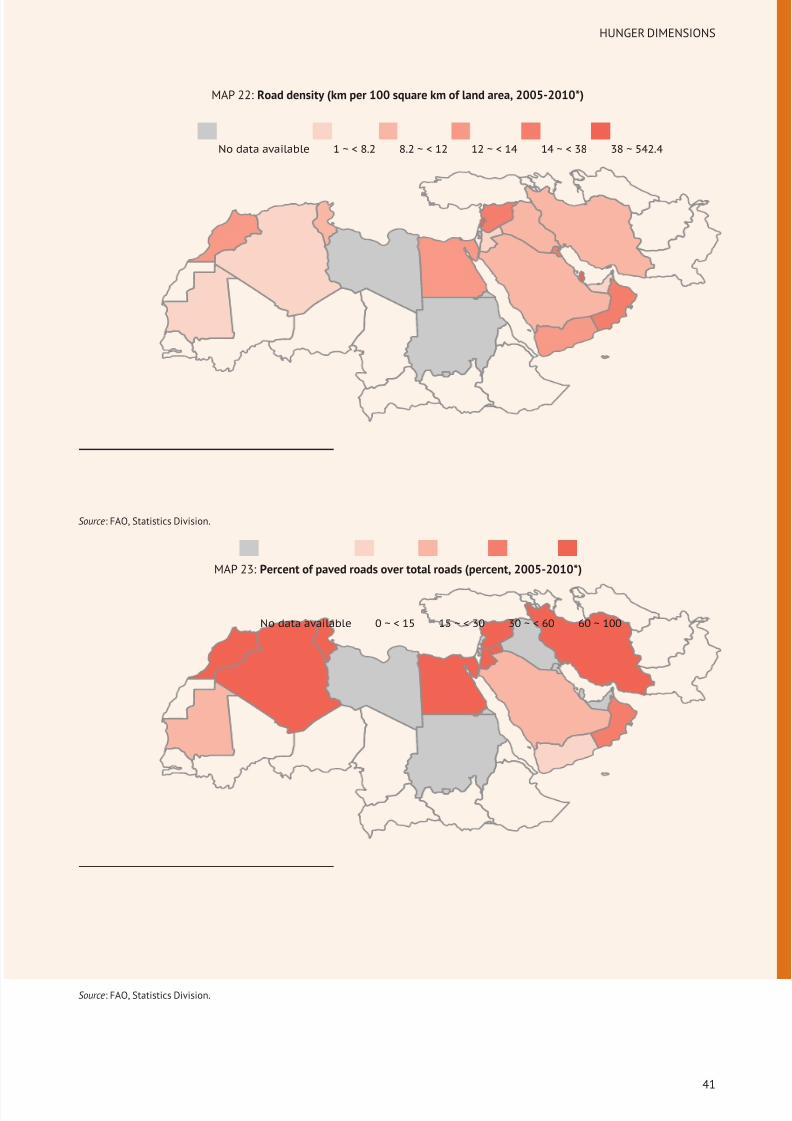
8/12/2019 FAO Statistical Yearbook 2014 Near East and North Africa Food and Agriculture
http://slidepdf.com/reader/full/fao-statistical-yearbook-2014-near-east-and-north-africa-food-and-agriculture 57/174
HUNGER DIMENSIONS
MAP 22: Road density (km per 100 square km of land area, 2005-2010*)
No data available 1 ~ < 8.2 8.2 ~ < 12 12 ~ < 14 14 ~ < 38 38 ~ 542.4
Source: FAO, Statistics Division.
MAP 23: Percent of paved roads over total roads (percent, 2005-2010*)
No data available 0 ~ < 15 15 ~ < 30 30 ~ < 60 60 ~ 100
Source: FAO, Statistics Division.
41
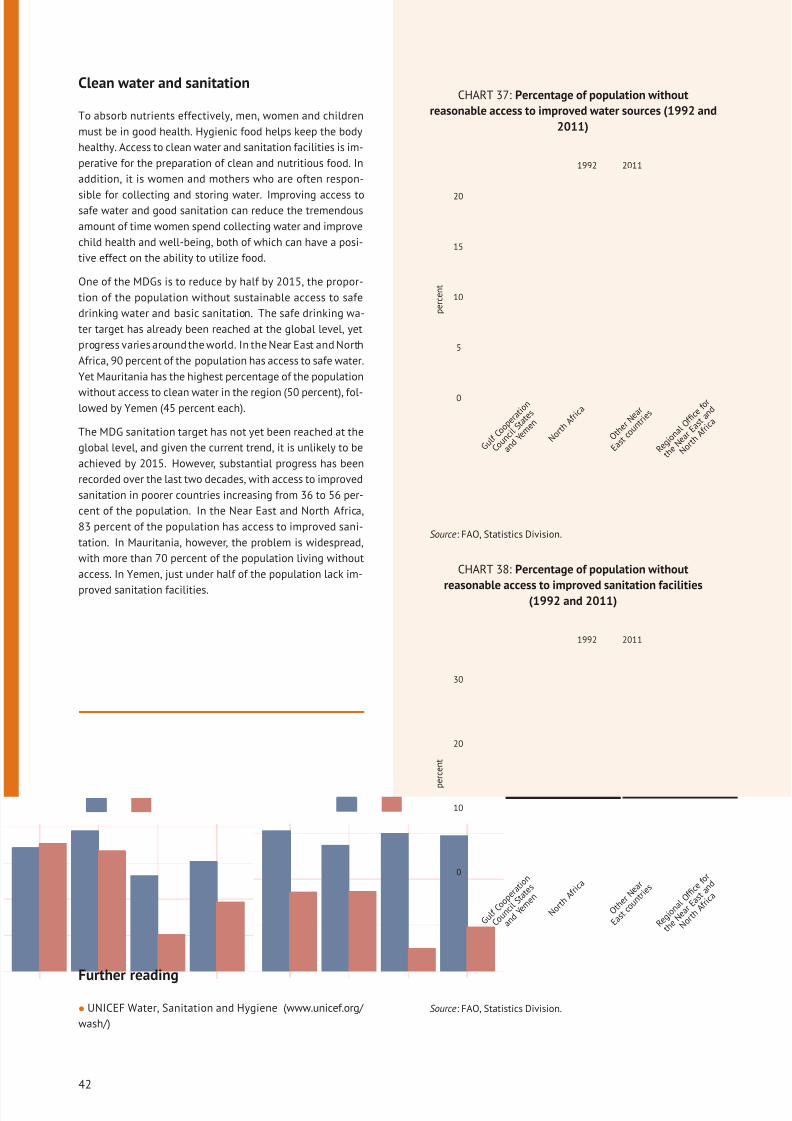
8/12/2019 FAO Statistical Yearbook 2014 Near East and North Africa Food and Agriculture
http://slidepdf.com/reader/full/fao-statistical-yearbook-2014-near-east-and-north-africa-food-and-agriculture 58/174
Clean water and sanitation
To absorb nutrients effectively, men, women and children
must be in good health. Hygienic food helps keep the body
healthy. Access to clean water and sanitation facilities is im-
perative for the preparation of clean and nutritious food. In
addition, it is women and mothers who are often respon-
sible for collecting and storing water. Improving access tosafe water and good sanitation can reduce the tremendous
amount of time women spend collecting water and improve
child health and well-being, both of which can have a posi-
tive effect on the ability to utilize food.
One of the MDGs is to reduce by half by 2015, the propor-
tion of the population without sustainable access to safe
drinking water and basic sanitation. The safe drinking wa-
ter target has already been reached at the global level, yet
progress varies around the world. In the Near East and North
Africa, 90 percent of the population has access to safe water.
Yet Mauritania has the highest percentage of the population
without access to clean water in the region (50 percent), fol-lowed by Yemen (45 percent each).
The MDG sanitation target has not yet been reached at the
global level, and given the current trend, it is unlikely to be
achieved by 2015. However, substantial progress has been
recorded over the last two decades, with access to improved
sanitation in poorer countries increasing from 36 to 56 per-
cent of the population. In the Near East and North Africa,
83 percent of the population has access to improved sani-
tation. In Mauritania, however, the problem is widespread,
with more than 70 percent of the population living without
access. In Yemen, just under half of the population lack im-
proved sanitation facilities.
Further reading• UNICEF Water, Sanitation and Hygiene (www.unicef.org/
wash/)
CHART 37: Percentage of population without
reasonable access to improved water sources (1992 and
2011)
0
5
10
15
20
G u l f
C o o p
e r a t
i o n
C o u n
c i l S t a t
e s
a n d Y e
m e n
N o r t h
A f r i c
a
O t h e
r N e a
r
E a s t
c o u n
t r i e s
R e g i o n
a l O f
fi c e f o r
t h e N e
a r E a
s t a n
d
N o r t h
A f r i c
a
p e r c e n t
1992 2011
Source: FAO, Statistics Division.
CHART 38: Percentage of population without
reasonable access to improved sanitation facilities(1992 and 2011)
0
10
20
30
G u l f
C o o p
e r a t
i o n
C o u n
c i l S t a t
e s
a n d
Y e m
e n
N o r t h
A f r i c
a
O t h e
r N e a
r
E a s t
c o u n
t r i e s
R e g i o n
a l O f
fi c e f o r
t h e N e
a r E a
s t a n
d
N o r t h
A f r i c
a
p
e r c e n t
1992 2011
Source: FAO, Statistics Division.
42
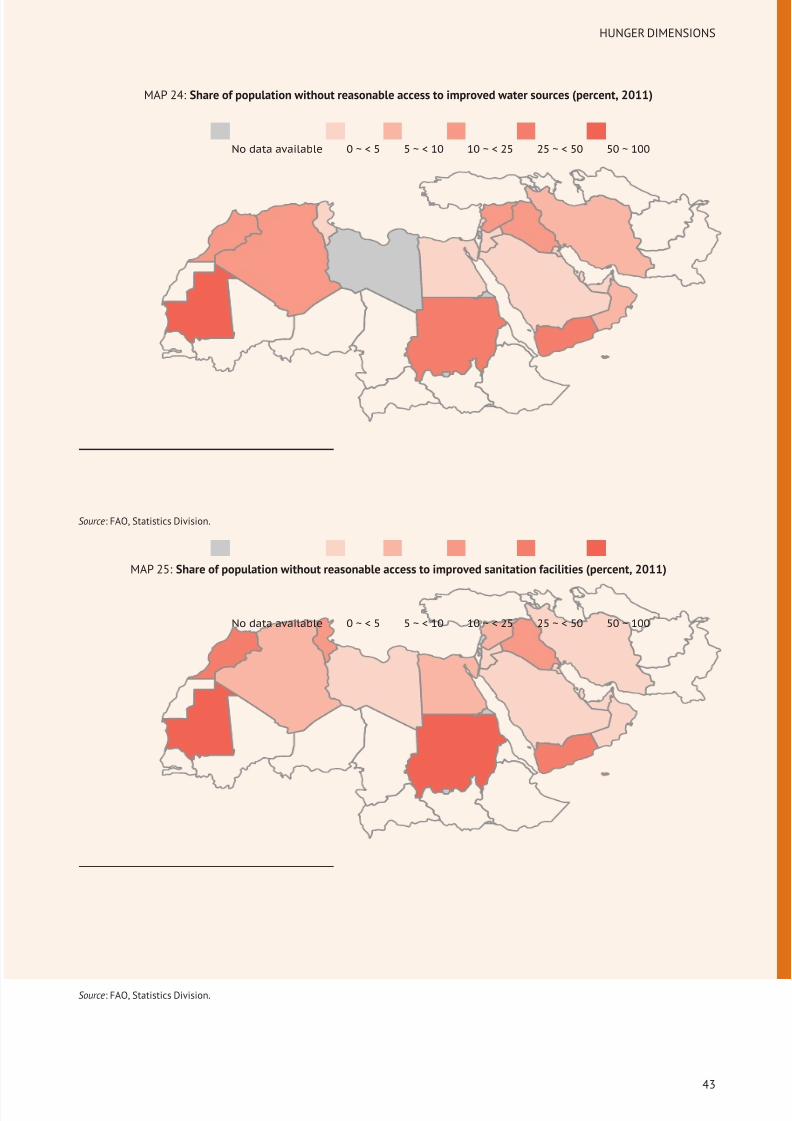
8/12/2019 FAO Statistical Yearbook 2014 Near East and North Africa Food and Agriculture
http://slidepdf.com/reader/full/fao-statistical-yearbook-2014-near-east-and-north-africa-food-and-agriculture 59/174
HUNGER DIMENSIONS
MAP 24: Share of population without reasonable access to improved water sources (percent, 2011)
No data available 0 ~ < 5 5 ~ < 10 10 ~ < 25 25 ~ < 50 50 ~ 100
Source: FAO, Statistics Division.
MAP 25: Share of population without reasonable access to improved sanitation facilities (percent, 2011)
No data available 0 ~ < 5 5 ~ < 10 10 ~ < 25 25 ~ < 50 50 ~ 100
Source: FAO, Statistics Division.
43
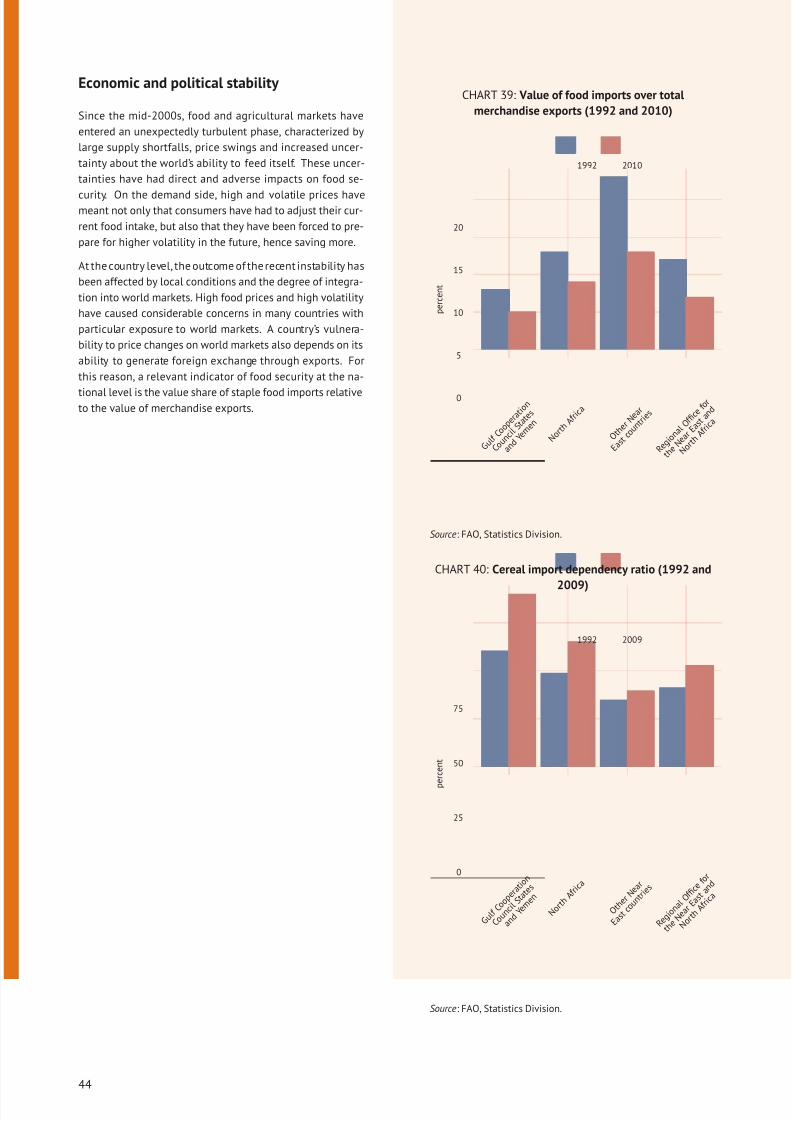
8/12/2019 FAO Statistical Yearbook 2014 Near East and North Africa Food and Agriculture
http://slidepdf.com/reader/full/fao-statistical-yearbook-2014-near-east-and-north-africa-food-and-agriculture 60/174
Economic and political stability
Since the mid-2000s, food and agricultural markets have
entered an unexpectedly turbulent phase, characterized by
large supply shortfalls, price swings and increased uncer-
tainty about the world’s ability to feed itself. These uncer-
tainties have had direct and adverse impacts on food se-
curity. On the demand side, high and volatile prices havemeant not only that consumers have had to adjust their cur-
rent food intake, but also that they have been forced to pre-
pare for higher volatility in the future, hence saving more.
At the country level, the outcome of the recent instability has
been affected by local conditions and the degree of integra-
tion into world markets. High food prices and high volatility
have caused considerable concerns in many countries with
particular exposure to world markets. A country’s vulnera-
bility to price changes on world markets also depends on its
ability to generate foreign exchange through exports. For
this reason, a relevant indicator of food security at the na-
tional level is the value share of staple food imports relativeto the value of merchandise exports.
CHART 39: Value of food imports over total
merchandise exports (1992 and 2010)
0
5
10
15
20
G u l f
C o o p
e r a t
i o n
C o u n
c i l S t a t
e s
a n d Y e
m e n
N o r t h
A f r i c
a
O t h e
r N e a
r
E a s t
c o u n
t r i e s
R e g i o n
a l O f
fi c e f o r
t h e N e
a r E a
s t a n
d
N o r t h
A f r i c
a
p e r c e n t
1992 2010
Source: FAO, Statistics Division.
CHART 40: Cereal import dependency ratio (1992 and
2009)
0
25
50
75
G u l f
C o o p
e r a t
i o n
C o u n
c i l S t a t
e s
a n d
Y e m
e n
N o r t h
A f r i c
a
O t h e
r N e a
r
E a s t
c o u n
t r i e s
R e g i o n
a l O f
fi c e f o r
t h e N e
a r E a
s t a n
d
N o r t h
A f r i c
a
p
e r c e n t
1992 2009
Source: FAO, Statistics Division.
44
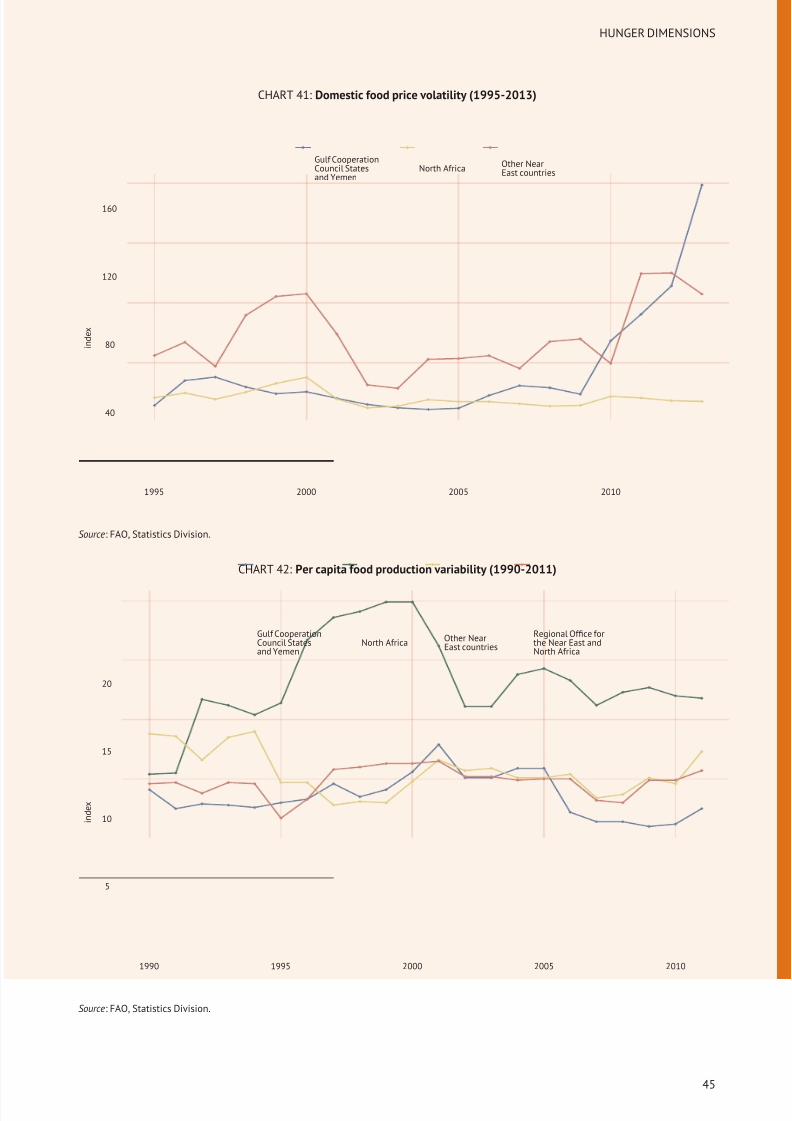
8/12/2019 FAO Statistical Yearbook 2014 Near East and North Africa Food and Agriculture
http://slidepdf.com/reader/full/fao-statistical-yearbook-2014-near-east-and-north-africa-food-and-agriculture 61/174
HUNGER DIMENSIONS
CHART 41: Domestic food price volatility (1995-2013)
40
80
120
160
1995 2000 2005 2010
i n d e x
Gulf CooperationCouncil Statesand Yemen
North Africa Other NearEast countries
Source: FAO, Statistics Division.
CHART 42: Per capita food production variability (1990-2011)
5
10
15
20
1990 1995 2000 2005 2010
i n d e x
Gulf CooperationCouncil Statesand Yemen
North Africa Other NearEast countries
Regional Office forthe Near East andNorth Africa
Source: FAO, Statistics Division.
45
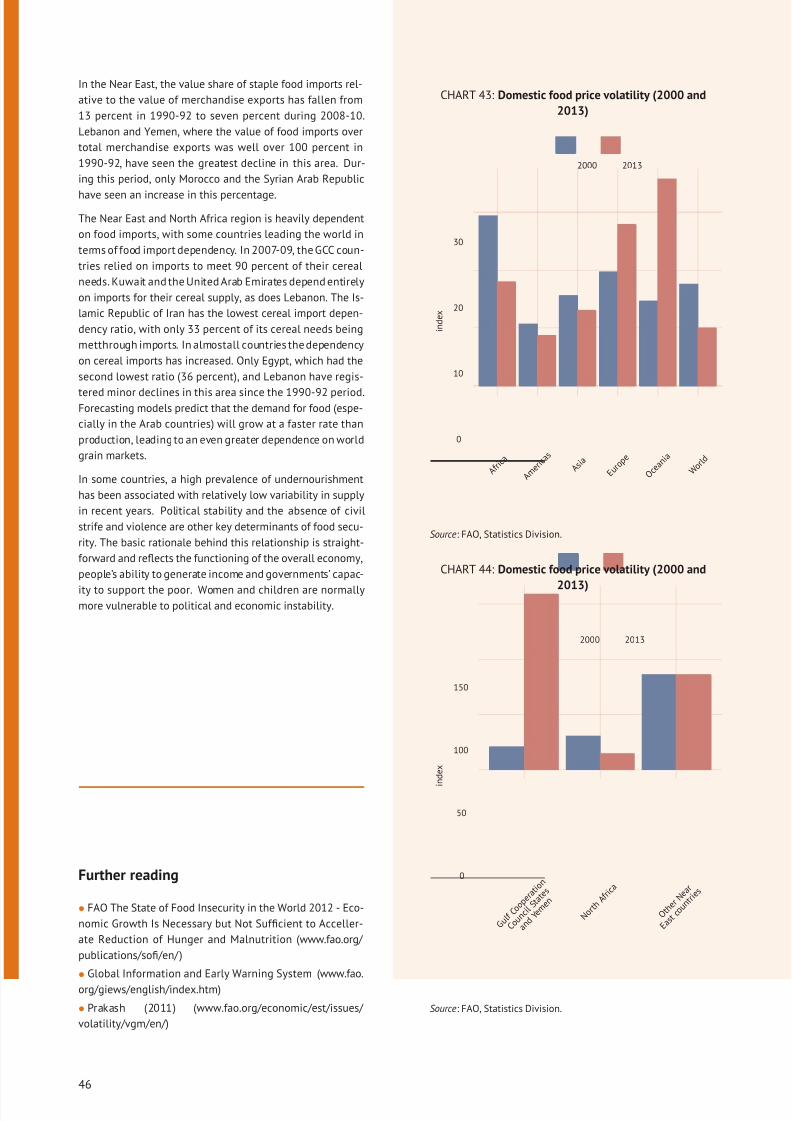
8/12/2019 FAO Statistical Yearbook 2014 Near East and North Africa Food and Agriculture
http://slidepdf.com/reader/full/fao-statistical-yearbook-2014-near-east-and-north-africa-food-and-agriculture 62/174
In the Near East, the value share of staple food imports rel-
ative to the value of merchandise exports has fallen from
13 percent in 1990-92 to seven percent during 2008-10.
Lebanon and Yemen, where the value of food imports over
total merchandise exports was well over 100 percent in
1990-92, have seen the greatest decline in this area. Dur-
ing this period, only Morocco and the Syrian Arab Republic
have seen an increase in this percentage.
The Near East and North Africa region is heavily dependent
on food imports, with some countries leading the world in
terms of food import dependency. In 2007-09, the GCC coun-
tries relied on imports to meet 90 percent of their cereal
needs. Kuwait and the United Arab Emirates depend entirely
on imports for their cereal supply, as does Lebanon. The Is-
lamic Republic of Iran has the lowest cereal import depen-
dency ratio, with only 33 percent of its cereal needs being
metthrough imports. In almostall countries the dependency
on cereal imports has increased. Only Egypt, which had the
second lowest ratio (36 percent), and Lebanon have regis-
tered minor declines in this area since the 1990-92 period.Forecasting models predict that the demand for food (espe-
cially in the Arab countries) will grow at a faster rate than
production, leading to an even greater dependence on world
grain markets.
In some countries, a high prevalence of undernourishment
has been associated with relatively low variability in supply
in recent years. Political stability and the absence of civil
strife and violence are other key determinants of food secu-
rity. The basic rationale behind this relationship is straight-
forward and reflects the functioning of the overall economy,
people’s ability to generate income and governments’ capac-
ity to support the poor. Women and children are normallymore vulnerable to political and economic instability.
Further reading
• FAO The State of Food Insecurity in the World 2012 - Eco-
nomic Growth Is Necessary but Not Sufficient to Acceller-
ate Reduction of Hunger and Malnutrition (www.fao.org/
publications/sofi/en/ )
• Global Information and Early Warning System (www.fao.
org/giews/english/index.htm)
• Prakash (2011) (www.fao.org/economic/est/issues/
volatility/vgm/en/)
CHART 43: Domestic food price volatility (2000 and
2013)
0
10
20
30
A f r i c
a
A m e r
i c a s
A s i a
E u r o
p e
O c e a
n i a
W o r l d
i n d e x
2000 2013
Source: FAO, Statistics Division.
CHART 44: Domestic food price volatility (2000 and
2013)
0
50
100
150
G u l f
C o o p
e r a t
i o n
C o u n
c i l S t a t
e s
a n d
Y e m e
n
N o r t h
A f r i c
a
O t h e
r N e a
r
E a s t
c o u n
t r i e s
i n d e x
2000 2013
Source: FAO, Statistics Division.
46
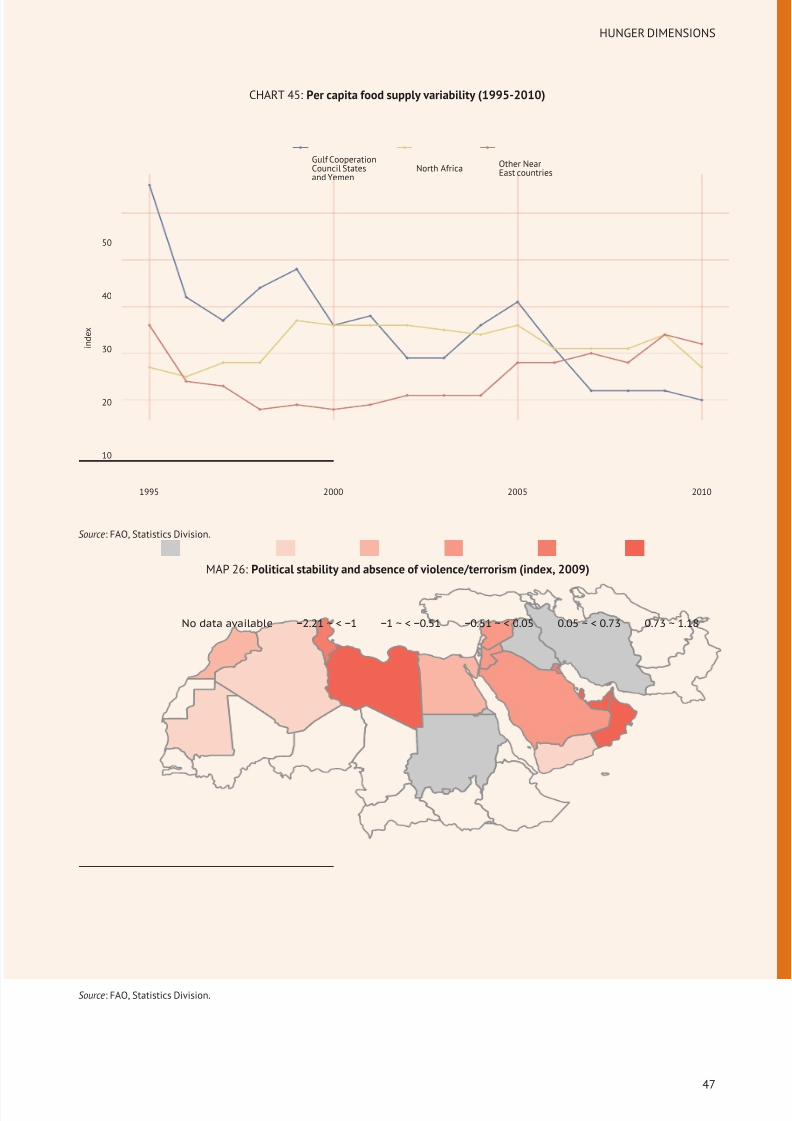
8/12/2019 FAO Statistical Yearbook 2014 Near East and North Africa Food and Agriculture
http://slidepdf.com/reader/full/fao-statistical-yearbook-2014-near-east-and-north-africa-food-and-agriculture 63/174
HUNGER DIMENSIONS
CHART 45: Per capita food supply variability (1995-2010)
10
20
30
40
50
1995 2000 2005 2010
i n d e x
Gulf CooperationCouncil Statesand Yemen
North Africa Other NearEast countries
Source: FAO, Statistics Division.
MAP 26: Political stability and absence of violence/terrorism (index, 2009)
No data available −2.21 ~ < −1 −1 ~ < −0.51 −0.51 ~ < 0.05 0.05 ~ < 0.73 0.73 ~ 1.18
Source: FAO, Statistics Division.
47
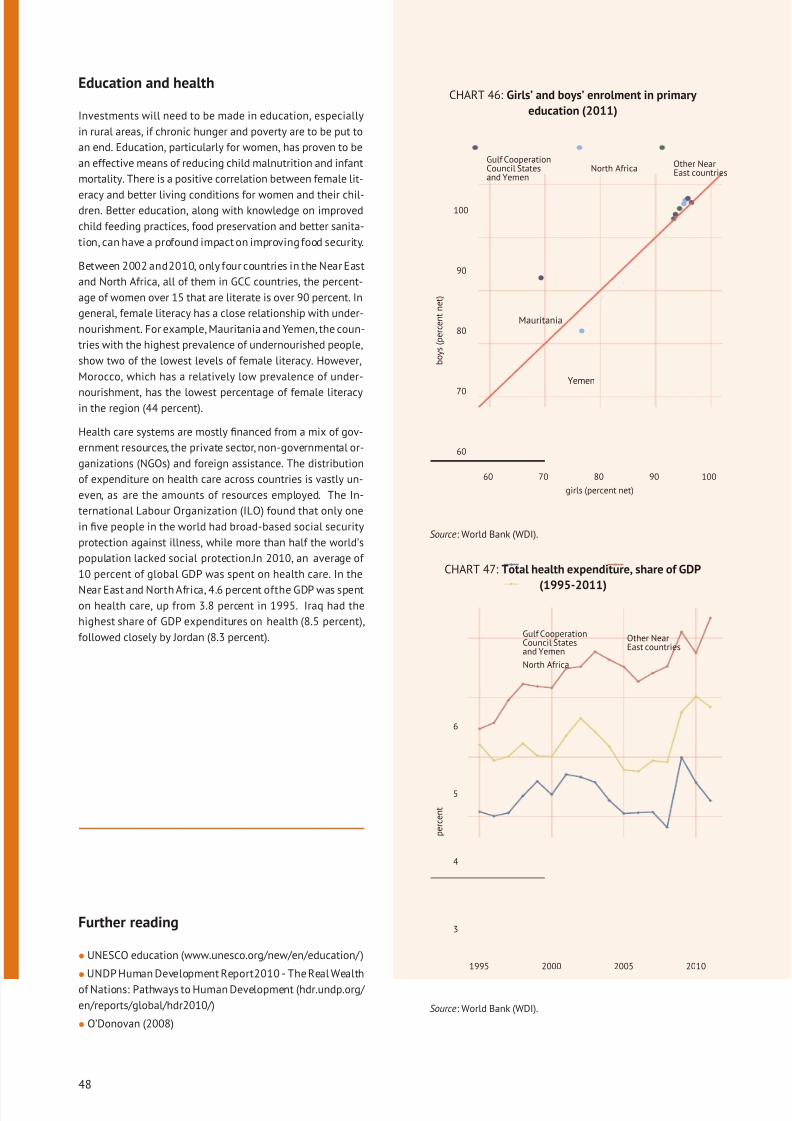
8/12/2019 FAO Statistical Yearbook 2014 Near East and North Africa Food and Agriculture
http://slidepdf.com/reader/full/fao-statistical-yearbook-2014-near-east-and-north-africa-food-and-agriculture 64/174
Education and health
Investments will need to be made in education, especially
in rural areas, if chronic hunger and poverty are to be put to
an end. Education, particularly for women, has proven to be
an effective means of reducing child malnutrition and infant
mortality. There is a positive correlation between female lit-
eracy and better living conditions for women and their chil-dren. Better education, along with knowledge on improved
child feeding practices, food preservation and better sanita-
tion, can have a profound impact on improving food security.
Between 2002 and2010, only four countries in the Near East
and North Africa, all of them in GCC countries, the percent-
age of women over 15 that are literate is over 90 percent. In
general, female literacy has a close relationship with under-
nourishment. For example, Mauritania and Yemen, the coun-
tries with the highest prevalence of undernourished people,
show two of the lowest levels of female literacy. However,
Morocco, which has a relatively low prevalence of under-
nourishment, has the lowest percentage of female literacyin the region (44 percent).
Health care systems are mostly financed from a mix of gov-
ernment resources, the private sector, non-governmental or-
ganizations (NGOs) and foreign assistance. The distribution
of expenditure on health care across countries is vastly un-
even, as are the amounts of resources employed. The In-
ternational Labour Organization (ILO) found that only one
in five people in the world had broad-based social security
protection against illness, while more than half the world’s
population lacked social protection.In 2010, an average of
10 percent of global GDP was spent on health care. In the
Near East and North Africa, 4.6 percent ofthe GDP was spenton health care, up from 3.8 percent in 1995. Iraq had the
highest share of GDP expenditures on health (8.5 percent),
followed closely by Jordan (8.3 percent).
Further reading
• UNESCO education (www.unesco.org/new/en/education/ )
• UNDP Human Development Report2010 - The Real Wealth
of Nations: Pathways to Human Development (hdr.undp.org/
en/reports/global/hdr2010/)
• O’Donovan (2008)
CHART 46: Girls’ and boys’ enrolment in primary
education (2011)
Yemen
Mauritania
60
70
80
90
100
60 70 80 90 100
girls (percent net)
b o y s ( p e r c e n t n e t )
Gulf CooperationCouncil Statesand Yemen
North Africa Other NearEast countries
Source: World Bank (WDI).
CHART 47: Total health expenditure, share of GDP
(1995-2011)
3
4
5
6
1995 2000 2005 2010
p e r c e n t
Gulf CooperationCouncil Statesand Yemen
North Africa
Other NearEast countries
Source: World Bank (WDI).
48
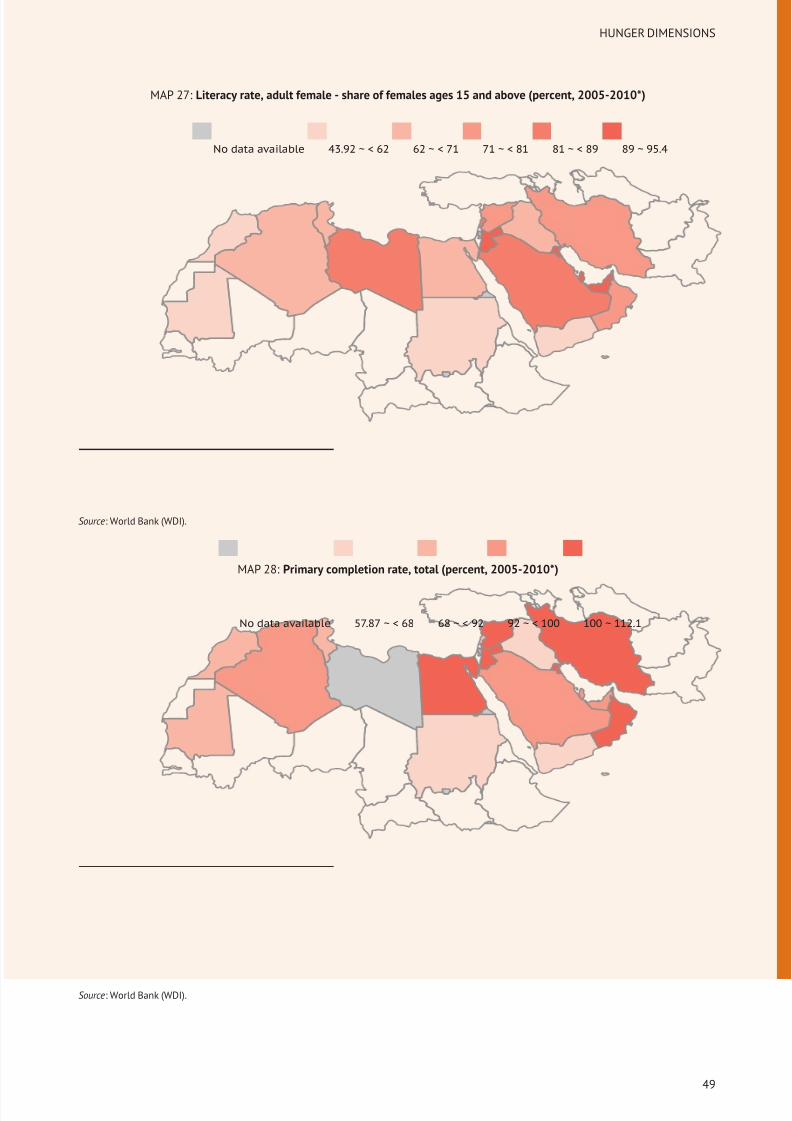
8/12/2019 FAO Statistical Yearbook 2014 Near East and North Africa Food and Agriculture
http://slidepdf.com/reader/full/fao-statistical-yearbook-2014-near-east-and-north-africa-food-and-agriculture 65/174
HUNGER DIMENSIONS
MAP 27: Literacy rate, adult female - share of females ages 15 and above (percent, 2005-2010*)
No data available 43.92 ~ < 62 62 ~ < 71 71 ~ < 81 81 ~ < 89 89 ~ 95.4
Source: World Bank (WDI).
MAP 28: Primary completion rate, total (percent, 2005-2010*)
No data available 57.87 ~ < 68 68 ~ < 92 92 ~ < 100 100 ~ 112.1
Source: World Bank (WDI).
49
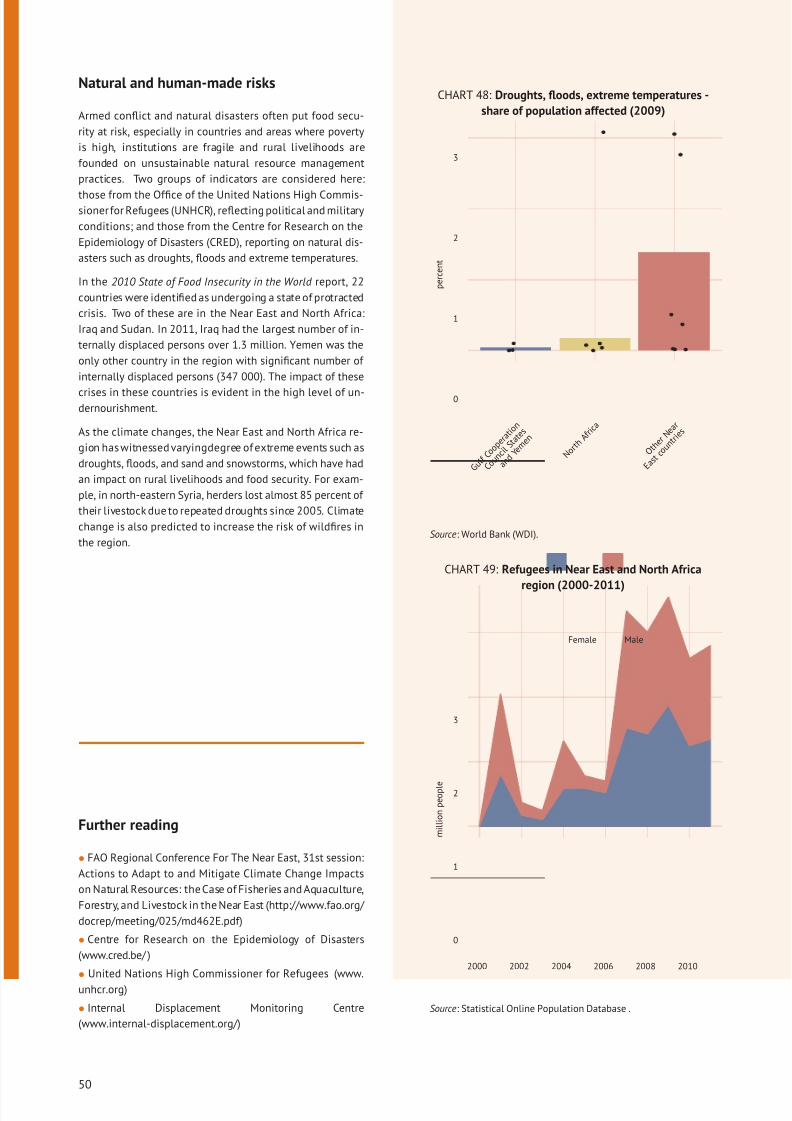
8/12/2019 FAO Statistical Yearbook 2014 Near East and North Africa Food and Agriculture
http://slidepdf.com/reader/full/fao-statistical-yearbook-2014-near-east-and-north-africa-food-and-agriculture 66/174
Natural and human-made risks
Armed conflict and natural disasters often put food secu-
rity at risk, especially in countries and areas where poverty
is high, institutions are fragile and rural livelihoods are
founded on unsustainable natural resource management
practices. Two groups of indicators are considered here:
those from the Office of the United Nations High Commis-sioner for Refugees (UNHCR), reflecting political and military
conditions; and those from the Centre for Research on the
Epidemiology of Disasters (CRED), reporting on natural dis-
asters such as droughts, floods and extreme temperatures.
In the 2010 State of Food Insecurity in the World report, 22
countries were identified as undergoing a state of protracted
crisis. Two of these are in the Near East and North Africa:
Iraq and Sudan. In 2011, Iraq had the largest number of in-
ternally displaced persons over 1.3 million. Yemen was the
only other country in the region with significant number of
internally displaced persons (347 000). The impact of these
crises in these countries is evident in the high level of un-dernourishment.
As the climate changes, the Near East and North Africa re-
gion has witnessed varyingdegree of extreme events such as
droughts, floods, and sand and snowstorms, which have had
an impact on rural livelihoods and food security. For exam-
ple, in north-eastern Syria, herders lost almost 85 percent of
their livestock due to repeated droughts since 2005. Climate
change is also predicted to increase the risk of wildfires in
the region.
Further reading
• FAO Regional Conference For The Near East, 31st session:
Actions to Adapt to and Mitigate Climate Change Impacts
on Natural Resources: the Case of Fisheries and Aquaculture,
Forestry, and Livestock in the Near East (http://www.fao.org/
docrep/meeting/025/md462E.pdf)
• Centre for Research on the Epidemiology of Disasters
(www.cred.be/ )
• United Nations High Commissioner for Refugees (www.
unhcr.org)
• Internal Displacement Monitoring Centre
(www.internal-displacement.org/ )
CHART 48: Droughts, floods, extreme temperatures -
share of population affected (2009)
0
1
2
3
G u l f
C o o p
e r a t
i o n
C o u n
c i l S t a
t e s
a n d
Y e m e
n
N o r t h
A f r i c
a
O t h e
r N e a
r
E a s t
c o u n
t r i e s
p e r c e n t
Source: World Bank (WDI).
CHART 49: Refugees in Near East and North Africa
region (2000-2011)
0
1
2
3
2000 2002 2004 2006 2008 2010
m i l l i o n p e o p l e
Female Male
Source: Statistical Online Population Database .
50
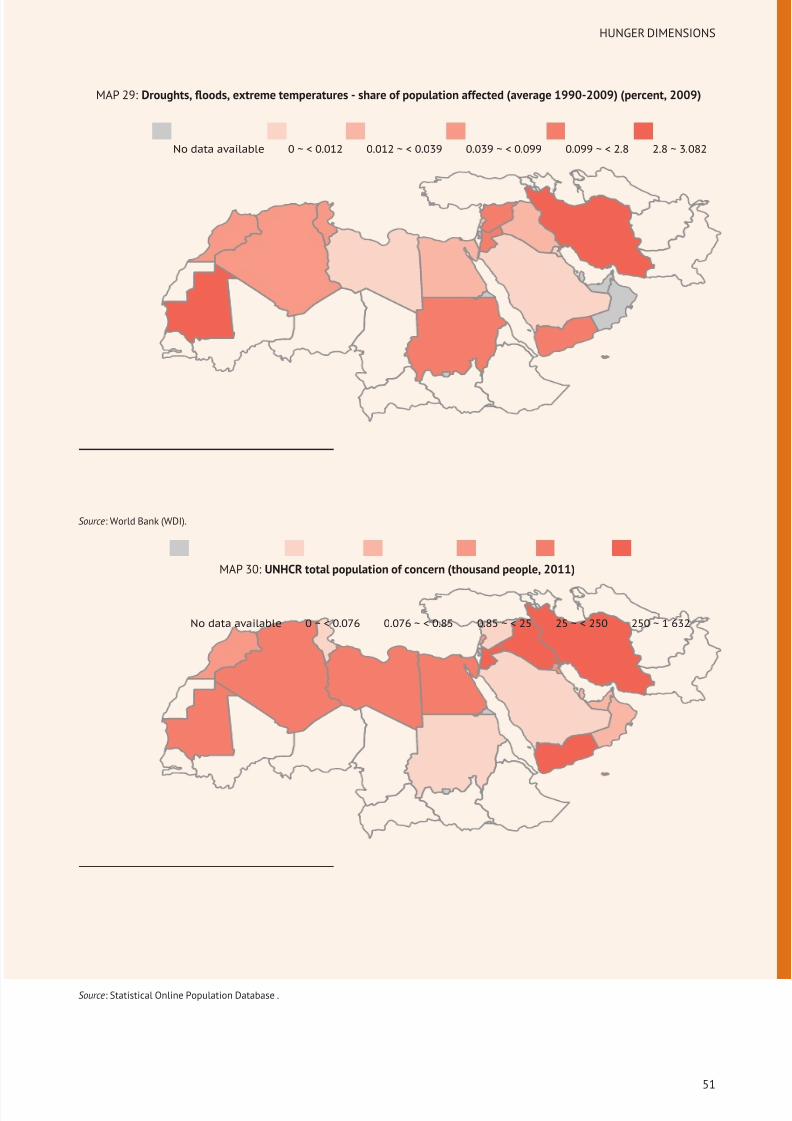
8/12/2019 FAO Statistical Yearbook 2014 Near East and North Africa Food and Agriculture
http://slidepdf.com/reader/full/fao-statistical-yearbook-2014-near-east-and-north-africa-food-and-agriculture 67/174
HUNGER DIMENSIONS
MAP 29: Droughts, floods, extreme temperatures - share of population affected (average 1990-2009) (percent, 2009)
No data available 0 ~ < 0.012 0.012 ~ < 0.039 0.039 ~ < 0.099 0.099 ~ < 2.8 2.8 ~ 3.082
Source: World Bank (WDI).
MAP 30: UNHCR total population of concern (thousand people, 2011)
No data available 0 ~ < 0.076 0.076 ~ < 0.85 0.85 ~ < 25 25 ~ < 250 250 ~ 1 632
Source: Statistical Online Population Database .
51
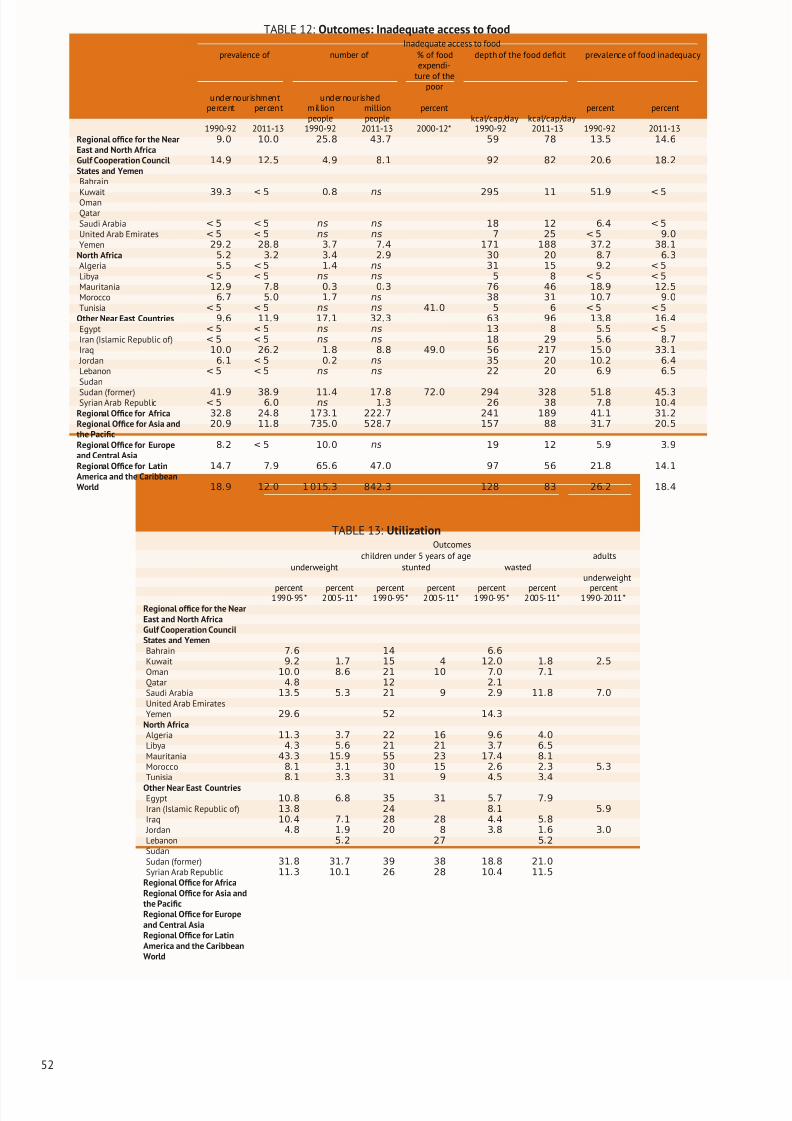
8/12/2019 FAO Statistical Yearbook 2014 Near East and North Africa Food and Agriculture
http://slidepdf.com/reader/full/fao-statistical-yearbook-2014-near-east-and-north-africa-food-and-agriculture 68/174
TABLE 12: Outcomes: Inadequate access to foodInadequate access to food
prevalence of number of % of foodexpendi-
ture of thepoor
depth of the food deficit prevalence of food inadequacy
undernourishment undernourishedpercent percent mil lion
peoplemillionpeople
percentkcal/cap/day kcal/cap/day
percent percent
1990-92 2011-13 1990-92 2011-13 2000-12* 1990-92 2011-13 1990-92 2011-13Regional office for the NearEast and North Africa
9.0 10.0 25.8 43.7 59 78 13.5 14.6
Gulf Cooperation CouncilStates and Yemen
14.9 12.5 4.9 8.1 92 82 20.6 18.2
Bahrain
Kuwait 39.3 < 5 0.8 ns 295 11 51.9 < 5
OmanQatarSaudi Arabia < 5 < 5 ns ns 18 12 6.4 < 5
United Arab Emirates < 5 < 5 ns ns 7 25 < 5 9.0
Yemen 29.2 28.8 3.7 7.4 171 188 37.2 38.1
North Africa 5.2 3.2 3.4 2.9 30 20 8.7 6.3
Algeria 5.5 < 5 1.4 ns 31 15 9.2 < 5
Libya < 5 < 5 ns ns 5 8 < 5 < 5
Mauritania 12.9 7.8 0.3 0.3 76 46 18.9 12.5
Morocco 6.7 5.0 1.7 ns 38 31 10.7 9.0
Tunisia < 5 < 5 ns ns 41.0 5 6 < 5 < 5
Other Near East Countries 9.6 11.9 17.1 32.3 63 96 13.8 16.4
Egypt < 5 < 5 ns ns 13 8 5.5 < 5
Iran (Islamic Republic of) < 5 < 5 ns ns 18 29 5.6 8.7
Iraq 10.0 26.2 1.8 8.8 49.0 56 217 15.0 33.1
Jordan 6.1 < 5 0.2 ns 35 20 10.2 6.4
Lebanon < 5 < 5 ns ns 22 20 6.9 6.5
Sudan
Sudan (former) 41.9 38.9 11.4 17.8 72.0 294 328 51.8 45.3Syrian Arab Republic < 5 6.0 ns 1.3 26 38 7.8 10.4
Regional Office for Africa 32.8 24.8 173.1 222.7 241 189 41.1 31.2
Regional Office for Asia andthe Pacific
20.9 11.8 735.0 528.7 157 88 31.7 20.5
Regional Office for Europeand Central Asia
8.2 < 5 10.0 ns 19 12 5.9 3.9
Regional Office for LatinAmerica and the Caribbean
14.7 7.9 65.6 47.0 97 56 21.8 14.1
World 18.9 12.0 1 015.3 842.3 128 83 26.2 18.4
TABLE 13: UtilizationOutcomes
children under 5 years of age adults
underweight stunted wastedunderweight
percent percent percent percent percent percent percent1990-95* 2005-11* 1990-95* 2005-11* 1990-95* 2005-11* 1990-2011*
Regional office for the NearEast and North AfricaGulf Cooperation CouncilStates and YemenBahrain 7.6 14 6.6
Kuwait 9.2 1.7 15 4 12.0 1.8 2.5
Oman 10.0 8.6 21 10 7.0 7.1
Qatar 4.8 12 2.1
Saudi Arabia 13.5 5.3 21 9 2.9 11.8 7.0
United Arab EmiratesYemen 29.6 52 14.3
North AfricaAlgeria 11.3 3.7 22 16 9.6 4.0
Libya 4.3 5.6 21 21 3.7 6.5
Mauritania 43.3 15.9 55 23 17.4 8.1
Morocco 8.1 3.1 30 15 2.6 2.3 5.3
Tunisia 8.1 3.3 31 9 4.5 3.4
Other Near East CountriesEgypt 10.8 6.8 35 31 5.7 7.9
Iran (Islamic Republic of) 13.8 24 8.1 5.9
Iraq 10.4 7.1 28 28 4.4 5.8
Jordan 4.8 1.9 20 8 3.8 1.6 3.0
Lebanon 5.2 27 5.2
SudanSudan (former) 31.8 31.7 39 38 18.8 21.0
Syrian Arab Republic 11.3 10.1 26 28 10.4 11.5
Regional Office for AfricaRegional Office for Asia andthe PacificRegional Office for Europeand Central AsiaRegional Office for LatinAmerica and the CaribbeanWorld
52
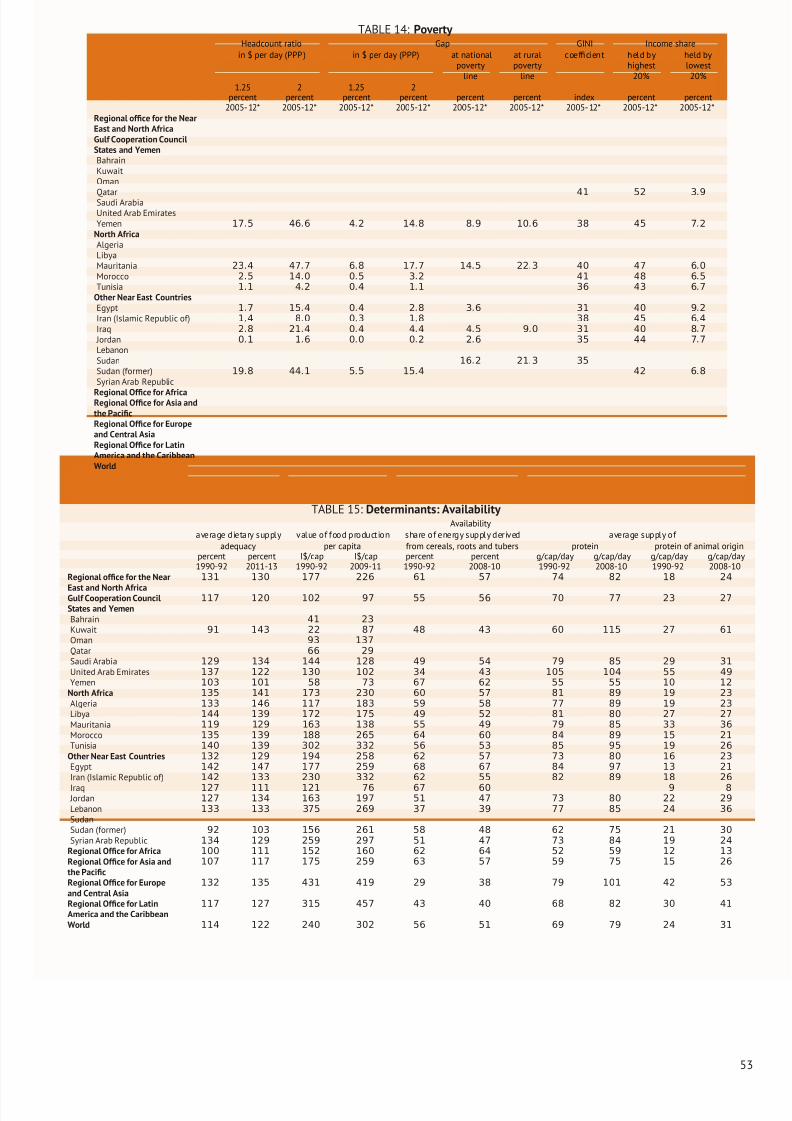
8/12/2019 FAO Statistical Yearbook 2014 Near East and North Africa Food and Agriculture
http://slidepdf.com/reader/full/fao-statistical-yearbook-2014-near-east-and-north-africa-food-and-agriculture 69/174
TABLE 14: Poverty Headcount ratio Gap GINI Income share
in $ per day (PPP ) in $ per day (PPP) at nationalpoverty
line
at ruralpoverty
line
coefficient held byhighest
20%
held bylowest
20%
1.25 2 1.25 2percent percent percent percent percent percent index percent percent
2005- 12* 2005-12* 2005-12* 2005-12* 2005-12* 2005-12* 2005- 12* 2005-12* 2005-12*Regional office for the NearEast and North AfricaGulf Cooperation CouncilStates and YemenBahrainKuwaitOman
Qatar 41 52 3.9
Saudi ArabiaUnited Arab EmiratesYemen 17.5 46.6 4.2 14.8 8.9 10.6 38 45 7.2
North AfricaAlgeriaLibyaMauritania 23.4 47.7 6.8 17.7 14.5 22.3 40 47 6.0
Morocco 2.5 14.0 0.5 3.2 41 48 6.5
Tunisia 1.1 4.2 0.4 1.1 36 43 6.7
Other Near East CountriesEgypt 1.7 15.4 0.4 2.8 3.6 31 40 9.2
Iran (Islamic Republic of) 1.4 8.0 0.3 1.8 38 45 6.4
Iraq 2.8 21.4 0.4 4.4 4.5 9.0 31 40 8.7
Jordan 0.1 1.6 0.0 0.2 2.6 35 44 7.7
LebanonSudan 16.2 21.3 35
Sudan (former) 19.8 44.1 5.5 15.4 42 6.8
Syrian Arab Republic
Regional Office for AfricaRegional Office for Asia andthe PacificRegional Office for Europeand Central AsiaRegional Office for LatinAmerica and the CaribbeanWorld
TABLE 15: Determinants: Availability Availability
average dietary supply value of food production share of energy supply derived average supply of
adequacy per capita from cereals, roots and tubers protein protein of animal originpercent percent I$/cap I$/cap percent percent g/cap/day g/cap/day g/cap/day g/cap/day1990-92 2011-13 1990-92 2009-11 1990-92 2008-10 1990-92 2008-10 1990-92 2008-10
Regional office for the Near
East and North Africa
131 130 177 226 61 57 74 82 18 24
Gulf Cooperation CouncilStates and Yemen
117 120 102 97 55 56 70 77 23 27
Bahrain 41 23
Kuwait 91 143 22 87 48 43 60 115 27 61
Oman 93 137
Qatar 66 29
Saudi Arabia 129 134 144 128 49 54 79 85 29 31
United Arab Emirates 137 122 130 102 34 43 105 104 55 49
Yemen 103 101 58 73 67 62 55 55 10 12
North Africa 135 141 173 230 60 57 81 89 19 23
Algeria 133 146 117 183 59 58 77 89 19 23
Libya 144 139 172 175 49 52 81 80 27 27
Mauritania 119 129 163 138 55 49 79 85 33 36
Morocco 135 139 188 265 64 60 84 89 15 21
Tunisia 140 139 302 332 56 53 85 95 19 26
Other Near East Countries 132 129 194 258 62 57 73 80 16 23
Egypt 142 147 177 259 68 67 84 97 13 21
Iran (Islamic Republic of) 142 133 230 332 62 55 82 89 18 26
Iraq 127 111 121 76 67 60 9 8 Jordan 127 134 163 197 51 47 73 80 22 29
Lebanon 133 133 375 269 37 39 77 85 24 36
SudanSudan (former) 92 103 156 261 58 48 62 75 21 30
Syrian Arab Republic 134 129 259 297 51 47 73 84 19 24
Regional Office for Africa 100 111 152 160 62 64 52 59 12 13
Regional Office for Asia andthe Pacific
107 117 175 259 63 57 59 75 15 26
Regional Office for Europeand Central Asia
132 135 431 419 29 38 79 101 42 53
Regional Office for LatinAmerica and the Caribbean
117 127 315 457 43 40 68 82 30 41
World 114 122 240 302 56 51 69 79 24 31
53
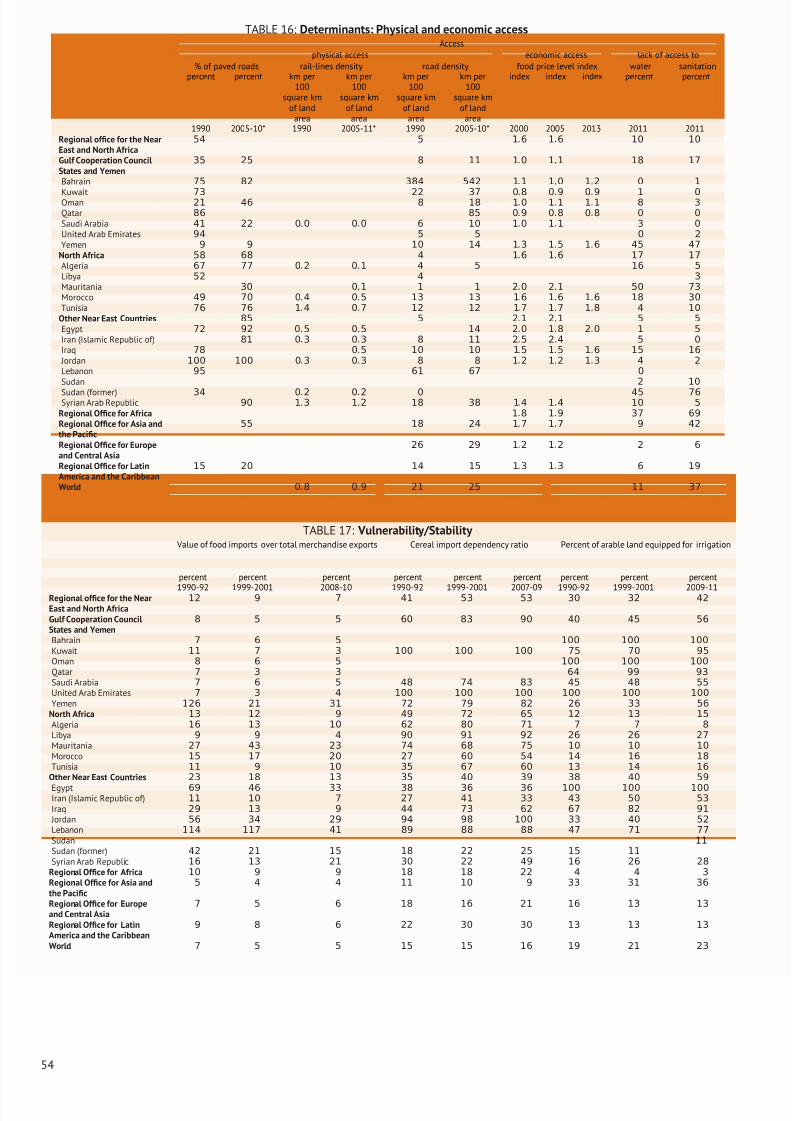
8/12/2019 FAO Statistical Yearbook 2014 Near East and North Africa Food and Agriculture
http://slidepdf.com/reader/full/fao-statistical-yearbook-2014-near-east-and-north-africa-food-and-agriculture 70/174
TABLE 16: Determinants: Physical and economic accessAccess
physical access economic access lack of access to
% of paved roads rail-lines density road density food price level index water sanitationpercent percent km per
100square km
of landarea
km per100
square kmof land
area
km per100
square kmof land
area
km per100
square kmof land
area
index index index percent percent
1990 2005-10* 1990 2005-11* 1990 2005-10* 2000 2005 2013 2011 2011Regional office for the NearEast and North Africa
54 5 1.6 1.6 10 10
Gulf Cooperation CouncilStates and Yemen
35 25 8 11 1.0 1.1 18 17
Bahrain 75 82 384 542 1.1 1.0 1.2 0 1
Kuwait 73 22 37 0.8 0.9 0.9 1 0
Oman 21 46 8 18 1.0 1.1 1.1 8 3
Qatar 86 85 0.9 0.8 0.8 0 0
Saudi Arabia 41 22 0.0 0.0 6 10 1.0 1.1 3 0
United Arab Emirates 94 5 5 0 2
Yemen 9 9 10 14 1.3 1.5 1.6 45 47
North Africa 58 68 4 1.6 1.6 17 17
Algeria 67 77 0.2 0.1 4 5 16 5
Libya 52 4 3
Mauritania 30 0.1 1 1 2.0 2.1 50 73
Morocco 49 70 0.4 0.5 13 13 1.6 1.6 1.6 18 30
Tunisia 76 76 1.4 0.7 12 12 1.7 1.7 1.8 4 10
Other Near East Countries 85 5 2.1 2.1 5 5
Egypt 72 92 0.5 0.5 14 2.0 1.8 2.0 1 5
Iran (Islamic Republic of) 81 0.3 0.3 8 11 2.5 2.4 5 0
Iraq 78 0.5 10 10 1.5 1.5 1.6 15 16
Jordan 100 100 0.3 0.3 8 8 1.2 1.2 1.3 4 2
Lebanon 95 61 67 0
Sudan 2 10
Sudan (former) 34 0.2 0.2 0 45 76Syrian Arab Republic 90 1.3 1.2 18 38 1.4 1.4 10 5
Regional Office for Africa 1.8 1.9 37 69
Regional Office for Asia andthe Pacific
55 18 24 1.7 1.7 9 42
Regional Office for Europeand Central Asia
26 29 1.2 1.2 2 6
Regional Office for LatinAmerica and the Caribbean
15 20 14 15 1.3 1.3 6 19
World 0.8 0.9 21 25 11 37
TABLE 17: Vulnerability/Stability Value of food imports over total merchandise exports Cereal import dependency ratio Percent of arable land equipped for irrigation
percent percent percent percent percent percent percent percent percent
1990-92 1999-2001 2008-10 1990-92 1999-2001 2007-09 1990-92 1999-2001 2009-11Regional office for the NearEast and North Africa
12 9 7 41 53 53 30 32 42
Gulf Cooperation CouncilStates and Yemen
8 5 5 60 83 90 40 45 56
Bahrain 7 6 5 100 100 100
Kuwait 11 7 3 100 100 100 75 70 95
Oman 8 6 5 100 100 100
Qatar 7 3 3 64 99 93
Saudi Arabia 7 6 5 48 74 83 45 48 55
United Arab Emirates 7 3 4 100 100 100 100 100 100
Yemen 126 21 31 72 79 82 26 33 56
North Africa 13 12 9 49 72 65 12 13 15
Algeria 16 13 10 62 80 71 7 7 8
Libya 9 9 4 90 91 92 26 26 27
Mauritania 27 43 23 74 68 75 10 10 10
Morocco 15 17 20 27 60 54 14 16 18
Tunisia 11 9 10 35 67 60 13 14 16
Other Near East Countries 23 18 13 35 40 39 38 40 59
Egypt 69 46 33 38 36 36 100 100 100Iran (Islamic Republic of) 11 10 7 27 41 33 43 50 53
Iraq 29 13 9 44 73 62 67 82 91
Jordan 56 34 29 94 98 100 33 40 52
Lebanon 114 117 41 89 88 88 47 71 77
Sudan 11
Sudan (former) 42 21 15 18 22 25 15 11
Syrian Arab Republic 16 13 21 30 22 49 16 26 28
Regional Office for Africa 10 9 9 18 18 22 4 4 3
Regional Office for Asia andthe Pacific
5 4 4 11 10 9 33 31 36
Regional Office for Europeand Central Asia
7 5 6 18 16 21 16 13 13
Regional Office for LatinAmerica and the Caribbean
9 8 6 22 30 30 13 13 13
World 7 5 5 15 15 16 19 21 23
54
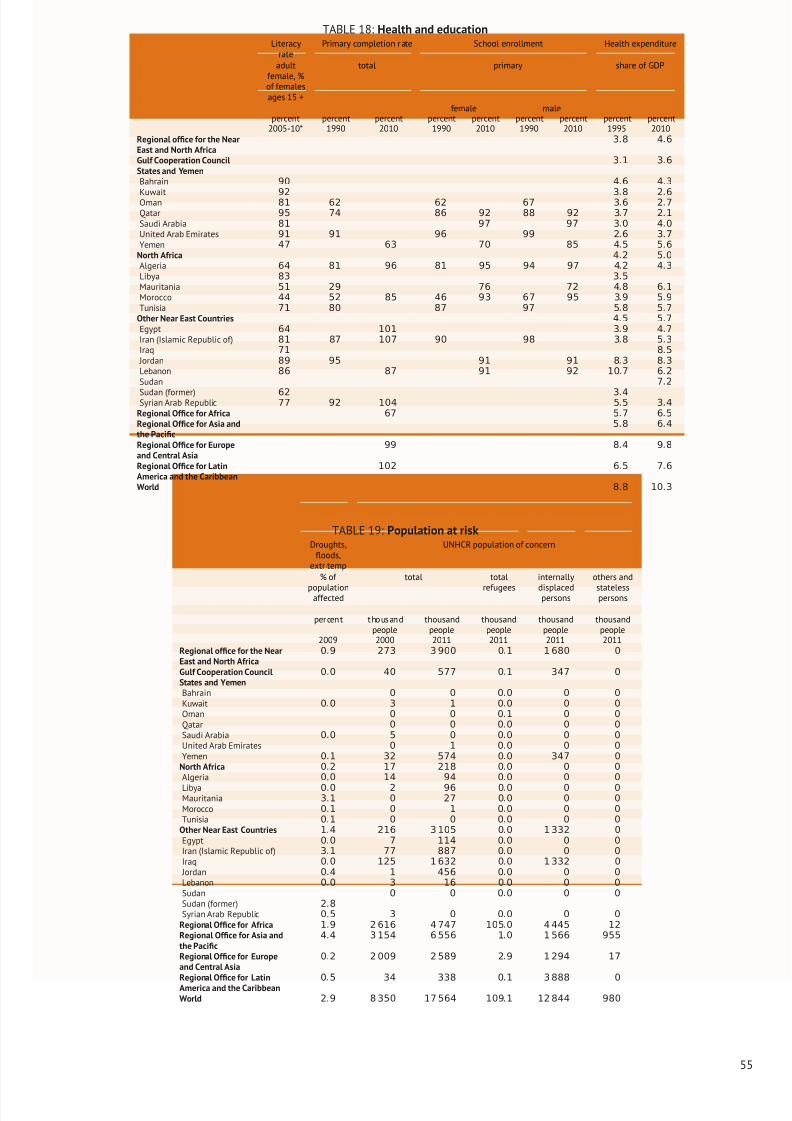
8/12/2019 FAO Statistical Yearbook 2014 Near East and North Africa Food and Agriculture
http://slidepdf.com/reader/full/fao-statistical-yearbook-2014-near-east-and-north-africa-food-and-agriculture 71/174
TABLE 18: Health and educationLiteracy
ratePrimary completion r ate School enrollment Health expenditure
adultfemale, %of femalesages 15 +
total primary share of GDP
female malepercent percent percent percent percent percent percent percent percent
2005-10* 1990 2010 1990 2010 1990 2010 1995 2010Regional office for the NearEast and North Africa
3.8 4.6
Gulf Cooperation CouncilStates and Yemen
3.1 3.6
Bahrain 90 4.6 4.3
Kuwait 92 3.8 2.6
Oman 81 62 62 67 3.6 2.7
Qatar 95 74 86 92 88 92 3.7 2.1
Saudi Arabia 81 97 97 3.0 4.0
United Arab Emirates 91 91 96 99 2.6 3.7
Yemen 47 63 70 85 4.5 5.6
North Africa 4.2 5.0
Algeria 64 81 96 81 95 94 97 4.2 4.3
Libya 83 3.5
Mauritania 51 29 76 72 4.8 6.1
Morocco 44 52 85 46 93 67 95 3.9 5.9
Tunisia 71 80 87 97 5.8 5.7
Other Near East Countries 4.5 5.7
Egypt 64 101 3.9 4.7
Iran (Islamic Republic of) 81 87 107 90 98 3.8 5.3
Iraq 71 8.5
Jordan 89 95 91 91 8.3 8.3
Lebanon 86 87 91 92 10.7 6.2
Sudan 7.2
Sudan (former) 62 3.4Syrian Arab Republic 77 92 104 5.5 3.4
Regional Office for Africa 67 5.7 6.5
Regional Office for Asia andthe Pacific
5.8 6.4
Regional Office for Europeand Central Asia
99 8.4 9.8
Regional Office for LatinAmerica and the Caribbean
102 6.5 7.6
World 8.8 10.3
TABLE 19: Population at riskDroughts,
floods,extr temp
UNHCR population of concern
% of
populationaffected
total total
refugees
internally
displacedpersons
others and
statelesspersons
percent thousandpeople
thousandpeople
thousandpeople
thousandpeople
thousandpeople
2009 2000 2011 2011 2011 2011Regional office for the NearEast and North Africa
0.9 273 3 900 0.1 1 680 0
Gulf Cooperation CouncilStates and Yemen
0.0 40 577 0.1 347 0
Bahrain 0 0 0.0 0 0
Kuwait 0.0 3 1 0.0 0 0
Oman 0 0 0.1 0 0
Qatar 0 0 0.0 0 0
Saudi Arabia 0.0 5 0 0.0 0 0
United Arab Emirates 0 1 0.0 0 0
Yemen 0.1 32 574 0.0 347 0
North Africa 0.2 17 218 0.0 0 0
Algeria 0.0 14 94 0.0 0 0
Libya 0.0 2 96 0.0 0 0Mauritania 3.1 0 27 0.0 0 0
Morocco 0.1 0 1 0.0 0 0
Tunisia 0.1 0 0 0.0 0 0
Other Near East Countries 1.4 216 3 105 0.0 1 332 0
Egypt 0.0 7 114 0.0 0 0
Iran (Islamic Republic of) 3.1 77 887 0.0 0 0
Iraq 0.0 125 1 632 0.0 1 332 0
Jordan 0.4 1 456 0.0 0 0
Lebanon 0.0 3 16 0.0 0 0
Sudan 0 0 0.0 0 0
Sudan (former) 2.8
Syrian Arab Republic 0.5 3 0 0.0 0 0
Regional Office for Africa 1.9 2 616 4 747 105.0 4 445 12
Regional Office for Asia andthe Pacific
4.4 3 154 6 556 1.0 1 566 955
Regional Office for Europeand Central Asia
0.2 2 009 2 589 2.9 1 294 17
Regional Office for LatinAmerica and the Caribbean0.5 34 338 0.1 3 888 0
World 2.9 8 350 17 564 109.1 12 844 980
55

8/12/2019 FAO Statistical Yearbook 2014 Near East and North Africa Food and Agriculture
http://slidepdf.com/reader/full/fao-statistical-yearbook-2014-near-east-and-north-africa-food-and-agriculture 72/174
56
8/12/2019 FAO Statistical Yearbook 2014 Near East and North Africa Food and Agriculture
http://slidepdf.com/reader/full/fao-statistical-yearbook-2014-near-east-and-north-africa-food-and-agriculture 73/174
PART
Feeding the world
According to the 2010 document “FAO Regional Priority Frameworkfor the Near East,” with a limited and fragile natural resource base, ahigh population growth and an increasing demand for food, the NearEast and North Africa region will have a challenging time feedingitself. The region has wealthy but food-deficit countries and poorcountries with higher levels of food production. This situation makesthe food security challenges of this region somewhat unique.
The farming systems prevailing in the region include irrigated, high-land mixed, rain fed mixed, dry, pastoral, sparse coastal artisanal andurban-based agriculture. In several countries, traditional nomadic
pastoralism has been replaced by modern mechanized farming. On-farm food production is becoming steadily less important for poorrural households. On the other hand, urban and peri-urban agricul-ture is important in supporting food needs of the urban poor.
Livestock contributes substantially to the livelihoods in the region,supporting a large portion of the landless and marginalized farm-ers particularly in arid and semi-arid areas, as well as of urban poor
57
8/12/2019 FAO Statistical Yearbook 2014 Near East and North Africa Food and Agriculture
http://slidepdf.com/reader/full/fao-statistical-yearbook-2014-near-east-and-north-africa-food-and-agriculture 74/174
in large cities. It also plays a major role in safeguarding food se-curity and nutrition, providing high quality protein for the diets. Inaddition, animals represent a substitute to monetary savings and an
insurance against risk, especially during crop failures or followingsevere drought. In certain environments, livestock provide draughtpower and transportation. However, the region’s reliance on animalfeed imports to meet the needs of the livestock sector is rapidly in-creasing.
The Near East and North Africa encompasses wide and dispersed ge-ographical areas of different marine and freshwater ecosystems andfisheries with different characteristics and complexity. The productiv-ity of fisheries and aquaculture in the region rely upon ecosystem andnatural resources that are often shared with other coastal countries.
In addition to enhancing agricultural productivity in the region, thereis also critical need to reduce the amount of food wastage. Foodwastage is one of the most significant but under-recognized globalissues related to food insecurity. In the Near East and North Africa, theaverage food loss of major staple food items such as wheat rangedbetween six and 12 percent between 2000 and 2011.
58
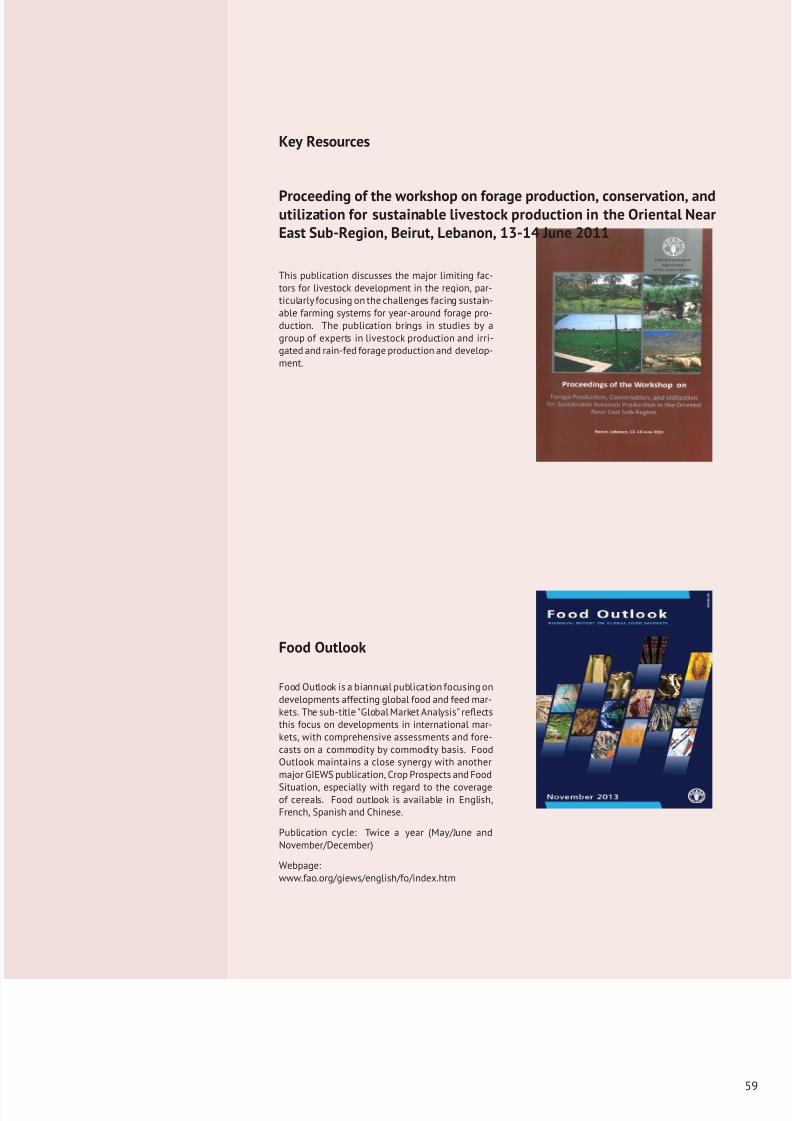
8/12/2019 FAO Statistical Yearbook 2014 Near East and North Africa Food and Agriculture
http://slidepdf.com/reader/full/fao-statistical-yearbook-2014-near-east-and-north-africa-food-and-agriculture 75/174
Key Resources
Proceeding of the workshop on forage production, conservation, andutilization for sustainable livestock production in the Oriental NearEast Sub-Region, Beirut, Lebanon, 13-14 June 2011
This publication discusses the major limiting fac-tors for livestock development in the region, par-ticularly focusing on the challenges facing sustain-able farming systems for year-around forage pro-duction. The publication brings in studies by agroup of experts in livestock production and irri-gated and rain-fed forage production and develop-ment.
Food Outlook
Food Outlook is a biannual publication focusing ondevelopments affecting global food and feed mar-kets. The sub-title "Global Market Analysis" reflectsthis focus on developments in international mar-kets, with comprehensive assessments and fore-casts on a commodity by commodity basis. FoodOutlook maintains a close synergy with anothermajor GIEWS publication, Crop Prospects and Food
Situation, especially with regard to the coverageof cereals. Food outlook is available in English,French, Spanish and Chinese.
Publication cycle: Twice a year (May/June andNovember/December)
Webpage:www.fao.org/giews/english/fo/index.htm
59

8/12/2019 FAO Statistical Yearbook 2014 Near East and North Africa Food and Agriculture
http://slidepdf.com/reader/full/fao-statistical-yearbook-2014-near-east-and-north-africa-food-and-agriculture 76/174
Aggregate agriculture
In recent decades, the productive potential of global agri-
culture has exceeded population growth. This has led to a
slow but steady increase in average per capita food avail-
ability. For the Near East and North Africa ensuring sustain-
able availability of adequate food supplies remains the most
important challenge. Increasing domestic food supply in anefficient and sustainable manner requires addressing a wide
range of factors that underpin the currently low and stag-
nant food production in the region, key among which is the
lagging productivity growth. Agricultural productivity in the
region has lingered behind other food-importing developing
countries and world averages.
Over the last decades, the supply of major food groups per
capita in the region has increased. Low-income countries
have witnessed a modest increase in food supply per capita.
A summary of the food security indicators for 2000-2002 and
2005-2007 shows that wheat flour, refined sugar, milled rice
and soya bean oil were the four most commonly consumedfood commodities and contributed to a larger share to the
dietary energy supply. Of the four, wheat flour became the
most selected staple food in almost all countries except in
the former Sudan where there was a greater preference for
sorghum flour takes the lead. Productivity and the availabil-
ity of these food products play a large part in determining
the level of food security in the region.
The relatively high availability of food, despite limited local
food supply, is in part explained by the high level of food
subsidies and safety nets. Countries in the region have been
able to maintain domestic food supplies primarily through
imports. Most countries in the region are net food im-porters, and consequently they need to secure necessary for-
eign exchange to finance these imports. In addition, to safe-
guard food supplies, they need to reduce exposure to market
volatility by improving supply chain efficiency and by more
effectively using financial instruments to hedge risk.
Given the fairly high levels of food consumption already at-
tained by several countries in the region, growth in the de-
mand for food is expected to slow down and reduce the
growing dependence on food imports. The demand slow-
down will be less in those countries with high population
growthand low levels of per capita food consumption. Coun-
tries in this category are Mauritania, Somalia and Yemen.However, the slowdown in demand will be less pronounced
if diets shift towards more livestock products whose produc-
tion requires increased quantities of feed.
Further reading
• Near East Agriculture Towards 2050: Prospects and
Challenges (ftp://ftp.fao.org/docrep/fao/meeting/012/
k1699E.pdf )
• FAO Agricultural Development Economics Division (www.
fao.org/economic/esa/esa-home/en/)
• Bruinsma (2011)
CHART 50: Food supply in crops primary equivalent
(2000-2009)
2800
3000
3200
2000 2002 2004 2006 2008
k c a l / c a p / d a y
Gulf CooperationCouncil Statesand Yemen
North Africa
Other NearEast countries
Source: FAO, Statistics Division (FAOSTAT).
CHART 51: Near East and North Africa protein and fat
supply in crops primary equivalent (2000-2009)
70
75
80
85
2000 2002 2004 2006 2008
g / c a p / d a y
Protein supply quantity in crops primary equivalent
Fat supply quantity in crops primary equivalent
Source: FAO, Statistics Division (FAOSTAT).
60
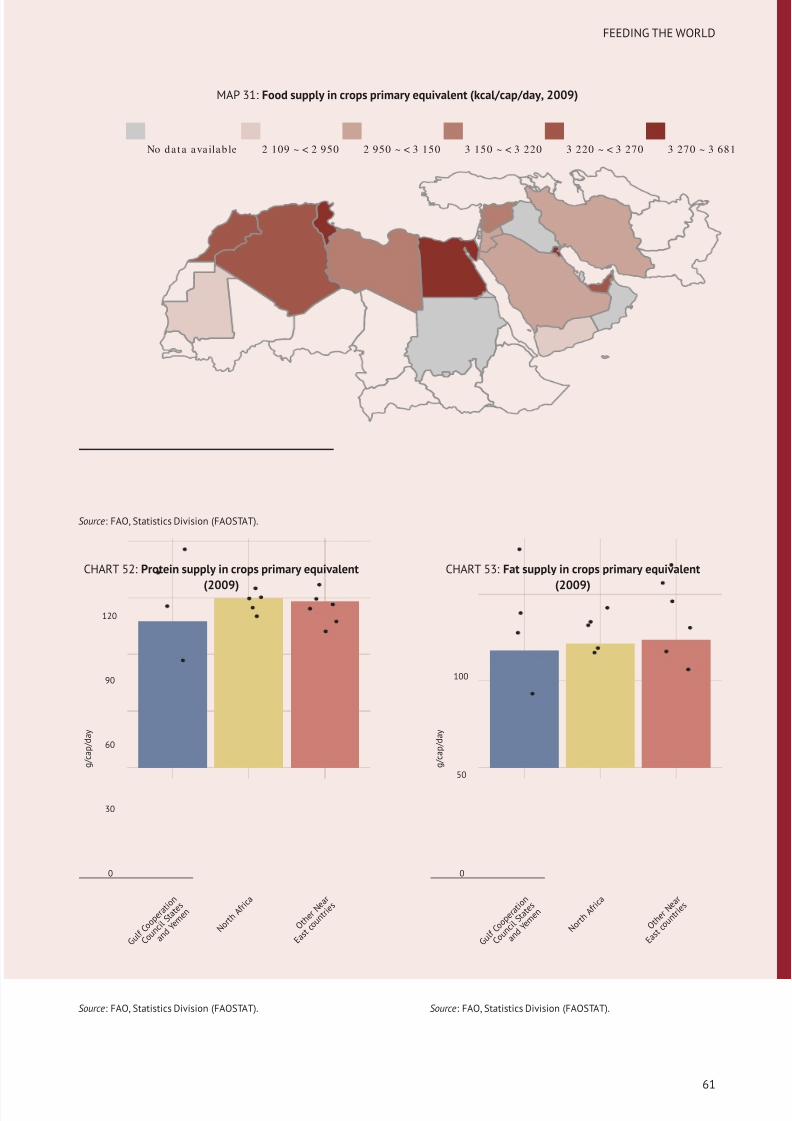
8/12/2019 FAO Statistical Yearbook 2014 Near East and North Africa Food and Agriculture
http://slidepdf.com/reader/full/fao-statistical-yearbook-2014-near-east-and-north-africa-food-and-agriculture 77/174
FEEDING THE WORLD
MAP 31: Food supply in crops primary equivalent (kcal/cap/day, 2009)
No da t a ava ilab le 2 109 ~ < 2 950 2 950 ~ < 3 150 3 150 ~ < 3 220 3 220 ~ < 3 270 3 270 ~ 3 681
Source: FAO, Statistics Division (FAOSTAT).
CHART 52: Protein supply in crops primary equivalent
(2009)
0
30
60
90
120
G u l f
C o o p
e r a t
i o n
C o u n
c i l S t a
t e s
a n d Y e
m e n
N o r t h
A f r i c
a
O t h e
r N e a
r
E a s t
c o u n
t r i e s
g / c a p / d a y
Source: FAO, Statistics Division (FAOSTAT).
CHART 53: Fat supply in crops primary equivalent
(2009)
0
50
100
G u l f
C o o p
e r a t
i o n
C o u n
c i l S t a t
e s
a n d Y e
m e n
N o r t h
A f r i c
a
O t h e
r N e a
r
E a s t
c o u n
t r i e s
g / c a p / d a y
Source: FAO, Statistics Division (FAOSTAT).
61
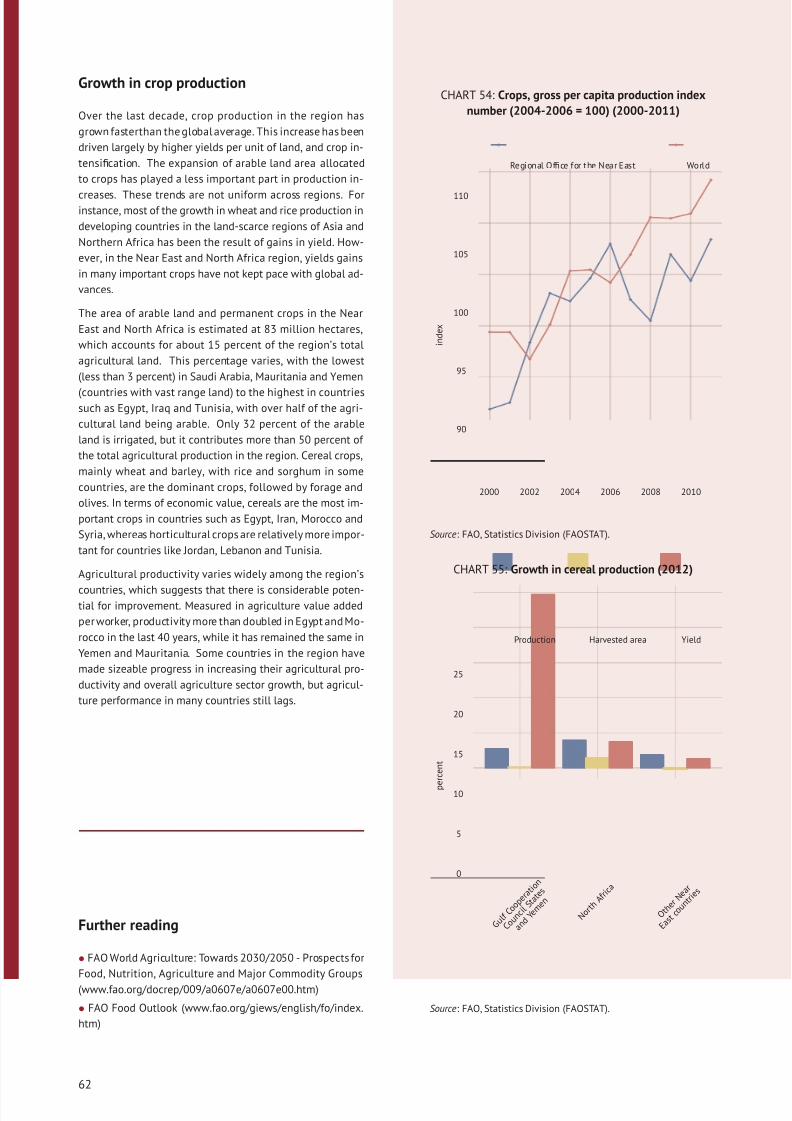
8/12/2019 FAO Statistical Yearbook 2014 Near East and North Africa Food and Agriculture
http://slidepdf.com/reader/full/fao-statistical-yearbook-2014-near-east-and-north-africa-food-and-agriculture 78/174
Growth in crop production
Over the last decade, crop production in the region has
grown fasterthan the global average. This increase has been
driven largely by higher yields per unit of land, and crop in-
tensification. The expansion of arable land area allocated
to crops has played a less important part in production in-
creases. These trends are not uniform across regions. Forinstance, most of the growth in wheat and rice production in
developing countries in the land-scarce regions of Asia and
Northern Africa has been the result of gains in yield. How-
ever, in the Near East and North Africa region, yields gains
in many important crops have not kept pace with global ad-
vances.
The area of arable land and permanent crops in the Near
East and North Africa is estimated at 83 million hectares,
which accounts for about 15 percent of the region’s total
agricultural land. This percentage varies, with the lowest
(less than 3 percent) in Saudi Arabia, Mauritania and Yemen
(countries with vast range land) to the highest in countriessuch as Egypt, Iraq and Tunisia, with over half of the agri-
cultural land being arable. Only 32 percent of the arable
land is irrigated, but it contributes more than 50 percent of
the total agricultural production in the region. Cereal crops,
mainly wheat and barley, with rice and sorghum in some
countries, are the dominant crops, followed by forage and
olives. In terms of economic value, cereals are the most im-
portant crops in countries such as Egypt, Iran, Morocco and
Syria, whereas horticultural crops are relatively more impor-
tant for countries like Jordan, Lebanon and Tunisia.
Agricultural productivity varies widely among the region’s
countries, which suggests that there is considerable poten-tial for improvement. Measured in agriculture value added
per worker, productivity more than doubled in Egypt and Mo-
rocco in the last 40 years, while it has remained the same in
Yemen and Mauritania. Some countries in the region have
made sizeable progress in increasing their agricultural pro-
ductivity and overall agriculture sector growth, but agricul-
ture performance in many countries still lags.
Further reading
• FAO World Agriculture: Towards 2030/2050 - Prospects for
Food, Nutrition, Agriculture and Major Commodity Groups
(www.fao.org/docrep/009/a0607e/a0607e00.htm)
• FAO Food Outlook (www.fao.org/giews/english/fo/index.
htm)
CHART 54: Crops, gross per capita production index
number (2004-2006 = 100) (2000-2011)
90
95
100
105
110
2000 2002 2004 2006 2008 2010
i n d e x
Regional Office for the Near East World
Source: FAO, Statistics Division (FAOSTAT).
CHART 55: Growth in cereal production (2012)
0
5
10
15
20
25
G u l f
C o o p
e r a t
i o n
C o u n
c i l S t a
t e s
a n d
Y e m e
n
N o r t h
A f r i c
a
O t h e
r N e a
r
E a s t
c o u n
t r i e s
p e r c e n t
Production Harvested area Yield
Source: FAO, Statistics Division (FAOSTAT).
62
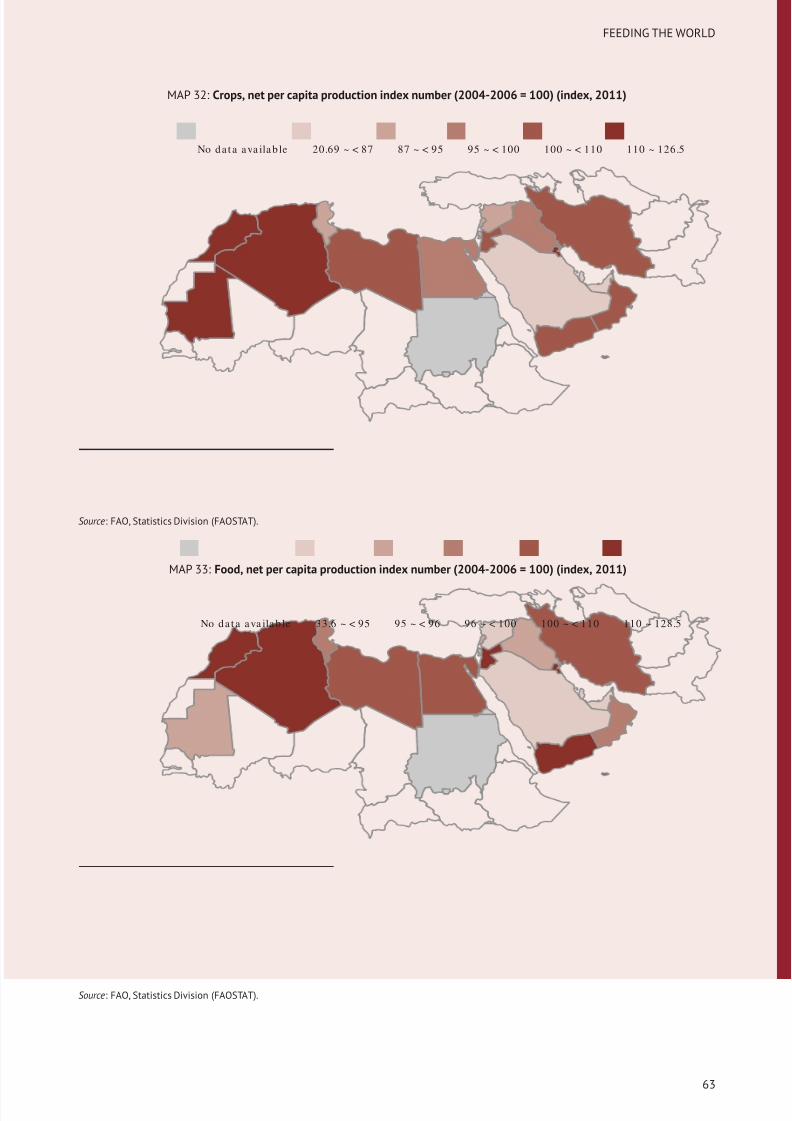
8/12/2019 FAO Statistical Yearbook 2014 Near East and North Africa Food and Agriculture
http://slidepdf.com/reader/full/fao-statistical-yearbook-2014-near-east-and-north-africa-food-and-agriculture 79/174
FEEDING THE WORLD
MAP 32: Crops, net per capita production index number (2004-2006 = 100) (index, 2011)
No da t a ava ila b le 20.69 ~ < 87 87 ~ < 95 95 ~ < 100 100 ~ < 110 110 ~ 126.5
Source: FAO, Statistics Division (FAOSTAT).
MAP 33: Food, net per capita production index number (2004-2006 = 100) (index, 2011)
No da t a ava ila b le 33.6 ~ < 95 95 ~ < 96 96 ~ < 100 100 ~ < 110 110 ~ 128.5
Source: FAO, Statistics Division (FAOSTAT).
63
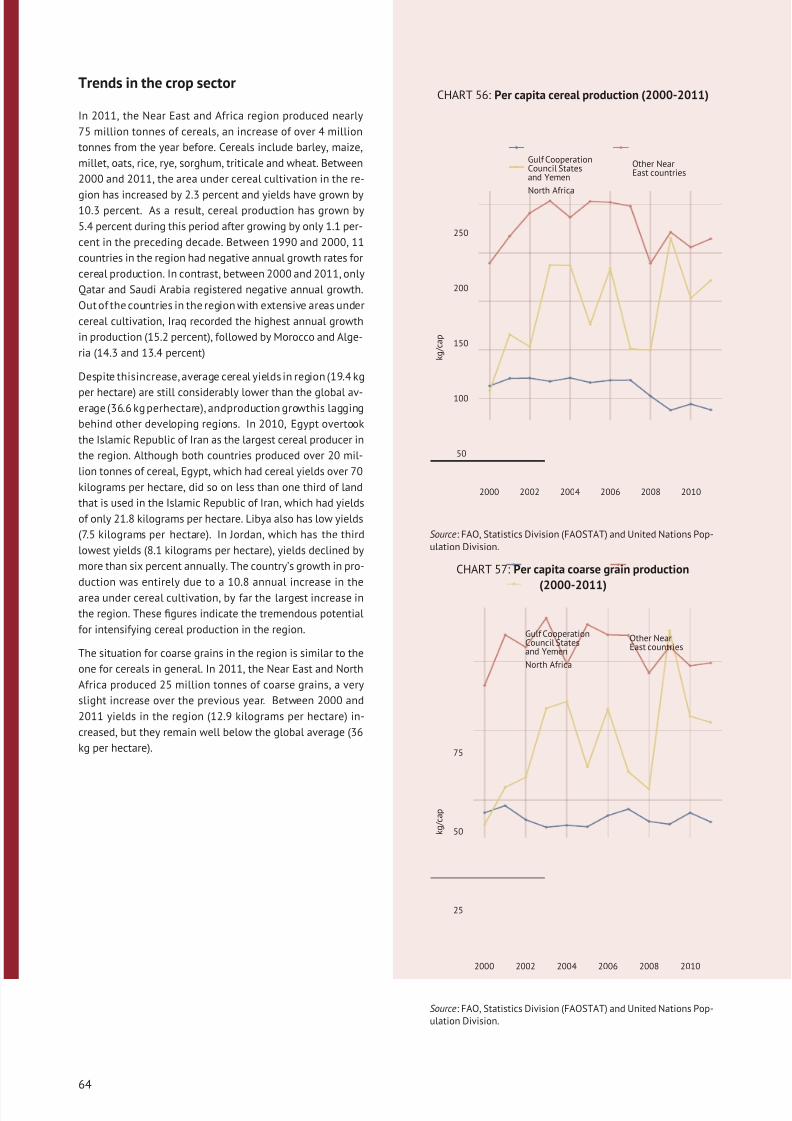
8/12/2019 FAO Statistical Yearbook 2014 Near East and North Africa Food and Agriculture
http://slidepdf.com/reader/full/fao-statistical-yearbook-2014-near-east-and-north-africa-food-and-agriculture 80/174
Trends in the crop sector
In 2011, the Near East and Africa region produced nearly
75 million tonnes of cereals, an increase of over 4 million
tonnes from the year before. Cereals include barley, maize,
millet, oats, rice, rye, sorghum, triticale and wheat. Between
2000 and 2011, the area under cereal cultivation in the re-
gion has increased by 2.3 percent and yields have grown by10.3 percent. As a result, cereal production has grown by
5.4 percent during this period after growing by only 1.1 per-
cent in the preceding decade. Between 1990 and 2000, 11
countries in the region had negative annual growth rates for
cereal production. In contrast, between 2000 and 2011, only
Qatar and Saudi Arabia registered negative annual growth.
Out of the countries in the region with extensive areas under
cereal cultivation, Iraq recorded the highest annual growth
in production (15.2 percent), followed by Morocco and Alge-
ria (14.3 and 13.4 percent)
Despite thisincrease, average cereal yields in region (19.4 kg
per hectare) are still considerably lower than the global av-erage (36.6 kg perhectare), andproduction growthis lagging
behind other developing regions. In 2010, Egypt overtook
the Islamic Republic of Iran as the largest cereal producer in
the region. Although both countries produced over 20 mil-
lion tonnes of cereal, Egypt, which had cereal yields over 70
kilograms per hectare, did so on less than one third of land
that is used in the Islamic Republic of Iran, which had yields
of only 21.8 kilograms per hectare. Libya also has low yields
(7.5 kilograms per hectare). In Jordan, which has the third
lowest yields (8.1 kilograms per hectare), yields declined by
more than six percent annually. The country’s growth in pro-
duction was entirely due to a 10.8 annual increase in the
area under cereal cultivation, by far the largest increase in
the region. These figures indicate the tremendous potential
for intensifying cereal production in the region.
The situation for coarse grains in the region is similar to the
one for cereals in general. In 2011, the Near East and North
Africa produced 25 million tonnes of coarse grains, a very
slight increase over the previous year. Between 2000 and
2011 yields in the region (12.9 kilograms per hectare) in-
creased, but they remain well below the global average (36
kg per hectare).
CHART 56: Per capita cereal production (2000-2011)
50
100
150
200
250
2000 2002 2004 2006 2008 2010
k g / c a p
Gulf CooperationCouncil Statesand Yemen
North Africa
Other NearEast countries
Source: FAO, Statistics Division (FAOSTAT) and United Nations Pop-ulation Division.
CHART 57: Per capita coarse grain production
(2000-2011)
25
50
75
2000 2002 2004 2006 2008 2010
k g / c a p
Gulf CooperationCouncil Statesand Yemen
North Africa
Other NearEast countries
Source: FAO, Statistics Division (FAOSTAT) and United Nations Pop-ulation Division.
64
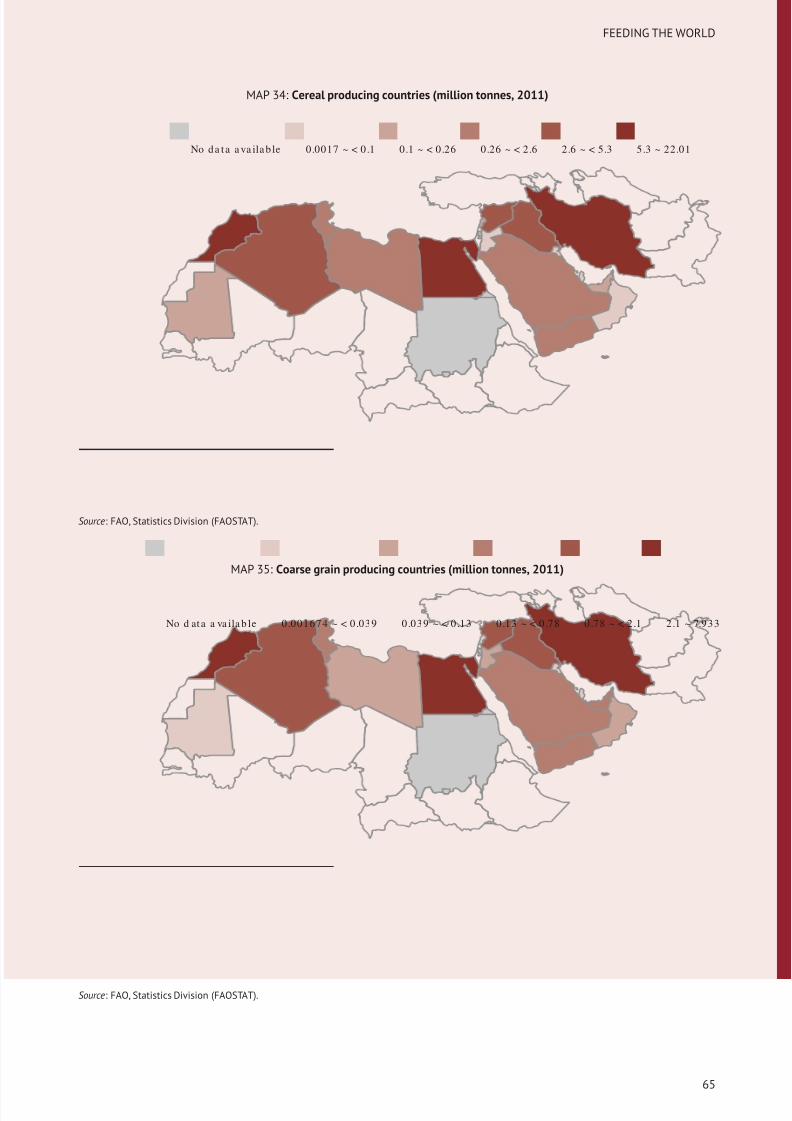
8/12/2019 FAO Statistical Yearbook 2014 Near East and North Africa Food and Agriculture
http://slidepdf.com/reader/full/fao-statistical-yearbook-2014-near-east-and-north-africa-food-and-agriculture 81/174
FEEDING THE WORLD
MAP 34: Cereal producing countries (million tonnes, 2011)
No da ta a va ila b le 0.0017 ~ < 0 .1 0.1 ~ < 0.26 0.26 ~ < 2.6 2.6 ~ < 5.3 5.3 ~ 22.01
Source: FAO, Statistics Division (FAOSTAT).
MAP 35: Coarse grain producing countries (million tonnes, 2011)
No d ata a va ila b le 0.001674 ~ < 0.039 0.039 ~ < 0.13 0.13 ~ < 0.78 0.78 ~ < 2.1 2.1 ~ 7.933
Source: FAO, Statistics Division (FAOSTAT).
65
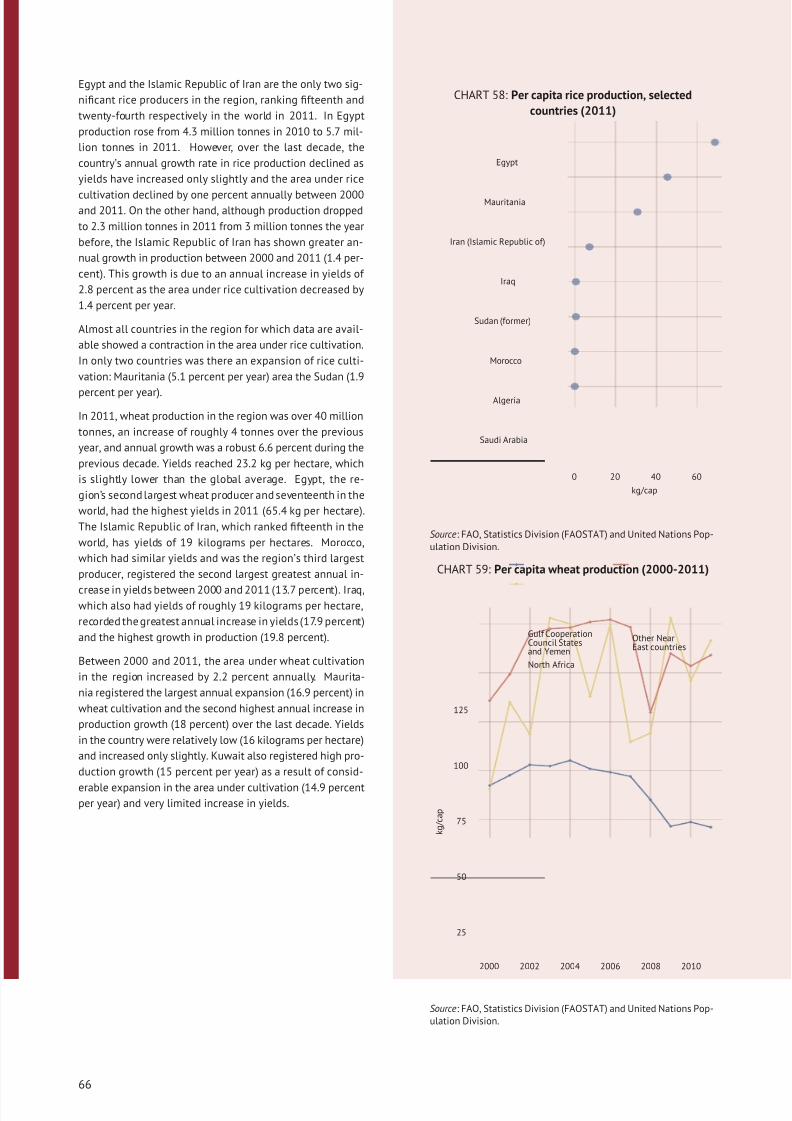
8/12/2019 FAO Statistical Yearbook 2014 Near East and North Africa Food and Agriculture
http://slidepdf.com/reader/full/fao-statistical-yearbook-2014-near-east-and-north-africa-food-and-agriculture 82/174
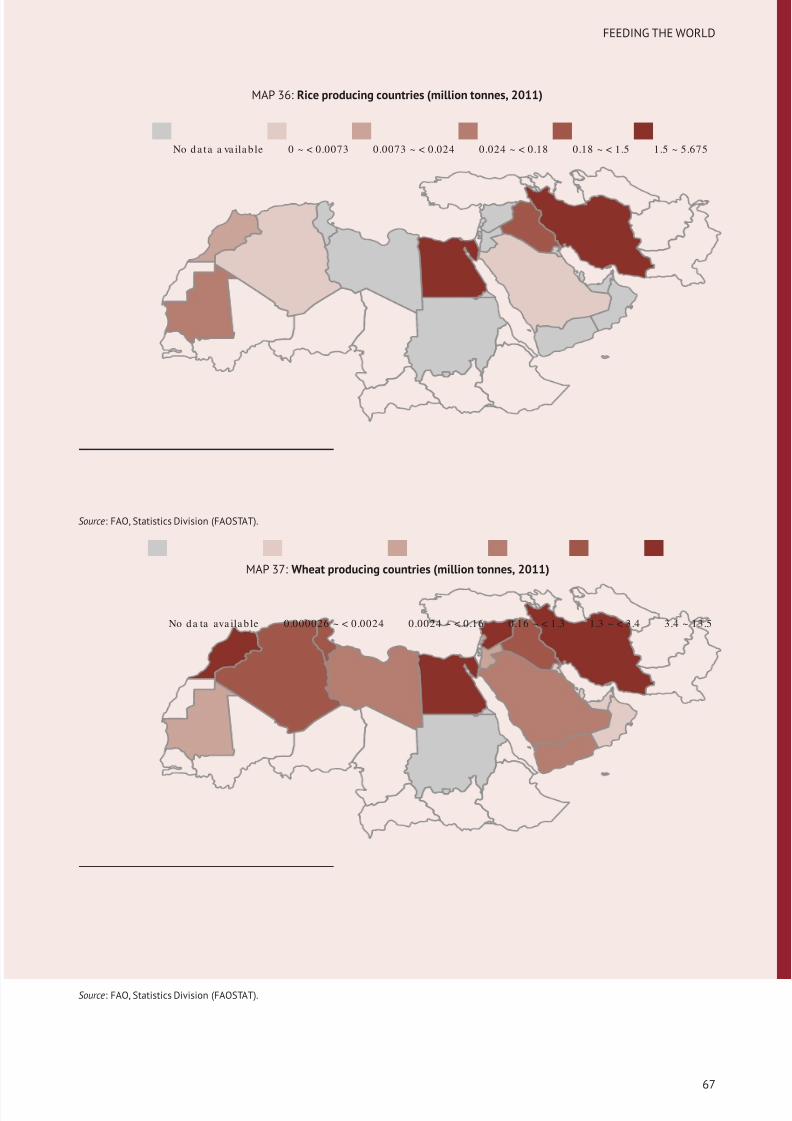
8/12/2019 FAO Statistical Yearbook 2014 Near East and North Africa Food and Agriculture
http://slidepdf.com/reader/full/fao-statistical-yearbook-2014-near-east-and-north-africa-food-and-agriculture 83/174
FEEDING THE WORLD
MAP 36: Rice producing countries (million tonnes, 2011)
No d a ta a va ila b le 0 ~ < 0.0073 0.0073 ~ < 0.024 0.024 ~ < 0.18 0.18 ~ < 1.5 1.5 ~ 5.675
Source: FAO, Statistics Division (FAOSTAT).
MAP 37: Wheat producing countries (million tonnes, 2011)
No da ta ava ila b le 0.000026 ~ < 0.0024 0.0024 ~ < 0.16 0.16 ~ < 1.3 1.3 ~ < 3.4 3.4 ~ 13.5
Source: FAO, Statistics Division (FAOSTAT).
67
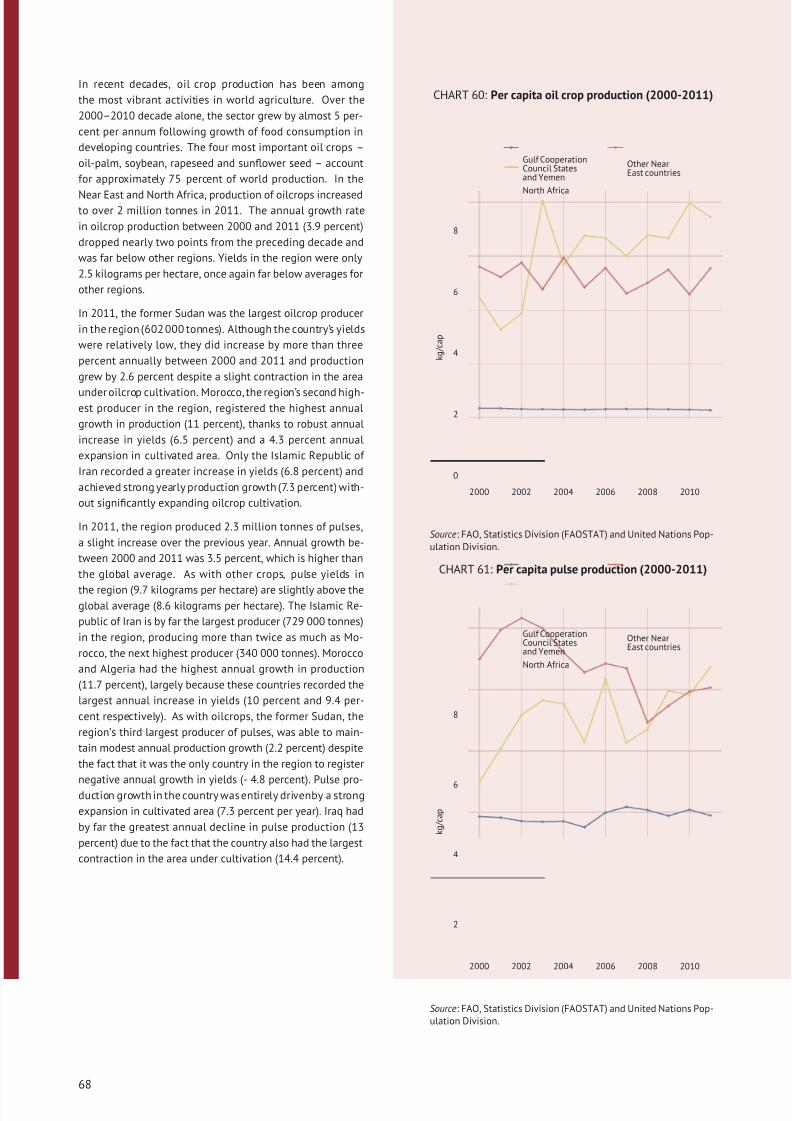
8/12/2019 FAO Statistical Yearbook 2014 Near East and North Africa Food and Agriculture
http://slidepdf.com/reader/full/fao-statistical-yearbook-2014-near-east-and-north-africa-food-and-agriculture 84/174
In recent decades, oil crop production has been among
the most vibrant activities in world agriculture. Over the
2000–2010 decade alone, the sector grew by almost 5 per-
cent per annum following growth of food consumption in
developing countries. The four most important oil crops –
oil-palm, soybean, rapeseed and sunflower seed – account
for approximately 75 percent of world production. In the
Near East and North Africa, production of oilcrops increasedto over 2 million tonnes in 2011. The annual growth rate
in oilcrop production between 2000 and 2011 (3.9 percent)
dropped nearly two points from the preceding decade and
was far below other regions. Yields in the region were only
2.5 kilograms per hectare, once again far below averages for
other regions.
In 2011, the former Sudan was the largest oilcrop producer
in the region (602 000 tonnes). Although the country’s yields
were relatively low, they did increase by more than three
percent annually between 2000 and 2011 and production
grew by 2.6 percent despite a slight contraction in the area
under oilcrop cultivation. Morocco, the region’s second high-est producer in the region, registered the highest annual
growth in production (11 percent), thanks to robust annual
increase in yields (6.5 percent) and a 4.3 percent annual
expansion in cultivated area. Only the Islamic Republic of
Iran recorded a greater increase in yields (6.8 percent) and
achieved strong yearly production growth (7.3 percent) with-
out significantly expanding oilcrop cultivation.
In 2011, the region produced 2.3 million tonnes of pulses,
a slight increase over the previous year. Annual growth be-
tween 2000 and 2011 was 3.5 percent, which is higher than
the global average. As with other crops, pulse yields in
the region (9.7 kilograms per hectare) are slightly above theglobal average (8.6 kilograms per hectare). The Islamic Re-
public of Iran is by far the largest producer (729 000 tonnes)
in the region, producing more than twice as much as Mo-
rocco, the next highest producer (340 000 tonnes). Morocco
and Algeria had the highest annual growth in production
(11.7 percent), largely because these countries recorded the
largest annual increase in yields (10 percent and 9.4 per-
cent respectively). As with oilcrops, the former Sudan, the
region’s third largest producer of pulses, was able to main-
tain modest annual production growth (2.2 percent) despite
the fact that it was the only country in the region to register
negative annual growth in yields (- 4.8 percent). Pulse pro-
duction growth in the country was entirely drivenby a strong
expansion in cultivated area (7.3 percent per year). Iraq had
by far the greatest annual decline in pulse production (13
percent) due to the fact that the country also had the largest
contraction in the area under cultivation (14.4 percent).
CHART 60: Per capita oil crop production (2000-2011)
0
2
4
6
8
2000 2002 2004 2006 2008 2010
k g / c a p
Gulf CooperationCouncil Statesand Yemen
North Africa
Other NearEast countries
Source: FAO, Statistics Division (FAOSTAT) and United Nations Pop-ulation Division.
CHART 61: Per capita pulse production (2000-2011)
2
4
6
8
2000 2002 2004 2006 2008 2010
k g / c a p
Gulf CooperationCouncil Statesand Yemen
North Africa
Other NearEast countries
Source: FAO, Statistics Division (FAOSTAT) and United Nations Pop-ulation Division.
68
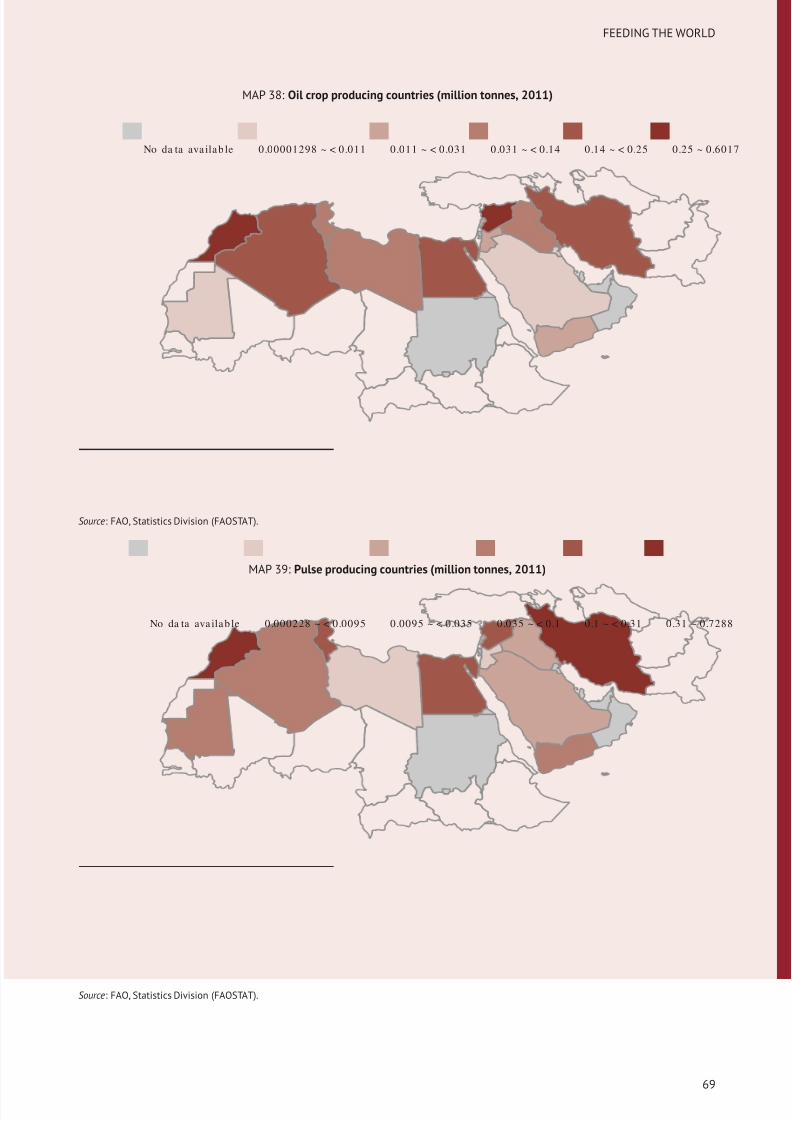
8/12/2019 FAO Statistical Yearbook 2014 Near East and North Africa Food and Agriculture
http://slidepdf.com/reader/full/fao-statistical-yearbook-2014-near-east-and-north-africa-food-and-agriculture 85/174
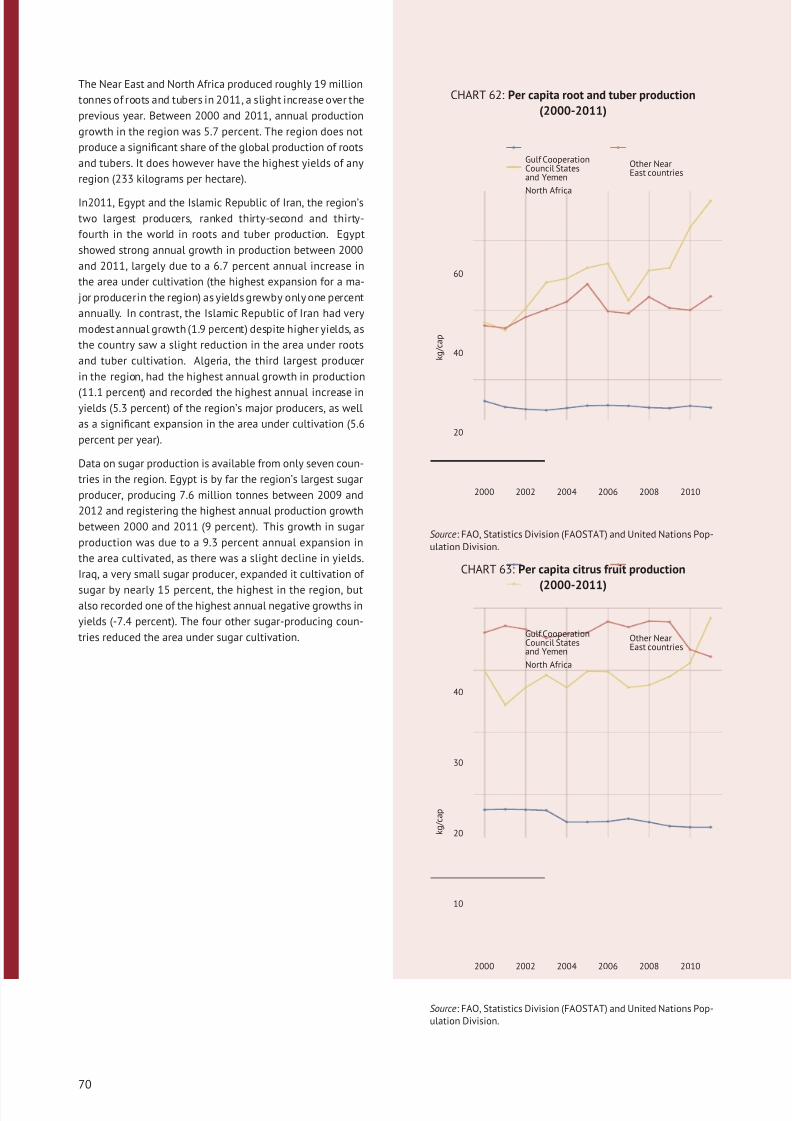
8/12/2019 FAO Statistical Yearbook 2014 Near East and North Africa Food and Agriculture
http://slidepdf.com/reader/full/fao-statistical-yearbook-2014-near-east-and-north-africa-food-and-agriculture 86/174
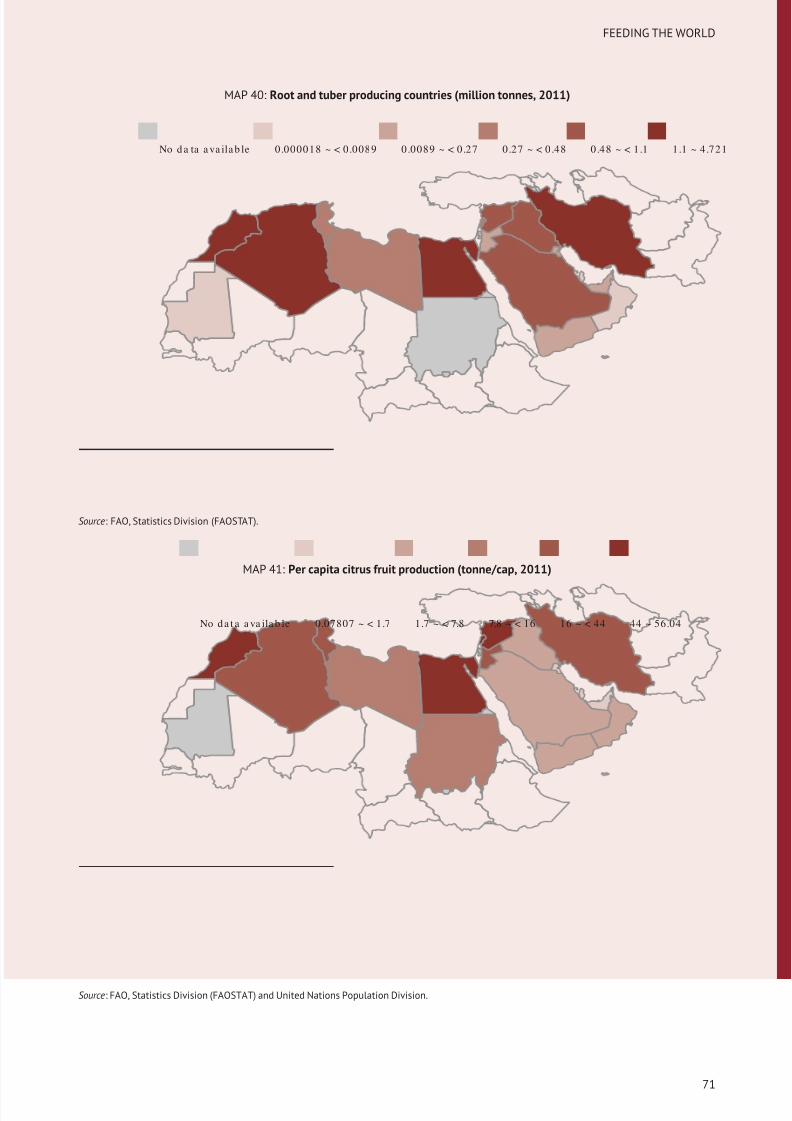
8/12/2019 FAO Statistical Yearbook 2014 Near East and North Africa Food and Agriculture
http://slidepdf.com/reader/full/fao-statistical-yearbook-2014-near-east-and-north-africa-food-and-agriculture 87/174
FEEDING THE WORLD
MAP 40: Root and tuber producing countries (million tonnes, 2011)
No da ta a va ila b le 0.000018 ~ < 0.0089 0.0089 ~ < 0.27 0.27 ~ < 0.48 0.48 ~ < 1.1 1.1 ~ 4.721
Source: FAO, Statistics Division (FAOSTAT).
MAP 41: Per capita citrus fruit production (tonne/cap, 2011)
No da t a a va ila b le 0.07807 ~ < 1.7 1.7 ~ < 7.8 7.8 ~ < 16 16 ~ < 44 44 ~ 56.04
Source: FAO, Statistics Division (FAOSTAT) and United Nations Population Division.
71
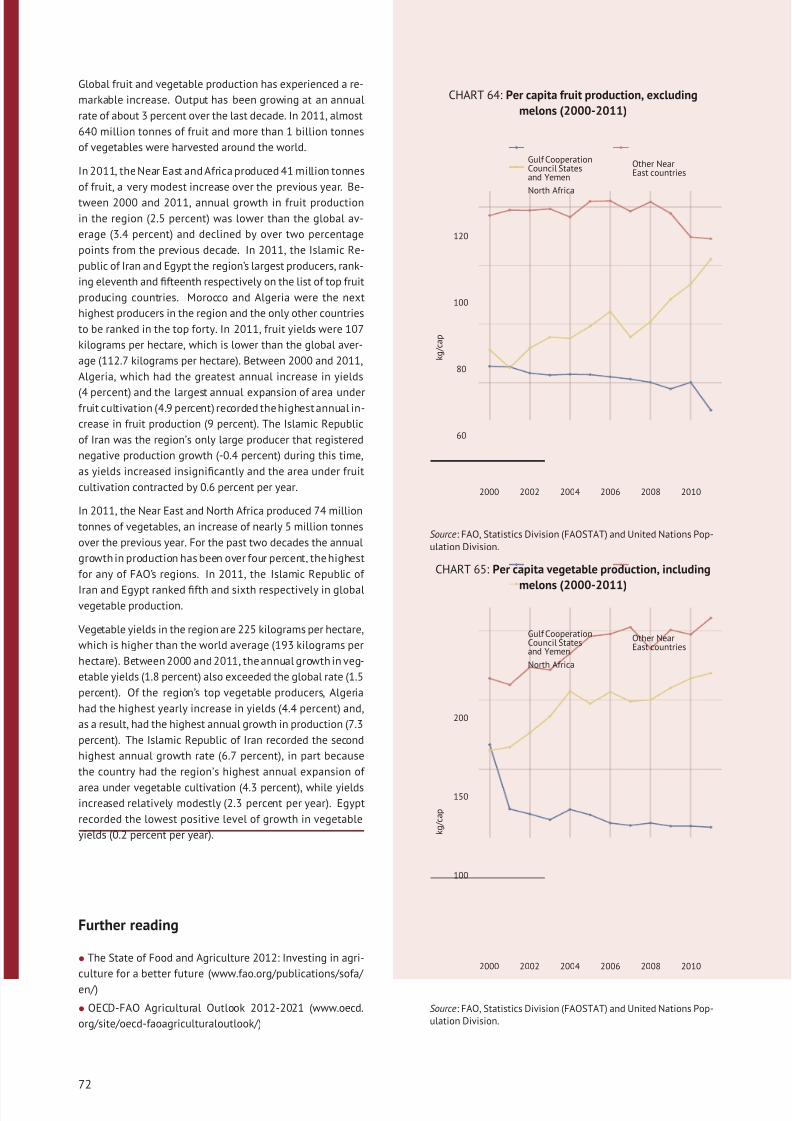
8/12/2019 FAO Statistical Yearbook 2014 Near East and North Africa Food and Agriculture
http://slidepdf.com/reader/full/fao-statistical-yearbook-2014-near-east-and-north-africa-food-and-agriculture 88/174
Global fruit and vegetable production has experienced a re-
markable increase. Output has been growing at an annual
rate of about 3 percent over the last decade. In 2011, almost
640 million tonnes of fruit and more than 1 billion tonnes
of vegetables were harvested around the world.
In 2011, the Near East and Africa produced 41 million tonnes
of fruit, a very modest increase over the previous year. Be-
tween 2000 and 2011, annual growth in fruit production
in the region (2.5 percent) was lower than the global av-
erage (3.4 percent) and declined by over two percentage
points from the previous decade. In 2011, the Islamic Re-
public of Iran and Egypt the region’s largest producers, rank-
ing eleventh and fifteenth respectively on the list of top fruit
producing countries. Morocco and Algeria were the next
highest producers in the region and the only other countries
to be ranked in the top forty. In 2011, fruit yields were 107
kilograms per hectare, which is lower than the global aver-
age (112.7 kilograms per hectare). Between 2000 and 2011,
Algeria, which had the greatest annual increase in yields
(4 percent) and the largest annual expansion of area underfruit cultivation (4.9 percent) recorded the highest annual in-
crease in fruit production (9 percent). The Islamic Republic
of Iran was the region’s only large producer that registered
negative production growth (-0.4 percent) during this time,
as yields increased insignificantly and the area under fruit
cultivation contracted by 0.6 percent per year.
In 2011, the Near East and North Africa produced 74 million
tonnes of vegetables, an increase of nearly 5 million tonnes
over the previous year. For the past two decades the annual
growth in production has been over four percent, the highest
for any of FAO’s regions. In 2011, the Islamic Republic of
Iran and Egypt ranked fifth and sixth respectively in globalvegetable production.
Vegetable yields in the region are 225 kilograms per hectare,
which is higher than the world average (193 kilograms per
hectare). Between 2000 and 2011, the annual growth in veg-
etable yields (1.8 percent) also exceeded the global rate (1.5
percent). Of the region’s top vegetable producers, Algeria
had the highest yearly increase in yields (4.4 percent) and,
as a result, had the highest annual growth in production (7.3
percent). The Islamic Republic of Iran recorded the second
highest annual growth rate (6.7 percent), in part because
the country had the region’s highest annual expansion of
area under vegetable cultivation (4.3 percent), while yieldsincreased relatively modestly (2.3 percent per year). Egypt
recorded the lowest positive level of growth in vegetable
yields (0.2 percent per year).
Further reading
• The State of Food and Agriculture 2012: Investing in agri-
culture for a better future (www.fao.org/publications/sofa/
en/)
• OECD-FAO Agricultural Outlook 2012-2021 (www.oecd.
org/site/oecd-faoagriculturaloutlook/)
CHART 64: Per capita fruit production, excluding
melons (2000-2011)
60
80
100
120
2000 2002 2004 2006 2008 2010
k g / c a p
Gulf CooperationCouncil Statesand Yemen
North Africa
Other NearEast countries
Source: FAO, Statistics Division (FAOSTAT) and United Nations Pop-ulation Division.
CHART 65: Per capita vegetable production, including
melons (2000-2011)
100
150
200
2000 2002 2004 2006 2008 2010
k g / c a p
Gulf CooperationCouncil Statesand Yemen
North Africa
Other NearEast countries
Source: FAO, Statistics Division (FAOSTAT) and United Nations Pop-ulation Division.
72
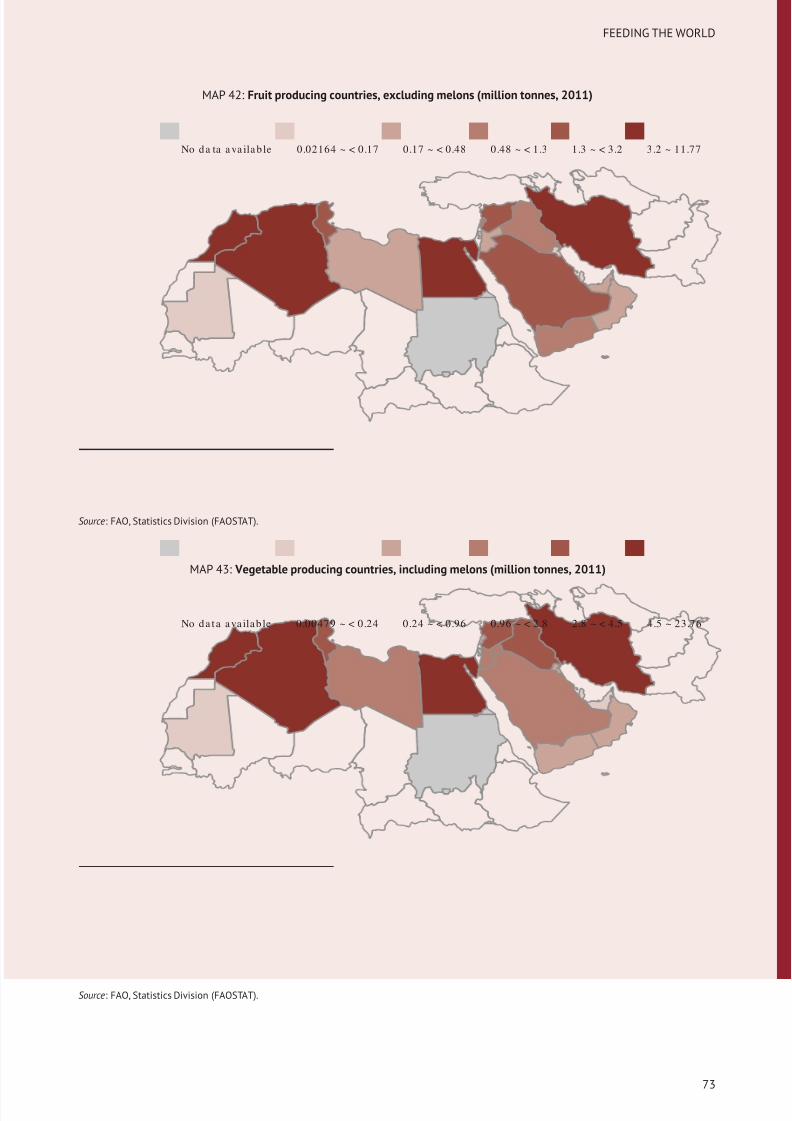
8/12/2019 FAO Statistical Yearbook 2014 Near East and North Africa Food and Agriculture
http://slidepdf.com/reader/full/fao-statistical-yearbook-2014-near-east-and-north-africa-food-and-agriculture 89/174
FEEDING THE WORLD
MAP 42: Fruit producing countries, excluding melons (million tonnes, 2011)
No da ta a va ila b le 0.02164 ~ < 0.17 0.17 ~ < 0.48 0.48 ~ < 1.3 1.3 ~ < 3.2 3.2 ~ 11.77
Source: FAO, Statistics Division (FAOSTAT).
MAP 43: Vegetable producing countries, including melons (million tonnes, 2011)
No da ta ava ilab le 0.00479 ~ < 0.24 0.24 ~ < 0.96 0.96 ~ < 2.8 2.8 ~ < 4.5 4.5 ~ 23.76
Source: FAO, Statistics Division (FAOSTAT).
73
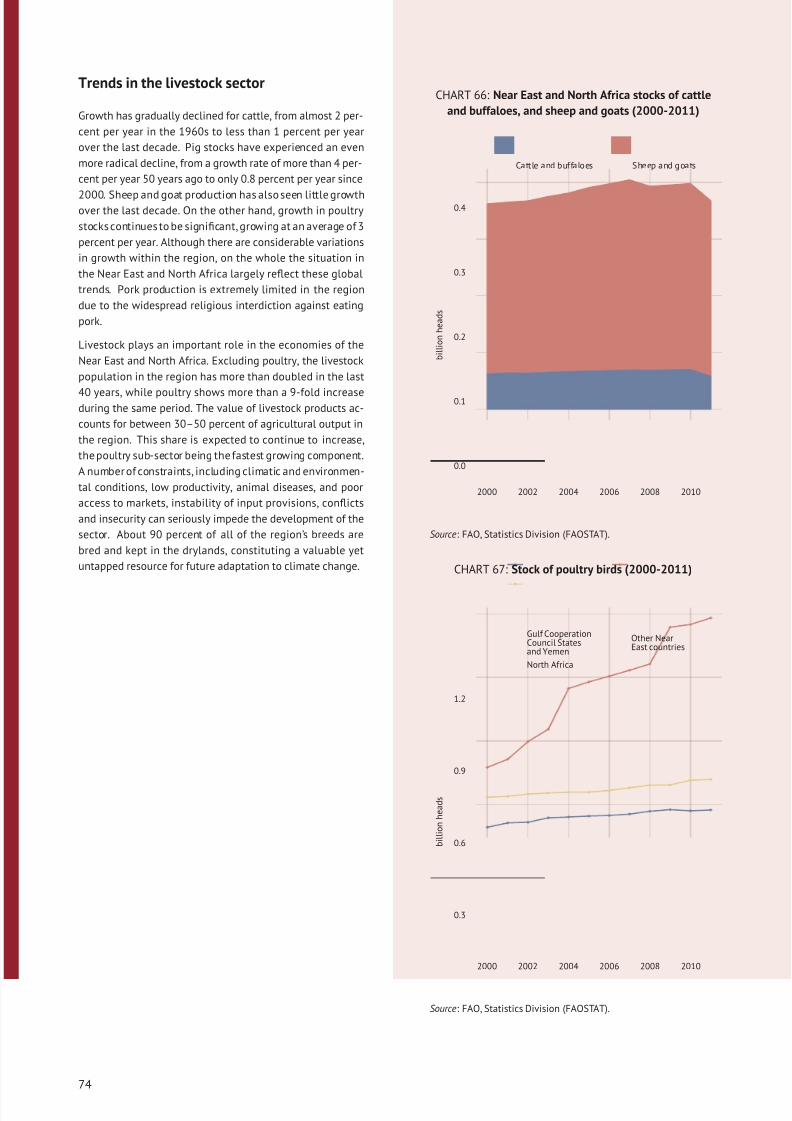
8/12/2019 FAO Statistical Yearbook 2014 Near East and North Africa Food and Agriculture
http://slidepdf.com/reader/full/fao-statistical-yearbook-2014-near-east-and-north-africa-food-and-agriculture 90/174
Trends in the livestock sector
Growth has gradually declined for cattle, from almost 2 per-
cent per year in the 1960s to less than 1 percent per year
over the last decade. Pig stocks have experienced an even
more radical decline, from a growth rate of more than 4 per-
cent per year 50 years ago to only 0.8 percent per year since
2000. Sheep and goat production has also seen little growthover the last decade. On the other hand, growth in poultry
stocks continues to be significant, growing at an average of 3
percent per year. Although there are considerable variations
in growth within the region, on the whole the situation in
the Near East and North Africa largely reflect these global
trends. Pork production is extremely limited in the region
due to the widespread religious interdiction against eating
pork.
Livestock plays an important role in the economies of the
Near East and North Africa. Excluding poultry, the livestock
population in the region has more than doubled in the last
40 years, while poultry shows more than a 9-fold increaseduring the same period. The value of livestock products ac-
counts for between 30–50 percent of agricultural output in
the region. This share is expected to continue to increase,
the poultry sub-sector being the fastest growing component.
A number of constraints, including climatic and environmen-
tal conditions, low productivity, animal diseases, and poor
access to markets, instability of input provisions, conflicts
and insecurity can seriously impede the development of the
sector. About 90 percent of all of the region’s breeds are
bred and kept in the drylands, constituting a valuable yet
untapped resource for future adaptation to climate change.
CHART 66: Near East and North Africa stocks of cattle
and buffaloes, and sheep and goats (2000-2011)
0.0
0.1
0.2
0.3
0.4
2000 2002 2004 2006 2008 2010
b i l l i o n h e a d s
Cattle and buffaloes Sheep and goats
Source: FAO, Statistics Division (FAOSTAT).
CHART 67: Stock of poultry birds (2000-2011)
0.3
0.6
0.9
1.2
2000 2002 2004 2006 2008 2010
b i l l i o n h e a d s
Gulf CooperationCouncil Statesand Yemen
North Africa
Other NearEast countries
Source: FAO, Statistics Division (FAOSTAT).
74
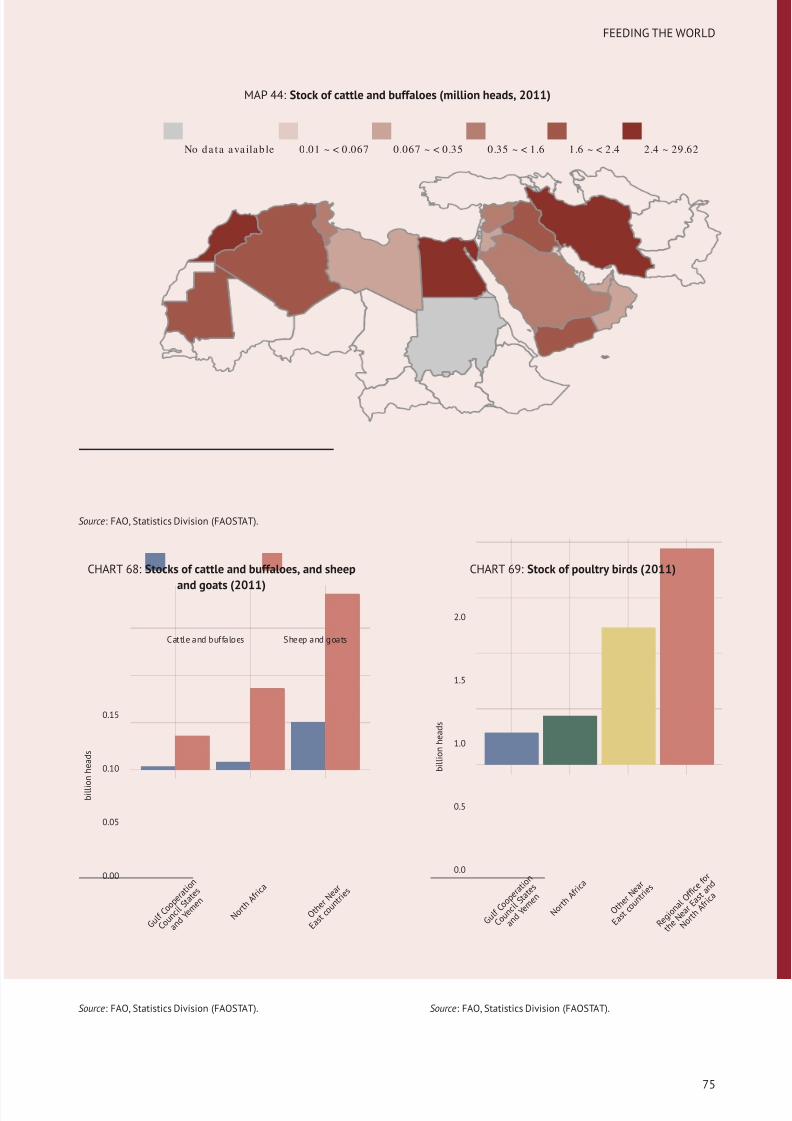
8/12/2019 FAO Statistical Yearbook 2014 Near East and North Africa Food and Agriculture
http://slidepdf.com/reader/full/fao-statistical-yearbook-2014-near-east-and-north-africa-food-and-agriculture 91/174
FEEDING THE WORLD
MAP 44: Stock of cattle and buffaloes (million heads, 2011)
No da ta ava ilab le 0.01 ~ < 0.067 0.067 ~ < 0.35 0.35 ~ < 1.6 1.6 ~ < 2.4 2.4 ~ 29.62
Source: FAO, Statistics Division (FAOSTAT).
CHART 68: Stocks of cattle and buffaloes, and sheep
and goats (2011)
0.00
0.05
0.10
0.15
G u l f
C o o p
e r a t
i o n
C o u n
c i l S t a
t e s
a n d Y e
m e n
N o r t h
A f r i c
a
O t h e
r N e a
r
E a s t
c o u n
t r i e s
b i l l i o n h e a d s
Cattle and buffaloes Sheep and goats
Source: FAO, Statistics Division (FAOSTAT).
CHART 69: Stock of poultry birds (2011)
0.0
0.5
1.0
1.5
2.0
G u l f
C o o p
e r a t
i o n
C o u n
c i l S t a t
e s
a n d Y e
m e n
N o r t h
A f r i c
a
O t h e
r N e a
r
E a s t
c o u n
t r i e s
R e g i o
n a l O
f fi c e
f o r
t h e N e
a r E a
s t a n
d
N o r t h
A f r i c
a
b i l l i o n h e a d s
Source: FAO, Statistics Division (FAOSTAT).
75
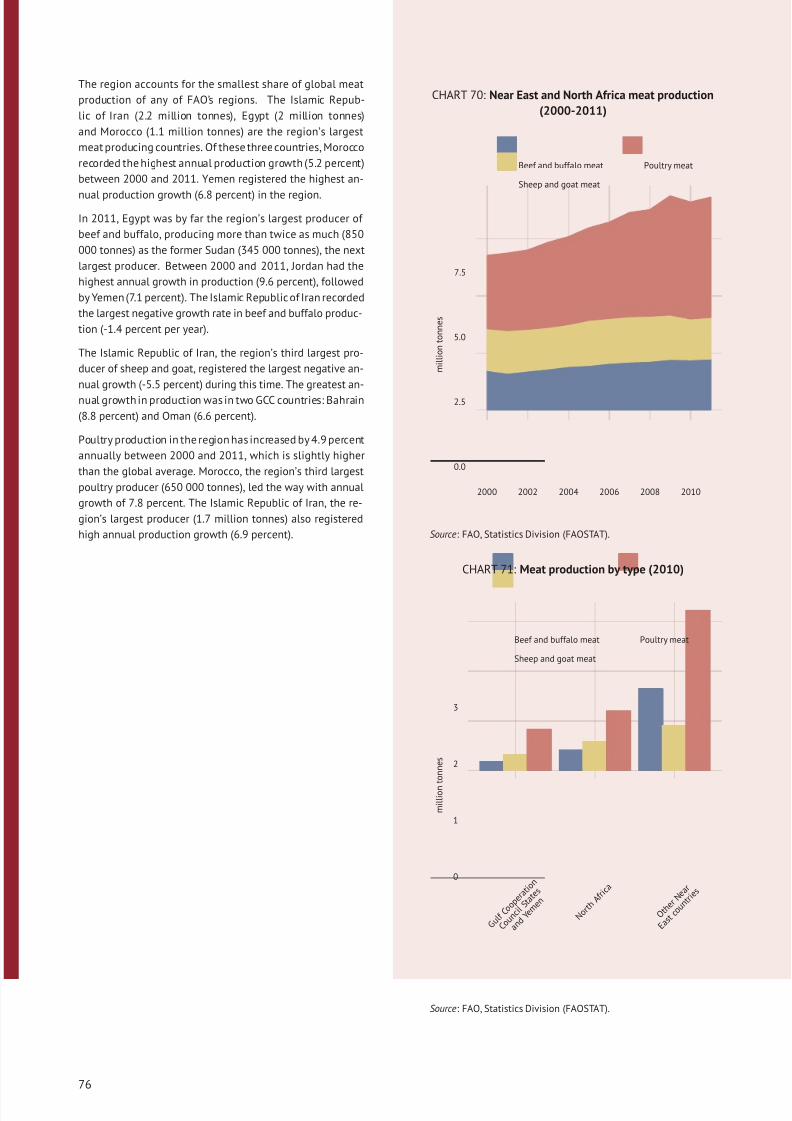
8/12/2019 FAO Statistical Yearbook 2014 Near East and North Africa Food and Agriculture
http://slidepdf.com/reader/full/fao-statistical-yearbook-2014-near-east-and-north-africa-food-and-agriculture 92/174
The region accounts for the smallest share of global meat
production of any of FAO’s regions. The Islamic Repub-
lic of Iran (2.2 million tonnes), Egypt (2 million tonnes)
and Morocco (1.1 million tonnes) are the region’s largest
meat producing countries. Of these three countries, Morocco
recorded the highest annual production growth (5.2 percent)
between 2000 and 2011. Yemen registered the highest an-
nual production growth (6.8 percent) in the region.
In 2011, Egypt was by far the region’s largest producer of
beef and buffalo, producing more than twice as much (850
000 tonnes) as the former Sudan (345 000 tonnes), the next
largest producer. Between 2000 and 2011, Jordan had the
highest annual growth in production (9.6 percent), followed
by Yemen (7.1 percent). The Islamic Republic of Iran recorded
the largest negative growth rate in beef and buffalo produc-
tion (-1.4 percent per year).
The Islamic Republic of Iran, the region’s third largest pro-
ducer of sheep and goat, registered the largest negative an-
nual growth (-5.5 percent) during this time. The greatest an-
nual growth in production was in two GCC countries: Bahrain
(8.8 percent) and Oman (6.6 percent).
Poultry production in the region has increased by 4.9 percent
annually between 2000 and 2011, which is slightly higher
than the global average. Morocco, the region’s third largest
poultry producer (650 000 tonnes), led the way with annual
growth of 7.8 percent. The Islamic Republic of Iran, the re-
gion’s largest producer (1.7 million tonnes) also registered
high annual production growth (6.9 percent).
CHART 70: Near East and North Africa meat production
(2000-2011)
0.0
2.5
5.0
7.5
2000 2002 2004 2006 2008 2010
m i l l i o n t o n n e s
Beef and buffalo meat
Sheep and goat meat
Poultry meat
Source: FAO, Statistics Division (FAOSTAT).
CHART 71: Meat production by type (2010)
0
1
2
3
G u l f
C o o p
e r a t
i o n
C o u n
c i l S t a t
e s
a n d
Y e m e
n
N o r t h
A f r i c
a
O t h e
r N e a
r
E a s t
c o u n
t r i e s
m i l l i o n
t o n n e s
Beef and buffalo meat
Sheep and goat meat
Poultry meat
Source: FAO, Statistics Division (FAOSTAT).
76
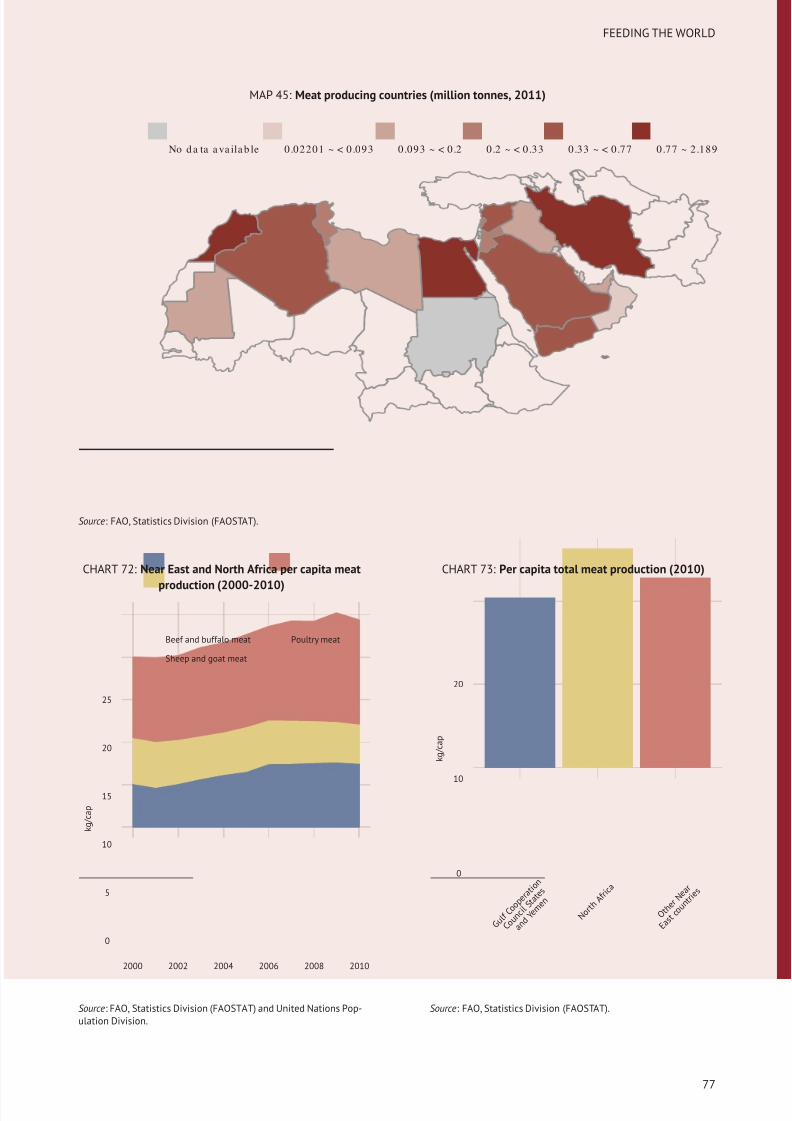
8/12/2019 FAO Statistical Yearbook 2014 Near East and North Africa Food and Agriculture
http://slidepdf.com/reader/full/fao-statistical-yearbook-2014-near-east-and-north-africa-food-and-agriculture 93/174
FEEDING THE WORLD
MAP 45: Meat producing countries (million tonnes, 2011)
No da ta a va ila b le 0.02201 ~ < 0.093 0.093 ~ < 0.2 0.2 ~ < 0.33 0.33 ~ < 0.77 0.77 ~ 2.189
Source: FAO, Statistics Division (FAOSTAT).
CHART 72: Near East and North Africa per capita meat
production (2000-2010)
0
5
10
15
20
25
2000 2002 2004 2006 2008 2010
k g / c a p
Beef and buffalo meat
Sheep and goat meat
Poultry meat
Source: FAO, Statistics Division (FAOSTAT) and United Nations Pop-ulation Division.
CHART 73: Per capita total meat production (2010)
0
10
20
G u l f
C o o p
e r a t
i o n
C o u n
c i l S t a
t e s
a n d Y e
m e n
N o r t h
A f r i c
a
O t h e
r N e a
r
E a s t
c o u n
t r i e s
k g / c a p
Source: FAO, Statistics Division (FAOSTAT).
77
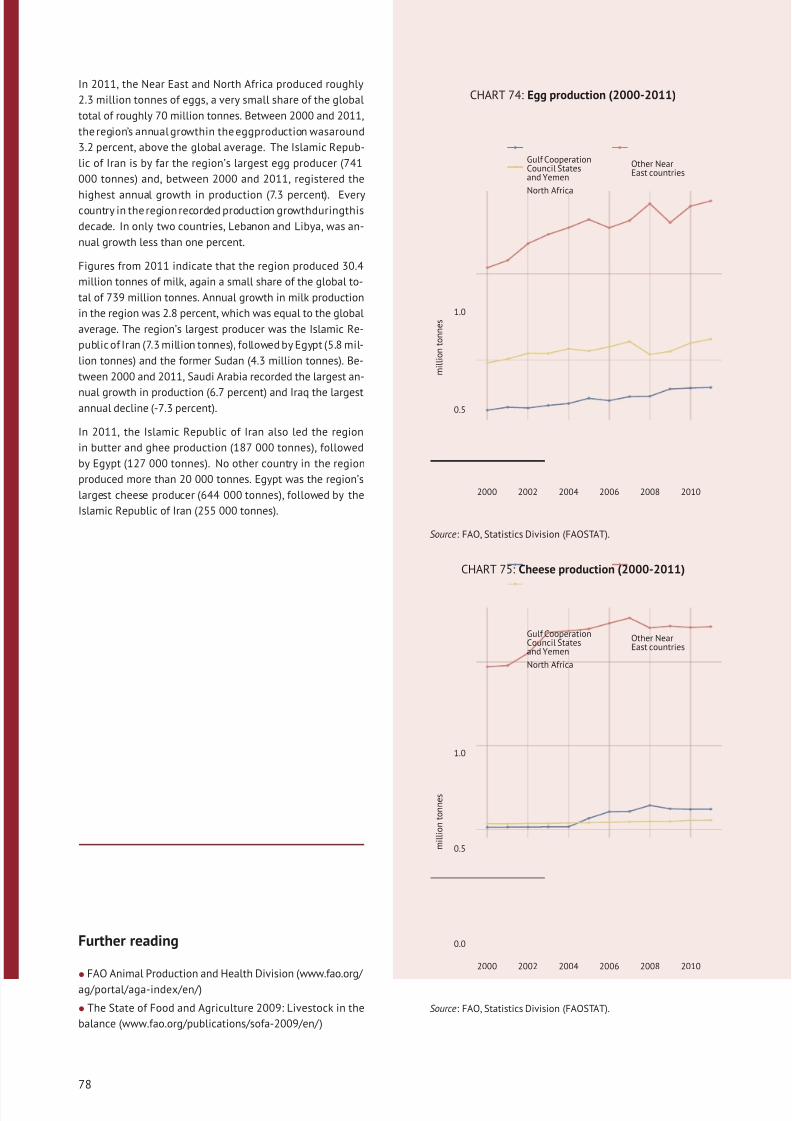
8/12/2019 FAO Statistical Yearbook 2014 Near East and North Africa Food and Agriculture
http://slidepdf.com/reader/full/fao-statistical-yearbook-2014-near-east-and-north-africa-food-and-agriculture 94/174
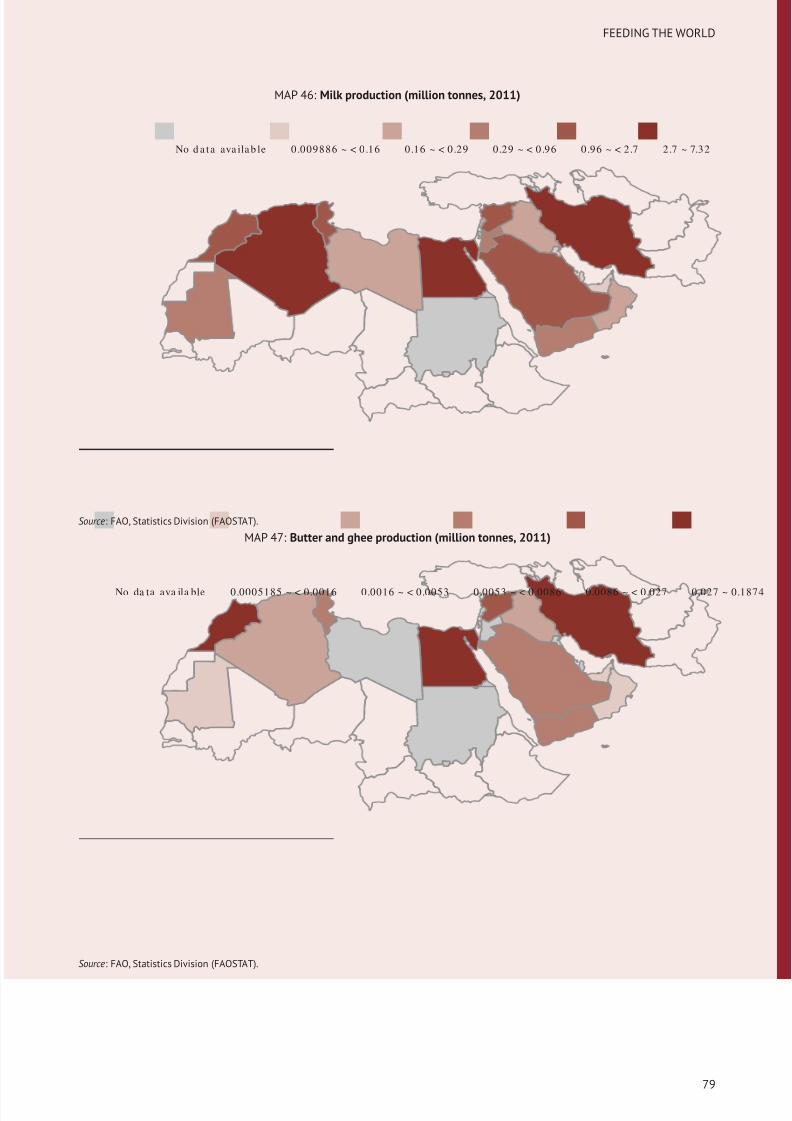
8/12/2019 FAO Statistical Yearbook 2014 Near East and North Africa Food and Agriculture
http://slidepdf.com/reader/full/fao-statistical-yearbook-2014-near-east-and-north-africa-food-and-agriculture 95/174
FEEDING THE WORLD
MAP 46: Milk production (million tonnes, 2011)
No d a ta ava ila b le 0.009886 ~ < 0.16 0.16 ~ < 0.29 0.29 ~ < 0.96 0.96 ~ < 2.7 2.7 ~ 7.32
Source: FAO, Statistics Division (FAOSTAT).
MAP 47: Butter and ghee production (million tonnes, 2011)
No da ta ava ila ble 0.0005185 ~ < 0.0016 0.0016 ~ < 0.0053 0.0053 ~ < 0.0086 0.0086 ~ < 0.027 0.027 ~ 0.1874
Source: FAO, Statistics Division (FAOSTAT).
79
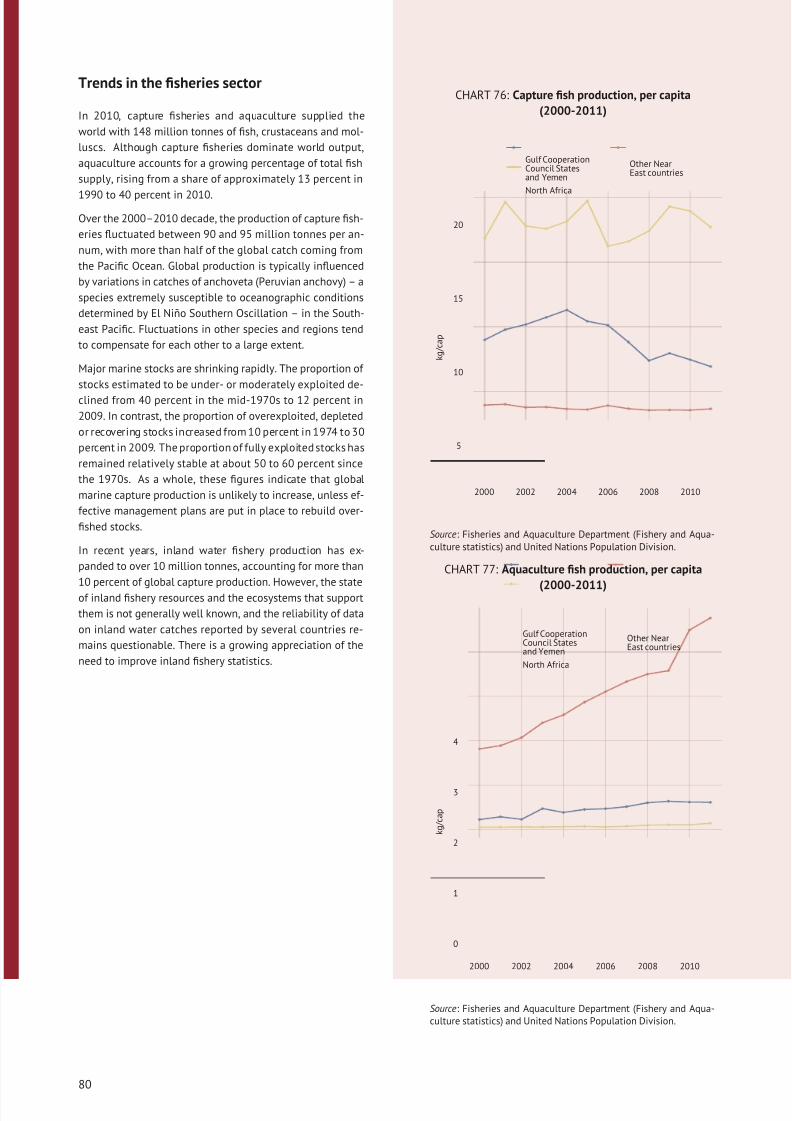
8/12/2019 FAO Statistical Yearbook 2014 Near East and North Africa Food and Agriculture
http://slidepdf.com/reader/full/fao-statistical-yearbook-2014-near-east-and-north-africa-food-and-agriculture 96/174
Trends in the fisheries sector
In 2010, capture fisheries and aquaculture supplied the
world with 148 million tonnes of fish, crustaceans and mol-
luscs. Although capture fisheries dominate world output,
aquaculture accounts for a growing percentage of total fish
supply, rising from a share of approximately 13 percent in
1990 to 40 percent in 2010.
Over the 2000–2010 decade, the production of capture fish-
eries fluctuated between 90 and 95 million tonnes per an-
num, with more than half of the global catch coming from
the Pacific Ocean. Global production is typically influenced
by variations in catches of anchoveta (Peruvian anchovy) – a
species extremely susceptible to oceanographic conditions
determined by El Niño Southern Oscillation – in the South-
east Pacific. Fluctuations in other species and regions tend
to compensate for each other to a large extent.
Major marine stocks are shrinking rapidly. The proportion of
stocks estimated to be under- or moderately exploited de-
clined from 40 percent in the mid-1970s to 12 percent in
2009. In contrast, the proportion of overexploited, depleted
or recovering stocks increased from 10 percent in 1974 to 30
percent in 2009. The proportion of fully exploited stocks has
remained relatively stable at about 50 to 60 percent since
the 1970s. As a whole, these figures indicate that global
marine capture production is unlikely to increase, unless ef-
fective management plans are put in place to rebuild over-
fished stocks.
In recent years, inland water fishery production has ex-
panded to over 10 million tonnes, accounting for more than
10 percent of global capture production. However, the state
of inland fishery resources and the ecosystems that support
them is not generally well known, and the reliability of data
on inland water catches reported by several countries re-
mains questionable. There is a growing appreciation of the
need to improve inland fishery statistics.
CHART 76: Capture fish production, per capita
(2000-2011)
5
10
15
20
2000 2002 2004 2006 2008 2010
k g / c a p
Gulf CooperationCouncil Statesand Yemen
North Africa
Other NearEast countries
Source: Fisheries and Aquaculture Department (Fishery and Aqua-culture statistics) and United Nations Population Division.
CHART 77: Aquaculture fish production, per capita
(2000-2011)
0
1
2
3
4
2000 2002 2004 2006 2008 2010
k g / c a p
Gulf CooperationCouncil Statesand Yemen
North Africa
Other NearEast countries
Source: Fisheries and Aquaculture Department (Fishery and Aqua-culture statistics) and United Nations Population Division.
80
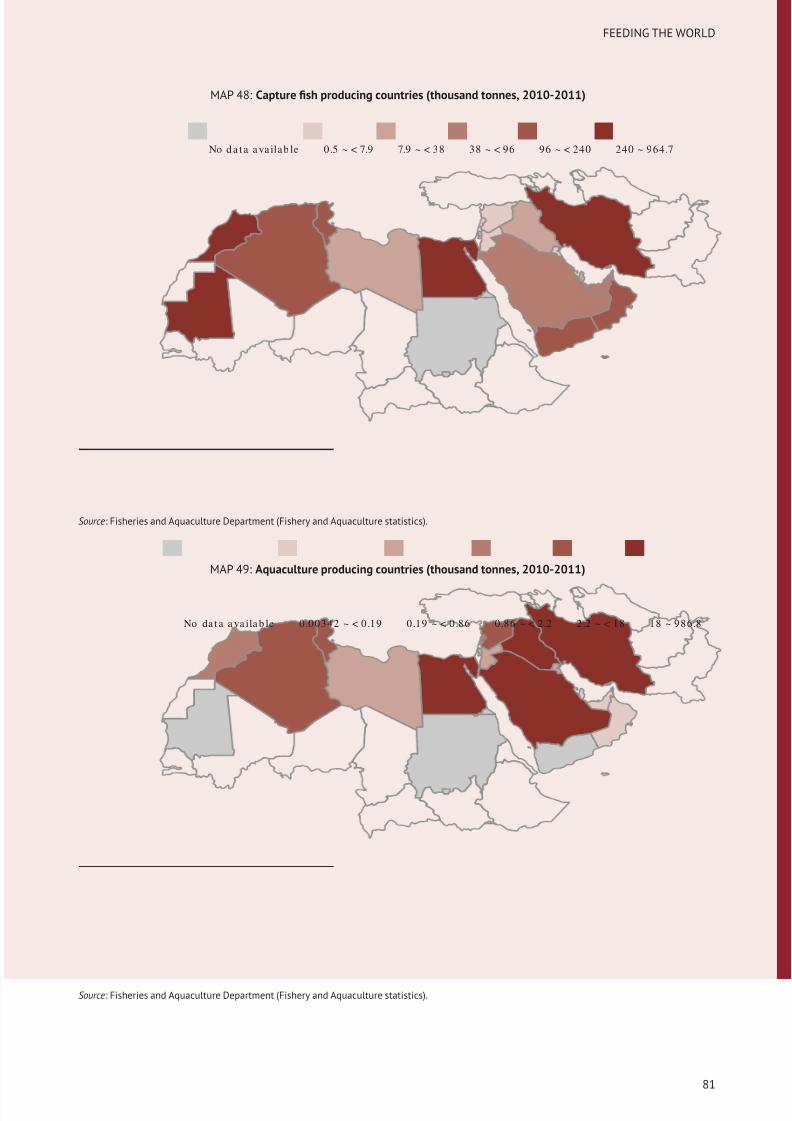
8/12/2019 FAO Statistical Yearbook 2014 Near East and North Africa Food and Agriculture
http://slidepdf.com/reader/full/fao-statistical-yearbook-2014-near-east-and-north-africa-food-and-agriculture 97/174
FEEDING THE WORLD
MAP 48: Capture fish producing countries (thousand tonnes, 2010-2011)
No da ta ava ilab le 0.5 ~ < 7.9 7.9 ~ < 38 38 ~ < 96 96 ~ < 240 240 ~ 964.7
Source: Fisheries and Aquaculture Department (Fishery and Aquaculture statistics).
MAP 49: Aquaculture producing countries (thousand tonnes, 2010-2011)
No da t a a va ila b le 0.00342 ~ < 0.19 0.19 ~ < 0.86 0.86 ~ < 2.2 2.2 ~ < 18 18 ~ 986.8
Source: Fisheries and Aquaculture Department (Fishery and Aquaculture statistics).
81
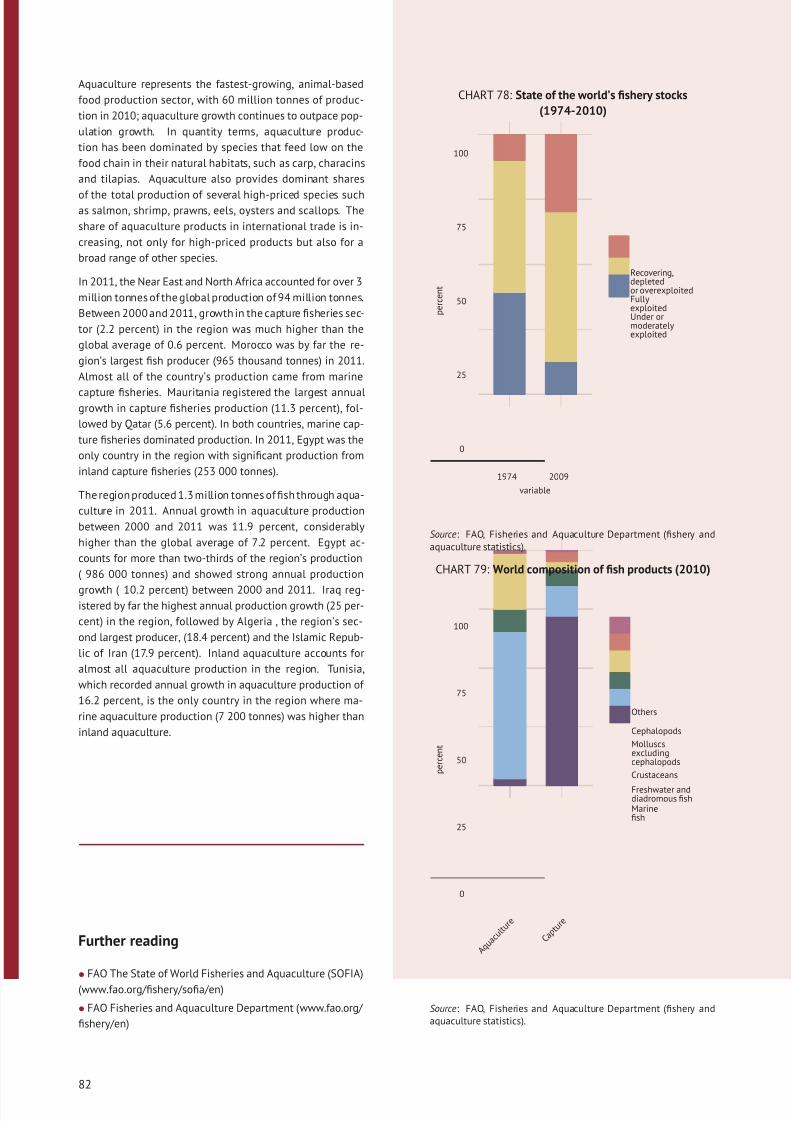
8/12/2019 FAO Statistical Yearbook 2014 Near East and North Africa Food and Agriculture
http://slidepdf.com/reader/full/fao-statistical-yearbook-2014-near-east-and-north-africa-food-and-agriculture 98/174
Aquaculture represents the fastest-growing, animal-based
food production sector, with 60 million tonnes of produc-
tion in 2010; aquaculture growth continues to outpace pop-
ulation growth. In quantity terms, aquaculture produc-
tion has been dominated by species that feed low on the
food chain in their natural habitats, such as carp, characins
and tilapias. Aquaculture also provides dominant shares
of the total production of several high-priced species suchas salmon, shrimp, prawns, eels, oysters and scallops. The
share of aquaculture products in international trade is in-
creasing, not only for high-priced products but also for a
broad range of other species.
In 2011, the Near East and North Africa accounted for over 3
million tonnes of the global production of 94 million tonnes.
Between 2000 and 2011, growth in the capture fisheries sec-
tor (2.2 percent) in the region was much higher than the
global average of 0.6 percent. Morocco was by far the re-
gion’s largest fish producer (965 thousand tonnes) in 2011.
Almost all of the country’s production came from marine
capture fisheries. Mauritania registered the largest annualgrowth in capture fisheries production (11.3 percent), fol-
lowed by Qatar (5.6 percent). In both countries, marine cap-
ture fisheries dominated production. In 2011, Egypt was the
only country in the region with significant production from
inland capture fisheries (253 000 tonnes).
The region produced 1.3 million tonnes of fish through aqua-
culture in 2011. Annual growth in aquaculture production
between 2000 and 2011 was 11.9 percent, considerably
higher than the global average of 7.2 percent. Egypt ac-
counts for more than two-thirds of the region’s production
( 986 000 tonnes) and showed strong annual production
growth ( 10.2 percent) between 2000 and 2011. Iraq reg-istered by far the highest annual production growth (25 per-
cent) in the region, followed by Algeria , the region’s sec-
ond largest producer, (18.4 percent) and the Islamic Repub-
lic of Iran (17.9 percent). Inland aquaculture accounts for
almost all aquaculture production in the region. Tunisia,
which recorded annual growth in aquaculture production of
16.2 percent, is the only country in the region where ma-
rine aquaculture production (7 200 tonnes) was higher than
inland aquaculture.
Further reading
• FAO The State of World Fisheries and Aquaculture (SOFIA)
(www.fao.org/fishery/sofia/en)
• FAO Fisheries and Aquaculture Department (www.fao.org/
fishery/en)
CHART 78: State of the world’s fishery stocks
(1974-2010)
0
25
50
75
100
1974 2009
variable
p e r c e n t
Recovering,depletedor overexploitedFullyexploitedUnder ormoderatelyexploited
Source: FAO, Fisheries and Aquaculture Department (fishery andaquaculture statistics).
CHART 79: World composition of fish products (2010)
0
25
50
75
100
A q u a c u
l t u r e
C a p t
u r e
p e r c e n t
Others
Cephalopods
Molluscsexcludingcephalopods
Crustaceans
Freshwater anddiadromous fishMarinefish
Source: FAO, Fisheries and Aquaculture Department (fishery andaquaculture statistics).
82
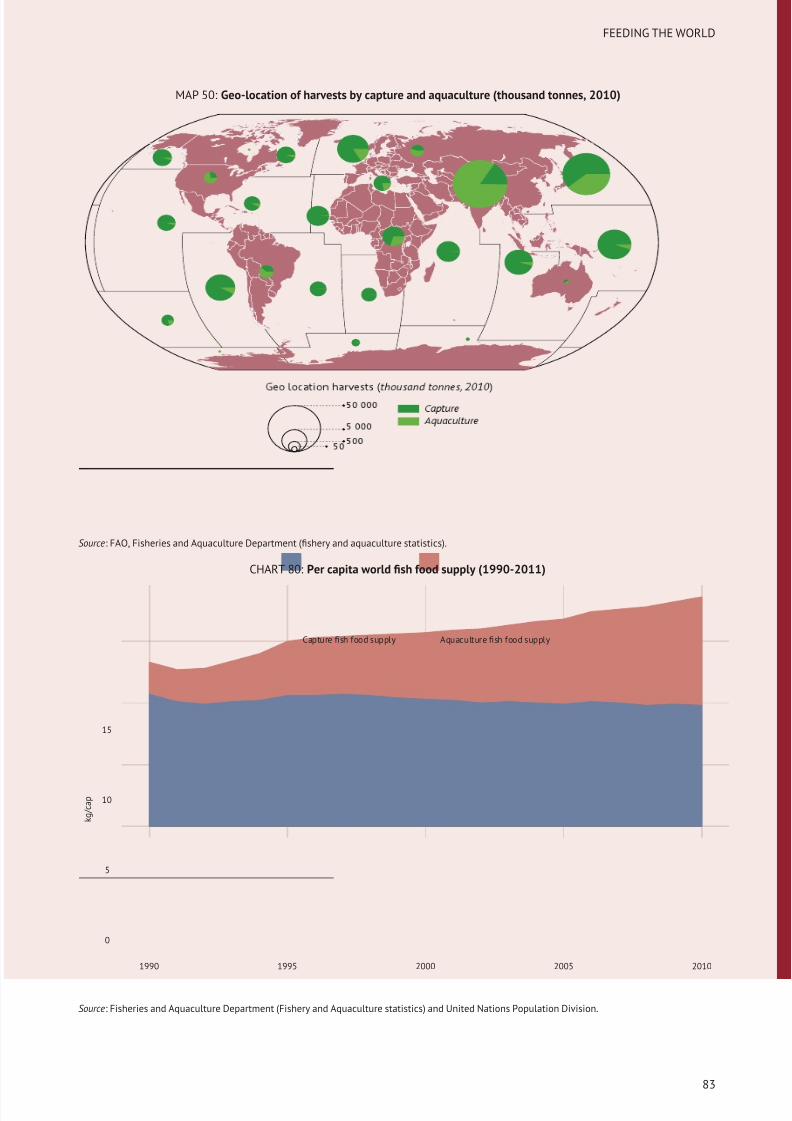
8/12/2019 FAO Statistical Yearbook 2014 Near East and North Africa Food and Agriculture
http://slidepdf.com/reader/full/fao-statistical-yearbook-2014-near-east-and-north-africa-food-and-agriculture 99/174
FEEDING THE WORLD
MAP 50: Geo-location of harvests by capture and aquaculture (thousand tonnes, 2010)
Source: FAO, Fisheries and Aquaculture Department (fishery and aquaculture statistics).
CHART 80: Per capita world fish food supply (1990-2011)
0
5
10
15
1990 1995 2000 2005 2010
k g / c a p
Capture fish food supply Aquaculture fish food supply
Source: Fisheries and Aquaculture Department (Fishery and Aquaculture statistics) and United Nations Population Division.
83
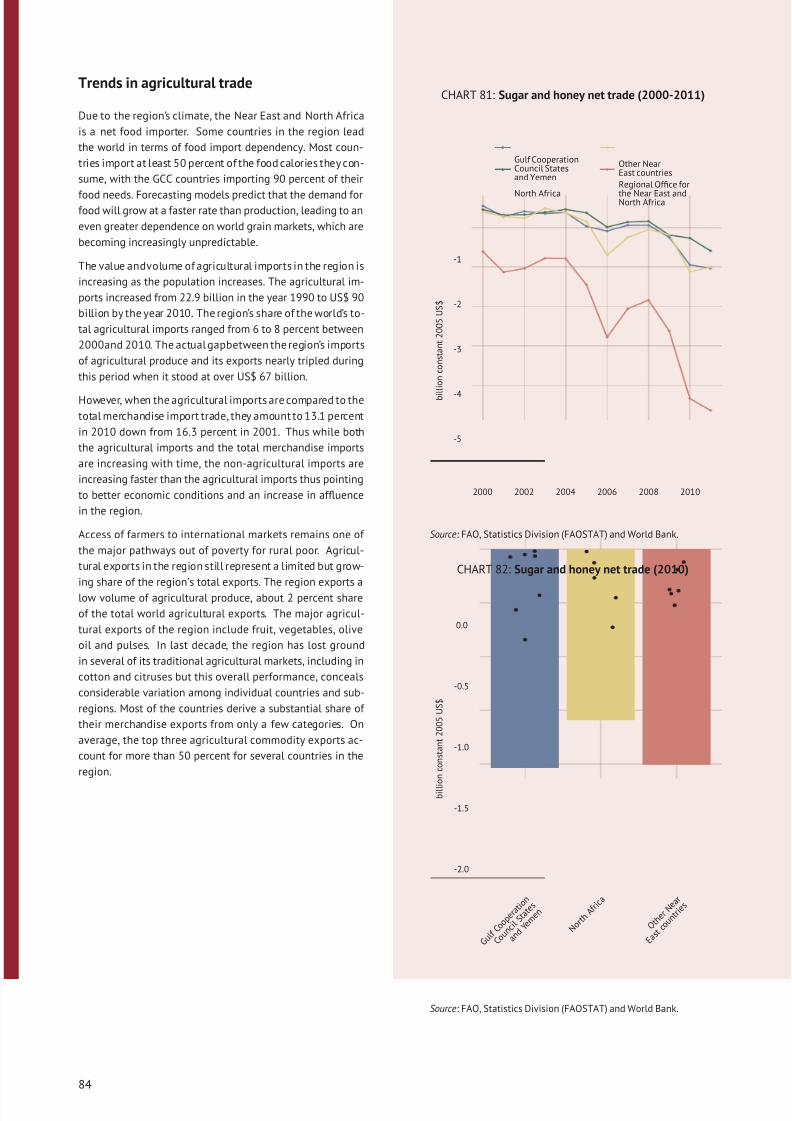
8/12/2019 FAO Statistical Yearbook 2014 Near East and North Africa Food and Agriculture
http://slidepdf.com/reader/full/fao-statistical-yearbook-2014-near-east-and-north-africa-food-and-agriculture 100/174
Trends in agricultural trade
Due to the region’s climate, the Near East and North Africa
is a net food importer. Some countries in the region lead
the world in terms of food import dependency. Most coun-
tries import at least 50 percent of the food calories they con-
sume, with the GCC countries importing 90 percent of their
food needs. Forecasting models predict that the demand forfood will grow at a faster rate than production, leading to an
even greater dependence on world grain markets, which are
becoming increasingly unpredictable.
The value andvolume of agricultural imports in the region is
increasing as the population increases. The agricultural im-
ports increased from 22.9 billion in the year 1990 to US$ 90
billion by the year 2010. The region’s share of the world’s to-
tal agricultural imports ranged from 6 to 8 percent between
2000and 2010. The actual gapbetween the region’s imports
of agricultural produce and its exports nearly tripled during
this period when it stood at over US$ 67 billion.
However, when the agricultural imports are compared to the
total merchandise import trade, they amount to 13.1 percent
in 2010 down from 16.3 percent in 2001. Thus while both
the agricultural imports and the total merchandise imports
are increasing with time, the non-agricultural imports are
increasing faster than the agricultural imports thus pointing
to better economic conditions and an increase in affluence
in the region.
Access of farmers to international markets remains one of
the major pathways out of poverty for rural poor. Agricul-
tural exports in the region still represent a limited but grow-
ing share of the region’s total exports. The region exports a
low volume of agricultural produce, about 2 percent share
of the total world agricultural exports. The major agricul-
tural exports of the region include fruit, vegetables, olive
oil and pulses. In last decade, the region has lost ground
in several of its traditional agricultural markets, including in
cotton and citruses but this overall performance, conceals
considerable variation among individual countries and sub-
regions. Most of the countries derive a substantial share of
their merchandise exports from only a few categories. On
average, the top three agricultural commodity exports ac-
count for more than 50 percent for several countries in the
region.
CHART 81: Sugar and honey net trade (2000-2011)
-5
-4
-3
-2
-1
2000 2002 2004 2006 2008 2010
b i l l i o n c o n s t a n t 2 0 0 5 U S $
Gulf CooperationCouncil Statesand Yemen
North Africa
Other NearEast countries
Regional Office for
the Near East andNorth Africa
Source: FAO, Statistics Division (FAOSTAT) and World Bank.
CHART 82: Sugar and honey net trade (2010)
-2.0
-1.5
-1.0
-0.5
0.0
G u l f
C o o p
e r a t
i o n
C o u n
c i l S t a t
e s
a n d Y e
m e n
N o r t h
A f r i c a
O t h e
r N e a
r
E a s t
c o u n
t r i e s
b i l l i o n c o n s t a n t 2 0 0 5 U S $
Source: FAO, Statistics Division (FAOSTAT) and World Bank.
84
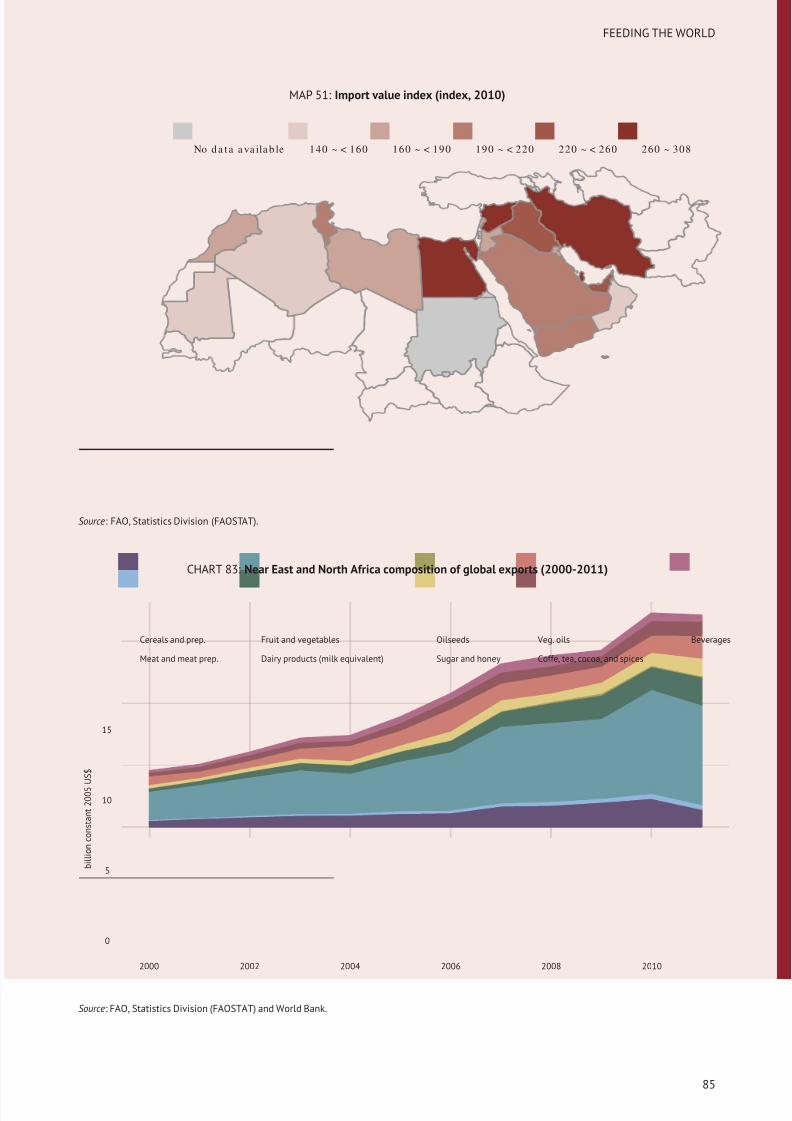
8/12/2019 FAO Statistical Yearbook 2014 Near East and North Africa Food and Agriculture
http://slidepdf.com/reader/full/fao-statistical-yearbook-2014-near-east-and-north-africa-food-and-agriculture 101/174
FEEDING THE WORLD
MAP 51: Import value index (index, 2010)
No da ta a va ila b le 140 ~ < 160 160 ~ < 190 190 ~ < 220 220 ~ < 260 260 ~ 308
Source: FAO, Statistics Division (FAOSTAT).
CHART 83: Near East and North Africa composition of global exports (2000-2011)
0
5
10
15
2000 2002 2004 2006 2008 2010
b i l l i o n c o n s t a n t 2 0 0 5 U S $
Cereals and prep.
Meat and meat prep.
Fruit and vegetables
Dairy products (milk equivalent)
Oilseeds
Sugar and honey
Veg. oils
Coffe, tea, cocoa, and spices
Beverages
Source: FAO, Statistics Division (FAOSTAT) and World Bank.
85
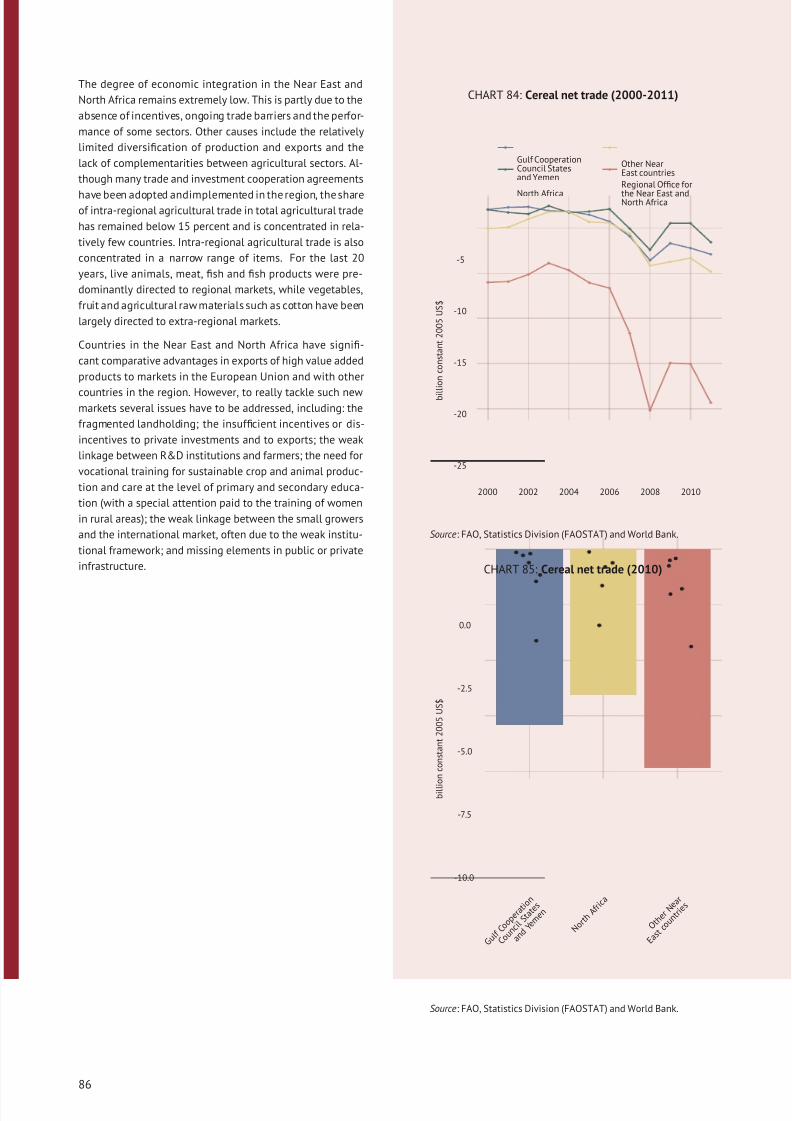
8/12/2019 FAO Statistical Yearbook 2014 Near East and North Africa Food and Agriculture
http://slidepdf.com/reader/full/fao-statistical-yearbook-2014-near-east-and-north-africa-food-and-agriculture 102/174
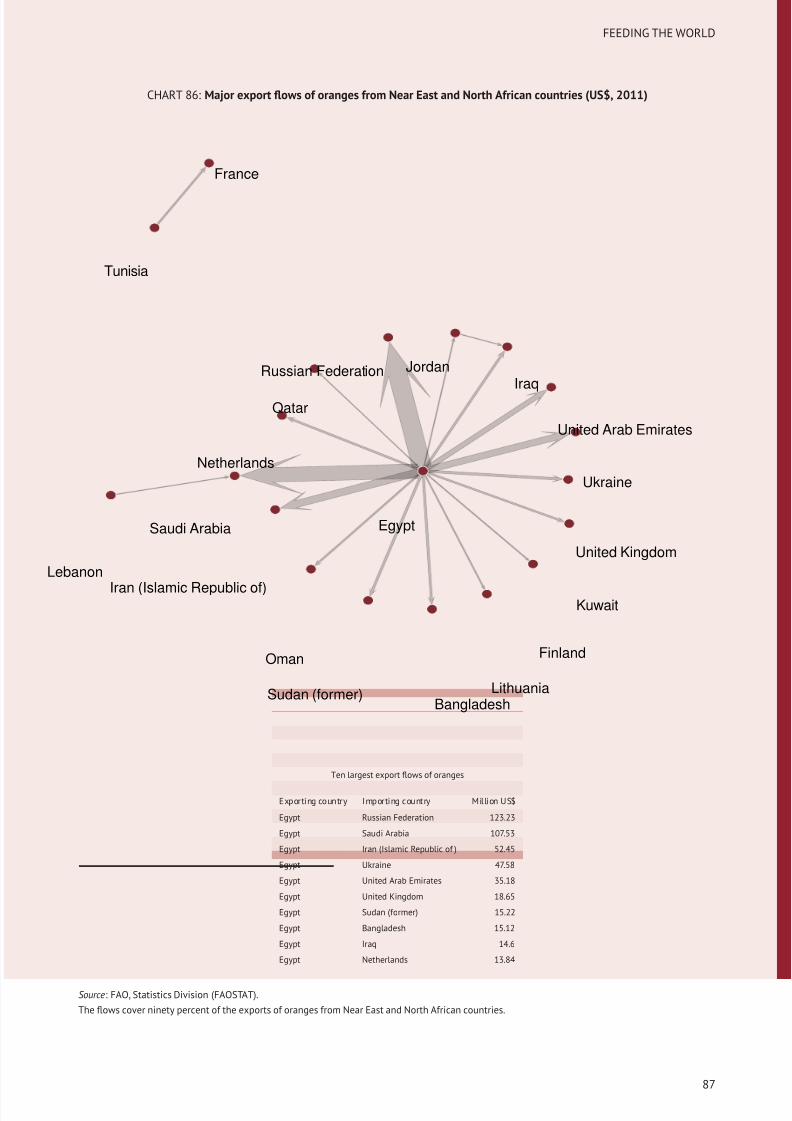
8/12/2019 FAO Statistical Yearbook 2014 Near East and North Africa Food and Agriculture
http://slidepdf.com/reader/full/fao-statistical-yearbook-2014-near-east-and-north-africa-food-and-agriculture 103/174
FEEDING THE WORLD
CHART 86: Major export flows of oranges from Near East and North African countries (US$, 2011)
Bangladesh
Egypt
Finland
France
Iran (Islamic Republic of)
IraqJordan
Kuwait
Lebanon
Lithuania
Netherlands
Oman
Qatar
Russian Federation
Saudi Arabia
Sudan (former)
Tunisia
Ukraine
United Arab Emirates
United Kingdom
Ten largest export flows of oranges
Exporting country Importing country Million US$
Egypt Russian Federation 123.23
Egypt Saudi Arabia 107.53
Egypt Iran (Islamic Republic of ) 52.45
Egypt Ukraine 47.58
Egypt United Arab Emirates 35.18
Egypt United Kingdom 18.65
Egypt Sudan (former) 15.22
Egypt Bangladesh 15.12
Egypt Iraq 14.6
Egypt Netherlands 13.84
Source: FAO, Statistics Division (FAOSTAT).
The flows cover ninety percent of the exports of oranges from Near East and North African countries.
87
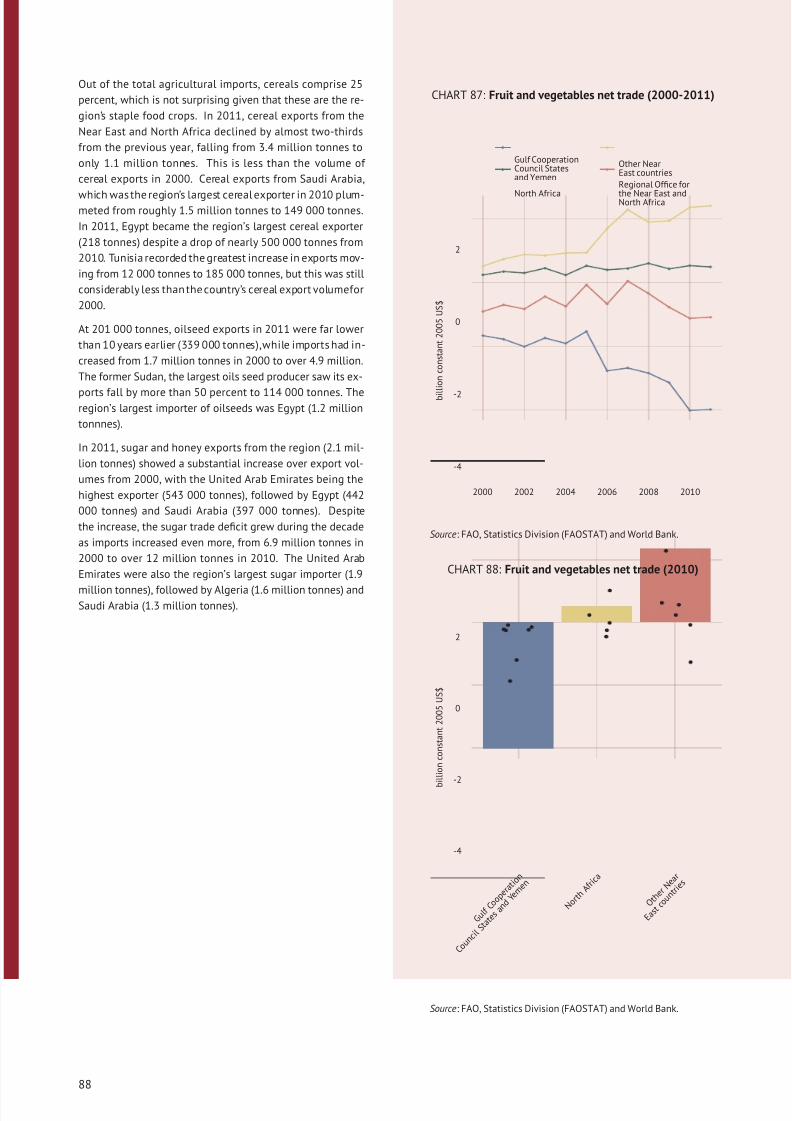
8/12/2019 FAO Statistical Yearbook 2014 Near East and North Africa Food and Agriculture
http://slidepdf.com/reader/full/fao-statistical-yearbook-2014-near-east-and-north-africa-food-and-agriculture 104/174
Out of the total agricultural imports, cereals comprise 25
percent, which is not surprising given that these are the re-
gion’s staple food crops. In 2011, cereal exports from the
Near East and North Africa declined by almost two-thirds
from the previous year, falling from 3.4 million tonnes to
only 1.1 million tonnes. This is less than the volume of
cereal exports in 2000. Cereal exports from Saudi Arabia,
which was the region’s largest cereal exporter in 2010 plum-meted from roughly 1.5 million tonnes to 149 000 tonnes.
In 2011, Egypt became the region’s largest cereal exporter
(218 tonnes) despite a drop of nearly 500 000 tonnes from
2010. Tunisia recorded the greatest increase in exports mov-
ing from 12 000 tonnes to 185 000 tonnes, but this was still
considerably less than the country’s cereal export volumefor
2000.
At 201 000 tonnes, oilseed exports in 2011 were far lower
than 10 years earlier (339 000 tonnes),while imports had in-
creased from 1.7 million tonnes in 2000 to over 4.9 million.
The former Sudan, the largest oils seed producer saw its ex-
ports fall by more than 50 percent to 114 000 tonnes. Theregion’s largest importer of oilseeds was Egypt (1.2 million
tonnnes).
In 2011, sugar and honey exports from the region (2.1 mil-
lion tonnes) showed a substantial increase over export vol-
umes from 2000, with the United Arab Emirates being the
highest exporter (543 000 tonnes), followed by Egypt (442
000 tonnes) and Saudi Arabia (397 000 tonnes). Despite
the increase, the sugar trade deficit grew during the decade
as imports increased even more, from 6.9 million tonnes in
2000 to over 12 million tonnes in 2010. The United Arab
Emirates were also the region’s largest sugar importer (1.9
million tonnes), followed by Algeria (1.6 million tonnes) andSaudi Arabia (1.3 million tonnes).
CHART 87: Fruit and vegetables net trade (2000-2011)
-4
-2
0
2
2000 2002 2004 2006 2008 2010
b i l l i o n c o n s t a n t 2 0 0 5 U S $
Gulf CooperationCouncil Statesand Yemen
North Africa
Other NearEast countries
Regional Office for
the Near East andNorth Africa
Source: FAO, Statistics Division (FAOSTAT) and World Bank.
CHART 88: Fruit and vegetables net trade (2010)
-4
-2
0
2
G u l f
C o o p
e r a t
i o n
C o u n
c i l S t a t
e s a n
d Y e m
e n
N o r t h
A f r i c
a
O t h e
r N e a
r
E a s t
c o u n
t r i e s
b
i l l i o n c o n s t a n t 2 0 0 5 U S $
Source: FAO, Statistics Division (FAOSTAT) and World Bank.
88
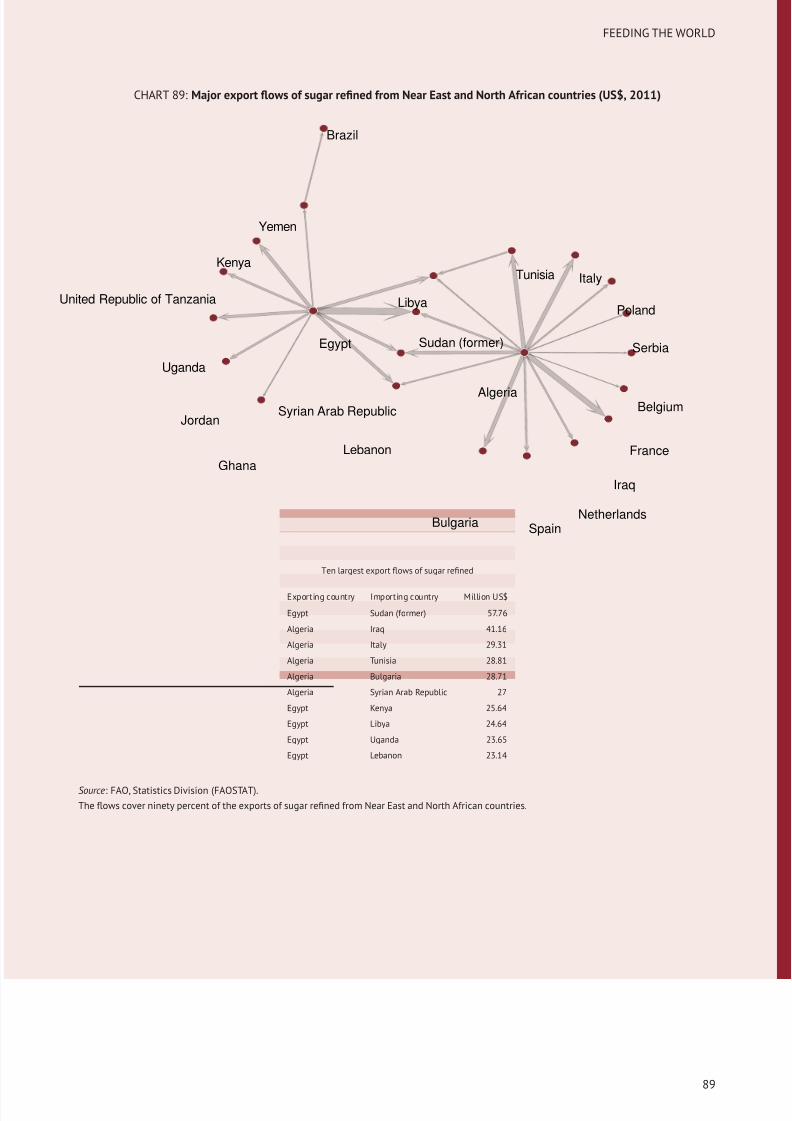
8/12/2019 FAO Statistical Yearbook 2014 Near East and North Africa Food and Agriculture
http://slidepdf.com/reader/full/fao-statistical-yearbook-2014-near-east-and-north-africa-food-and-agriculture 105/174
FEEDING THE WORLD
CHART 89: Major export flows of sugar refined from Near East and North African countries (US$, 2011)
AlgeriaBelgium
Brazil
Bulgaria
Egypt
FranceGhana
Iraq
Italy
Jordan
Kenya
Lebanon
Libya
Netherlands
Poland
Serbia
Spain
Sudan (former)
Syrian Arab Republic
Tunisia
Uganda
United Republic of Tanzania
Yemen
Ten largest export flows of sugar refined
Exporting country Importing country Million US$
Egypt Sudan (former) 57.76
Algeria Iraq 41.16
Algeria Italy 29.31
Algeria Tunisia 28.81
Algeria Bulgaria 28.71
Algeria Syrian Arab Republic 27
Egypt Kenya 25.64
Egypt Libya 24.64
Egypt Uganda 23.65
Egypt Lebanon 23.14
Source: FAO, Statistics Division (FAOSTAT).
The flows cover ninety percent of the exports of sugar refined from Near East and North African countries.
89
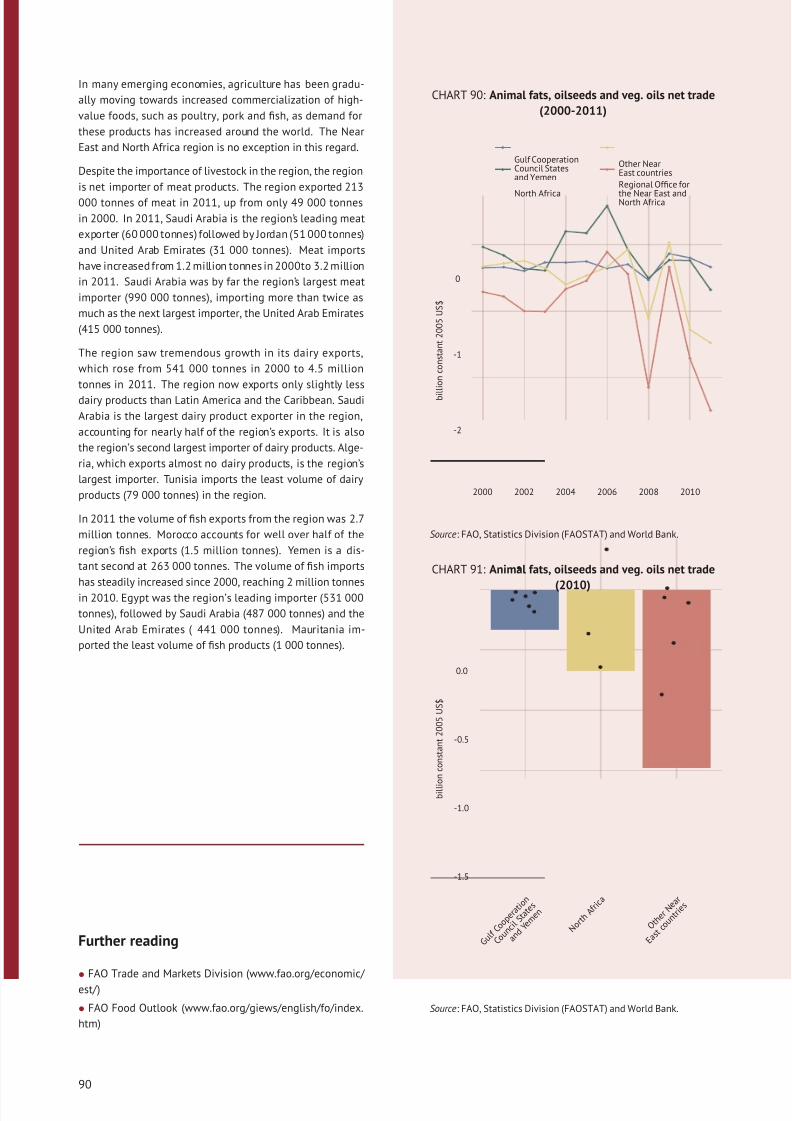
8/12/2019 FAO Statistical Yearbook 2014 Near East and North Africa Food and Agriculture
http://slidepdf.com/reader/full/fao-statistical-yearbook-2014-near-east-and-north-africa-food-and-agriculture 106/174
In many emerging economies, agriculture has been gradu-
ally moving towards increased commercialization of high-
value foods, such as poultry, pork and fish, as demand for
these products has increased around the world. The Near
East and North Africa region is no exception in this regard.
Despite the importance of livestock in the region, the region
is net importer of meat products. The region exported 213
000 tonnes of meat in 2011, up from only 49 000 tonnes
in 2000. In 2011, Saudi Arabia is the region’s leading meat
exporter (60 000 tonnes) followed by Jordan (51 000 tonnes)
and United Arab Emirates (31 000 tonnes). Meat imports
have increased from 1.2 million tonnes in 2000to 3.2 million
in 2011. Saudi Arabia was by far the region’s largest meat
importer (990 000 tonnes), importing more than twice as
much as the next largest importer, the United Arab Emirates
(415 000 tonnes).
The region saw tremendous growth in its dairy exports,
which rose from 541 000 tonnes in 2000 to 4.5 million
tonnes in 2011. The region now exports only slightly less
dairy products than Latin America and the Caribbean. Saudi
Arabia is the largest dairy product exporter in the region,
accounting for nearly half of the region’s exports. It is also
the region’s second largest importer of dairy products. Alge-
ria, which exports almost no dairy products, is the region’s
largest importer. Tunisia imports the least volume of dairy
products (79 000 tonnes) in the region.
In 2011 the volume of fish exports from the region was 2.7
million tonnes. Morocco accounts for well over half of the
region’s fish exports (1.5 million tonnes). Yemen is a dis-
tant second at 263 000 tonnes. The volume of fish imports
has steadily increased since 2000, reaching 2 million tonnes
in 2010. Egypt was the region’s leading importer (531 000
tonnes), followed by Saudi Arabia (487 000 tonnes) and the
United Arab Emirates ( 441 000 tonnes). Mauritania im-
ported the least volume of fish products (1 000 tonnes).
Further reading
• FAO Trade and Markets Division (www.fao.org/economic/
est/ )
• FAO Food Outlook (www.fao.org/giews/english/fo/index.
htm)
CHART 90: Animal fats, oilseeds and veg. oils net trade
(2000-2011)
-2
-1
0
2000 2002 2004 2006 2008 2010
b i l l i o n c o n s t a n t 2 0 0 5 U S $
Gulf CooperationCouncil Statesand Yemen
North Africa
Other NearEast countries
Regional Office for
the Near East andNorth Africa
Source: FAO, Statistics Division (FAOSTAT) and World Bank.
CHART 91: Animal fats, oilseeds and veg. oils net trade
(2010)
-1.5
-1.0
-0.5
0.0
G u l f
C o o p
e r a t
i o n
C o u n
c i l S t a t
e s
a n d Y e
m e n
N o r t h
A f r i c a
O t h e
r N e a
r
E a s t
c o u n
t r i e s
b i l l i o n c o n s t a n t 2 0 0 5 U S $
Source: FAO, Statistics Division (FAOSTAT) and World Bank.
90
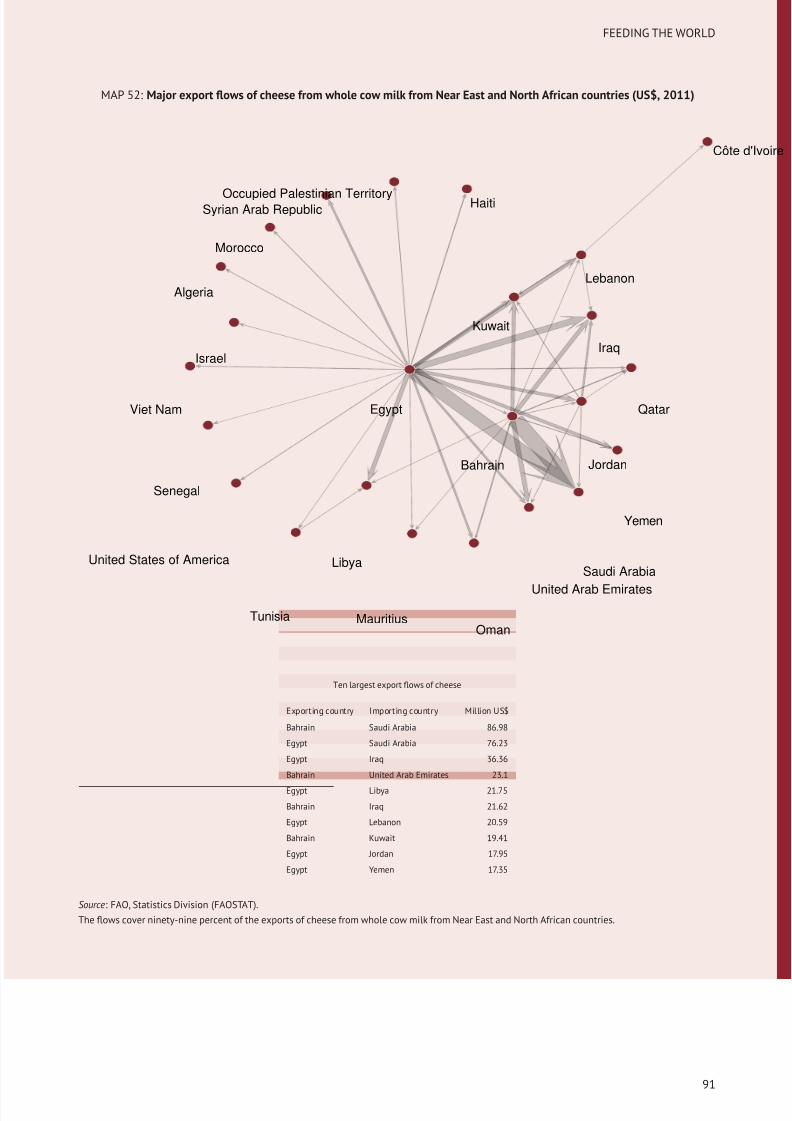
8/12/2019 FAO Statistical Yearbook 2014 Near East and North Africa Food and Agriculture
http://slidepdf.com/reader/full/fao-statistical-yearbook-2014-near-east-and-north-africa-food-and-agriculture 107/174
FEEDING THE WORLD
MAP 52: Major export flows of cheese from whole cow milk from Near East and North African countries (US$, 2011)
Algeria
Bahrain
Côte d'Ivoire
Egypt
Haiti
IraqIsrael
Jordan
Kuwait
Lebanon
Libya
Mauritius
Morocco
Occupied Palestinian Territory
Oman
Qatar
Saudi Arabia
Senegal
Syrian Arab Republic
Tunisia
United Arab Emirates
United States of America
Viet Nam
Yemen
Ten largest export flows of cheese
Exporting country Importing country Million US$
Bahrain Saudi Arabia 86.98
Egypt Saudi Arabia 76.23
Egypt Iraq 36.36
Bahrain United Arab Emirates 23.1
Egypt Libya 21.75
Bahrain Iraq 21.62
Egypt Lebanon 20.59
Bahrain Kuwait 19.41
Egypt Jordan 17.95
Egypt Yemen 17.35
Source: FAO, Statistics Division (FAOSTAT).
The flows cover ninety-nine percent of the exports of cheese from whole cow milk from Near East and North African countries.
91
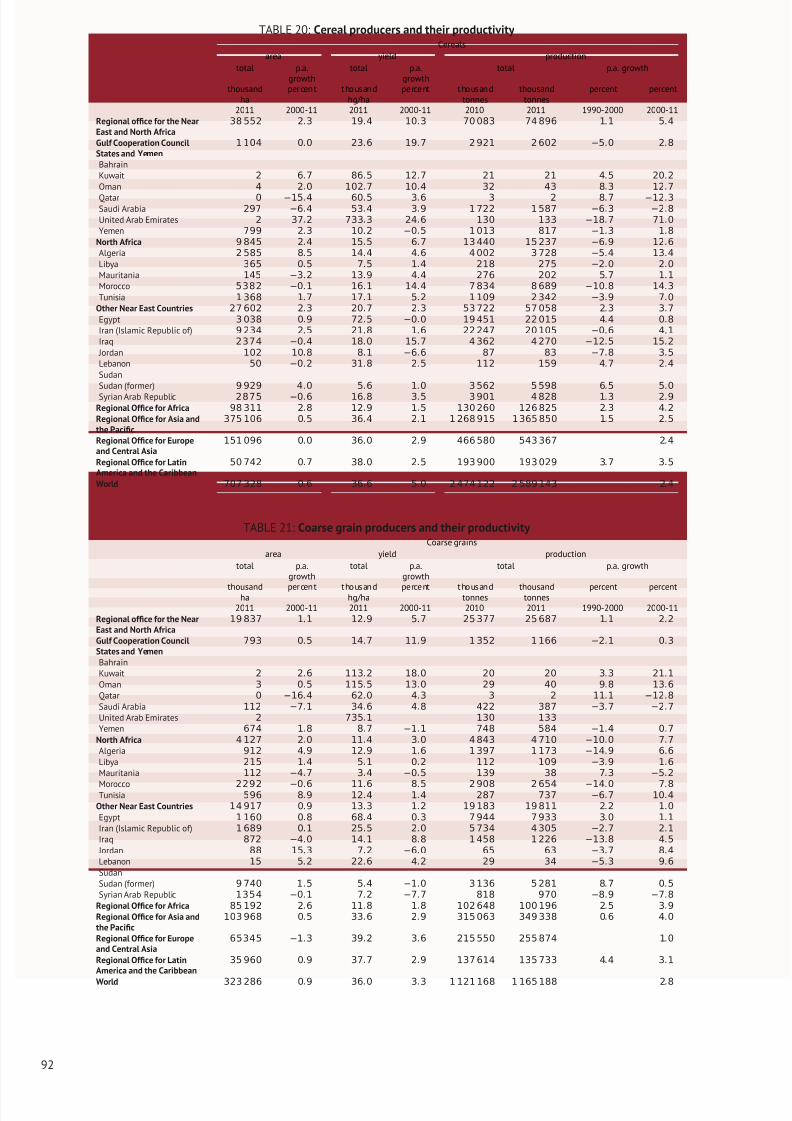
8/12/2019 FAO Statistical Yearbook 2014 Near East and North Africa Food and Agriculture
http://slidepdf.com/reader/full/fao-statistical-yearbook-2014-near-east-and-north-africa-food-and-agriculture 108/174
TABLE 20: Cereal producers and their productivity Cereals
area yield production
total p.a.growth
total p.a.growth
total p.a. growth
thousandha
percent thousandhg/ha
percent thousandtonnes
thousandtonnes
percent percent
2011 2000-11 2011 2000-11 2010 2011 1990-2000 2000-11Regional office for the NearEast and North Africa
38 552 2.3 19.4 10.3 70 083 74 896 1.1 5.4
Gulf Cooperation CouncilStates and Yemen
1 104 0.0 23.6 19.7 2 921 2 602 −5.0 2.8
BahrainKuwait 2 6.7 86.5 12.7 21 21 4.5 20.2
Oman 4 2.0 102.7 10.4 32 43 8.3 12.7
Qatar 0 −15.4 60.5 3.6 3 2 8.7 −12.3Saudi Arabia 297 −6.4 53.4 3.9 1 722 1 587 −6.3 −2.8
United Arab Emirates 2 37.2 733.3 24.6 130 133 −18.7 71.0
Yemen 799 2.3 10.2 −0.5 1 013 817 −1.3 1.8
North Africa 9 845 2.4 15.5 6.7 13 440 15 237 −6.9 12.6
Algeria 2 585 8.5 14.4 4.6 4 002 3 728 −5.4 13.4
Libya 365 0.5 7.5 1.4 218 275 −2.0 2.0
Mauritania 145 −3.2 13.9 4.4 276 202 5.7 1.1
Morocco 5382 −0.1 16.1 14.4 7 834 8 689 −10.8 14.3
Tunisia 1 368 1.7 17.1 5.2 1 109 2 342 −3.9 7.0
Other Near East Countries 27 602 2.3 20.7 2.3 53 722 57 058 2.3 3.7
Egypt 3 038 0.9 72.5 −0.0 19 451 22 015 4.4 0.8
Iran (Islamic Republic of) 9 234 2.5 21.8 1.6 22 247 20 105 −0.6 4.1
Iraq 2374 −0.4 18.0 15.7 4 362 4 270 −12.5 15.2
Jordan 102 10.8 8.1 −6.6 87 83 −7.8 3.5
Lebanon 50 −0.2 31.8 2.5 112 159 4.7 2.4
SudanSudan (former) 9 929 4 .0 5.6 1.0 3 562 5 598 6.5 5.0
Syrian Arab Republic 2875 −0.6 16.8 3.5 3 901 4 828 1.3 2.9
Regional Office for Africa 98 311 2.8 12.9 1.5 130 260 126 825 2.3 4.2
Regional Office for Asia andthe Pacific
375 106 0.5 36.4 2.1 1 268 915 1 365 850 1.5 2.5
Regional Office for Europeand Central Asia
151 096 0.0 36.0 2.9 466 580 543 367 2.4
Regional Office for LatinAmerica and the Caribbean
50 742 0.7 38.0 2.5 193 900 193 029 3.7 3.5
World 707 328 0.6 36.6 5.0 2 474 122 2 589 143 2.4
TABLE 21: Coarse grain producers and their productivity Coarse grains
area yield production
total p.a.growth
total p.a.growth
total p.a. growth
thousandha percent thousandhg/ha percent thousandtonnes thousandtonnes percent percent
2011 2000-11 2011 2000-11 2010 2011 1990-2000 2000-11Regional office for the NearEast and North Africa
19 837 1.1 12.9 5.7 25 377 25 687 1.1 2.2
Gulf Cooperation CouncilStates and Yemen
793 0.5 14.7 11.9 1 352 1 166 −2.1 0.3
BahrainKuwait 2 2.6 113.2 18.0 20 20 3.3 21.1
Oman 3 0.5 115.5 13.0 29 40 9.8 13.6
Qatar 0 −16.4 62.0 4.3 3 2 11.1 −12.8
Saudi Arabia 112 −7.1 34.6 4.8 422 387 −3.7 −2.7
United Arab Emirates 2 735.1 130 133
Yemen 674 1.8 8.7 −1.1 748 584 −1.4 0.7
North Africa 4 127 2.0 11.4 3.0 4 843 4 710 −10.0 7.7
Algeria 912 4.9 12.9 1.6 1 397 1 173 −14.9 6.6
Libya 215 1.4 5.1 0.2 112 109 −3.9 1.6
Mauritania 112 −4.7 3.4 −0.5 139 38 7.3 −5.2
Morocco 2292 −0.6 11.6 8.5 2 908 2 654 −14.0 7.8Tunisia 596 8.9 12.4 1.4 287 737 −6.7 10.4
Other Near East Countries 14 917 0.9 13.3 1.2 19 183 19 811 2.2 1.0
Egypt 1 160 0.8 68.4 0.3 7 944 7 933 3.0 1.1
Iran (Islamic Republic of) 1 689 0.1 25.5 2.0 5 734 4 305 −2.7 2.1
Iraq 872 −4.0 14.1 8.8 1 458 1 226 −13.8 4.5
Jordan 88 15.3 7.2 −6.0 65 63 −3.7 8.4
Lebanon 15 5.2 22.6 4.2 29 34 −5.3 9.6
SudanSudan (former) 9 740 1 .5 5.4 −1.0 3 136 5 281 8.7 0.5
Syrian Arab Republic 1354 −0.1 7.2 −7.7 818 970 −8.9 −7.8
Regional Office for Africa 85 192 2.6 11.8 1.8 102 648 100 196 2.5 3.9
Regional Office for Asia andthe Pacific
103 968 0.5 33.6 2.9 315 063 349 338 0.6 4.0
Regional Office for Europeand Central Asia
65345 −1.3 39.2 3.6 215 550 255 874 1.0
Regional Office for LatinAmerica and the Caribbean
35 960 0.9 37.7 2.9 137 614 135 733 4.4 3.1
World 323 286 0.9 36.0 3.3 1 121 168 1 165 188 2.8
92
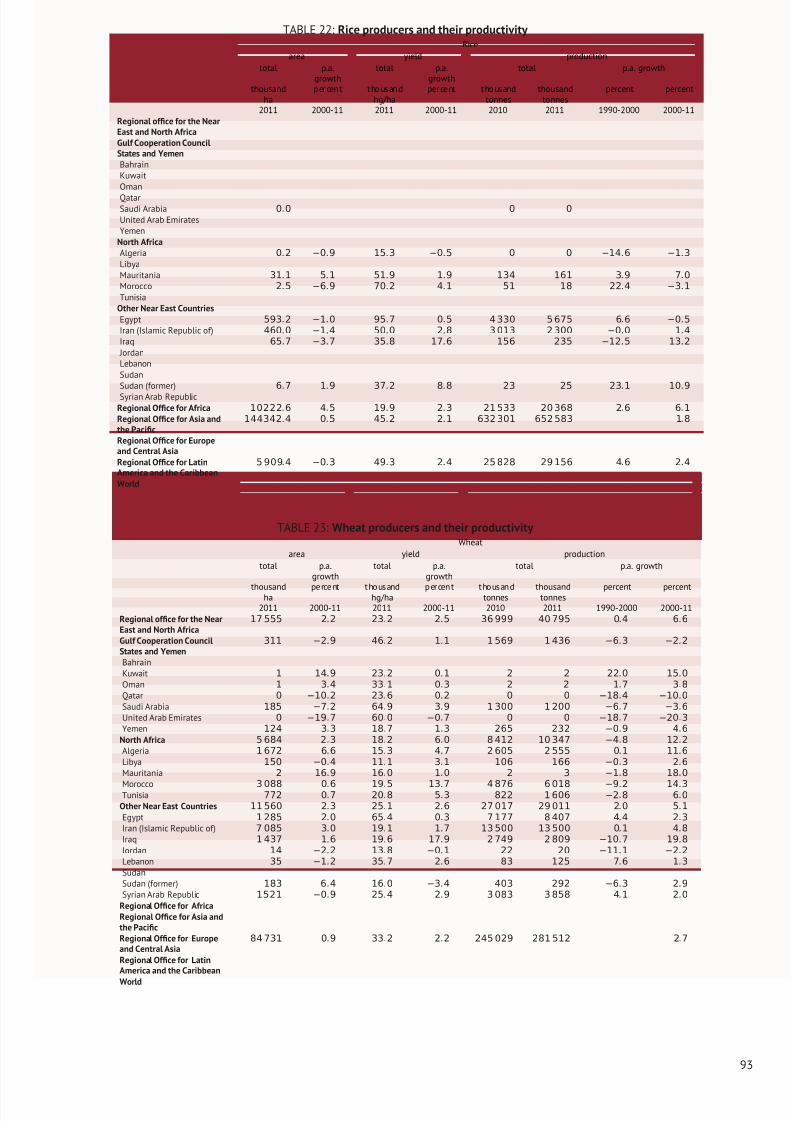
8/12/2019 FAO Statistical Yearbook 2014 Near East and North Africa Food and Agriculture
http://slidepdf.com/reader/full/fao-statistical-yearbook-2014-near-east-and-north-africa-food-and-agriculture 109/174
TABLE 22: Rice producers and their productivity Rice
area yield production
total p.a.growth
total p.a.growth
total p.a. growth
thousandha
p ercent thousandhg/ha
percent thousandtonnes
thousandtonnes
percent percent
2011 2000-11 2011 2000-11 2010 2011 1990-2000 2000-11Regional office for the NearEast and North AfricaGulf Cooperation CouncilStates and YemenBahrainKuwaitOman
QatarSaudi Arabia 0.0 0 0
United Arab EmiratesYemen
North AfricaAlgeria 0.2 −0.9 15.3 −0.5 0 0 −14.6 −1.3
LibyaMauritania 31.1 5.1 51.9 1.9 134 161 3.9 7.0
Morocco 2.5 −6.9 70.2 4.1 51 18 22.4 −3.1
TunisiaOther Near East CountriesEgypt 593.2 −1.0 95.7 0.5 4 330 5 675 6.6 −0.5
Iran (Islamic Republic of) 460.0 −1.4 50.0 2.8 3 013 2 300 −0.0 1.4
Iraq 65.7 −3.7 35.8 17.6 156 235 −12.5 13.2
JordanLebanonSudanSudan (former) 6.7 1.9 37.2 8.8 23 25 23.1 10.9
Syrian Arab RepublicRegional Office for Africa 10222.6 4.5 19.9 2.3 21 533 20 368 2.6 6.1
Regional Office for Asia andthe Pacific
144342.4 0.5 45.2 2.1 632 301 652 583 1.8
Regional Office for Europeand Central AsiaRegional Office for LatinAmerica and the Caribbean
5 909.4 −0.3 49.3 2.4 25 828 29 156 4.6 2.4
World
TABLE 23: Wheat producers and their productivity Wheat
area yield production
total p.a.growth
total p.a.growth
total p.a. growth
thousandha percent thousandhg/ha p ercent thousandtonnes thousandtonnes percent percent
2011 2000-11 2011 2000-11 2010 2011 1990-2000 2000-11Regional office for the NearEast and North Africa
17 555 2.2 23.2 2.5 36 999 40 795 0.4 6.6
Gulf Cooperation CouncilStates and Yemen
311 −2.9 46.2 1.1 1 569 1 436 −6.3 −2.2
BahrainKuwait 1 14.9 23.2 0.1 2 2 22.0 15.0
Oman 1 3.4 33.1 0.3 2 2 1.7 3.8
Qatar 0 −10.2 23.6 0.2 0 0 −18.4 −10.0
Saudi Arabia 185 −7.2 64.9 3.9 1 300 1 200 −6.7 −3.6
United Arab Emirates 0 −19.7 60.0 −0.7 0 0 −18.7 −20.3
Yemen 124 3.3 18.7 1.3 265 232 −0.9 4.6
North Africa 5 684 2.3 18.2 6.0 8 412 10 347 −4.8 12.2
Algeria 1 672 6.6 15.3 4.7 2 605 2 555 0.1 11.6
Libya 150 −0.4 11.1 3.1 106 166 −0.3 2.6
Mauritania 2 16.9 16.0 1.0 2 3 −1.8 18.0
Morocco 3 088 0.6 19.5 13.7 4 876 6 018 −9.2 14.3Tunisia 772 0.7 20.8 5.3 822 1 606 −2.8 6.0
Other Near East Countries 11 560 2.3 25.1 2.6 27 017 29 011 2.0 5.1
Egypt 1 285 2.0 65.4 0.3 7 177 8 407 4.4 2.3
Iran (Islamic Republic of) 7 085 3.0 19.1 1.7 13 500 13 500 0.1 4.8
Iraq 1 437 1.6 19.6 17.9 2 749 2 809 −10.7 19.8
Jordan 14 −2.2 13.8 −0.1 22 20 −11.1 −2.2
Lebanon 35 −1.2 35.7 2.6 83 125 7.6 1.3
SudanSudan (former) 183 6.4 16.0 −3.4 403 292 −6.3 2.9
Syrian Arab Republic 1521 −0.9 25.4 2.9 3 083 3 858 4.1 2.0
Regional Office for AfricaRegional Office for Asia andthe PacificRegional Office for Europeand Central Asia
84 731 0.9 33.2 2.2 245 029 281 512 2.7
Regional Office for LatinAmerica and the Caribbean
World
93
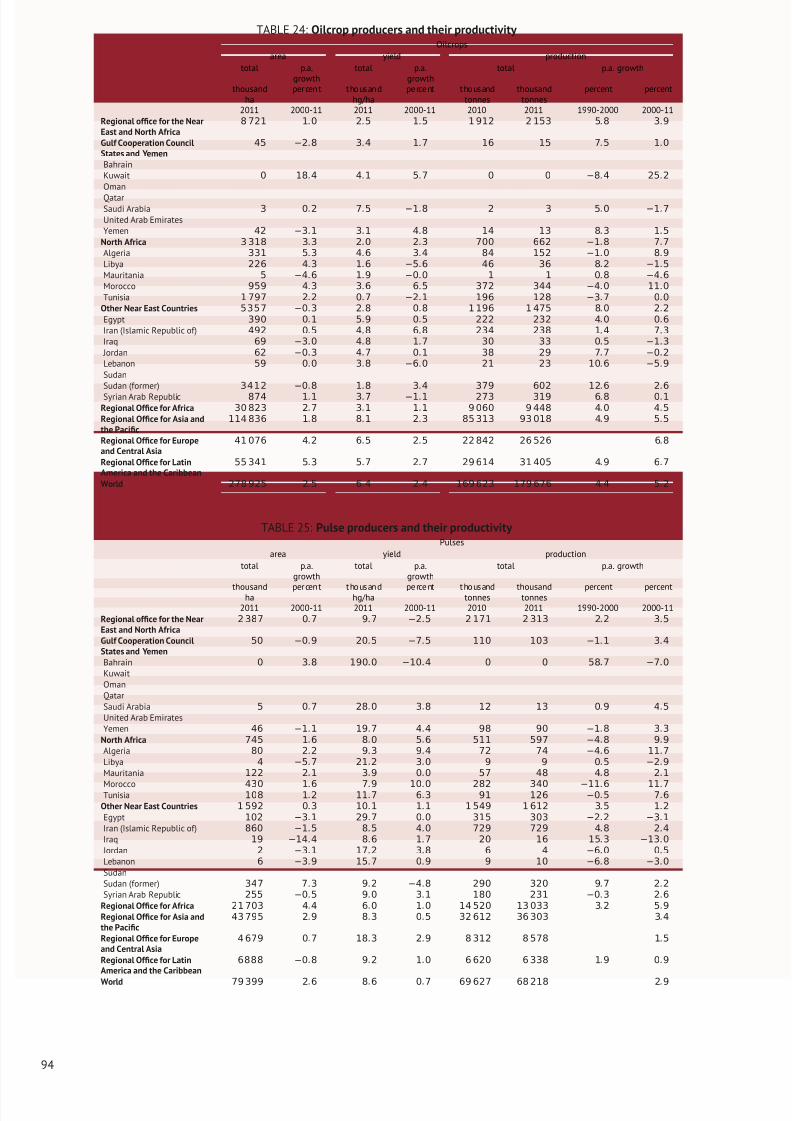
8/12/2019 FAO Statistical Yearbook 2014 Near East and North Africa Food and Agriculture
http://slidepdf.com/reader/full/fao-statistical-yearbook-2014-near-east-and-north-africa-food-and-agriculture 110/174
TABLE 24: Oilcrop producers and their productivity Oilcrops
area yield production
total p.a.growth
total p.a.growth
total p.a. growth
thousandha
percent thousandhg/ha
percent thousandtonnes
thousandtonnes
percent percent
2011 2000-11 2011 2000-11 2010 2011 1990-2000 2000-11Regional office for the NearEast and North Africa
8 721 1.0 2.5 1.5 1 912 2 153 5.8 3.9
Gulf Cooperation CouncilStates and Yemen
45 −2.8 3.4 1.7 16 15 7.5 1.0
BahrainKuwait 0 18.4 4.1 5.7 0 0 −8.4 25.2
Oman
QatarSaudi Arabia 3 0.2 7.5 −1.8 2 3 5.0 −1.7
United Arab EmiratesYemen 42 −3.1 3.1 4.8 14 13 8.3 1.5
North Africa 3 318 3.3 2.0 2.3 700 662 −1.8 7.7
Algeria 331 5.3 4.6 3.4 84 152 −1.0 8.9
Libya 226 4.3 1.6 −5.6 46 36 8.2 −1.5
Mauritania 5 −4.6 1.9 −0.0 1 1 0.8 −4.6
Morocco 959 4.3 3.6 6.5 372 344 −4.0 11.0
Tunisia 1 797 2.2 0.7 −2.1 196 128 −3.7 0.0
Other Near East Countries 5357 −0.3 2.8 0.8 1 196 1 475 8.0 2.2
Egypt 390 0.1 5.9 0.5 222 232 4.0 0.6
Iran (Islamic Republic of) 492 0.5 4.8 6.8 234 238 1.4 7.3
Iraq 69 −3.0 4.8 1.7 30 33 0.5 −1.3
Jordan 62 −0.3 4.7 0.1 38 29 7.7 −0.2
Lebanon 59 0.0 3.8 −6.0 21 23 10.6 −5.9
SudanSudan (former) 3412 −0.8 1.8 3.4 379 602 12.6 2.6
Syrian Arab Republic 874 1.1 3.7 −1.1 273 319 6.8 0.1
Regional Office for Africa 30 823 2.7 3.1 1.1 9 060 9 448 4.0 4.5
Regional Office for Asia andthe Pacific
114 836 1.8 8.1 2.3 85 313 93 018 4.9 5.5
Regional Office for Europeand Central Asia
41 076 4.2 6.5 2.5 22 842 26 526 6.8
Regional Office for LatinAmerica and the Caribbean
55 341 5.3 5.7 2.7 29 614 31 405 4.9 6.7
World 278 925 2.5 6.4 2.4 169 623 179 676 4.4 5.2
TABLE 25: Pulse producers and their productivity Pulses
area yield production
total p.a.growth
total p.a.growth
total p.a. growth
thousandha percent thousandhg/ha percent thousandtonnes thousandtonnes percent percent
2011 2000-11 2011 2000-11 2010 2011 1990-2000 2000-11Regional office for the NearEast and North Africa
2 387 0.7 9.7 −2.5 2 171 2 313 2.2 3.5
Gulf Cooperation CouncilStates and Yemen
50 −0.9 20.5 −7.5 110 103 −1.1 3.4
Bahrain 0 3.8 190.0 −10.4 0 0 58.7 −7.0
KuwaitOmanQatarSaudi Arabia 5 0.7 28.0 3.8 12 13 0.9 4.5
United Arab EmiratesYemen 46 −1.1 19.7 4.4 98 90 −1.8 3.3
North Africa 745 1.6 8.0 5.6 511 597 −4.8 9.9
Algeria 80 2.2 9.3 9.4 72 74 −4.6 11.7
Libya 4 −5.7 21.2 3.0 9 9 0.5 −2.9
Mauritania 122 2.1 3.9 0.0 57 48 4.8 2.1
Morocco 430 1.6 7.9 10.0 282 340 −11.6 11.7Tunisia 108 1.2 11.7 6.3 91 126 −0.5 7.6
Other Near East Countries 1 592 0.3 10.1 1.1 1 549 1 612 3.5 1.2
Egypt 102 −3.1 29.7 0.0 315 303 −2.2 −3.1
Iran (Islamic Republic of) 860 −1.5 8.5 4.0 729 729 4.8 2.4
Iraq 19 −14.4 8.6 1.7 20 16 15.3 −13.0
Jordan 2 −3.1 17.2 3.8 6 4 −6.0 0.5
Lebanon 6 −3.9 15.7 0.9 9 10 −6.8 −3.0
SudanSudan (former) 347 7.3 9.2 −4.8 290 320 9.7 2.2
Syrian Arab Republic 255 −0.5 9.0 3.1 180 231 −0.3 2.6
Regional Office for Africa 21 703 4.4 6.0 1.0 14 520 13 033 3.2 5.9
Regional Office for Asia andthe Pacific
43 795 2.9 8.3 0.5 32 612 36 303 3.4
Regional Office for Europeand Central Asia
4 679 0.7 18.3 2.9 8 312 8 578 1.5
Regional Office for LatinAmerica and the Caribbean
6888 −0.8 9.2 1.0 6 620 6 338 1.9 0.9
World 79 399 2.6 8.6 0.7 69 627 68 218 2.9
94
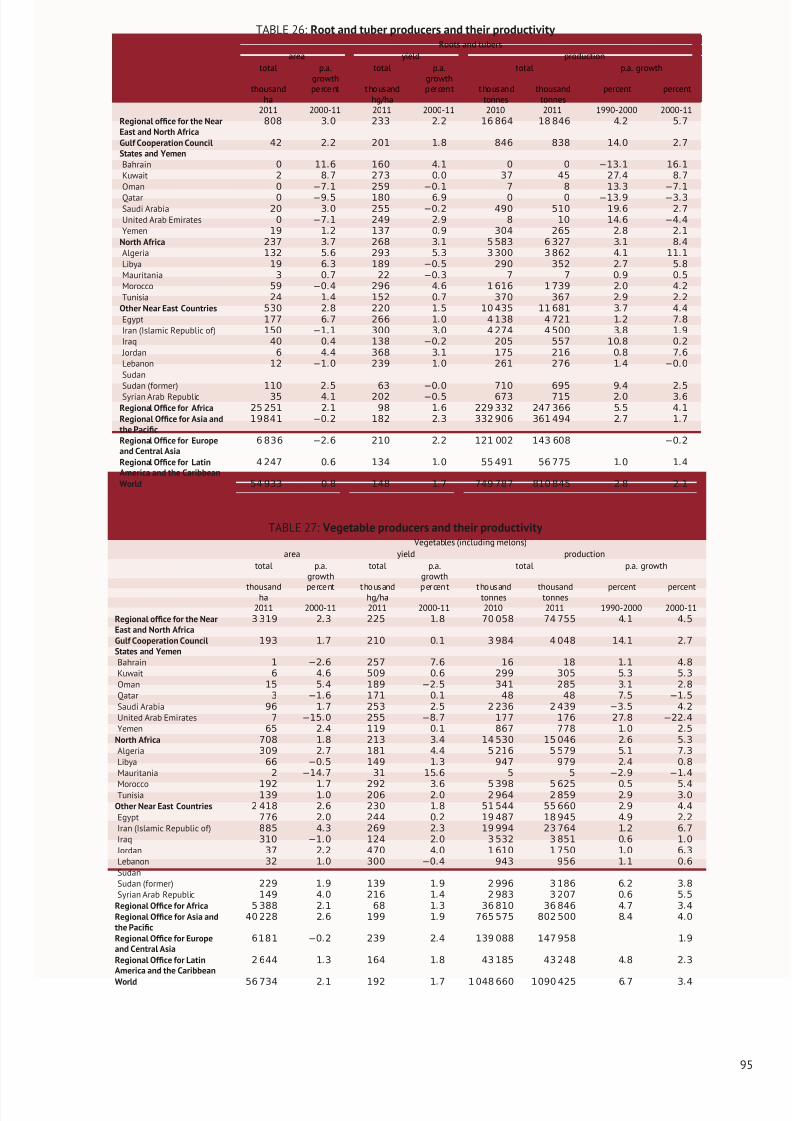
8/12/2019 FAO Statistical Yearbook 2014 Near East and North Africa Food and Agriculture
http://slidepdf.com/reader/full/fao-statistical-yearbook-2014-near-east-and-north-africa-food-and-agriculture 111/174
TABLE 26: Root and tuber producers and their productivity Roots and tubers
area yield production
total p.a.growth
total p.a.growth
total p.a. growth
thousandha
percent thousandhg/ha
p ercent thousandtonnes
thousandtonnes
percent percent
2011 2000-11 2011 2000-11 2010 2011 1990-2000 2000-11Regional office for the NearEast and North Africa
808 3.0 233 2.2 16 864 18 846 4.2 5.7
Gulf Cooperation CouncilStates and Yemen
42 2.2 201 1.8 846 838 14.0 2.7
Bahrain 0 11.6 160 4.1 0 0 −13.1 16.1
Kuwait 2 8.7 273 0.0 37 45 27.4 8.7
Oman 0 −7.1 259 −0.1 7 8 13.3 −7.1
Qatar 0 −9.5 180 6.9 0 0 −13.9 −3.3Saudi Arabia 20 3.0 255 −0.2 490 510 19.6 2.7
United Arab Emirates 0 −7.1 249 2.9 8 10 14.6 −4.4
Yemen 19 1.2 137 0.9 304 265 2.8 2.1
North Africa 237 3.7 268 3.1 5 583 6 327 3.1 8.4
Algeria 132 5.6 293 5.3 3 300 3 862 4.1 11.1
Libya 19 6.3 189 −0.5 290 352 2.7 5.8
Mauritania 3 0.7 22 −0.3 7 7 0.9 0.5
Morocco 59 −0.4 296 4.6 1 616 1 739 2.0 4.2
Tunisia 24 1.4 152 0.7 370 367 2.9 2.2
Other Near East Countries 530 2.8 220 1.5 10 435 11 681 3.7 4.4
Egypt 177 6.7 266 1.0 4 138 4 721 1.2 7.8
Iran (Islamic Republic of) 150 −1.1 300 3.0 4 274 4 500 3.8 1.9
Iraq 40 0.4 138 −0.2 205 557 10.8 0.2
Jordan 6 4.4 368 3.1 175 216 0.8 7.6
Lebanon 12 −1.0 239 1.0 261 276 1.4 −0.0
SudanSudan (former) 110 2.5 63 −0.0 710 695 9.4 2.5
Syrian Arab Republic 35 4.1 202 −0.5 673 715 2.0 3.6
Regional Office for Africa 25 251 2.1 98 1.6 229 332 247 366 5.5 4.1
Regional Office for Asia andthe Pacific
19841 −0.2 182 2.3 332 906 361 494 2.7 1.7
Regional Office for Europeand Central Asia
6 836 −2.6 210 2.2 121 002 143 608 −0.2
Regional Office for LatinAmerica and the Caribbean
4 247 0.6 134 1.0 55 491 56 775 1.0 1.4
World 54 933 0.8 148 1.7 749 787 810 845 2.8 2.1
TABLE 27: Vegetable producers and their productivity Vegetables (including melons)
area yield production
total p.a.growth
total p.a.growth
total p.a. growth
thousandha percent thousandhg/ha p ercent thousandtonnes thousandtonnes percent percent
2011 2000-11 2011 2000-11 2010 2011 1990-2000 2000-11Regional office for the NearEast and North Africa
3 319 2.3 225 1.8 70 058 74 755 4.1 4.5
Gulf Cooperation CouncilStates and Yemen
193 1.7 210 0.1 3 984 4 048 14.1 2.7
Bahrain 1 −2.6 257 7.6 16 18 1.1 4.8
Kuwait 6 4.6 509 0.6 299 305 5.3 5.3
Oman 15 5.4 189 −2.5 341 285 3.1 2.8
Qatar 3 −1.6 171 0.1 48 48 7.5 −1.5
Saudi Arabia 96 1.7 253 2.5 2 236 2 439 −3.5 4.2
United Arab Emirates 7 −15.0 255 −8.7 177 176 27.8 −22.4
Yemen 65 2.4 119 0.1 867 778 1.0 2.5
North Africa 708 1.8 213 3.4 14 530 15 046 2.6 5.3
Algeria 309 2.7 181 4.4 5 216 5 579 5.1 7.3
Libya 66 −0.5 149 1.3 947 979 2.4 0.8
Mauritania 2 −14.7 31 15.6 5 5 −2.9 −1.4
Morocco 192 1.7 292 3.6 5 398 5 625 0.5 5.4Tunisia 139 1.0 206 2.0 2 964 2 859 2.9 3.0
Other Near East Countries 2 418 2.6 230 1.8 51 544 55 660 2.9 4.4
Egypt 776 2.0 244 0.2 19 487 18 945 4.9 2.2
Iran (Islamic Republic of) 885 4.3 269 2.3 19 994 23 764 1.2 6.7
Iraq 310 −1.0 124 2.0 3 532 3 851 0.6 1.0
Jordan 37 2.2 470 4.0 1 610 1 750 1.0 6.3
Lebanon 32 1.0 300 −0.4 943 956 1.1 0.6
SudanSudan (former) 229 1.9 139 1.9 2 996 3 186 6.2 3.8
Syrian Arab Republic 149 4.0 216 1.4 2 983 3 207 0.6 5.5
Regional Office for Africa 5 388 2.1 68 1.3 36 810 36 846 4.7 3.4
Regional Office for Asia andthe Pacific
40 228 2.6 199 1.9 765 575 802 500 8.4 4.0
Regional Office for Europeand Central Asia
6181 −0.2 239 2.4 139 088 147 958 1.9
Regional Office for LatinAmerica and the Caribbean
2 644 1.3 164 1.8 43 185 43 248 4.8 2.3
World 56 734 2.1 192 1.7 1 048 660 1090 425 6.7 3.4
95

8/12/2019 FAO Statistical Yearbook 2014 Near East and North Africa Food and Agriculture
http://slidepdf.com/reader/full/fao-statistical-yearbook-2014-near-east-and-north-africa-food-and-agriculture 112/174
TABLE 28: Sugar producers and their productivity Sugar
area yield production
total p.a.growth
total p.a.growth
total p.a. growth
thousandha
percent thousandhg/ha
percent thousandtonnes
thousandtonnes
percent percent
2009-12* 2000-11 2009-12* 2000-11 2009-12* 2009-12* 1990-2000 2000-11Regional office for the NearEast and North AfricaGulf Cooperation CouncilStates and YemenBahrainKuwaitOman
QatarSaudi ArabiaUnited Arab EmiratesYemen
North AfricaAlgeriaLibyaMauritaniaMorocco 28.9 −1.3 563.2 1.7 1 626.7 1 626.7 −0.3 0.5
Tunisia 0.0 0.0 0.0 −23.0
Other Near East CountriesEgypt 152.0 9.3 500.0 −0.3 7 600.0 7 600.0 17.5 9.0
Iran (Islamic Republic of) 105.0 −4.3 395.2 4.0 4 150.0 4 150.0 1.8 −0.5
Iraq 1.6 14.8 103.2 −7.2 16.0 16.0 −25.9 6.5
JordanLebanon 0.1 −35.1 213.3 −7.4 1.3 1.3 13.9 −40.0
SudanSudan (former)Syrian Arab Republic 27.0 −0.5 703.7 4.5 1 900.0 1 900.0 10.8 4.0
Regional Office for AfricaRegional Office for Asia andthe PacificRegional Office for Europeand Central Asia
3752.3 204 039.7 204 039.7
Regional Office for LatinAmerica and the CaribbeanWorld
TABLE 29: Treenut producers and their productivity Treenuts
area yield production
total p.a.growth
total p.a.growth
total p.a. growth
thousandha percent thousandhg/ha percent thousandtonnes thousandtonnes percent percent
2011 2000-11 2011 2000-11 2010 2011 1990-2000 2000-11Regional office for the NearEast and North Africa
1 005 0.7 16.6 10.6 1 565 1 665 4.6 9.0
Gulf Cooperation CouncilStates and Yemen
0 −0.2 48.7 14.0 1 2 4.4 7.2
Bahrain 0 −5.3 42.8 3.1 0 0 5.3 −2.3
KuwaitOmanQatarSaudi ArabiaUnited Arab Emirates 0 −3.4 417.1 15.4 1 1 4.3 11.4
Yemen 0 2.3 6.3 −1.5 0 0 1.1 0.7
North Africa 462 0.4 5.0 1.6 239 230 2.1 2.2
Algeria 40 3.5 5.6 −4.9 57 22 8.5 −1.5
Libya 44 −1.6 8.7 5.1 30 38 −2.3 3.5
Mauritania
Morocco 151 0.5 7.0 3.1 98 106 1.9 3.6Tunisia 227 0.2 2.8 0.1 54 63 1.6 0.2
Other Near East Countries 543 0.9 26.4 5.9 1 325 1 433 5.5 10.1
Egypt 5 −2.8 73.3 5.8 42 37 16.9 2.8
Iran (Islamic Republic of) 431 −0.1 26.6 11.7 1 101 1 147 2.0 11.6
Iraq 2 −2.8 19.1 2.9 4 4 −2.1 −0.0
Jordan 1 2.1 63.5 5.7 3 4 2.8 7.9
Lebanon 6 −2.9 72.1 6.8 33 41 5.0 3.7
SudanSudan (former)Syrian Arab Republic 98 5.9 20.4 −0.9 143 200 13.5 5.0
Regional Office for AfricaRegional Office for Asia andthe PacificRegional Office for Europeand Central Asia
1 743 0.6 12.0 2.3 2 160 2 091 1.3
Regional Office for LatinAmerica and the Caribbean
World
96
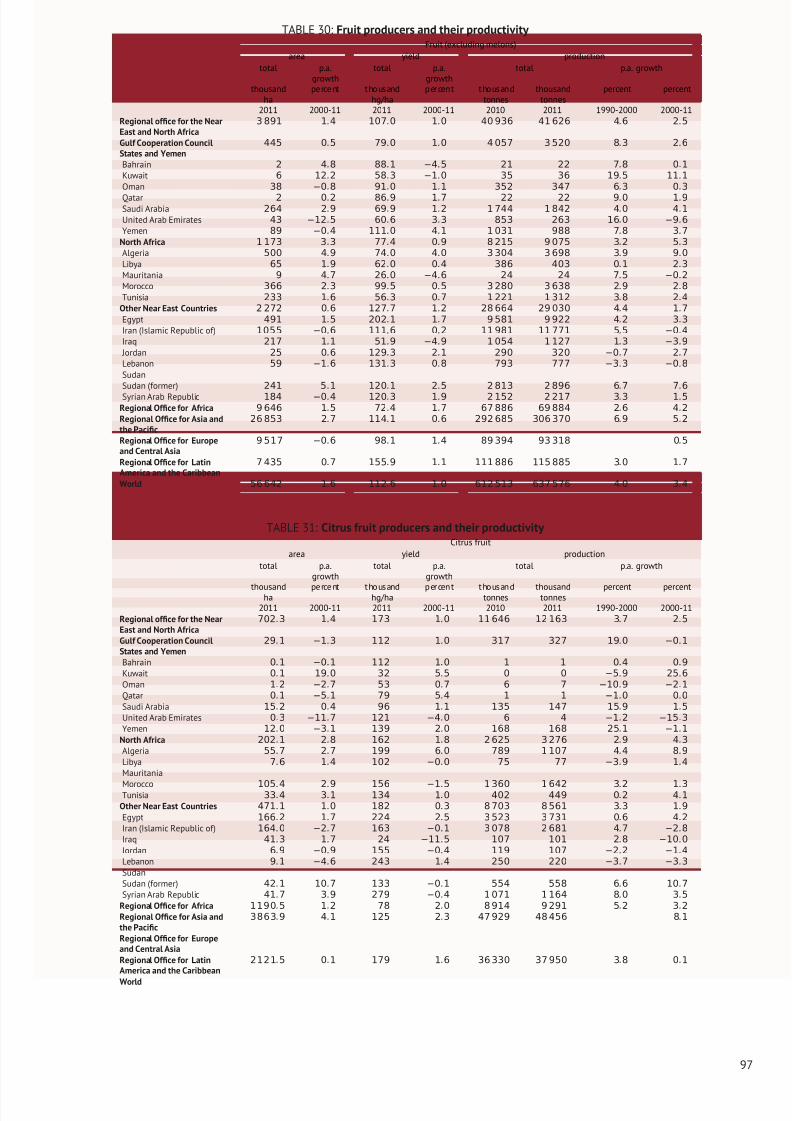
8/12/2019 FAO Statistical Yearbook 2014 Near East and North Africa Food and Agriculture
http://slidepdf.com/reader/full/fao-statistical-yearbook-2014-near-east-and-north-africa-food-and-agriculture 113/174
TABLE 30: Fruit producers and their productivity Fruit (excluding melons)
area yield production
total p.a.growth
total p.a.growth
total p.a. growth
thousandha
percent thousandhg/ha
p ercent thousandtonnes
thousandtonnes
percent percent
2011 2000-11 2011 2000-11 2010 2011 1990-2000 2000-11Regional office for the NearEast and North Africa
3 891 1.4 107.0 1.0 40 936 41 626 4.6 2.5
Gulf Cooperation CouncilStates and Yemen
445 0.5 79.0 1.0 4 057 3 520 8.3 2.6
Bahrain 2 4.8 88.1 −4.5 21 22 7.8 0.1
Kuwait 6 12.2 58.3 −1.0 35 36 19.5 11.1
Oman 38 −0.8 91.0 1.1 352 347 6.3 0.3
Qatar 2 0.2 86.9 1.7 22 22 9.0 1.9Saudi Arabia 264 2.9 69.9 1.2 1 744 1 842 4.0 4.1
United Arab Emirates 43 −12.5 60.6 3.3 853 263 16.0 −9.6
Yemen 89 −0.4 111.0 4.1 1 031 988 7.8 3.7
North Africa 1 173 3.3 77.4 0.9 8 215 9 075 3.2 5.3
Algeria 500 4.9 74.0 4.0 3 304 3 698 3.9 9.0
Libya 65 1.9 62.0 0.4 386 403 0.1 2.3
Mauritania 9 4.7 26.0 −4.6 24 24 7.5 −0.2
Morocco 366 2.3 99.5 0.5 3 280 3 638 2.9 2.8
Tunisia 233 1.6 56.3 0.7 1 221 1 312 3.8 2.4
Other Near East Countries 2 272 0.6 127.7 1.2 28 664 29 030 4.4 1.7
Egypt 491 1.5 202.1 1.7 9 581 9 922 4.2 3.3
Iran (Islamic Republic of) 1055 −0.6 111.6 0.2 11 981 11 771 5.5 −0.4
Iraq 217 1.1 51.9 −4.9 1 054 1 127 1.3 −3.9
Jordan 25 0.6 129.3 2.1 290 320 −0.7 2.7
Lebanon 59 −1.6 131.3 0.8 793 777 −3.3 −0.8
SudanSudan (former) 241 5.1 120.1 2.5 2 813 2 896 6.7 7.6
Syrian Arab Republic 184 −0.4 120.3 1.9 2 152 2 217 3.3 1.5
Regional Office for Africa 9 646 1.5 72.4 1.7 67 886 69 884 2.6 4.2
Regional Office for Asia andthe Pacific
26 853 2.7 114.1 0.6 292 685 306 370 6.9 5.2
Regional Office for Europeand Central Asia
9 517 −0.6 98.1 1.4 89 394 93 318 0.5
Regional Office for LatinAmerica and the Caribbean
7 435 0.7 155.9 1.1 111 886 115 885 3.0 1.7
World 56 642 1.6 112.6 1.0 612 513 637 576 4.0 3.4
TABLE 31: Citrus fruit producers and their productivity Citrus fruit
area yield production
total p.a.growth
total p.a.growth
total p.a. growth
thousandha percent thousandhg/ha p ercent thousandtonnes thousandtonnes percent percent
2011 2000-11 2011 2000-11 2010 2011 1990-2000 2000-11Regional office for the NearEast and North Africa
702.3 1.4 173 1.0 11 646 12 163 3.7 2.5
Gulf Cooperation CouncilStates and Yemen
29.1 −1.3 112 1.0 317 327 19.0 −0.1
Bahrain 0.1 −0.1 112 1.0 1 1 0.4 0.9
Kuwait 0.1 19.0 32 5.5 0 0 −5.9 25.6
Oman 1.2 −2.7 53 0.7 6 7 −10.9 −2.1
Qatar 0.1 −5.1 79 5.4 1 1 −1.0 0.0
Saudi Arabia 15.2 0.4 96 1.1 135 147 15.9 1.5
United Arab Emirates 0.3 −11.7 121 −4.0 6 4 −1.2 −15.3
Yemen 12.0 −3.1 139 2.0 168 168 25.1 −1.1
North Africa 202.1 2.8 162 1.8 2 625 3 276 2.9 4.3
Algeria 55.7 2.7 199 6.0 789 1 107 4.4 8.9
Libya 7.6 1.4 102 −0.0 75 77 −3.9 1.4
Mauritania
Morocco 105.4 2.9 156 −1.5 1 360 1 642 3.2 1.3Tunisia 33.4 3.1 134 1.0 402 449 0.2 4.1
Other Near East Countries 471.1 1.0 182 0.3 8 703 8 561 3.3 1.9
Egypt 166.2 1.7 224 2.5 3 523 3 731 0.6 4.2
Iran (Islamic Republic of) 164.0 −2.7 163 −0.1 3 078 2 681 4.7 −2.8
Iraq 41.3 1.7 24 −11.5 107 101 2.8 −10.0
Jordan 6.9 −0.9 155 −0.4 119 107 −2.2 −1.4
Lebanon 9.1 −4.6 243 1.4 250 220 −3.7 −3.3
SudanSudan (former) 42.1 10.7 133 −0.1 554 558 6.6 10.7
Syrian Arab Republic 41.7 3.9 279 −0.4 1 071 1 164 8.0 3.5
Regional Office for Africa 1190.5 1.2 78 2.0 8 914 9 291 5.2 3.2
Regional Office for Asia andthe Pacific
3863.9 4.1 125 2.3 47 929 48 456 8.1
Regional Office for Europeand Central AsiaRegional Office for LatinAmerica and the Caribbean
2121.5 0.1 179 1.6 36 330 37 950 3.8 0.1
World
97
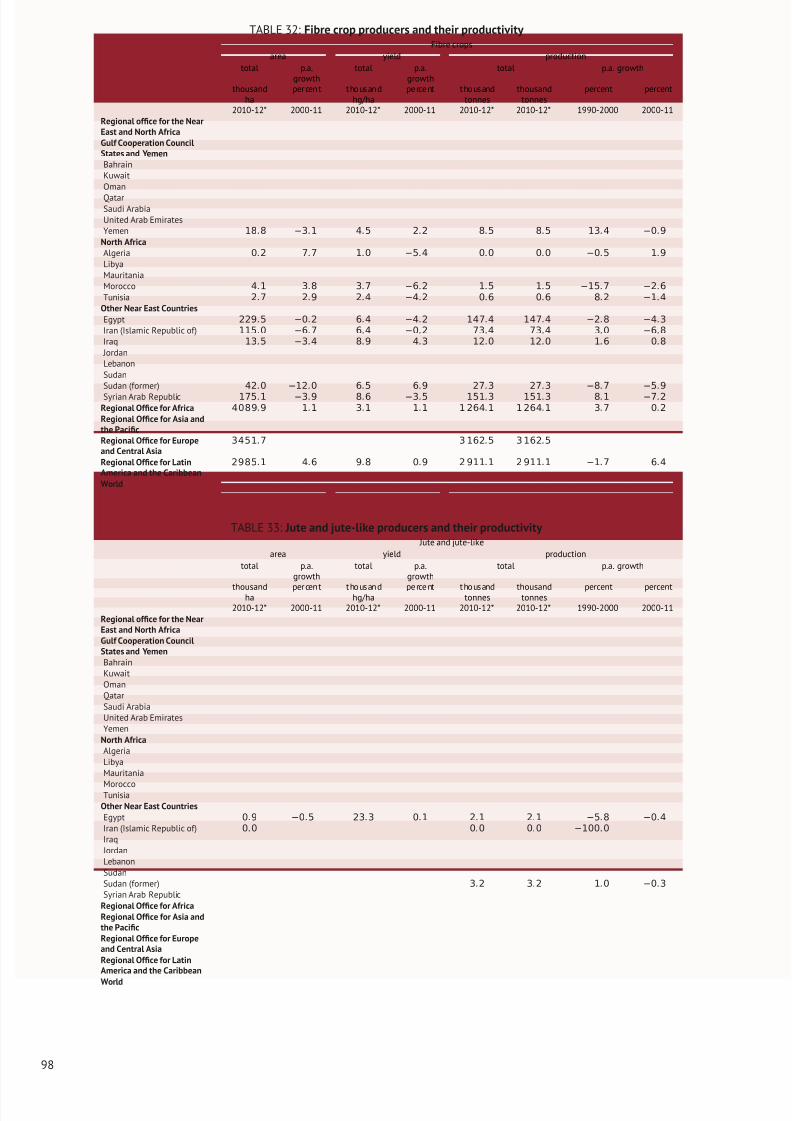
8/12/2019 FAO Statistical Yearbook 2014 Near East and North Africa Food and Agriculture
http://slidepdf.com/reader/full/fao-statistical-yearbook-2014-near-east-and-north-africa-food-and-agriculture 114/174
TABLE 32: Fibre crop producers and their productivity Fibre crops
area yield production
total p.a.growth
total p.a.growth
total p.a. growth
thousandha
percent thousandhg/ha
percent thousandtonnes
thousandtonnes
percent percent
2010-12* 2000-11 2010-12* 2000-11 2010-12* 2010-12* 1990-2000 2000-11Regional office for the NearEast and North AfricaGulf Cooperation CouncilStates and YemenBahrainKuwaitOman
QatarSaudi ArabiaUnited Arab EmiratesYemen 18.8 −3.1 4.5 2.2 8.5 8.5 13.4 −0.9
North AfricaAlgeria 0.2 7.7 1.0 −5.4 0.0 0.0 −0.5 1.9
LibyaMauritaniaMorocco 4.1 3.8 3.7 −6.2 1.5 1.5 −15.7 −2.6
Tunisia 2.7 2.9 2.4 −4.2 0.6 0.6 8.2 −1.4
Other Near East CountriesEgypt 229.5 −0.2 6.4 −4.2 147.4 147.4 −2.8 −4.3
Iran (Islamic Republic of) 115.0 −6.7 6.4 −0.2 73.4 73.4 3.0 −6.8
Iraq 13.5 −3.4 8.9 4.3 12.0 12.0 1.6 0.8
JordanLebanonSudanSudan (former) 42.0 −12.0 6.5 6.9 27.3 27.3 −8.7 −5.9
Syrian Arab Republic 175.1 −3.9 8.6 −3.5 151.3 151.3 8.1 −7.2
Regional Office for Africa 4089.9 1.1 3.1 1.1 1 264.1 1 264.1 3.7 0.2
Regional Office for Asia andthe PacificRegional Office for Europeand Central Asia
3451.7 3 162.5 3 162.5
Regional Office for LatinAmerica and the Caribbean
2985.1 4.6 9.8 0.9 2 911.1 2 911.1 −1.7 6.4
World
TABLE 33: Jute and jute-like producers and their productivity Jute and jute-like
area yield production
total p.a.growth
total p.a.growth
total p.a. growth
thousandha percent thousandhg/ha percent thousandtonnes thousandtonnes percent percent
2010-12* 2000-11 2010-12* 2000-11 2010-12* 2010-12* 1990-2000 2000-11Regional office for the NearEast and North AfricaGulf Cooperation CouncilStates and YemenBahrainKuwaitOmanQatarSaudi ArabiaUnited Arab EmiratesYemen
North AfricaAlgeriaLibyaMauritania
MoroccoTunisia
Other Near East CountriesEgypt 0.9 −0.5 23.3 0.1 2.1 2.1 −5.8 −0.4
Iran (Islamic Republic of) 0.0 0.0 0.0 −100.0
Iraq JordanLebanonSudanSudan (former) 3.2 3.2 1.0 −0.3
Syrian Arab RepublicRegional Office for AfricaRegional Office for Asia andthe PacificRegional Office for Europeand Central AsiaRegional Office for LatinAmerica and the Caribbean
World
98
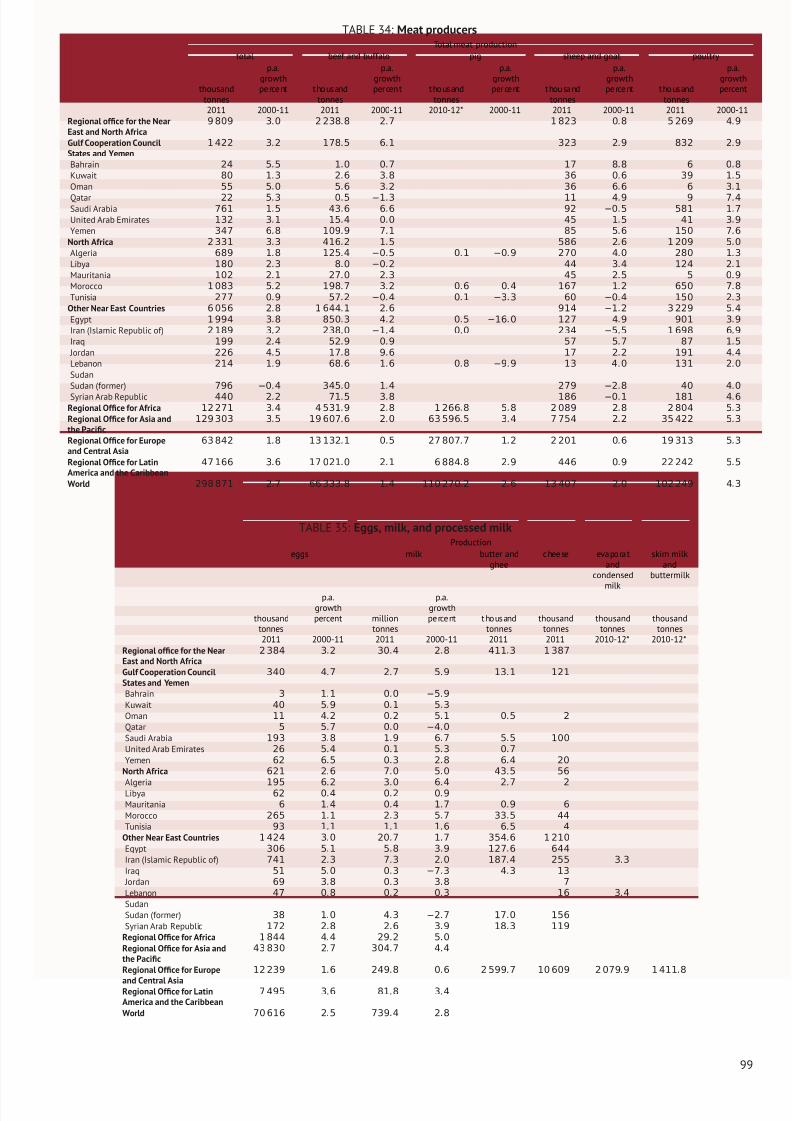
8/12/2019 FAO Statistical Yearbook 2014 Near East and North Africa Food and Agriculture
http://slidepdf.com/reader/full/fao-statistical-yearbook-2014-near-east-and-north-africa-food-and-agriculture 115/174
TABLE 34: Meat producersTotal meat production
total beef and buffalo pig sheep and goat poultry
p.a.growth
p.a.growth
p.a.growth
p.a.growth
p.a.growth
thousandtonnes
percent thousandtonnes
percent thousandtonnes
percent thousandtonnes
percent thousandtonnes
percent
2011 2000-11 2011 2000-11 2010-12* 2000-11 2011 2000-11 2011 2000-11Regional office for the NearEast and North Africa
9 809 3.0 2 238.8 2.7 1 823 0.8 5 269 4.9
Gulf Cooperation CouncilStates and Yemen
1 422 3.2 178.5 6.1 323 2.9 832 2.9
Bahrain 24 5.5 1.0 0.7 17 8.8 6 0.8
Kuwait 80 1.3 2.6 3.8 36 0.6 39 1.5
Oman 55 5.0 5.6 3.2 36 6.6 6 3.1
Qatar 22 5.3 0.5 −1.3 11 4.9 9 7.4Saudi Arabia 761 1.5 43.6 6.6 92 −0.5 581 1.7
United Arab Emirates 132 3.1 15.4 0.0 45 1.5 41 3.9
Yemen 347 6.8 109.9 7.1 85 5.6 150 7.6
North Africa 2 331 3.3 416.2 1.5 586 2.6 1 209 5.0
Algeria 689 1.8 125.4 −0.5 0.1 −0.9 270 4.0 280 1.3
Libya 180 2.3 8.0 −0.2 44 3.4 124 2.1
Mauritania 102 2.1 27.0 2.3 45 2.5 5 0.9
Morocco 1 083 5.2 198.7 3.2 0.6 0.4 167 1.2 650 7.8
Tunisia 277 0.9 57.2 −0.4 0.1 −3.3 60 −0.4 150 2.3
Other Near East Countries 6 056 2.8 1 644.1 2.6 914 −1.2 3 229 5.4
Egypt 1 994 3.8 850.3 4.2 0.5 −16.0 127 4.9 901 3.9
Iran (Islamic Republic of) 2 189 3.2 238.0 −1.4 0.0 234 −5.5 1 698 6.9
Iraq 199 2.4 52.9 0.9 57 5.7 87 1.5
Jordan 226 4.5 17.8 9.6 17 2.2 191 4.4
Lebanon 214 1.9 68.6 1.6 0.8 −9.9 13 4.0 131 2.0
SudanSudan (former) 796 −0.4 345.0 1.4 279 −2.8 40 4.0
Syrian Arab Republic 440 2.2 71.5 3.8 186 −0.1 181 4.6
Regional Office for Africa 12 271 3.4 4 531.9 2.8 1 266.8 5.8 2 089 2.8 2 804 5.3
Regional Office for Asia andthe Pacific
129 303 3.5 19 607.6 2.0 63 596.5 3.4 7 754 2.2 35 422 5.3
Regional Office for Europeand Central Asia
63 842 1.8 13 132.1 0.5 27 807.7 1.2 2 201 0.6 19 313 5.3
Regional Office for LatinAmerica and the Caribbean
47 166 3.6 17 021.0 2.1 6 884.8 2.9 446 0.9 22 242 5.5
World 298 871 2.7 66 333.8 1.4 110 270.2 2.6 13 407 2.0 102 249 4.3
TABLE 35: Eggs, milk, and processed milkProduction
eggs milk butter andghee
cheese evaporatand
condensed
milk
skim milkand
buttermilk
p.a.growth
p.a.growth
thousandtonnes
percent milliontonnes
percent thousandtonnes
thousandtonnes
thousandtonnes
thousandtonnes
2011 2000-11 2011 2000-11 2011 2011 2010-12* 2010-12*
Regional office for the NearEast and North Africa
2 384 3.2 30.4 2.8 411.3 1 387
Gulf Cooperation CouncilStates and Yemen
340 4.7 2.7 5.9 13.1 121
Bahrain 3 1.1 0.0 −5.9
Kuwait 40 5.9 0.1 5.3
Oman 11 4.2 0.2 5.1 0.5 2
Qatar 5 5.7 0.0 −4.0
Saudi Arabia 193 3.8 1.9 6.7 5.5 100
United Arab Emirates 26 5.4 0.1 5.3 0.7
Yemen 62 6.5 0.3 2.8 6.4 20
North Africa 621 2.6 7.0 5.0 43.5 56
Algeria 195 6.2 3.0 6.4 2.7 2
Libya 62 0.4 0.2 0.9
Mauritania 6 1.4 0.4 1.7 0.9 6
Morocco 265 1.1 2.3 5.7 33.5 44
Tunisia 93 1.1 1.1 1.6 6.5 4
Other Near East Countries 1 424 3.0 20.7 1.7 354.6 1 210
Egypt 306 5.1 5.8 3.9 127.6 644
Iran (Islamic Republic of) 741 2.3 7.3 2.0 187.4 255 3.3
Iraq 51 5.0 0.3 −7.3 4.3 13
Jordan 69 3.8 0.3 3.8 7
Lebanon 47 0.8 0.2 0.3 16 3.4
SudanSudan (former) 38 1.0 4.3 −2.7 17.0 156
Syrian Arab Republic 172 2.8 2.6 3.9 18.3 119
Regional Office for Africa 1 844 4.4 29.2 5.0
Regional Office for Asia andthe Pacific
43 830 2.7 304.7 4.4
Regional Office for Europe
and Central Asia
12 239 1.6 249.8 0.6 2 599.7 10 609 2 079.9 1 411.8
Regional Office for LatinAmerica and the Caribbean
7 495 3.6 81.8 3.4
World 70 616 2.5 739.4 2.8
99
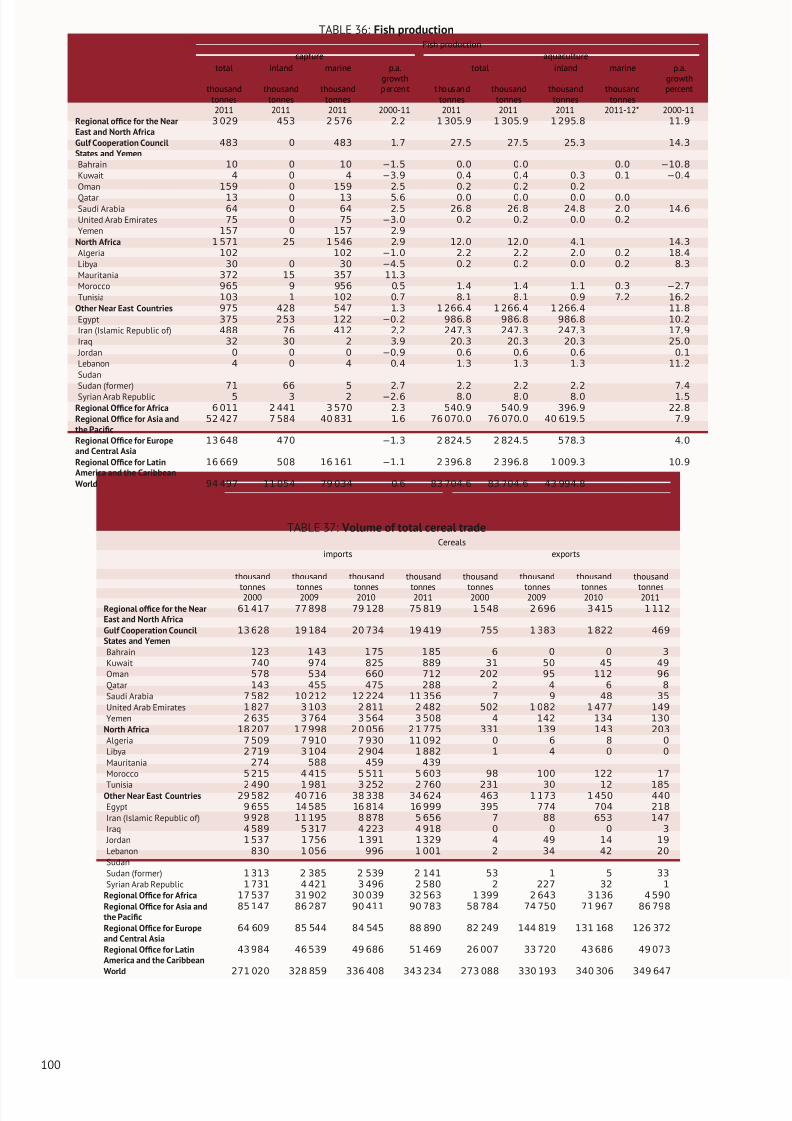
8/12/2019 FAO Statistical Yearbook 2014 Near East and North Africa Food and Agriculture
http://slidepdf.com/reader/full/fao-statistical-yearbook-2014-near-east-and-north-africa-food-and-agriculture 116/174
TABLE 36: Fish productionFish production
capture aquaculture
total inland marine p.a.growth
total inland marine p.a.growth
thousandtonnes
thousandtonnes
thousandtonnes
p ercent thousandtonnes
thousandtonnes
thousandtonnes
thousandtonnes
percent
2011 2011 2011 2000-11 2011 2011 2011 2011-12* 2000-11Regional office for the NearEast and North Africa
3 029 453 2 576 2.2 1 305.9 1 305.9 1 295.8 11.9
Gulf Cooperation CouncilStates and Yemen
483 0 483 1.7 27.5 27.5 25.3 14.3
Bahrain 10 0 10 −1.5 0.0 0.0 0.0 −10.8
Kuwait 4 0 4 −3.9 0.4 0.4 0.3 0.1 −0.4
Oman 159 0 159 2.5 0.2 0.2 0.2
Qatar 13 0 13 5.6 0.0 0.0 0.0 0.0Saudi Arabia 64 0 64 2.5 26.8 26.8 24.8 2.0 14.6
United Arab Emirates 75 0 75 −3.0 0.2 0.2 0.0 0.2
Yemen 157 0 157 2.9
North Africa 1 571 25 1 546 2.9 12.0 12.0 4.1 14.3
Algeria 102 102 −1.0 2.2 2.2 2.0 0.2 18.4
Libya 30 0 30 −4.5 0.2 0.2 0.0 0.2 8.3
Mauritania 372 15 357 11.3
Morocco 965 9 956 0.5 1.4 1.4 1.1 0.3 −2.7
Tunisia 103 1 102 0.7 8.1 8.1 0.9 7.2 16.2
Other Near East Countries 975 428 547 1.3 1 266.4 1 266.4 1 266.4 11.8
Egypt 375 253 122 −0.2 986.8 986.8 986.8 10.2
Iran (Islamic Republic of) 488 76 412 2.2 247.3 247.3 247.3 17.9
Iraq 32 30 2 3.9 20.3 20.3 20.3 25.0
Jordan 0 0 0 −0.9 0.6 0.6 0.6 0.1
Lebanon 4 0 4 0.4 1.3 1.3 1.3 11.2
SudanSudan (former) 71 66 5 2.7 2.2 2.2 2.2 7.4
Syrian Arab Republic 5 3 2 −2.6 8.0 8.0 8.0 1.5
Regional Office for Africa 6 011 2 441 3 570 2.3 540.9 540.9 396.9 22.8
Regional Office for Asia andthe Pacific
52 427 7 584 40 831 1.6 76 070.0 76 070.0 40 619.5 7.9
Regional Office for Europeand Central Asia
13 648 470 −1.3 2 824.5 2 824.5 578.3 4.0
Regional Office for LatinAmerica and the Caribbean
16 669 508 16 161 −1.1 2 396.8 2 396.8 1 009.3 10.9
World 94 497 11 054 79 034 0.6 83 704.6 83 704.6 43 994.8
TABLE 37: Volume of total cereal tradeCereals
imports exports
thousand
tonnes
thousand
tonnes
thousand
tonnes
thousand
tonnes
thousand
tonnes
thousand
tonnes
thousand
tonnes
thousand
tonnes2000 2009 2010 2011 2000 2009 2010 2011
Regional office for the NearEast and North Africa
61 417 77 898 79 128 75 819 1 548 2 696 3 415 1 112
Gulf Cooperation CouncilStates and Yemen
13 628 19 184 20 734 19 419 755 1 383 1 822 469
Bahrain 123 143 1 75 1 85 6 0 0 3
Kuwait 740 974 825 889 31 50 45 49
Oman 578 534 660 712 202 95 112 96
Qatar 143 455 475 288 2 4 6 8
Saudi Arabia 7 582 10 212 12 224 11 356 7 9 48 35
United Arab Emirates 1 827 3 103 2 811 2 482 502 1 082 1 477 149
Yemen 2 635 3 764 3 564 3 508 4 142 134 130
North Africa 18 207 1 7 998 2 0 056 2 1 775 331 139 143 203
Algeria 7 509 7 910 7 930 11 092 0 6 8 0
Libya 2 719 3 104 2 904 1 882 1 4 0 0
Mauritania 274 588 459 439
Morocco 5 215 4 415 5 511 5 603 98 100 122 17
Tunisia 2 490 1 981 3 252 2 760 231 30 12 185Other Near East Countries 29 582 40 716 38 338 34 624 463 1 173 1 450 440
Egypt 9 655 14 585 16 814 16 999 395 774 704 218
Iran (Islamic Republic of) 9 928 11 195 8 878 5 656 7 88 653 147
Iraq 4 589 5 317 4 223 4 918 0 0 0 3
Jordan 1 537 1 756 1 391 1 329 4 49 14 19
Lebanon 830 1 056 996 1 001 2 34 42 20
SudanSudan (former) 1 313 2 385 2 539 2 141 53 1 5 33
Syrian Arab Republic 1 731 4 421 3 496 2 580 2 227 32 1
Regional Office for Africa 17 537 31 902 30 039 32 563 1 399 2 643 3 136 4 590
Regional Office for Asia andthe Pacific
85 147 86 287 90 411 90 783 58 784 74 750 71 967 86 798
Regional Office for Europeand Central Asia
64 609 85 544 84 545 88 890 82 249 144 819 131 168 126 372
Regional Office for LatinAmerica and the Caribbean
43 984 46 539 49 686 51 469 26 007 33 720 43 686 49 073
World 271 020 328 859 336 408 343 234 273 088 330 193 340 306 349 647
100
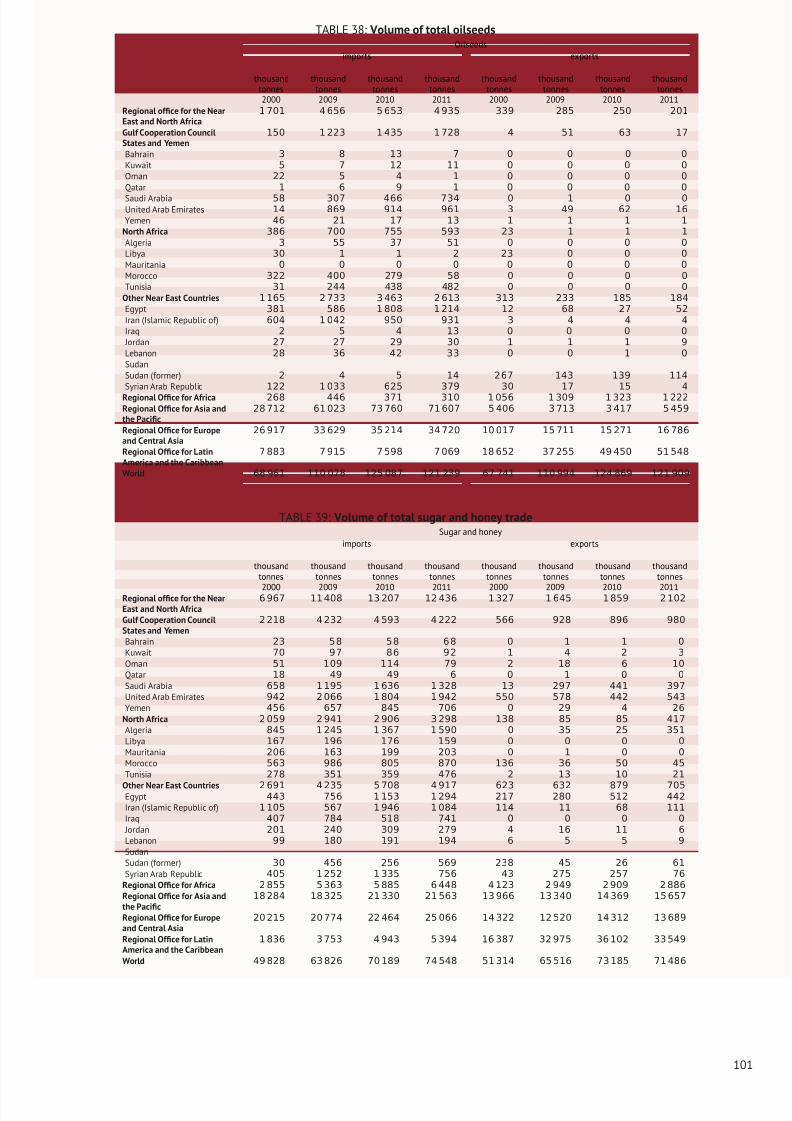
8/12/2019 FAO Statistical Yearbook 2014 Near East and North Africa Food and Agriculture
http://slidepdf.com/reader/full/fao-statistical-yearbook-2014-near-east-and-north-africa-food-and-agriculture 117/174
TABLE 38: Volume of total oilseedsOilseeds
imports exports
thousandtonnes
thousandtonnes
thousandtonnes
thousandtonnes
thousandtonnes
thousandtonnes
thousandtonnes
thousandtonnes
2000 2009 2010 2011 2000 2009 2010 2011
Regional office for the NearEast and North Africa
1 701 4 656 5 653 4 935 339 285 250 201
Gulf Cooperation CouncilStates and Yemen
150 1 223 1 435 1 728 4 51 63 17
Bahrain 3 8 13 7 0 0 0 0
Kuwait 5 7 12 11 0 0 0 0
Oman 22 5 4 1 0 0 0 0
Qatar 1 6 9 1 0 0 0 0
Saudi Arabia 58 307 466 734 0 1 0 0
United Arab Emirates 14 869 914 961 3 49 62 16
Yemen 46 21 17 13 1 1 1 1
North Africa 386 700 755 593 23 1 1 1
Algeria 3 55 37 51 0 0 0 0
Libya 30 1 1 2 23 0 0 0
Mauritania 0 0 0 0 0 0 0 0
Morocco 322 400 279 58 0 0 0 0
Tunisia 31 244 438 482 0 0 0 0
Other Near East Countries 1 165 2 733 3 463 2 613 313 233 185 184
Egypt 381 586 1 808 1 214 12 68 27 52
Iran (Islamic Republic of) 604 1 042 950 931 3 4 4 4
Iraq 2 5 4 13 0 0 0 0
Jordan 27 27 29 30 1 1 1 9
Lebanon 28 36 42 33 0 0 1 0
SudanSudan (former) 2 4 5 14 267 143 139 114
Syrian Arab Republic 122 1 033 625 379 30 17 15 4
Regional Office for Africa 268 446 371 310 1 056 1 309 1 323 1 222
Regional Office for Asia andthe Pacific
28 712 61 023 73 760 71 607 5 406 3 713 3 417 5 459
Regional Office for Europeand Central Asia
26 917 33 629 35 214 34 720 10 017 15 711 15 271 16 786
Regional Office for LatinAmerica and the Caribbean
7 883 7 915 7 598 7 069 18 652 37 255 49 450 51 548
World 68 961 110 078 125 087 121 239 67 741 110 994 124 869 121 909
TABLE 39: Volume of total sugar and honey tradeSugar and honey
imports exports
thousandtonnes
thousandtonnes
thousandtonnes
thousandtonnes
thousandtonnes
thousandtonnes
thousandtonnes
thousandtonnes
2000 2009 2010 2011 2000 2009 2010 2011Regional office for the NearEast and North Africa
6 967 11 408 13 207 12 436 1 327 1 645 1 859 2 102
Gulf Cooperation CouncilStates and Yemen
2 218 4 232 4 593 4 222 566 928 896 980
Bahrain 23 5 8 5 8 6 8 0 1 1 0
Kuwait 70 97 86 9 2 1 4 2 3
Oman 51 109 114 79 2 18 6 10
Qatar 18 49 49 6 0 1 0 0
Saudi Arabia 658 1 195 1 636 1 328 13 297 441 397
United Arab Emirates 942 2 066 1 804 1 942 550 578 442 543
Yemen 456 657 845 706 0 29 4 26
North Africa 2 059 2 941 2 906 3 298 138 85 85 417
Algeria 845 1 245 1 367 1 590 0 35 25 351
Libya 167 196 176 159 0 0 0 0
Mauritania 206 163 199 203 0 1 0 0
Morocco 563 986 805 870 136 36 50 45
Tunisia 278 351 359 476 2 13 10 21
Other Near East Countries 2 691 4 235 5 708 4 917 623 632 879 705Egypt 443 756 1 153 1 294 217 280 512 442
Iran (Islamic Republic of) 1 105 567 1 946 1 084 114 11 68 111
Iraq 407 784 518 741 0 0 0 0
Jordan 201 240 309 279 4 16 11 6
Lebanon 99 180 191 194 6 5 5 9
SudanSudan (former) 30 456 256 569 238 45 26 61
Syrian Arab Republic 405 1 252 1 335 756 43 275 257 76
Regional Office for Africa 2 855 5 363 5 885 6 448 4 123 2 949 2 909 2 886
Regional Office for Asia andthe Pacific
18 284 18 325 21 330 21 563 13 966 13 340 14 369 15 657
Regional Office for Europeand Central Asia
20 215 20 774 22 464 25 066 14 322 12 520 14 312 13 689
Regional Office for LatinAmerica and the Caribbean
1 836 3 753 4 943 5 394 16 387 32 975 36 102 33 549
World 49 828 63 826 70 189 74 548 51 314 65 516 73 185 71 486
101
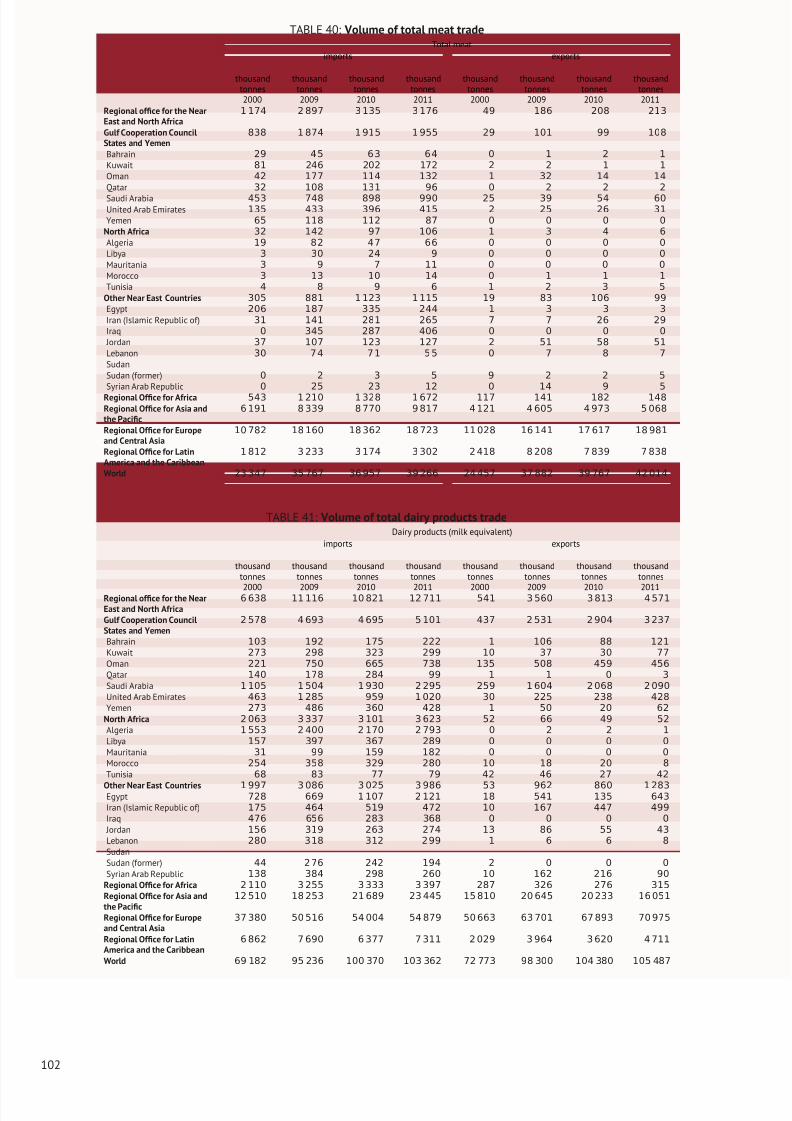
8/12/2019 FAO Statistical Yearbook 2014 Near East and North Africa Food and Agriculture
http://slidepdf.com/reader/full/fao-statistical-yearbook-2014-near-east-and-north-africa-food-and-agriculture 118/174
TABLE 40: Volume of total meat tradeTotal meat
imports exports
thousandtonnes
thousandtonnes
thousandtonnes
thousandtonnes
thousandtonnes
thousandtonnes
thousandtonnes
thousandtonnes
2000 2009 2010 2011 2000 2009 2010 2011
Regional office for the NearEast and North Africa
1 174 2 897 3 135 3 176 49 186 208 213
Gulf Cooperation CouncilStates and Yemen
838 1 874 1 915 1 955 29 101 99 108
Bahrain 29 4 5 6 3 6 4 0 1 2 1
Kuwait 81 246 202 172 2 2 1 1
Oman 42 177 114 132 1 32 14 14
Qatar 32 108 131 96 0 2 2 2
Saudi Arabia 453 748 898 990 25 39 54 60
United Arab Emirates 135 433 396 415 2 25 26 31
Yemen 65 118 112 87 0 0 0 0
North Africa 32 142 97 106 1 3 4 6
Algeria 19 82 47 66 0 0 0 0
Libya 3 30 24 9 0 0 0 0
Mauritania 3 9 7 11 0 0 0 0
Morocco 3 13 10 14 0 1 1 1
Tunisia 4 8 9 6 1 2 3 5
Other Near East Countries 305 881 1 123 1 115 19 83 106 99
Egypt 206 187 335 244 1 3 3 3
Iran (Islamic Republic of) 31 141 281 265 7 7 26 29
Iraq 0 345 287 406 0 0 0 0
Jordan 37 107 123 127 2 51 58 51
Lebanon 30 7 4 7 1 5 5 0 7 8 7
SudanSudan (former) 0 2 3 5 9 2 2 5
Syrian Arab Republic 0 25 23 12 0 14 9 5
Regional Office for Africa 543 1 210 1 328 1 672 117 141 182 148
Regional Office for Asia andthe Pacific
6 191 8 339 8 770 9 817 4 121 4 605 4 973 5 068
Regional Office for Europeand Central Asia
10 782 18 160 18 362 18 723 11 028 16 141 17 617 18 981
Regional Office for LatinAmerica and the Caribbean
1 812 3 233 3 174 3 302 2 418 8 208 7 839 7 838
World 23 347 35 767 36 957 39 266 24 457 37 882 39 767 42 014
TABLE 41: Volume of total dairy products tradeDairy products (milk equivalent)
imports exports
thousandtonnes
thousandtonnes
thousandtonnes
thousandtonnes
thousandtonnes
thousandtonnes
thousandtonnes
thousandtonnes
2000 2009 2010 2011 2000 2009 2010 2011Regional office for the NearEast and North Africa
6 638 11 116 10 821 12 711 541 3 560 3 813 4 571
Gulf Cooperation CouncilStates and Yemen
2 578 4 693 4 695 5 101 437 2 531 2 904 3 237
Bahrain 103 192 175 222 1 106 88 121
Kuwait 273 298 323 299 10 37 30 77
Oman 221 750 665 738 135 508 459 456
Qatar 140 178 284 99 1 1 0 3
Saudi Arabia 1 105 1 504 1 930 2 295 259 1 604 2 068 2 090
United Arab Emirates 463 1 285 959 1 020 30 225 238 428
Yemen 273 486 360 428 1 50 20 62
North Africa 2 063 3 337 3 101 3 623 52 66 49 52
Algeria 1 553 2 400 2 170 2 793 0 2 2 1
Libya 157 397 367 289 0 0 0 0
Mauritania 31 99 159 182 0 0 0 0
Morocco 254 358 329 280 10 18 20 8
Tunisia 68 83 77 79 42 46 27 42
Other Near East Countries 1 997 3 086 3 025 3 986 53 962 860 1 283Egypt 728 669 1 107 2 121 18 541 135 643
Iran (Islamic Republic of) 175 464 519 472 10 167 447 499
Iraq 476 656 283 368 0 0 0 0
Jordan 156 319 263 274 13 86 55 43
Lebanon 280 318 312 2 99 1 6 6 8
SudanSudan (former) 44 2 76 242 194 2 0 0 0
Syrian Arab Republic 138 384 298 260 10 162 216 90
Regional Office for Africa 2 110 3 255 3 333 3 397 287 326 276 315
Regional Office for Asia andthe Pacific
12 510 18 253 21 689 23 445 15 810 20 645 20 233 16 051
Regional Office for Europeand Central Asia
37 380 50 516 54 004 54 879 50 663 63 701 67 893 70 975
Regional Office for LatinAmerica and the Caribbean
6 862 7 690 6 377 7 311 2 029 3 964 3 620 4 711
World 69 182 95 236 100 370 103 362 72 773 98 300 104 380 105 487
102
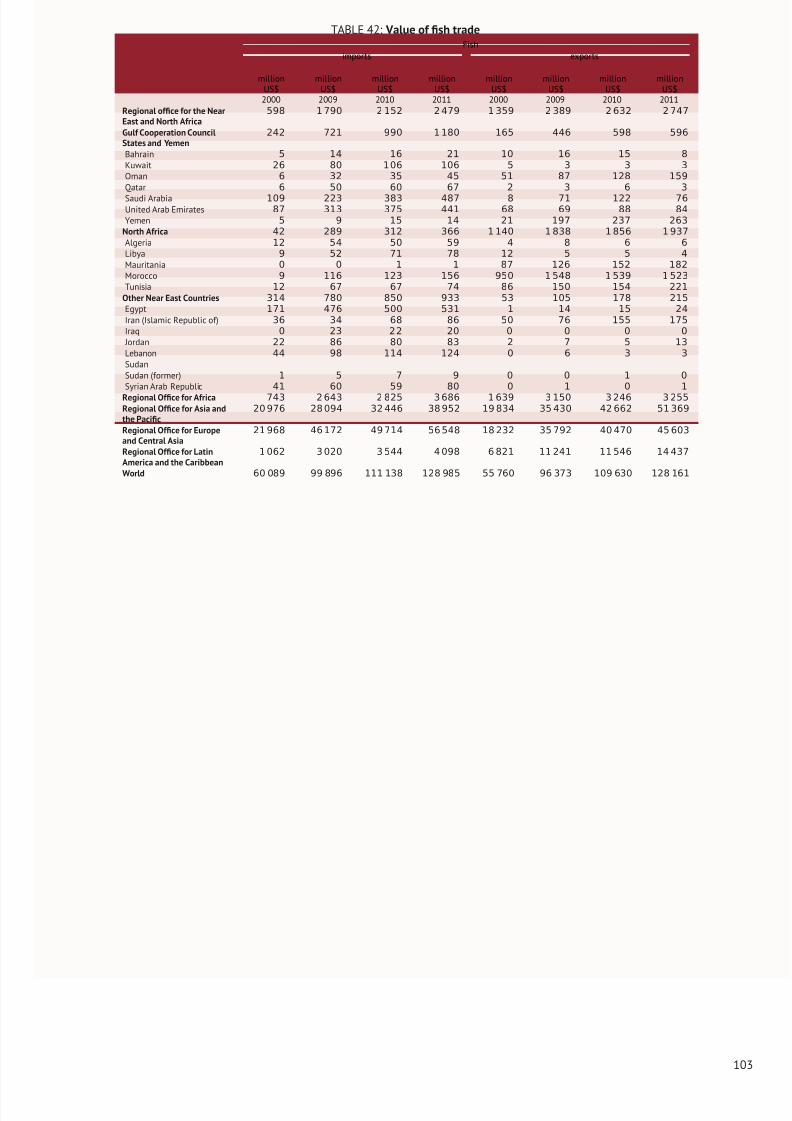
8/12/2019 FAO Statistical Yearbook 2014 Near East and North Africa Food and Agriculture
http://slidepdf.com/reader/full/fao-statistical-yearbook-2014-near-east-and-north-africa-food-and-agriculture 119/174
TABLE 42: Value of fish tradeFish
imports exports
millionUS$
millionUS$
millionUS$
millionUS$
millionUS$
millionUS$
millionUS$
millionUS$
2000 2009 2010 2011 2000 2009 2010 2011
Regional office for the NearEast and North Africa
598 1 790 2 152 2 479 1 359 2 389 2 632 2 747
Gulf Cooperation CouncilStates and Yemen
242 721 990 1 180 165 446 598 596
Bahrain 5 14 16 21 10 16 15 8
Kuwait 26 80 1 06 106 5 3 3 3
Oman 6 32 35 45 51 87 128 159
Qatar 6 50 60 67 2 3 6 3
Saudi Arabia 109 223 383 487 8 71 122 76
United Arab Emirates 87 313 375 441 68 69 88 84
Yemen 5 9 15 14 21 197 237 263
North Africa 42 289 312 366 1 140 1 838 1 856 1 937
Algeria 12 54 50 59 4 8 6 6
Libya 9 52 71 78 12 5 5 4
Mauritania 0 0 1 1 87 126 152 182
Morocco 9 116 123 156 950 1 548 1 539 1 523
Tunisia 12 67 67 74 86 150 154 221
Other Near East Countries 314 780 850 933 53 105 178 215
Egypt 171 476 500 531 1 14 15 24
Iran (Islamic Republic of) 36 34 68 86 50 76 155 175
Iraq 0 23 2 2 20 0 0 0 0
Jordan 22 86 80 83 2 7 5 13
Lebanon 44 98 114 124 0 6 3 3
SudanSudan (former) 1 5 7 9 0 0 1 0
Syrian Arab Republic 41 60 59 80 0 1 0 1
Regional Office for Africa 743 2 643 2 825 3 686 1 639 3 150 3 246 3 255
Regional Office for Asia andthe Pacific
20 976 28 094 32 446 38 952 19 834 35 430 42 662 51 369
Regional Office for Europeand Central Asia
21 968 46 172 49 714 56 548 18 232 35 792 40 470 45 603
Regional Office for LatinAmerica and the Caribbean
1 062 3 020 3 544 4 098 6 821 11 241 11 546 14 437
World 60 089 99 896 111 138 128 985 55 760 96 373 109 630 128 161
103

8/12/2019 FAO Statistical Yearbook 2014 Near East and North Africa Food and Agriculture
http://slidepdf.com/reader/full/fao-statistical-yearbook-2014-near-east-and-north-africa-food-and-agriculture 120/174
104
8/12/2019 FAO Statistical Yearbook 2014 Near East and North Africa Food and Agriculture
http://slidepdf.com/reader/full/fao-statistical-yearbook-2014-near-east-and-north-africa-food-and-agriculture 121/174
PART
Sustainability dimensions
Agriculture – including crops, livestock, forest, fisheries and aqua-culture – is the main human activity responsible for natural resourcemanagement at the local and regional levels. The Near East andAfrica region’s critical shortage of water and cultivable land and thepressure on these resources, and their degradation make their effi-cient management a paramount task. Appropriate management of demand can help ensure that water and land are used optimally forcrop, livestock, fisheries and forestry production. A holistic approachto water and resource management is the first step in addressingthe challenges the region is facing and to identify working solutions.
Livestock and fisheries are particularly important food resources inmany countries of the region, which makes preservation and sustain-able management of rangelands and marine ecosystems resources animportant priority.
In several countries in the region, forestry, although limited, playsan important role in the preservation of the natural environment andthe mitigation of the impacts of climate change. Increasing efficiency
105
8/12/2019 FAO Statistical Yearbook 2014 Near East and North Africa Food and Agriculture
http://slidepdf.com/reader/full/fao-statistical-yearbook-2014-near-east-and-north-africa-food-and-agriculture 122/174
of water and land use through new technologies could expand pro-duction and increase the use of these resources in the alleviation of food insecurity and poverty. Opportunities for water harvesting, re-
utilization of wastewater and enhancement of rangeland have greatpotential in many countries of the region. For these opportunities tobe realized, it will be necessary to promote the engagement and par-ticipation of all stakeholders in planning and managing water, landand genetic resources. Regional cooperation on transboundary watermanagement will also be essential.
With proper policies, agricultural sectors can deliver a wide rangeof benefits, including the provision of environmental services andamenities through water storage and purification, carbon seques-tration and the maintenance of rural landscapes. In this context,
research-driven sustainable pathways to agricultural intensificationcan save vast areas of natural forest and grasslands that would bedeveloped in the absence of higher crop, meat and milk yields.
Both new and traditional demands for produce are increasing thepressure on scarce agricultural resources in the region. While theagriculture sector will be forced to compete for land and water withexpanding urban settlements and industrial zones, it may also berequired to meet the growing demands of the emerging bio-basedeconomy, increasingly through bioenergy and new emerging marketsfor renewable and sustainable industrial products.
Climate change is likely to affect agriculture and food security in theregion primarily through changes in temperature, precipitation, ex-treme climatic events and sea level. These may result in increasedwater scarcity, land degradation, crop failures, loss of rangeland andother vegetation covers, livestock deaths and reduced fisheries pro-duction. To move toward sustainable food and agriculture systems,governments, public institutions and farmers, particularly the poorproducers, need to be supported in their efforts to adapt to and,where appropriate, mitigate climate change.
Emissions of greenhouse gases (GHGs) from agriculture, forestry andother land uses contribute significantly to the threat of global warm-ing. The land sectors are responsible for nearly 30 percent of allhuman-induced GHG emissions into the atmosphere, a contributioncomparable to that of the energy sector and far exceeding total emis-sions from transportation. Crop and livestock production alone is re-sponsible for half of the methane and two-thirds of the nitrous oxideemitted into the atmosphere by human activity.
106
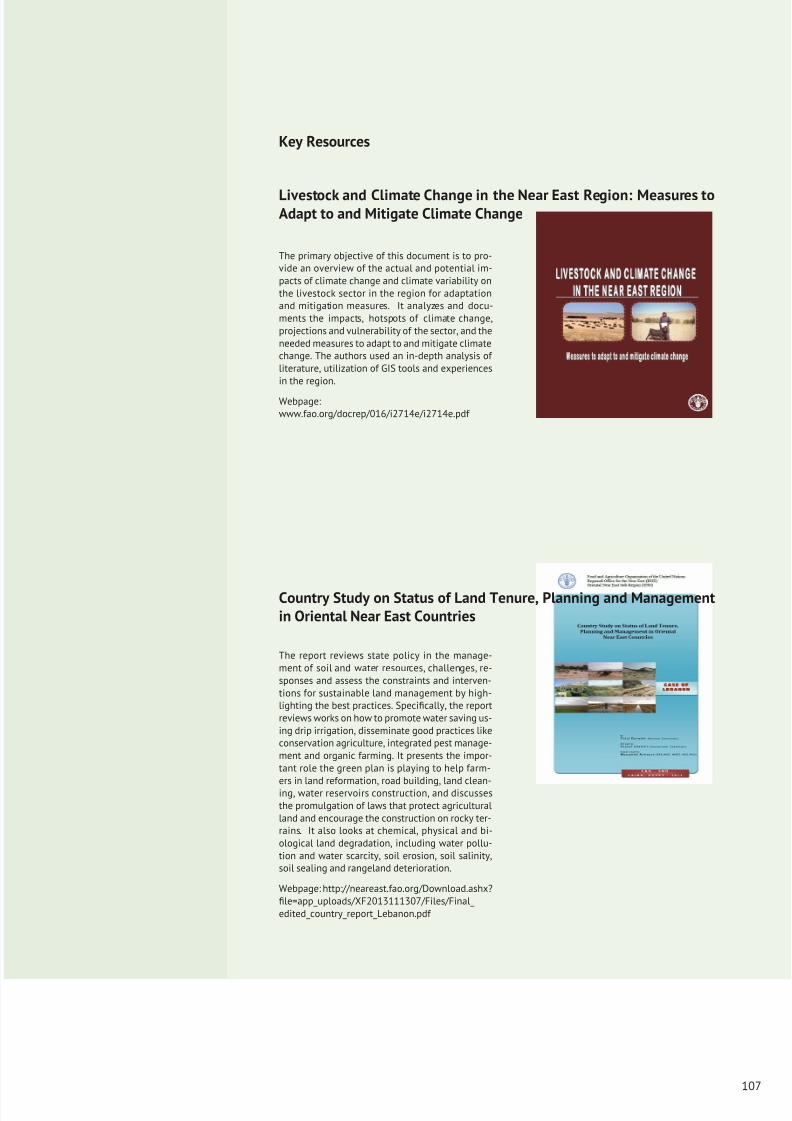
8/12/2019 FAO Statistical Yearbook 2014 Near East and North Africa Food and Agriculture
http://slidepdf.com/reader/full/fao-statistical-yearbook-2014-near-east-and-north-africa-food-and-agriculture 123/174
Key Resources
Livestock and Climate Change in the Near East Region: Measures toAdapt to and Mitigate Climate Change
The primary objective of this document is to pro-vide an overview of the actual and potential im-pacts of climate change and climate variability onthe livestock sector in the region for adaptationand mitigation measures. It analyzes and docu-ments the impacts, hotspots of climate change,projections and vulnerability of the sector, and theneeded measures to adapt to and mitigate climatechange. The authors used an in-depth analysis of literature, utilization of GIS tools and experiencesin the region.
Webpage:www.fao.org/docrep/016/i2714e/i2714e.pdf
Country Study on Status of Land Tenure, Planning and Managementin Oriental Near East Countries
The report reviews state policy in the manage-ment of soil and water resources, challenges, re-sponses and assess the constraints and interven-tions for sustainable land management by high-lighting the best practices. Specifically, the reportreviews works on how to promote water saving us-ing drip irrigation, disseminate good practices likeconservation agriculture, integrated pest manage-ment and organic farming. It presents the impor-tant role the green plan is playing to help farm-
ers in land reformation, road building, land clean-ing, water reservoirs construction, and discussesthe promulgation of laws that protect agriculturalland and encourage the construction on rocky ter-rains. It also looks at chemical, physical and bi-ological land degradation, including water pollu-tion and water scarcity, soil erosion, soil salinity,soil sealing and rangeland deterioration.
Webpage: http://neareast.fao.org/Download.ashx?file=app_uploads/XF2013111307/Files/Final_edited_country_report_Lebanon.pdf
107
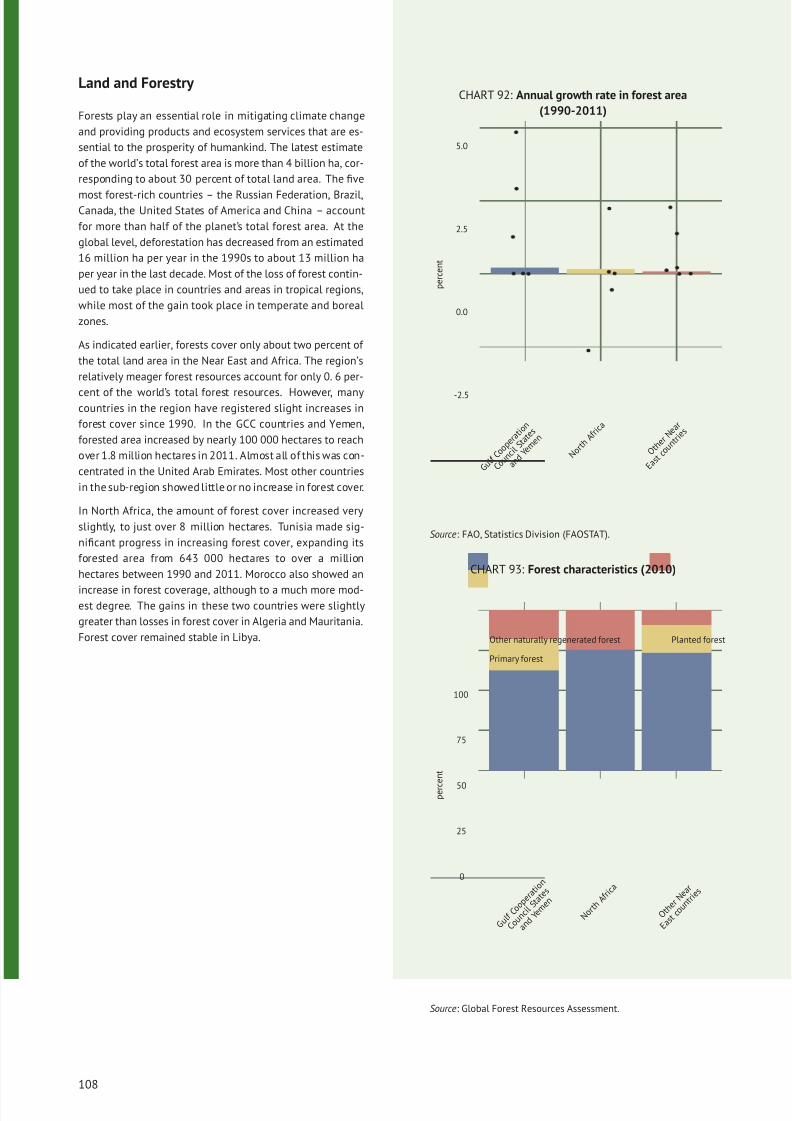
8/12/2019 FAO Statistical Yearbook 2014 Near East and North Africa Food and Agriculture
http://slidepdf.com/reader/full/fao-statistical-yearbook-2014-near-east-and-north-africa-food-and-agriculture 124/174
Land and Forestry
Forests play an essential role in mitigating climate change
and providing products and ecosystem services that are es-
sential to the prosperity of humankind. The latest estimate
of the world’s total forest area is more than 4 billion ha, cor-
responding to about 30 percent of total land area. The five
most forest-rich countries – the Russian Federation, Brazil,Canada, the United States of America and China – account
for more than half of the planet’s total forest area. At the
global level, deforestation has decreased from an estimated
16 million ha per year in the 1990s to about 13 million ha
per year in the last decade. Most of the loss of forest contin-
ued to take place in countries and areas in tropical regions,
while most of the gain took place in temperate and boreal
zones.
As indicated earlier, forests cover only about two percent of
the total land area in the Near East and Africa. The region’s
relatively meager forest resources account for only 0. 6 per-
cent of the world’s total forest resources. However, manycountries in the region have registered slight increases in
forest cover since 1990. In the GCC countries and Yemen,
forested area increased by nearly 100 000 hectares to reach
over 1.8 million hectares in 2011. Almost all of this was con-
centrated in the United Arab Emirates. Most other countries
in the sub-region showed little or no increase in forest cover.
In North Africa, the amount of forest cover increased very
slightly, to just over 8 million hectares. Tunisia made sig-
nificant progress in increasing forest cover, expanding its
forested area from 643 000 hectares to over a million
hectares between 1990 and 2011. Morocco also showed an
increase in forest coverage, although to a much more mod-est degree. The gains in these two countries were slightly
greater than losses in forest cover in Algeria and Mauritania.
Forest cover remained stable in Libya.
CHART 92: Annual growth rate in forest area
(1990-2011)
-2.5
0.0
2.5
5.0
G u l f
C o o p
e r a t
i o n
C o u n
c i l S t a t
e s
a n d
Y e m e
n
N o r t h
A f r i c a
O t h e
r N e a
r
E a s t
c o u n
t r i e s
p e r c e n t
Source: FAO, Statistics Division (FAOSTAT).
CHART 93: Forest characteristics (2010)
0
25
50
75
100
G u l f
C o o p
e r a t
i o n
C o u n
c i l S t a t
e s
a n d
Y e m e
n
N o r t h
A f r i c
a
O t h e
r N e a
r
E a s t
c o u n
t r i e s
p e r c
e n t
Other naturally regenerated forest
Primary forest
Planted forest
Source: Global Forest Resources Assessment.
108
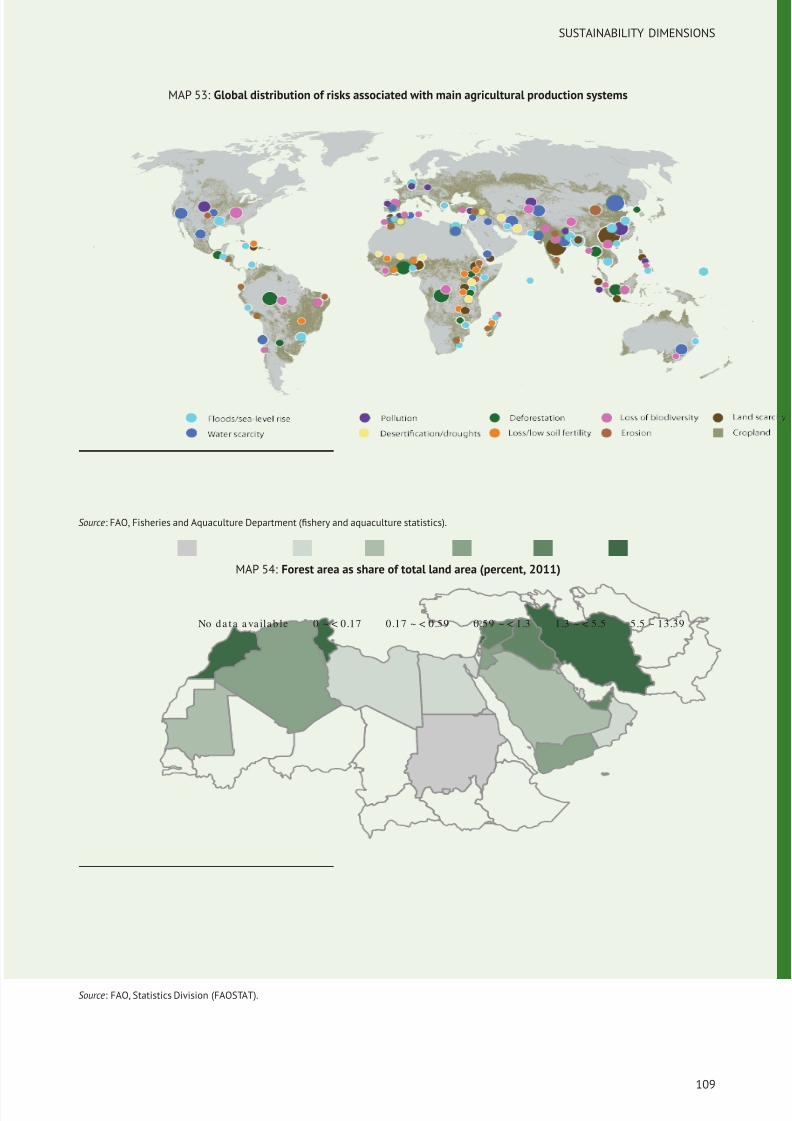
8/12/2019 FAO Statistical Yearbook 2014 Near East and North Africa Food and Agriculture
http://slidepdf.com/reader/full/fao-statistical-yearbook-2014-near-east-and-north-africa-food-and-agriculture 125/174
SUSTAINABILITY DIMENSIONS
MAP 53: Global distribution of risks associated with main agricultural production systems
Source: FAO, Fisheries and Aquaculture Department (fishery and aquaculture statistics).
MAP 54: Forest area as share of total land area (percent, 2011)
No da ta a va ilab le 0 ~ < 0.17 0.17 ~ < 0.59 0.59 ~ < 1.3 1.3 ~ < 5.5 5.5 ~ 13.39
Source: FAO, Statistics Division (FAOSTAT).
109
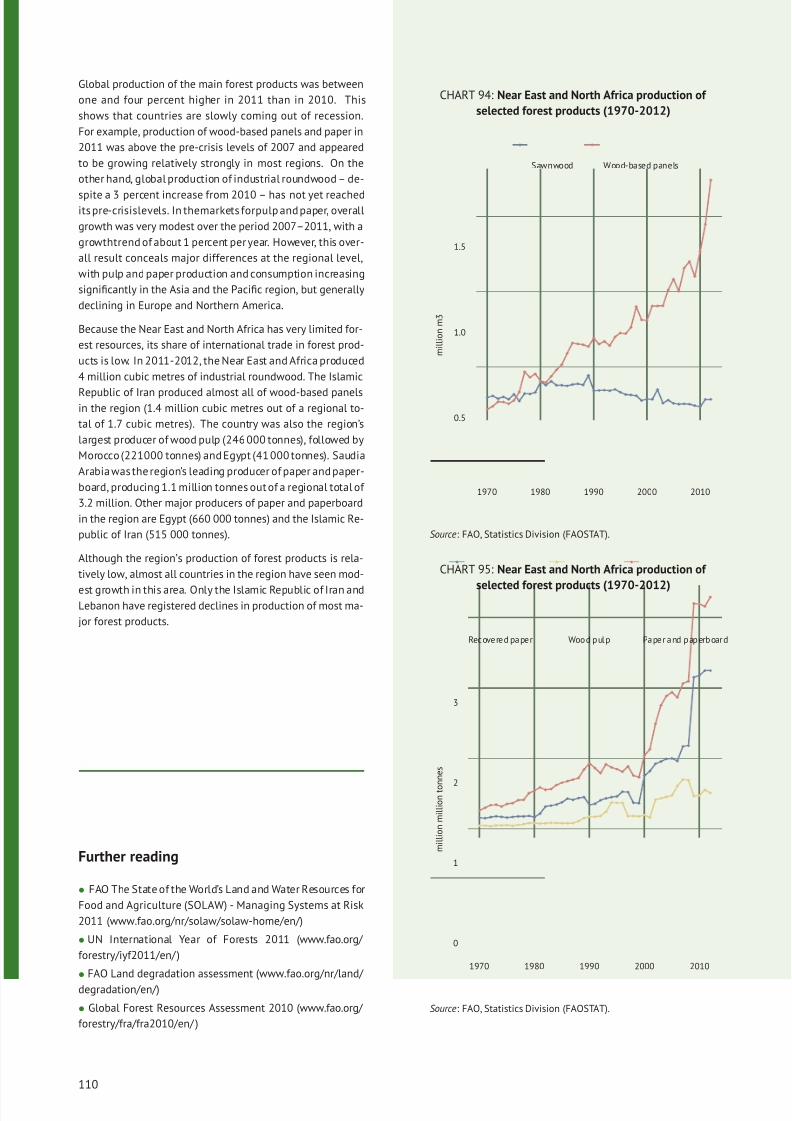
8/12/2019 FAO Statistical Yearbook 2014 Near East and North Africa Food and Agriculture
http://slidepdf.com/reader/full/fao-statistical-yearbook-2014-near-east-and-north-africa-food-and-agriculture 126/174
Global production of the main forest products was between
one and four percent higher in 2011 than in 2010. This
shows that countries are slowly coming out of recession.
For example, production of wood-based panels and paper in
2011 was above the pre-crisis levels of 2007 and appeared
to be growing relatively strongly in most regions. On the
other hand, global production of industrial roundwood – de-
spite a 3 percent increase from 2010 – has not yet reachedits pre-crisislevels. In themarkets forpulp and paper, overall
growth was very modest over the period 2007–2011, with a
growthtrend of about 1 percent per year. However, this over-
all result conceals major differences at the regional level,
with pulp and paper production and consumption increasing
significantly in the Asia and the Pacific region, but generally
declining in Europe and Northern America.
Because the Near East and North Africa has very limited for-
est resources, its share of international trade in forest prod-
ucts is low. In 2011-2012, the Near East and Africa produced
4 million cubic metres of industrial roundwood. The Islamic
Republic of Iran produced almost all of wood-based panelsin the region (1.4 million cubic metres out of a regional to-
tal of 1.7 cubic metres). The country was also the region’s
largest producer of wood pulp (246 000 tonnes), followed by
Morocco (221000 tonnes) and Egypt (41 000 tonnes). Saudia
Arabia was the region’s leading producer of paper and paper-
board, producing 1.1 million tonnes out of a regional total of
3.2 million. Other major producers of paper and paperboard
in the region are Egypt (660 000 tonnes) and the Islamic Re-
public of Iran (515 000 tonnes).
Although the region’s production of forest products is rela-
tively low, almost all countries in the region have seen mod-
est growth in this area. Only the Islamic Republic of Iran andLebanon have registered declines in production of most ma-
jor forest products.
Further reading
• FAO The State of the World’s Land and Water Resources for
Food and Agriculture (SOLAW) - Managing Systems at Risk
2011 (www.fao.org/nr/solaw/solaw-home/en/)
• UN International Year of Forests 2011 (www.fao.org/
forestry/iyf2011/en/ )
• FAO Land degradation assessment (www.fao.org/nr/land/
degradation/en/)
• Global Forest Resources Assessment 2010 (www.fao.org/
forestry/fra/fra2010/en/ )
CHART 94: Near East and North Africa production of
selected forest products (1970-2012)
0.5
1.0
1.5
1970 1980 1990 2000 2010
m i l l i o n m 3
Sawnwood Wood-based panels
Source: FAO, Statistics Division (FAOSTAT).
CHART 95: Near East and North Africa production of
selected forest products (1970-2012)
0
1
2
3
1970 1980 1990 2000 2010
m i l l i o n m i l l i o n t o n n e s
Recovered paper Wood pulp Paper and paperboar d
Source: FAO, Statistics Division (FAOSTAT).
110
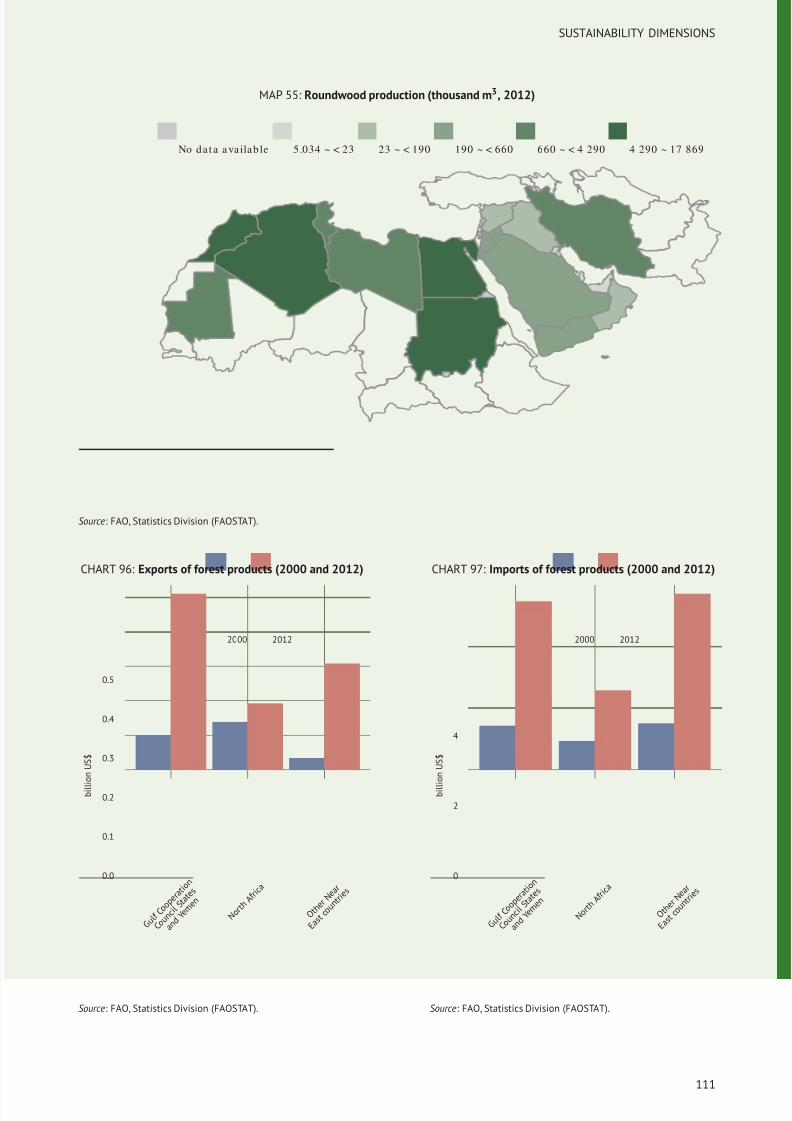
8/12/2019 FAO Statistical Yearbook 2014 Near East and North Africa Food and Agriculture
http://slidepdf.com/reader/full/fao-statistical-yearbook-2014-near-east-and-north-africa-food-and-agriculture 127/174
SUSTAINABILITY DIMENSIONS
MAP 55: Roundwood production (thousand m3, 2012)
No da t a a va ilab le 5.034 ~ < 23 23 ~ < 190 190 ~ < 660 660 ~ < 4 290 4 290 ~ 17 869
Source: FAO, Statistics Division (FAOSTAT).
CHART 96: Exports of forest products (2000 and 2012)
0.0
0.1
0.2
0.3
0.4
0.5
G u l f
C o o p
e r a t
i o n
C o u n
c i l S t a t
e s
a n d Y e
m e n
N o r t h
A f r i c
a
O t h e
r N e a
r
E a s t
c o u n
t r i e s
b i l l i o n U S $
2000 2012
Source: FAO, Statistics Division (FAOSTAT).
CHART 97: Imports of forest products (2000 and 2012)
0
2
4
G u l f
C o o p
e r a t
i o n
C o u n
c i l S t a t
e s
a n d Y e
m e n
N o r t h
A f r i c
a
O t h e
r N e a
r
E a s t
c o u n
t r i e s
b i l l i o n U S $
2000 2012
Source: FAO, Statistics Division (FAOSTAT).
111
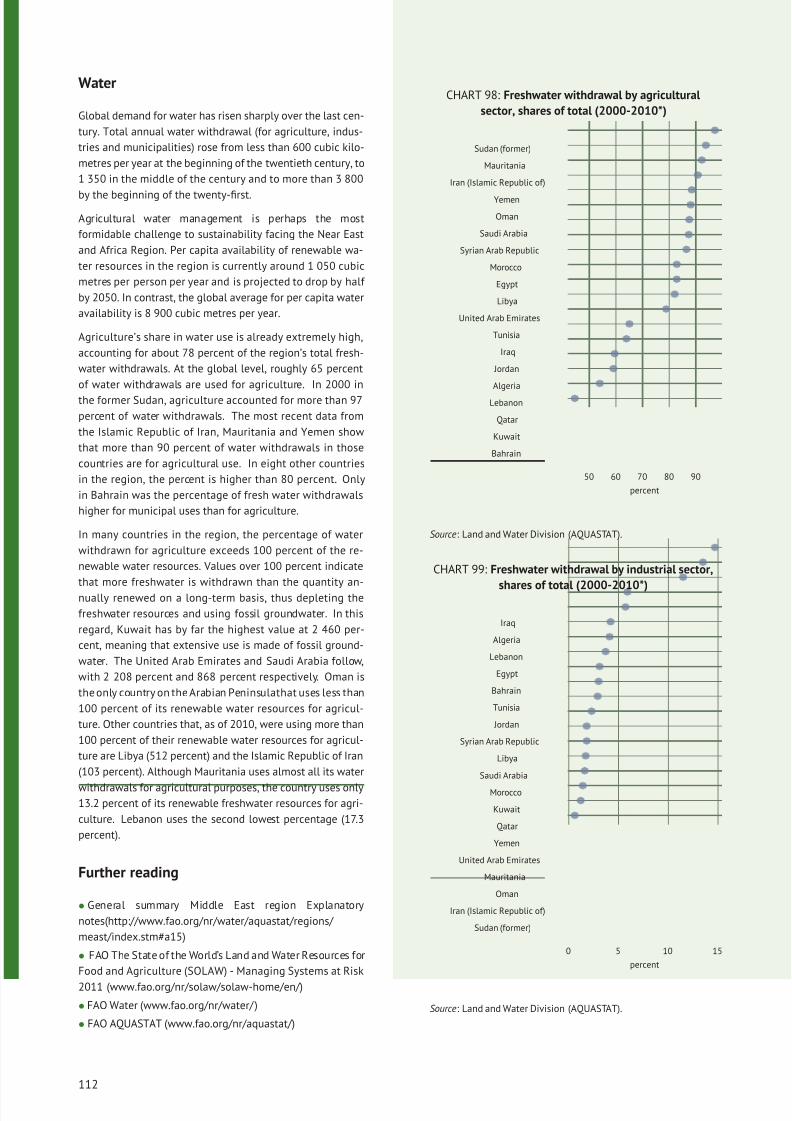
8/12/2019 FAO Statistical Yearbook 2014 Near East and North Africa Food and Agriculture
http://slidepdf.com/reader/full/fao-statistical-yearbook-2014-near-east-and-north-africa-food-and-agriculture 128/174
Water
Global demand for water has risen sharply over the last cen-
tury. Total annual water withdrawal (for agriculture, indus-
tries and municipalities) rose from less than 600 cubic kilo-
metres per year at the beginning of the twentieth century, to
1 350 in the middle of the century and to more than 3 800
by the beginning of the twenty-first.
Agricultural water management is perhaps the most
formidable challenge to sustainability facing the Near East
and Africa Region. Per capita availability of renewable wa-
ter resources in the region is currently around 1 050 cubic
metres per person per year and is projected to drop by half
by 2050. In contrast, the global average for per capita water
availability is 8 900 cubic metres per year.
Agriculture’s share in water use is already extremely high,
accounting for about 78 percent of the region’s total fresh-
water withdrawals. At the global level, roughly 65 percent
of water withdrawals are used for agriculture. In 2000 in
the former Sudan, agriculture accounted for more than 97
percent of water withdrawals. The most recent data from
the Islamic Republic of Iran, Mauritania and Yemen show
that more than 90 percent of water withdrawals in those
countries are for agricultural use. In eight other countries
in the region, the percent is higher than 80 percent. Only
in Bahrain was the percentage of fresh water withdrawals
higher for municipal uses than for agriculture.
In many countries in the region, the percentage of water
withdrawn for agriculture exceeds 100 percent of the re-
newable water resources. Values over 100 percent indicate
that more freshwater is withdrawn than the quantity an-
nually renewed on a long-term basis, thus depleting the
freshwater resources and using fossil groundwater. In this
regard, Kuwait has by far the highest value at 2 460 per-
cent, meaning that extensive use is made of fossil ground-
water. The United Arab Emirates and Saudi Arabia follow,
with 2 208 percent and 868 percent respectively. Oman is
the only country on the Arabian Peninsulathat uses less than
100 percent of its renewable water resources for agricul-
ture. Other countries that, as of 2010, were using more than
100 percent of their renewable water resources for agricul-
ture are Libya (512 percent) and the Islamic Republic of Iran
(103 percent). Although Mauritania uses almost all its water
withdrawals for agricultural purposes, the country uses only13.2 percent of its renewable freshwater resources for agri-
culture. Lebanon uses the second lowest percentage (17.3
percent).
Further reading
• General summary Middle East region Explanatory
notes(http://www.fao.org/nr/water/aquastat/regions/
meast/index.stm#a15)
• FAO The State of the World’s Land and Water Resources for
Food and Agriculture (SOLAW) - Managing Systems at Risk
2011 (www.fao.org/nr/solaw/solaw-home/en/)
• FAO Water (www.fao.org/nr/water/ )
• FAO AQUASTAT (www.fao.org/nr/aquastat/)
CHART 98: Freshwater withdrawal by agricultural
sector, shares of total (2000-2010*)
Bahrain
Kuwait
Qatar
Lebanon
Algeria
Jordan
Iraq
Tunisia
United Arab Emirates
Libya
Egypt
Morocco
Syrian Arab Republic
Saudi Arabia
Oman
Yemen
Iran (Islamic Republic of)
Mauritania
Sudan (former)
50 60 70 80 90
percent
Source: Land and Water Division (AQUASTAT).
CHART 99: Freshwater withdrawal by industrial sector,
shares of total (2000-2010*)
Sudan (former)
Iran (Islamic Republic of)
Oman
Mauritania
United Arab Emirates
Yemen
Qatar
Kuwait
Morocco
Saudi Arabia
Libya
Syrian Arab Republic
Jordan
Tunisia
Bahrain
Egypt
Lebanon
Algeria
Iraq
0 5 10 15
percent
Source: Land and Water Division (AQUASTAT).
112
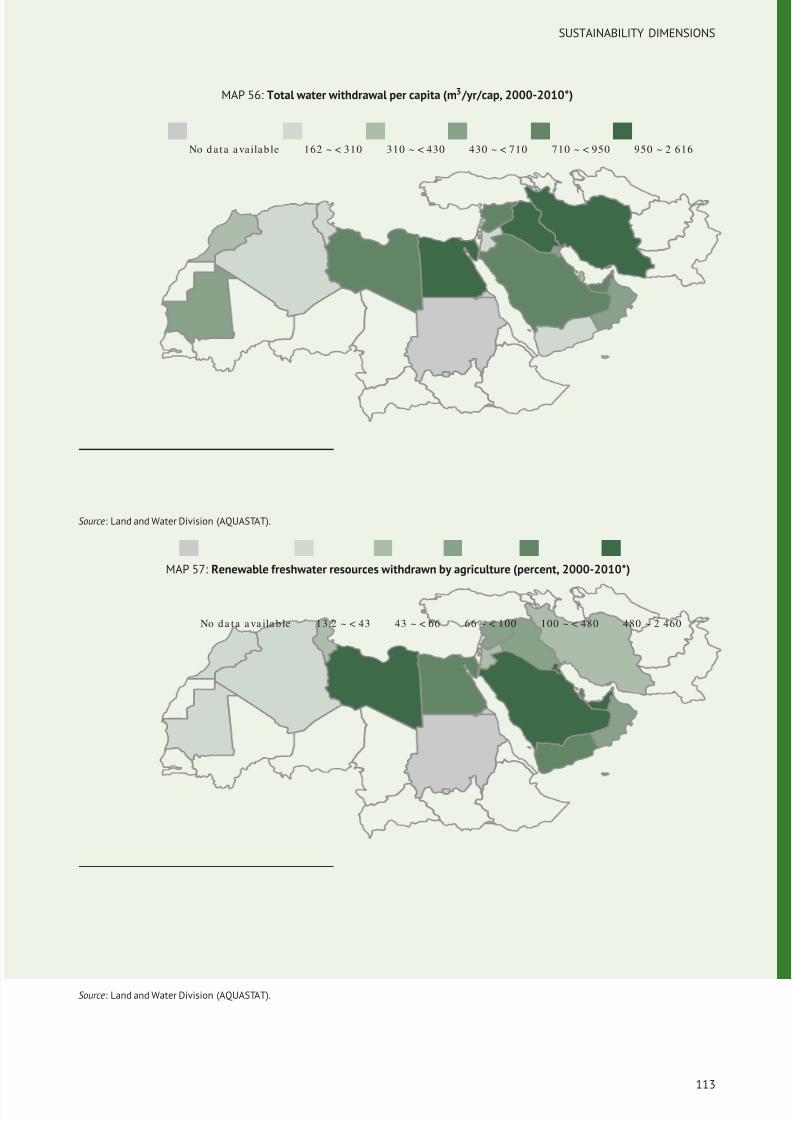
8/12/2019 FAO Statistical Yearbook 2014 Near East and North Africa Food and Agriculture
http://slidepdf.com/reader/full/fao-statistical-yearbook-2014-near-east-and-north-africa-food-and-agriculture 129/174
SUSTAINABILITY DIMENSIONS
MAP 56: Total water withdrawal per capita (m3 /yr/cap, 2000-2010*)
No d a ta a va ilab le 162 ~ < 310 310 ~ < 430 430 ~ < 710 710 ~ < 950 950 ~ 2 616
Source: Land and Water Division (AQUASTAT).
MAP 57: Renewable freshwater resources withdrawn by agriculture (percent, 2000-2010*)
No da ta a va ila b le 13.2 ~ < 43 43 ~ < 66 66 ~ < 100 100 ~ < 480 480 ~ 2 460
Source: Land and Water Division (AQUASTAT).
113
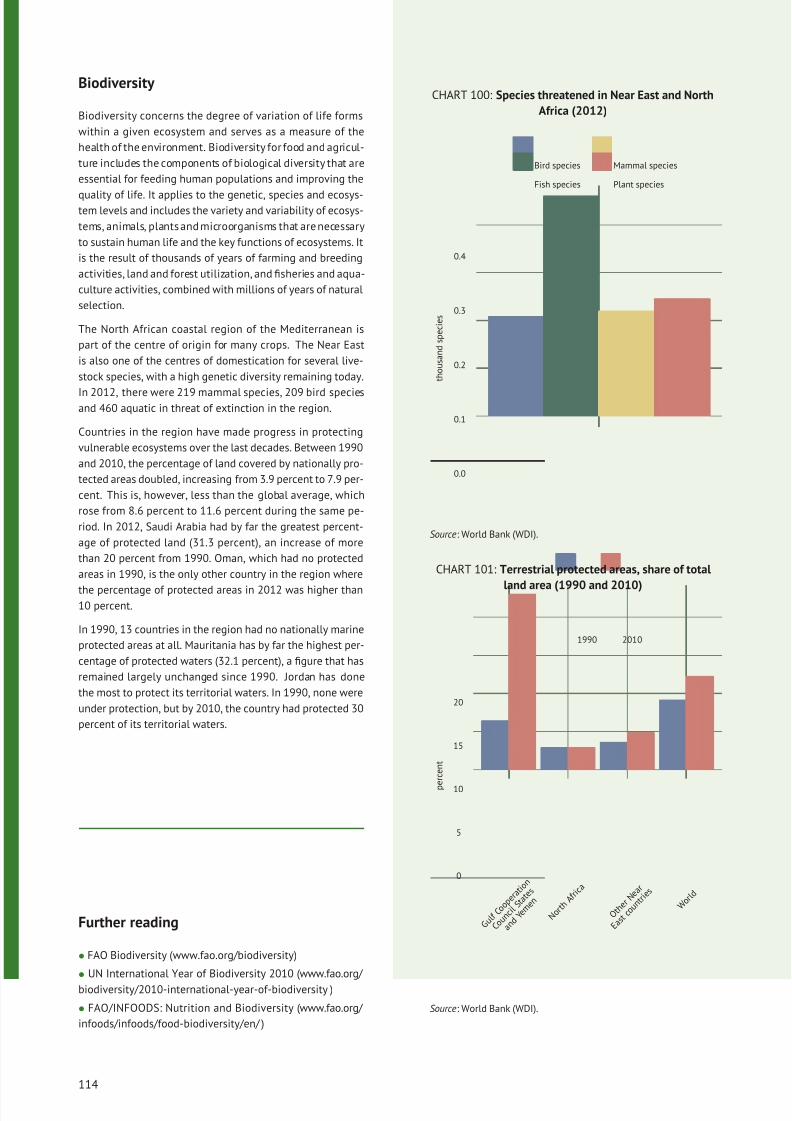
8/12/2019 FAO Statistical Yearbook 2014 Near East and North Africa Food and Agriculture
http://slidepdf.com/reader/full/fao-statistical-yearbook-2014-near-east-and-north-africa-food-and-agriculture 130/174
Biodiversity
Biodiversity concerns the degree of variation of life forms
within a given ecosystem and serves as a measure of the
health of the environment. Biodiversity for food and agricul-
ture includes the components of biological diversity that are
essential for feeding human populations and improving the
quality of life. It applies to the genetic, species and ecosys-tem levels and includes the variety and variability of ecosys-
tems, animals, plants and microorganisms that are necessary
to sustain human life and the key functions of ecosystems. It
is the result of thousands of years of farming and breeding
activities, land and forest utilization, and fisheries and aqua-
culture activities, combined with millions of years of natural
selection.
The North African coastal region of the Mediterranean is
part of the centre of origin for many crops. The Near East
is also one of the centres of domestication for several live-
stock species, with a high genetic diversity remaining today.
In 2012, there were 219 mammal species, 209 bird speciesand 460 aquatic in threat of extinction in the region.
Countries in the region have made progress in protecting
vulnerable ecosystems over the last decades. Between 1990
and 2010, the percentage of land covered by nationally pro-
tected areas doubled, increasing from 3.9 percent to 7.9 per-
cent. This is, however, less than the global average, which
rose from 8.6 percent to 11.6 percent during the same pe-
riod. In 2012, Saudi Arabia had by far the greatest percent-
age of protected land (31.3 percent), an increase of more
than 20 percent from 1990. Oman, which had no protected
areas in 1990, is the only other country in the region where
the percentage of protected areas in 2012 was higher than10 percent.
In 1990, 13 countries in the region had no nationally marine
protected areas at all. Mauritania has by far the highest per-
centage of protected waters (32.1 percent), a figure that has
remained largely unchanged since 1990. Jordan has done
the most to protect its territorial waters. In 1990, none were
under protection, but by 2010, the country had protected 30
percent of its territorial waters.
Further reading
• FAO Biodiversity (www.fao.org/biodiversity)
• UN International Year of Biodiversity 2010 (www.fao.org/
biodiversity/2010-international-year-of-biodiversity )
• FAO/INFOODS: Nutrition and Biodiversity (www.fao.org/
infoods/infoods/food-biodiversity/en/ )
CHART 100: Species threatened in Near East and North
Africa (2012)
0.0
0.1
0.2
0.3
0.4
t h o u s a n d s p e c i e s
Bird species
Fish species
Mammal species
Plant species
Source: World Bank (WDI).
CHART 101: Terrestrial protected areas, share of total
land area (1990 and 2010)
0
5
10
15
20
G u l f
C o o p
e r a t
i o n
C o u n
c i l S t a t
e s
a n d
Y e m e
n
N o r t h
A f r i c
a
O t h e
r N e a
r
E a s t
c o u n
t r i e s
W o r l d
p e r c e n t
1990 2010
Source: World Bank (WDI).
114
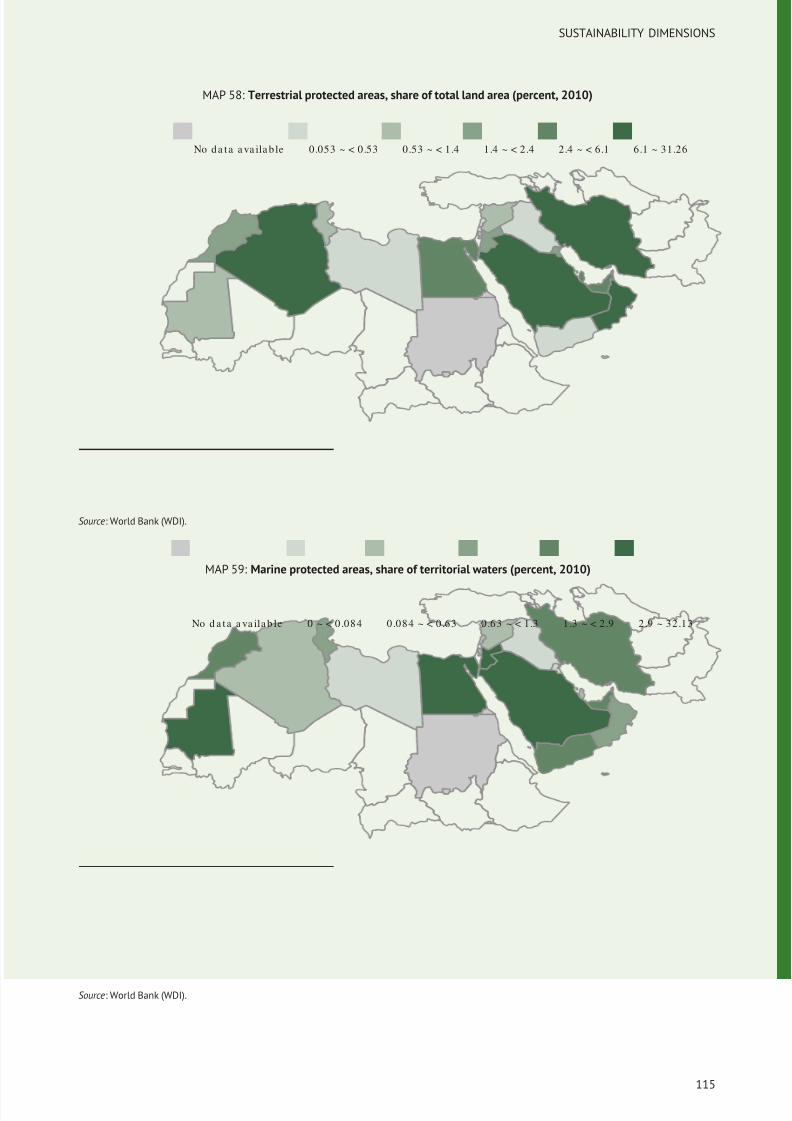
8/12/2019 FAO Statistical Yearbook 2014 Near East and North Africa Food and Agriculture
http://slidepdf.com/reader/full/fao-statistical-yearbook-2014-near-east-and-north-africa-food-and-agriculture 131/174
SUSTAINABILITY DIMENSIONS
MAP 58: Terrestrial protected areas, share of total land area (percent, 2010)
No da ta a va ila b le 0.053 ~ < 0.53 0.53 ~ < 1.4 1.4 ~ < 2.4 2.4 ~ < 6.1 6.1 ~ 31.26
Source: World Bank (WDI).
MAP 59: Marine protected areas, share of territorial waters (percent, 2010)
No d a ta a va ila b le 0 ~ < 0.084 0.084 ~ < 0.63 0.63 ~ < 1.3 1.3 ~ < 2.9 2.9 ~ 32.13
Source: World Bank (WDI).
115
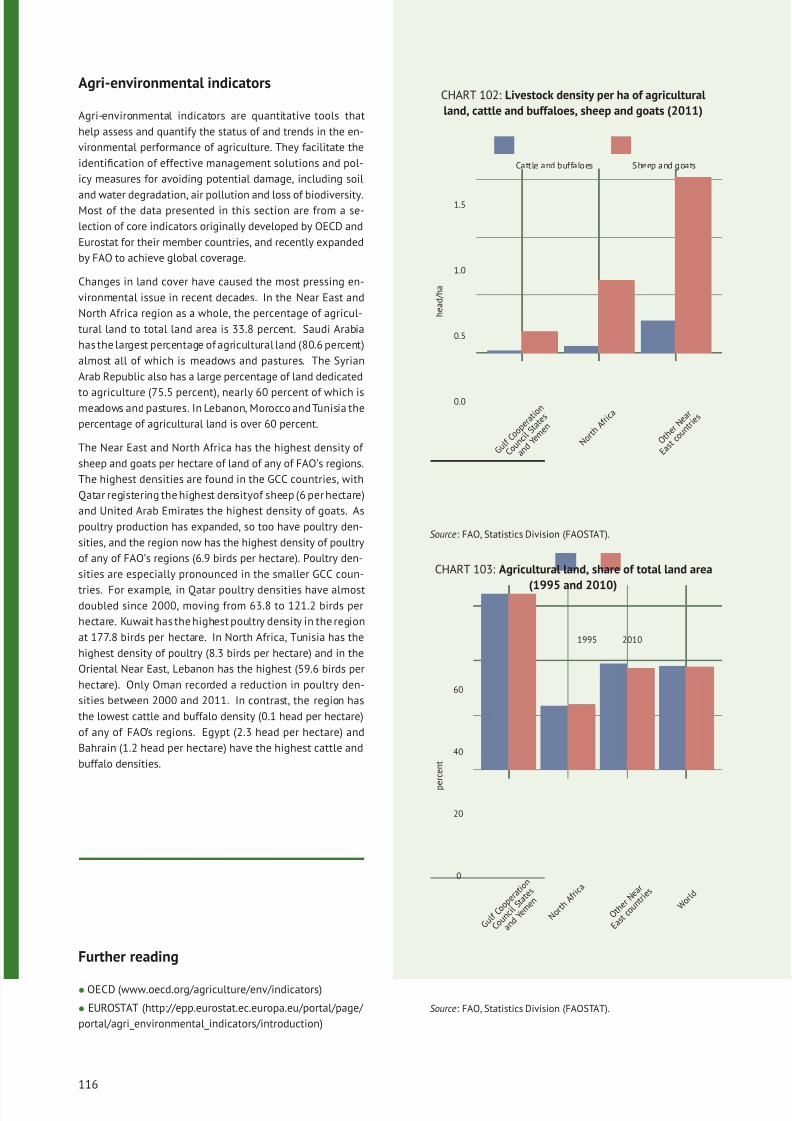
8/12/2019 FAO Statistical Yearbook 2014 Near East and North Africa Food and Agriculture
http://slidepdf.com/reader/full/fao-statistical-yearbook-2014-near-east-and-north-africa-food-and-agriculture 132/174
Agri-environmental indicators
Agri-environmental indicators are quantitative tools that
help assess and quantify the status of and trends in the en-
vironmental performance of agriculture. They facilitate the
identification of effective management solutions and pol-
icy measures for avoiding potential damage, including soil
and water degradation, air pollution and loss of biodiversity.Most of the data presented in this section are from a se-
lection of core indicators originally developed by OECD and
Eurostat for their member countries, and recently expanded
by FAO to achieve global coverage.
Changes in land cover have caused the most pressing en-
vironmental issue in recent decades. In the Near East and
North Africa region as a whole, the percentage of agricul-
tural land to total land area is 33.8 percent. Saudi Arabia
has the largest percentage of agricultural land (80.6 percent)
almost all of which is meadows and pastures. The Syrian
Arab Republic also has a large percentage of land dedicated
to agriculture (75.5 percent), nearly 60 percent of which ismeadows and pastures. In Lebanon, Morocco and Tunisia the
percentage of agricultural land is over 60 percent.
The Near East and North Africa has the highest density of
sheep and goats per hectare of land of any of FAO’s regions.
The highest densities are found in the GCC countries, with
Qatar registering the highest densityof sheep (6 per hectare)
and United Arab Emirates the highest density of goats. As
poultry production has expanded, so too have poultry den-
sities, and the region now has the highest density of poultry
of any of FAO’s regions (6.9 birds per hectare). Poultry den-
sities are especially pronounced in the smaller GCC coun-
tries. For example, in Qatar poultry densities have almostdoubled since 2000, moving from 63.8 to 121.2 birds per
hectare. Kuwait has the highest poultry density in the region
at 177.8 birds per hectare. In North Africa, Tunisia has the
highest density of poultry (8.3 birds per hectare) and in the
Oriental Near East, Lebanon has the highest (59.6 birds per
hectare). Only Oman recorded a reduction in poultry den-
sities between 2000 and 2011. In contrast, the region has
the lowest cattle and buffalo density (0.1 head per hectare)
of any of FAO’s regions. Egypt (2.3 head per hectare) and
Bahrain (1.2 head per hectare) have the highest cattle and
buffalo densities.
Further reading
• OECD (www.oecd.org/agriculture/env/indicators)
• EUROSTAT (http://epp.eurostat.ec.europa.eu/portal/page/
portal/agri_environmental_indicators/introduction)
CHART 102: Livestock density per ha of agricultural
land, cattle and buffaloes, sheep and goats (2011)
0.0
0.5
1.0
1.5
G u l f
C o o p
e r a t
i o n
C o u n
c i l S t a t
e s
a n d
Y e m
e n
N o r t h
A f r i c
a
O t h e
r N e a
r
E a s t
c o u n
t r i e s
h e a d / h a
Cattle and buffaloes Sheep and goats
Source: FAO, Statistics Division (FAOSTAT).
CHART 103: Agricultural land, share of total land area
(1995 and 2010)
0
20
40
60
G u l f
C o o p
e r a t
i o n
C o u n
c i l S t a t
e s
a n d
Y e m e
n
N o r t h
A f r i c
a
O t h e
r N e a
r
E a s t
c o u n
t r i e s
W o r l d
p e r c e n t
1995 2010
Source: FAO, Statistics Division (FAOSTAT).
116
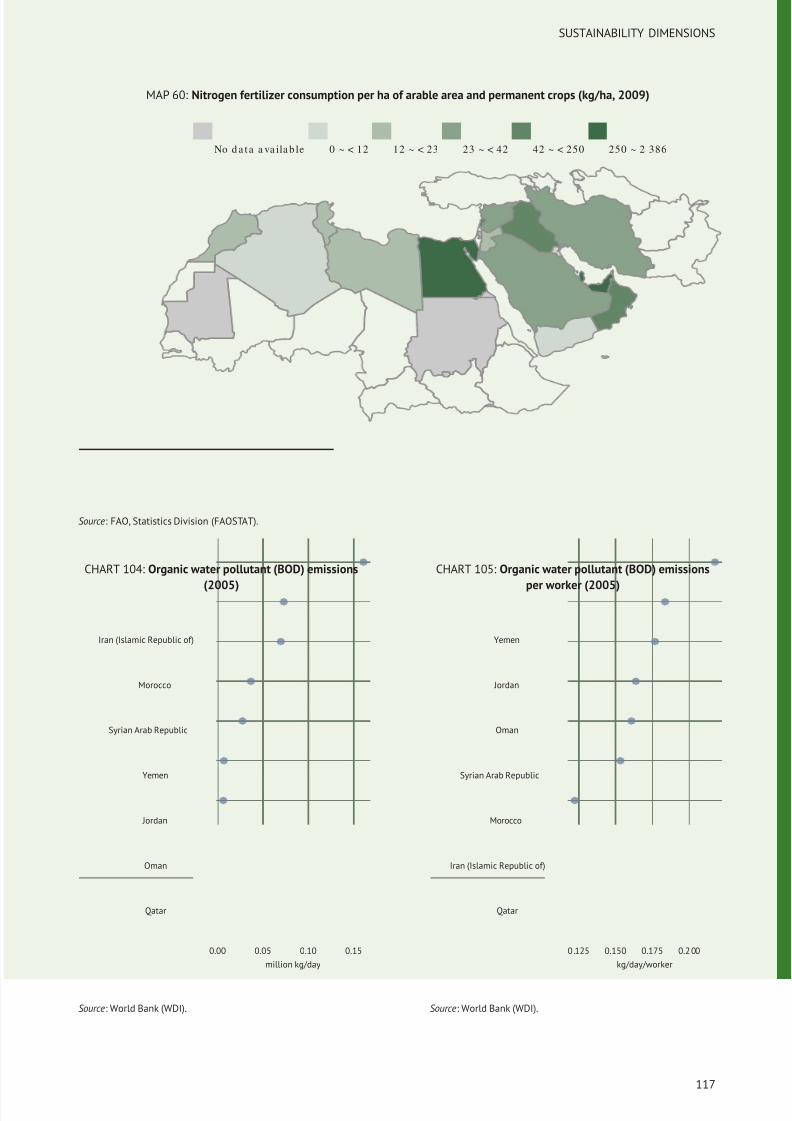
8/12/2019 FAO Statistical Yearbook 2014 Near East and North Africa Food and Agriculture
http://slidepdf.com/reader/full/fao-statistical-yearbook-2014-near-east-and-north-africa-food-and-agriculture 133/174
SUSTAINABILITY DIMENSIONS
MAP 60: Nitrogen fertilizer consumption per ha of arable area and permanent crops (kg/ha, 2009)
No d a ta a va ila b le 0 ~ < 12 12 ~ < 23 23 ~ < 42 42 ~ < 250 250 ~ 2 386
Source: FAO, Statistics Division (FAOSTAT).
CHART 104: Organic water pollutant (BOD) emissions
(2005)
Qatar
Oman
Jordan
Yemen
Syrian Arab Republic
Morocco
Iran (Islamic Republic of)
0.00 0.05 0.10 0.15
million kg/day
Source: World Bank (WDI).
CHART 105: Organic water pollutant (BOD) emissions
per worker (2005)
Qatar
Iran (Islamic Republic of)
Morocco
Syrian Arab Republic
Oman
Jordan
Yemen
0 .125 0.150 0.175 0.2 00
kg/day/worker
Source: World Bank (WDI).
117
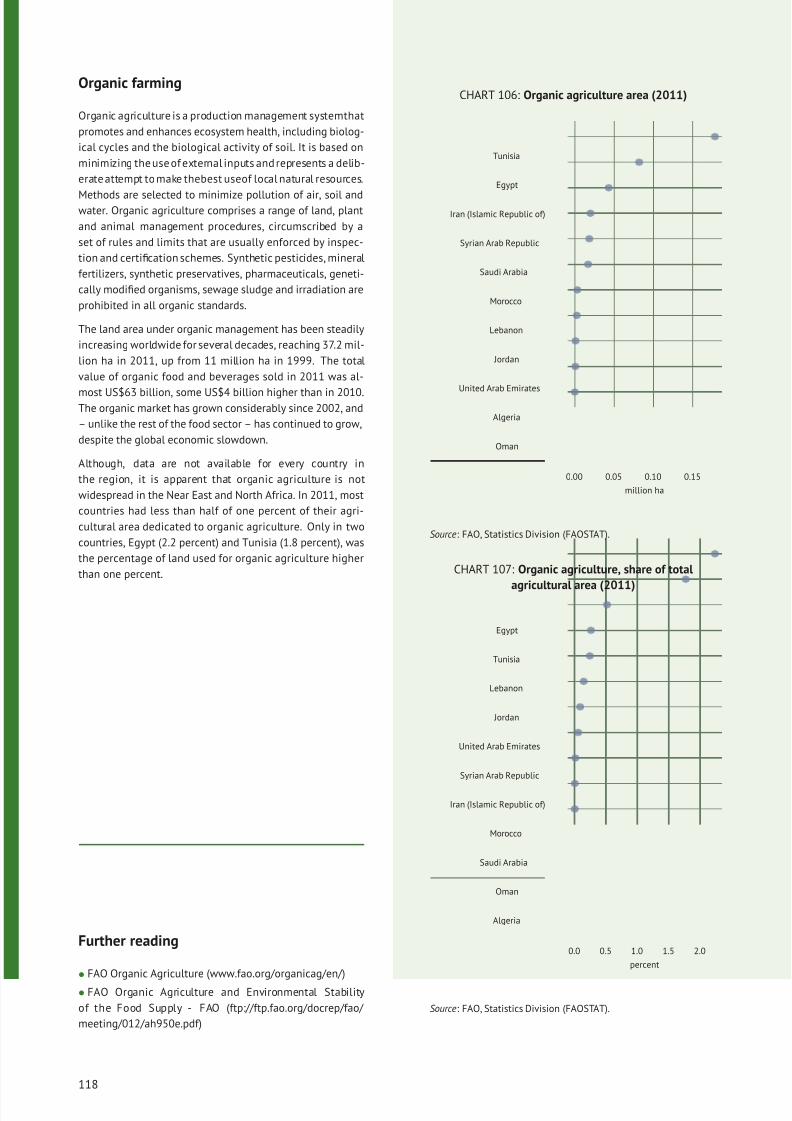
8/12/2019 FAO Statistical Yearbook 2014 Near East and North Africa Food and Agriculture
http://slidepdf.com/reader/full/fao-statistical-yearbook-2014-near-east-and-north-africa-food-and-agriculture 134/174
Organic farming
Organic agriculture is a production management systemthat
promotes and enhances ecosystem health, including biolog-
ical cycles and the biological activity of soil. It is based on
minimizing the use of external inputs and represents a delib-
erate attempt to make thebest useof local natural resources.
Methods are selected to minimize pollution of air, soil andwater. Organic agriculture comprises a range of land, plant
and animal management procedures, circumscribed by a
set of rules and limits that are usually enforced by inspec-
tion and certification schemes. Synthetic pesticides, mineral
fertilizers, synthetic preservatives, pharmaceuticals, geneti-
cally modified organisms, sewage sludge and irradiation are
prohibited in all organic standards.
The land area under organic management has been steadily
increasing worldwide for several decades, reaching 37.2 mil-
lion ha in 2011, up from 11 million ha in 1999. The total
value of organic food and beverages sold in 2011 was al-
most US$63 billion, some US$4 billion higher than in 2010.The organic market has grown considerably since 2002, and
– unlike the rest of the food sector – has continued to grow,
despite the global economic slowdown.
Although, data are not available for every country in
the region, it is apparent that organic agriculture is not
widespread in the Near East and North Africa. In 2011, most
countries had less than half of one percent of their agri-
cultural area dedicated to organic agriculture. Only in two
countries, Egypt (2.2 percent) and Tunisia (1.8 percent), was
the percentage of land used for organic agriculture higher
than one percent.
Further reading
• FAO Organic Agriculture (www.fao.org/organicag/en/)
• FAO Organic Agriculture and Environmental Stability
of the Food Supply - FAO (ftp://ftp.fao.org/docrep/fao/
meeting/012/ah950e.pdf)
CHART 106: Organic agriculture area (2011)
Oman
Algeria
United Arab Emirates
Jordan
Lebanon
Morocco
Saudi Arabia
Syrian Arab Republic
Iran (Islamic Republic of)
Egypt
Tunisia
0.00 0.05 0.10 0.15
million ha
Source: FAO, Statistics Division (FAOSTAT).
CHART 107: Organic agriculture, share of total
agricultural area (2011)
Algeria
Oman
Saudi Arabia
Morocco
Iran (Islamic Republic of)
Syrian Arab Republic
United Arab Emirates
Jordan
Lebanon
Tunisia
Egypt
0.0 0.5 1.0 1.5 2.0
percent
Source: FAO, Statistics Division (FAOSTAT).
118
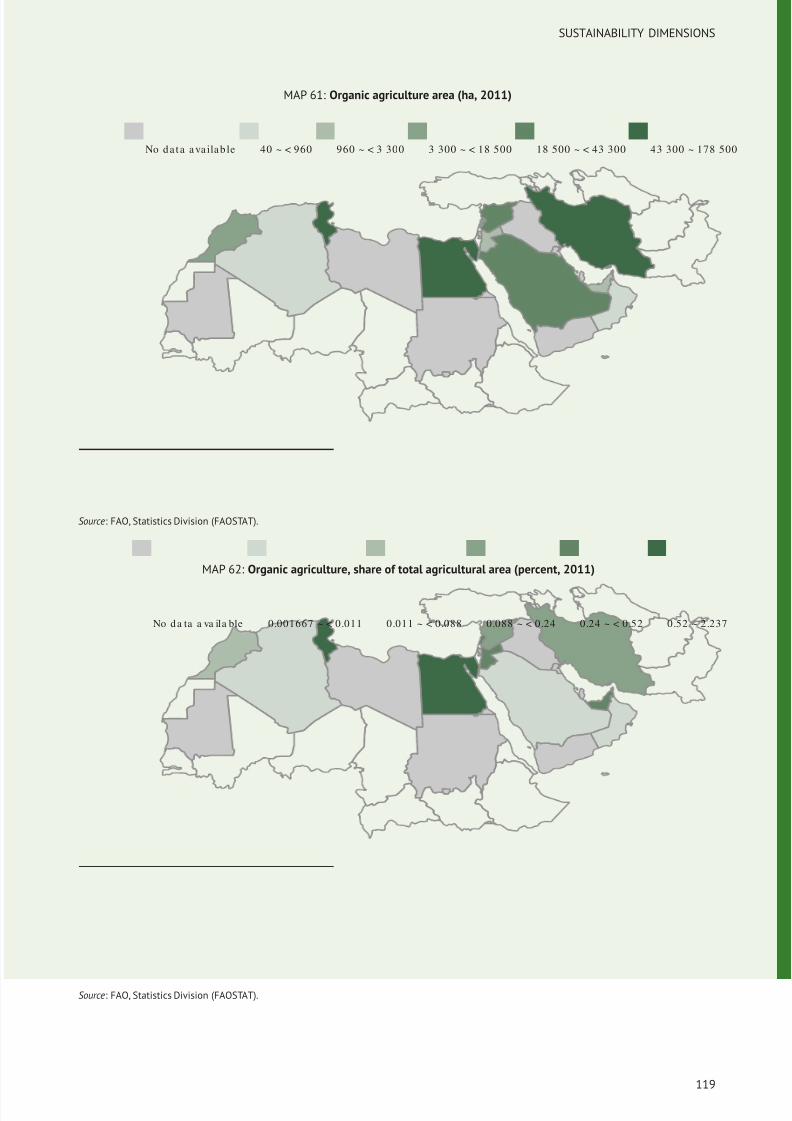
8/12/2019 FAO Statistical Yearbook 2014 Near East and North Africa Food and Agriculture
http://slidepdf.com/reader/full/fao-statistical-yearbook-2014-near-east-and-north-africa-food-and-agriculture 135/174
SUSTAINABILITY DIMENSIONS
MAP 61: Organic agriculture area (ha, 2011)
No da ta a va ilab le 40 ~ < 960 960 ~ < 3 300 3 300 ~ < 18 500 18 500 ~ < 43 300 43 300 ~ 178 500
Source: FAO, Statistics Division (FAOSTAT).
MAP 62: Organic agriculture, share of total agricultural area (percent, 2011)
No da ta a va ila ble 0.001667 ~ < 0.011 0.011 ~ < 0.088 0.088 ~ < 0.24 0.24 ~ < 0.52 0.52 ~ 2.237
Source: FAO, Statistics Division (FAOSTAT).
119
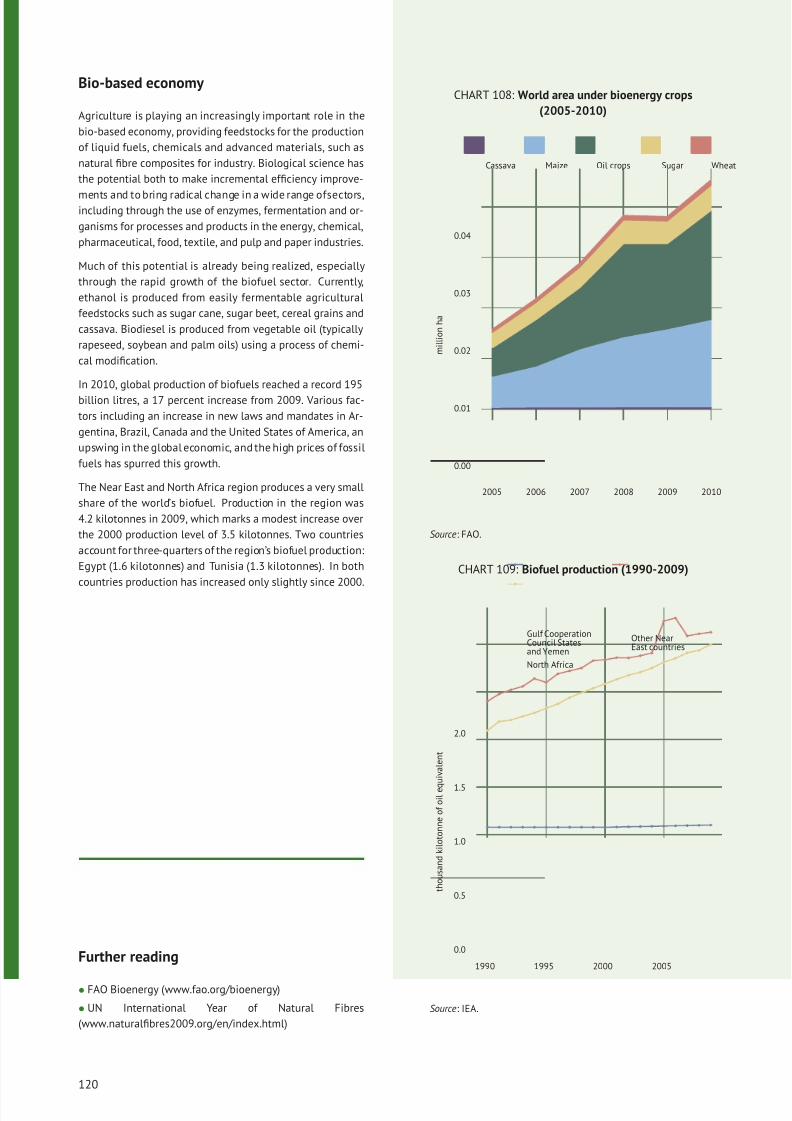
8/12/2019 FAO Statistical Yearbook 2014 Near East and North Africa Food and Agriculture
http://slidepdf.com/reader/full/fao-statistical-yearbook-2014-near-east-and-north-africa-food-and-agriculture 136/174
Bio-based economy
Agriculture is playing an increasingly important role in the
bio-based economy, providing feedstocks for the production
of liquid fuels, chemicals and advanced materials, such as
natural fibre composites for industry. Biological science has
the potential both to make incremental efficiency improve-
ments and to bring radical change in a wide range ofsectors,including through the use of enzymes, fermentation and or-
ganisms for processes and products in the energy, chemical,
pharmaceutical, food, textile, and pulp and paper industries.
Much of this potential is already being realized, especially
through the rapid growth of the biofuel sector. Currently,
ethanol is produced from easily fermentable agricultural
feedstocks such as sugar cane, sugar beet, cereal grains and
cassava. Biodiesel is produced from vegetable oil (typically
rapeseed, soybean and palm oils) using a process of chemi-
cal modification.
In 2010, global production of biofuels reached a record 195
billion litres, a 17 percent increase from 2009. Various fac-
tors including an increase in new laws and mandates in Ar-
gentina, Brazil, Canada and the United States of America, an
upswing in the global economic, and the high prices of fossil
fuels has spurred this growth.
The Near East and North Africa region produces a very small
share of the world’s biofuel. Production in the region was
4.2 kilotonnes in 2009, which marks a modest increase over
the 2000 production level of 3.5 kilotonnes. Two countries
account for three-quarters of the region’s biofuel production:
Egypt (1.6 kilotonnes) and Tunisia (1.3 kilotonnes). In both
countries production has increased only slightly since 2000.
Further reading
• FAO Bioenergy (www.fao.org/bioenergy)
• UN International Year of Natural Fibres
(www.naturalfibres2009.org/en/index.html)
CHART 108: World area under bioenergy crops
(2005-2010)
0.00
0.01
0.02
0.03
0.04
2005 2006 2007 2008 2009 2010
m i l l i o n h a
Cassava Maize Oil crops Sugar Wheat
Source: FAO.
CHART 109: Biofuel production (1990-2009)
0.0
0.5
1.0
1.5
2.0
1990 1995 2000 2005
t h o u s a n d k i l o t o n n e o f o i l e q
u i v a l e n t
Gulf CooperationCouncil Statesand Yemen
North Africa
Other NearEast countries
Source: IEA.
120
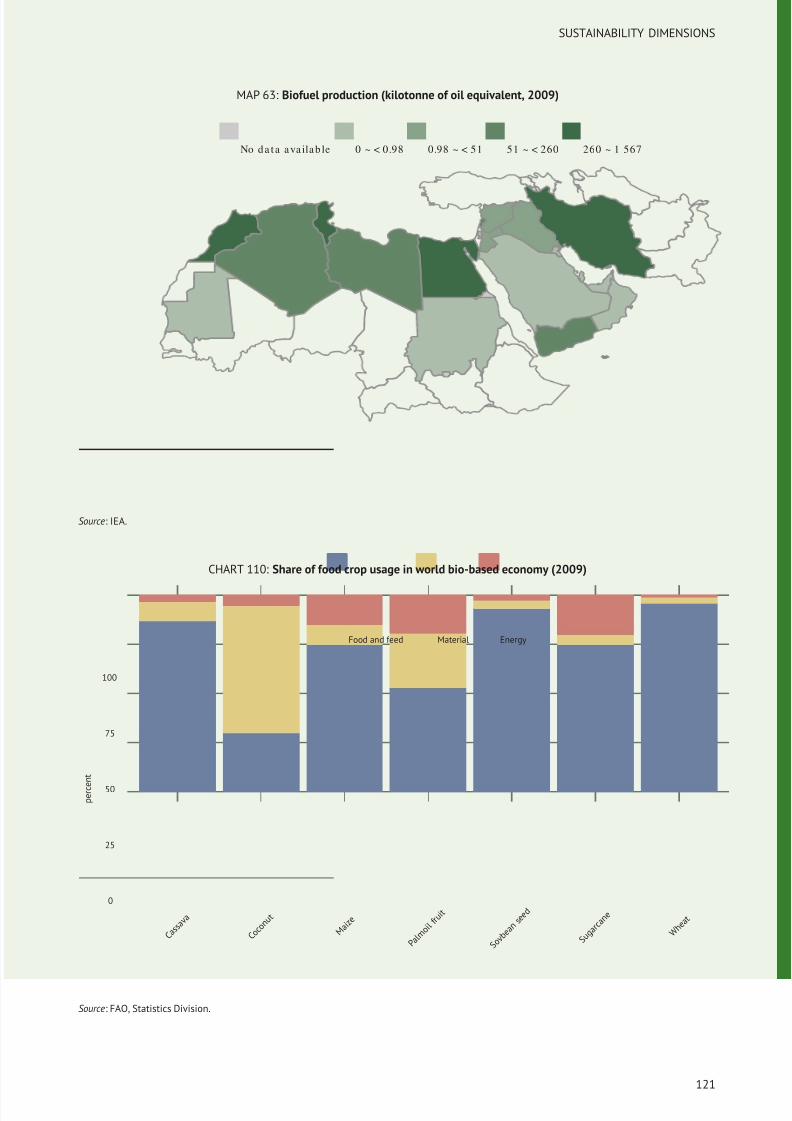
8/12/2019 FAO Statistical Yearbook 2014 Near East and North Africa Food and Agriculture
http://slidepdf.com/reader/full/fao-statistical-yearbook-2014-near-east-and-north-africa-food-and-agriculture 137/174
SUSTAINABILITY DIMENSIONS
MAP 63: Biofuel production (kilotonne of oil equivalent, 2009)
No da ta ava ilab le 0 ~ < 0.98 0.98 ~ < 51 51 ~ < 260 260 ~ 1 567
Source: IEA.
CHART 110: Share of food crop usage in world bio-based economy (2009)
0
25
50
75
100
C a s s
a v a
C o c o
n u t
M a i z e
P a l m
o i l f r u
i t
S o y b
e a n
s e e d
S u g a r
c a n e
W h e
a t
p e r c e
n t
Food and feed Material Energy
Source: FAO, Statistics Division.
121
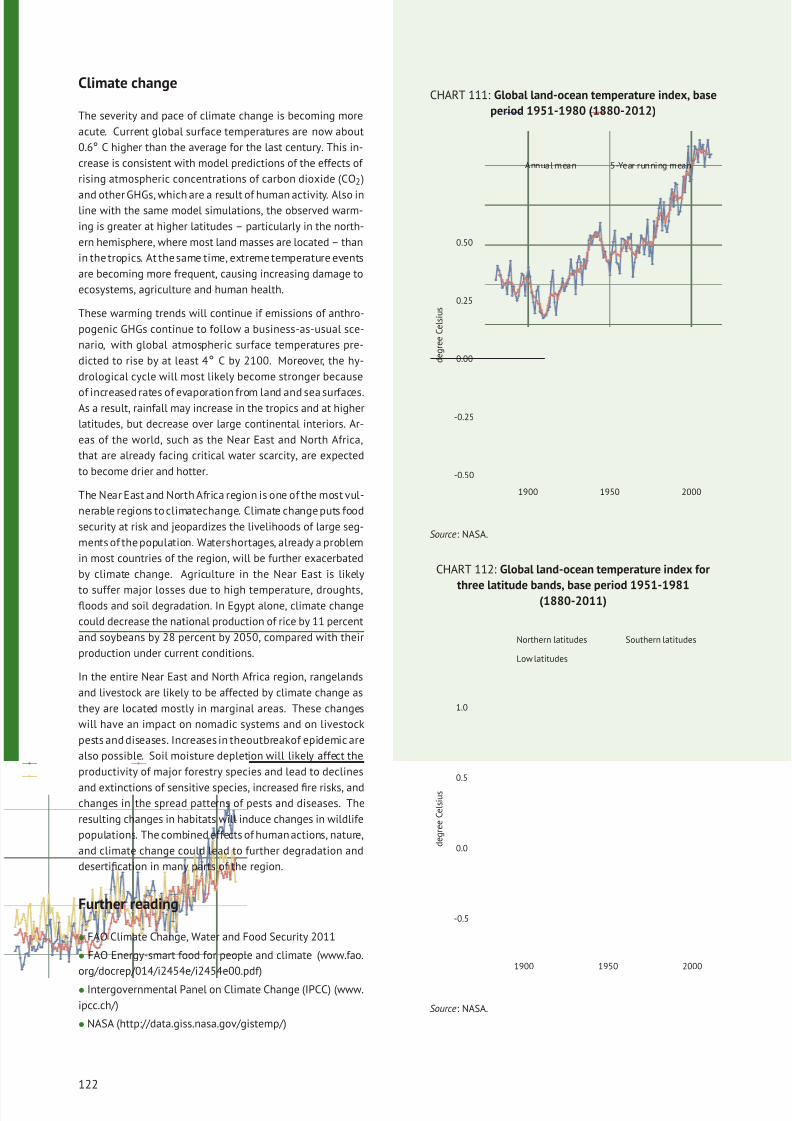
8/12/2019 FAO Statistical Yearbook 2014 Near East and North Africa Food and Agriculture
http://slidepdf.com/reader/full/fao-statistical-yearbook-2014-near-east-and-north-africa-food-and-agriculture 138/174
Climate change
The severity and pace of climate change is becoming more
acute. Current global surface temperatures are now about
0.6◦ C higher than the average for the last century. This in-
crease is consistent with model predictions of the effects of
rising atmospheric concentrations of carbon dioxide (CO2)
and other GHGs, which are a result of human activity. Also inline with the same model simulations, the observed warm-
ing is greater at higher latitudes – particularly in the north-
ern hemisphere, where most land masses are located – than
in the tropics. At the same time, extreme temperature events
are becoming more frequent, causing increasing damage to
ecosystems, agriculture and human health.
These warming trends will continue if emissions of anthro-
pogenic GHGs continue to follow a business-as-usual sce-
nario, with global atmospheric surface temperatures pre-
dicted to rise by at least 4◦ C by 2100. Moreover, the hy-
drological cycle will most likely become stronger because
of increased rates of evaporation from land and sea surfaces.As a result, rainfall may increase in the tropics and at higher
latitudes, but decrease over large continental interiors. Ar-
eas of the world, such as the Near East and North Africa,
that are already facing critical water scarcity, are expected
to become drier and hotter.
The Near East and North Africa region is one of the most vul-
nerable regions to climatechange. Climate change puts food
security at risk and jeopardizes the livelihoods of large seg-
ments of the population. Watershortages, already a problem
in most countries of the region, will be further exacerbated
by climate change. Agriculture in the Near East is likely
to suffer major losses due to high temperature, droughts,floods and soil degradation. In Egypt alone, climate change
could decrease the national production of rice by 11 percent
and soybeans by 28 percent by 2050, compared with their
production under current conditions.
In the entire Near East and North Africa region, rangelands
and livestock are likely to be affected by climate change as
they are located mostly in marginal areas. These changes
will have an impact on nomadic systems and on livestock
pests and diseases. Increases in theoutbreakof epidemic are
also possible. Soil moisture depletion will likely affect the
productivity of major forestry species and lead to declines
and extinctions of sensitive species, increased fire risks, andchanges in the spread patterns of pests and diseases. The
resulting changes in habitats will induce changes in wildlife
populations. The combined effects of human actions, nature,
and climate change could lead to further degradation and
desertification in many parts of the region.
Further reading
• FAO Climate Change, Water and Food Security 2011
• FAO Energy-smart food for people and climate (www.fao.
org/docrep/014/i2454e/i2454e00.pdf)
• Intergovernmental Panel on Climate Change (IPCC) (www.
ipcc.ch/)
• NASA (http://data.giss.nasa.gov/gistemp/)
CHART 111: Global land-ocean temperature index, base
period 1951-1980 (1880-2012)
-0.50
-0.25
0.00
0.25
0.50
1900 1950 2000
d e g r e e C e l s i u s
Annual mean 5-Year running mean
Source: NASA.
CHART 112: Global land-ocean temperature index for
three latitude bands, base period 1951-1981(1880-2011)
-0.5
0.0
0.5
1.0
1900 1950 2000
d e g r e e C e l s i u s
Northern latitudes
Low latitudes
Southern latitudes
Source: NASA.
122
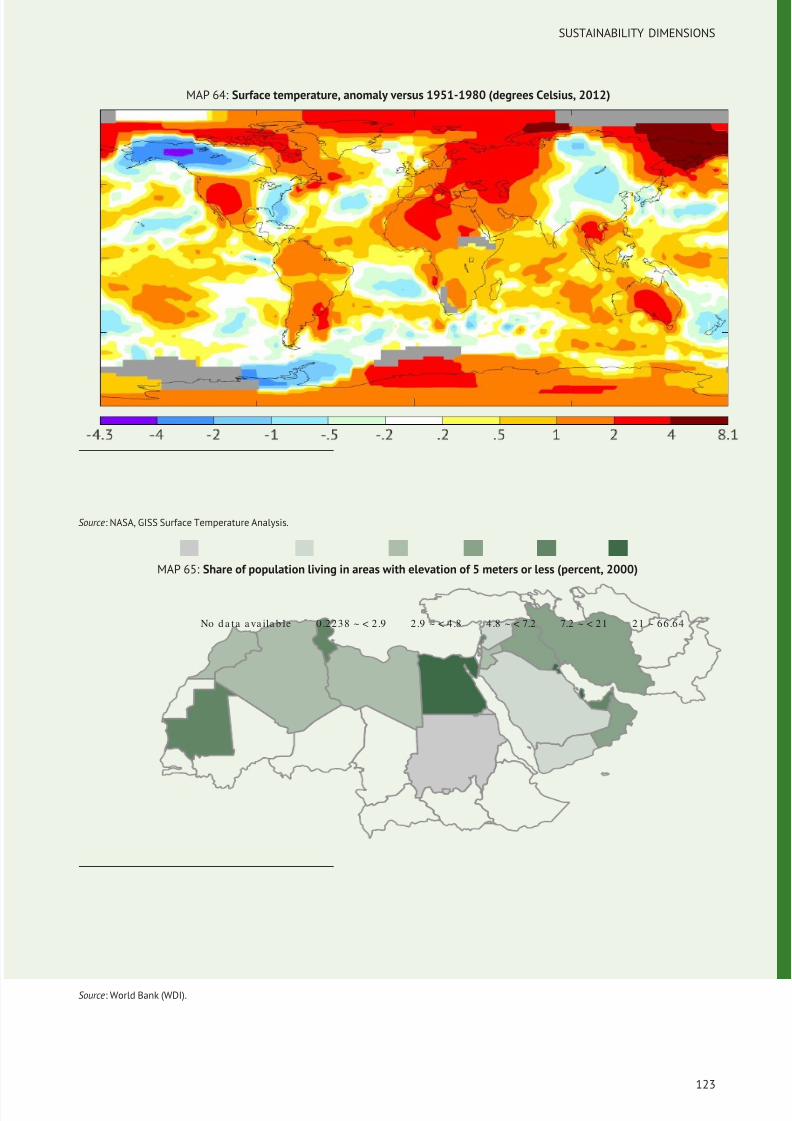
8/12/2019 FAO Statistical Yearbook 2014 Near East and North Africa Food and Agriculture
http://slidepdf.com/reader/full/fao-statistical-yearbook-2014-near-east-and-north-africa-food-and-agriculture 139/174
SUSTAINABILITY DIMENSIONS
MAP 64: Surface temperature, anomaly versus 1951-1980 (degrees Celsius, 2012)
Source: NASA, GISS Surface Temperature Analysis.
MAP 65: Share of population living in areas with elevation of 5 meters or less (percent, 2000)
No da ta a va ila b le 0.2238 ~ < 2.9 2.9 ~ < 4.8 4.8 ~ < 7.2 7.2 ~ < 21 21 ~ 66.64
Source: World Bank (WDI).
123
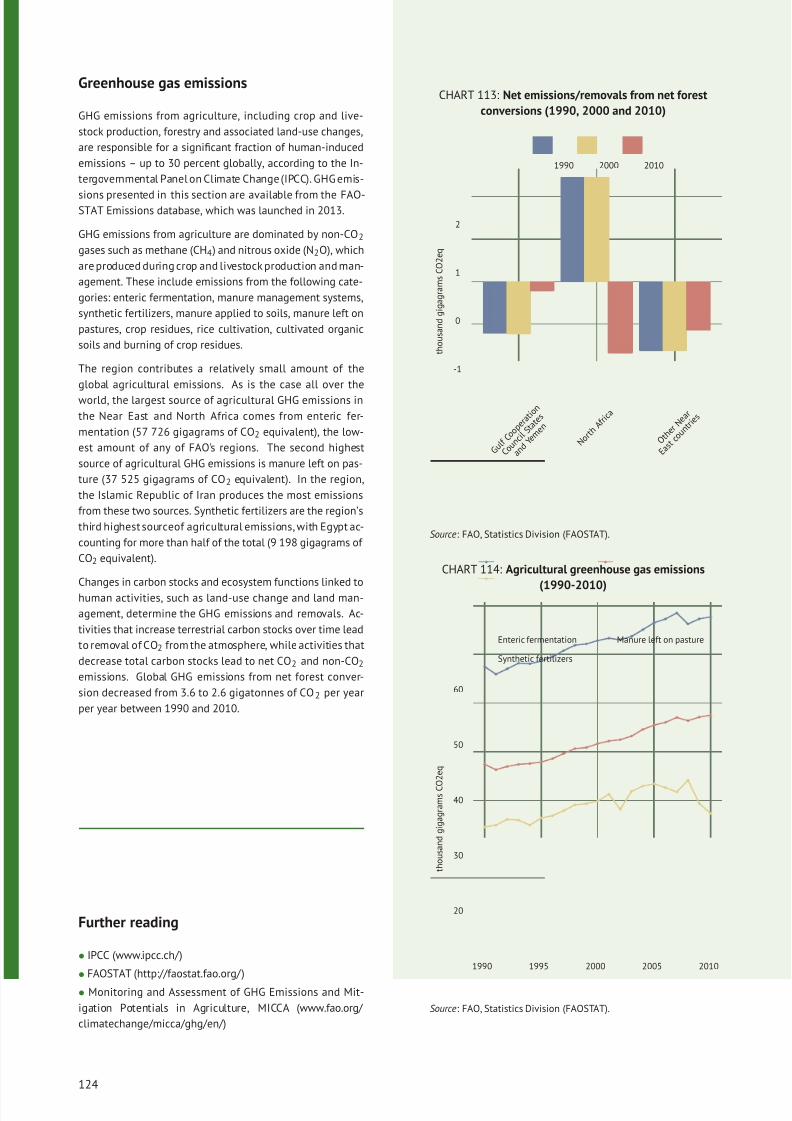
8/12/2019 FAO Statistical Yearbook 2014 Near East and North Africa Food and Agriculture
http://slidepdf.com/reader/full/fao-statistical-yearbook-2014-near-east-and-north-africa-food-and-agriculture 140/174
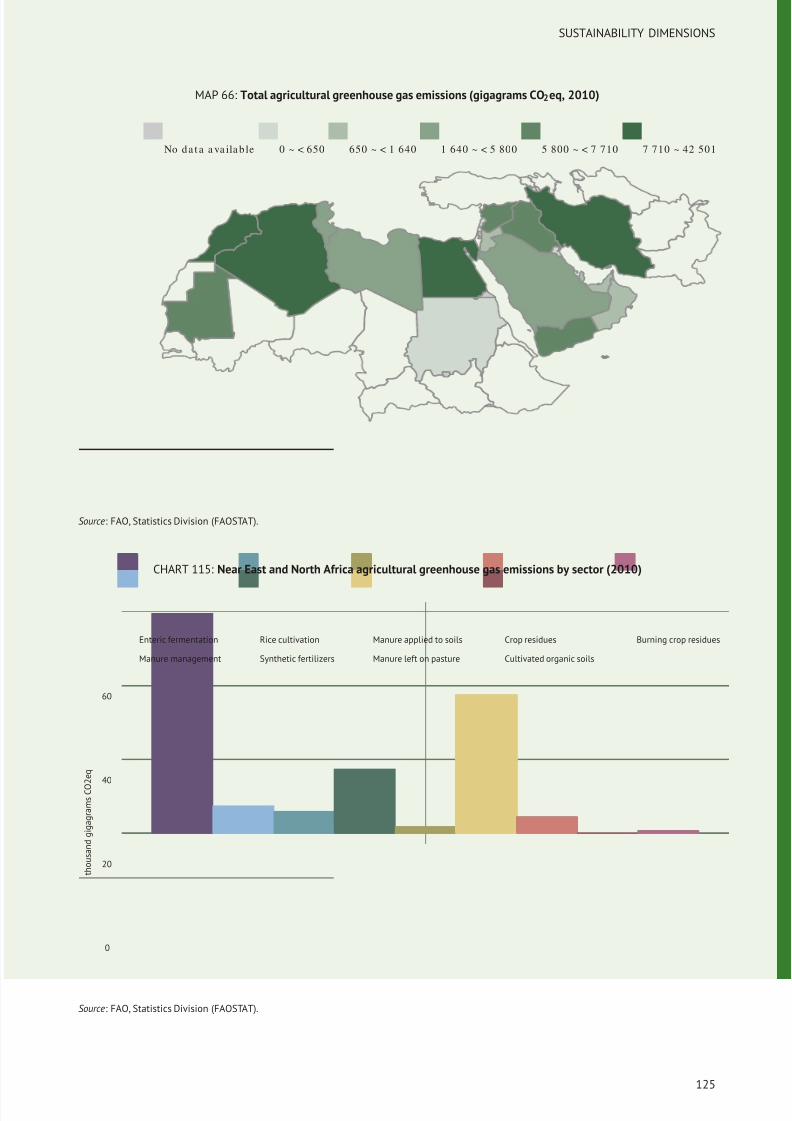
8/12/2019 FAO Statistical Yearbook 2014 Near East and North Africa Food and Agriculture
http://slidepdf.com/reader/full/fao-statistical-yearbook-2014-near-east-and-north-africa-food-and-agriculture 141/174
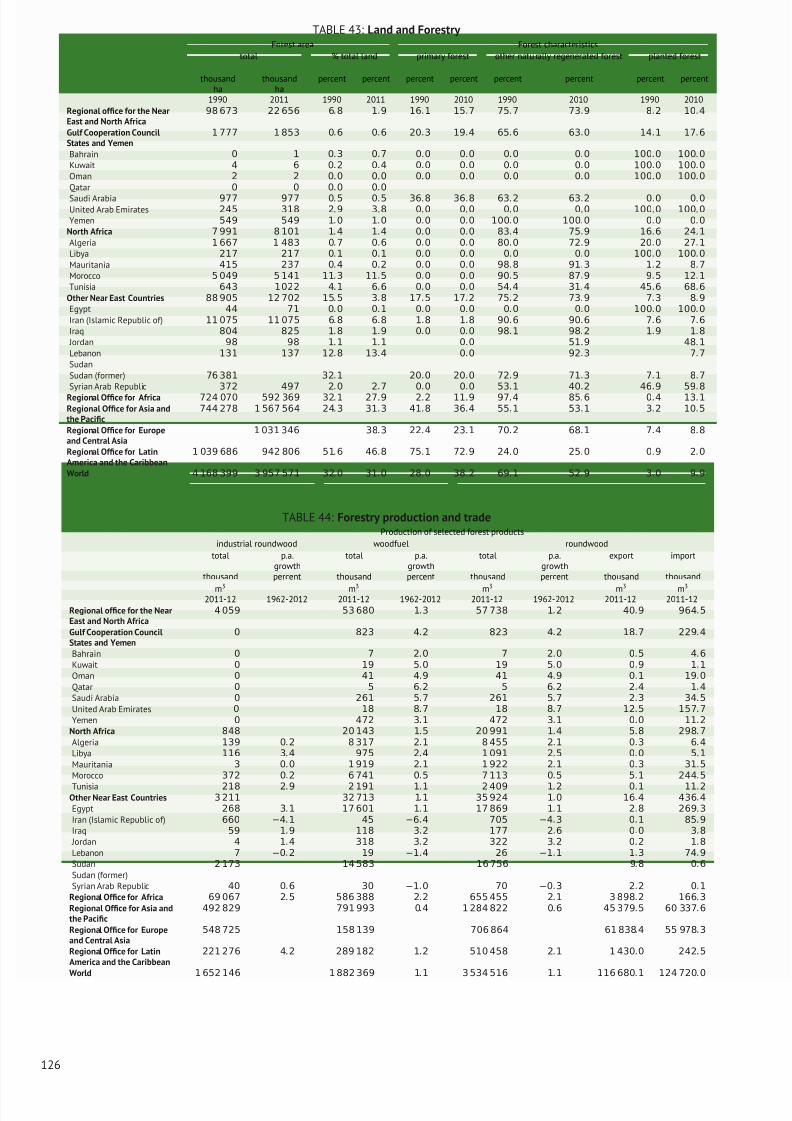
8/12/2019 FAO Statistical Yearbook 2014 Near East and North Africa Food and Agriculture
http://slidepdf.com/reader/full/fao-statistical-yearbook-2014-near-east-and-north-africa-food-and-agriculture 142/174
TABLE 43: Land and Forestry Forest area Forest characteristics
total % total land primary forest other natu rally regenerated forest planted forest
thousandha
thousandha
percent percent percent percent percent percent percent percent
1990 2011 1990 2011 1990 2010 1990 2010 1990 2010
Regional office for the NearEast and North Africa
98 673 22 656 6.8 1.9 16.1 15.7 75.7 73.9 8.2 10.4
Gulf Cooperation CouncilStates and Yemen
1 777 1 853 0.6 0.6 20.3 19.4 65.6 63.0 14.1 17.6
Bahrain 0 1 0.3 0.7 0.0 0.0 0.0 0.0 100.0 100.0
Kuwait 4 6 0.2 0.4 0.0 0.0 0.0 0.0 100.0 100.0
Oman 2 2 0.0 0.0 0.0 0.0 0.0 0.0 100.0 100.0
Qatar 0 0 0.0 0.0
Saudi Arabia 977 977 0.5 0.5 36.8 36.8 63.2 63.2 0.0 0.0
United Arab Emirates 245 318 2.9 3.8 0.0 0.0 0.0 0.0 100.0 100.0
Yemen 549 549 1.0 1.0 0.0 0.0 100.0 100.0 0.0 0.0
North Africa 7 991 8 101 1.4 1.4 0.0 0.0 83.4 75.9 16.6 24.1
Algeria 1 667 1 483 0.7 0.6 0.0 0.0 80.0 72.9 20.0 27.1
Libya 217 217 0.1 0.1 0.0 0.0 0.0 0.0 100.0 100.0
Mauritania 415 237 0.4 0.2 0.0 0.0 98.8 91.3 1.2 8.7
Morocco 5 049 5 141 11.3 11.5 0.0 0.0 90.5 87.9 9.5 12.1
Tunisia 643 1022 4.1 6.6 0.0 0.0 54.4 31.4 45.6 68.6
Other Near East Countries 88 905 12 702 15.5 3.8 17.5 17.2 75.2 73.9 7.3 8.9
Egypt 44 71 0.0 0.1 0.0 0.0 0.0 0.0 100.0 100.0
Iran (Islamic Republic of) 11 075 11 075 6.8 6.8 1.8 1.8 90.6 90.6 7.6 7.6
Iraq 804 825 1.8 1.9 0.0 0.0 98.1 98.2 1.9 1.8
Jordan 98 98 1.1 1.1 0.0 51.9 48.1
Lebanon 131 137 12.8 13.4 0.0 92.3 7.7
SudanSudan (former) 76 381 32.1 20.0 20.0 72.9 71.3 7.1 8.7
Syrian Arab Republic 372 497 2.0 2.7 0.0 0.0 53.1 40.2 46.9 59.8
Regional Office for Africa 724 070 592 369 32.1 27.9 2.2 11.9 97.4 85.6 0.4 13.1
Regional Office for Asia andthe Pacific
744 278 1 567 564 24.3 31.3 41.8 36.4 55.1 53.1 3.2 10.5
Regional Office for Europeand Central Asia
1 031 346 38.3 22.4 23.1 70.2 68.1 7.4 8.8
Regional Office for LatinAmerica and the Caribbean
1 039 686 942 806 51.6 46.8 75.1 72.9 24.0 25.0 0.9 2.0
World 4 168 399 3 957 571 32.0 31.0 28.0 38.2 69.1 52.9 3.0 9.9
TABLE 44: Forestry production and tradeProduction of selected forest products
industrial roundwood woodfuel roundwood
total p.a.growth
total p.a.growth
total p.a.growth
export import
thousand
m3
percent thousand
m3
percent thousand
m3
percent thousand
m3
thousand
m32011-12 1962-2012 2011-12 1962-2012 2011-12 1962-2012 2011-12 2011-12
Regional office for the NearEast and North Africa
4 059 53 680 1.3 57 738 1.2 40.9 964.5
Gulf Cooperation CouncilStates and Yemen
0 823 4.2 823 4.2 18.7 229.4
Bahrain 0 7 2.0 7 2.0 0.5 4.6
Kuwait 0 19 5.0 19 5.0 0.9 1.1
Oman 0 41 4.9 41 4.9 0.1 19.0
Qatar 0 5 6.2 5 6.2 2.4 1.4
Saudi Arabia 0 261 5.7 261 5.7 2.3 34.5
United Arab Emirates 0 18 8.7 18 8.7 12.5 157.7
Yemen 0 472 3.1 472 3.1 0.0 11.2
North Africa 848 20 143 1.5 20 991 1.4 5.8 298.7
Algeria 139 0.2 8 317 2.1 8 455 2.1 0.3 6.4
Libya 116 3.4 975 2.4 1 091 2.5 0.0 5.1
Mauritania 3 0.0 1 919 2.1 1 922 2.1 0.3 31.5
Morocco 372 0.2 6 741 0.5 7 113 0.5 5.1 244.5
Tunisia 218 2.9 2 191 1.1 2 409 1.2 0.1 11.2Other Near East Countries 3 211 32 713 1.1 35 924 1.0 16.4 436.4
Egypt 268 3.1 17 601 1.1 17 869 1.1 2.8 269.3
Iran (Islamic Republic of) 660 −4.1 45 −6.4 705 −4.3 0.1 85.9
Iraq 59 1.9 118 3.2 177 2.6 0.0 3.8
Jordan 4 1.4 318 3.2 322 3.2 0.2 1.8
Lebanon 7 −0.2 19 −1.4 26 −1.1 1.3 74.9
Sudan 2 173 14 583 16 756 9.8 0.6
Sudan (former)Syrian Arab Republic 40 0.6 30 −1.0 70 −0.3 2.2 0.1
Regional Office for Africa 69 067 2.5 586 388 2.2 655 455 2.1 3 898.2 166.3
Regional Office for Asia andthe Pacific
492 829 791 993 0.4 1 284 822 0.6 45 379.5 60 337.6
Regional Office for Europeand Central Asia
548 725 158 139 706 864 61 838.4 55 978.3
Regional Office for LatinAmerica and the Caribbean
221 276 4.2 289 182 1.2 510 458 2.1 1 430.0 242.5
World 1 652 146 1 882 369 1.1 3 534 516 1.1 116 680.1 124 720.0
126
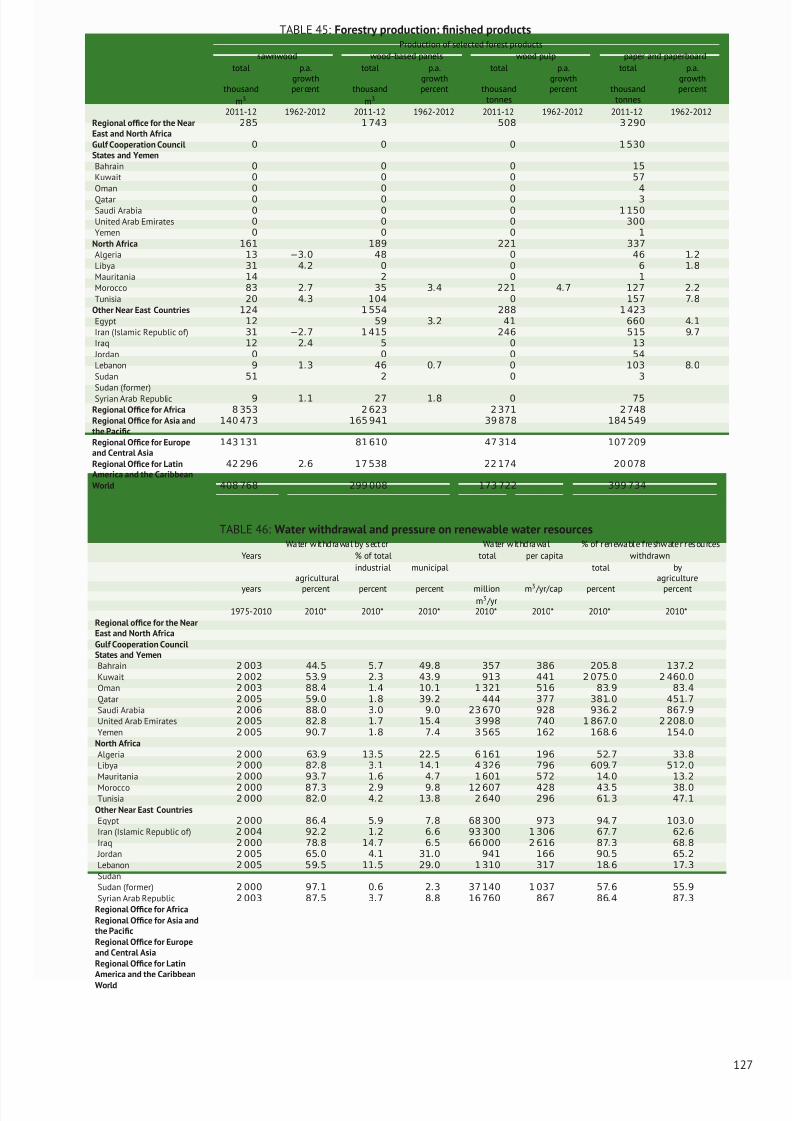
8/12/2019 FAO Statistical Yearbook 2014 Near East and North Africa Food and Agriculture
http://slidepdf.com/reader/full/fao-statistical-yearbook-2014-near-east-and-north-africa-food-and-agriculture 143/174
TABLE 45: Forestry production: finished productsProduction of selected forest products
sawnwood wood-based panels wood pulp paper and paperboard
total p.a.growth
total p.a.growth
total p.a.growth
total p.a.growth
thousand
m3
per cent thousand
m3
percent thousandtonnes
percent thousandtonnes
percent
2011-12 1962-2012 2011-12 1962-2012 2011-12 1962-2012 2011-12 1962-2012Regional office for the NearEast and North Africa
285 1 743 508 3 290
Gulf Cooperation CouncilStates and Yemen
0 0 0 1 530
Bahrain 0 0 0 15
Kuwait 0 0 0 57
Oman 0 0 0 4
Qatar 0 0 0 3
Saudi Arabia 0 0 0 1 150
United Arab Emirates 0 0 0 300
Yemen 0 0 0 1
North Africa 161 189 221 337
Algeria 13 −3.0 48 0 46 1.2
Libya 31 4.2 0 0 6 1.8
Mauritania 14 2 0 1
Morocco 83 2.7 35 3.4 221 4.7 127 2.2
Tunisia 20 4.3 104 0 157 7.8
Other Near East Countries 124 1 554 288 1 423
Egypt 12 59 3.2 41 660 4.1
Iran (Islamic Republic of) 31 −2.7 1 415 246 515 9.7
Iraq 12 2.4 5 0 13
Jordan 0 0 0 54
Lebanon 9 1.3 46 0.7 0 103 8.0
Sudan 51 2 0 3
Sudan (former)Syrian Arab Republic 9 1.1 27 1.8 0 75
Regional Office for Africa 8 353 2 623 2 371 2 748
Regional Office for Asia andthe Pacific
140 473 165 941 39 878 184 549
Regional Office for Europeand Central Asia
143 131 81 610 47 314 107 209
Regional Office for LatinAmerica and the Caribbean
42 296 2.6 17 538 22 174 20 078
World 408 768 299 008 173 722 399 734
TABLE 46: Water withdrawal and pressure on renewable water resourcesWater withdrawal by sector Water withdrawal % of renewable freshwater resources
Years % of total total per capita withdrawn
agriculturalindustrial municipal total by
agriculture
years percent percent percent millionm3 /yr
m3 /yr/cap percent percent
1975-2010 2010* 2010* 2010* 2010* 2010* 2010* 2010*
Regional office for the NearEast and North AfricaGulf Cooperation CouncilStates and YemenBahrain 2 003 44.5 5.7 49.8 357 386 205.8 137.2
Kuwait 2 002 53.9 2.3 43.9 913 441 2 075.0 2 460.0
Oman 2 003 88.4 1.4 10.1 1 321 516 83.9 83.4
Qatar 2 005 59.0 1.8 39.2 444 377 381.0 451.7
Saudi Arabia 2 006 88.0 3.0 9.0 23 670 928 936.2 867.9
United Arab Emirates 2 005 82.8 1.7 15.4 3 998 740 1 867.0 2 208.0
Yemen 2 005 90.7 1.8 7.4 3 565 162 168.6 154.0
North AfricaAlgeria 2 000 63.9 13.5 22.5 6 161 196 52.7 33.8
Libya 2 000 82.8 3.1 14.1 4 326 796 609.7 512.0
Mauritania 2 000 93.7 1.6 4.7 1 601 572 14.0 13.2
Morocco 2 000 87.3 2.9 9.8 12 607 428 43.5 38.0Tunisia 2 000 82.0 4.2 13.8 2 640 296 61.3 47.1
Other Near East CountriesEgypt 2 000 86.4 5.9 7.8 68 300 973 94.7 103.0
Iran (Islamic Republic of) 2 004 92.2 1.2 6.6 93 300 1 306 67.7 62.6
Iraq 2 000 78.8 14.7 6.5 66 000 2 616 87.3 68.8
Jordan 2 005 65.0 4.1 31.0 941 166 90.5 65.2
Lebanon 2 005 59.5 11.5 29.0 1 310 317 18.6 17.3
SudanSudan (former) 2 000 97.1 0.6 2.3 37 140 1 037 57.6 55.9
Syrian Arab Republic 2 003 87.5 3.7 8.8 16 760 867 86.4 87.3
Regional Office for AfricaRegional Office for Asia andthe PacificRegional Office for Europeand Central AsiaRegional Office for LatinAmerica and the Caribbean
World
127
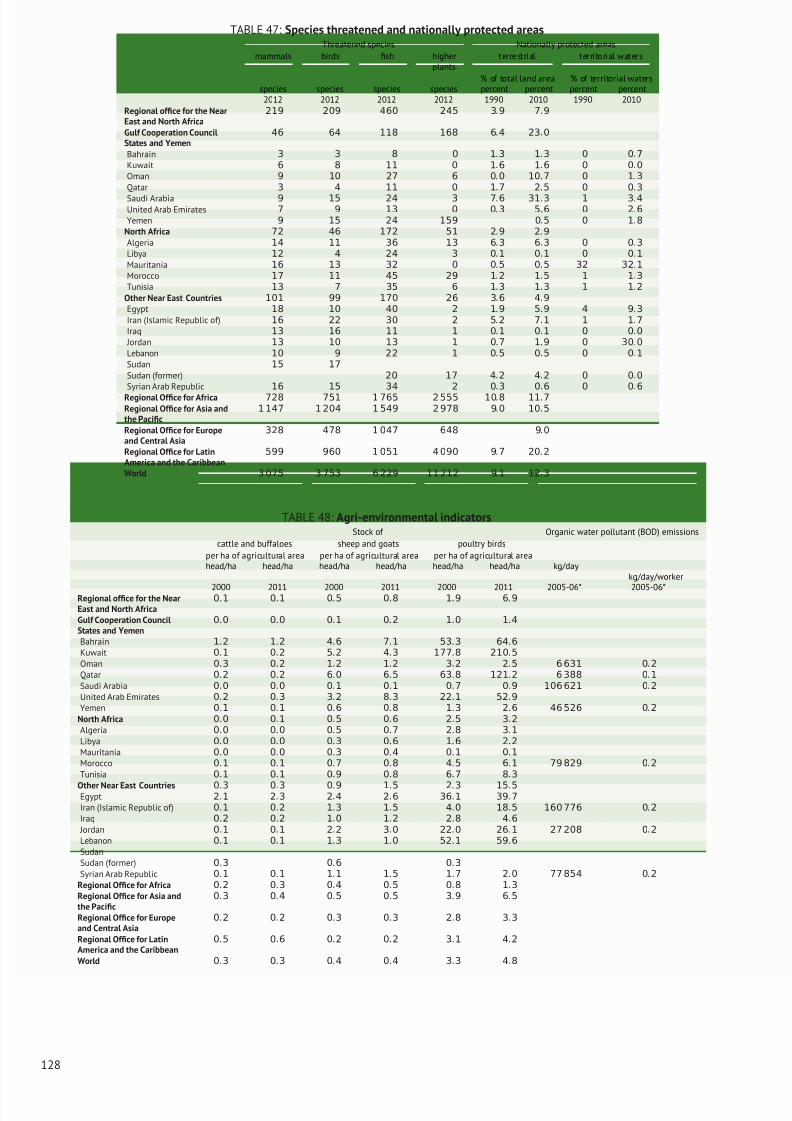
8/12/2019 FAO Statistical Yearbook 2014 Near East and North Africa Food and Agriculture
http://slidepdf.com/reader/full/fao-statistical-yearbook-2014-near-east-and-north-africa-food-and-agriculture 144/174
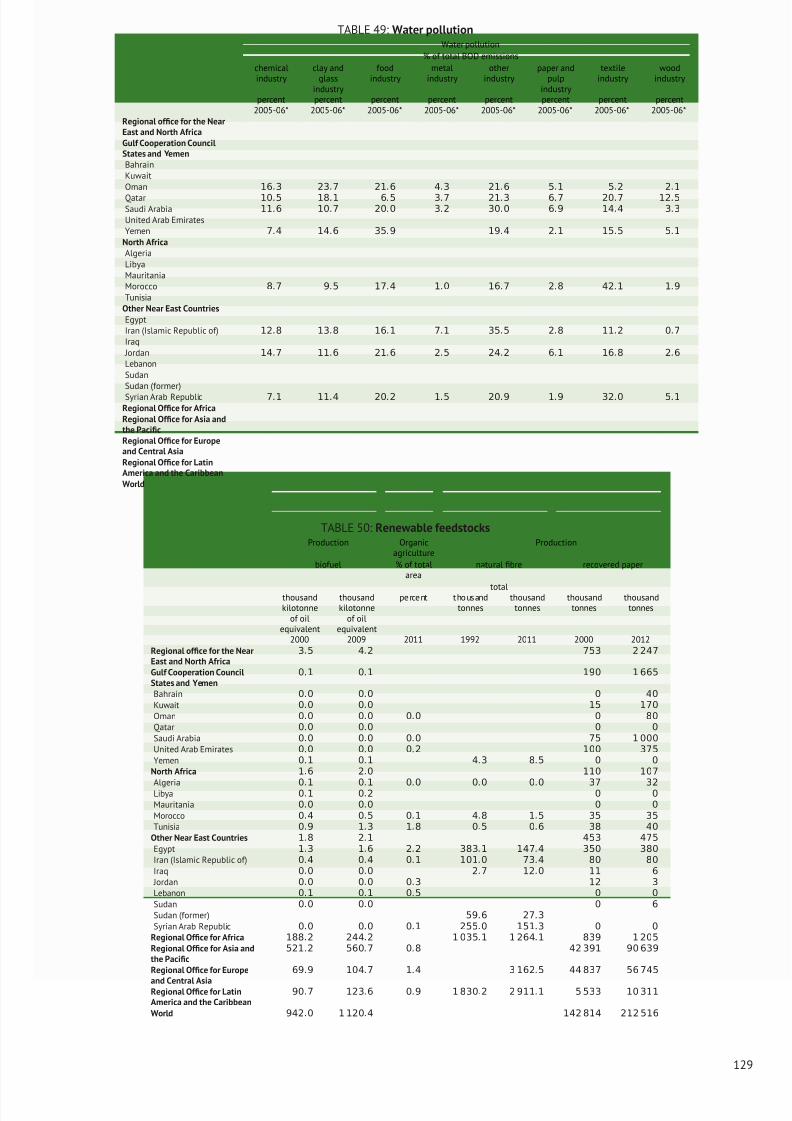
8/12/2019 FAO Statistical Yearbook 2014 Near East and North Africa Food and Agriculture
http://slidepdf.com/reader/full/fao-statistical-yearbook-2014-near-east-and-north-africa-food-and-agriculture 145/174
TABLE 49: Water pollutionWater pollution
% of total BOD emissions
chemicalindustry
clay andglass
industry
foodindustry
metalindustry
otherindustry
paper andpulp
industry
textileindustry
woodindustry
percent percent percent percent percent percent percent percent2005-06* 2005-06* 2005-06* 2005-06* 2005-06* 2005-06* 2005-06* 2005-06*
Regional office for the NearEast and North AfricaGulf Cooperation CouncilStates and YemenBahrainKuwaitOman 16.3 23.7 21.6 4.3 21.6 5.1 5.2 2.1
Qatar 10.5 18.1 6.5 3.7 21.3 6.7 20.7 12.5Saudi Arabia 11.6 10.7 20.0 3.2 30.0 6.9 14.4 3.3
United Arab EmiratesYemen 7.4 14.6 35.9 19.4 2.1 15.5 5.1
North AfricaAlgeriaLibyaMauritaniaMorocco 8.7 9.5 17.4 1.0 16.7 2.8 42.1 1.9
TunisiaOther Near East CountriesEgyptIran (Islamic Republic of) 12.8 13.8 16.1 7.1 35.5 2.8 11.2 0.7
Iraq Jordan 14.7 11.6 21.6 2.5 24.2 6.1 16.8 2.6
LebanonSudanSudan (former)Syrian Arab Republic 7.1 11.4 20.2 1.5 20.9 1.9 32.0 5.1
Regional Office for AfricaRegional Office for Asia andthe PacificRegional Office for Europeand Central AsiaRegional Office for LatinAmerica and the CaribbeanWorld
TABLE 50: Renewable feedstocksProduction Organic
agricultureProduction
biofuel % of totalarea
natural fibre recovered paper
totalthousandkilotonne
of oilequivalent
thousandkilotonne
of oilequivalent
percent thousandtonnes
thousandtonnes
thousandtonnes
thousandtonnes
2000 2009 2011 1992 2011 2000 2012
Regional office for the NearEast and North Africa
3.5 4.2 753 2 247
Gulf Cooperation CouncilStates and Yemen
0.1 0.1 190 1 665
Bahrain 0.0 0.0 0 40
Kuwait 0.0 0.0 15 170
Oman 0.0 0.0 0.0 0 80
Qatar 0.0 0.0 0 0
Saudi Arabia 0.0 0.0 0.0 75 1 000
United Arab Emirates 0.0 0.0 0.2 100 375
Yemen 0.1 0.1 4.3 8.5 0 0
North Africa 1.6 2.0 110 107
Algeria 0.1 0.1 0.0 0.0 0.0 37 32
Libya 0.1 0.2 0 0
Mauritania 0.0 0.0 0 0
Morocco 0.4 0.5 0.1 4.8 1.5 35 35
Tunisia 0.9 1.3 1.8 0.5 0.6 38 40
Other Near East Countries 1.8 2.1 453 475
Egypt 1.3 1.6 2.2 383.1 147.4 350 380
Iran (Islamic Republic of) 0.4 0.4 0.1 101.0 73.4 80 80
Iraq 0.0 0.0 2.7 12.0 11 6
Jordan 0.0 0.0 0.3 12 3
Lebanon 0.1 0.1 0.5 0 0
Sudan 0.0 0.0 0 6
Sudan (former) 59.6 27.3
Syrian Arab Republic 0.0 0.0 0.1 255.0 151.3 0 0
Regional Office for Africa 188.2 244.2 1 035.1 1 264.1 839 1 205
Regional Office for Asia andthe Pacific
521.2 560.7 0.8 42 391 90 639
Regional Office for Europe
and Central Asia
69.9 104.7 1.4 3 162.5 44 837 56 745
Regional Office for LatinAmerica and the Caribbean
90.7 123.6 0.9 1 830.2 2 911.1 5 533 10 311
World 942.0 1 120.4 142 814 212 516
129
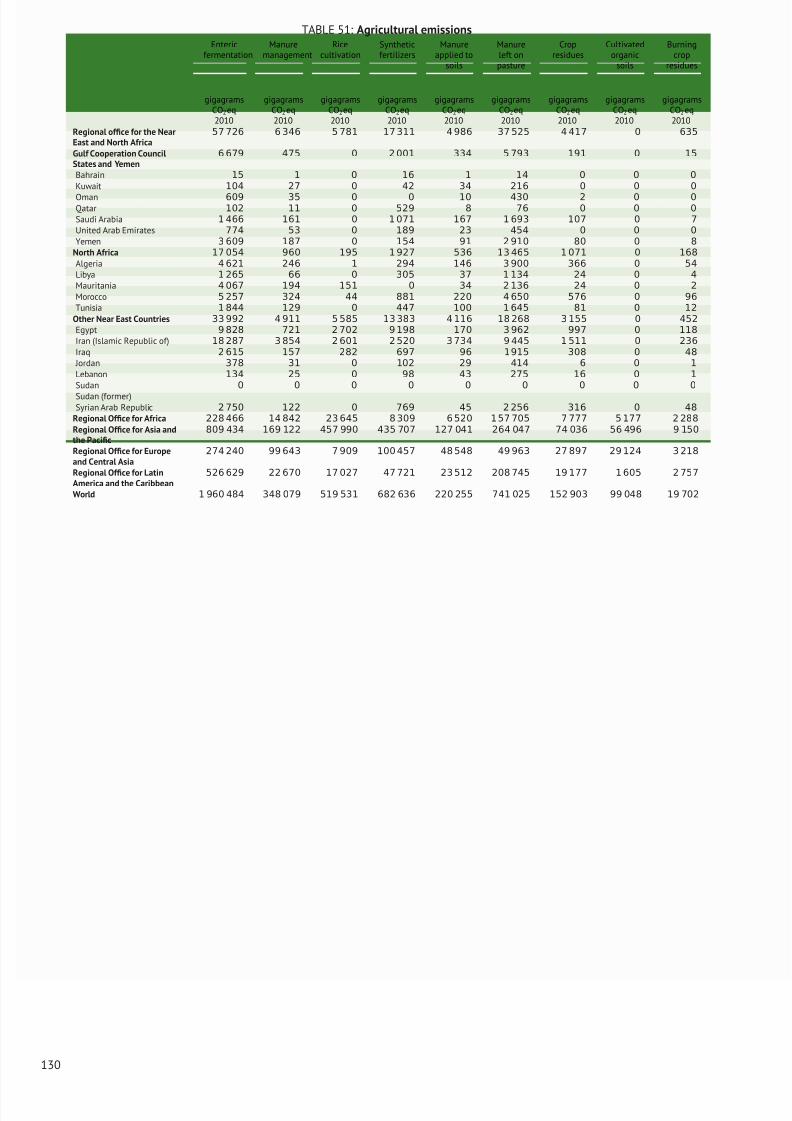
8/12/2019 FAO Statistical Yearbook 2014 Near East and North Africa Food and Agriculture
http://slidepdf.com/reader/full/fao-statistical-yearbook-2014-near-east-and-north-africa-food-and-agriculture 146/174
TABLE 51: Agricultural emissionsEnteric
fermentationManure
managementRice
cultivationSyntheticfertilizers
Manureapplied to
soils
Manureleft onpasture
Cropresidues
Cultivatedorganic
soils
Burningcrop
residues
gigagramsCO2eq
gigagramsCO2eq
gigagramsCO2eq
gigagramsCO2eq
gigagramsCO2eq
gigagramsCO2eq
gigagramsCO2eq
gigagramsCO2eq
gigagramsCO2eq
2010 2010 2010 2010 2010 2010 2010 2010 2010
Regional office for the NearEast and North Africa
57 726 6 346 5 781 17 311 4 986 37 525 4 417 0 635
Gulf Cooperation CouncilStates and Yemen
6 679 475 0 2 001 334 5 793 191 0 15
Bahrain 15 1 0 16 1 14 0 0 0
Kuwait 104 27 0 42 34 216 0 0 0
Oman 609 35 0 0 10 430 2 0 0Qatar 102 11 0 529 8 76 0 0 0
Saudi Arabia 1 466 161 0 1 071 167 1 693 107 0 7
United Arab Emirates 774 53 0 189 23 454 0 0 0
Yemen 3 609 187 0 154 91 2 910 80 0 8
North Africa 17 054 960 195 1 927 536 13 465 1 071 0 168
Algeria 4 621 246 1 294 146 3 900 366 0 54
Libya 1 265 66 0 305 37 1 134 24 0 4
Mauritania 4 067 194 151 0 34 2 136 24 0 2
Morocco 5 257 324 44 881 220 4 650 576 0 96
Tunisia 1 844 129 0 447 100 1 645 81 0 12
Other Near East Countries 33 992 4 911 5 585 13 383 4 116 18 268 3 155 0 452
Egypt 9 828 721 2 702 9 198 170 3 962 997 0 118
Iran (Islamic Republic of) 18 287 3 854 2 601 2 520 3 734 9 445 1 511 0 236
Iraq 2 615 157 282 697 96 1915 308 0 48
Jordan 378 31 0 102 29 414 6 0 1
Lebanon 134 25 0 98 43 275 16 0 1
Sudan 0 0 0 0 0 0 0 0 0
Sudan (former)Syrian Arab Republic 2 750 122 0 769 45 2 256 316 0 48
Regional Office for Africa 228 466 14 842 23 645 8 309 6 520 1 57 705 7 777 5 177 2 288
Regional Office for Asia andthe Pacific
809 434 169 122 457 990 435 707 127 041 264 047 74 036 56 496 9 150
Regional Office for Europeand Central Asia
274 240 99 643 7 909 100 457 48 548 49 963 27 897 29 124 3 218
Regional Office for LatinAmerica and the Caribbean
526 629 22 670 17 027 47 721 23 512 208 745 19 177 1 605 2 757
World 1 960 484 348 079 519 531 682 636 220 255 741 025 152 903 99 048 19 702
130

8/12/2019 FAO Statistical Yearbook 2014 Near East and North Africa Food and Agriculture
http://slidepdf.com/reader/full/fao-statistical-yearbook-2014-near-east-and-north-africa-food-and-agriculture 147/174
PART
Metadata
131
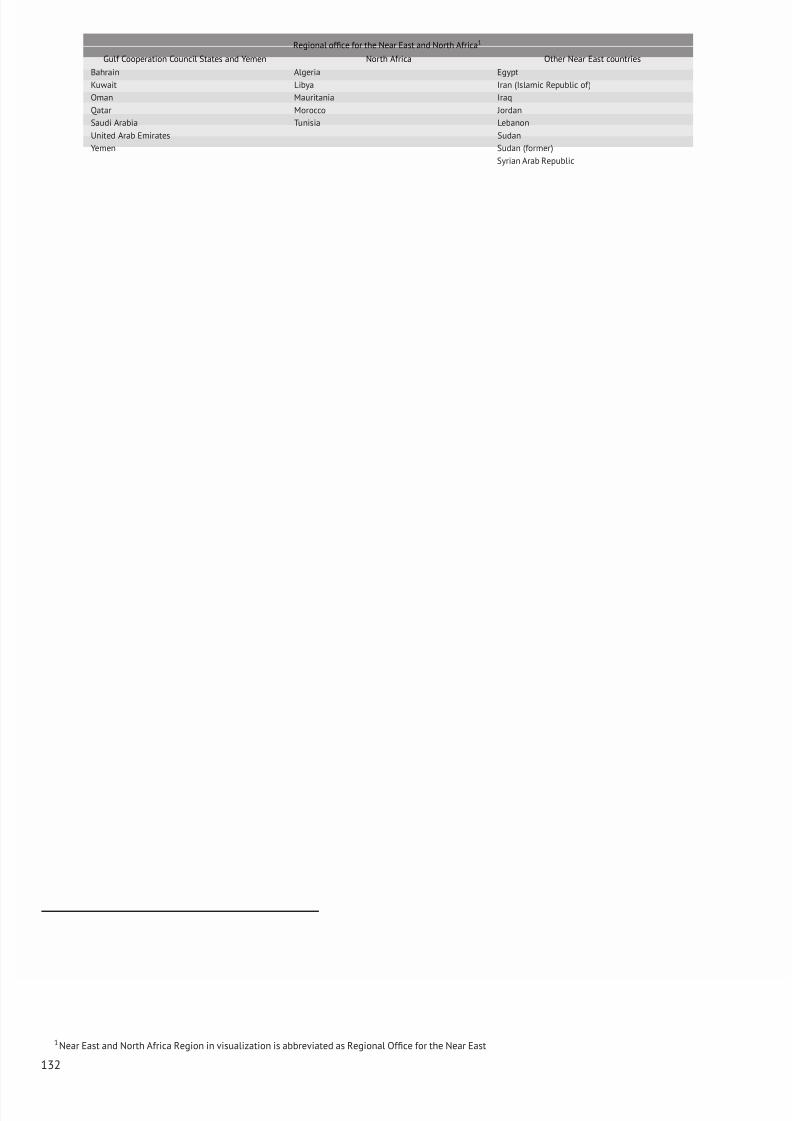
8/12/2019 FAO Statistical Yearbook 2014 Near East and North Africa Food and Agriculture
http://slidepdf.com/reader/full/fao-statistical-yearbook-2014-near-east-and-north-africa-food-and-agriculture 148/174
Regional office for the Near East and North Afric a1
Gulf Cooperation Council States and Yemen North Africa Other Near East countries
Bahrain Algeria Egypt
Kuwait Libya Iran (Islamic Republic of)
Oman Mauritania Iraq
Qatar Morocco Jordan
Saudi Arabia Tunisia Lebanon
United Arab Emirates Sudan
Yemen Sudan (former)
Syrian Arab Republic
1Near East and North Africa Region in visualization is abbreviated as Regional Office for the Near East
132
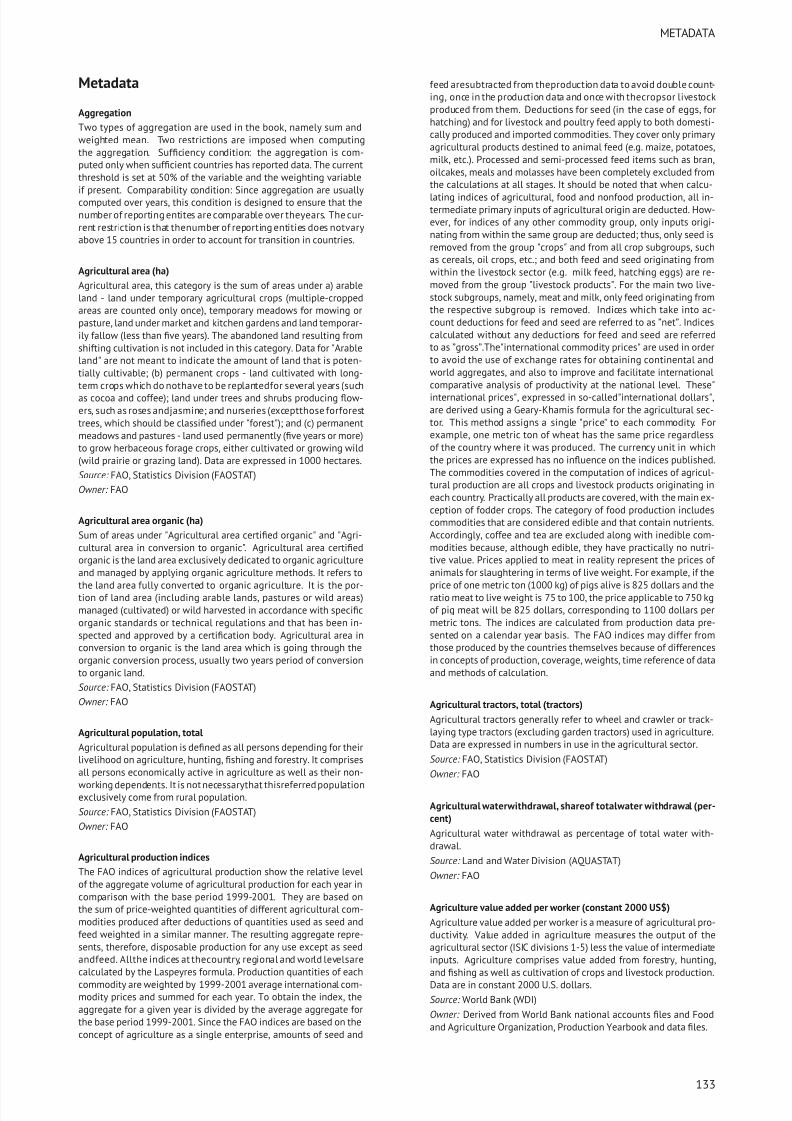
8/12/2019 FAO Statistical Yearbook 2014 Near East and North Africa Food and Agriculture
http://slidepdf.com/reader/full/fao-statistical-yearbook-2014-near-east-and-north-africa-food-and-agriculture 149/174
METADATA
Metadata
Aggregation
Two types of aggregation are used in the book, namely sum andweighted mean. Two restrictions are imposed when computingthe aggregation. Sufficiency condition: the aggregation is com-puted only when sufficient countries has reported data. The currentthreshold is set at 50% of the variable and the weighting variableif present. Comparability condition: Since aggregation are usuallycomputed over years, this condition is designed to ensure that thenumber of reporting entites are comparable over theyears. The cur-rent restriction is that thenumber of reporting entities does notvaryabove 15 countries in order to account for transition in countries.
Agricultural area (ha)
Agricultural area, this category is the sum of areas under a) arableland - land under temporary agricultural crops (multiple-croppedareas are counted only once), temporary meadows for mowing orpasture, land under market and kitchen gardens and land temporar-ily fallow (less than five years). The abandoned land resulting fromshifting cultivation is not included in this category. Data for "Arableland" are not meant to indicate the amount of land that is poten-tially cultivable; (b) permanent crops - land cultivated with long-term crops which do nothave to be replantedfor several years (suchas cocoa and coffee); land under trees and shrubs producing flow-ers, such as roses andjasmine; and nurseries (exceptthose forforesttrees, which should be classified under "forest"); and (c) permanentmeadows and pastures - land used permanently (five years or more)to grow herbaceous forage crops, either cultivated or growing wild(wild prairie or grazing land). Data are expressed in 1000 hectares.
Source: FAO, Statistics Division (FAOSTAT)
Owner: FAO
Agricultural area organic (ha)
Sum of areas under "Agricultural area certified organic" and "Agri-cultural area in conversion to organic". Agricultural area certifiedorganic is the land area exclusively dedicated to organic agricultureand managed by applying organic agriculture methods. It refers to
the land area fully converted to organic agriculture. It is the por-tion of land area (including arable lands, pastures or wild areas)managed (cultivated) or wild harvested in accordance with specificorganic standards or technical regulations and that has been in-spected and approved by a certification body. Agricultural area inconversion to organic is the land area which is going through theorganic conversion process, usually two years period of conversionto organic land.
Source: FAO, Statistics Division (FAOSTAT)
Owner: FAO
Agricultural population, total
Agricultural population is defined as all persons depending for theirlivelihood on agriculture, hunting, fishing and forestry. It comprisesall persons economically active in agriculture as well as their non-
working dependents. It is not necessarythat thisreferred populationexclusively come from rural population.
Source: FAO, Statistics Division (FAOSTAT)
Owner: FAO
Agricultural production indices
The FAO indices of agricultural production show the relative levelof the aggregate volume of agricultural production for each year incomparison with the base period 1999-2001. They are based onthe sum of price-weighted quantities of different agricultural com-modities produced after deductions of quantities used as seed andfeed weighted in a similar manner. The resulting aggregate repre-sents, therefore, disposable production for any use except as seedandfeed. Allthe indices at thecountry, regional and world levelsarecalculated by the Laspeyres formula. Production quantities of each
commodity are weighted by 1999-2001 average international com-modity prices and summed for each year. To obtain the index, theaggregate for a given year is divided by the average aggregate forthe base period 1999-2001. Since the FAO indices are based on theconcept of agriculture as a single enterprise, amounts of seed and
feed aresubtracted from theproduction data to avoid double count-ing, once in the production data and once with thecropsor livestockproduced from them. Deductions for seed (in the case of eggs, forhatching) and for livestock and poultry feed apply to both domesti-cally produced and imported commodities. They cover only primaryagricultural products destined to animal feed (e.g. maize, potatoes,milk, etc.). Processed and semi-processed feed items such as bran,oilcakes, meals and molasses have been completely excluded fromthe calculations at all stages. It should be noted that when calcu-
lating indices of agricultural, food and nonfood production, all in-termediate primary inputs of agricultural origin are deducted. How-ever, for indices of any other commodity group, only inputs origi-nating from within the same group are deducted; thus, only seed isremoved from the group "crops" and from all crop subgroups, suchas cereals, oil crops, etc.; and both feed and seed originating fromwithin the livestock sector (e.g. milk feed, hatching eggs) are re-moved from the group "livestock products". For the main two live-stock subgroups, namely, meat and milk, only feed originating fromthe respective subgroup is removed. Indices which take into ac-count deductions for feed and seed are referred to as ”net”. Indicescalculated without any deductions for feed and seed are referredto as ”gross”.The"international commodity prices" are used in orderto avoid the use of exchange rates for obtaining continental andworld aggregates, and also to improve and facilitate internationalcomparative analysis of productivity at the national level. These"international prices", expressed in so-called"international dollars",are derived using a Geary-Khamis formula for the agricultural sec-tor. This method assigns a single "price" to each commodity. Forexample, one metric ton of wheat has the same price regardlessof the country where it was produced. The currency unit in whichthe prices are expressed has no influence on the indices published.The commodities covered in the computation of indices of agricul-tural production are all crops and livestock products originating ineach country. Practically all products are covered, with the main ex-ception of fodder crops. The category of food production includescommodities that are considered edible and that contain nutrients.Accordingly, coffee and tea are excluded along with inedible com-modities because, although edible, they have practically no nutri-tive value. Prices applied to meat in reality represent the prices of animals for slaughtering in terms of live weight. For example, if the
price of one metric ton (1000 kg) of pigs alive is 825 dollars and theratio meat to live weight is 75 to 100, the price applicable to 750 kgof pig meat will be 825 dollars, corresponding to 1100 dollars permetric tons. The indices are calculated from production data pre-sented on a calendar year basis. The FAO indices may differ fromthose produced by the countries themselves because of differencesin concepts of production, coverage, weights, time reference of dataand methods of calculation.
Agricultural tractors, total (tractors)
Agricultural tractors generally refer to wheel and crawler or track-laying type tractors (excluding garden tractors) used in agriculture.Data are expressed in numbers in use in the agricultural sector.
Source: FAO, Statistics Division (FAOSTAT)
Owner: FAO
Agricultural waterwithdrawal, shareof totalwater withdrawal (per-cent)
Agricultural water withdrawal as percentage of total water with-drawal.
Source: Land and Water Division (AQUASTAT)
Owner: FAO
Agriculture value added per worker (constant 2000 US$)
Agriculture value added per worker is a measure of agricultural pro-ductivity. Value added in agriculture measures the output of theagricultural sector (ISIC divisions 1-5) less the value of intermediateinputs. Agriculture comprises value added from forestry, hunting,and fishing as well as cultivation of crops and livestock production.
Data are in constant 2000 U.S. dollars.Source: World Bank (WDI)
Owner: Derived from World Bank national accounts files and Foodand Agriculture Organization, Production Yearbook and data files.
133
8/12/2019 FAO Statistical Yearbook 2014 Near East and North Africa Food and Agriculture
http://slidepdf.com/reader/full/fao-statistical-yearbook-2014-near-east-and-north-africa-food-and-agriculture 150/174
Agriculture, Forestry, Fishing, and Hunting, Cash (Budg. Cen. Govt.)(share of agricultural GDP)
See ’Government expenditure’.
Source: FAO, Statistics Division (FAOSTAT)
Owner: FAO
Agriculture, Forestry, Fishing, and Hunting, Cash (Budg. Cen. Govt.)(share of total outlays)
See ’Government expenditure’.
Source: FAO, Statistics Division (FAOSTAT)
Owner: FAO
Agriculture, Forestry, Fishing, and Hunting, Noncash (Budg. Cen.Govt.) (share of agricultural GDP)
See ’Government expenditure’.
Source: FAO, Statistics Division (FAOSTAT)
Owner: FAO
Agriculture, Forestry, Fishing, and Hunting, Noncash (Budg. Cen.Govt.) (share of total outlays)
See ’Government expenditure’.
Source: FAO, Statistics Division (FAOSTAT)
Owner: FAO
Agriculture, value added (percent of GDP)
Agriculture corresponds to ISIC divisions 1-5 and includes forestry,hunting, and fishing, as well as cultivation of crops and livestockproduction. Value added is the net output of a sector after addingup all outputs and subtracting intermediate inputs. It is calculatedwithout making deductions for depreciation of fabricated assets ordepletion and degradation of natural resources. The origin of valueadded is determined by the InternationalStandard Industrial Classi-fication (ISIC), revision 3. Note: For VAB countries, grossvalue addedat factor cost is used as the denominator.
Source: World Bank (WDI)
Owner: World Bank national accounts data, and OECD National Ac-counts data files.
All GHG agricultural sectors, total emissions in CO2eq (gigagrams)
Agriculture Total contains all the emissions produced in the differ-ent agricultural emissions sub-domains, providing a picture of thecontribution to the total amount of GHG emissions from agriculture.GHG Emissions from agriculture consist of non-CO2 gases, namelymethane (CH4) and nitrous oxide (N2O), produced by crop and live-stock production and management activities.
Source: FAO, Statistics Division (FAOSTAT)
Owner: FAO
Aquaculture fish production (tonnes)Aquaculture is defined as the farming of aquatic organisms. Farm-ing implies some form of intervention in the rearing process to en-hance production, such as regular stocking, feeding, protection frompredators, etc. Farming also implies individual or corporate owner-ship of the stock being cultivated. For statistical purposes, aquaticorganisms which are harvested by an individual or corporate bodywhichhas ownedthem throughout theirrearing period contribute toaquaculture, while aquatic organisms which are exploitable by thepublic as a common property resource, with or without appropriatelicenses, are the harvest of fisheries. In the case of capture-basedaquaculture, only the incremental growth (or weightgain) in captiv-ity, could and should be reported as the production from aquacul-ture. Data included here covers an aquaculture production of fish,molluscs, crustaceans and miscellaneous aquatic animals but ex-cluding production for marine mammals, crocodiles, corals, pearls,
sponges and aquatic plants.
Source: Fisheries and Aquaculture Department (Fishery and Aqua-culture statistics)
Owner: FAO
Aquaculture fish production inland (tonnes)
Aquaculture production from inland areas.
Source: Fisheries and Aquaculture Department (Fishery and Aqua-culture statistics)
Owner: FAO
Aquaculture fish production marine (tonnes)
Aquaculture production from marine areas.
Source: Fisheries and Aquaculture Department (Fishery and Aqua-culture statistics)
Owner: FAO
Arable land (ha)
Arable landis the landunder temporaryagricultural crops(multiple-cropped areas are counted onlyonce), temporarymeadows for mow-ingor pasture, land under marketand kitchen gardens and land tem-porarily fallow (less than five years). The abandoned land resultingfrom shifting cultivation is not included in this category. Data for’Arable land’ are not meant to indicate the amount of land that ispotentially cultivable.
Source: FAO, Statistics Division (FAOSTAT)
Owner: FAO
Arable land and permanent crops (ha)
Arable land and Permanent crops, this category is the sum of areasunder ’Arable land’ and ’Permanent crops’.
Source: FAO, Statistics Division (FAOSTAT)
Owner: FAO
Area under bioenergy crops (ha)
The assumed land area required to produce a given annual quantityof biofuel production.
Source: FAO
Owner: Based on IEA biofuel production data
Artificial sweetenersHigh-intensity or low-caloric sweetening agents that are producedchemically.
Average dietary supply adequacy (index)
The indicator expresses the Dietary Energy Supply (DES) as a per-centage of the Average Dietary Energy Requirement (ADER) in thecountry. Each country’s or region’s average supply of calories forfood consumption is normalized by the average dietary energy re-quirement estimated for its population, to provide an index of ade-quacy of thefoodsupplyin terms of calories. Analyzedtogether withthe prevalence of undernourishment, it allows discerning whetherundernourishment is mainly due to insufficiency of the food supplyor to particularly bad distribution. The indicator is calculated as anaverage over 3 years to reduce the impact of possible errors in es-
timated DES, due to the difficulties in properly accounting of stockvariations in major food. It thus provides an indicator of structuralfood supply adequacy.
Source: FAO, Statistics Division
Owner: FAO
Average fat supply (g/cap/day)
National average fat supply (expressed in grams per caput per day).
Source: FAO, Statistics Division
Owner: FAO
Average protein supply (g/cap/day)
National average protein supply (expressed in grams per caput perday). As other indicators based on Food balance Sheets data, it iscalculated on 3 year averages, to reduce the impact of errors inrecording of annual stock variations.
Source: FAO, Statistics Division
Owner: FAO
134
8/12/2019 FAO Statistical Yearbook 2014 Near East and North Africa Food and Agriculture
http://slidepdf.com/reader/full/fao-statistical-yearbook-2014-near-east-and-north-africa-food-and-agriculture 151/174
METADATA
Average supply of protein of animal origin (g/cap/day)
National average protein supply (expressed in grams per caput perday). It includes the following groups: Meat; Offals; Animal Fatsand Products; Milk and Products; Eggs, Fish, Seafood and Products;and Acquatic Products, other. The indicator is calculated on 3 yearaverages.
Source: FAO, Statistics Division
Owner: FAO
Beef and buffalo meat (tonnes)
See ’Buffalos’, ’Meat, total’, and ’Production’.
Source: FAO, Statistics Division (FAOSTAT)
Owner: FAO
Biofuel production (energy, kilotonne of oil equivalent)
Sum of ethanol and biodiesel production, reported in kilotonne of oil equivalent.
Source: IEA
Owner: Energy Balances of OECD Countries and Energy Balances of Non-OECD Countries, 2011 editions
Bird species, threatenedBirds are listed for countries included within their breeding or win-tering ranges. Threatened species are the number of species clas-sified by the IUCN as endangered, vulnerable, rare, indeterminate,out of danger, or insufficiently known.
Source: World Bank (WDI)
Owner: United Nations Environmental Program and the World Con-servation Monitoring Centre, and International Union for Conserva-tion of Nature, Red List of Threatened Species.
Buffaloes
Indian, Asiatic, pigmy, water buffalo (Bubalus bubalus; B. arnee; B.depressicornis); African buffalo (genus Syncerus); American bison(Bison bison); European bison (Bison bonasus); beeffalo (cross be-tween a bison and a domesticated beef animal). See 866. Excludes
wild bisons and buffaloes.
Burning crop residues, total emissions in CO2eq (gigagrams)
Greenhouse Gas (GHG) emissions from burning crop residues consistof methane and nitrous oxide gases produced by the combustion of a percentage of the crop residues burnt on-site.
Source: FAO, Statistics Division (FAOSTAT)
Owner: FAO
Butter and ghee production (tonnes)
See ’Butter, ghee’ and ’Production’.
Source: FAO, Statistics Division (FAOSTAT)
Owner: FAO
Butter, Ghee
Default composition: 886 Butter, cow milk, 887 Ghee, butteroil of cow milk, 952 Butter, buffalo milk, 953 Ghee, of buffalo milk, 983Butter and ghee, sheep milk, 1022 Butter of goat mlk
Capture fish production (tonnes)
Capture fishery is defined as the hunting, collecting and gatheringactivities directed at removing or collecting live wild aquatic organ-isms. The capture production statistics here indicates the nominalcatches of aquatic organisms, killed, caught, trapped or collected forall commercial, industrial, recreational and subsistence purposes inlive weight equivalent. Data included here covers capture produc-tion of fish, molluscs, crustaceans and miscellaneous aquatic an-imals but excluding production for marine mammals, crocodiles,corals, pearls, sponges and aquatic plants.
Source: Fisheries and Aquaculture Department (Fishery and Aqua-culture statistics)
Owner: FAO
Capture fish production inland (tonnes)
Capture fishery production from inland areas.
Source: Fisheries and Aquaculture Department (Fishery and Aqua-culture statistics)
Owner: FAO
Capture fish production marine (tonnes)
Capture fishery production from marine areas.
Source: Fisheries and Aquaculture Department (Fishery and Aqua-culture statistics)
Owner: FAO
Cassava
Manioc, mandioca, yuca (Manihot esculenta, syn. M. utilissima);yuca dulce (M. palmata, syn. M. dulcis). A semi-permanent cropgrown in tropical and subtropical regions. Sometimes bitter andsweet cassavas are referred to as separate species, the former beingM. esculenta andthe latterM. palmata, but this is incorrectsincethetoxicity varies according to location. Cassava is the staple food inmany tropical countries. It is not traded internationally in its freshstate because tubers deteriorate very rapidly.
CattleCommon ox (Bos taurus); zebu, humped ox (Bos indicus); Asiatic ox(subgenus Bibos); Tibetan yak (Poephagus grunniens). Animals of the genus listed, regardless of age, sex, or purpose raised. Data areexpressed in number of heads.
Cattle and buffaloes (heads)
See ’Cattle’ and ’Buffaloes’.
Source: FAO, Statistics Division (FAOSTAT)
Owner: FAO
Cereal exports (tonnes)
Exports (volume) of cereals.
Source: FAO, Statistics Division (FAOSTAT)
Owner: FAO
Cereal import dependency ratio (percent)
Cereal imports/(cereal production+cereali mport-cerealexport). Theindicator is calculated on 3 year averages.
Source: FAO, Statistics Division
Owner: FAO
Cereal imports (tonnes)
Imports (volume) of cereals.
Source: FAO, Statistics Division (FAOSTAT)
Owner: FAO
Cereals
Cereals include Wheat, Rice Paddy, Barley, Maize, Popcorn, Rye,Oats, Millets, Sorghum, Buckwheat, Quinoa, Fonio, Triticale, CanarySeed, Mixed Grain and Cereals Nes.
Cereals harvested area (ha)
See ’Cereals’ and ’Crop area’.
Source: FAO, Statistics Division (FAOSTAT)
Owner: FAO
Cereals production (tonnes)
See ’Cereals’ and ’Crop production’.
Source: FAO, Statistics Division (FAOSTAT)
Owner: FAO
Cereals yield (hg/ha)
See ’Cereals’ and ’Crop yield’.
Source: FAO, Statistics Division (FAOSTAT)
Owner: FAO
135
8/12/2019 FAO Statistical Yearbook 2014 Near East and North Africa Food and Agriculture
http://slidepdf.com/reader/full/fao-statistical-yearbook-2014-near-east-and-north-africa-food-and-agriculture 152/174
Cheese (all kinds) production (tonnes)
All kinds of cheese. See also ’Production’.
Source: FAO, Statistics Division (FAOSTAT)
Owner: FAO
Chickens
Fowl (Gallus domesticus); Guinea fowl (Numida meleagris. Domes-ticated birds only. Data are expressed in thousands.
Chickens (heads)
See ’Chickens’ and ’Production’.
Source: FAO, Statistics Division (FAOSTAT)
Owner: FAO
Children in employment, total (share of children ages 7-14)
Children in employment refer to children involved in economic ac-tivity for at least one hour in the reference week of the survey.
Source: World Bank (WDI)
Owner: Understanding Children’s Work project based on data fromILO, UNICEF and the World Bank.
CitrusIncluding inter alia: bergamot (Citrus bergamia); citron (C. medicavar. cedrata); chinotto (C. myrtifolia); kumquat (Fortunellajaponica).Some minor varieties of citrus are used primarily in the preparationof perfumes and soft drinks.
Citrus fruit harvested area (ha)
See ’Fruit, citrus nes’ and ’Crop area’.
Source: FAO, Statistics Division (FAOSTAT)
Owner: FAO
Citrus fruit production (tonnes)
See ’Fruit, citrus nes’ and ’Crop production’.
Source: FAO, Statistics Division (FAOSTAT)
Owner: FAO
Citrus fruit yield (hg/ha)
See ’Fruit, citrus nes’ and ’Crop yield’.
Source: FAO, Statistics Division (FAOSTAT)
Owner: FAO
Coarse grain
Coarse grains include Barley, Maize, Popcorn, Rye, Oats, Millet,Sorghum, Buckwheat, Quinoa, Fonio, Triticale, Canary seed, Mixedgrain and Cereals, nes.
Coarse grain harvested area (ha)
See ’Coarse grain’ and ’Crop area’.
Source: FAO, Statistics Division (FAOSTAT)
Owner: FAO
Coarse grain production (tonnes)
See ’Coarse grain’ and ’Crop production’.
Source: FAO, Statistics Division (FAOSTAT)
Owner: FAO
Coarse grain yield (hg/ha)
See ’Coarse grain’ and ’Crop yield’.
Source: FAO, Statistics Division (FAOSTAT)
Owner: FAO
Cocoa, beans
Theobroma cacao. The seeds contained in the fruit of the cacao-tree, including whole or broken, raw or roasted.
Cocoa, paste
Obtained by grinding roasted cocoa beans. Also called liquor. Notdefatted.
Coconut Oil
Default composition: Oil, coconut (copra)
Coconuts
Cocos nucifera Husked coconut. In shell, covered by the endocarp,while exocarp (the smooth outer skin) and mesocarp (the fibrouscovering) are removed. Immature nuts contain a milky juice thatis consumed as a refreshing drink. Mature nuts are consumed assuch, or processed for copra or desiccated coconut. The flesh, fromwhich copra/oil is extracted, constitutes 40-70% of the weight of the husked coconut. The oil content is about 36% of the flesh.
Cotton lint
Gossypium spp. Fibres from ginning seed cotton that have not beencarded or combed. Trade data also include fibres that have beencleaned, bleached, dyed or rendered absorbent.
Cottonseed Oil
Default composition: Oil, cottonseed
CPIA business regulatory environment rating (1=low to 6=high)
Business regulatory environment assesses the extent to which thelegal, regulatory, and policy environments help or hinder privatebusinesses in investing, creating jobs, and becoming more produc-tive.
Source: World Bank (WDI)
Owner: World Bank Group, CPIA database(http://www.worldbank.org/ida).
Crop area
Crop area is a surface of land on which a crop is grown. In general,theareameasuredfor cadastralpurposes includes, in addition tothearea cultivated, headlands, ditches and other non-cultivated areas.Such an area can be called gross area as against the net area whichincludes only the portion of the gross area actually cultivated. Forvarious reasons, e.g. natural calamities or economic considerations,certain areas planted or sown with a given crop arenot harvestedorare harvested before the crop reaches maturity. Hence the need forthe concept of area to be sub-divided into sown or planted area andharvested area. Sown area data are necessary to estimate quantitiesused for seeding purposes; harvested area, to provide reliable andaccurateyield and production data. A peculiarity of permanentcropsis that numberof trees or plantsis reported in addition to or, insteadof, thearea planted. This is particularly so as regards plantsgrowingoutside of compact plantations, which are either interplanted withother crops or are scattered. Both area and number of trees arealso divided into productive or bearing and non-productive or non-bearing areas or trees. In most cases, non-bearing refers to young
plants that are not yet bearing.
Crop production
Crop production data refer to the actual harvested production fromthe field or orchard and gardens, excluding harvesting and thresh-ing losses and that part of crop not harvested for any reason. Pro-duction therefore includes the quantities of the commodity sold inthe market (marketed production) and the quantities consumed orused by the producers (auto-consumption). When the productiondata available refers to a production period falling into two succes-sive calendar years and it is not possible to allocate the relativeproduction to each of them, it is usual to refer production data tothat year into which the bulk of the production falls. Crop produc-tion data are recorded in tonnes (t). In many countries, crop pro-duction data are obtained as a function of the estimated yield and
the total area. If such a compilation method of production statisticsis enforced by the country, it must be ensured that the total areadoes not refer to sown or planted area, which would give then the<U+393C><U+3E31>biological production’, but to the actually har-vested area during the year.\
136
8/12/2019 FAO Statistical Yearbook 2014 Near East and North Africa Food and Agriculture
http://slidepdf.com/reader/full/fao-statistical-yearbook-2014-near-east-and-north-africa-food-and-agriculture 153/174
METADATA
Crop residues, total emissions in CO2eq (gigagrams)
Greenhouse Gas (GHG) emissions from crop residues consist of ni-trous oxide gas from decomposition of nitrogen in crop residues lefton managed soils.
Source: FAO, Statistics Division (FAOSTAT)
Owner: FAO
Crop yieldHarvested production per unit of harvested area for crop products.In most of the cases yield data are not recorded but obtained by di-viding the production data by the data on area harvested. Data onyields of permanent crops are not as reliable as those for temporarycrops either because most of the area information may correspondto planted area, as for grapes, or because of the scarcity and unreli-ability of the area figures reported by the countries, as for examplefor cocoa and coffee.
Crops net per capita production index number (2004-2006 = 100)
See ’Agricultural production indices’.
Source: FAO, Statistics Division (FAOSTAT)
Owner: FAO
Cultivated organic soils, total emissions in CO2eq (gigagrams)
Greenhouse gas (GHG) emissions data from cultivated organic soilsare those associated with nitrous oxide gas from drained organicsoils. Computed at Tier 1 and complemented by geo-spatial data,following the 2006 IPCC Guidelines for National GHG Inventories(IPCC, 2006). Available by country, with global coverage and relativeto the period 1990-2010 with annual updates.
Source: FAO, Statistics Division (FAOSTAT)
Owner: FAO
Dairy products (milk equivalent) exports (tonnes)
Exports (volume) of dairy products (milk equivalent).Source: FAO, Statistics Division (FAOSTAT)
Owner: FAO
Dairy products (milk equivalent) imports (tonnes)
Imports (volume) of dairy products (milk equivalent).
Source: FAO, Statistics Division (FAOSTAT)
Owner: FAO
Depth of the food deficit (kcal/cap/day)
The depth of the food deficit indicates how many calories wouldbe needed to lift the undernourished from their status, everything
else being constant. The average intensity of food deprivation of the undernourished, estimated as the difference between the av-erage dietary energy requirement and the average dietary energyconsumption of the undernourished population (food-deprived), ismultiplied by the number of undernourished to provide an estimateof the total food deficit in the country, which is then normalized bythe total population. The indicator is calculated as an average over3 years.
Source: FAO, Statistics Division
Owner: FAO
Domestic food price volatility (index)
The Domestic Food Price Volatility is a measure of variation of theDomestic Food Price Level Index. It has been computed as the Stan-
dard Deviation (SD) of the deviations from the trend over the previ-ous five years.
Source: FAO, Statistics Division
Owner: ILO and World Bank ICP (International Comparison Project)
Droughts, floods, extreme temperatures (percent of population af-fected, average 1990-2009)
Droughts, floods and extreme temperatures is the annual averagepercentage of the population that is affected by natural disastersclassified as eitherdroughts, floods, or extreme temperature events.A drought is an extended period of time characterized by a defi-ciency in a region’s water supply that is the result of constantly be-low average precipitation. A drought can lead to losses to agricul-ture, affect inland navigation and hydropower plants, and cause a
lack of drinking water and famine. A flood is a significant rise of water level in a stream, lake, reservoir or coastal region. Extremetemperature events are either cold waves or heat waves. A coldwave can be both a prolonged period of excessively cold weatherand the sudden invasion of very cold air over a large area. Alongwith frost it can cause damage to agriculture, infrastructure, andproperty. A heat wave is a prolonged period of excessively hot andsometimes also humid weather relative to normal climate patternsof a certain region. Population affected is the number of peopleinjured, left homeless or requiring immediate assistance during aperiod of emergency resulting from a natural disaster; it can alsoinclude displaced or evacuated people. Average percentage of pop-ulation affected is calculated by dividing the sum of total affectedfor the period stated by the sum of the annual population figuresfor the period stated.
Source: World Bank (WDI)Owner: EM-DAT: The OFDA/CRED International Disaster Database:www.emdat.be, Universite Catholique de Louvain, Brussels (Bel-gium), World Bank.
Egg production
Covers all domestic birds which have contributed to egg produc-tion during the year, wherever they lay and the corresponding totalproduction, including eggs intended to be used for hatching but ex-cluding waste on farms.
Eggs
Default composition: 1062 Eggs, hen, in shell, 1063 Eggs, liquid,1064 Eggs, dried, 1091 Eggs, other bird, in shell; nutrient data only:916 Egg albumine
Eggs primary production (tonnes)
See ’Eggs’ and ’Egg production’.
Source: FAO, Statistics Division (FAOSTAT)
Owner: FAO
Emissions
The release of greenhouse gases and/or their precursors into theatmosphere over a specified area and period of time.
Employees, agriculture, female (share of female employment)
Employees are people who work for a public or private employerand receive remuneration in wages, salary, commission, tips, piecerates, or pay in kind.
Source: World Bank (WDI)Owner: International Labour Organization, Key Indicators of theLabour Market database.
Employees, agriculture, male (share of male employment)
Employees are people who work for a public or private employerand receive remuneration in wages, salary, commission, tips, piecerates, or pay in kind.
Source: World Bank (WDI)
Owner: International Labour Organization, Key Indicators of theLabour Market database.
Employment in agriculture (share of total employment)
Employees are people who work for a public or private employer
and receive remuneration in wages, salary, commission, tips, piecerates, or pay in kind.
Source: World Bank (WDI)
Owner: International Labour Organization, Key Indicators of theLabour Market database.
137
8/12/2019 FAO Statistical Yearbook 2014 Near East and North Africa Food and Agriculture
http://slidepdf.com/reader/full/fao-statistical-yearbook-2014-near-east-and-north-africa-food-and-agriculture 154/174
Employment, total
Employees are people who work for a public or private employerand receive remuneration in wages, salary, commission, tips, piecerates, or pay in kind.
Source: World Bank
Owner: International Labour Organization, Key Indicators of theLabour Market database.
Enteric fermentation, total emissions in CO2eq (gigagrams)
Greenhouse gas (GHG) emissions from enteric fermentation consistof methane gas produced in digestive systems of ruminants and toa lesser extent of non-ruminants.
Source: FAO, Statistics Division (FAOSTAT)
Owner: FAO
Environmental Protection, Cash (Budg. Cen. Govt.) (share of totaloutlays)
See ’Government expenditure’.
Source: FAO, Statistics Division (FAOSTAT)
Owner: FAO
Environmental Protection, Noncash (Budg. Cen. Govt.) (share of total outlays)
See ’Government expenditure’.
Source: FAO, Statistics Division (FAOSTAT)
Owner: FAO
Evaporated and condensed milk production (tonnes)
See ’Milk excluding butter’ and ’Milk production (tonnes)’.
Source: FAO, Statistics Division (FAOSTAT)
Owner: FAO
Export of forest products (USD)
Forest materials for commercial use.
Source: FAO, Statistics Division (FAOSTAT)
Owner: FAO
Export of roundwood (m3)
See ’Roundwood’.
Source: FAO, Statistics Division (FAOSTAT)
Owner: FAO
Exports of beverages (US$)
Value of exports of beverages in current US$.
Source: FAO, Statistics Division (FAOSTAT)
Owner: FAO
Exports of cereals and prep. (US$)
Value of exports of cereals and prep. in current US$.
Source: FAO, Statistics Division (FAOSTAT)
Owner: FAO
Exports of coffe, tea, cocoa, and spices (US$)
Value of exports of coffe, tea, cocoa, and spices in current US$.
Source: FAO, Statistics Division (FAOSTAT)
Owner: FAO
Exports of dairy products (milk equivalent) (US$) Value of exports of milk equivalent in current US$.
Source: FAO, Statistics Division (FAOSTAT)
Owner: FAO
Exports of fish (US$)
Value of exports of fish in current US$ (data reported include fish,molluscs, crustaceans, and miscellaneous aquatic animals but ex-cluding marine mammals, crocodiles, corals, pearls, sponges andaquatic plants, miscellaneous aquatic animal products and fishwaste).
Source: Fisheries and Aquaculture Department (Fishery and Aqua-culture statistics)
Owner: FAO
Exports of fruit and vegetables (US$)
Value of exports of fruit and vegetables in current US$.
Source: FAO, Statistics Division (FAOSTAT)
Owner: FAO
Exports of meat and meat prep. (US$)
Value of exports of meat and meat prep. i n current US$.
Source: FAO, Statistics Division (FAOSTAT)
Owner: FAO
Exports of oilseeds (US$)
Value of exports of oilseeds in current US$.
Source: FAO, Statistics Division (FAOSTAT)
Owner: FAO
Exports of sugar and honey (US$)
Value of exports of sugar and honey in current US$.
Source: FAO, Statistics Division (FAOSTAT)
Owner: FAO
Exports of veg. oils (US$)
Value of exports of veg. oils in current US$.
Source: FAO, Statistics Division (FAOSTAT)
Owner: FAO
Fat supply quantity in crops primary equivalent (g/cap/day)
Fat supply quantity in crops primary equivalent.
Source: FAO, Statistics Division (FAOSTAT)
Owner: FAO
Fats, Animals, Raw
Default composition: 869 Fat, cattle, 871 Fat, cattle butcher, 949Fat, buffaloes, 979 Fat, sheep, 994 Grease incl. lanolin wool, 1019Fat, goats, 1037 Fat, pigs, 1040 Fat, pig butcher, 1043 Lard, 1065Fat, poultry, 1066Fat, poultry, rendered, 1129Fat, camels, 1160Fat,other camelids, 1168 Oils, fats of animal nes, 1221 Lard stearine oil,1222 Degras, 1225 Tallow, 1243 Fat, nes, prepared
FDI inward flows - Agriculture, hunting, forestry, fishing (current
USD)Inflows of foreign direct investment (FDI) in agriculture, hunting,forestry, and fishing.
Source: Foreign agriculture investment database
Owner: UNCTAD
FDI inward flows- Agriculture, hunting,forestry, fishing + Food,bev-erages, tobacco (current USD)
Inflows of foreign direct investment (FDI) in agriculture, hunting,forestry, and fishing + food, beverages, tobacco.
Source: Foreign agriculture investment database
Owner: UNCTAD
FDI inward flows - Food, beverages, tobacco (current USD)
Inflows of foreign direct investment (FDI) in food, beverages, to-bacco.
Source: Foreign agriculture investment database
Owner: UNCTAD
138
8/12/2019 FAO Statistical Yearbook 2014 Near East and North Africa Food and Agriculture
http://slidepdf.com/reader/full/fao-statistical-yearbook-2014-near-east-and-north-africa-food-and-agriculture 155/174
8/12/2019 FAO Statistical Yearbook 2014 Near East and North Africa Food and Agriculture
http://slidepdf.com/reader/full/fao-statistical-yearbook-2014-near-east-and-north-africa-food-and-agriculture 156/174
Forest area (ha)
Forest area is the land spanning more than 0.5 hectares with treeshigher than 5 metres and a canopy cover of more than 10 percent,or trees able to reach these thresholds in situ. It does not includelandthat is predominantly underagricultural or urbanland use. For-est is determined both by the presence of trees and the absence of other predominant land uses. The trees should be able to reach aminimum height of 5 metres (m) in situ. Areas under reforestationthat have not yet reached but are expected to reach a canopy cover
of 10 percent and a tree height of 5 m are included, as are tem-porarily unstocked areas, resulting from human intervention or nat-ural causes, which are expected to regenerate. Includes: areas withbamboo and palms provided that height and canopy cover criteriaare met; forest roads, firebreaks and other small open areas; forestin national parks, nature reserves and other protected areas suchas those of specific scientific, historical, cultural or spiritual inter-est; windbreaks, shelterbelts and corridors of trees with an area of more than 0.5 ha and width of more than 20 m; plantations primar-ily used for forestry or protective purposes, such as: rubber-woodplantations and cork, oak stands. Excludes: tree stands in agricul-tural production systems, for example in fruit plantations and agro-forestry systems. The term also excludes trees in urban parks andgardens.
Source: FAO, Statistics Division (FAOSTAT)
Owner: FAO
Freshwater Fish
Default composition: 1501 Frwtr Diad F, 1502 Frwtr Fz Whl, 1503Frwtr Fillet, 1504 Frwtr Fz Flt, 1505 Frwtr Cured, 1506 FrwtrCanned, 1507 Frwtr Pr nes, 1508 Frwtr Meals
Fruit harvested area (ha)
See ’Fruit, excluding melons’ and ’Crop area’.
Source: FAO, Statistics Division (FAOSTAT)
Owner: FAO
Fruit production, excluding melons (tonnes)
See ’Fruit, excluding melons’ and ’Crop production’.
Source: FAO, Statistics Division (FAOSTAT)
Owner: FAO
Fruit yield (hg/ha)
See ’Fruit, excluding melons’ and ’Crop yield’.
Source: FAO, Statistics Division (FAOSTAT)
Owner: FAO
Fruit, citrus nes
Including inter alia: bergamot (Citrus bergamia); citron (C. medicavar. cedrata); chinotto (C. myrtifolia); kumquat (Fortunellajaponica).Some minor varieties of citrus are used primarily in the preparationof perfumes and soft drinks.
Fruit, excluding melons
Fruit Crops consist of fruits and berries that, with few exceptions,are characterized by their sweet taste. Nearly all are permanentcrops, mainly from trees, bushes and shrubs, as well as vines andpalms. Fruits and berries grow on branches, stalks or the trunks of plants, usually singly, butsometimesgrouped in bunches or clusters(e.g. bananas and grapes). Commercial crops are cultivated in plan-tations, but significant quantities of fruits are also collected fromscattered plants that may or may not be cultivated.
Fruit, fresh nes
Including inter alia: azarole (Crataegus azarolus); babaco (Car-ica pentagona); elderberry (Sambucus nigra); jujube (Zizyphus ju-juba); litchi (nephelium litchi); loquat (Eriobotrya japonica); med-lar (Mespilus germanica); pawpaw (Asimina triloba); pomegranate(Punica granatum); prickly pear (Opuntia ficus-indica); rose hips(Rosa spp.); rowanberry (Sorbus aucuparia); service-apple (Sorbus
domestica); tamarind (Tamarindus indica); tree-strawberry (Arbutusunedo). Other fresh fruit that are not identified separately becauseof their minor relevance at the international level. Because of theirlimited local importance, some countries report fresh fruit underthis heading that are classified separately by FAO.
GDP (current US$)
GDP at purchaser’s prices is the sum of gross value added by all res-ident producers in the economy plus any product taxes and minusany subsidies not included in the value of the products. It is cal-culated without making deductions for depreciation of fabricatedassets or for depletion and degradation of natural resources. Dataare in current U.S. dollars. Dollar figures for GDP are converted fromdomestic currencies using single year official exchange rates. For afew countries where the official exchange rate does not reflect the
rate effectively applied to actual foreign exchange transactions, analternative conversion factor is used.
Source: World Bank (WDI)
Owner: World Bank national accounts data, and OECD National Ac-counts data files.
GINI index
Gini index measures the extent to which the distribution of income(or, in some cases, consumption expenditure) among individuals orhouseholds within an economy deviates from a perfectly equal dis-tribution. A Lorenz curve plots the cumulative percentages of totalincome received against the cumulative number of recipients, start-ing with the poorest individual or household. The Gini index mea-sures the area between the Lorenz curve and a hypothetical line of
absolute equality, expressed as a percentage of the maximum areaunder the line. Thus a Gini index of 0 represents perfect equality,while an index of 100 implies perfect inequality.
Source: World Bank (WDI)
Owner: World Bank, Development Research Group. Data are basedon primary household survey data obtained from government sta-tistical agencies and World Bank country departments. Data forhigh-income economies are from the Luxembourg Income Studydatabase. For more information and methodology, please see Pov-calNet (http://iresearch.worldbank.org/PovcalNet/index.htm).
Global 5-Year running mean land-ocean temperature index (degreeCelsius)
Global 5-years running mean land-ocean temperature index, with
base period 1951-1980.Source: NASA
Owner: Hansen et al. 2007
Global annual mean land-ocean temperature index (degree Celsius)
Global annual mean land-ocean temperature index, with base pe-riod 1951-1980.
Source: NASA
Owner: Hansen et al. 2006
Global annual mean land-ocean temperature index, low latitudes23.6N-23.6S (degree Celsius)
Global annual mean land-ocean temperature index, low latitudes
23.6N-23.6S with base period 1951-1980.Source: NASA
Owner: Hansen et al. 2009
Global annual mean land-ocean temperature index, northern lati-tudes 90N-23.6N (degree Celsius)
Global annual mean land-ocean temperature index, northern lati-tudes 90N-23.6N with base period 1951-1980.
Source: NASA
Owner: Hansen et al. 2008
Global annual mean land-ocean temperature index, southern lati-tudes 23.6S-90S (degree Celsius)
Global annual mean land-ocean temperature index, southern lati-tudes 23.6S-90S with base period 1951-1980.
Source: NASA
Owner: Hansen et al. 2010
140
8/12/2019 FAO Statistical Yearbook 2014 Near East and North Africa Food and Agriculture
http://slidepdf.com/reader/full/fao-statistical-yearbook-2014-near-east-and-north-africa-food-and-agriculture 157/174
METADATA
GNI per capita, Atlas method (current US$)
GNI per capita (formerly GNP per capita) is the gross national in-come, converted to U.S. dollars using the World Bank Atlas method,divided by the midyear population. GNIis thesum of value added byall resident producers plus any product taxes (less subsidies) not in-cludedin the valuationof outputplus netreceipts of primary income(compensation of employees and property income) from abroad.GNI, calculated in national currency, is usually converted to U.S. dol-lars at official exchange rates for comparisons across economies, al-
though an alternative rate is used when the official exchange rate isjudged to diverge by an exceptionally large margin from therate ac-tually applied in international transactions. To smooth fluctuationsin pricesand exchangerates, a special Atlas methodof conversionisused by the World Bank. This applies a conversion factor that aver-ages theexchange rate fora given year andthe twopreceding years,adjusted for differences in rates of inflation between the country,and through 2000, the G-5 countries (France, Germany, Japan, theUnited Kingdom, and the United States). From2001, thesecountriesinclude the Euro area, Japan, the United Kingdom, and the UnitedStates.
Source: World Bank (WDI)
Owner: World Bank national accounts data, and OECD National Ac-counts data files.
Goats
Includes Hircus, Ibex, Nubiana, Pyrenaica, Tibetana, Kashmir andAngora.
Government expenditure
Data presented on government expenditure refers to Core Areas of Government Functions Relevant to the Agriculture Sector based onthe Classification of Functions of Government (COFOG) as outlinedin the IMF’s Government Finance Statistics Manual, 2001 (GFSM2001). COFOG is essential for making international comparisonsof the extent to which governments are involved in economic andsocial functions because it avoids problems associated with organi-zational changes in a single government, and problems of organi-zational differences among countries. Statistics on expenditures inagriculture, forestry and fisheries and on environmental protectioncanbe usedto study theeffectiveness of government programs thatsupport an enabling environment for essential public goods withhigh economic and social returns. COFOG provides key aggregatesthat could be used as indicators or measures of results / outcomes.
Government expenditure allocated to agricultural and rural devel-opment
Data on government expenditure on agriculture refers to all non-repayable payments, whether capital or current, requited or not bygovernment for the agricultural and rural development sector.
Grain, mixed
A mixture of cereal species that are sown and harvested together.The mixture wheat/rye is known as meslin, but in trade is usually
classified with wheat.
Grapes
Default composition: 560 Grapes, 561 Raisins, 562 Juice, grape, 563Grapes, must
Gross capital stock (constant 2005 prices)
The estimate of capital stock in agriculture refers to a value thatis attached to the total physical capital capacity available for re-peated use in the production of other goods, in existence at specificpoint in time in the economy of agriculture sector. The estimates of investment in agriculture have indirectly been derived by the FAOFAO, Statistics Division using physical data on livestock, tractors,irrigated land and land under permanent crops etc., and the aver-age prices for the year 1995. These data enabled the derivation of the capital stock in agriculture which is the gross, and the annualchange in the latter is taken to reflect investment in agriculture.
Source: FAO, Statistics Division (FAOSTAT)
Owner: FAO
Gross capital stock, land development (constant 2005 prices)
See ’Gross capital stock (constant 2005 prices)’.
Source: FAO, Statistics Division (FAOSTAT)
Owner: FAO
Gross capital stock, livestock fixed assets (constant 2005 prices)
See ’Gross capital stock (constant 2005 prices)’.
Source: FAO, Statistics Division (FAOSTAT)
Owner: FAO
Gross capital stock, livestock inventory (constant 2005 prices)
See ’Gross capital stock (constant 2005 prices)’.
Source: FAO, Statistics Division (FAOSTAT)
Owner: FAO
Gross capital stock, machinery & equipment (constant 2005 prices)
See ’Gross capital stock (constant 2005 prices)’.
Source: FAO, Statistics Division (FAOSTAT)
Owner: FAO
Gross capital stock, plantation crops (constant 2005 prices)See ’Gross capital stock (constant 2005 prices)’.
Source: FAO, Statistics Division (FAOSTAT)
Owner: FAO
Gross capital stock, structures for livestock (constant 2005 prices)
See ’Gross capital stock (constant 2005 prices)’.
Source: FAO, Statistics Division (FAOSTAT)
Owner: FAO
Groundnut Oil
Default composition: 244 Oil, groundnut
Health expenditure, total (percent of GDP)Total health expenditure is the sum of public and private health ex-penditure. It covers the provision of health services (preventive andcurative), family planning activities, nutrition activities, and emer-gency aid designated for health but does not include provision of water and sanitation.
Source: World Bank (WDI)
Owner: World Health Organization National Health Accountdatabase (see http://apps.who.int/nha/database for the most recentupdates).
Honey, natural
Honey produced by bees (Apis mellifera) or by other insects.
Import of forest products (USD)Forest materials for commercial use.
Source: FAO, Statistics Division (FAOSTAT)
Owner: FAO
Import of roundwood (m3)
See ’Roundwood’.
Source: FAO, Statistics Division (FAOSTAT)
Owner: FAO
Import value index (2004-2006 = 100)
Value indices represent the change in the current values of Importc.i.f. (cost, insurance and freight) all expressed in US dollars. Forcountries which report import values on an f.o.b. (free on board)basis, these are adjusted to approximate c.i.f. values (by a standardfactor of 112 percent).
Source: FAO, Statistics Division (FAOSTAT)
Owner: FAO
141
8/12/2019 FAO Statistical Yearbook 2014 Near East and North Africa Food and Agriculture
http://slidepdf.com/reader/full/fao-statistical-yearbook-2014-near-east-and-north-africa-food-and-agriculture 158/174
Imports of fish (US$)
Value of imports of fish in current US$ (data reported include fish,molluscs, crustaceans, and miscellaneous aquatic animals but ex-cluding production for marine mammals, crocodiles, corals, pearls,sponges and aquatic plants, miscellaneous aquatic animal productsand fish waste).
Source: Fisheries and Aquaculture Department (Fishery and Aqua-culture statistics)
Owner: FAO
Income share held by highest 20% (percent)
Percentage share of income or consumption is the share that ac-crues to subgroups of population indicated by deciles or quintiles.Percentageshares by quintile maynot sumto 100 because of round-ing.
Source: World Bank (WDI)
Owner: World Bank, Development Research Group. Data are basedon primary household survey data obtained from government sta-tistical agencies and World Bank country departments. Data forhigh-income economies are from the Luxembourg Income Studydatabase. For more information and methodology, please see Pov-calNet (http://iresearch.worldbank.org/PovcalNet/index.htm).
Income share held by lowest 20% (percent)
Percentage share of income or consumption is the share that ac-crues to subgroups of population indicated by deciles or quintiles.Percentageshares by quintile maynot sumto 100 because of round-ing.
Source: World Bank (WDI)
Owner: World Bank, Development Research Group. Data are basedon primary household survey data obtained from government sta-tistical agencies and World Bank country departments. Data forhigh-income economies are from the Luxembourg Income Studydatabase. For more information and methodology, please see Pov-calNet (http://iresearch.worldbank.org/PovcalNet/index.htm).
Industrial roundwood
The wood removed (volume of roundwood under bark) for produc-tion of goods and services other than energy production (wood-fuel). It represents the sum of: sawlogs and veneer logs; pulp-wood, round and split; and other industrial roundwood. Seehttp://www.fao.org/forestry/62283/en/ for further information.
Industrial roundwood production (m3)
See ’Industrial roundwood’ and ’Production’.
Source: FAO, Statistics Division (FAOSTAT)
Owner: FAO
Industrial water withdrawal, share of total water withdrawal (per-cent)
Industrial water withdrawal as percentage of total water with-drawal.
Source: Land and Water Division (AQUASTAT)
Owner: FAO
Industry, value added (percent of GDP)
Industry corresponds to ISIC divisions 10-45 and includes manu-facturing (ISIC divisions 15-37). It comprises value added in mining,manufacturing (also reported as a separate subgroup), construction,electricity, water, and gas. Value added is the net output of a sectorafter adding up all outputs and subtracting intermediate inputs. Itis calculated without making deductions for depreciation of fabri-cated assets or depletion and degradation of natural resources. Theorigin of value added is determined by the International StandardIndustrial Classification (ISIC), revision 3. Note: For VAB countries,
gross value added at factor cost is used as the denominator.
Source: World Bank (WDI)
Owner: World Bank national accounts data, and OECD National Ac-counts data files.
Internally displaced persons, total
Internally Displaced Persons (IDPs) arepeople or groupsof individu-als who have been forced to leave their homes or places of habitualresidence, in particular as a result of, or in order to avoid the effectsof armed conflict, situations of generalized violence, violations of human rights or natural- or human-made disasters, and who havenot crossed an international border. For purposes of UNHCR’s statis-tics, this population only includes conflict-generated IDPs to whomthe Office extends protection and/or assistance. As such, UNHCR
statistics do not provide a comprehensive picture of global internaldisplacement. Moreover, UNHCR’s IDP statistics are not necessar-ily representative of the entire IDP population in a given countrybut are exclusively limited to the ones who are protected and/or as-sisted by the Office. For global IDP estimates, consult the InternalDisplacement Monitoring Centre (IDMC) of the Norwegian RefugeeCouncil (NRC) website. The 2007 IDP population category also in-cludespeople in IDP-like situations. This sub-category is descriptivein nature and includes groups of persons who are inside their coun-tryof nationalityor habitualresidence andwho face protection riskssimilar to those of IDPs butwho, forpractical or other reasons, couldnot be reported as such.
Source: Statistical Online Population Database
Owner: UNHCR
Irrigation potential (ha)
Area of land which is potentially irrigable. Country/regional stud-ies assess this value according to different methods. For example,some consider only land resources, others consider land resourcesplus water availability, others include economical aspects in theirassessments (such as distance and/or difference in elevation be-tween the suitable land and the available water) or environmentalaspects, etc. If available, this information is given in the individualcountry profiles. The figure includes the area already under agricul-tural water management .
Source: Land and Water Division (AQUASTAT)
Owner: FAO
Jute and jute-likeWhite jute (Corchorus capsularis); red jute, tossa (C. olitorius). Tradedata cover raw or processed jute (but not spun), tow and waste, yarnwaste and garnetted stock and may include jute-like fibres.
Jute and jute-like harvested area (ha)
See ’Jute and jute-like’ and ’Crop area’.
Source: FAO, Statistics Division (FAOSTAT)
Owner: FAO
Jute and jute-like production (tonnes)
See ’Jute and jute-like’ and ’Crop production’.
Source: FAO, Statistics Division (FAOSTAT)Owner: FAO
Jute and jute-like yield (hg/ha)
See ’Jute and jute-like’ and ’Crop yield’.
Source: FAO, Statistics Division (FAOSTAT)
Owner: FAO
Labor participation rate, female (share of female population ages15+)
Labor force participation rate is the proportion of the populationages 15 andolderthat is economicallyactive: allpeople whosupplylabor for the production of goods and services during a specified
period.
Source: World Bank (WDI)
Owner: International Labour Organization, Key Indicators of theLabour Market database.
142
8/12/2019 FAO Statistical Yearbook 2014 Near East and North Africa Food and Agriculture
http://slidepdf.com/reader/full/fao-statistical-yearbook-2014-near-east-and-north-africa-food-and-agriculture 159/174
METADATA
Labor participation rate, male (share of male population ages 15+)
Labor force participation rate is the proportion of the populationages 15 andolderthat is economically active: allpeople whosupplylabor for the production of goods and services during a specifiedperiod.
Source: World Bank (WDI)
Owner: International Labour Organization, Key Indicators of theLabour Market database.
Land area (sq. km)
Land area is a country’s total area, excluding area under inlandwaterbodies, national claims to continental shelf, and exclusive economiczones. In most cases the definition of inland water bodies includesmajor rivers and lakes.
Source: World Bank (WDI)
Owner: Food and Agriculture Organization, electronic files and website.
Life expectancy at birth, total (years)
Life expectancy at birth indicates the number of years a newborninfant would live if prevailing patterns of mortality at the time of itsbirth were to stay the same throughout its life.
Source: World Bank (WDI)Owner: UNPD World Population Prospects 2010
Literacy rate, adult female (percent of females ages 15 and above)
Adult literacy rate is the percentage of people ages 15 and abovewho can, with understanding, read and write a short, simple state-ment on their everyday life.
Source: World Bank (WDI)
Owner: United Nations Educational, Scientific, and Cultural Organi-zation (UNESCO) Institute for Statistics.
Livestock
Animals such as cattle and sheep which are kept on the holding orotherwise for agricultural production.
Maize
Zea mays Corn, Indian corn, mealies. A grain with a high germ con-tent. At the national level, hybrid and ordinary maize should bereported separately owing to widely different yields and uses. Usedlargely for animal feed and commercial starch production.
Male employment, total
Employees are people who work for a public or private employerand receive remuneration in wages, salary, commission, tips, piecerates, or pay in kind.
Source: World Bank
Owner: International Labour Organization, Key Indicators of theLabour Market database.
Mammal species, threatened
Mammal species are mammals excluding whales and porpoises.Threatened speciesare the number of species classified by the IUCNas endangered, vulnerable, rare, indeterminate, out of danger, or in-sufficiently known.
Source: World Bank (WDI)
Owner: United Nations Environmental Program and the World Con-servation Monitoring Centre, and International Union for Conserva-tion of Nature, Red List of Threatened Species.
Manufactures Unit Value (MUV) (index)
The MUV is a composite index of prices for manufactured exportsfrom the fifteen major developed and emerging economies to low-
and middle-income economies, valued in U.S. dollars. For the MUV(15) index, unit value indexes in local currency for each countryare converted to U.S. dollars using market exchange rates and arecombined using weights determined by the share of each coun-try’s exports in G15 exports to low- and middle-income countries.
The shares are calculated using SITC revision 3 Manufactures ex-ports data from UN COMTRADE in 2005, the base year. The pri-mary manufacturing prices index source is OECD’s Domestic Pro-ducer Price Index (PPI) for manufacturing. Whenever PPI is notavailable, export price indexes or the export unit values are usedas proxies. The countries and relative weights (in parentheses)are: Brazil (2.95%), Canada (0.93%), China (11.79%), France (5.87%),Germany (13.29%), India (1.77%), Italy (6.07%), Japan (16.70%),Mexico (0.93%), South Africa (0.75%), South Korea (10.95%), Spain
(2.30%), Thailand (2.51%), United Kingdom (3.50%), and UnitedStates (19.68%).
Source: World Bank
Owner: World Bank, Development Prospects Group; Historical USGDP deflator: US Department of Commerce.
Manure applied to soils, total emissions in CO2eq (gigagrams)
Greenhouse gas (GHG) emissions from manure applied to soils con-sist of nitrous oxide gas from nitrogen additions to managed soilsfrom treated manure.
Source: FAO, Statistics Division (FAOSTAT)
Owner: FAO
Manure left on pasture, total emissions in CO2eq (gigagrams)Greenhouse Gases (GHG) emissions data from manure left on pas-ture consist of nitrous oxidegas from nitrogen additionsto managedsoils from grazing livestock.
Source: FAO, Statistics Division (FAOSTAT)
Owner: FAO
Manure management, total emissions in CO2eq (gigagrams)
Greenhouse gas (GHG) emissions from manure management con-sist of methane and nitrous oxide gases from aerobic and anaerobicdecomposition processes.
Source: FAO, Statistics Division (FAOSTAT)
Owner: FAO
Marine protected areas (share of territorial waters)
Marine protected areas are areas of intertidal or subtidal terrain–and overlying water and associated flora and fauna and historicaland cultural features–that have been reserved by law or other ef-fective means to protect part or all of the enclosed environment.
Source: World Bank (WDI)
Owner: United Nations Environmental Program and the World Con-servation Monitoring Centre, as compiled by the World ResourcesInstitute, based on data from national authorities, national legisla-tion and international agreements.
Meat, ass
Including frog legs, marine mammals, etc. Some countries include-under this heading meats that arelistedabove, but which arenotre-ported separately. Fresh, chilled or frozen.
Meat, beef, preparations
Meat and offal (o/t liver) that are boiled, steamed, grilled,fried,roasted or otherwise cooked. Includes prepared meals thatcontain morethan 20% of meat and offal by weight.
Meat, total
Meat from animals, fresh, chilled or frozen, with bone in. All datashown relate to total meat production from both commercial andfarm slaughter. Data are given in terms of dressed carcass weight,i.e. excluding offals and slaughter fats.
Meat, total (tonnes)See ’Meat, total’ and ’Production’.
Source: FAO, Statistics Division (FAOSTAT)
Owner: FAO
143
8/12/2019 FAO Statistical Yearbook 2014 Near East and North Africa Food and Agriculture
http://slidepdf.com/reader/full/fao-statistical-yearbook-2014-near-east-and-north-africa-food-and-agriculture 160/174
8/12/2019 FAO Statistical Yearbook 2014 Near East and North Africa Food and Agriculture
http://slidepdf.com/reader/full/fao-statistical-yearbook-2014-near-east-and-north-africa-food-and-agriculture 161/174
METADATA
ODA received for forestry sector (US$)
See ’Official Development Assistance’
Source: FAO, Statistics Division
Owner: The EAA dataset is compiled from OECD (as given includedin the OECD internet home-page), DAC Reports, Annual Reports of the World Bank and data received from other organizations on re-gional development. The data are processed by following a seriesof steps such as analyses, including systematic checking and verifi-cations at various stages for enhancing the quality of the data priorto dissemination on FAOSTAT.
Official Development Assistance
The concessional (Official Development Assistance, ODA) and non-Concessional commitments made by bilateral and multilateraldonors to developing countries is referred to as ’External Assistanceto Agriculture’. The term ’Agriculture’ is generally used in the broadsense to cover agriculture, forestry, fisheries, land and water, agro-industries, environment, manufacturing of agricultural inputs andmachinery, regional and river development, and rural development.The narrow concept of agriculture has also been defined to lookat the contribution made to develop agriculture in a strict sense.This includes assistance provided for the development of agricul-ture (cropand animal husbandry), forestry, fisheries (including train-ing, extension and research) and development of land and waterresources.
Oil-bearing crops
Oil-bearing crops or oil crops include both annual (usually calledoilseeds) and perennial plants whose seeds, fruits or mesocarp andnuts are valued mainly for the edible or industrial oils that are ex-tracted from them. They include: Castor oil seed, Coconuts, Cot-tonseed, Groundnuts, with shell, Hempseed, Jojoba Seeds, KariteNuts (Sheanuts), Linseed, Melonseed, Mustard seed, Oil palm fruit,Oilseeds, Nes, Olives, Palm kernels, Palm oil, Poppy seed, Rape-seed, Safflower seed, Seed cotton, Sesame seed, Soybeans, Sun-flower seed and Tung Nuts.
Oil-bearing crops harvested area, share of world total
See ’Oil-bearing crops’ and ’Crop area’.Source: FAO, Statistics Division (FAOSTAT)
Owner: FAO
Oil-bearing crops production (tonnes)
See ’Oil-bearing crops’ and ’Crop production’.
Source: FAO, Statistics Division (FAOSTAT)
Owner: FAO
Oil-bearing crops yield (hg/ha)
See ’Oil-bearing crops’ and ’Crop yield’.
Source: FAO, Statistics Division (FAOSTAT)
Owner: FAO
Oil, maize
Extracted from germ by pressure or by solvents.
Oil, palm
Obtained from the mesocarp of the fruit of the oil palm by pressure,and also by solvent from the residues of the pressure extraction.
Oilcrops Oil, Other
Default composition: 263 Karite nuts (sheanuts), 265 Castor oilseed, 275 Tung nuts, 277 Jojoba seed, 280 Safflower seed, 296Poppy seed, 299 Melonseed, 305 Tallowtree seed, 310 Kapok fruit,311 Kapokseed in shell, 312 Kapokseed shelled, 333 Linseed, 336Hempseed, 339 Oilseeds nes, 343 Flour, oilseeds
Oilseeds exports (tonnes)
Exports (volume) of oilseeds.
Source: FAO, Statistics Division (FAOSTAT)
Owner: FAO
Oilseeds imports (tonnes)
Imports (volume) of oilseeds.
Source: FAO, Statistics Division (FAOSTAT)
Owner: FAO
Oilseeds nes
Includes inter alia: beech nut (Fagus sylvatica);(Aleurites
moluccana);(Carapa guineensis);(Croton tiglium);(Bassialatifolia);(Guizotia abyssinica);(Licania rigida);(Perillafrutescens);(Jatropha curcas);(Shorea robusta);(Pongamiaglabra);(Astrocaryum spp.). Other oilseeds, oleaginous fruitsand nuts that are not identified separately because of their minorrelevance at the international level. Because of their limited localimportance, some countries report commodities under this headingthat are classified individually by FAO. Also included under thiscode are tea seeds, grape pips and tomato seeds from which oil isextracted.
Olive Oil
Default composition: 261 Oil, olive, virgin, 274 Oil, olive residues
Organic water pollutant (BOD) emissions (kg per day per worker)Emissions per worker are total emissions of organic waterpollutantsdivided by the number of industrial workers. Organic water pollu-tants are measured by biochemical oxygen demand, which refers tothe amount of oxygen that bacteria in water will consume in break-ing down waste. This is a standard water-treatment test for thepresence of organic pollutants.
Source: World Bank (WDI)
Owner: World Bank and UNIDO’s industry database.
Organic water pollutant (BOD) emissions (kg per day)
Emissions of organic water pollutants are measured by biochemicaloxygen demand, which refers to the amount of oxygen that bacteriain water will consume in breaking down waste. This is a standard
water-treatment test for the presence of organic pollutants.Source: World Bank (WDI)
Owner: 1998 study by Hemamala Hettige, Muthukumara Mani,and David Wheeler, "Industrial Pollution in Economic Development:Kuznets Revisited" (available at www.worldbank.org/nipr). The datawere updated by the World Bank’s Development Research Group us-ing the same methodology as the initial study.
Other land (ha)
Other land is the land not classified as Agricultural land and For-est area. It includes built-up and related land, barren land, otherwooded land, etc.
Source: FAO, Statistics Division (FAOSTAT)
Owner: FAO
Other naturally regenerated forest (ha)
Naturally regenerated forest is forest predominantly composed of trees established through natural regeneration. Other naturally re-generated forest is forest where there are clearly visible indicationsof human activities.
Source: Global Forest Resources Assessment
Owner: FAO
Others and stateless, total
Population of concern to UNHCR, others and stateless.
Source: Statistical Online Population Database
Owner: UNHCR
Palmkernel Oil
Default composition: 258 Oil, palm kernel
145
8/12/2019 FAO Statistical Yearbook 2014 Near East and North Africa Food and Agriculture
http://slidepdf.com/reader/full/fao-statistical-yearbook-2014-near-east-and-north-africa-food-and-agriculture 162/174
Paper and paperboard
Thesum of Paperand Paperboard,Newsprint, Paperand Paperboardother than Newsprint, Printing and Writing Paper, Other Paper andPaperboard, Household and Sanitary Paper, Wrapping and Packag-ingPaper and Paperboard andOther Paperand Paperboard NotElse-whereSpecified. See http://www.fao.org/forestry/62283/en/ for fur-ther information.
Paper and paperboard production (tonnes)See ’Paper and paperboard’ and ’Production’.
Source: FAO, Statistics Division (FAOSTAT)
Owner: FAO
Part of equipped area actually irrigated (percent)
Percent of area equipped for irrigation that is actually irrigated inany given year, expressed in percentage. Irrigated land that is cul-tivated more than once a year is counted only once.
Source: Land and Water Division (AQUASTAT)
Owner: FAO
Pastry
All baked products excluding those listed under bread. Pastry prod-
ucts may contain ingredients other than wheat flour, such as milk,eggs, sugar, honey, starch, fats, fruit, seeds, etc.
Per Capita food production variability (index)
Per capita food production variability corresponds to the variabilityof the net food production value in constant 2004-2006 1000 Inter-national $ (Net Food PIN) dividedby the population number as fromUN 2010 estimates. Variability is based on thetrendof the NetFoodPIN per capita over the period 1985 to 2010 and corresponds to thestandard deviation of the deviation from the trend over a period of 5 years. Missing values for Eritrea/Ethiopia, former Yugoslavia andCaucasus countries for 1985 to 1992 are estimated backward usingtheshareof thevalueof food production of each country in thetotalvalue of the region it belonged to prior to 1992.
Source: FAO, Statistics Division
Owner: FAO
Per Capita food supply variability (index)
Food supply variability correspond to the variable Food supply totalin kcal/person/day as estimated by the FAO Statistic Division. Thevariability is obtained as the standard deviation over 5 years of thedeviation from the trend of per capita food supply observed duringthe period 1990 to 2010.
Source: FAO, Statistics Division
Owner: FAO
Per capita supply
Estimates of per capita food supplies available for human consump-tion during the reference period in terms of quantity, caloric value,
protein and fat content. Calorie supplies are reported i n kilocalories(1 calorie = 4.19 kilojoules). Per capita supplies in terms of productweight are derived from the total supplies available for human con-sumption (i.e. Food) by dividing the quantities of Food by the totalpopulation actually partaking of the food supplies during the ref-erence period, i.e. the present in-area (de facto) population withinthe present geographical boundaries of the country. In other words,nationals living abroad during the reference period are excluded,but foreigners living in the country are included. Adjustments aremade wherever possible for part-time presence or absence, suchas temporary migrants, tourists and refugees supported by specialschemes (if it has not been possible to allow for the amounts pro-vided by such schemes under imports). In almost all cases, thepopulation figures used are the mid-year estimates published bythe United Nations Population Division. Per capita supply figuresshown in the commodity balances therefore represent only the av-
erage supply available for the population as a whole and do notnecessarily indicate what is actually consumed by individuals. Evenif they are taken as approximation to per capita consumption, it isimportant to note that the amount of food actually consumed maybe lower than the quantity shown here, depending on the degree
of losses of edible food and nutrients in the household, e.g. dur-ing storage, in preparation and cooking etc. In many cases com-modities are not consumed in the primary form in which they arepresented in the commodity balance, e.g. cereals enter the house-hold mainly in processed form like flour, meal, husked or milledrice. To take this fact into account, the caloric value, the protein andfat content shown against primary commodities in the commoditybalances have been derived by applying the appropriate food com-position factors to the quantities of the processed commodities and
not by multiplying the quantities shown in the commodity balancewith the food composition factors relating to primary commodities.
Percent of adults who are underweight (percent)
Percentage of adults who are underweight, as defined by a BodyMass Index (BMI)below the international referencestandardof 18.5.To calculate an individual’s BMI, weight and height data are need.The BMI is weight (kg) divided by squared height (m).
Source: FAO, Statistics Division
Owner: World Health Organization (WHO)
Percent of arable land equipped for irrigation (percent)
Percent of arable land equipped for irrigation. The indicator is cal-culated on 3 year averages.
Source: FAO, Statistics DivisionOwner: FAO
Percent of paved roads over total roads (percent)
Paved roads are those surfaced with crushed stone (macadam) andhydrocarbon binder or bituminized agents, with concrete, or withcobblestones, as a percentage of allthe country’s roads, measured inlength. Regional aggregates are computed as weighted average us-ingtotal road network as weight. Because of thelow coverage, miss-ing values were interpolated using linear trend between two pointsor extrapolated backward and forward using the closest point. Notethat regional aggregates were calculated only if countries for whichdata were available represented more than 70% of the total lenghtof road network of the region they belong to.
Source: FAO, Statistics Division
Owner: International Road Federation, World Road Statistics andelectronic files, except where noted.
Percentage of children under 5 years of age who are stunted (per-cent)
Percentage of stunting (height-for-age less than -2 standard devia-tions of the WHO Child Growth Standards median) among childrenaged 0-5 years.
Source: FAO, Statistics Division
Owner: World Health Organization (WHO)
Percentage of children under 5 years of age who are underweight(percent)
Percentage of underweight (weight-for-age less than -2 standarddeviations of theWHO Child GrowthStandards median) among chil-dren aged 0-5 years.
Source: FAO, Statistics Division
Owner: World Health Organization (WHO)
Percentage of children under 5 years of age who are wasted (per-cent)
Percentage of (weight-for-height less than -2 standard deviations of the WHO Child Growth Standards median) among children aged 0-5years.
Source: FAO, Statistics Division
Owner: World Health Organization (WHO)
Percentage of population with no reasonable access to improvedsanitation facilities (percent)
Access to improved sanitation facilities refers to the percentage of the population with at least adequate access to excreta disposal fa-cilities that can effectively prevent human, animal, and insect con-tact with excreta. Improved facilities range from simple but pro-tected pit latrines to flush toilets with a sewerage connection. To
146
8/12/2019 FAO Statistical Yearbook 2014 Near East and North Africa Food and Agriculture
http://slidepdf.com/reader/full/fao-statistical-yearbook-2014-near-east-and-north-africa-food-and-agriculture 163/174
METADATA
be effective, facilities must be correctly constructed and properlymaintained.
Source: FAO, Statistics Division
Owner: World Health Organization (WHO)
Percentage of population with no reasonable access to improved water sources (percent)
Access to an improved water source refers to the percentage of the
population with reasonable access to an adequate amount of waterfrom an improved source, such as a household connection, publicstandpipe, borehole, protected well or spring, and rainwater collec-tion. Unimproved sources include vendors, tanker trucks, and un-protected wells and springs. Reasonable access is defined as theavailability of at least 20 liters a person a day from a source withinone kilometer of the dwelling.
Source: FAO, Statistics Division
Owner: World Health Organization (WHO)
Permanent crops (ha)
Permanent crops is the land cultivated with long-term crops whichdo nothave to be replantedfor several years (such as cocoa andcof-fee); land under trees and shrubs producing flowers, such as roses
and jasmine; and nurseries (except those for forest trees, whichshould be classified under "forest"). Permanent meadows and pas-tures are excluded from land under permanent crops.
Source: FAO, Statistics Division (FAOSTAT)
Owner: FAO
Permanent meadows and pastures (ha)
Permanent meadows and pastures is the land used permanently(five years or more) to grow herbaceous forage crops, either cul-tivated or growing wild (wild prairie or grazing land). Data are ex-pressed in 1000 hectares.
Source: FAO, Statistics Division (FAOSTAT)
Owner: FAO
Pesticide consumptionData refer to quantities of pesticides applied to crops and seeds inthe agriculture sector. Figures are generally expressed in terms of active ingredients. Data are expressed in tonnes (t). However, due tosome country reporting practices, thedata maybe reported by: con-sumption in formulated product (including diluents and adjuvants);sales; distribution or imports for use in the agricultural sector. Inthese cases it is specified in the country notes.
Pesticides
Pesticides refer to insecticides, fungicides, herbicides, disinfectantsand any substance or mixture of substances intended for prevent-ing, destroying or controlling any pest, including vectors of humanor animal disease, unwanted species of plants or animals causingharm during or otherwise interfering with the production, process-ing, storage, transport or marketing of food, agricultural commodi-ties, wood and wood products or animal feedstuffs, or substanceswhich may be administered to animals for the control of insects,arachnids or other pests in or on their bodies. The term includessubstances intended for use as a plant growth regulator, defoliant,desiccant or agent for thinning fruit or preventing the prematurefall of fruit, and substances applied to crops either before or afterharvest to protect the commodity from deterioration during storageand transport.
Phosphate fertilizers consumption (tonnes of P205 total nutrients)
Phosphate fertilizers consumption.
Source: FAO, Statistics Division (FAOSTAT)
Owner: FAO
Pig meat
Meat, with the bone in, of domestic or wild pigs (e.g. wildboars),whether fresh, chilled or frozen.
Pig meat per capita (tonne/cap)
See ’Pig meat’ and ’Production’.
Source: FAO, Statistics Division (FAOSTAT)
Owner: FAO
Pigs
Domestic pig (Sus domestica); wild boar (Sus scrofa). See 866. Ex-cludes non-domesticated wild boars.
Plant species (higher), threatened
Higher plants are native vascular plant species. Threatened speciesarethe numberof species classifiedby theIUCN as endangered, vul-nerable, rare, indeterminate, out of danger, or insufficiently known.
Source: World Bank (WDI)
Owner: United Nations Environmental Program and the World Con-servation Monitoring Centre, and International Union for Conserva-tion of Nature, Red List of Threatened Species.
Planted forest (ha)
Planted forest is forest predominantly composed of trees estab-lished through planting and/or deliberate seeding.
Source: Global Forest Resources Assessment
Owner: FAO
Political stability and absence of violence/terrorism (index)
Political stability and absence of violence measures perceptions of the likelihood that the government will be destabilized or over-thrown by unconstitutional or violent means, including politically-motivated violence and terrorism.
Source: FAO, Statistics Division
Owner: WorldWide Governance Indicators
Population ages 0-14, total
Population with age between 0 and 14 years.
Source: United Nations Population Division
Owner: United Nations Population Division, World PopulationProspects.
Population ages 15-64, total
Population with age between 15 and 64 years.
Source: United Nations Population Division
Owner: United Nations Population Division, World PopulationProspects.
Population ages 65 and above, total
Population with age above 65.
Source: United Nations Population Division
Owner: United Nations Population Division, World PopulationProspects.
Population density (people per sq. km of land area)
Population density is midyear population divided by land area insquare kilometers. Population is based on the de facto definitionof population, which counts all residents regardless of legal statusor citizenship–except for refugees not permanently settled in thecountry of asylum, who are generally considered part of the popu-lation of their country of origin. Land area is a country’s total area,excluding area under inland water bodies, national claims to conti-nental shelf, and exclusive economic zones. In most cases the defi-nition of inland water bodies includes major rivers and lakes.
Source: World Bank (WDI)
Owner: Food and Agriculture Organization and World Bank popula-tion estimates.
Population living in areas where elevation is below 5 meters (shareof total population)
Population below 5mis thepercentageof thetotal population livingin areas where the elevation is 5 meters or less.
Source: World Bank (WDI)
Owner: Center for International Earth Science Information Network(CIESIN), Place II dataset.
147
8/12/2019 FAO Statistical Yearbook 2014 Near East and North Africa Food and Agriculture
http://slidepdf.com/reader/full/fao-statistical-yearbook-2014-near-east-and-north-africa-food-and-agriculture 164/174
Population, total
Total population is based on the de facto definition of population,which counts all residents regardless of legal status or citizenship–except for refugees not permanently settled in the country of asy-lum, who are generally considered part of the population of theircountry of origin. The values shown are midyear estimates.
Source: United Nations Population Division
Owner: United Nations Population Division, World Population
Prospects.
Potash fertilizers consumption (tonnes of K20 total nutrients)
Potash fertilizers consumption.
Source: FAO, Statistics Division (FAOSTAT)
Owner: FAO
Potassium Sulphate
Is a white crystalline salt and contains 48 to 52 per cent potash(K20). Potassium sulfate can be extracted from naturally occurringbrines or by the decomposition of potassium chloride with sulfuricacid.
Poultry birds (heads)
Domesticated birds for commercial use.
Source: FAO, Statistics Division (FAOSTAT)
Owner: FAO
Poultry meat
Poultry birds, fresh, chilled or frozen, with bone in. All data shownrelate to total meat production from both commercial and farmslaughter. Data are given in terms of dressed carcass weight, i.e. ex-cluding offals and slaughter fats. Poultry meat includes Bird meat,nes, Chicken meat, Duck meat, Goose and guinea fowl meat andTurkey meat.
Poultry meat (tonnes)
See ’Poultry meat’ and ’Production’.
Source: FAO, Statistics Division (FAOSTAT)
Owner: FAO
Poverty gap at $1.25 a day PPP (percent)
Poverty gap is the mean shortfall from the poverty line (countingthe nonpoor as having zero shortfall), expressed as a percentage of the poverty line. This measure reflects the depth of poverty as wellas its incidence.
Source: World Bank (WDI)
Owner: World Bank, Development Research Group. Data are basedon primary household survey data obtained from government sta-tistical agencies and World Bank country departments. Data forhigh-income economies are from the Luxembourg Income Studydatabase. For more information and methodology, please see Pov-calNet (http://iresearch.worldbank.org/PovcalNet/index.htm).
Poverty gap at $2 a day PPP (percente)
Poverty gap is the mean shortfall from the poverty line (countingthe nonpoor as having zero shortfall), expressed as a percentage of the poverty line. This measure reflects the depth of poverty as wellas its incidence.
Source: World Bank (WDI)
Owner: World Bank, Development Research Group. Data are based
on primary household survey data obtained from government sta-tistical agencies and World Bank country departments. Data forhigh-income economies are from the Luxembourg Income Studydatabase. For more information and methodology, please see Pov-calNet (http://iresearch.worldbank.org/PovcalNet/index.htm).
Poverty gap at national poverty line (percent)
Poverty gap at national poverty line is the mean shortfall from thepoverty line (counting the nonpoor as having zero shortfall) as apercentage of the poverty line. This measure reflects the depth of poverty as well as its incidence.
Source: World Bank (WDI)
Owner: Global Poverty Working Group. Data are based on WorldBank’s country poverty assessments and country Poverty Reduction
Strategies.
Poverty gap at rural poverty line (percent)
Poverty gap at rural poverty line is the mean shortfall from thepoverty line (counting the nonpoor as having zero shortfall) as apercentage of the national rural poverty line. This measure reflectsthe depth of poverty as well as its incidence.
Source: World Bank (WDI)
Owner: Global Poverty Working Group. Data are based on WorldBank’s country poverty assessments and country Poverty ReductionStrategies.
Poverty headcount ratio at $1.25 a day PPP (percent of population)
Population below $1.25 a day is the percentage of the population
living on less than $1.25 a day at 2005 international prices. As aresultof revisions in PPPexchange rates, povertyrates forindividualcountries cannot be compared with poverty rates reported in earliereditions.
Source: World Bank (WDI)
Owner: World Bank, Development Research Group. Data are basedon primary household survey data obtained from government sta-tistical agencies and World Bank country departments. Data forhigh-income economies are from the Luxembourg Income Studydatabase. For more information and methodology, please see Pov-calNet (http://iresearch.worldbank.org/PovcalNet/index.htm).
Poverty headcount ratio at $2 a day PPP (percent of population)
Population below $2 a day is the percentage of the population liv-ing on less than $2.00 a day at 2005 international prices. As a re-sult of revisions in PPP exchange rates, poverty rates for individualcountries cannot be compared with poverty rates reported in earliereditions.
Source: World Bank (WDI)
Owner: World Bank, Development Research Group. Data are basedon primary household survey data obtained from government sta-tistical agencies and World Bank country departments. Data forhigh-income economies are from the Luxembourg Income Studydatabase. For more information and methodology, please see Pov-calNet (http://iresearch.worldbank.org/PovcalNet/index.htm).
Poverty headcount ratio at national poverty line (percent of popu-lation)
Poverty headcount ratio at national poverty line (% of population).
Source: World Bank (WDI)Owner: Global Poverty Working Group. Data are based on WorldBank’s country poverty assessments and country Poverty ReductionStrategies.
Prevalence of food inadequacy (percent)
It is conceptually analogous to the prevalence of undernourishment, butcalculated setting thecaloric thresholdto a higherlevel, by us-ing a Physical Activity Level (PAL) coefficient of 1.75, as opposed to1.55. It measures the percentage of the population that is at risk of not covering the food requirements associated with normal phys-ical activity, and therefore including also those who, even thoughcannot be considered chronically undernourished, are likely beingconditioned in their economic activity by insufficient food. Whilethe PoU is an estimator of chronic food deprivation ("hunger"), thisnew estimator is a less conservative measure of food inadequacy inthe population. The indicator is calculated on 3 year averages.
Source: FAO, Statistics Division
Owner: FAO
148
8/12/2019 FAO Statistical Yearbook 2014 Near East and North Africa Food and Agriculture
http://slidepdf.com/reader/full/fao-statistical-yearbook-2014-near-east-and-north-africa-food-and-agriculture 165/174
8/12/2019 FAO Statistical Yearbook 2014 Near East and North Africa Food and Agriculture
http://slidepdf.com/reader/full/fao-statistical-yearbook-2014-near-east-and-north-africa-food-and-agriculture 166/174
Rice harvested area (ha)
See ’Rice (paddy)’ and ’Crop area’.
Source: FAO, Statistics Division (FAOSTAT)
Owner: FAO
Rice yield (hg/ha)
See ’Rice (paddy)’ and ’Crop yield’.
Source: FAO, Statistics Division (FAOSTAT)
Owner: FAO
Road density (percent)
Road density is the ratio of the length of the country’s total roadnetwork to the country’s land area. The road network includes allroads in the country: motorways, highways, main or national roads,secondary or regional roads, and other urban and rural roads. Re-gional aggregates are computed as weighted average using surfacearea as weight. Because of the low coverage, missing values wereinterpolated using linear trend between two points or extrapolatedbackward and forward using the closest point. Note that regionalaggregates were calculated only if countries for which data wereavailable represented more than 70% of the total area of the regionthey belong to.
Source: FAO, Statistics Division
Owner: International Road Federation, World Road Statistics andelectronic files, except where noted.
Root and tuber crops
Roots and tubers are plants yielding starchy roots, tubers, rhizomes,corms and stems. They include Potatoes, Sweet Potatoes, Cassava,Yautia (Cocoyam), Taro (Cocoyam), Yams, Roots And Tubers Nes.
Root and tuber crops production (tonnes)
See ’Root and tuber crops’ and ’Crop production’.
Source: FAO, Statistics Division (FAOSTAT)
Owner: FAO
Roots and tubers harvested area (ha)
See ’Root and tuber crops’ and ’Crop area’.
Source: FAO, Statistics Division (FAOSTAT)
Owner: FAO
Roots and tubers yield (hg/ha)
See ’Root and tuber crops’ and ’Crop yield’.
Source: FAO, Statistics Division (FAOSTAT)
Owner: FAO
Roots and tubers, nes
Including inter alia: arracacha (Arracacoa xanthorrhiza); arrow-root (Maranta arundinacea); chufa (Cyperus esculentus); sago palm(Metroxylon spp.); oca and ullucu (Oxalis tuberosa and Ullucustuberosus); yam bean, jicama (Pachyrxhizus erosus, P. angulatus);mashua (Tropaeolum tuberosum); Jerusalem artichoke, topinambur(Helianthus tuberosus). Other tubers, roots or rhizomes, fresh, thatare not identified separately because of their minor relevance atthe international level. Because of their limited local importance,some countries report roots and tubers under this commodity head-ing that are classified individually by FAO.
Roundwood
All roundwood felled or otherwise harvested and removed. It com-prises all wood obtained from removals, i.e. the quantities removedfrom forests and from trees outside the forest, including wood re-covered from natural, felling and logging losses during the period,calendar year or forest year. It includes: all wood removed with orwithout bark, including wood removed in its round form, or split,roughly squared or in other form (e.g. branches, roots, stumps and
burls (where these are harvested) and wood that is roughly shapedor pointed. In the production statistics, it represents the sum of:wood fuel, including wood for charcoal; sawlogs and veneer logs;pulpwood, round and split; and other industrial roundwood. Seehttp://www.fao.org/forestry/62283/en/ for further information.
Roundwood production (m3)
See ’Roundwood’ and ’Production’.
Source: FAO, Statistics Division (FAOSTAT)
Owner: FAO
Rural population, total
Rural population refers to people living in rural areas as defined bynational statistical offices.
Source: United Nations Population Division
Owner: United Nations Population Division, World UrbanizationProspects.
Safflower seed
Carthamus tinctorius. Valued mainly for its oil. Minor uses includeas a human food and as poultry feed.
Safflower seed
Glycine soja. The most important oil crop. Also widely consumedas a bean and in the form of various derived products because of itshigh protein content, e.g. soya milk, meat, etc.
SawnwoodWood that has been produced from both domestic and importedroundwood, either by sawing lengthways or by a profile-chippingprocess and that, with a few exceptions, exceeds 5 mm in thick-ness. It includes: planks, beams, joists, boards, rafters, scantlings,laths, boxboards, sleepers and "lumber", etc., in the following forms:unplaned, planed, grooved, tongued, fingerjointed, chamfered, rab-beted, V-jointed, beaded, etc. It excludes: wooden flooring. Seehttp://www.fao.org/forestry/62283/en/ for further information.
Sawnwood production (m3)
See ’Sawnwood’ and ’Production’.
Source: FAO, Statistics Division (FAOSTAT)
Owner: FAO
School enrollment, primary, female (percent net)
Net enrollment ratio is the ratio of children of official school agebased on the International Standard Classification of Education1997 who are enrolled in school to the population of the corre-sponding official school age. Primary education provides childrenwith basic reading, writing, and mathematics skills along with anelementary understanding of such subjects as history, geography,natural science, social science, art, and music.
Source: World Bank (WDI)
Owner: United Nations Educational, Scientific, and Cultural Organi-zation (UNESCO) Institute for Statistics.
School enrollment, primary, male (percent net)
Net enrollment ratio is the ratio of children of official school age
based on the International Standard Classification of Education1997 who are enrolled in school to the population of the corre-sponding official school age. Primary education provides childrenwith basic reading, writing, and mathematics skills along with anelementary understanding of such subjects as history, geography,natural science, social science, art, and music.
Source: World Bank (WDI)
Owner: United Nations Educational, Scientific, and Cultural Organi-zation (UNESCO) Institute for Statistics.
Services, etc., value added (percent of GDP)
Services correspond to ISIC divisions 50-99 and they include valueadded in wholesale and retail trade (including hotels and restau-rants), transport, and government, financial, professional, and per-sonal services such as education, health care, and real estate ser-
vices. Also included are imputed bank service charges, import du-ties, and any statistical discrepancies noted by national compilersas well as discrepancies arising from rescaling. Value added is thenet output of a sector after adding up all outputs and subtractingintermediate inputs. It is calculated without making deductions for
150
8/12/2019 FAO Statistical Yearbook 2014 Near East and North Africa Food and Agriculture
http://slidepdf.com/reader/full/fao-statistical-yearbook-2014-near-east-and-north-africa-food-and-agriculture 167/174
METADATA
depreciation of fabricated assets or depletion and degradation of natural resources. The industrial origin of value added is deter-mined by the International Standard Industrial Classification (ISIC),revision 3. Note: For VAB countries, gross value added at factor costis used as the denominator.
Source: World Bank (WDI)
Owner: World Bank national accounts data, and OECD National Ac-counts data files.
Sesameseed Oil
Default composition: Oil, sesame
Share of energy supply derived from cereals, roots and tubers (per-cent)
Energy supply (in kcal/caput/day) provided by cereals, roots and tu-bers divided by total Dietary Energy Supply(DES) (in kcal/caput/day)calculated from the correponding categories in the FAOSTAT FoodBalance Sheets. As other indicators based on Food Balance Sheetsdata, it is calculated on 3 year averages, to reduce the errors due tothe difficulties in recording annual stock changes.
Source: FAO, Statistics Division
Owner: FAO
Share of feedstocks used in bioenergy production (percent)
Estimated shares of commodity globally used in non-food sectors,including industrial renewable materials and bioenergy.
Source: FAO, Statistics Division
Owner: FAO
Share of food expenditure of the poor (percent)
Proportion of food consumption over total consumption (food andnon-food) for the lowest income quintile of the population.
Source: FAO, Statistics Division
Owner: FAO
Share of freshwater resources withdrawn by agriculture (percent)
Water withdrawn for irrigation in a given year, expressed in percentof the total actual renewable water resources (TRWR_actual). Thisparameter is an indication of the pressure on the renewable waterresources caused by irrigation.
Source: Land and Water Division (AQUASTAT)
Owner: FAO
Sheep
Ovis spp.. See ’Cattle’. Includes Uriel, Argali, Bighorn, Karakul andAstrakhan.
Sheep and goat meat (tonnes)
See ’Sheep’, ’Goats’, ’Meat, total’, and ’Production’.
Source: FAO, Statistics Division (FAOSTAT)
Owner: FAO
Sheep and goats (heads)
See ’Sheep’ and ’Goats’.
Source: FAO, Statistics Division (FAOSTAT)
Owner: FAO
Skim milk and buttermilk production, dry (tonnes)
See ’Milk excluding butter’ and ’Milk production (tonnes)’.
Source: FAO, Statistics Division (FAOSTAT)
Owner: FAO
Soyabean Oil
Default composition: Oil, soybean
Sugar
Beta vulgaris var. altissima. In some producing countries, marginalquantities areconsumed, eitherdirectlyas food or in the preparationof jams.
Sugar (Raw Equivalent)
Default composition: 158 Sugar, cane, raw, centrifugal, 159 Sugar,beet, raw, centrifugal, 162 Sugar Raw Centrifugal, 164Sugar refined,168 Sugar confectionery, 171 Sugar flavoured
Sugar and honey exports (tonnes)
Exports (volume) of sugar and honey.
Source: FAO, Statistics Division (FAOSTAT)
Owner: FAO
Sugar and honey imports (tonnes)
Imports (volume) of sugar and honey.
Source: FAO, Statistics Division (FAOSTAT)
Owner: FAO
Sugar beet
Beta vulgaris var. altissima. In some producing countries, marginalquantities areconsumed, eitherdirectly as food or in thepreparationof jams.
Sugar caneSaccharum officinarum. In some producing countries, marginalquantities of sugar cane are consumed, either directly as food orin the form of juice.
Sugar harvested area (ha)
See ’Sugar’ and ’Crop area’.
Source: FAO, Statistics Division (FAOSTAT)
Owner: FAO
Sugar production (tonnes)
See ’Sugar’ and ’Crop production’.
Source: FAO, Statistics Division (FAOSTAT)
Owner: FAO
Sugar yield (hg/ha)
See ’Sugar’ and ’Crop yield’.
Source: FAO, Statistics Division (FAOSTAT)
Owner: FAO
Sunflower seed
Helianthus annuus. Valued mainly for its oil. Minor uses include asa human food and as feed for birds.
Sunflowerseed Oil
Default composition: Oil, sunflower
Synthetic fertilizers, total emissions in CO2eq (gigagrams)
Greenhouse gas (GHG) emissions from synthetic fertilizers consistof nitrous oxide gas from synthetic nitrogen additions to managedsoils.
Source: FAO, Statistics Division (FAOSTAT)
Owner: FAO
Telephone lines (per 100 people)
Telephone lines are fixed telephone lines thatconnect a subscriber’sterminal equipment to the public switched telephone network andthat have a port on a telephone exchange. Integrated services digi-tal network channels ands fixed wireless subscribers are included.
Source: World Bank (WDI)
Owner: International Telecommunication Union, World Telecommu-nication/ICT Development Report and database, and World Bank es-timates.
151
8/12/2019 FAO Statistical Yearbook 2014 Near East and North Africa Food and Agriculture
http://slidepdf.com/reader/full/fao-statistical-yearbook-2014-near-east-and-north-africa-food-and-agriculture 168/174
Terrestrial protected areas (share of total land area)
Terrestrial protected areas are totally or partially protected areas of at least1,000 hectares thatare designatedby national authorities asscientific reserves with limited public access, national parks, naturalmonuments, nature reserves or wildlife sanctuaries, protected land-scapes, and areas managed mainly for sustainable use. Marine ar-eas, unclassified areas, littoral (intertidal) areas, and sites protectedunder local or provincial law are excluded.
Source: World Bank (WDI)
Owner: United Nations Environmental Program and the World Con-servation Monitoring Centre, as compiled by the World ResourcesInstitute, based on data from national authorities, national legisla-tion and international agreements.
Total area equipped for irrigation (ha)
Area equipped to provide water (via irrigation) to crops. It includesareas equipped for full/partial control irrigation, equipped lowlandareas, and areas equipped for spate irrigation.
Source: Land and Water Division (AQUASTAT)
Owner: FAO
Total female population of concern to UNHCR, total
See ’Total population of concern to UNHCR, total’.
Source: Statistical Online Population Database
Owner: UNHCR
Total forest (ha)
Sum of ’Other naturally regenerated forest (ha)’, ’Primary forest (ha)’,and ’Planted forest (ha)’.
Source: Global Forest Resources Assessment
Owner: FAO
Total land area (ha)
Land area is the total area of the country excluding area under in-land water bodies. Possible variations in the data may be due to
updating and revisions of the country data and not necessarily toany change of area. Data are expressed in 1 000 hectares.
Source: FAO, Statistics Division (FAOSTAT)
Owner: FAO
Total male population of concern to UNHCR, total
See ’Total population of concern to UNHCR, total’.
Source: Statistical Online Population Database
Owner: UNHCR
Total meat exports (tonnes)
Exports (volume) of total meat.
Source: FAO, Statistics Division (FAOSTAT)
Owner: FAO
Total meat imports (tonnes)
Imports (volume) of total meat.
Source: FAO, Statistics Division (FAOSTAT)
Owner: FAO
Total ODA received (US$)
See ’Official Development Assistance’
Source: FAO, Statistics Division
Owner: The EAA dataset is compiled from OECD (as given includedin the OECD internet home-page), DAC Reports, Annual Reports of
the World Bank and data received from other organizations on re-gional development. The data are processed by following a seriesof steps such as analyses, including systematic checking and verifi-cations at various stages for enhancing the quality of the data priorto dissemination on FAOSTAT.
Total pesticides use (tonnes)
Pesticides refer to insecticides, fungicides, herbicides, disinfectantsand any substance or mixture of substances intended for prevent-ing, destroying or controlling any pest, including vectors of humanor animal disease, unwanted species of plants or animals causingharm during or otherwise interfering with the production, process-ing, storage, transport or marketing of food, agricultural commodi-ties, wood and wood products or animal feedstuffs, or substanceswhich may be administered to animals for the control of insects,
arachnids or other pests in or on their bodies. The term includessubstances intended for use as a plant growth regulator, defoliant,desiccant or agent for thinning fruit or preventing the prematurefall of fruit, and substances applied to crops either before or afterharvest to protect the commodity from deterioration during stor-age and transport. Pesticides use data refers to quantities of pesti-cides applied to crops and seeds in the agriculture sector. Figuresare expressed in metric tons of active ingredients. However, due tosome country reporting practices, the data may be reported by: usein formulated product; sales; distribution or imports for use in theagriculturalsector. In these cases it is specified in thecountry notes.
Source: FAO FAO, Statistics Division
Owner: FAO
Total population of concern to UNHCR, total
Population of concern to UNHCR includes: refugees, asylum-seekers, returned refugees, internally displaced persons (IDPs) pro-tected/assisted by UNHCR, returned IDPs, stateless persons, andothers of concern to UNHCR.
Source: Statistical Online Population Database
Owner: UNHCR
Total public agricultural expenditures in R & D (2005 PPP US$)
Total public agricultural expenditures in R & D.
Source: ASTI
Owner: ASTI 2012, Eurostat 2012, OECD, 2012, andvarious country-level secondary sources (see for morei nformati on on data sources and estimations onhttp://www.asti.cgiar.org/pdf/CountrySourcesEstimations.pdf).Agricultural GDP from World Bank (2012).
Total public agricultural research expenditures (share of agriculturalGDP)
Total public agricultural research expenditures as share of agricul-tural GDP.
Source: ASTI
Owner: ASTI 2012, Eurostat 2012, OECD, 2012, andvarious country-level secondary sources (see for morei nformati on on data sources and estimations onhttp://www.asti.cgiar.org/pdf/CountrySourcesEstimations.pdf).Agricultural GDP from World Bank (2012).
Total refugees, total
In UNHCR statistics, refugees include individuals recognized un-der the 1951 Convention relating to the Status of Refugees; its1967Protocol; the 1969 OAU Convention Governing the Specific As-pects of Refugee Problems in Africa; those recognized in accordancewith the UNHCR Statute; individuals granted complementary formsof protection; or, those enjoying ’temporary protection’. The 2007refugee population category also includes people in a refugee-likesituation, most of who were previously included in the Others of concern group. This sub-category is descriptive in nature and in-cludes groups of persons who are outside their country or territoryof origin and who face protection risks similar to those of refugees,but for whom refugee status has, for practical or other reasons, notbeen ascertained.
Source: Statistical Online Population Database
Owner: UNHCR
Total share of freshwater resources withdrawn (percent)
Total freshwater withdrawn in a given year, expressed in percentageof the actual total renewable water resources (TRWR_actual). This
152
8/12/2019 FAO Statistical Yearbook 2014 Near East and North Africa Food and Agriculture
http://slidepdf.com/reader/full/fao-statistical-yearbook-2014-near-east-and-north-africa-food-and-agriculture 169/174
METADATA
parameter is an indication of the pressure on the renewable waterresources.
Source: Land and Water Division (AQUASTAT)
Owner: FAO
Total water withdrawal (m3 /yr)
Annual quantity of water withdrawn for agricultural, industrial andmunicipal purposes. It includes renewable freshwater resources
as well as potential over-abstraction of renewable groundwater orwithdrawal of fossil groundwater and potential use of desalinatedwater or treated wastewater. It does not include in stream uses,which are characterized by a very low net consumption rate, suchas recreation, navigation, hydropower, inland capture fisheries, etc.
Source: Land and Water Division (AQUASTAT)
Owner: FAO
Total water withdrawal per capita (m3 /yr/person)
Total annual amount of water withdrawn per capita.
Source: Land and Water Division (AQUASTAT)
Owner: FAO
Trade (percent of GDP)
Trade is the sum of exports and imports of goods and services mea-sured as a share of gross domestic product.
Source: World Bank (WDI)
Owner: World Bank national accounts data, and OECD National Ac-counts data files.
Treenuts harvested area (ha)
See ’Treenuts’ and ’Crop area’.
Source: FAO, Statistics Division (FAOSTAT)
Owner: FAO
Treenuts production (tonnes)
See ’Treenuts’ and ’Crop production’.
Source: FAO, Statistics Division (FAOSTAT)Owner: FAO
Treenuts yield (hg/ha)
See ’Treenuts’ and ’Crop yield’.
Source: FAO, Statistics Division (FAOSTAT)
Owner: FAO
Urban population, total
Urban population refers to people living in urban areas as definedby national statistical offices.
Source: United Nations Population Division
Owner: United Nations Population Division, World UrbanizationProspects.
Value of agricultural exports
Value of agricultural exports should be reported in national cur-rency, US dollars or other currency. Export values are mostly re-ported as FOB. In the FAOSTAT database export values are ex-pressed in thousand US dollars.
Value of agricultural imports
Value of agricultural imports should be reported in national cur-rency, US dollars or other currency. Import values are mostly re-ported as CIF. In theFAOSTAT database import values areexpressedin thousand US dollars.
Value of food imports over total merchandise exports (percent)
Value of food (excl. fish) imports over total merchandise exports.The indicator is calculated on 3 year averages.
Source: FAO, Statistics Division
Owner: FAO
Value of food production per capita (I$/cap)
The totalvalue of AnnualFood Production, as estimatedby FAO andpublished by FAOSTAT in International Dollars (I$) divided by thetotal population. It provides a cross country comparable measureof the relative economic size of the food production sector in thecountry. The indicator is calculated on 3 year averages.
Source: FAO, Statistics Division
Owner: FAO
Vegetable production (tonnes)
See ’Vegetable, including melons’ and ’Crop production’.
Source: FAO, Statistics Division (FAOSTAT)
Owner: FAO
Vegetable, including melons
Vegetables, as classified in this group, are mainly annual plants cul-tivated as field and garden crops in the open and under glass, andused almost exclusively for food. Vegetables grown principally foranimal feed or seed should be excluded. Certain plants, normallyclassified as cereals and pulses, belong to this group when har-vested green, such as green maize, green peas, etc. This groupingdiffers from international trade classifications for vegetables in thatit includes melons and watermelons, whichare normally considered
to be fruit crops. But, whereas fruit crops are virtually all perma-nent crops, melons and watermelons are similar to vegetables inthat they are temporary crops. Chillies and green peppers are in-cluded in this grouping when they are harvested for consumptionas vegetables and not processed into spices. FAO production datafor green peas and green beans refer to the total weight includ-ing pods, although some countries report on a shelled weight basis.The weight of the pods ranges from 40 to 50 percent for peas to upto 70 percent for broad beans. Area data on small vegetable gar-dens are often omitted in agricultural surveys, although productionestimates may be reported. Trade data for fresh vegetables also in-clude chilled vegetables, meaning the temperature of the productshas been reduced to around 0C without the products being frozen.
Vegetables harvested area (ha)
See ’Vegetable, including melons’ and ’Crop area’.Source: FAO, Statistics Division (FAOSTAT)
Owner: FAO
Vegetables yield (hg/ha)
See ’Vegetable, including melons’ and ’Crop yield’.
Source: FAO, Statistics Division (FAOSTAT)
Owner: FAO
Vegetables, fresh nes
Including inter alia: bamboo shoots (Bambusa spp.); beets, chards(Beta vulgaris); capers (Capparis spinosa); cardoons (Cynara cardun-culus); celery (Apium graveolens); chervil (Anthriscus cerefolium);cress (Lepidium sativum); fennel (Foeniculum vulgare); horseradish
(Cochlearia armoracia); marjoram, sweet (Majorana hortensis); oys-ter plant (Tragopogon porrifolius); parsley (Petroselinum crispum);parsnips (Pastinaca sativa); radish (Raphanus sativus); rhubarb(Rheum spp.); rutabagas, swedes (Brassica napus); savory (Saturejahortensis); scorzonera (Scorzonera hispanica); sorrel (Rumex ace-tosa); soybean sprouts tarragon (Artemisia dracunculus); watercress(Nasturtiumofficinale). Othervegetables thatare not identified sep-arately because of their minor relevance at the international level.Because of their limited local importance, some countries reportvegetables under this heading that are classified individually byFAO.
Waste
Amount of the commodity in question lost through wastage (waste)during the year at all stages between the level at which produc-
tion is recorded and the household, i.e. storage and transportation.Losses occurring before and during harvest are excluded. Wastefrom both edible and inedible parts of the commodity occurring inthe household is also excluded. Quantities lost during the transfor-mation of primary commodities into processed products are taken
153
8/12/2019 FAO Statistical Yearbook 2014 Near East and North Africa Food and Agriculture
http://slidepdf.com/reader/full/fao-statistical-yearbook-2014-near-east-and-north-africa-food-and-agriculture 170/174
into account in the assessment of respective extraction/conversionrates. Distribution wastes tend to be considerable in countries withhot humid climate, difficult transportation and inadequate storageor processing facilities. This applies to the more perishable food-stuffs, and especially to those which have to be transported orstored for a long time in a tropical climate. Waste is often esti-mated as a fixed percentage of availability, the latter being definedas production plus imports plus stock withdrawals.
Water pollution, chemical industry (share of total BOD emissions)
Industry shares of emissions of organic water pollutants refer toemissions from manufacturing activities as defined by two-digit di-visions of the International Standard Industrial Classification (ISIC),revision 2: chemicals (35). Emissions of organic water pollutantsare measured by biochemical oxygen demand, which refers to theamount of oxygen that bacteria in water will consume in breakingdown waste. This is a standard water-treatment test for the pres-ence of organic pollutants.
Source: World Bank (WDI)
Owner: 1998 study by Hemamala Hettige, Muthukumara Mani,and David Wheeler, "Industrial Pollution in Economic Development:Kuznets Revisited" (available at www.worldbank.org/nipr). The datawere updated by the World Bank’s Development Research Group us-ing the same methodology as the initial study.
Water pollution, clay and glass industry (share of total BOD emis-sions)
See ’Water pollution, chemical industry (% of total BOD emissions)’.
Source: World Bank (WDI)
Owner: See ’Water pollution, chemical industry (% of total BODemissions)’.
Water pollution, food industry (share of total BOD emissions)
See ’Water pollution, chemical industry (% of total BOD emissions)’.
Source: World Bank (WDI)
Owner: See ’Water pollution, chemical industry (% of total BODemissions)’.
Water pollution, metal industry (share of total BOD emissions)
See ’Water pollution, chemical industry (% of total BOD emissions)’.
Source: World Bank (WDI)
Owner: See ’Water pollution, chemical industry (% of total BODemissions)’.
Water pollution, other industry (share of total BOD emissions)
See ’Water pollution, chemical industry (% of total BOD emissions)’.
Source: World Bank (WDI)
Owner: See ’Water pollution, chemical industry (% of total BODemissions)’.
Water pollution, paper and pulp industry (share of total BOD emis-sions)
See ’Water pollution, chemical industry (% of total BOD emissions)’.
Source: World Bank (WDI)
Owner: See ’Water pollution, chemical industry (% of total BODemissions)’.
Water pollution, textile industry (share of total BOD emissions)
See ’Water pollution, chemical industry (% of total BOD emissions)’.
Source: World Bank (WDI)
Owner: See ’Water pollution, chemical industry (% of total BODemissions)’.
Water pollution, wood industry (share of total BOD emissions)
See ’Water pollution, chemical industry (% of total BOD emissions)’.
Source: World Bank (WDI)
Owner: See ’Water pollution, chemical industry (% of total BODemissions)’.
Water resources per capita (m3 /yr/person)
Total annual internal renewable water resources per inhabitant.
Source: Land and Water Division (AQUASTAT)
Owner: FAO
Wheat
Triticum spp.: common (T. aestivum) durum (T. durum) spelt (T.spelta). Common anddurumwheatare themain types. Among com-
mon wheat, the main varieties are spring and winter, hard and soft,and red and white. At the national level, different varieties shouldbe reported separately, reflecting their different uses. Used mainlyfor human food.
Wheat harvested area (ha)
See ’Wheat’ and ’Crop area’.
Source: FAO, Statistics Division (FAOSTAT)
Owner: FAO
Wheat production (tonnes)
See ’Wheat’ and ’Crop production.
Source: FAO, Statistics Division (FAOSTAT)
Owner: FAO
Wheat yield (hg/ha)
See ’Wheat’ and ’Crop yield’.
Source: FAO, Statistics Division (FAOSTAT)
Owner: FAO
Wood-based panels
The wood-based panels category is an aggregate category. Inthe production and trade statistics, it represents the sum of:veneer sheets, plywood, particle board, and fibreboard. Seehttp://www.fao.org/forestry/62283/en/ for further information.
Wood-based panels production (m3)
See ’Wood-based panels’ and ’Production’.
Source: FAO, Statistics Division (FAOSTAT)Owner: FAO
Wood pulp
Wood pulp is a fibrous material prepared from pulpwood, woodchips, particles, residues or recovered paper by mechanical and/orchemical process for further manufacture into paper, paperboard,fibreboard or other cellulose products. In the production and tradestatistics, it represents the sum of: mechanical wood pulp; semi-chemical wood pulp; chemical wood pulp; and dissolving woodpulp. See http://www.fao.org/forestry/62283/en/ for further infor-mation.
Wood pulp production (tonnes)
See ’Wood pulp’ and ’Production’.
Source: FAO, Statistics Division (FAOSTAT)Owner: FAO
Woodfuel
Roundwood that will be used as fuel for purposes such as cook-ing, heating or power production. It includes: wood harvested frommain stems, branches and other parts of trees (where these are har-vested for fuel) and wood that will be used for charcoal produc-tion (e.g. in pit kilns and portable ovens). The volume of round-wood used in charcoal production, is estimated by using a fac-tor of 6.0 to convert from the weight (MT) of charcoal producedto the solid volume (CUM) of roundwood used in production. Itis reported in cubic metres underbark (i.e. excluding bark). Seehttp://www.fao.org/forestry/62283/en/ for further information.
Woodfuel production (m3)
See ’ Woodfuel’ and ’Production’.
Source: FAO, Statistics Division (FAOSTAT)
Owner: FAO
154
8/12/2019 FAO Statistical Yearbook 2014 Near East and North Africa Food and Agriculture
http://slidepdf.com/reader/full/fao-statistical-yearbook-2014-near-east-and-north-africa-food-and-agriculture 171/174
Bibliography
African Development Bank 2012. The African Economic Outlook: Promoting Youth Employment, OECD publishing.
2013. The African Economic Outlook: Structural Trasformation and Natural Resources, OECD publishing.
Bruinsma, J. 2011. The Resources Outlook: By How Much Do Land, Water and Crop Yields Need to Increase by 2050?, in Looking Ahead in World Food
and Agriculture: Perspectives to 2050 , ed. by Conforti, P. FAO, Rome.
El-Kholi, A., Darwish, T. & Taimeh, A. 2012. Country Study on Status of Land Tenure, Planning and Management in Oriental Near East Countries . FAO/SNO,Cairo.
FAO 2008. Near East Agriculture Towards 2050: Prospects and Challenges, 29th FAO Regional Conference for the Near East, FAO, Rome.
2009. The State of Food and Agriculture 2009 - Livestock in the Balance, FAO, Rome.
2010a. FAO Regional priority framework for the Near East, Thiertieth FAO Regional Conference for the Near East„ FAO, Rome.
2010b. Global Forest Resources Assessment 2010 - Main Report, FAO, Rome.
2010c. The Implications of Soaring Food Prices and the Global Financial and Economic Crisis for Agricultural Development and Food and Nutrition
Security in the Near East , Thiertieth FAO Regional Conference for the Near East„ FAO, Rome.
2011a. Climate Change, Water and Food Security, FAO, Rome.
2011b. The State of Food and Agriculture 2010-11 - Women in Agriculture: Closing the Gender Gap for Development, FAO, Rome.
2011c. The State of Food Insecurity in the World 2011 - How Does International Price Volatility Affect Domestic Economies and Food Security?, FAO,Rome.
2011d. The State of the World’s Land and Water Resources for Food and Agriculture - Managing Systems at Risk, FAO, Rome.
2012a. Actions to Adapt to and Mitigate Climate Change Impacts on Natural Resources: the Case of Fisheries and Aquaculture, Forestry, and Livestock
in the Near East, 31st Regional Conference for the Near East, FAO, Rome.
2012b. State of the World’s Forests 2012 - The Role of Forests in Human History, FAO, Rome.
2012c. The State of Food and Agriculture 2012 - Investing in Agriculture for a Better Future, FAO, Rome.
2012d. The State of Food Insecurity in the World 2012 - Economic growth is necessary but not suffcient to accelerate reduction of hunger and
malnutrition, FAO, Rome.
2012e. The State of World Fisheries and Aquaculture 2012, FAO, Rome.
2012f. World Agriculture: Towards 2030/2050 - The 2012 Revision, FAO, Rome.
2013a. Statistical Analysis of Selected Food and Agricultural Indicators for the Near East, FAO, Rome.
2013b. Statistical Yearbook, FAO, Rome.
2013c. The State of Food and Agriculture 2013 - Food Systems for Better Nutrition, FAO, Rome.
2013d. The State of Food Insecurity in the World 2013 - The Multiple Dimensions of Food Security, FAO, Rome.
FAO/RNE 2012. Proceeding of the workshop on forage production, conservation, and utilization for sustainable livestock production in the Oriental Near East
Sub-Region, Beirut, Lebanon, 13-14 June 2011, FAO/RNE, Cairo.
2013a. Food Security and nutrition in the Southern and Eastern Rim of the Mediterranean Basin, FAO, Cairo.
2013b. Report of the expert consultation meeting on food losses and waste reduction in the Near East region: Towards a regional comprehensive
strategy, Sharm El Sheikh, Egypt, 18-19 December 2012, FAO, Cairo.
IEA 2009. World Energy Outlook 2009 Fact Sheet: Why Is Our Current Pathway Unsustainable?, International Energy Agency (IEA), Paris.
2010. World Energy Outlook 2010, IEA, Paris.
2013. World Energy Outlook 2013, IEA, Paris.
Various years a. Energy Balances of Non-OECD Countries, IEA, Paris.
155
8/12/2019 FAO Statistical Yearbook 2014 Near East and North Africa Food and Agriculture
http://slidepdf.com/reader/full/fao-statistical-yearbook-2014-near-east-and-north-africa-food-and-agriculture 172/174
Various years b. Energy Balances of OECD Countries, IEA, Paris.
Various years c. Energy Statistics of Non-OECD Countries, IEA, Paris.
Various years d. Energy Statistics of OECD Countries, IEA, Paris.
IFAD 2011. Rural Poverty Report 2011 - New Realities, New Challenges: New Opportunities for Tomorrow’s Generation, International Fund for AgriculturalDevelopment (IFAD), Rome.
ILO 2009. Guide to the New Millennium Development Goals Employment Indicators, International Labour Organization (ILO), Geneva.
2012. Global Employment Trends 2012. Preventing a deeper job crisis, ILO, Geneva.
2013. Global Employment Trends 2013 - Recovering from a second jobs dip, ILO, Geneva.
Various years a. Key Indicators of the Labour Market (KILM), ILO, Geneva.
Various years b. Yearbook of Labour Statistics, ILO, Geneva.
IMF Various years . International Financial Statistics Yearbook, International Monetary Fund (IMF), Washington, D.C.
O’Donovan, D. 2008. The Atlas of Health: Mapping the Challenges and Causes of Disease. Earthscan, London.
OECD Various years a. Development Co-operation Report, Organization for Economic Co-operation and Development (OECD), Paris.
Various years b. Geographical Distribution of Financial Flows to Developing Economies, OECD, Paris.
OECD and FAO 2012. Agricultural Outlook 2012-2021, Organisation for Economic Co-operation and Development (OECD) and FAO.
Partnership on Measuring ICT for Development 2008. The Global Information Society: A Statistical View, United Nations, Santiago.
Prakash, A. (ed.) 2011. Safeguarding Food Security in Volatile Global Markets. FAO, Rome.
R CoreTeam 2012.R: A Language and Environment forStatistical Computing, R Foundation for Statistical Computing, Vienna, Austria. ISBN3-900051-07-0.
Schmidhuber, J., Bruinsma, J. & Boedeker, G. 2011. Capital Requirements for Agriculture in Dveloping Countries to 2050, in Looking Ahead in World
Food and Agriculture: Perspectives to 2050 , ed. by Conforti, P. Food and Agriculture Organization.
Schmidhuber, J. and Bruinsma, J. 2011. Investing Towards a World Free of Hunger, Lowering Vulnerability and Enhancing Resilience, in Safeguarding
Food Security in Volatile Global Markets, ed. by Prakash, A. FAO, Rome.
Tanyeri-Aburi, A. & H.Elamin, N. (eds.) 2011. International Investments in Agriculture in the Near East: Evidence from Egypt, Morocco and Sudan . FAO/RNE,
Cairo.
UN 2008a. International Standard Industrial Classification of All Economic Activities, 4th Revision. Statistical Papers Series M, No. 4, Rev. 4, United Nations(UN), New York.
2008b. Kyoto Protocol to theUnited Nations FrameworkConvention on Climate Change,United Nations Framework Convention on Climate Change,New York.
2009a. Copenhagen Accord, United Nations Framework Convention on Climate Change, Copenhagen.
2009b. Fact Sheet: Stepping Up International Action on Climate Change: The Road to Copenhagen, United Nations Framework Convention onClimate Change, New York.
UNDP 2010. Human Development Report - The Real Wealth of Nations: Pathways to HumanDevelopment, United Nations Development Programme (UNDP),New York.
2011. Human Development Report - Sustainability and Equity: A Better Future for All, UNDP, New York.
UNESCO 2009. World Water Development Report 3: Water in a Changing World, UNESCO, Paris.
2010. UNESCO Science Report 2010, UNESCO, Paris.
2011. International Standard Classification of Education, 2011 revision, United Nations Educational, Scientific, and Cultural Organization (UN-ESCO), Paris.
Various years a. EFA Global Monitoring Report, UNESCO, Paris.
Various years b. Global Education Digest, UNESCO, Paris.
UNPD 2011. World Population Prospects: The 2010 Revision, UNPD, United Nations, Department of Economic and Social Affairs, New York.
2013. Trends in Total Migrant Stock: 2013 Revision, United Nations Population Division (UNPD), United Nations, Department of Economic andSocial Affairs, New York.
Various years. World Urbanization Prospects, UNPD, United Nations, Department of Economic and Social Affairs, New York.
van de Steeg, J. & Tibbo, M. 2012. Livestock and Climate Change in the Near East Region: Measures to Adapt to and Mitigate Climate Change. FAO/RNE,Cairo.
156
8/12/2019 FAO Statistical Yearbook 2014 Near East and North Africa Food and Agriculture
http://slidepdf.com/reader/full/fao-statistical-yearbook-2014-near-east-and-north-africa-food-and-agriculture 173/174
BIBLIOGRAPHY
von Cramon-Taubadel, S. and Gustavo, A. and de Haen, H. and Nivyevskyi, O. 2011. Investment in Developing Countries Food and Agriculture - AssessingAgricultural Capital Stocks and Their Impact on Productivity, in Looking Ahead in World Food and Agriculture: Perspectives to 2050 , ed. by Conforti, P.FAO, Rome.
WHO and UNICEF 2012. Progress on Drinking Water and Sanitation, World Health Organization (WHO) and United Nations Children’s Fund (UNICEF),New York.
World Bank 2013. World Development Report 2013: Jobs. Oxford University Press, New York.
Various years . World Development Indicators - Various issues, WB, Washington, D.C.
World Bank and IMF 2012. Global Monitoring Report: Food Prices, Nutrition, and the Millennium Development Goals, World Bankand InternationalMonetaryFund (IMF), Washington, D.C.
157
8/12/2019 FAO Statistical Yearbook 2014 Near East and North Africa Food and Agriculture
http://slidepdf.com/reader/full/fao-statistical-yearbook-2014-near-east-and-north-africa-food-and-agriculture 174/174


