
Fannie Mae and Minority Lending: Assessment and Action … · Fannie Mae and Minority Lending:...
46
, -M- anrue _ae Fannie Mae and Minority Lending: Assessment and Action Plan Presented by: Barry Zigas Senior Vice President, National Housing Impact Division SWRO HCD Advisory Council Dallas, November 16, 2000 CONFIDENTIAL AND PROPRIETARY BUSINESS INFORMATION CONFIDENTIAL TREATMENT REQUESTED 1 FM-FCIC 00171931
Transcript of Fannie Mae and Minority Lending: Assessment and Action … · Fannie Mae and Minority Lending:...

~l-~ , -M-~~~ anrue _ae
Fannie Mae and Minority Lending: Assessment and Action Plan
Presented by: Barry Zigas
Senior Vice President, National Housing Impact Division
SWRO HCD Advisory Council Dallas, November 16, 2000
CONFIDENTIAL AND PROPRIETARY BUSINESS INFORMATION CONFIDENTIAL TREATMENT REQUESTED
1
FM-FCIC 00171931

Overview
• The Challenge of Minority Lending
• Measuring Fannie Mae's Success
• A Commitment to Minority Lending: The American Dream Commitment
• New HUD Housing Goals
2
• Thank you for giving me a chance to join you today. Mike asked me to share with you Fannie Mae's perspective on the challenges and opportunities of minority lending, as well as a brief overview of the newly finalized regulatory housing goals promulgated by RUD.
• The presentation has four distinct segments. I will begin by reviewing the data on the barriers to minority homeownership.
• I will then share some facts both about Fannie Mae's success in tackling the challenge of minority lending, and in looking at recent market trends and our performance when compared to the market.
• I want to share with you some specific information about the main initiatives we are taking under our American Dream Commitment to expand minority homeownership and Fannie Mae's role in expanding it, and close with a brief summary of the new HUD regulations.
CONFIDENTIAL AND PROPRIETARY BUSINESS INFORMATION CONFIDENTIAL TREATMENT REQUESTED
2
FM-FCIC 00171932

The Challenges for Minority Lending
CONFIDENTIAL AND PROPRIETARY BUSINESS INFORMATION CONFIDENTIAL TREATMENT REQUESTED
3
3
FM-FCIC 00171933

Black and Hispanic Homeownership Rates Lag Far Behind Whites
80%
70%
60%
50%
40%
30%
20%
10%
0% Whites
Source: U.S. Census Bureau, Housing Vacancy Survey
Blacks
1999
CONFIDENTIAL AND PROPRIETARY BUSINESS INFORMATION CONFIDENTIAL TREATMENT REQUESTED
Hispanics
4
4
FM-FCIC 00171934

Differences in Median Incomes
$ 50,000
40,000
30,000
20,000
10,000
o Whites Blacks Hispanics
I [J Homeowners IIIIIIII Renters I
Source: Joint Center for Housing Studies' tabulations from Federal Reserve Survey of Consumer Finances, 1998.
- Fannie Mae is committed to working with the entire housing industry to close these gaps. But the challenges are significant.
- Economic circumstances are not evenly distributed among the races, and the differences are shocking.
-Black and Hispanic incomes lag behind white incomes for both homeowners, shown in light blue, and renters, shown in dark blue.
-The mortgage finance system will have to deal successfully with these income issues in the decade ahead in order to close the homeownership gaps.
5 CONFIDENTIAL AND PROPRIETARY BUSINESS INFORMATION CONFIDENTIAL TREATMENT REQUESTED FM-FCIC 00171935

Median Net Wealth by Race and Housing Tenure
Homeowners $ 10,000
9,000
8,000
7,000
6,000
5,000
4,000
3,000
2,000
1,000
0
Renters
Whites Blacks Hispanics Whites Blacks Hispanics
183lV1edian Net Wealth l1li Median Home Equity 1 183 Median Net Wealth 1
Source: Joint Center for Housing Studies' tabulations from Federal Reserve Survey of Consumer Finances, 1998. 6
-The differences are even more stark in wealth. For both homeowners (left) and renters (right) White net wealth is significantly higher than Hispanic and Black net wealth.
-Obviously, the lack of net worth is a barrier to homeownership, but also, conversely, the lack of homeowners hip is a barrier to wealth creation. Just look at the differences in net wealth between homeowners and renters.
-Most people's largest asset is the equity in their home. The chart on the left shows that home equity makes up a higher share of total net wealth for Blacks and Hispanics than for Whites.
6 CONFIDENTIAL AND PROPRIETARY BUSINESS INFORMATION CONFIDENTIAL TREATMENT REQUESTED FM-FCIC 00171936

Cash to Close
1998 Fannie Mae Deliveries Over 90% LTV 30~------------------------
25~--------------------
~ 20~------------
QI
~ 15~------------QI Il.
10 +--------
5
o Asian Whites Hispanics Blacks
Americans
All 1998 Fannie Mae Deliveries (DU and non-DU) 7
-In our mortgage business, the differences in wealth show up in the amount of down payment the borrower can provide and the amount of reserves that the borrower has. Both are critical elements in assessing a borrower's credit risk profile.
-This slide shows that Hispanics and Blacks tend to have more high LTV loans, indicating that they have less wealth to put into a down payment.
CONFIDENTIAL AND PROPRIETARY BUSINESS INFORMATION CONFIDENTIAL TREATMENT REQUESTED
7
FM-FCIC 00171937

Reserves
1998 DU Submissions with Less Than One Month of Reserves
20,-----------------------------------------------------------------------------------------------------------------------
15~----------------
5
o Asian Whites Hispanics Blacks
Americans
1998 DU Submissions (data on reserves for all 1998 deliveries are not available) 8
This next slide shows the larger percentage of Hispanic and Black applicants with less than one full month of available cash reserves after closing.
This is another widely recognized factor in assessing a borrower's credit risk.
CONFIDENTIAL AND PROPRIETARY BUSINESS INFORMATION CONFIDENTIAL TREATMENT REQUESTED
8
FM-FCIC 00171938

Financial Barriers to Homeownership (Based on NHID analysis of 1993 SIPP)
One Reason Only Any Two Reasons /
White Hhlds 20.5 Million
100%
Black Hhlds 5.1 Million
100%
Hispanic Hhlds 4.3 Million
100%
Other Hhlds 1.2 Million
100%
9
Each of these individual issues is exacerbated when you realize that the majority of renters face more than one of these barriers at the same time.
Total Minority renter households that face:
1) 1 barrier only = 1.35 Million (12.6% of all minority renter hhlds),
2) 2 barriers only = 1.14 Million (10.7% of all minority renter hhlds),
3) 3 barriers = 7.6 Million (71 % of all minority renter hhlds).
Note: Approximately 8.8 Million minority renter hhlds face multiple barriers (82% of all minority renter hhlds). Also, 5.7% of all minority renter hhlds (620,000) can afford a conventional mortgage.
While this Fannie Mae analysis focuses on 1993 SIPP data, census Bureau analyst Howard Savage has published work painting exactly the same picture around the difficulties of turning renters into homeowners.
CONFIDENTIAL AND PROPRIETARY BUSINESS INFORMATION CONFIDENTIAL TREATMENT REQUESTED
9
FM-FCIC 00171939

Credit 1998 Fannie Mae Deliveries by Credit Score
CD 40 CI c
35 {}, CD 30 I..
25 0 u 20 U)
c 15 .... 10 c
CD u 5 I..
, ~~:~~~:_:_:~_:._:_~_#_'9~_"'_" ________________ ___
CD 0 C.
<620 620-659 660-699 700-739 740+
~AsianAmericans ·······················Whites ·······················Hispanics -Blacks
All 1998 Fannie Mae Deliveries (DU and non-DU) 10
But wealth and income are not the only barriers to minority homeownership.
Based on an analysis of Fannie Mae deliveries, minorities tend to have lower credit scores than non-minorities.
Blacks, represented by the blue line, tend to have a higher percentage of loans that score below 620, which is an indicator of high credit risk.
The purple and green lines, representing Asians and Whites, have a much higher percentage ofloans with credit scores above 740, which is an indicator ofless credit risk.
CONFIDENTIAL AND PROPRIETARY BUSINESS INFORMATION CONFIDENTIAL TREATMENT REQUESTED
10
FM-FCIC 00171940

Comfort with Real Estate Terms People reporting they are not comfortable with real estate terms
Whites Blacks Hispanics
Source: Fannie Mae National Housing Survey, 1993 and 1999 11
Access to information about the home buying process is another barrier. Fannie Mae has researched this question through our annual National Housing Survey, copies of which you can get through Mike and his staff.
During the Trillion Dollar Commitment, the company and then the Foundation put enormous resources into home buyer education and consumer outreach. The survey shows that we have made considerable progress in overcoming this barrier.
On the other hand, a majority of Black and Hispanic households still express a level of discomfort with real estate terms.
CONFIDENTIAL AND PROPRIETARY BUSINESS INFORMATION CONFIDENTIAL TREATMENT REQUESTED
11
FM-FCIC 00171941

Discrimination Percentage of Blacks and Hispanics who believe that people of their racial background suffer from discrimination in mortgage lending
70 59
60
50
40
30
20
10
o Blacks
Source: Fannie Mae National Housing Survey, 1993 and 1999
Hispanics
12
Discrimination is also another maj or concern and a lingering barrier despite much progress on this front in American society over the last 4 decades.
Our survey finds that fewer Blacks and Hispanics believe that people like them face discrimination in mortgage lending when responses today are compared with 6 years ago.
But the levels are still unacceptably high.
CONFIDENTIAL AND PROPRIETARY BUSINESS INFORMATION CONFIDENTIAL TREATMENT REQUESTED
12
FM-FCIC 00171942
Fannie Mae's Commitment to Minority Lending
Mission Statement
At Fannie Mae, we are in the American Dream business.
Our mission is to tear down barriers, lower costs, and increase the opportunities for homeownership and affordable rental housing for
all Americans. Because having a safe place to call home strengthens families, communities, and our nation as a whole.
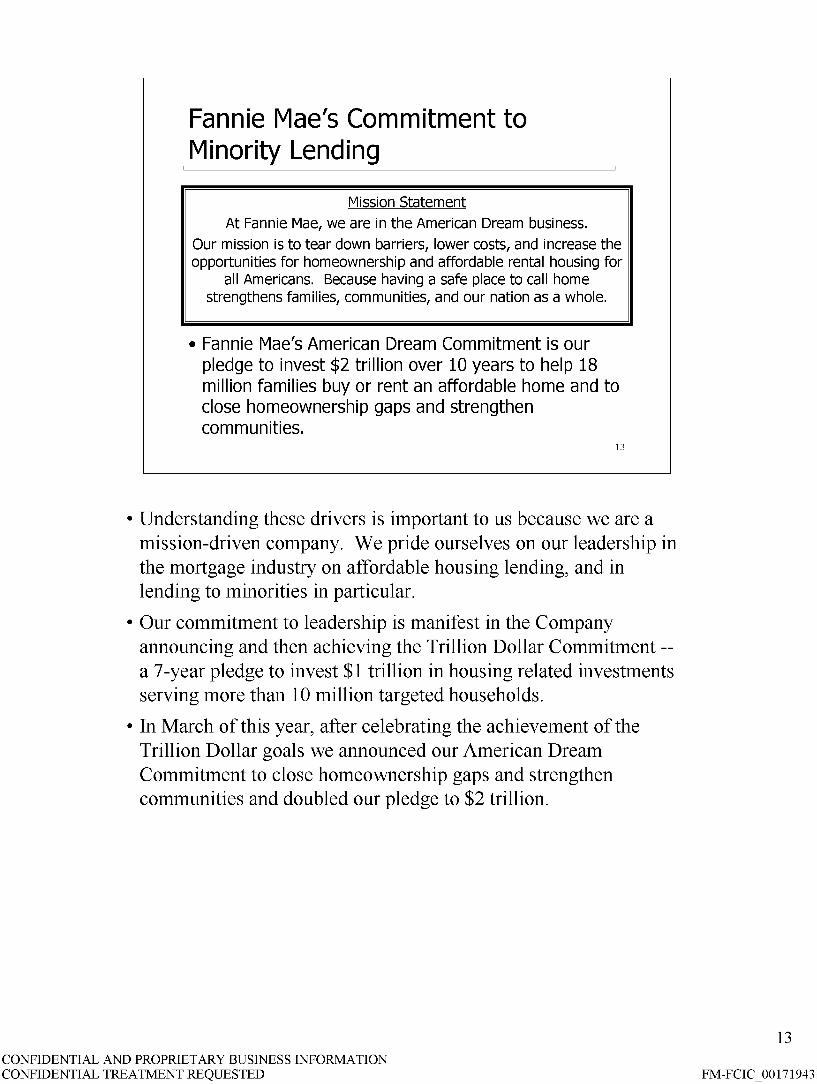
• Fannie Mae's American Dream Commitment is our pledge to invest $2 trillion over 10 years to help 18 million families buy or rent an affordable home and to close homeownership gaps and strengthen communities.
13
• Understanding these drivers is important to us because we are a mission-driven company. We pride ourselves on our leadership in the mortgage industry on affordable housing lending, and in lending to minorities in particular.
• Our commitment to leadership is manifest in the Company announcing and then achieving the Trillion Dollar Commitment -a 7 -year pledge to invest $1 trillion in housing related investments serving more than 10 million targeted households.
• In March of this year, after celebrating the achievement of the Trillion Dollar goals we announced our American Dream Commitment to close homeownership gaps and strengthen communities and doubled our pledge to $2 trillion.
CONFIDENTIAL AND PROPRIETARY BUSINESS INFORMATION CONFIDENTIAL TREATMENT REQUESTED
13
FM-FCIC 00171943

1999 Achievements
• 68.6 percent of Fannie Mae business served targeted populations
• Increased share of our overall business served targeted borrowers
• $45.6 billion in loans to minority households • $12.4 billion in multifamily housing investments • More than $1 billion in investments in the
LIHTC
14
• One of our outstanding achievements under that the Trillion Dollar Commitment is the transformation of our business. When we announced the goal in 1994, 55 percent of our business served targeted populations. This has grown to more than 68 percent today.
• In 1999, we increased the share of our total single family business serving minority borrowers from 14.4 percent to 16.6 percent from 1998.
• We also increased the low-mod and underserved shares of households served by our single-family business from 1998 to 1999.
• We provided more than $45.6 billion in home financing to more than 412,000 minority families -- a level of investment unparalleled by any other single entity in the industry.
• We also continued our leadership as the leading financial institution supporting multifamily housing and remained the nation's largest single investor in lowincome housing tax credits.
14 CONFIDENTIAL AND PROPRIETARY BUSINESS INFORMATION CONFIDENTIAL TREATMENT REQUESTED FM-FCIC 00171944

2000 Achievements
• Achieved Trillion Dollar Commitment and announced American Dream Commitment
• $23.8 billion YTD serving 219,731 minority households
• On track for strongest targeted lending performance ever -- nearly 50 percent of households low- and moderate income and 19.5 percent of households minority
15
• We are already near the end of 2000, and we are on track to have a very good year.
• We achieved the Trillion and announced a redoubling of our commitment under the American Dream Commitment.
• Our Chairman has committed to lead the market in lending to all racial and ethnic groups. Although we won't see the data for the primary market until next August, we believe we're on track to meet this challenge. Year to date, more than 19 percent of the households we've served in 2000 are minority.
• We are also expecting a very strong year in our housing goals performance. Year to date nearly 50 percent of the households we have served have incomes below the area median income in their area.
• We also have a number of exciting new achievements in 2000.
• We are advancing our efforts to serve subprime borrowers with our Timely Payment Rewards product and we have rolled out our newest version of Desktop Underwriter, DU 5.0, which will help us to greatly expand the markets we can serve.
• And most recently we announced our MyCommunity Mortgage, which we hope will give lenders the flexibility they need to meet their individual CRA 1-4 unit product needs and expand even more our service to low-mod borrowers and their communities.
• AA: 47,175; $4.5B. H: 87,032; $8.5B. Asian: 54,658; $7.2B
15 CONFIDENTIAL AND PROPRIETARY BUSINESS INFORMATION CONFIDENTIAL TREATMENT REQUESTED FM-FCIC 00171945

I
Growth in Households Served Fannie Mae 1993-1999 (Percent chanae in hOI Jseholds served--PMM and refinance)
1993-1999
1I11III Blacks I11III Hispanics II All Minorities m All Households 0 Whites 1
Source: Fannie Mae acquisitions data in units, 1993 and 1999, total single family business. 16
• We believe we have much to be proud about with respect to Fannie Mae's minority lending performance in 1999 and over the decade.
• This slide illustrates the change in the number of households we served, comparing our purchases in 1993 to our purchases in 1999.
• As you can see, we have made much progress -- increasing the number of minority households we serve by 16 percent, while the number of White households we served decreased 13 percent.
• Even more pronounced is the progress we have made in serving Black and Hispanic borrowers, which have increased by 31 and 26 percent respectively.
CONFIDENTIAL AND PROPRIETARY BUSINESS INFORMATION CONFIDENTIAL TREATMENT REQUESTED
16
FM-FCIC 00171946

Recent Market Trends and Fannie Mae Performance
CONFIDENTIAL AND PROPRIETARY BUSINESS INFORMATION CONFIDENTIAL TREATMENT REQUESTED
17
17
FM-FCIC 00171947

'" = 0: 0 ... .... 0 :.. ~
'S ::: Z
Market Trends: Total Single Family Loan Volume Down in 1999
16,000,000
14,000,000
12,000,000
10,000,000
8,000,000
6,000,000
4,000,000
2,000,000
0
1993 1994 1995 1996 1997 1998 1999
I [;l Purchase Money D Refinance and Home Improvement I
Source: HMDA data, originations and purchases 18
• I would now like to shift to a discussion of the market trends we've observed this year and what they tell us about minority participation and the respective accomplishments of the primary and secondary markets.
• First, in 1999, the mortgage market remained strong, with high mortgage market volumes. Loan levels last year were second only to 1998, with 13.2 million loans originated or purchased in 1999.
• Second, 1999 was down nearly 15 percent from 1998 volume. As you can see from this chart, the overall drop in volume was driven entirely by a decline in refinance loan volume of 31 percent. The number of home purchase money mortgages continued to grow, up 6 percent from 1998.
18 CONFIDENTIAL AND PROPRIETARY BUSINESS INFORMATION CONFIDENTIAL TREATMENT REQUESTED FM-FCIC 00171948

Market Trends: Relatively Better Minority Market
40.00%
30.00%
20.00%
10.00%
0.00% Conv. Conf. Gov't Manuf. Hsing Subprime Jumbo
o Overall Volume % Change 1998-1999 II1II Minority Volume % Change 1998-1999
Source: HMDA Data, Originations and Purchases 1998 and 1999. Purchase money mortgages. Subprime and Manufactured Housing loans defined as volume by HUD-identified subprime and 19 manufactured housing lenders.
• One of the major stories in the 1999 market data is strong minority volumes.
• Again, purchase money mortgage volumes increased from 1998 to 1999.
• Moveover, as this chart shows, minority purchase money mortgage growth exceeded that of the market across all market segments when compared with overall volume change from 1998 to 1999.
• It is important to note, however, the highest levels of growth were in those market segments where we do not traditionally participate: manufactured, subprime, and jumbo mortgages.
CONFIDENTIAL AND PROPRIETARY BUSINESS INFORMATION CONFIDENTIAL TREATMENT REQUESTED
19
FM-FCIC 00171949

Market Trends: Boom in Subprime Lending 1993-1999 2,500,000 18.00%
16.00%
2,000,000 14.00%
12.00% 1,500,000
10.00%
8.00% 1,000,000
6.00%
500,000 4.00%
2.00%
o 0.00%
1993 1994 1995 1996 1997 1998 1999
IIIIIIIIIIIII Loan Volume --+- Market Share I
Source: HMDA Data, Loan Originations and Purchases, total loan volume for lenders identified by HUD to be primarily subprime or manufactured housing lenders. 20
• This leads to another story behind the 1999 market data -- the continued growth of the suprime market.
• 1999 HMDA data suggests that subprime market share has grown more than ten-fold over the past 7 years -- from 1 percent of total originations and purchases to nearly 11 percent of total originations and purchases.
• The subprime market was the only market segment with higher overall volume in 1999 than in 1998.
• Inside B&C Lending estimates $160 billion in subprime originations in 1999. 1999 HMDA data, using HUD's list of sub prime lenders, shows only $119 billion in subprime originations -- missing approximately 1/4 of the industry estimated volume for that year. HUD also estimates that the total volume of the lenders on their subprime list covers only 80 percent of the total subprime volume. (Note: Inside B&C Lending $160B estimate and $119B of originations off HUD 's list include manufactured housing volume.)
• I should also mention that we have seen considerable consolidation in the mortgage market over the past few years. Many banks and thrifts have acquired subprime affiliates and begun to reach further down the credit curve themselves.
20 CONFIDENTIAL AND PROPRIETARY BUSINESS INFORMATION CONFIDENTIAL TREATMENT REQUESTED FM-FCIC 00171950

Affordable and Minority Lending: Subprime vs. Conventional Conforming Market (1999 HMDA Percent of Loans)
70.0% 56.2% 60.0%
50.0%
40.0%
30.0%
20.0%
10.0%
0.0% Low-Mod Underserved Minority
1II1II Subprime D Conventional Conforming I
Source: 1999 HMDA data, originations and purchases, owner-occupied, purchase money mortgages in MSAs. Subprime defined as loans originated or purchased by 263 HUD-identified subprime lenders and 23 HUD-identified
manufactured housing lenders. Conventional Conforming excludes subprime, manufactured, government, and jumbo loans, except those reported as sold to Fannie Mae or Freddie Mac.
21
• As you can see, the subprime market has much higher low- and moderate-income, underserved, and minority concentrations than the prime conventional conforming market.
CONFIDENTIAL AND PROPRIETARY BUSINESS INFORMATION CONFIDENTIAL TREATMENT REQUESTED
21
FM-FCIC 00171951

Market Trends: Percent of Loans Sold to Affiliates Increased
25.0%
20.0%
15.0%
10.0%
5.0%
0.0% f""="-------
1998 1999
I D Total m Low-Mod 1m Underserved IIBB Minority I
Source: HMDA Data 1998 and 1999, Originations and Purchases, Conventional Conforming, Owner-Occupied Home Purchase Loans in MSAs, mortgage company subsidiaries of banks and thrifts, loan volume reported as "Sold to Affiliates".
22
• Further, in the subset of the market to which we compare our performance, we observe an increase in volume being sold to primary market affiliate institutions.
• 1999 HMDA data shows that mortgage companies whose parent companies are banks or thrifts also sold significantly higher shares of their targeted production to their affiliated companies and less to other secondary market entities. This trend is reflected in the significant bulking up in mortgage assets that we observed last year among banks and S&Ls.
• In the subset of their business to which we compare our performance, mortgage company subsidiaries of depositories sold 19.5 percent of their loans to affiliates in 1999. This is a 99 percent increase over the 9.8 percent of their business they sold to affiliates in 1998.
• Similarly, the share of low-mod loan volume these lenders sold to affiliates jumped from 14.4 percent in 1998 to 19.3 percent in 1999. For loans to borrowers in underserved areas, the share jumped from 13.1 percent to 18.5 percent. For minority loans the share jumped from 16.9 percent in 1998 to 23.1 percent in 1999.
CONFIDENTIAL AND PROPRIETARY BUSINESS INFORMATION CONFIDENTIAL TREATMENT REQUESTED
22
FM-FCIC 00171952

Market Trends: Increases in Affordable Loans Not Sold
Percent Change in Share of Loans by Depositories Not Sold to Secondary Market,
1998-1999
mLow- and Moderate-Income mUnderserved 111M inority
Source: HMDA Data 1998 and 1999, Originations and Purchases, Conventional Conforming, Owner-Occupied Home Purchase Loans in MSAs, commercial banks and S&Ls, loans reported as "Not Sold". 23
• Depositories also held a higher share of their volume in portfolio, especially for minority lending.
• In the subset of their business to which we compare our performance, these lenders increased the share of their production held in portfolio by 17.9 percent from 1998 to 1999.
• This trend holds true across targeted lending groups, as well.
• As you can see from the chart, banks and S&Ls increased the share of their low-mod loans held in portfolio by 13.0 percent; loans to borrowers in underserved areas by 15.2 percent; and loans to minority borrowers by 18.2 percent. Most importantly, we calculate that all of the growth in lending to minorities in the conventional conforming market went into depository portfolios.
• Since banks and S&Ls have the largest share of targeted lending in the primary conventional conforming market, their decision to hold rather than sell affects the mix of business available to Fannie Mae.
• Our own anecdotal evidence suggests that this increase is due in part to below-market eRA loan products.
CONFIDENTIAL AND PROPRIETARY BUSINESS INFORMATION CONFIDENTIAL TREATMENT REQUESTED
23
FM-FCIC 00171953

Market Trends: Portfolio Loans vs. Loans Sold to the Secondary Market
50.0
40.0
30.0
20.0
10.0
O.O'Yo-l"= Low-Mod Un de rserve d Minority
IIILoansNotSold .LoansSold I
Source: HMDA Data 1998 and 1999, Originations and Purchases, Conventional Conforming, Owner-Occupied Home Purchase Loans in MSAs, commercial banks and S&Ls, loans reported 24 as "Not Sold" compared to loans reported as sold.
• It is also important to note that the loans that depositories put into portfolio had a much higher presence of underserved area loans and minority loans than the loans that the depositories made available for sale.
CONFIDENTIAL AND PROPRIETARY BUSINESS INFORMATION CONFIDENTIAL TREATMENT REQUESTED
24
FM-FCIC 00171954

Fannie Mae versus the Primary Market: Achieving a Meaningful Comparison
• Conventional Conforming loans only - Remove jumbo loans - Remove government loans - Remove subprime lender volumes - Remove manufactured housing lenders and
very small loans
• Other considerations - Originations and purchases - Home purchase loans only - Owner-occupied loans only
25
• With these trends in mind, I want to give you a sense of how Fannie Mae has stacked up in its own performance in serving minorities and other targeted borrowers when compared with the progress made in the primary market by originating lenders.
• First, let me explain how we use the HMDA information when making comparisions:
• Remove the jumbo, governments, subprime and manufactured housing loans (using HUD's list). These are not markets in which we operate. We do add back in those jumbo, subprime, and manufactured housing loans reported as sold to Fannie or Freddie, under the assumption that these loans did indeed conform to our market.
• In looking at HMDA, we include loans reported as both originated and purchased by lenders. Purchases make up an important percentage of the overall market and a high percentage of Fannie Mae business is originated by third party originators.
• Limit to purchase money mortgages because refinance loans are more a function of interest rate movements than level of effort.
• Finally, a fair comparison includes only owner-occupied loans, because HMDA data captures the income of the borrower not the resident in an investor-owned, single-family property.
• Let me mention here that Hun also performs a similar comparison between our performance and the market. Some of you may have seen their numbers in the Housing Goals rule or in the press last spring. Their methodology differs from ours in that they look at originations only in the HMDA database, and they include investor-owned mortgages in the comparison. In addition, HUD includes all of the manufactured housing loan volume and at least half of the subprime volume. Again, we believe these are not markets in which Fannie Mae has traditionally operated, and therefore should not be included in the market against which our leadership is measured.
CONFIDENTIAL AND PROPRIETARY BUSINESS INFORMATION CONFIDENTIAL TREATMENT REQUESTED
25
FM-FCIC 00171955

HMDA Data, 1999: Minority Loans by RacejEthnicity and Race Not Provided
1999
IIII! Asian ~ Black ~ Hispanic IIII! Other iIIII Not Provided/Not Applicable
Source: 1999 H1.1DA data, originations and purchases, total volwne. 26
• It is particularly important to focus on the issue of missing data. Increasingly loans are delivered to Fannie Mae without the race of the borrower identified. Likewise, data in HMDA reveals high levels of loans without race data. In fact, the number of loans without race data -- shown by the red bar on this chart, for the market -- completely swamps the amount of loans with data for any individual racial or ethnic group.
• The problem of missing data is much more pronounced in the market than in our data. Borrower race is not reported on nearly 27 percent of the HMDA loans. 14 percent the loans we financed in 1999 did not provide the race of the borrower.
• The point is that with so much unknown information, it is difficult to draw clear conclusions when differences in performance are measured in basis points.
CONFIDENTIAL AND PROPRIETARY BUSINESS INFORMATION CONFIDENTIAL TREATMENT REQUESTED
26
FM-FCIC 00171956

Income Distribution of Fannie Mae's Business Mirrors the Market, 1999
9.00%
8.00%+-----------------------:
7.00% +--____ ------;/:~.~,._: . .....:~_ .. :..~_.~:_~~=~.'~ "c-':" ~ __________ ----:
I' ' ... « ? 6.00% +-----------,.~~----~,,______--------____+_C
~o 5.00% +------+!f-~-,' ------~-"'~ .. 'li:~'\,'-. _..-----------,'f;---Cf:. • [ r ' ~. 4.00% +----------.i,. ~./'-________ ----"";--______ --"i:_':
/' ~ f: .. ,/": "-"'''- t
3.00% +-------i,':'-, -----------c.,--------;r:--// 'x.......... I
2.00% +----/!:'--' --------------',,""'. '~ .. -" ----+/-: 1 .00% /. ''''''''''''':«<' ,,~l !
0.00% ...Jjr.~L,/_:r£~.' ~~~~~~~~~~~~~~~~~~--i
..• ; •.. Fannie Mae --10--- Primary Market
Sources: Fannie Mae data, owner'occupied, purchase money mortgages in MSAs; Home Mortgage Disclosure Act, conventional conforming market, owner'occupied, purchase money mortgages in MSAs " plus jumbo, 27
• This slide shows you how Fannie Mae's financings in 1999 compared with the distribution of reported originations in the primary market for conforming, conventional loans. Jumbos are excluded from the market profile, for instance.
• As you can see, our business is in lock step with the market. Any differences between Fannie Mae's business and the primary market are quite small.
• At the same time, however, we did notice a slight shift to the left for the market relative to the same chart for prior years. In other words, in 1999 our performance tracked a little less closely than in earlier years.
CONFIDENTIAL AND PROPRIETARY BUSINESS INFORMATION CONFIDENTIAL TREATMENT REQUESTED
27
FM-FCIC 00171957

Fannie Mae versus the Market in Low-Mod Lending (Percent of loans serving low- and moderate-income borrowers)
1995 1996 1997 1998 1999
I D Primary Market m Fannie Mae I
Sources: Fannie Mae data, owner-occupied, purchase money mortgages in MSAs; Home Mortgage Disclosure Act, conventional conforming market, owner-occupied, purchase money mortgages in MSAs -- plus jumbo, subprime, and manufactured loans reported as "sold to" Fannie Mae or Freddie Mac. 28
• This slide compares Fannie Mae with the primary market, again, using the methodology I outlined, on lending to borrowers at or below Area Median Income.
• As you can see, our analysis shows Fannie Mae's performance slightly below that of the primary market in 1999, a departure from most of the other years since 1995.
• Our analysis suggests that this is due to the market trends I discussed earlier:
• depositories held an increased share of their low-mod loans in portfolio in 1999;
• mortgage bank subsidiaries of depositories sold a higher share of their loans to affiliates;
• and increased subprime lending volume -- traditionally a higher percentage low-mod than the overall conventional conforming market -- a significant portion of which is not picked up by HUD's lender list and therefore is reflected in this subset of the primary market.
• It's important to look at the five-year story. Changes beyond our control in market conditions affect the relationship of our performance to that of the primary market. However, as you can see on this slide and those that follow, we have consistently led or met the market over the longer term.
28 CONFIDENTIAL AND PROPRIETARY BUSINESS INFORMATION CONFIDENTIAL TREATMENT REQUESTED FM-FCIC 00171958

Fannie Mae versus the Market in Underserved Lending (Percent of loans serving underserved areas)
30%
25%
20%
15%
10%
5%
0% 1995 1996 1997 1998 1999
I D Primary Market Il] Fannie Mae I
Sources: Fannie Mae data, owner-occupied, purchase money mortgages in MSAs; Home Mortgage Disclosure Act, conventional conforming market, owner-occupied, purchase money mortgages in MSAs -- plus jumbo, subprime, and manufactured loans reported as "sold to" Fannie Mae or Freddie Mac.
29
• This slide shows you a comparison between Fannie Mae and the primary market for lending to borrowers in underserved areas (essentially census tracts with lower income and higher minority concentrations).
• While you can see that we have historically exceeded or matched the market, data for 1999 suggests that the primary market's performance in this area surpassed Fannie Mae.
• Again, we believe the three broader market trends explain much of the performance gap for 1999.
29 CONFIDENTIAL AND PROPRIETARY BUSINESS INFORMATION CONFIDENTIAL TREATMENT REQUESTED FM-FCIC 00171959

Fannie Mae versus the Market in Minority Lending (Percent of loans serving minority borrowers)
20%
15%
10%
5%
0% 1995 1996 1997 1998
I D Primary Market Ifl Fannie Mae I
1999
Source: Fannie Mae data, owner-occupied purchase money mortgages in MSAs; Home Mortgage Disclosure Act, conventional conforming market, owner-occupied, purchase money mortgages in MSAs -- plus jumbo, 30 subprime, and manufactured loans reported as "sold to" Fannie Mae or Freddie Mac.
• Similarly, our analysis found that even though the minority share of our business increased from 1998 to 1999, it did not keep pace with the primary market.
• But let's put this analysis in perspective:
• In the primary market, there are more loans for which we cannot identify borrower race than there are loans identified as minority.
• In 1999, Fannie Mae purchased more than 384,000 minority loans serving more than 412,000 minority households. This is more than any other private secondary market entity.
• Furthermore, our analysis found that had depositories behaved as they had in 1998 -- had they made the same proportion of their loan volume available to the secondary market -- this chart would show Fannie Mae leading the market in minority lending.
• Likewise, had mortgage company subsidiaries of depositories not increased the share of their business they sold to affiliates in 1999, this chart would show Fannie Mae's performance exceeding the primary market.
• Finally, we have learned through anecdotal evidence from our lender partners that subprime loans may be included in the loan purchase data they submit under HMDA. With a disproportionately higher minority concentration, such subprime loan volume would skew this comparison.
30 CONFIDENTIAL AND PROPRIETARY BUSINESS INFORMATION CONFIDENTIAL TREATMENT REQUESTED FM-FCIC 00171960

Unidentified Subprime Volume Impact on Lending Comparison
45.0% ,--------------------40.3% .
40.0%
35.0%
30.0%
25.0% 18.5% 18.9% 18.3%
20.0%
15.0%
10.0%
5.0%
0.0%
Low-Mod Underserved Minority
E;'l Fannie Mae D Primary Market D Primary Market Adjusted
Source: Fannie Mae data, owner-occupied purchase money mortgages in MSAs; "Primary Market" is HMDA data, conventional conforming market, owner-occupied, purchase money mortgages in MSAs -- plus jumbo, subprime, and manufactured loans reported as "sold to" Fannie Mae or Freddie Mac. "Primary market adjusted" is above HMDA data minus estimated subprime volume not reflected in HUD-identified subprime lender volume.
• N OW I'd like to show you some of the analysis we have done to explore the impact that market trends have on our comparison to the primary market.
• You remember the earlier chart that showed the boom in subprime lending. I mentioned that we and others identify subprime volume in the HMDA data by using a list of subprime lenders that HUD issues each year, and that while this is the best way to identify subprime volume in the data set, it undercounts the subprime volume in the market by about 25 percent.
• So what we've done is adjust the primary prime conventional conforming data for this undercount -- "Unidentified Subprime". This chart illustrates the impact this adjustment has on the market's performance.
• As you can see, when we remove what we estimate to be subprime loans that are not identified by HUD's subprime lender list, the targeted shares of primary market volumes declines.
• With this adjustment, Fannie Mae's minority and low-mod shares are higher than that of the primary market in 1999.
• Background: Methodology is to remove $41 billion (estimated unidentified subprime volume in conventional conforming market) from the conv conf market at the same distribution as the subprime volume identified by HUD's lender list. For the purposes of the estimated undercount and the adjustment, manufactured housing volume in included in the subprime numbers.
31 CONFIDENTIAL AND PROPRIETARY BUSINESS INFORMATION CONFIDENTIAL TREATMENT REQUESTED FM-FCIC 00171961

Fannie Mae's American Dream Commitment
32
Nevertheless, Fannie Mae is committed to leading in lending to all minorities, and the shift in our performance relative to the market concerns us. I'd like to tum now to give you some details about the steps we are taking as a company to increase our participation in lending to minorities, and to help increase minorities' participation in the mortgage finance system overall.
CONFIDENTIAL AND PROPRIETARY BUSINESS INFORMATION CONFIDENTIAL TREATMENT REQUESTED
32
FM-FCIC 00171962

American Dream Commitment
• Mortgage Consumer Rights Agenda
• National Minority Homeownership
Initiative
• "Opportunity for All" Strategy
• eHomeownership
• America's Living Communities Plan
• Affordable Rental Housing Leadership
33
The American Dream Commitment is Fannie Mae's commitment to leaderhsip in affordable housing and to closing persistent homeownership gaps.
Fannie Mae has made a commitment to support an average $200 billion a year in affordable housing activity compare to the previous commitment of $143 billion per year.
The American Dream Commitment puts a more intense focus on tackling the tough challenge of closing homeownership gaps.
Our National Minority Homeownership Initiative and our Opportunity for All Strategy are dedicated to this goal. Over the last several years, America has made extraordinary progress in increasing homeownership rates for all Americans -- more than 40 percent of the new homeowners created have been minority families - but significant gaps still remain. This poses a significant challenge for this country if we are going to close larger gaps in wealth, income, and opportunity.
The American Dream Commitment includes a new intense focus on community development and the role that housing investment plays in building strong neighborhoods and a stronger society.
And, finally, the American Dream Commitment breaks new ground with its unique focus on preeminence of consumer rights and fundamental role of technology.
I want to focus my time on detailing for your our plans and actions under the National Minority Homeownership Initiative.
CONFIDENTIAL AND PROPRIETARY BUSINESS INFORMATION CONFIDENTIAL TREATMENT REQUESTED
33
FM-FCIC 00171963

I
National Minority Homeownership Initiative
• Help lead a comprehensive nationwide campaign to increase minority homeownership rates by challenging the public and private sectors to create five million new homeowners through 2009.
• Lead in lending to all minorities
• Continue to lead the fight to end discrimination in the mortgage finance system
34
The National Minority Homeownership Initiative begins with a challenge to both the public and private sectors to create 5 million new minority homeowners over the next 10 years.
CONFIDENTIAL AND PROPRIETARY BUSINESS INFORMATION CONFIDENTIAL TREATMENT REQUESTED
34
FM-FCIC 00171964

Minority Homeownership Rate Projections
60% -------------------------------------------------------------------------------------------------------------------------------------------------
'" i 55% -----------------------------------------------------------------_---"'~,---~~>~>~------ --.
150% ------------------------------------------"~">""-'~/<
'" g 45% J:
a ~ ~ ~ ~ ~ ~ ~ ro m a ~ m m m m m m m m m m a a m m m m m m m m m m a a ~ ~ ~ ~ ~ ~ ~ ~ ~ ~ ~ ~
Year
-- Actual Minority Homeownership Rate -- High Series Is Based on 1993-1998 Homeownership Rate Trends -- Middle Series Is The Average of High and Low Series -- Low Series Is Based on 1990-1995 Homeownership Rate Trends
This chart shows you the kind of challenge this goal presents.
CONFIDENTIAL AND PROPRIETARY BUSINESS INFORMATION CONFIDENTIAL TREATMENT REQUESTED
35
55.1%
50.7%
46.4%
35
FM-FCIC 00171965

Minority Financings Provided
$450 $400 $350 $300 $250 $200 $150 $100
$50 $0
$420 Billion Through 2009
Trillion Dollar American Dream Commitment Commitment
36
Fannie Mae will make our contributions. I've already shared with you the fact that in recent years we have consistently outpaced the market in terms of our overall financing of loans to minorities.
But we are not content.
Over the next 10 years, we are committed to finance more than $420 billion in loans serving 3 million minority borrowers. This $420 billion is more than twice the $189 billion in minority lending we achieved under the Trillion Dollar Commitment and represents an annual growth in minority lending business 15 percent higher than our overall business.
CONFIDENTIAL AND PROPRIETARY BUSINESS INFORMATION CONFIDENTIAL TREATMENT REQUESTED
36
FM-FCIC 00171966

National Minority
I
Homeownership Initiative
• Extend conventional market practices and cost-savings to borrowers in the subprime market
• Increase deliveries from MWOLs and CDFIs to $3 billion annually
• Strengthen and grow our partnerships with civil rights groups and faith-based organizations
• Invest $350 million to help 4,600 Native American home buyers
37
To achieve our big goals will require that we continue to make progress in breaking down the barriers that face all renters, but more often minority renters. These barriers include limited savings for down payments, inadequate income to cover monthly mortgage payments, impaired credit, lack of sufficient information about the process, and discrimination. Many renters face all of these barriers at once.
Fannie Mae will need to continue to expand our underwriting experiments -already more than $10 billion committed -- that are testing new approaches to credit and downpayment and income. The learning from these experiments, coupled with our technology is making innovation and market expansion possible. Our Timely Payment Rewards product, for example, is opening markets and lowering costs for borrowers who otherwise face only the alternative of much higher priced loans in the subprime market.
To reach our big goals, we will also need to expand our partnerships with civil rights groups and faith-based organizations to establish new channels and new connections to communities of color. We will need to increase our deliveries form non-traditional Fannie Mae customers -- such as minority-owned lenders and community development financial institutions who are currently serving these consumers.
CONFIDENTIAL AND PROPRIETARY BUSINESS INFORMATION CONFIDENTIAL TREATMENT REQUESTED
37
FM-FCIC 00171967

I
National Minority Homeownership Initiative
• Lender partnerships to increase minority homeownership and lending volumes
- $5 billion partnership with CTX Mortgage
- $12 billion partnership with CitiMortgage
- $1 billion partnership with Irwin Mortgage
• Welcome Initiative -- A New Country, A New Home
• Perspectives on Diversity 38
Lenders are the key to all of our success, of course, and one of our principal efforts to build a better book of minority lending starts with our key partners -lenders.
This region has been a leader, with both CitiMortgage and CTX Mortgage leading the way in creating innovative, targeted initiatives with Fannie Mae designed specifically to increase lending to minorities and other underserved borrowers.
Under these agreements, we have worked with our partners to create or accept specialized products with very low downpayments and other underwriting flexibilities.
We have provided our lender partners with specialized market research to help them identify areas where their efforts are likely to yield the greatest results.
We have worked with them to create and provide specialized marketing materials, particularly for New Immigrants and others for whom English is not their first language.
We plan to do more of these in 2001.
CONFIDENTIAL AND PROPRIETARY BUSINESS INFORMATION CONFIDENTIAL TREATMENT REQUESTED
38
FM-FCIC 00171968

I
National Minority Homeownership Initiative
• Targeted community lending products that expand our lenders' ability to reach underserved markets
- $530 billion in CRA-eligible financings through 2009
- $20 billion in targeted CRA lending through innovative products
• MyCommunityLoan.com
- >$7 billion since 1997 launch
- Increased flexibility through DU, introduction of EA/TPR 39
We know that our lender partners, particularly depositories, face their own challenges in meeting the full spectrum of their communities' credit needs.
Fannie Mae is already the leading source of mortgage credit to support CRAtype lending. In 1999, for example, about 30 percent of all our single family financings helped families that met one or both of the CRA lending tests. In addition, since 1997 we've had an aggressive initiative to finance CRA lending through both flow and seasoned deals. To date we've done more than $7 billion, against a goal of $10 billion by 2002.
The American Dream Commitment commits us to finance at least $530 billion in CRA-eligible loans through 2009, and to undertake at least $20 billion in targeted CRA lending with our lender partners.
We will accomplish this through initiatives like MyCommunityLoan, which was announced last month at the MBA, the ABA and ACB conferences. We will continue to expand our products like EA and TPR, and continue to add flexibilities and products to DU so that it continues to be a fundamental tool in reaching new markets.
CONFIDENTIAL AND PROPRIETARY BUSINESS INFORMATION CONFIDENTIAL TREATMENT REQUESTED
39
FM-FCIC 00171969

I
National Minority Homeownership Initiative
• Partnerships with new entrants and trusted advisors to assist minorities overcome barriers and bring consumers to the marketplace
- National Urban League
- National Council of La Raza
- Neighborhood Reinvestment Corporation
- NAACP
- The Enterprise Foundation
40
Our experience over the last 10 years has taught us that our work is more successful when we are laboring together with non-traditional partners with deep roots in the communities we are seeking to serve. That's why we've created partnerships with these groups, and will continue to expand this list in the next years.
In every case, we are working directly with our lenders to help these groups identify potential homebuyers, provide them with advice and encouragement, and assist them in entering the mortgage process well educated and prepared. Through these alliances we will bring new consumers to the marketplace and help our lenders serve them with innovative products to meet their needs.
CONFIDENTIAL AND PROPRIETARY BUSINESS INFORMATION CONFIDENTIAL TREATMENT REQUESTED
40
FM-FCIC 00171970

I
National Minority Homeownership Initiative
• Direct investments and deposits in Community Development Financial Institutions (CDFIs) to spur mortgage and community development investments in underserved communities
- $8 million in deposits
- $29.6 million in equity investments
- $13.5 million in loans for CDFI investments
41
We are also providing capital to community-based institutions that are specifically designed to meet the needs of these often underserved communities.
CONFIDENTIAL AND PROPRIETARY BUSINESS INFORMATION CONFIDENTIAL TREATMENT REQUESTED
41
FM-FCIC 00171971

Regulatory Housing Goals, 2001-2003
42
In sum, then, our strategy is simple but challenging: to work with our lender partners to devise and then market the best products to these new markets.
We have an unwavering commitment to serving these new markets, and believe that the American Dream Commitment gives us the blueprint to achieve the bold goals we've set for ourselves and to help our lenders meet their own.
I'd like to tum now to a very brief description of the regulatory housing goals recently promulgated by HUD. As most of you know, these goals are mandated in the 1992 statute that established our current regulatory structure. We've been operating under them since 1993, and this is the third time they have been changed.
Our mission goals are really like CRA on steroids. They are based on a percentage of our business, every year. We report on our progress 4 times a year, and provide data tapes of our complete book of business for the year twice each year. Large parts of what we do to serve low and moderate income households are not counted in the goals -- like our investments in Low Income Housing Tax Credits, for instance.
The next slide shows you what the goals were from 1995 through this year; how we stacked up against them; and what HUD has decided they should be for the next three years.
The fact is, Fannie Mae has exceeded every one of these goals since 1994.
CONFIDENTIAL AND PROPRIETARY BUSINESS INFORMATION CONFIDENTIAL TREATMENT REQUESTED
42
FM-FCIC 00171972

Proposed New Housing Goals
Low Mod Underserved Special Affordable
m Goal 1995-99
m 1999 Performance
mNewGoal
Special Affordable MF Subgoal: Increased to an amount equal to 1 % of avg. 1997-99 MF volume, or $2.85 billion over the goals period. Current goal is $l. 29 billion. 1999 Fannie Mae performance was $4.0 billion
43
These new goals represent a real stretch for Fannie Mae, despite our terrific performance over the last 6 years. We estimate, and HUD's analysis agrees, that we face a stretch of about two full percentage points from our current levels in order to meet these new, aggressive goals.
CONFIDENTIAL AND PROPRIETARY BUSINESS INFORMATION CONFIDENTIAL TREATMENT REQUESTED
43
FM-FCIC 00171973

Major Changes: More Accurate Counting Rules
• Treatment of missing data
- Excluded in both numerator and denominator
- Allows proxy data for multifamily rents
- Caps missing data on owner-occupied units in low-income tracts at 1 percent
• Specialized government mortgages -- HECMS, RHS, and Native American -- will now count for all three goals.
• Special affordable seasoned loans -- safe harbor based on lender CRA performance and for specialized institutions (HFAs, community credit unions, CDFIs, etc.) 44
There are some notable features in the new regs. One of the most important is that while raising the goals to a very challenging new level, HUD has also rectified some technical issues in the way our business is counted. These changes will ensure that we can take credit for all the business we do that serves targeted groups. It doesn't make a huge difference in our actual scores, but it assures consistent treatment.
CONFIDENTIAL AND PROPRIETARY BUSINESS INFORMATION CONFIDENTIAL TREATMENT REQUESTED
44
FM-FCIC 00171974

Major Changes: Bonus Points
• Small multifamily properties receive 2 pOints for each unit toward all three goals.
- Freddie Mac also receives 1.2 units' credit for all multifamily units in properties >50 units through 2003.
• Units in owner-occupied 2-4 unit properties receive two pOints toward the goals above a baseline equal to 60 percent of historical average.
• Bonus pOints are appropriate:
- Difficult markets to serve.
- Incentives to engage these markets.
45
HUD also acknowledged that there are specific parts of the market where Fannie Mae and Freddie Mac should be encouraged to do more. The higher goals levels are predicated, to some degree, on an assumption that we will be able to do so. Thus HUD has provided bonus scoring as an incentive in two specific areas: smaller rental properties, and rental units in owner occupied 2-4 unit properties.
CONFIDENTIAL AND PROPRIETARY BUSINESS INFORMATION CONFIDENTIAL TREATMENT REQUESTED
45
FM-FCIC 00171975

Thank You!
46
Fannie Mae is committed to exceeding these new goals, as we have in the past. We believe that our American Dream Commitment will insure our success. The real payoff will be increased access to mortgages by minorities and other underserved families; more business for our lenders; and stronger, healthier communities
CONFIDENTIAL AND PROPRIETARY BUSINESS INFORMATION CONFIDENTIAL TREATMENT REQUESTED
46
FM-FCIC 00171976


