
FAMOOSr 2009 - Inria · 2015-11-03 · FAMOOSr 2009 3rd Workshop on FAMIX and MOOSE in Software...
27
FAMOOSr 2009 3rd Workshop on FAMIX and MOOSE in Software Reengineering Organizers: Simon Denier INRIA Lille-Nord Europe, France Tudor Gîrba University of Bern, Switzerland Program Committee: Gabriela Arevalo LIFIA La Plata, Argentina Johan Brichau UniversitÃl’ catholique de Louvain, Belgium Serge Demeyer University of Antwerp, Belgium Yann-Gaël Guéhéneuc École Polytechnique de Montréal, Canada Andy Kellens Vrije Universiteit Brussel, Belgium Michele Lanza University of Lugano, Switzerland Radu Marinescu Politehnica University of Timisoara, Romania Oscar Nierstrasz University of Bern, Switzerland Pascal Vollmer ICT Software Engineering, Germany Thomas Zimmermann Microsoft Research http://moose.unibe.ch/events/famoosr2009
Transcript of FAMOOSr 2009 - Inria · 2015-11-03 · FAMOOSr 2009 3rd Workshop on FAMIX and MOOSE in Software...

FAMOOSr 2009
3rd Workshop on FAMIX and MOOSE in Software Reengineering
Organizers:Simon Denier INRIA Lille-Nord Europe, FranceTudor Gîrba University of Bern, Switzerland
Program Committee:Gabriela Arevalo LIFIA La Plata, ArgentinaJohan Brichau UniversitÃl’ catholique de Louvain, BelgiumSerge Demeyer University of Antwerp, BelgiumYann-Gaël Guéhéneuc École Polytechnique de Montréal, CanadaAndy Kellens Vrije Universiteit Brussel, BelgiumMichele Lanza University of Lugano, SwitzerlandRadu Marinescu Politehnica University of Timisoara, RomaniaOscar Nierstrasz University of Bern, SwitzerlandPascal Vollmer ICT Software Engineering, GermanyThomas Zimmermann Microsoft Research
http://moose.unibe.ch/events/famoosr2009

About FAMOOSr
The goal of the FAMOOSr workshop is to strengthen the community of researchers and practitioners who are workingin re- and reverse engineering, by providing a forum for building future research using Moose and FAMIX as sharedinfrastructure.
Research should be collaborative and supported by tools. The increasing amount of data available about softwaresystems poses new challenges for reengineering research, as the proposed approaches need to scale. In this context,concerns about meta-modeling and analysis techniques need to be augmented by technical concerns about how toreuse and how to build upon the efforts of previous research.
That is why Moose is an open-source software for researchers to build and share their analysis, meta-models, and data.Both FAMIX and Moose started in the context of FAMOOS, a European research project on object-oriented frameworks.Back in 1997 Moose was as a simple implementation of the FAMIX meta-model, which was a language independentmeta-model for object-oriented systems. However over the past decade, Moose has been used in a growing number ofresearch projects and has evolved to be a generic environment for various reverse and reengineering activities. In thesame time, FAMIX was extended to support emerging research interest such as dynamic analysis, evolution analysis,identifier analysis, bug tracking analysis, or visualization. Recent work includes analysis of software architecture andsemantic annotations.
Currently, several research groups are using Moose as a platform, or FAMIX as a meta-model, and other groupsannounced interest in using them in the future.
Simon & TudorOctober 11, 2009

Table of Contents
Session 1: Tools1. Identifying Cycle Causes With CycleTable
Jannik Laval, Simon Denier, Stéphane Ducasse
2. Lumiere: An Infrastructure for Producing 3D Applications in SmalltalkFernando Olivero, Michele Lanza, Romain Robbes
3. Miler – A Tool Infrastructure to Analyze Mailing ListsAlberto Bacchelli, Michele Lanza, Marco D’Ambros
Session 2: Models1. Challenges for Domain Knowledge Driven Program Analysis
Daniel Ratiu
2. Driving the refactoring of Java Enterprise Applications by evaluating the distance between application elementsFabrizio Perin
3. Why and How to Substantiate the Good of our Reverse Engineering Tools?David Röthlisberger

Identifying cycle causes with CycleTable
Jannik Laval, Simon Denier, Stephane DucasseRMoD Team, INRIA, Lille, France
Abstract
Identifying and understanding cycles in large applica-tions is a challenging task. In this paper we present Cy-cleTable which displays both direct and indirect references.It shows how minimal cycles are intertwined through sharededges and allows the reengineer to devise simple strategiesto remove them.
1 Introduction
Understanding the structure of large applications is achallenging but important task. Several approaches provideinformation on packages and their relationships, by visu-alizing software artifacts, metrics, their structure and theirevolution. Software metrics can be somehow difficult to un-derstand since they are dependent on projects. DistributionMap [1] alleviates this problem by showing how propertiesare spread over an application. Lanza et al. [2] propose torecover high level views by visualizing relationships. Pack-age Surface Blueprint [3] reveals the package internal struc-ture and relationships among other packages.
In previous work, we enhanced Dependency Struc-ture Matrix (eDSM) [4] to visualize dependencies be-tween packages, showing in each matrix cell informationabout the dependencies at the fine grain of classes (inheri-tance, class references, invocations, referencing and refer-enced classes/methods). eDSM proved useful to providean overview of dependencies, detect direct cycles (a cyclebetween two packages) and provide information to removethem. However, removing all direct cycles does not neces-sarily remove all cyclic dependencies because there couldbe indirect cycles (between more than two packages). Al-though indirect cycles are also displayed by eDSM, they arehard to read in the eDSM layout, making the task inefficient.
In this paper, we present a new visualization, called Cy-cleTable, entirely dedicated to cyclic dependencies assess-ment. CycleTable layout displays both direct and indi-rect cycles and shows how minimal cycles are intertwinedthrough shared edges. CycleTable combines this layout
with the enriched cells of eDSM to provide the details ofdependencies at class level.
Next section introduces the challenges of cycle analy-sis with graph layout and eDSM. Section 3 explains Cy-cleTable layout and enriched cells. Section 4 presents asample of cyclic dependencies displayed with CycleTableand discusses the criteria to break cycles as highlighted bythe visualization.
2 Cycle Visualization
Figure 2 shows a sample graph with five nodes and threeminimal cycles. Each edge is weighted. Notice that cycleA-B-C and A-B-E share a common edge (in yellow) fromA to B. This shared edge is interesting to spot since it joinstwo cycles and by removing it we would break those cycles.
Graph layouts offer an intuitive representation of graphs,and some handle cyclic graph better than others. On largegraphs, complex layouts may reduce the clutter but this isoften not simple to achieve. In addition, in the context ofDSM we enhanced the DSM cells to convey much moreinformation about the strength, the nature and consequencesof a cycle. Now it is difficult to combine a graph layoutwith enriched cells (see Figure 4 for a cell sample), as anenriched cell represents an edge in a graph. Enriched cellis an important asset of our work with eDSM as it providesfine-grained details of a dependency between two packages,and enables small multiples as well as micro-macro readingeffects [5].
In eDSM we used a matrix, the traditional support ofDSM. It provides a regular structure which is the same atany scale: it handles the repetitive arrangement of enrichedcells, enabling the above effects. It is a fundamental ele-ment of eDSM design. In Figure 1, four packages belongingto Pharo kernel (an open-source Smalltalk) are presentedin a eDSM. It shows edges involved in direct cycles in redand pink cells, indirect cycles in yellow. More explanationsabout the design and usage of eDSM are available in [4].
While eDSM allows us to analyze direct cycles comfort-ably, we could not address the problem of indirect cyclesleft over after removal of direct cycles. The main reason
1

Figure 1. Some Pharo core packages in aeDSM (with cycles overlayed)
for this problem is that it is difficult to read an indirect cy-cle in the matrix, i.e., to follow the sequence of cells repre-senting the sequence of edges in the cycle. The order canappear quite arbitrary as one has to jump between differentcolumns and rows (this problem does not exist with directcycles as there is only two cells, mirroring each other alongthe diagonal). Cycles have been overlayed in Figure 1 toshow the complexity of reading indirect cycles, intertwinedwith direct cycles.
3 CycleTable
We have built the CycleTable design with the single pur-pose of visualizing cycles. As a consequence, CycleTabledoes not show a complete overview of dependencies be-tween packages as eDSM does. It complements eDSM.CycleTable is a rectangular matrix where nodes are placedin rows and cycles in columns. CycleTable (i) shows eachminimal cycle clearly and independently, (ii) highlightsshared edges between minimal cycles, and (iii) uses en-riched cells [4] to provide information about edge internals,enabling small multiples and micro-macro reading [5] i.e.,variations of the same structure to reveal information. Wedetail each of these points now.
3.1 Minimal Cycle
A minimal cycle is a cycle with no repeated nodes otherthan the starting and ending nodes. For example, in Fig-ure 2, A-B-E and A-B-C are two different minimal cycles,but A-B-C-D-C is not because C is present twice. With min-imal cycles, the visualization provides all edges contains incycles. Therefore it is not necessary to show complex (in-tertwined) cycles. In the CycleTable layout, each minimalcycle is represented directly and independently in its owncolumn.
3.2 CycleTable Layout
The CycleTable layout is presented in Figure 3. Thisfigure shows a sample CycleTable layout for the graph inFigure 2. The first column (header) contains the name ofpackages involved in cycles, then all minimal cycles are rep-resented column by column. A box at the intersection of arow and a column indicates that the package is involved inthe cycle.
One package per row. Each row contains dependencies(as boxes) from the package in the header. Number in eachbox represents the weight of the edge. In Figure 3, first rowrepresents package A, which depends on package B witha weight of 10. Second row represents package B, whichdepends on E (weight 9) and C (weight 4).
One cycle per column. In the right part of the table, eachcolumn represents a cycle. In Figure 3, the first columninvolves packages A, B and E in a cycle. Each minimalcycle is represented independently.
Shared edges. Cells with the same background color rep-resent the same edge between two packages, shared by mul-tiple cycles. In Figure 3, first row contains two boxes with ayellow background color. It represents the same edge fromA to B, involved in the two distinct cycles A-B-E and A-B-C. It is a valuable information for reengineering cycles.Indeed, removing or reversing A-B would solve two cycles.
3.3 CycleTable Cell
Box content is customized to display enriched cells asin eDSM [4]. An enriched cell displays all dependencies atclass level from one package to the other. A CycleTable cellis structured in three parts: (i) on top, position in the cycle,(ii) in center, an enriched cell as in DSM, and (iii) on right,a colored frame if the edge is shared by multiple cycles.
2

AB
E
D
C
1
9
10
43
1
1
Figure 2. Sample graph with three cycles.
A
B
E
C
D
B-10
E-9
A-1
A-3
C-4
B-10
C-1
D-1
A-B-E Cycle
Shared edge A-BSource node B
Edge A-BEdge B-C
Edges from C
packages involved in cycles
each column is a cycle
Figure 3. CycleTable for sample graph.
Position in the cycle. The position in the cycle representsa relative order between edges. This number is sometimesnecessary to retrieve the exact order of edges in indirect cy-cles. In Figure 5, numbers allow one to read indirect cyclesin third and fifth columns.
Enriched cell. Cell contents gives a detailed overview ofdependencies from the package in the header of the row(source package) to the next package in the cycle (targetpackage). Each cell represents a small context, which en-forces comparison with others. The objective is to createsmall multiples [5].
An enriched cell is composed of three parts. The toprow gives an overview of the strength and nature of the de-pendencies. The two large boxes detail dependencies goingfrom the top box to the bottom box i.e., from the sourcepackage to the target package. Each box contains squares
that represent involved classes: referencing classes in thesource package and referenced classes in the target pack-age. Edges between squares links each source class (in topbox) to its target classes (in bottom box). As this structureis the same as in eDSM [4], we give no more explanation inthis paper.
Number
Source package
Target package
Ratio of concerned classes
in each package
Tot Inh Ref Msg Ext
Green fill: no dependency to other packages
Red fill: dependencies in both directions with other packages
Orange fill: dependencies from or to other packages
Dependency number and nature
C
Z X Y
BA
Colored link based on:- Red: references (+invocations)- Blue: inheritance- Green: invocations- Black: inheritance+others
Position in the cycle
Color: shared edge
Figure 4. Information in CycleTable cell.
4 Breaking Cycles with CycleTable
Figure 5 shows a CycleTable with the sample four pack-ages of Pharo core presented in Figure 1. Five minimal cy-cles are immediately made visible. It also appears that threeedges are each involved in multiple cycles (with the red,blue, and orange frames).
An important asset of CycleTable is that it does not focuson a single solution to break cyclic dependencies. It ratherhighlights different options as there are many ways to re-solve such cyclic dependencies. Only the reengineer canselect what he thinks is the best solution based on a matterof criteria. We now discuss how CycleTable allows one toconsider solutions for solving cycles in Figure 5.
First things to consider in CycleTable are the sharededges, the number of cycles they are involved in,and their weight. For example, the blue cell linkingSystem-FileRegistry to Kernel is in the two in-direct cycles. Yet it has a weight of six dependenciesand involves six classes as well, which can require somework to remove. Finally, from a semantic point of view,Kernel is at the root of many functions in the systemso it seems difficult to remove such dependencies fromSystem-FileRegistry.
Instead, we turn our focus to the red cells, linkingKernel to System-FilePackage. It has a very lowweight and involves only two classes. This is the minimaldependency we can get between two packages and seems asa prime candidate for removal. Removing this dependency(by moving a class, changing the method, or making a class
3

Figure 5. Pharo core from Figure 1 in CycleTable.
extension) would break the first two cycles from the left.The third cycle links directly System-FilePackage
and System-Support and is not intertwined with others.There is a weak link from the second package to the firstwhich seems easy enough to remove.
Finally, the orange edge links the last two cy-cles. However, it is obvious that it is too com-plex to be removed. The fourth cycle seems solvableby removing its last edge (from System-Support toSystem-FileRegistry). The last cycle, linking di-rectly Kernel and System-Support is too complexso that a simple removal strategy can be devised with Cy-cleTable. Both packages are at the very core of Pharo sys-tem and are highly coupled together.
5 Conclusion
In this paper we presented CycleTable. This visualiza-tion shows cycles between packages in a system. Each cy-cle is presented in a separated column. A colored frameshow which edge is shared by several cycles. To completethe visualization, enriched cells (proposed in [4]) have beenadapted and integrated to represent each edge.
This visualization is for now a good complement of a
DSM visualization. This visualization allows us to solvecycles separately or conjointly.
Future work will focus on computing heuristics for high-lighting interesting edges in cycles (either because of theirlow weight or because they are shared by many cycles),prone to removal by the reengineer.
References
[1] S. Ducasse, T. Gırba, and A. Kuhn. Distribution map. In Pro-ceedings of 22nd IEEE International Conference on SoftwareMaintenance (ICSM ’06), pages 203–212, Los Alamitos CA,2006. IEEE Computer Society.
[2] S. Ducasse and M. Lanza. The class blueprint: Visually sup-porting the understanding of classes. Transactions on Soft-ware Engineering (TSE), 31(1):75–90, Jan. 2005.
[3] S. Ducasse, D. Pollet, M. Suen, H. Abdeen, and I. Alloui.Package surface blueprints: Visually supporting the under-standing of package relationships. In ICSM ’07: Proceed-ings of the IEEE International Conference on Software Main-tenance, pages 94–103, 2007.
[4] J. Laval, S. Denier, S. Ducasse, and A. Bergel. Identifyingcycle causes with enriched dependency structural matrix. InWCRE ’09: Proceedings of the 2009 16th Working Confer-ence on Reverse Engineering, 2009.
[5] E. R. Tufte. Visual Explanations. Graphics Press, 1997.
4

Lumiere: An Infrastructure for Producing 3DApplications in Smalltalk
Fernando Olivero, Michele Lanza, Romain RobbesREVEAL @ Faculty of Informatics, University of Lugano{fernando.olivero,michele.lanza,romain.robbes}@usi.ch
Abstract—With the goal of developing 3D applications using
Smalltalk, we decided to build a lightweight 3D framework
named Lumiere from scratch, because after conducting a brief
survey of the available frameworks, we found many of them to be
either outdated, abandoned, undocumented or too heavyweight.
In this paper we present the design and implementation
of Lumiere , an object-oriented framework based on a stage
metaphor to display interactive 3D micro-worlds.
I. INTRODUCTION
The Smalltalk language and its many dialects include sev-eral frameworks for developing 3D applications. Some of themare simple wrappers of low level rendering libraries (such asOpenGL or DirectX), while others are complete frameworksfor producing 3D graphics. However, many of them areoutdated, unmaintained, undocumented or heavyweight [2].
Therefore we built Lumiere , the missing 3D frameworkin Smalltalk. We implemented it using Pharo and OpenGL,with the objective of producing 3D graphics with a simple,modern, lightweight and efficient framework. Lumiere is anobject-oriented framework that provides a layer of abstractionover graphical primitives and low-level rendering. The low-level rendering of the framework is done by OpenGL, anindustry standard library for doing high performance graphics.We chose to use OpenGL for efficiency, maintainability, andportability reasons [2]. Lumiere provides the infrastructurefor building 3D applications using intuitive metaphors andhigh-level concepts such as shapes, lights, cameras and stages.Using Lumiere a programmer can create complex 3D scenesthat we call micro-worlds, using performant 3D graphics fullyintegrated with the underlying environment (Figure 1).
Fig. 1. Lumiere micro-worlds
In the following sections we describe the design and imple-mentation of Lumiere .
II. THE DESIGN OF LumiereWhen designing Lumiere we chose to build the framework
around an intuitive metaphor, promoting ease of usage andunderstanding, because of the immediate mental model thatmetaphors provide. We settled on a stage metaphor, whererendering takes place by cameras taking pictures of micro-worlds lit by the lights of the stage. Similar concepts werealready present in other Smalltalk frameworks such as Bal-lon3D and Croquet [3], and also in foreign languages such asOpen Scene Graph1. In the following we detail each aspect ofthe design and provide UML diagrams of the exposed APIs.
A. Rendering a Scene
A stage provides a context for taking pictures of a micro-world, therefore a stage contains a micro-world, cameras andlights, and other environmental properties such as ambientlights and fog (see Figure 2).
addLight:takePictureOn:viewingVolumeWithAngle: angle aspect: aspect zNear: near zFar:openAsMorph
microworldcameraslightslightingModelselectionPolicyselectedShapeshighlightedShapes
LStage
loadInto:moveForwardstrafeRightbeGroundMovementtakePictureOf:onangle:aspect:zNear:zFar:
locationorientationviewingVolume
LCamera
loadInto:turnOn
ambientdiffusespecularlocation
LLight
LDirectional
intensity: angle:
spotDirectionexponent
LSpotlight
attenuationFactorLPositional
Fig. 2. UML class diagram of Lumiere stages, lights, and cameras
The lights are responsible for illuminating the scenes. Thereare several types of lights in Lumiere , similar to the OpenGLlighting model. Each light can be positioned anywhere on stageand contributes to the final appearance of the shapes in a scene.
Cameras take pictures of the microworlds, rendering themon a canvas. They dictate several properties of the finaldrawing such as the distance, orientation and angle of sightfrom which the picture is taken. As such, they determine whichshapes of the micro-world are visible in the rendered image.
1http://www.openscenegraph.org/projects/osg

B. Modeling a micro-world
A Lumiere micro-world is a 3D world, programmaticallymodeled and populated by a diverse variety of visual objectscalled shapes. Shapes are the building blocks of Lumierescenes, they have visual properties such as scale, color, mate-rials and textures. A shape can be a primitive or a compositeshape that groups several lower-level shapes. Lumiere providesspecial-purpose composite shapes with a predefined layoutto simplify the positioning of the shapes composing it (seeFigure 3).
addChild:at:openAsMorph
sceneGraphboundingVolume
LMicroworldboundingVolumeLumiereShape
rungap
LLayout
modelscalefillStylematerialtextures
LShapeshapesLCompositeShape
Fig. 3. Lumiere micro-world and shapes
The visual properties, orientation, and location of Lumiereshapes are described programatically when designing aLumiere micro-world. The spatial relationships betweenshapes are modeled in a micro-world using a scene graphimplementation, which is a hierarchical representation of theposition of the shapes that populate a given micro-world. Ascene graph is a directed graph composed by different typesof nodes. There are nodes for loading translations, rotations,scales into a canvas. Other nodes when loaded into a canvasgenerate a particular figure to be drawn (see Figure 4).
#model#accept:#loadInto:
parentLNode
LDrawableNode
shaperenderingState
LShapeNode
#addChild:at:childLMiddleNode
x, y, z
LAffineTransformationNode
angleLRotationNodeLTranslationNode LScaleNode
#addChild:at:childrenLGroupNode
Fig. 4. Lumiere scene graph nodes
When a Lumiere node is loaded into a canvas, it modifiesthe state of the latter according to the its type. For examplewhen a scale node is loaded into a canvas it produces amodification in the size of every shape rendered afterwards.
III. THE IMPLEMENTATION OF LumiereLumiere uses several underlying frameworks, from the
base graphics renderer, OpenGL to the Pharo UI framework,Morphic. The architecture of Lumiere is depicted in Figure 5.
StageMorph
Stage
Microworld
SceneGraph
OpenGLCanvas
OpenGLContext
AlienOpenGLAlienFFI
Morphic
OpenGL
Pharo
Lumière
Fig. 5. The architecture of Lumiere
Lumiere uses OpenGL through AlienFFI, a foreign librarywrapper framework. It uses a canvas framework to facilitate itsinteractions with the OpenGL renderer, and is integrated withthe Pharo environment through the Morphic, Omnibrowser andGlamour frameworks.
A. AlienOpenGL
OpenGL is written in C to maximize performance andhence Lumiere needs to interface with it. We implementedAlienOpenGL
2, a framework that uses AlienFFI to access theunderlying functionality offered by OpenGL. AlienOpenGLallows one to invoke library functions by sending messages toa singleton instance of ALienOpenGLLibrary.
addressfreefloatAt:signedByteAt:
Alien
GLConstant
GLEnum GLBoolean
GLFloat GLInt GIntVector
pickedNamesfirstNamePickedsecondNamePicked
GLSelectionBuffer
alienMethodNamed:libraryName
alienHandle
AlienLibrary
glColor3fRed:green:blue:glEnable:glLoadName:glMatrixMode:glGetInteger:
AlienOpenGLLibrary
gluPerspectiveAngle:aspect:zNear:zFar:gluLookAtEye:center:up:gluPickMatrixX:y:width:height:viewport:
AlienGluLibrary
Fig. 6. AlienOpenGL API
See Figure 6 for a UML class diagram of the API ofAlienOpenGL.
This framework also provides OpenGL data types reifi-cation, access to the Glu library (an extension to the baseOpenGL library), and facilities for creating and manipulatingan OpenGL drawable surface, managed both by the operatingsystem and AlienOpenGL, where the rendering takes place.
2AlienOpenGL is available at http://www.squeaksource.com/AlienOpenGL

B. Canvas and context
When taking pictures of a micro-world with a camera,Lumiere traverses the scene and loads the primitive shapesonto a canvas, which is an abstraction of a 3D surface,where primitive figures can be rendered. A canvas has acontext, an object that reifies an OpenGL context (a particularstate of the base rendering system), and acts as an adapterbetween Lumiere code and the basic OpenGL protocol ofthe AlienOpenGL framework. The canvas context allows usto provide some optimizations by maintaining a cache of thestate changes, and forwarding only real state changes to thelow level AlienOpenGL library.
A canvas forwards the load primitives requests to theappropriate class of geometry object of Lumiere , for examplethe message #loadSphereScaled: is forwarded to aninstance of LSphere. This enables to implement differentvertex loading mechanisms without modifying any of the can-vas load methods, decoupling the request of loading a primitivefrom the actual low-level implementation. In Figure 7 wedisplay the canvas, context and geometry class diagram.
backgroundColor:loadColor:loadMaterial:loadAxisScaled:loadCubeScaled:loadCylinderScaled:loadDiskScaled:loadLineScaled:loadSphereScaled:useLightingModel:
contextLOpenGLCanvas
disableAllLightsenableTexture:doBackfaceCullingclearTransformationloadModelviewModeloadColor:loadScale:makeCurrent
oglcolormatrixModefillModeloadedMaterial
LOpenGLContext
LCylinder LCube LSphere LPyramid
loadWithNormalsInto:scale:loadWithoutNormalsInto:scale:loadForPickingInto:scale:
LGeometry
Fig. 7. Canvas, context and geometry
C. Scene graph
The scene graph dictates the final appearance, orientation,and location of the shapes that populate a micro-world. Eachnode in the path from the root node to a drawable node,contributes to modify the mentioned properties. For example,inserting a scale node after the root node of a micro-world thatcontains only one drawable node that renders a cube, affectsthe final size of the cube being rendered.
A scene graph is a convenient structure for accessing allthe shapes in a micro-world when performing several tasks.Lumiere uses the Visitor design pattern [1] to streamlinethis process. Lumiere includes three different visitors (seeFigure 8) for traversing scene graphs:
1) LRenderingVisitor: A rendering visitor traversesthe scene and loads the visible nodes into a canvas todisplay images on the screen.
2) LScenePickingVisitor: Picking is the processtrough which OpenGL determines which 3D object isunder the mouse cursor. OpenGL renders the scene ina hidden buffer for this, so the picking visitor rendersa lower detail version of the drawables for optimizationpurposes.
3) LBVHCullingVisitor: Culling is the process ofdetermining which parts of the scene are visible ornot. The culling visitor traverses the scene performingintersection tests, pruning the nodes of the shapes thatare outside a particular viewing volume.
traverse:andRenderOn:
visitedselectedNodeshighlightedNodes
LRenderingVisitor
visitDrawableNode:visitGroupNode:visitMiddleNode:visitRotationNode:visitTranslationNode:visitScaleNode:
sceneGraphcanvasprunedNodes
LSceneGraphVisitor
traverse:andRenderOn:loadNodeNamed:
namedNodesLScenePickingVisitor
traverse:andRenderOn:loadNodeNamed:
cameraLBVHCullingVisitor
Fig. 8. Lumiere scene visitors
D. Underlying environment integration
Lumiere is fully integrated in the Pharo smalltalk envi-ronment. A stage can be opened in a window, integrated inbrowsers and respond to mouse and keyboard events.
Integration with Morphic. Lumiere stages are integratedinto Morphic, the standard UI framework of Pharo. Lu-miere shapes, micro-worlds and stages answer the message#openAsMorph, opening an instance of a StageMorph. AStage Morph holds an AlienOpenGL draw-able for performingthe low level rendering, displaying pictures of the micro-worlds taken by the cameras of the stages.
Integration with Omnibrowser. Stage morphs can beinserted into Omnibrowser, the standard window environmentof Pharo. A stage morph answers the messages #addWindowand #removeWindow, for adding or removing the windowdecorating it.
Integration with Glamour. Lumiere stages can also be in-tegrated into Glamour, a new scriptable browser framework forPharo. Any stage can be rendered as a Lumiere presentationinserted into a glamour browser (see Figure 9).
Responding to user events. The shapes of micro-worldsdisplayed by stage morphs can react to user input, from thekeyboard and mouse. Lumiere provides modifiable stage inter-action policies to control the highlighting, selection, clickingand keyboard event handling. For example some stage interac-tion policies specify single or multiple selection, floating overshapes awareness and different camera keyboards movements.

Fig. 9. Glamour integration
In Figure 10 we present to the right a stage morph with aselected shape, and to the left a stage morph with a highlightedshape integrated into Omnibrowser.
Fig. 10. Pharo integration
IV. CONCLUSION
In this paper we presented the design and implementation ofLumiere , our novel 3D framework implemented in Smalltalk.
Lumiere uses a stage metaphor to render micro-worlds –graphs of 3D shapes generated programmatically– in OpenGL.Lumiere is implemented using Pharo and is fully integratedwith the underlying environment. The 3D scenes generated byLumiere can be integrated in Pharo’s windows and browsers,and Lumiere provides support for customizable keyboard andmouse interactions.
REFERENCES
[1] E. Gamma, R. Helm, R. Johnson, and J. Vlissides. Design Patterns: Ele-
ments of Reusable Object-Oriented Software. Addison Wesley, Reading,Mass., 1995.
[2] F. Olivero, M. Lanza, and R. Robbes. Lumiere: A novel framework forrendering 3d graphics in smalltalk. pages xxx – xxx. ACM Press, 2009.
[3] D. Smith, A. Kay, A. Raab, and D. Reed. Croquet - a collaborationsystem architecture, Jan. 2003.

Miler – A Tool Infrastructure to Analyze Mailing Lists
Alberto Bacchelli, Michele Lanza, Marco D’AmbrosREVEAL @ Faculty of Informatics - University of Lugano, Switzerland
Abstract—The information that can be used to analyzesoftware systems is not limited to the raw source code, butalso to any other artifact produced during its evolution. Inour recent work we have focused on how archives of e-mailsthat concern a system can be exploited to enhance programcomprehension.
In this paper we present Miler, a tool we have built for thatpurpose. We describe its architecture and infrastructure, andthe FAMIX meta-model extension we have devised to modelmailing list archives.
I. INTRODUCTION
In software systems, not only the source code, but anyother artifact revolving around them (requirements, designdocuments, user manuals, bug reports, etc.) concurs todefine their shapes. Such artifacts add information eitherby describing a specific piece of the source code or generallyintroducing concepts or necessities.
E-mail archives are widely employed during the devel-opment of software systems and contain information atdifferent levels of abstraction. E-mails are used to discussissues ranging from low-level decisions (e.g., implementationof specific software artifacts, bug fixing, discussing userinterface problems) up to high-level considerations (e.g.,
design rationales, future planning). They can often be writtenand read by both software system developers and end-users,and always come with additional meta-information (e.g., time-stamp, thread, author) that can be taken into account.
Since the FAMIX meta-model was designed to be exten-sible, adding new information to the source code entitiesit models is straightforward. However, to add informationfrom e-mails it is first necessary to import messages from thearchives in which they reside. Then, the resulting data mustbe stored in an easily accessible persistent format, in orderto be used for subsequent analyses. Finally, the informationcontained in e-mails must be linked to the entities in thesystem model, described according to the FAMIX meta-model.
In this article we present Miler, a tool infrastructure thattackles these issues and allows one to analyze e-mail archivesof software systems. Miler is implemented in VisualWorks1
Smalltalk, uses the Moose Reengineering Environment forthe modeling tasks, and uses GLORP [4] and the Metabase[2] for the object persistency. In previous work we usedthis infrastructure to create a benchmark for e-mail analysis
1http://www.cincomsmalltalk.com/
and to test different lightweight methodologies for linkinge-mails and source code [1].
Structure of the paper In Section II we present anoverview of the Miler architecture introducing its componentsand showing how they interact. Then we provide the detailsof our technique to import archives of mailing lists, and weexplain how we store e-mails in a database transparentlythanks to a simple meta-model description. In Section III,we discuss how to use Miler to deal with the merging of themodel of the system and the model of the e-mail archive.We conclude in Section IV.
II. MILER
Figure 1 depicts an overview of Miler’s architecture.After a target system is chosen (point I), the source codeis imported into the MOOSE Reengineering Environmentthrough an importer module. The importer parses the sourcecode, generate the corresponding model according to theFAMIX meta-model and exports it in a format that can beloaded by the MOOSE Environment. It is possible both touse a third-part importer or to implement a specific one. Forexample, when working with Java systems we used iPlasma2
as importer, while we implemented specific importers to dealwith languages (e.g., PHP, Actionscript) not supported byany external tool. After the necessary models are availablefrom Moose, they are included into the core of Miler as“System Models”.
After the target system is selected, the e-mails in thearchive of mailing lists are also imported into Miler. Differentsystems use different applications to manage and archivemailing lists, thus not offering a consistent way to access totheir data. Moreover, such applications could change duringthe system lifetime. For this reason, in the worst case scenario,it might be necessary to write at least one importer per systemto collect e-mails. We tackled this issue by using MarkMail3,a free service for searching mailing list archives, which areconstantly updated. More than 7,000 mailing lists, takenespecially from open source software projects, are stored anddisplayed in a consistent manner. It is possible both to searche-mails through queries and to access all the e-mails of aspecific mailing list. We implemented an importer (Figure 1,point II) that crawls the MarkMail website and extracts all thee-mails from the selected mailing lists and instantiates them
2http://loose.upt.ro/iplasma/3http://markmail.org/

External Components
Miler Core
Database
Target System
MarkMail Service
Source Control System
Source Code Importer
MOOSEReengineeringEnvironment
MarkMailImporter
System Models
Miler GameWeb
Application
GL
OR
P
Reviewers
Annotations
E-Mails
Mailing Lists
I
II
III
IV
V
Miler
Figure 1. Miler architecture
as objects that are part of the Miler core. As it appears fromthe architecture diagram, it is easy to add various importerscapable of extracting data from other sources than MarkMailservice and instantiate them as objects.
To store information gathered from a mailing list, we usean approach based on object persistency rather than using textfiles (e.g., as done with MOOSE, whose last, and currentlyused, file format is MSE4). Text files do not require a DBMS,however data cannot be accessed remotely, and they generateperformance bottlenecks, since the entire text file must alwaysbe parsed (i.e., it is not possible to import only parts of themodel). When considering mailing lists, the performanceaspect is relevant as they often contain thousands of e-mails.
In Figure 1, the orange components that reside inside thecore of Miler (Point IV) are modeled according to a meta-model written in Meta5. Thanks to these meta-descriptions,the Metabase component is capable of automatically gener-ating the corresponding GLORP class descriptions, whichdefine the mapping between the Smalltalk classes and the
4http://scg.unibe.ch/wiki/projects/fame/mse5Meta is the previous version of Fame (http://scg.unibe.ch/wiki/projects/
fame/)
database tables [2]. In this way, objects are stored andretrieved from the chosen database transparently through theGLORP layer: It is sufficient to save the objects of the modelthe first time they are created and to create a connectionwith the database when loading Miler. In addition, sinceobjects are stored in a common database, it is possible toaccess them, even remotely, from different languages andapplications.
The last component of the Miler architecture is the “MilerGame”(Figure 1, Point V). This is a web application usedto manually annotate the entities of the systems with thee-mails discussing them. This application is built on the topof the Miler Core using the Seaside web framework [3]. InSection III, we describe in detail the application from a userpoint of view.
III. ENTITIES AND E-MAILS
After the core of Miler is filled with the necessary data,gathered from both source code and message archives, thestep that follows is extending the FAMIX models with therelevant information that resides inside the model of e-mails,i.e., linking software system entities (e.g., classes) with the

I
II
III IV
V
Figure 2. The Miler Game Web Application
e-mails discussing them. Since e-mails are written in free-form text, automatically finding such missing links is nota trivial task [1]. To create a benchmark against which tocompare approaches that establish such links, we devised the“Miler Game”, a web application that permits to efficientlyannotate the system entities with the corresponding e-mails.
Figure 2 illustrates the main page of the web application,which is displayed after the user login. Different interactivepanels form this page: the “Systems” panel (Point I) showsthe list of the software systems for which both the FAMIXmodel and the e-mails are available in Miler. The user herechooses the system to be considered. The “Mails” panel(Point II) informs the user about how many e-mails havebeen read for each system. Since it is possible to setup apredetermined number of mails to read per system (e.g., tocreate benchmarks [1]), this number is also displayed. The“Navigation” panel (Point III) allows the user to retrieve ane-mail knowing its unique permalink (as we were using theMarkMail importer, we decided to use the one present in theMarkMail service). The main panel of the application is thee-mail panel (Point IV), in which the headers and content ofan e-mail are displayed. Headers are displayed on top of themessage, including the subject, the author, the date and thelist to which the e-mail was sent, and the unique permalinkof the message inside Miler. The message content is coloredlike in common e-mail readers: “Threaded” messages thatare part of a larger discussion often quote sentences from
previous e-mails, thus, in order to increase readability, theMiler Game colors quoted text differently. Finally, there is the“Annotation” panel (Point V) with two components: the listof the entities that are already annotated (i.e., are discussedin the e-mail) and an autocompletion field (Figure 3).
Figure 3. Autocompletion in the Miler Game
This field helps the user in annotating the e-mail at differentlevels: first, it allows the user to see all the entities whosename include the letters she inserted; second, it avoidstypos and forces the user to enter only entities that arereally present in the FAMIX models; third, the entity namesare colored according to the time proximity of the e-mail

date and the entity release. In Miler, it is possible to havemore than one release of the same system, and when theentity names are displayed their date is taken into account.If the entity is present in the last release before the e-mail date, then its name will be colored in black in theautocompletion menu, if the entity is older, then it willbe colored in light gray. On the contrary, if the entityappears in the version released after the e-mail date, its colorwill be blue, otherwise light blue, if present in a versionwhich was released later. This helps the user discerning theappropriate entity. For example, if we consider the classnamed ClassFinder, that is also present in Figure 3, theautocompletion menu shows two different entities with thisname: “org::apache::jmeter::util::ClassFinder”, in light gray,and “org::apache::jorphan::reflect::ClassFinder”, in black. Ifthe class is mentioned only by its name in the e-mail, withoutthe package, and there is no other information, the user candecide to take the latter, as it is more probable that the e-mailis referring to it.
namerawContent
Miler.MEntity
rawContentlistpermalinksubjecttimestamp
Miler.Mail
isReported
Miler.Annotation
name
Miler.Reviewer
namelanguage
Miler.MSystem
nametimestamp
Miler.MRelease
1 1..*
10..*
11..*
1..*
1 1
1
10..*
SCG.Moose.FAMIXAbstractObject
Figure 4. UML Schema of the Miler core
Figure 4 shows the core meta-model behind Miler. MSys-
tem is the class representing a system that is imported inMiler. Since GLORP adds an hidden “id” instance variableto every object it stores, it is possible for the name to benot unique. Each MSystem owns a collection of MReleases,which represent the various version of the source code.Each MRelease is characterized by a “timestamp” and has acollection of unique MEntities. In our case, we decided tocreate a new class to represent entities of the system, insteadof extending Moose definitions, however it is possible tosubstitute this abstraction with a FAMIXAbstractObject class.To do so, the developer must describe that class meta-modelusing Meta to specify the information, i.e., instance variables,to be stored and retrieved from the database.
In Figure 4, the class Reviewer represents the abstractionof the users of Miler. When a reviewer reads a new e-mail, this generates a new Annotation that expresses thereviewer’s opinion on the connection between a Mail and
zero or more MEntities. This class shows the “missing link”between source code entities and e-mails. Once the linksare validated (e.g., by a review or other expert users), theAnnotation can be put aside and the MEntity can be directlyextended with the new information. If FAMIXAbstractObject
takes the place of MEntity, it is possible to extend it eitherby using a new instance variable or by using the property
attribute already existing in the class.Annotations can be generated not only by the manual
work of users, but also implementing an automated method.For example, it was shown that searching for entity namesinto the content of mails using regular expressions is oftensufficient to establish a correct link between an e-mail andsource code artifacts [1].
IV. SUMMARY
In this paper we have presented Miler, a novel toolinfrastructure to establish links between e-mails and sourcecode artifacts. We described the architecture of Miler,discussing the different modules composing it, and presentedour implementation and how it can be extended. We thenpresented Miler Game, a web application we devised formanually linking the information in the e-mails with theentities of the system.
As future work, we plan to extend the “Miler Game”web application to allow selected users to easily performadministrative tasks, such as adding new systems, releasesor mailing lists, by simply providing a link to the versioncontrol repository or to the mailing list archive.
Acknowledgments We gratefully acknowledge the finan-cial support of the Swiss National Science foundation forthe project “DiCoSA” (SNF Project No. 118063).
REFERENCES
[1] A. Bacchelli, M. D’Ambros, M. Lanza, and R. Robbes.Benchmarking lightweight techniques to link e-mails and sourcecode. In Proceedings of WCRE 2009 (16th Working Conference
on Reverse Engineering), pages xxx–xxx. IEEE CS Press, 2009.
[2] M. D’Ambros, M. Lanza, and M. Pinzger. The metabase:Generating object persistency using meta descriptions. InProceedings of FAMOOSR 2007 (1st Workshop on FAMIX
and Moose in Reengineering), 2007.
[3] S. Ducasse, A. Lienhard, and L. Renggli. Seaside: A flexibleenvironment for building dynamic web applications. IEEE
Software, 24(5):56–63, 2007.
[4] A. Knight. Glorp: generic lightweight object-relational persis-tence. In OOPSLA ’00: Addendum to the 2000 proceedings
of the conference on Object-oriented programming, systems,
languages, and applications (Addendum), pages 173–174. ACMPress, 2000.

Challenges for Domain Knowledge Driven Program Analysis
Daniel RatiuTechnische Universitat Munchen
Abstract
Programming is a knowledge intensive activity. In or-
der to write and evolve programs, programmers make use of
knowledge of different kinds like about the business domain,
programming technologies or design. Most of the current
reverse engineering approaches do not explicitly take into
consideration the domain knowledge implemented in pro-
grams when the analyses are performed and thereby they
lose important information. This situation is due to a series
of difficulties that need to be overcome when performing
analyses that interpret the code from the point of view of do-
main knowledge. In this paper we advocate the need for the
explicit use of domain knowledge in program analyses and
we discuss the most important challenges that have to be
addressed to realize such analyses in the practice: making
the knowledge explicit, obtaining the knowledge, defining
appropriate interpretations, and recovering the interpreta-
tions automatically. We present islands of solutions to ap-
proach these challenges and we argue that to systematically
overcome them is required a community effort.
1 Introduction
Programs model aspects of the real world. Designheuristics and object-oriented design guidelines suggest thatthere needs to be a correspondence between program mod-ules and the domain knowledge that they implement [3].The situation in the practice is however different: unitsof knowledge are scattered between many program mod-ules and a single program module contains more knowl-edge units (phenomena known as delocalization and inter-leaving) – e. g. Figure 1 illustrates how are multiple kinds ofknowledge used in different program parts: different classesreference knowledge about the business domain (e. g. fam-ily), the programming technologies (e. g. XML), architec-ture (e. g. Visitor pattern), and Java core library. Therebythe structure of the program is only weakly related to thepartition of the domain knowledge that it implements. Byregarding programs purely from a structural point of view
!"#$%&##'()*+$%,&-.-'/+*$012
3"40$5'50+##'6&7#)%'$*30&*&%8#'90&*&%8'':'---''3"40$5';)$<'+55&38',=$#$8)7';2':'---'>''3"40$5'6&7#)%'50)%&,2':'---'>>
3"40$5'50+##'?@AB&7$+0$C&7'$*30&*&%8#'=$#$8)7':'---'''3"40$5';$#$86&7#)%,6&7#)%'32':'---''>>
D+;+'()*+$%
(&#$.%'()*+$%,&-.-'6+88&7%#2
67).7+**$%.'E&5F%)0).$&#''()*+$%,&-.-'?@A2
Figure 1. Weaving of different kinds (dimen-sions) of domain knowledge in programs
we lose the connection with the domain knowledge. Insteadof analyzing programs from the point of view of their struc-ture, one could change the focus and regard the code pri-mary from the point of view of the domain knowledge thatit uses. Our aim is to obtain and use a new interpretationof the code given in terms of the domain knowledge (Fig-ure 2). This high level interpretation is highly desirable (andmore natural) since the end-user changes requests, technol-ogy changes, the need to reuse already written code are allexpressed in terms of domain knowledge (about technicalor business domain) and how it is reflected in the code.
!"#$"%&
'()#"&%*+,()#"&%-,#(+)"#&+.#/0+-1%-+,2+#3-2,/0+-10+*%($3%$0+/0),(,-,#(
4#"&%*+5"#$"%&&,($+*%($3%$0+/0),(,-,#(
6#&53-0"
&0%(,($
7#&
% ,(89(# :*0/$ 0+;%2 0/
,(-0"5" 0-%-,# (+#)+5 "#$"%&2
!<+20&
%(-,. 2+;%2 0/
,(-0"5" 0-%-,# (+#)+5 "#$"%&2
7#&%,(+9(#:*0/$0
=%.1,(0+>-"3.-3"02
7#&%,(
&0%(,(
$ !"#"$"%&%
Figure 2. Program meanings
1

Currently, the use of domain knowledge is only sporadi-cally considered into automatic programs analysis practice.Instead of using the domain knowledge up-front in the anal-yses, today the reverse engineers implicitly interpret the do-main knowledge agnostic analysis results from the point ofview of his background knowledge. In automatic programanalysis approaches (Figure 3-top), the domain knowledgeis regarded as a helper in the analyses (at best), and besideseveral use-cases (concepts location being the most repre-sentative one), the domain knowledge is mostly ignored. Inour vision (Figure 3-bottom) rather than being only a helperin analyzing programs, the domain knowledge should playa fundamental role in any kind of program analysis. Basedon the domain meaning we can define completely new anal-yses and enhance the existent ones – e. g. the domain mean-ing can be used to lift the current analyses at the logicallevel such as: instead of assessing the structural modularityof a program we could assess its logical modularity, insteadof detecting code clones we could to address logical redun-dancy, etc. We advocate that the systematic use of domainknowledge when analyzing programs can leverage the cur-rent analyses at a higher level of abstraction, this being thecentral aim of reverse engineering [4].
!"#$%&'%"(&')"(&*
+&,-,'./0123456&(7
!"#$%&'8"(&
!"#$%&'()*"$+',"#-"".
!."#%()/%'%$',"#-"".!!!/%(,0#)1((%((2%#'
-"".3,(4+.,5+',"#
-"".
8"9%&:;#5*'<=&>'"<&$':$"-$5)6
+&,-,'#9=?=&(')&;53)"(&*7
!"#$%&'8"(&
*"0,$+.)6%4(%-"".
*"0,$+.)6%74#7+#$8/%'%$',"#)-"".!!!*"0,$+.)9"74.+:,'8
1((%((2%#')-"".3,(4+.,5+',"#
-"".
@A$"-$5)36;$#%;#$&3($=<&9B
:$"-$5)'595*C6=6
D")5=9'E9">*&(-&
@D")5=93F9">*&(-&3($=<&9B
:$"-$5)'595*C6=6'
Figure 3. Classical reverse engineering vs.domain knowledge driven program analysis
Outline. In the next sections we present a generic frame-work for assigning domain meaning to programs (Sec-tion 2), we discuss some challenges that need to be over-come in order to perform domain knowledge driven pro-gram analyses on a large scale (Section 3), we present is-lands of solutions for tackling these challenges (Section 4)and our call for a community effort (Section 5).
2 Assigning domain meaning to programs
In Figure 4 we present a generic framework to assign do-main meaning to programs. The key parts in the frameworkare the semantic domain, program abstraction, and inter-
pretation as we detail below.
!"#$"%& !"#$"%&'()*+"%,+-#. /0&%.+-,'1#&%-. 1#&%-.'2.#3405$0
!"#$%&%$#'#()"
Figure 4. Framework for assigning (domain)meaning to programs
Program abstraction. The program abstraction is amodel of the program that is rich enough to allow the de-sired analyses. The abstraction should not be too detailedto hinder the analyses due to too much information; at thesame time, the abstraction should not be too coarse-grainedto make the results of the analyses inaccurate.
Defining the program abstraction and extracting it withdifferent parsing technologies from the code is one of themostly studied issues in the reverse engineering. An ex-ample of an established program abstraction is the FAMIXmeta-model [5].
Semantic domain. The semantic domain is an adequaterepresentation of domain knowledge, that is used to inter-pret the program. The semantic domain should be flexibleenough to represent accurately (i. e. with minimal encodingbias) concepts from a wide variety of domains (e. g. frombusiness domains to programming technologies), at differ-ent levels of detail, from different perspectives (e. g. struc-ture, dynamics), and it should be rich enough to enable thedesired analyses.
Since in domain knowledge driven program analysis pro-grams are interpreted from the point of view of the knowl-edge that they implement (rather than based on the seman-tics of the programming language) and since the domainknowledge is captured in the semantic domain, the limitsof the semantic domain determines the limits of the logicalanalyses.
Interpretation. The interpretation is a mapping betweenthe program abstraction and the chosen semantic domain.The mapping assigns meaning to the program and is the keyingredient for the definition of advanced analyses. In orderto enable the analysis of big programs, we need to recover(or approximate) the interpretation automatically.
Recovery the interpretation is a problem similar to con-cepts location [9] and concepts assignment [2], whereby theconcepts are a priori well defined by the semantic domain,belong to different kinds of knowledge ranging from busi-ness domain to programming (as shown in Figure 1) and the
2

meaning of the mappings between the concepts and pro-gram parts is well defined. In domain knowledge drivenprogram analyses, the interpretation is not seen as externalanalysis (like concepts location is depicted in upper part ofFigure 3) but rather as fundamental (inherent) part of theprograms representation (Figure 3-bottom).
Most of the reverse engineering approaches that use ex-ternal knowledge to interpret programs (e. g. [1, 6, 7, 8, 12])can be classified according to the framework from Figure 4.These approaches differ in the formality of the semantic do-main (e. g. natural language documentation, weak ontolo-gies, logics-based knowledge bases), in the definedness ofthe interpretation (e. g. traceability links, reference of indi-vidual concepts), or in the chosen program abstraction.
3 Challenges in domain knowledge driven
program analysis
In the ideal way, domain knowledge driven analysesshould be similar to the investigation of a project guru thatknows exactly the structure of the program, the knowledgeimplemented in the program and how does it map to theprogram entities. The guru would further use these ingredi-ents as basis for more complex analyses. The pure structuralanalyses approaches are a particular case of domain knowl-edge driven ones, in the sense that the domain knowledge isnot used at all (called the “zero knowledge assumption”).
From the above ingredients for implementing the domainknowledge driven program analyses, obtaining the programabstraction is by far the most understood. Both the makingthe semantic domain explicit, populating it with the knowl-edge, defining an adequate interpretation and recovering itautomatically are open issues.
1) Expressing and obtaining the domain knowledge. Aprecondition of performing complex analyses is to have do-main knowledge in a machine processable form. Obtain-ing the domain knowledge and sharing it are problems ad-dressed by knowledge engineering (knowledge acquisition,representation and sharing).
Ontologies are envisioned to be fundamental means forsharing knowledge. However, there is much knowledge thatcan not be captured in ontologies – e. g. knowledge aboutthe dynamics of a system, physical laws, complex relations,constraints, knowledge that is not lexicalized (knowledgeunits that do not have (yet) associated a name). Further-more, obtaining adequate ontologies for program analysesis an open issue. Off-the-shelf ontologies that exist to-day1 are highly inadequate for analyzing the programs (have
1http://swoogle.umbc.edu
other focus, are at another abstraction level, and are not de-tailed enough).
2) Defining and recovering the interpretation. Definingand automatically recovering the exact mappings betweenthe domain knowledge and the code is a difficult issue – forexample, a domain concept can be defined, represented, en-coded or only referenced in a part of a program. Dependingon the exact interpretation we can apply different analysesover the program – e. g. whether a certain concept is redun-dantly defined, or only referenced in several places.
Once adequate interpretations are defined, in order to beapplicable on large programs, we need to recover them in a(semi-)automatic manner. For most of the domain concepts(especially those of non-technical nature) the clues for re-covering the interpretation stay outside of the programminglanguage definition and mostly in informal sources of in-formation – for example the names of program identifiersrepresent the most important clues. The recovery of inter-pretation based on this information is sensitive to the qualityof identifiers and the modularization of the program. There-fore, in the most general case the interpretation can be onlyapproximated. These facts lead to difficulties in recover-ing exactly the interpretation and subsequently performingautomatic program analyses.
4 Approaching the challenges
Implementing domain knowledge driven program anal-yses in the widest sense is a difficult endeavor that wouldrequire human intelligence. However, depending on cer-tain (classes of) use-cases even small and simple knowledgebases and rough approximations in the recovery of the in-terpretation function can bring substantial advantages.
4.1 Expressing and obtaining the domainknowledge
Expressing the semantic domain as light-weighted
ontologies. Light-weighted ontologies (concepts and rela-tions among them) can be used as a relatively simple andconvenient way to express lexicalized parts of the domainknowledge.
Extracting domain knowledge by analyzing the sim-
ilarities of domain specific APIs. Knowledge about pro-gramming technologies (e. g. XML, GUI, databases, com-munication) is used in virtually every program and thereforedue to its pervasive occurrence in programs, many analy-sis use-cases involve it. Therefore, once knowledge basesthat contain programming knowledge are built, they can beshared and re-used by a community of users for analyzingdifferent programs.
3

Much of the knowledge of technical nature (e. g. GUI,XML, databases) is captured by the APIs that are well estab-lished in the programming community – e. g. the standardAPIs of each programming language. We started to builda repository of programming technologies knowledge2 thatcontain light-weighted ontologies extracted by analyzingthe commonalities of multiple APIs that address the samedomain. This represents only a first step in sharing the tech-nical knowledge relevant for interpreting a wide variety ofprograms.
Building knowledge bases through reverse knowledge
engineering. In the case when no knowledge base is avail-able that fulfills our needs, we can perform reverse knowl-edge engineering in order to build the semantic domain bymanually investigating the code and building fragments ofthe semantic domain (e. g. fragments of ontologies that con-tain the domain knowledge) [6, 11]. However, in order todo this we need adequate tool support and a well definedmethodology.
4.2 Defining and recovering adequate in-terpretations
Defining the interpretations based on use-cases. De-pending on the use-case, we need more or less powerfulinterpretations. For example, assessing the logical modular-ity of programs [11] requires a weaker interpretation as op-posed to the assessment of domain appropriateness of APIs[10]. Depending on the powerfulness of the interpretationit can be easier (or not) to recover it from programs in anautomatic manner.
Recovering the interpretation. One way to recoverthe interpretation is to use the information contained in thenames of program identifiers or in the code documentation.The advantage is that in this manner we can recover infor-mation belonging to a wide variety of domains. However,this approach is very sensitive with respect to the quality ofthe identifiers. Other approaches that recover knowledgecloser to programming (e. g. design patterns) use patternmatching for interpreting the code [8]. Finally, there areanalysis approaches based on the manual definition of theinterpretation [6, 12].
A minimal unified meta-model. In Figure 5 we presenta minimal meta-model that contains the program abstrac-tion and the domain knowledge as two graphs. The inter-pretation is given by a relation between concepts and pro-gram elements. Both the program graph and the knowledgegraphs can be refined with more structure (FAMIX is an ex-tension of the program graph), or enhanced with constraints.
2http://www4.in.tum.de/˜ratiu/knowledge_repository.html
!"#$"%&'()&)*+
!"#$"%&,)(%+-#*
.#*/)0+
.#*/)0+1%(,)(%+-#*
2*+)"0")+%+-#*
Figure 5. A minimal unified meta-model thatconsiders programs abstraction and domainknowledge
5 The need for a community effort
Finally, we advocate that in order to systematically ad-dress these challenges and to use domain knowledge in au-tomatic program analyses, we need a community effort.Systematic building of knowledge bases about program-ming technologies that are frequently used, annotations ofstandard APIs with the conceptual information, definitionof interpretations adequate for performing certain analysesrequire efforts that can be addressed only in a community.
References
[1] G. Antoniol, G. Canfora, G. Casazza, A. D. Lucia, andE. Merlo. Recovering traceability links between code anddocumentation. IEEE Trans. on Sof. Eng., 28(10):970–983,2002.
[2] T. J. Biggerstaff, B. G. Mitbander, and D. Webster. Theconcept assignment problem in program understanding. InICSE ’93, pages 482–498. IEEE CS Press, 1993.
[3] G. Booch. Object-Oriented Analysis and Design with Appli-
cations (3rd Edition). Addison Wesley, 2004.[4] E. J. Chikofsky and J. H. Cross. Reverse engineering and
design recovery: A taxonomy. IEEE Software, 7(1):13–17,1990.
[5] S. Demeyer, S. Tichelaar, and S. Ducasse. Famix 2.1 —the famoos information exchange model. Technical report,University of Bern, 2001.
[6] P. Devanbu, R. Brachman, and P. G. Selfridge. Lassie: aknowledge-based software information system. Commun.
ACM, 34(5):34–49, 1991.[7] M. T. Harandi and J. Q. Ning. Knowledge-based program
analysis. IEEE Software, 7(1):74–81, 1990.[8] W. Kozaczynski, S. Letovsky, and J. Q. Ning. A knowledge-
based approach to software system understanding. In KBSE,pages 162–170, 1991.
[9] V. Rajlich and N. Wilde. The role of concepts in programcomprehension. In IWPC’02. IEEE CS Press, 2002.
[10] D. Ratiu and J. Juerjens. Evaluating the reference and rep-resentation of domain concepts in APIs. In ICPC’08. IEEECS, 2008.
[11] D. Ratiu, J. Jurjens, and R. Marinescu. The logical modular-ity of programs. In Proceedings of the Working Conference
on Reverse Engineering (WCRE’09), 2009.[12] M. P. Robillard and G. C. Murphy. Representing concerns in
source code. ACM Trans. on Sof. Eng. Meth., 16(1):3, 2007.
4

Driving the refactoring of Java Enterprise Applications by evaluating the distancebetween application elements
Fabrizio Perin
Software Composition Group
University of Bern, Switzerland
http://scg.unibe.ch
Abstract—Java Enterprise Applications (JEAs) are complexsystems composed using various technologies that in turn relyon languages other than Java, such as XML or SQL. Given thecomplexity of these applications, the need to reverse engineerthem in order to support further development becomes critical.In this paper we show how it is possible to split a system intolayers and how is possible to interpret the distance betweenapplication elements in order to support the refactoring ofJEAs. The purpose of this paper is to explore ways to providesuggestions about the refactoring operations to perform on thecode by evaluating the distance between layers and elementsbelonging those layers. We split JEAs into layers by consideringthe kinds and the purposes of the elements composing theapplication. We measure distance between elements by usingthe notion of the shortest path in a graph. Also we presenthow to enrich the interpretation of the distance value withenterprise pattern detection in order to refine the suggestionabout modifications to perform on the code.
Keywords-Reverse engineering; Java Enterprise; Architec-ture.
I. INTRODUCTION
Since Java 2 Platform Enterprise Edition (J2EE) wasintroduced in 1999 it has become one of the standardtechnologies for enterprise application development. J2EEapplications are complex systems composed using varioustechnologies that in turn rely on languages other than Java,such as XML or SQL. In order to perform different kindsof analyses on JEAs it is important to collect informationfrom all sources and put it together in a model that caninclude everything relevant. In this paper we focus ourattention on analyzing the structure of JEAs. As knownfrom the literature [1], [2], [3], [4] JEAs, by their verynature, can be split into layers. Each layer can differ fromthe others in the type of the elements that it contains or inthe task that those elements have been created to perform.Evaluating the distance between different layers and betweenelements belonging those layers we can reveal violationsof the application’s architecture that should be modified inorder to improve readability and maintainability.
In this paper we propose a technique to drive this refac-toring. We describe the layering scheme that we adopt,the index that we use to identify architectural violations
and how we can modify the interpretation of that indexusing enterprise pattern detection. We plan to implementour proposal in Moose [5], a software analysis platform,in order to exploit our existing infrastructure for static anddynamic analysis. Moose is a reengineering environment thatprovide several services including a language independentmeta-model. On top of Moose have been build several toolsthat provide different services like: static analysis, dynamicanalysis, software visualization, evolution analysis.
II. LAYERING
Java Enterprise Applications are complex software sys-tems composed of different elements. Because those ele-ments have different purposes and behaviors JEAs can besplit into layers [1]. Comparing different types of layeringschemes [1], [2], [3], [4] we split the applications into 4layers: Presentation, Service, Business and Data layer. Everyelement belonging to a layer has a specific purpose and theywork together to solve the user’s problems. The Presentationlayer contains all elements concerning the front-end of theapplication such as a rich UI or an HTML browser interface.The Service layer is part of the Business layer and containsall those elements that define the set of available operationsand manage the communications between the Presentationlayer and the domain logic classes. The Business layerincludes all classes that implement and model the domainlogic. The Data layer contains all classes that access thedatabase and map the data into objects that can be used bythe application. In Figure 1 illustrates the layering systemthat we adopt. The large external rectangles represent thelayers.
When implementing a service it is always important tocreate a complete structure that involves all layers. Thereare two main reasons for this: the first, and most importantone, is related to code understanding and the second tomaintainability. If, for some reason, a service does notneed to process some data, an element belonging to thePresentation layer can invoke directly an element in the Datalayer. However in this way whoever will read the code willmiss the domain model related to that particular service.So it becomes much more difficult to understand the code.

It is also important go through all layers for reasons ofmaintainability. If at the beginning of development it is notnecessary to process some data, it could became necessaryafterward and it is usually tricky to modify the structure ofthe code preserving understandability.
Service Layer
Business Layer
BData Layer
Presentation Layer
A
Service Layer
Business Layer
BData Layer
Presentation Layer
A
RIGHT WRONG
Figure 1. Layering scheme and basic invocation chian.
III. DISTANCE BETWEEN ELEMENTS
We use value of the distance between JEA’s elementsto identify violations in the architecture. We compute thedistance between elements using the notion of the shortestpath in a graph. We can therefore use graph theory to solveour problem [6]. In the following we summarize the idea ofdistance used to solve the shortest path problem.
We have a weighted, directed graph G = �V,E�, with aweight function ω : E → R mapping edges to real-valuedweights. The weight of a path p = �υ0, υ1, υ2, . . . , υn� isthe sum of all weights of its edges:
ω(p) =k�
i=1
ω(υi−1, υi) (1)
The shortest path weight from u to υ is defined as:
δ(u, υ) =
min{ω(p) : u � υ} if there is a pathfrom u and υ,
∞ otherwise(2)
Every edge in the graph has a weight that is necessaryto find which is the shortest path between two elements. Inour case we want to assign to each of them the weight 1. Itis possible to calculate the minimum number of invocationsfrom one method to another using Dijkstra’s algorithm. We
define the distance between two elements as the shortestpath between those two elements.
We will define threshold values to determine which dis-tance is correct and which is not. To simplify the conceptin this work, even if the Presentation layer could containHTML or JS Pages as well as GUI elements in any language,in the following we will consider an element contained inthis layer as a class with methods.
The basic distance to calculate is the distance betweendifferent methods. The distances between classes and layersare derived from the distance between methods, thereforeit is not necessary to apply the algorithm used to calculatedistances on those methods, it is just necessary to regroupthe methods of a path as part of a class or a layer.
In Figure 1 on the left we show the basic invocation chainthat implements a normal user request. This chain containsclasses and the smallest squares are methods or a genericJSP or HTML page. In Figure 1 on the right we also showwhat we consider to be a wrong invocation chain. In fact inthis case the element A belonging to the Presentation layerinvokes directly the method B belonging to the Data layer.
The distance between classes and layers is important tocalculate because we cannot be sure that everything is finejust looking at the distance between methods. If the distancebetween methods has an acceptable value this doesn’t meansthat every layer is touched in the implementation.
We will present in the following some examples thatcover some normal cases that can be found in a normalimplementation of an enterprise application. It is importantto underline that the real threshold values to adopt to evaluatethe code are still to be decided and they will be definedby analyzing some huge industrial case studies with anumber of classes up to 1800. Below we exemplify our ideaconsidering as right a distance value between two elementsbelonging the Presentation and the Data layer equals to 3.
Example 1: In Figure 1 on the left: The distance betweenmethod A and method B is 3 as well as the distancebetween the class that contains A and the class that containsB and the distance between the Presentation layer andthe Data layer. We consider this situation a basic rightimplementation where all layers are touched. If instead weconsider two classes, the first belonging to the Presentationlayer and the second belongs to the Data layer, then if thedistance between those classes is 1 it means that there isa direct invocation from the Presentation layer to the Datalayer. This is the most basic and recurrent case of wrongimplementation.
Example 2: In Figure 2 are shown a couple of correct paths.On the left side the distance between method A and methodB is 4, instead the distance between the class that contains Aand the class that contains B as well as the distance betweenthe Presentation layer and the Data layer is 3. From those
2

Sample 1
Service Layer
Business Layer
BData Layer
Presentation Layer
A
Service Layer
Business Layer
BData Layer
Presentation Layer
A
Sample 2
Figure 2. Layering scheme and basic invocation chian.
values we can see that all layers have been touched andthat in a class there is an internal invocation because ofthe difference between the distance between methods andthe distance between classes. On the right in Figure 2 alldistance values are the same and equal to 4. Also in this casewe can see that everything seems fine. What is important ina situation like this is that the number of invocations is nottoo high. A too high value is a symptom of complexity, somaybe that service implementation could be simplified.
Example 3: In Figure 3 on the left the distance betweenmethod A and method B is 3 so we consider it right. Onthe other hand the distance between their classes is just 2as well as the distance between the Presentation layer andthe Data layer. What is missing is a representation of thedomain logic. On the right in Figure 3 the distance betweenA and B and the distance between the classes that containthem is 4 so it is right but the distance between layers is 2.What is missing is an entry point for that specific servicebecause method A accesses directly a method belonging tothe Business layer.
IV. DISTANCE AND ENTERPRISE PATTERNS
There is a large body of development patterns gatheredby the engineering community. There are patterns for en-terprise applications [1] in general and patterns for J2EE[4] in particular. The description of design patterns providesinformation about the structure, the participant’s roles, theinteraction between participants and, above all, the intent forwhich they should be used. Our intent is to mix the value ofthe distance between elements and data source architectural
patterns [1] tuning the results obtained by just looking forthe distance index.
By being able to identify data source architectural patternsin the applications it is possible to provide more specificsuggestions on the operation to accomplish during the refac-toring. It is also possible to identify potential errors in acorrect invocation sequence or vice versa.
Sample 1
Service Layer
Business Layer
Presentation Layer
A
BData Layer
Presentation Layer
A
Service Layer
Business Layer
Sample 2
Data Layer
B
Figure 3. Layering scheme and basic invocation chian.
For example in Figure 1 on the right is shown a wronginvocation where the distance between A and B is 1. In thiscase the business logic is missing as well as the invocationto the Service layer that define the services available inthe system. A standard modification to the code will beto implement one class belonging to the Business layerand another belonging to the Service layer. Supposing nowthat the class that contains B implements the pattern ActiveRecord [1]. By it own definition, this pattern should containsome domain logic. So the modification to enact is not justto implement the missing classes in the Business and theData layer but also to move the domain logic in the newclass down to the Business layer.
V. RELATED WORKS
Some effort has been already spent in the context ofarchitectural conformance checking [7], [8], [9]. In particular[9] extracting information from source code and byte code inJava and C++ and storing this information in a database thatmodels all information that can be extracted from the code.From this information it is possible to perform different kindof analyses like checking illegal relationships within layers.
3

There are some differences between our work and [9]. Weplan to apply our idea to an enterprise system that containsnot only Java but also other languages such as XML, JSor SQL. The information harvested from the system willbe modeled with FAMIX [10]. Our model will include allaspects concerning an enterprise application: the FAMIXmeta model will not only contain structural informationbut also higher level information such as methods involvedin a transaction. Using Mondrian [11] on the informationcontained in the meta model we can generate many differentsoftware visualizations on the code. Our intent is not onlyto identify which part of code could contain errors orinconsistencies but also to suggest possible modificationsfor the refactoring.
VI. CONCLUSION
In this paper we summarized our proposal to drive therefactoring of JEAs by comparing the distance between theapplication’s elements to that of the data source architecturalpatterns.
In particular we presented the layering scheme that weadopt to regroup different elements of a JEAs. We alsoexplore how to apply the concept of method distance tocreate an index that can be used to detect the presence ofa wrong application structure. Finally we relate the conceptof distance to the data source architectural patterns in orderto modify the interpretation of the distances. In this casewe propose to compile a catalogue of patterns and distancestogether with heuristics to drive the refactoring.
The basic idea is that every service has to be implementedtouching every layer starting from the Presentation one.The catalog will be able to indicate what is wrong in theimplementation and how the code should be modified inorder to have a right structure. The approach could also beused to expose code that is too complex, i.e., if the distanceis too high.
We plan to implement our proposal in FAMIX [10] whichalready includes a generic meta-model for Object-Orientedapplication that can be extended to analyze Enterprise ap-plications in Java. We want to refine FAMIX by addingall parts and relations that are necessary to model a JEA.Based on a consistent meta-model, it is possible to definea quality model based on metrics and pattern detection. Wewill evaluate the performance impact of calculating everytime the distance or cacheing it. Another solution could bepre-compute all distances between all elements. In this casethe Floyd-Warshall algorithm will fit better.
In order to validate this work we plan to perform experi-ments using an industrial partner we have been collaboratingwith.
Acknowledgments We gratefully acknowledge the financialsupport of the Hasler Foundation for the project “Enabling
the evolution of J2EE applications through reverse engineer-ing and quality assurance” (Project no. 2234, Oct. 2007 –Sept. 2010). We would also want to thank Tudor Gırba,Oscar Nierstrasz for their comments on this paper and theirsupport on this project.
REFERENCES
[1] M. Fowler, Patterns of Enterprise Application Architecture.Addison Wesley, 2005.
[2] F. Marinescu, Ejb Design Patterns: Advanced Patterns, Pro-
cesses, and Idioms with Poster. New York, NY, USA: JohnWiley & Sons, Inc., 2002.
[3] K. Brown and G. C. et al., Enterprise Java Programming with
IBM Websphere. Addison Wesley, 2001.
[4] D. Alur, J. Crupi, and D. Malks, Core J2EE Patterns: Best
Practices and Design Strategies. Pearson Education, 2001.
[5] O. Nierstrasz, S. Ducasse, and T. Gırba, “The story of Moose:an agile reengineering environment,” in Proceedings of the
European Software Engineering Conference (ESEC/FSE’05).New York NY: ACM Press, 2005, pp. 1–10, invitedpaper. [Online]. Available: http://scg.unibe.ch/archive/papers/Nier05cStoryOfMoose.pdf
[6] T. H. Corman, C. E. Leiserson, and R. L. Rivest, Introduction
to Algorithms. MIT Press, 1990.
[7] G. Murphy, D. Notkin, and K. Sullivan, “Software reflexionmodels: Bridging the gap between source and high-level mod-els,” in Proceedings of SIGSOFT ’95, Third ACM SIGSOFT
Symposium on the Foundations of Software Engineering.ACM Press, 1995, pp. 18–28.
[8] B. Lague, C. Leduc, A. L. Bon, E. Merlo, and M. Dagenais,“An analysis framework for understanding layered softwarearchitectures,” in Proceedings IWPC ’98, 1998.
[9] W. Bischofberger, J. Kuhl, and S. Loffler, “Sotograph – apragmatic approach to source code architecture conformancechecking,” in Software Architecture, ser. LNCS. Springer-Verlag, 2004, vol. 3047, pp. 1–9.
[10] S. Tichelaar, S. Ducasse, S. Demeyer, and O. Nierstrasz,“A meta-model for language-independent refactoring,” inProceedings of International Symposium on Principles of
Software Evolution (ISPSE ’00). IEEE Computer SocietyPress, 2000, pp. 157–167. [Online]. Available: http://scg.unibe.ch/archive/papers/Tich00bRefactoringMetamodel.pdf
[11] M. Meyer, T. Gırba, and M. Lungu, “Mondrian: Anagile visualization framework,” in ACM Symposium on
Software Visualization (SoftVis’06). New York, NY, USA:ACM Press, 2006, pp. 135–144. [Online]. Available:http://scg.unibe.ch/archive/papers/Meye06aMondrian.pdf
4

Why and How to Substantiate the Good of our Reverse Engineering Tools?
David RothlisbergerSoftware Composition Group, University of Bern, Switzerland
Abstract
Researchers and practitioners are usually eager to de-velop, test and experiment with new ideas and techniques toanalyze software systems and/or to present results of suchanalyzes, for instance new kind of visualizations or analy-sis tools. However, often these novel and certainly promis-ing ideas are never properly and seriously empirically eval-uated. Instead their inventors just resort to anecdotal ev-idence to substantiate their beliefs and claims that theirideas and the realizations thereof are actually useful in the-ory and practice. The chief reason why proper validationis often neglected is that serious evaluation of any newlyrealized technique, tool, or concept in reverse engineeringis time-consuming, laborious, and often tedious. Further-more, we assume that there is also a lack of knowledge orexperience concerning empirical evaluation in our commu-nity. This paper hence sketches some ideas and discussesbest practices of how we can still, with moderate expenses,come up with at least some empirical validation of our nextproject in the field of reverse engineering.
Keywords: reverse engineering, software analysis, em-pirical software engineering, evaluation, validation
1 Introduction
In recent years, the reverse engineering community in-vented and realized many interesting, promising and po-tentially practically useful techniques, concepts, processes,or tools such as Moose [4], Program Explorer [8], Graph-trace [7], or Mondrian [12]. Many useful visualizations ofsoftware systems, presenting on a high or low level bothsoftware structure and behavior have been invented (forinstance, Polymetric Views [10], Class Blueprints [3, 9],Real-time visualization [15], or even 3D visualizations [5]).
While all these innovations are promising to actuallysupport software developers in various software engineer-ing tasks such as gaining an understanding for an unfamiliarapplication, analyzing collaborations between source arti-facts, correcting software defects, or extending and enhanc-
ing key software features, nobody really knows whether anyof those invented techniques contributes any value in prac-tice, and if so, to which degree these techniques add value.Thus many questions are left open, for example how big isthe impact of a given reengineering tool or technique onproductivity or whether practitioners actually employ theconcepts our community developed. Another interestingquestion is which techniques are best suited for which kindof software tasks, that is, which techniques or tools should asoftware developer use when faced with a task in areas suchas defect correction, feature implementation, refactoring, orporting an application from one programming language toanother. Certainly we are also interested in learning howa specific reverse engineering tool or technique is best em-ployed in practice to be most helpful. As long as these ques-tions remain unanswered and largely neglected, we cannotbe sure whether our work has an impact on software devel-opers working in industry on practical, real-world softwaredevelopment and maintenance problems and challenges.
For most of the fore-mentioned tools, techniques, orvisualizations we completely lack quantitative knowledgeabout their practical usefulness. Thus we discuss in this pa-per several means how we can concretely acquire such cru-cial knowledge. The ideas presented here should serve as athought-provoking impulse for how to evaluate and validateexisting reverse engineering tools or at least newly inventedand implemented tools. Moreover, we want to provoke adiscussion in the community to sensibilize researchers andpractitioners in our field for the importance of empirical re-search and to motivate them to actually perform such valida-tion, that is, to conduct empirical studies and experiments.The ideas for empirical evaluations in our field presented inthe following should give the basic knowledge about how toget started with empirical research.
This paper is structured as follows: In Section 2 we stressthe importance of empirical validation with some concreteexamples of the benefits of such validation. Section 3presents and discusses different kinds of empirical valida-tion, and how we can apply them to the context of reverseengineering research. Finally, Section 4 wraps up the paperwith some concluding remarks.
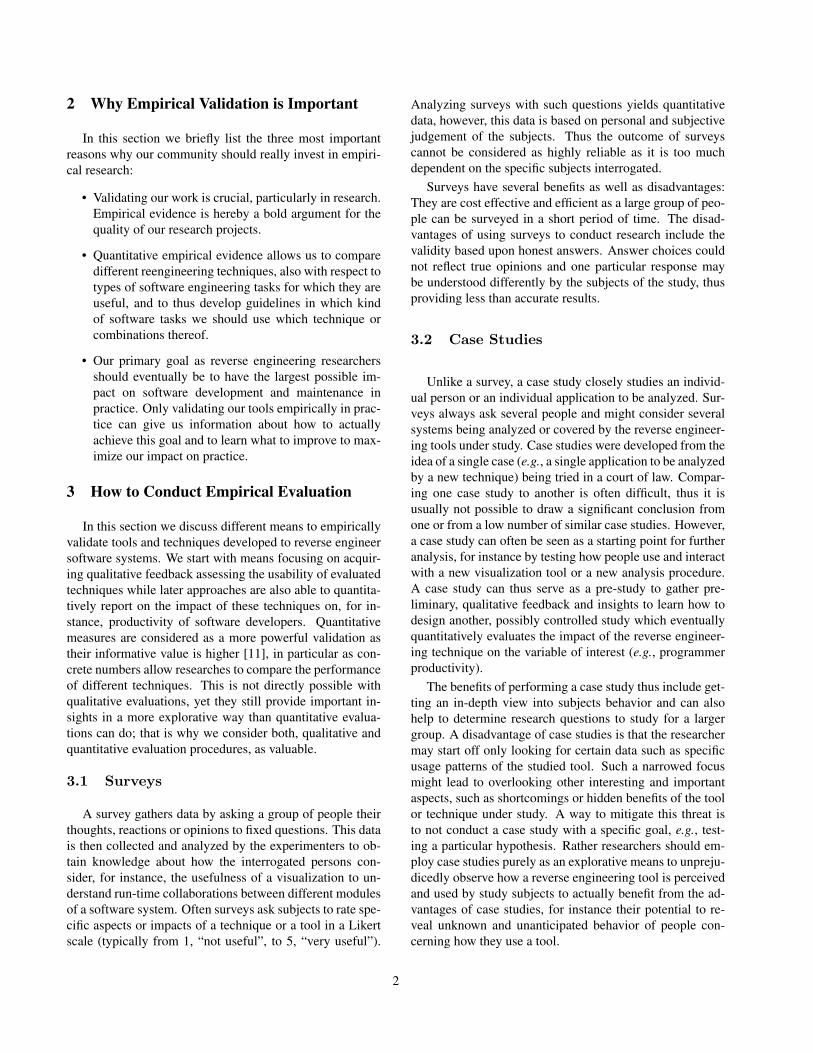
2 Why Empirical Validation is Important
In this section we briefly list the three most importantreasons why our community should really invest in empiri-cal research:
• Validating our work is crucial, particularly in research.Empirical evidence is hereby a bold argument for thequality of our research projects.
• Quantitative empirical evidence allows us to comparedifferent reengineering techniques, also with respect totypes of software engineering tasks for which they areuseful, and to thus develop guidelines in which kindof software tasks we should use which technique orcombinations thereof.
• Our primary goal as reverse engineering researchersshould eventually be to have the largest possible im-pact on software development and maintenance inpractice. Only validating our tools empirically in prac-tice can give us information about how to actuallyachieve this goal and to learn what to improve to max-imize our impact on practice.
3 How to Conduct Empirical Evaluation
In this section we discuss different means to empiricallyvalidate tools and techniques developed to reverse engineersoftware systems. We start with means focusing on acquir-ing qualitative feedback assessing the usability of evaluatedtechniques while later approaches are also able to quantita-tively report on the impact of these techniques on, for in-stance, productivity of software developers. Quantitativemeasures are considered as a more powerful validation astheir informative value is higher [11], in particular as con-crete numbers allow researches to compare the performanceof different techniques. This is not directly possible withqualitative evaluations, yet they still provide important in-sights in a more explorative way than quantitative evalua-tions can do; that is why we consider both, qualitative andquantitative evaluation procedures, as valuable.
3.1 Surveys
A survey gathers data by asking a group of people theirthoughts, reactions or opinions to fixed questions. This datais then collected and analyzed by the experimenters to ob-tain knowledge about how the interrogated persons con-sider, for instance, the usefulness of a visualization to un-derstand run-time collaborations between different modulesof a software system. Often surveys ask subjects to rate spe-cific aspects or impacts of a technique or a tool in a Likertscale (typically from 1, “not useful”, to 5, “very useful”).
Analyzing surveys with such questions yields quantitativedata, however, this data is based on personal and subjectivejudgement of the subjects. Thus the outcome of surveyscannot be considered as highly reliable as it is too muchdependent on the specific subjects interrogated.
Surveys have several benefits as well as disadvantages:They are cost effective and efficient as a large group of peo-ple can be surveyed in a short period of time. The disad-vantages of using surveys to conduct research include thevalidity based upon honest answers. Answer choices couldnot reflect true opinions and one particular response maybe understood differently by the subjects of the study, thusproviding less than accurate results.
3.2 Case Studies
Unlike a survey, a case study closely studies an individ-ual person or an individual application to be analyzed. Sur-veys always ask several people and might consider severalsystems being analyzed or covered by the reverse engineer-ing tools under study. Case studies were developed from theidea of a single case (e.g., a single application to be analyzedby a new technique) being tried in a court of law. Compar-ing one case study to another is often difficult, thus it isusually not possible to draw a significant conclusion fromone or from a low number of similar case studies. However,a case study can often be seen as a starting point for furtheranalysis, for instance by testing how people use and interactwith a new visualization tool or a new analysis procedure.A case study can thus serve as a pre-study to gather pre-liminary, qualitative feedback and insights to learn how todesign another, possibly controlled study which eventuallyquantitatively evaluates the impact of the reverse engineer-ing technique on the variable of interest (e.g., programmerproductivity).
The benefits of performing a case study thus include get-ting an in-depth view into subjects behavior and can alsohelp to determine research questions to study for a largergroup. A disadvantage of case studies is that the researchermay start off only looking for certain data such as specificusage patterns of the studied tool. Such a narrowed focusmight lead to overlooking other interesting and importantaspects, such as shortcomings or hidden benefits of the toolor technique under study. A way to mitigate this threat isto not conduct a case study with a specific goal, e.g., test-ing a particular hypothesis. Rather researchers should em-ploy case studies purely as an explorative means to unpreju-dicedly observe how a reverse engineering tool is perceivedand used by study subjects to actually benefit from the ad-vantages of case studies, for instance their potential to re-veal unknown and unanticipated behavior of people con-cerning how they use a tool.
2

Table 1. Comparison of different kinds of empirical studiesStudy Costs Quantitative Qualitative Generalizability ReproducibilitySurvey + Partially Yes + -Case Study ++ No Yes - - - -Observational Study + No Yes - -Contest - Partially Partially + +Controlled Experiment - - - Yes No ++ ++
3.3 Observational Studies
An observational study is similar to a case study. Typi-cally, a observational study includes several single and pos-sibly independent case studies with, for instance, severalsubjects, software systems to be analyzed, or analysis toolsand techniques being used. Thus observational studies helpexperimenters to generalize the findings and results of onecase study to a broader context.
Conducting observational studies has similar advantagesand disadvantages as case studies. Of course they requiremore time and effort to conduct than just a single case study,the amount of insights and reliability they yield is larger andbroader though.
3.4 Contests
Contests are another, rather specialized means to evalu-ate reverse engineering tools. The basic idea is to let differ-ent subjects or different analysis tools compete against eachother, for instance by imposing some tasks or questions onthe subjects that have to solve these problems under timepressure and while competing against other subjects. Theeventual goal is to win the contest, for instance by solvingthe problem in the shortest amount of time or in the high-est quality. The performance of each subject is analyzed,the experimenters observe the contest and try to locate thecause why and how much a specific reverse engineering toolhelped subjects to solve the problem in a particular time oraccuracy.
The fundamental difference to an observational study isthe fact that a contest puts significant time pressure on thesubjects; thus they are more motivated to solicit the best outof the available tools they obtain to solve the given prob-lem. Thus the results might be more reliable and compara-ble between different employed tools as the motivation ofthe subjects was high to do their best to learn, understandand employ a tool in the most efficient manner.
3.5 Controlled Experiments
(Controlled) experiments are crucial in finding the an-swers to questions such as “does tool X provide value in
software maintenance activities”. The cause and effect ofa particular problem can be studied through an experiment,providing it has “a set of rules and guidelines that mini-mize the possibility of error, bias and chance occurrences”[6]. Surveys and case studies require observation and ask-ing questions, whereas experiments require controls andthe creation of constrained situations to be able to actuallyrecord beneficial data.
The benefits of controlled experiments include a morescientific and thus more accepted approach of collectingdata, as well as limiting potential bias that could occur ina survey, case study or an observational study. One dis-advantage to many experiments is the cost factor involved;often laboratory procedures can be expensive. Another po-tential disadvantage is that a controlled experiment virtu-ally always has a narrow focus, that is, it tries to study oneor several very particular variables and thus neglecting anyother, potentially interesting analysis of, for instance, devel-oper reactions to specific characteristics of a reverse engi-neering technique.
Examples of well conducted controlled experiments inthe area of software engineering and specifically in the fieldof program comprehension, software analysis, and reverseengineering are for instance: Cornelissen et al. [2] thatevaluated EXTRAVIS, a trace visualizing tool, with 24 stu-dent subjects. Quante et al. [14] evaluated by means of acontrolled experiment with 25 students the benefits of Dy-namic Object Process Graphs (DOPGs) for program com-prehension. Arisholm et al. [1] quantitatively analyzed ina large, long-lasting controlled experiment with 295 profes-sional software engineers on three different levels (junior,intermediate, expert) whether pair programming has a posi-tive impact on time required, correctness and effort for solv-ing programming tasks with respect to system complexityand programmer expertise.
3.6 Summary
Table 1 summarizes the different kinds of empirical stud-ies we presented in this section. The table shows for in-stance which studies to use to gather quantitative or qual-itative feedback (note that each study can certainly be ex-tended to gather qualitative feedback as well even though itsprimary goal is to quantitatively analyze cause-effect rela-
3

tionships, for instance by observing the study subjects or byadditionally handing out a questionnaire). With “generaliz-ability” we refer to whether the study concept itself easilyallows us to obtain results that can be generalized to practi-cal, real-world situations. Generalizability is certainly verymuch dependent on how a concrete study is designed. With“reproducibility” we suggest how likely a type of study isto yield the same results when conducted several times.
Researchers sometimes only require the use of one ofthe discussed methods to successfully find the answer to aquestion, however it is often worthwhile to combine dif-ferent methods when evaluating a specific research projectas each evaluation method has its specific strengths. Thus acombination of different methods often yields more insightsand results that are more reliable and generalizable to othercontexts, software systems, or analysis techniques.
Kitchenham et al. [6] thoroughly report on preliminaryguidelines for empirical research in software engineering;these guidelines are also applicable to the field of reverseengineering and reengineering. Di Penta et al. [13] encour-age researchers and practitioners to design and carry outempirical studies related to program comprehension and todevelop standards how to conduct such studies. They givesome early hints how to establish a community motivated toperform empirical engineering in our field.
4 Conclusions
In this paper we first motivated the need for conductingempirical research in the reverse engineering and reengi-neering field by raising some important questions that re-main unanswered as long as only very little empirical vali-dation on our techniques and tools is performed. In a secondstep, we introduced several types of empirical studies suchas surveys, case studies, or controlled experiments that wecan employ to actually conduct empirical studies. More-over, we gave some hints how to concretely conduct whichkind of study in which context and referred to importantwork on empirical software engineering done by other re-searchers.
Acknowledgments. We gratefully acknowledge the financialsupport of the Swiss National Science Foundation for the projects“Bringing Models Closer to Code” (SNF Project No. 200020-121594, Oct. 2008 – Sept. 2010).
References
[1] E. Arisholm, H. Gallis, T. Dyba, and D. I. Sjoberg. Evalu-ating pair programming with respect to system complexityand programmer expertise. IEEE Transactions on SoftwareEngineering, 33(2):65–86, 2007.
[2] B. Cornelissen, A. Zaidman, A. van Deursen, L. Moonen,and R. Koschke. A systematic survey of program compre-
hension through dynamic analysis. IEEE Transactions onSoftware Engineering, 2009. To appear.
[3] S. Ducasse and M. Lanza. The class blueprint: Visuallysupporting the understanding of classes. Transactions onSoftware Engineering (TSE), 31(1):75–90, Jan. 2005.
[4] S. Ducasse, M. Lanza, and S. Tichelaar. Moose: an Exten-sible Language-Independent Environment for Reengineer-ing Object-Oriented Systems. In Proceedings of CoSET’00 (2nd International Symposium on Constructing SoftwareEngineering Tools), June 2000.
[5] D. Holten, R. Vliegen, and J. J. van Wijk. Visual realism forthe visualization of software metrics. In VISSOFT, pages27–32, 2005.
[6] B. A. Kitchenham, S. L. Pfleeger, L. M. Pickard, P. W. Jones,D. C. Hoaglin, K. E. Emam, and J. Rosenberg. Preliminaryguidelines for empirical research in software engineering.IEEE Trans. Softw. Eng., 22(8):721–734, 2002.
[7] M. F. Kleyn and P. C. Gingrich. GraphTrace — under-standing object-oriented systems using concurrently ani-mated views. In Proceedings of International Conferenceon Object-Oriented Programming Systems, Languages, andApplications (OOPSLA’88), volume 23, pages 191–205.ACM Press, Nov. 1988.
[8] D. Lange and Y. Nakamura. Interactive visualization of de-sign patterns can help in framework understanding. In Pro-ceedings ACM International Conference on Object-OrientedProgramming Systems, Languages and Applications (OOP-SLA’95), pages 342–357, New York NY, 1995. ACM Press.
[9] M. Lanza and S. Ducasse. A Categorization of Classes basedon the Visualization of their Internal Structure: the ClassBlueprint. In Proceedings of 16th International Conferenceon Object-Oriented Programming Systems, Languages andApplications (OOPSLA ’01), pages 300–311. ACM Press,2001.
[10] M. Lanza and S. Ducasse. Polymetric views—a lightweightvisual approach to reverse engineering. Transactions onSoftware Engineering (TSE), 29(9):782–795, Sept. 2003.
[11] T. C. Lethbridge, S. E. Sim, and J. Singer. Studying soft-ware engineers: Data collection techniques for softwarefield studies. Empirical Software Engineering, Springer Sci-ence and Business Media, Inc., The Netherlands, 10(3):311–341, July 2005.
[12] B. A. Myers, D. A. Weitzman, A. J. Ko, and D. H. Chau.Answering why and why not questions in user interfaces. InCHI ’06: Proceedings of the SIGCHI conference on HumanFactors in computing systems, pages 397–406, New York,NY, USA, 2006. ACM Press.
[13] M. D. Penta, R. E. K. Stirewalt, and E. Kraemer. De-signing your next empirical study on program comprehen-sion. In Proceedings of the 15th International Conferenceon Program Comprehension, pages 281–285, Washington,DC, USA, 2007. IEEE Computer Society.
[14] J. Quante. Do dynamic object process graphs support pro-gram understanding? - a controlled experiment. In Pro-ceedings of the 16th International Conference on ProgramComprehension (ICPC’08), pages 73–82, Washington, DC,USA, 2008. IEEE Computer Society.
[15] S. P. Reiss. Visualizing Java in action. In Proceedings ofSoftVis 2003 (ACM Symposium on Software Visualization),pages 57–66, 2003.
4