Fall AGU 2010, San Francisco Dec 17, 2010 Observing the Ionospheric Signature of Ocean Tsunamis...
19
Fall AGU 2010, San Francisco Dec 17, 2010 Observing the Ionospheric Signature of Ocean Tsunamis Using GPS Total Electron Content D. A. Galvan 1 ; A. Komjathy 1 ; M. P. Hickey 2 ; A. Mannucci 1 1 Ionospheric and Atmospheric Remote Sensing Group, NASA Jet Propulsion Laboratory, California Institute of Technology 2 Department of Physical Sciences, Embry-Riddle Aeronautical University
-
Upload
elisabeth-mccormick -
Category
Documents
-
view
217 -
download
2
Transcript of Fall AGU 2010, San Francisco Dec 17, 2010 Observing the Ionospheric Signature of Ocean Tsunamis...

Fall AGU 2010, San FranciscoDec 17, 2010
Observing the Ionospheric Signature of Ocean Tsunamis
Using GPS Total Electron Content
D. A. Galvan1; A. Komjathy1; M. P. Hickey2; A. Mannucci1
1Ionospheric and Atmospheric Remote Sensing Group, NASA Jet Propulsion Laboratory, California Institute of Technology2Department of Physical Sciences, Embry-Riddle Aeronautical University
Fall AGU 2010, San FranciscoDec 17, 2010
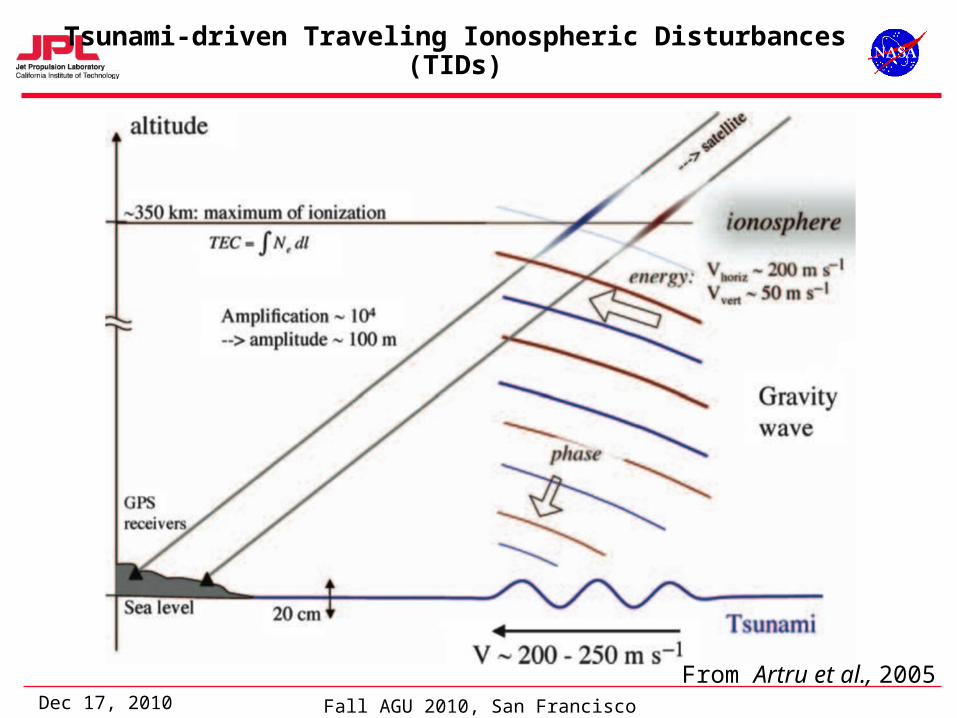
Tsunami-driven Traveling Ionospheric Disturbances(TIDs)
From Artru et al., 2005
Fall AGU 2010, San FranciscoDec 17, 2010
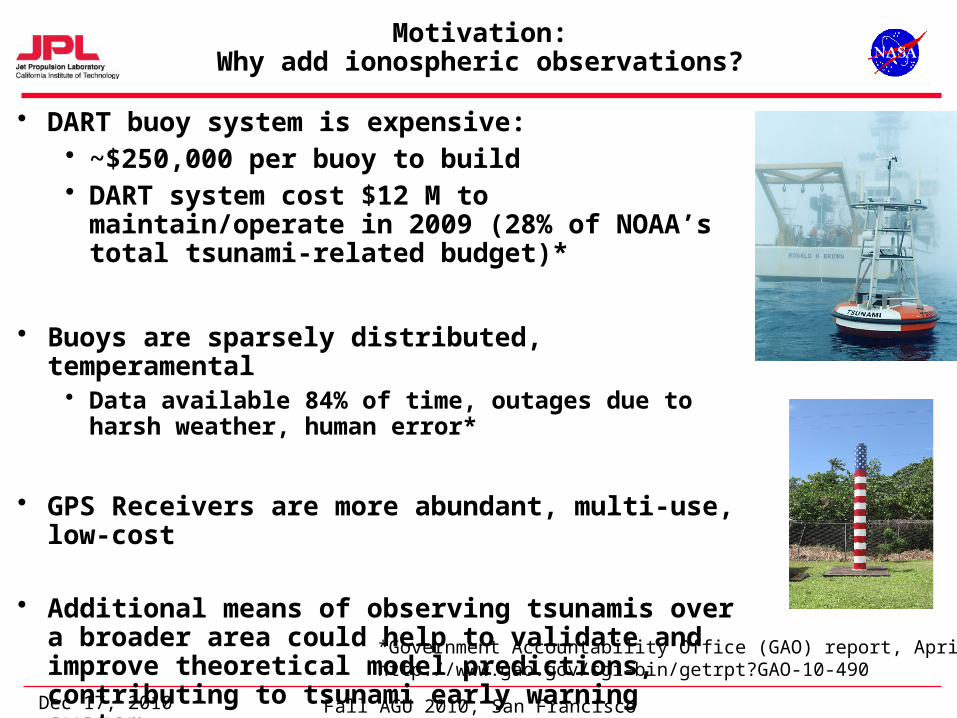
Motivation:Why add ionospheric observations?
• DART buoy system is expensive: • ~$250,000 per buoy to build• DART system cost $12 M to maintain/operate in
2009 (28% of NOAA’s total tsunami-related budget)*
• Buoys are sparsely distributed, temperamental• Data available 84% of time, outages due to harsh weather,
human error*
• GPS Receivers are more abundant, multi-use, low-cost
• Additional means of observing tsunamis over a broader area could help to validate and improve theoretical model predictions, contributing to tsunami early warning system.
*Government Accountability Office (GAO) report, April 2010http://www.gao.gov/cgi-bin/getrpt?GAO-10-490

Fall AGU 2010, San FranciscoDec 17, 2010
Data Type: Total Electron Content (TEC) from International GNSS System (IGS) stations
-30-second TEC data from dual-frequency GPS receivers.-Data processed through Global Ionospheric Mapping (GIM) algorithm at JPL
-For simultaneous bias identification/removal (satellite and receiver),

Fall AGU 2010, San FranciscoDec 17, 2010
Regional Networks
Source: Scripps Orbit and Permanent Array Center (SOPAC) GPS Data Archive, UCSDhttp://sopac.ucsd.edu/cgi-bin/somi4i
5
Source: Japanese GPS Earth Observation Network (GEONET) ArrayOver 1200 stationshttp://terras.gsi.go.jp/gps/geonet_top.html
GEONET Array
Fall AGU 2010, San FranciscoDec 17, 2010
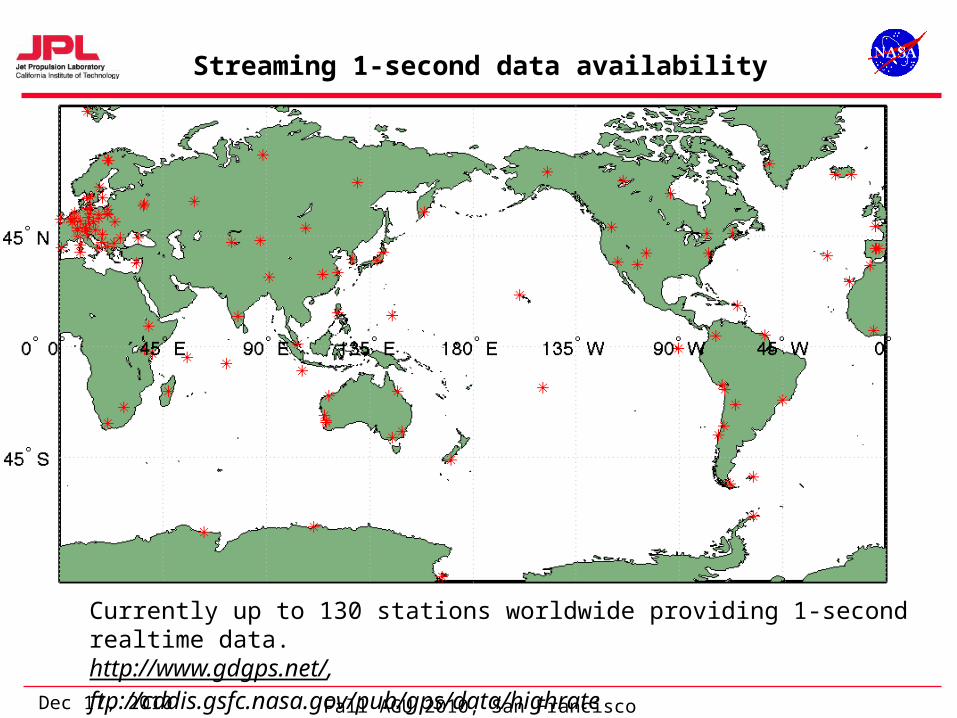
Streaming 1-second data availability
Currently up to 130 stations worldwide providing 1-second realtime data.http://www.gdgps.net/,ftp://cddis.gsfc.nasa.gov/pub/gps/data/highrate

Fall AGU 2010, San FranciscoDec 17, 2010
Methodology
• Estimate arrival time. Use simple 200 m/s projection, model predictions (MOST, Song, etc.)
• Process GPS TEC data JPL GIM software.
• Apply bi-directional band-pass filter: 0.5 – 5 mHz (33.3 – 3 min period)
• Plot filtered TEC as a function of distance/time.

Fall AGU 2010, San FranciscoDec 17, 2010
American Samoa Tsunami 9/29/09 Observed at Hawaii
Rolland et al., 2010 (GRL)Galvan et al., 2011 (submitted)

Fall AGU 2010, San FranciscoDec 17, 2010
American Samoa Tsunami 9/29/09Observed at Hawaii (map plot)
Lat
LonUT Sep 29-30, 2009
Dis
tanc
e fr
om E
pice
nter

Fall AGU 2010, San FranciscoDec 17, 2010
American Samoa Tsunami 9/29/09Real-time 1-second data

Fall AGU 2010, San FranciscoDec 17, 2010
COSMIC as additional resource

Fall AGU 2010, San FranciscoDec 17, 2010
Chile Tsunami 2/27/10Observed at Japan

Fall AGU 2010, San FranciscoDec 17, 2010
Chile Tsunami 2/27/10Observed at Japan
UT Sep 29-30, 2009
Dis
tanc
e fr
om E
pice
nter

Fall AGU 2010, San FranciscoDec 17, 2010
Theoretical Model Results
Ocean Surface Displacement (m)
Vertical TEC
Spectral full-wave model (SFWM), Hickey et al., 2009, using input wave form from Peltier and Hines, 1976, and period/velocity from DART buoy.

Fall AGU 2010, San FranciscoDec 17, 2010
Hickey Model Compared with Data
FilteredVTEC (TECU)
Universal Time (2/28/2010)
Fall AGU 2010, San FranciscoDec 17, 2010
Summary
• Tsunami-driven TID’s observed via GPS TEC after the American Samoa Tsunami of 9/29/2009 and the Chilean tsunami of 2/27/2010. (Galvan et al., submitted)
• Models predict tsunami-driven TID’s. (Occhipinti et al., 2008; Hickey et al., 2009; Mai and Kiang, 2009).
• Observations: Typically ~0.1 – 0.5 TECU.
• 30-second archived data AND 1-second real-time data available for study, both ground-based and LEO (COSMIC).
• Long-term potential for warning system.

Fall AGU 2010, San FranciscoDec 17, 2010
Acknowledgements
• NASA ROSES Grant # NNH07ZDA001N-ESI(Tsunami Imaging Using GPS Measurements)
• Dr. John LaBrecque (NASA HQ)• Dr. Philip Stephens (JPL)• Dr. Vasily Titov and Dr. Yong Wei (NOAA
Center for Tsunami Research)• Dr. James Foster (University of Hawaii)• Dr. Giovanni Occhipinti (IPGP, France)

Fall AGU 2010, San FranciscoDec 17, 2010
BACKUP SLIDES

Fall AGU 2010, San FranciscoDec 17, 2010
JPL’s GIM Ionosphere Algorithm
• Data-driven vertical TEC maps based on interpolating GPS slant TEC measurements on global scales (1993 – present):• Solar-geomagnetic reference frame• Shell approximation: extended slab (450 km altitude)• Multiple shells (250, 450, & 800 km altitude)• Map slant TEC measurements to equivalent vertical
using obliquity factor• Spatial interpolation: Triangular-grid or Bi-cubic splines
• Temporal smoothing: stochastic Kalman filter– Vertical TEC at each vertex treated as a random walk
parameter• Initialized with Klobuchar, Bent, or IRI95 model• Simultaneously solve for satellite biases (Tgd) and
receiver biases