Fairness in a Car-dependent Society - Sustainable Development
78
Fairness in a Car-dependent Society
Transcript of Fairness in a Car-dependent Society - Sustainable Development

Fairness in a Car-dependent Society


Fairness in a Car-dependent Society

2 — Fairness in Transport – Finding an alternative to car dependency – Sustainable Development Commission
ContentsForeword 5
Executive summary 7
1 Introduction 11
2 The right to travel 13
3 Car dependency 153.1 The costs and revenues of motoring 17
4 Fairness and transport 194.1 Low income groups 19
4.1.1 Amount of travel by income group 19
4.1.2 Negative impacts of travel by income group 22
4.2 Children and young people 25
4.2.1 Road casualties 27
4.2.2 Independent travel 27
4.2.3 Obesity 29
4.2.4 Air and noise pollution 29
4.2.5 Affordability 30
4.3 Older people 31
4.4 People with disabilities 32
4.5 Black, Asian and minority ethnic groups 33
4.6 Rural communities 35
4.7 Future generations and poorer nations 36
4.8 Summary 39
3
5 A sustainable approach to transport 405.1 A new approach 40
5.2 A sustainable transport hierarchy 40
5.3 How a sustainable transport hierarchy can improve fairness 42
5.3.1 Demand reduction for powered transport 42
5.3.2 Modalshifttomoresustainableandspaceefficientmodes 42
5.3.3 Efficiencyimprovementstoexistingmodes 43
5.3.4 Capacity increases for powered transport 43
5.4 Transport appraisal 44
5.5 Conclusion 46
6 Conclusion 47
Appendices 48 Appendix 1 Defining fairness 48
Appendix 2 Hierarchies in sustainability and transport 51
Appendix 3 Fairness benefits of active travel 54
Appendix 4 Potential policies to improve fairness 55
Demand reduction for powered travel 55
Modalshifttomoresustainableandspaceefficientmodes 56
EfficiencyImprovements 58
Capacity increases 59
Appendix 5 Department for Transport work on social and distributional impacts 60
Appendix 6 Limitations of current approaches to cost benefit analysis 61

4 — Fairness in Transport – Finding an alternative to car dependency – Sustainable Development Commission
Acknowledgements
This report was written and prepared by Duncan Kay with support from Jake Reynolds, Shirley Rodrigues, Andrew Lee, Beverley Anderson, Rebecca Gibbs, Claire Monkhouse, Tess Gill and other members of the Sustainable Development Commission’s staff.
We would also like to acknowledge the input and advice of others, specifically:
LeeSmith–PrincipalResearchOfficer,SocialResearchandEvaluation,DepartmentforTransport
Nigel Dotchin – Head of Equalities Policy, Department for Transport
Dr.KarenLucas–SeniorResearchFellow,TransportStudiesUnit,UniversityofOxford
GordonStokes–SeniorVisitingResearchAssociate,TransportStudiesUnit,UniversityofOxford
Richard Hebditch – Campaigns Director, Campaign for Better Transport
Ralph Smyth – Senior Transport Campaigner, Campaign to Protect Rural England

5
Foreword
Freedom, fairness, and responsibility – the aims of the Coalition’s programme for government. Powerful words, but what do they mean in the context of the UK transport system?
Inthisreportweexploretheissueoffairnessinparticular.Welookatwhobenefitsfromourcurrentpatternsoftravel, who does not, and how well the system serves the most vulnerable groups in society such as the young, the old and the poor. The picture which emerges is one ofsignificantinequalities.Notonlydovulnerablegroupstravel less than other people, they carry a greater burden of the costs of other people’s travel. In other words they are both ‘less travelled’ and ‘travelled-upon’. The impacts they experiencecanbesevere:chronicairpollutionandnoise,trafficdanger,higherratesofinjuryandcrime.
Roadtrafficisresponsibleforthegreatmajorityoftheseimpacts. The UK is one of the most car-dependent countries in Europe. The distance travelled on our roads has increased tenfold since 1950. Many services are now based on the assumption that users will access them by car. People whodonotdriveorcannotaffordtodrivefindthemselvesincreasingly trapped in a car-dependent world, unable to participateinthebenefits,butforcedtoendureitscosts.
Yet,paradoxically,roadtravelhaswidenedthechoiceofjobsandopportunitiesavailabletomanypeople,liberatingthem from the constraints of the past. We do not seek here tocondemncars,evenlessmotorists.Wesimplyexplorewhat costs are associated with our car dependency, and who bears them. Many of the lessons apply equally to rail and air.
It is not utopian to imagine a transport system that works better for everyone, without damaging the health of our communities or leaving a legacy of environmental damage for our children. Anyone travelling to the Netherlands will catch a glimpse of how things can be different, with almost 30percentofalljourneysmadebybicyclecomparedwithone or two per cent in this country. Worsening congestion,
rising fuel costs and continuing concerns about climate change and quality of life all suggest there must be a better way.
We believe the solution lies in the application of a simple hierarchy in transport policy which turns current thinking on its head in two respects. Firstly, it recognises the importance of behaviour change. The key opportunity for policymakersoverthenextperiodwillbetoreducethedemand for road travel through innovative use of ICT, modal shift to active travel and public transport.
Secondly, it challenges the view that transport is purely an issue for travellers. From a fairness perspective this view isinexcusablyblinkered,asillustratedbythereactionto the proposed route for HS2 (high speed rail). Future investments in transport must put the quality of life of people they affect at the heart of the design process and actively seek to redress the wrongs of the past. An important test of the localism agenda will be whether it gives greater voice to communities that have for years sought action on issues such as noise from trunk roads or air quality concerns – and of course how the relevant transport bodies respond.
In this respect we note the publication of Creating Growth, Cutting Carbon, the UK Government’s vision for a sustainable local transport system which encourages local authorities to prioritise quality of life, safety and the environment alongside economic development in their transport planning. In future we would like to see this kind ofintegratedthinkingdevelopedfurther,andextendedtonational transport strategies.
In the meantime, we hope this report will offer inspiration to transport planners across the UK wishing to forge a more equitable transport system.
Tess GillSDC Commissioner for Work and Skills

6 — Fairness in Transport – Finding an alternative to car dependency – Sustainable Development Commission
List of figures
Figure1:Distancetravelledbymode(DfT2010) .......................................................................................................................13
Figure2:Changesintherealcostoftransportandincome:1997to2009,UnitedKingdom ...................................................15
Figure3:ImpactsofIncreasingCarDependency ........................................................................................................................16
Figure4:ComparisonofthewidercostoftransportinEnglishurbanareas(£billionperannum,2009pricesandvalues) ...17
Figure5:Distancetravelledbyincomequintile(NationalTravelSurvey) .................................................................................20
Figure6:Changeinpercentageofhouseholdswithoutacar/van1995-7to2009(NationalTravelSurvey) .........................20
Figure7:Distancetravelledbymodebyincomequintile(NationalTravelSurvey) ..................................................................21
Figure8:UKpublicspendingontransport–cashequivalentperyearversushouseholdincomedecile (1=lowest, 10 =highest) ...............................................................................................................................................22
Figure9:Childdeathsbysocio-economicclass(NS-SEC),2001-2003........................................................................................23
Figure10:AveragenumbersoffriendsandacquaintancesofpeoplelivingonthreedifferentroadsinBristol ......................24
Figure11:Waysinwhichresidentsattempttomitigatetrafficimpacts ....................................................................................25
Figure12:Shrinkingchildhoodtravel(imagecourtesyoftheDailyMail) .................................................................................26
Figure13:FrompresentationbyUCL–Childrentravellingtoschoolalone(NationalTravelSurvey) .......................................27
Figure14:Reasonsadultsgiveforaccompanyingtheirchildrentoschool(NationalTravelSurvey2008)..............................28
Figure15:Caloriesburnedduringdifferentformsoftravel(onleft)anddifferentactivities(onright) ..................................29
Figure16:DriverLicenceholdingbyageband ...........................................................................................................................30
Figure17:Percentagewithoutacar/vanbyethnicity(NationalTravelSurvey) ......................................................................33
Figure18:Quantityandtypeofspacebyblackandminorityethnicpopulation (all measures based on hectares of green space per 1,000 population) .................................................................34
Figure19:UKGreenhousegasemissionsfrompersonaltravelbyincomegroup .....................................................................37
Figure20:HistoricandForecastTrafficandEmissions,England(DfTRoadTransportForecasts2009) .....................................38
Figure21:SummaryofcomparativeresultsunderdifferentNATAassumptions ......................................................................45
Figure22:ManualforStreetsuserhierarchy ..............................................................................................................................52
Figure23:Flowdiagramillustratinganiterativeapproachtotransportassessment ...............................................................52
Figure24:Benefitcostratiosofalternativetransportpolicyoptions ........................................................................................54

Executive Summary — 7
Inexaminingfairnessintransportpolicy,itisfirstnecessaryto understand where we are starting from in terms of existingtransportpatterns.TheaverageBritishpersontravelled over three times as far in 2007 as their equivalent in1952,andthisexcludesinternationalairtravel.Almostall of this increase has been due to the growth of road transportand,inparticular,carjourneys.
The widespread availability and affordability of car travel hasbroughtmanybenefitsforpeople.Carsofferthefreedom to travel to almost any destination, at whatever time, with passengers and luggage and minimal need to plan ahead. They have made it easier to keep in touch withfriendsandfamilyandtoreachawiderrangeofjobopportunities. As they have become more affordable, theyhavedramaticallyexpandedthetravelpossibilitiesavailable to ordinary families.
But these freedoms have been obtained at a substantial price, and one that falls most heavily on the poorest and most vulnerable in society. The negative impacts of our expandingtravelhorizonsincludedeaths,injuries,andthe threat of accidents that restrict others’ freedoms; air and noise pollution; congestion; community severance and the loss of social cohesion. These and other impacts, in particular climate change, which are associated with increased travel, will place a heavy burden upon future generations.
Ourrighttofreedomofmovementmustbeexercisedwithout unduly compromising the rights of others to live free from the negative impacts that travel imposes. The challenge for Government is to create a framework and introduce policies, which achieve a better balance between potentiallyconflictingrightsandfreedomsinawaythatisequitable for both this and future generations and, which respects environmental limits.
Current UK transport patterns are dominated by road transport and car use – the UK has been described by the Commission on Integrated Transport as the most car-dependent country in Europe. Over the past decade, the costs of public transport alternatives have risen in real terms while the cost of motoring has fallen. More car journeyshavecreatedcongestionandproducedamorehostile road environment. Walking and cycling in particular have become more dangerous and unpleasant as the number of vehicles on the roads has increased. Over time, landusepatternshavechangedtoreflectcaruse.Shopsand services have moved to car-accessible locations. Journeypatternshavebecomemorediffuseandjourneys
have become longer. Our society is becoming hard-wired to increasing levels of car dependency.
The costs to society are substantial. In late 2009, the CabinetOffice,workingwiththeDepartmentforTransport,estimatedthecoststoEnglishurbanareasat£38-49billion.Thiswasbasedonexcessdelays,accidents,poorairquality,physical inactivity, greenhouse gas emissions and some oftheimpactsofnoise.Scalingthesefiguresupgivesanestimateof£43-£56billionforthewholeoftheUK.Yettheirreport acknowledges that there are important omissions fromthisfigure,mentioningforinstanceanadditional£4-5billion for noise impacts on health and productivity. The reportmakesnoattempttoquantifytheexternalcostsofnegative social impacts, despite referring to reduced social cohesionandinteractionasaresultoftraffic.Yetresearchfrom the Institute of Transport Economics in Oslo suggests that the cost of community severance (the ‘barrier effect’ due to transport infrastructure such as busy roads) is greater than the estimated cost of noise and almost equal to the costofairpollution.Whenthetypicalannualexpenditureonroadsofabout£8-9billionisaddedtothis,itisclearthatthetotalcostofourlevelofcardependencysignificantlyexceedsthe£48billionperannumintaxesandchargesonUK road users.
These positive and negative impacts are unevenly distributed.Sevenkeygroupshavebeenexamined:lowincome; children; older people; the disabled; black; Asian and minority ethnic groups; rural communities; and future generations. The review of evidence underpinning this reportrevealedanumberofkeyfindings:
Whilstover80%ofhouseholdshaveacar,oneinfive1 men and one in three women do not drive.
The richest 10 per cent of the population effectively 2 receive four times as much public spending on transport as the poorest 10 per cent.
Children of the lowest socioeconomic groups are up 3 to28timesmorelikelytobekilledontheroadsthanthose of the top socioeconomic group.
The most common cause of death for children aged 4 5-14 years is being hit by a vehicle.
Car owners in the lowest income quintile spend 25 5 percentoftotalhouseholdexpenditureonmotoring(by comparison spending 10 per cent of income on householdenergybillsisdefinedas‘fuelpoverty’).
Executive summary

8 — Fairness in Transport – Finding an alternative to car dependency – Sustainable Development Commission
Black and black British people have amongst the 6 lowest car ownership rates, while in London, for example,theyare30percentmorelikelytobeinjuredon the road than white ethnic groups.
Those in the top income quintile travel two and half 7 times as far as those in the bottom income quintile and three times as far by car. In the lowest income quintile, less than half of adults hold a driving licence and less than half of households have a car whilst half of all households in the highest income quintile have two or more cars. For those claiming income support orjobseeker’sallowance,caraccessfiguresareevenlower – almost two thirds do not have access to a car and a licence to drive it.
Thoseovertheageof60areseventimesmorelikely8 to be killed if hit by a car at 30 mph and 35 per cent of all pedestrian fatalities are people over the age of 70.
People living in rural areas now see car ownership as a 9 necessity and around 90 per cent of households have at least one car. The cost of motoring was found to accountfor60to100percentoftheadditionalincomecalculated as being required for rural dwellers to meet a minimum socially acceptable standard of living commensurate with urban dwellers.
55 per cent of trains in use in Great Britain have 10 not been built to modern access standards and 41 per cent of stations do not have step free access to all platforms. 39 per cent of buses do not have accessibilitycertificates.
Ouranalysisdemonstratesthatexistingtransportpatterns in the UK contribute to substantial and persistent inequalities.Somepeoplebenefitfromaccessingawiderange of education and employment opportunities and goods and services, whilst others are held back, unable to access the opportunities that would enable them to maximisetheirownwellbeingandsocialandeconomiccontribution.
The inequality is two-fold. In general the people experiencingtheworstaccessopportunitiesalsosufferthe worst effects of other people’s travel. They are both ‘less travelled’ and ‘travelled-upon’. The evidence we present in this report suggests that the central reason for this inequality is society’s dependence upon the car as its dominant mode of travel. Put simply, increasing car dependency has led to increasing unfairness.
A new approach to transport policy is badly needed – one whichaccommodatescomplexity,worksintelligentlywithsocial and environmental impacts, and takes a system-wide view. We need to move away from ‘predict and provide’ for powered transport (including rail and aviation) and work instead towards policy choices that are guided by a vision of a sustainable transport system.
Wefirstproposedanoverarchinghierarchicalapproachto transport policy in our consultation response to the Department for Transport’s Delivering a Sustainable Transport System consultation (2009). We used the hierarchy again to inform our approach in our Smarter Moves report (2010). This describes the four stages in more detail. The hierarchy is intended as a simple tool which can be used at all levels of transport policy making to structure thinkingingeneratingandprioritisingsolutions:

Executive Summary — 9
Recommendation: The Government and the Devolved Administrations adopt this over-arching transport hierarchy approach and promote its use at all levels of transport decision-making as a tool to ensure that the most sustainable and fair transport solutions are prioritised.
Whilst this approach to policy making will help to ensure that the most sustainable solutions are prioritised, another critical area requiring progress is the more detailed appraisal of transport scheme options.
Recommendation: The Government and the Devolved Administrations should improve the handling of social and distributional impacts in transport decision-making and appraisal. Changes made should be monitored to assess whether they are leading to fairer outcomes.
The suitability of alternative decision-making processes tocost-benefitanalysisforuseinareasofcomplexpolicymakinginvolvingsignificantsocialandlong-termimpactsshouldalsobeexplored.Implementingtheserecommendations would substantially improve the sustainability and, therefore, the fairness of future transport policy decisions. For this reason we make one further recommendation.
MODAL Shiftto more sustainable and space effi cient modes
EFFICIENCY Improvementsof existing modes
DEMAND Reductionfor powered transport
CAPACITY Increasesfor powered transport
1
2
3
4
Best
Worst
Sustainability option
s
Once all actions in Step 1 have been takenmove to Step 2
Once all actions in Step 2 have been takenmove to Step 3
Once all actions in Step 3 have been takenmove to Step 4
A Sustainable Transport Hierarchy

10 — Fairness in Transport – Finding an alternative to car dependency – Sustainable Development Commission
Recommendation: In order to tackle unfairness in society, the Government and the Devolved Administrations should make reducing transport inequalities a specific goal of transport policy.
Many of the transport schemes necessary to tackle unfairnesswillliewithinthejurisdictionoflocalauthorities.In England, we welcome the Department for Transport’s new Local Sustainable Transport Fund. As the Department suggests, the fund should support local authorities wishing to introduce packages of measures “encouraging walking and cycling, initiatives to improve integration between travelmodesandend-to-endjourneyexperiences,betterpublictransportandimprovedtrafficmanagementschemes”.
The success of the fund will depend on both the quality of the submissions from local authorities and on the methodology used to assess those submissions. The criteria usedtojudgeapplicationsforanyformoftransportfundingshould be based on the sustainable transport hierarchy and assessment of the social and distributional impacts.
Inatimeofextremepublicspendingconstraint,withfamiliesacrosstheUKexperiencinghardshipanduncertainty, the issues of affordability of fairness policies, and their acceptability by the public, do need to be considered.
Thebenefittocostratioofmanyofthemostsustainabletransportinterventionsisveryhigh,aspredictedbyexistingappraisal processes such as the one used in England, NATA. Interestingly, the current methodology of NATA does not takeintoaccountmanyofthesocialbenefitsthatwouldaccrue from more sustainable transport policies. If these wereincluded,thebenefit-costratiocalculationsarelikely to be even higher. It has also been argued that more sustainable policy options would be given greater value if the methodology used to calculate them more accurately reflectedtheurgentneedtoreducecarbonemissions.
By acting on the recommendations in this report, government at all levels will deliver a fairer, more environmentally sustainable transport system that no longer disadvantages the poorest and most vulnerable in society. In doing so it will result in a transport system that works better for us all.

Introduction — 11
The Coalition Government put three words on the front ofitsprogrammeforgovernment:Freedom,FairnessandResponsibility. In the foreword David Cameron and Nick Cleggstatethat:
“�Difficult�decisions�will�have�to�be�taken�in�the�months�and�years�ahead,�but�we�will�ensure�that�fairness�is�at�the�heart�of�those�decisions�so�that�all�those�most�in�need�are�protected…�We�both�want�a�Britain�where�social�mobility�is�unlocked;�where�everyone,�regardless�of�background,�has�the�chance�to�rise�as�high�as�their�talents�and�ambition�allow�them.”1
Equally, the debate on fairness and reducing inequalities is one that features strongly in the Devolved Administrations.
We agree that the pursuit of fairness should be a central goal of government. Much of the debate about fairness centres on reform of the welfare system, inequalities in earnings,taxationandaccesstohealthandeducation.Inthis report, we have chosen to focus on fairness in relation totransportpolicyandtodosowithinthecontextoftheemerging policy direction of the Coalition Government. Much of the analysis in this report however is relevant across the UK Government and Devolved Administrations.
In discussing fairness and the UK transport system, it is importanttodefinewhatwemeanbyfairnessitself.Oneof the two key principles of sustainable development stateswemustensurea“strong,healthyandjustsociety”.Thisisfurtherdefinedas“Meetingthediverseneedsofallpeopleinexistingandfuturecommunities,promotingpersonal wellbeing, social cohesion and inclusion, and creating equal opportunity”.2 For the purposes of this reportwehavechosentoshortenthissimplyto:Social
and environmental justice for all, now and in the future. (See Appendix 1 – Defining fairness for a detailed explanationofthis).
Transport has a central role to play in the creation of a fairer society. There are straightforward questions of whether people are able to access essential services, amenities and employment opportunities, keep in touch with friends and family, or travel to gain new and varied experiences,includingothercultures.Thesearethepositivebenefitsthattravelcanoffer.Therearealsonegativeimpacts:congestion;airandnoisepollution;deathsandinjuries;healthconcerns;reducedsocialcohesionandthecontribution that transport makes to climate change.
Thisreportexamineshowthesepositiveandnegativeimpactsareexperiencedbydifferentsectionsofsociety.Itlooksatwhoisbenefittingandwhoismissingout.Itexaminessomeofthecoststhatourtravelimposesonsociety and on who those costs fall. It focuses primarily on examiningtheimpactsofpersonaltravelintheUK,whilstalso discussing some of the impacts across the globe and on futuregenerations.Howeveritdoesnotexploretheissuessurrounding freight or aviation. For our work on the latter please refer to Breaking the Holding Pattern and Contested Evidence.3
The report shows how the principles of sustainable development can be applied to transport policy, starting from a simple hierarchy which can be applied in order to prioritise proposed policies and measures. This approach, in combination with improvements to the transport appraisal process, should be consistently applied to ensure that future transport policy decisions support the creation of a fairer and more sustainable society.
1Introduction
This report is being written against a background of some of the most dramatic cuts in public spending that have been witnessedfordecades,inordertoreducethedeficitinpublicfinances.Thereisacleardesiretoreturnthecountryto economic growth and the government has stated that “a modern transport infrastructure is essential for a dynamic and entrepreneurial economy”. In England, the Coalition Government has also committed to a reduction
in rules and regulations and a shift to “intelligent ways to encourage, support and enable people to make better choices for themselves”.4
The UK Coalition Government has also promised to reduce the cost of regulations, through measures such as a ‘one-in one-out’ policy, and a commitment to ‘shunning the bureaucratic levers of the past’. However it is not yet clear
Background
12 — Fairness in Transport – Finding an alternative to car dependency – Sustainable Development Commission
howregulatorycostswillbemeasured,orhowthebenefitsassociated with regulation (for instance protection of the environment or better working conditions) will be taken into account.
The Department for Transport’s business plan for 2011-2015 states:
“�Our�vision�is�for�a�transport�system�that�is�an�engine�for�economic�growth�but�one�that�is�also�greener�and�safer�and�improves�quality�of�life�in�our�communities.”5
The business plan only mentions fairness once, in relation to the introduction of road user charging for heavy goods vehicles, yet fairness is a central theme of this Government. As we show in this report, achieving a fairer society will require a new approach to transport policy making.
Thechallengeistofindtransportpoliciesthatpromotefairness, support the economic recovery, reduce transport carbon emissions and other negative environmental and social impacts, require minimal public funding, and align with the Government’s wish to reduce regulation. Similar challenges face the Devolved Administrations.
2 – The right to travel — 13
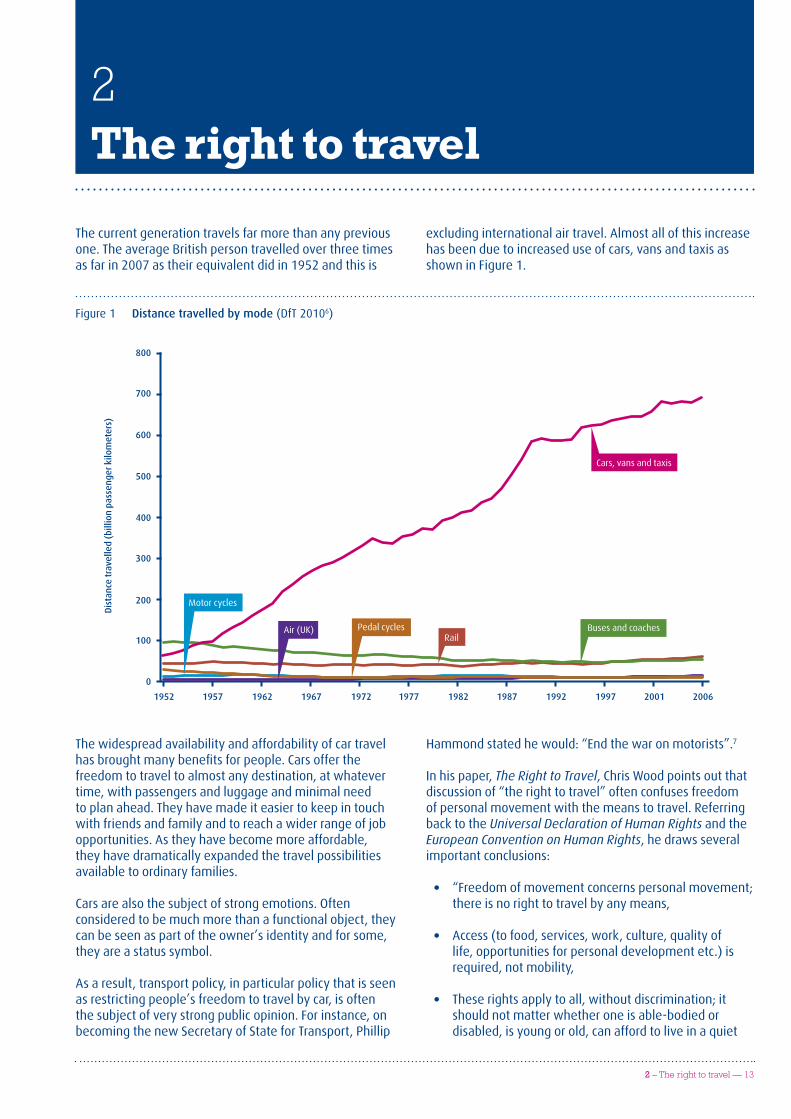
The current generation travels far more than any previous one. The average British person travelled over three times as far in 2007 as their equivalent did in 1952 and this is
excludinginternationalairtravel.Almostallofthisincreasehasbeenduetoincreaseduseofcars,vansandtaxisasshown in Figure 1.
2The right to travel
Figure 1 Distance�travelled�by�mode (DfT 20106)
Distance travelled by mode
Source: TSGB data
100
0
300
200
500
400
700
600
800
1952 1957 1962 1967 1972 1977 1982 1987 1992 1997 2001 2006
Cars, vans and taxis
Buses and coachesRail
Air (UK) Pedal cycles
Dis
tanc
e tr
avel
led
(bill
ion
pass
enge
r kilo
met
ers)
Motor cycles
The widespread availability and affordability of car travel hasbroughtmanybenefitsforpeople.Carsofferthefreedom to travel to almost any destination, at whatever time, with passengers and luggage and minimal need to plan ahead. They have made it easier to keep in touch withfriendsandfamilyandtoreachawiderrangeofjobopportunities. As they have become more affordable, theyhavedramaticallyexpandedthetravelpossibilitiesavailable to ordinary families.
Carsarealsothesubjectofstrongemotions.Oftenconsideredtobemuchmorethanafunctionalobject,theycan be seen as part of the owner’s identity and for some, they are a status symbol.
As a result, transport policy, in particular policy that is seen as restricting people’s freedom to travel by car, is often thesubjectofverystrongpublicopinion.Forinstance,onbecoming the new Secretary of State for Transport, Phillip
Hammondstatedhewould:“Endthewaronmotorists”.7
In his paper, The Right to Travel, Chris Wood points out that discussion of “the right to travel” often confuses freedom of personal movement with the means to travel. Referring back to the Universal Declaration of Human Rights and the European Convention on Human Rights, he draws several importantconclusions:
“Freedom of movement concerns personal movement; • there is no right to travel by any means,
Access (to food, services, work, culture, quality of • life, opportunities for personal development etc.) is required, not mobility,
These rights apply to all, without discrimination; it • should not matter whether one is able-bodied or disabled, is young or old, can afford to live in a quiet

14 — Fairness in Transport – Finding an alternative to car dependency – Sustainable Development Commission
location or not, drives a car or not, and so on. In addition, there is the issue of inter-generational equity, i.e.therightsoffuturegenerationstoenjoythesamefreedomsasweenjoytoday,whichisakeyelementofsustainable development,
Qualityoflife,agoodlivingenvironment,personal• security and freedom from road danger, noise and air pollution, are human rights,
Rights come with obligations.”• 8
He recognises that choosing where to live and having freedom of movement are considered by many as basic freedoms in a democratic country, but argues that these freedoms must be balanced against the freedoms of other peopletoenjoylifewithoutthenegativeimpactsofotherpeople’s travel. He also recognises that travel can broaden the mind and is a means of self-development, but that this
mustnotbeattheexpenseofotherpeople’srightsandfreedoms. There are for instance both negative and positive social impacts on local communities as a result of tourism. People’s freedom of movement must also be limited to remain within both local and global environmental limits.
The question of inter-generational equity is an important consideration.Asanalysisinthenextchaptershows,existingUKtravelpatternsarelargelyunsustainable.Itwould therefore be inappropriate to suggest that future generations should have a right to travel in the same way as we do today. However they should have a right to the same ‘fundamental freedoms’ as we have.
The challenge for any government is to create a framework andintroducepoliciesthatbalancepotentiallyconflictingrights and freedoms in a way that is equitable for both this and future generations and which respects environmental limits.

3 – Car Dependency – 15
Beforeexaminingthefairnessimplications,itisfirstnecessary to understand where we are starting from in termsofexistingtransportpatterns.Therearejustover31 million cars on the road and 4.2 million commercial vehicles.9AsFigure1illustrates,inanyexaminationofUKtravelpatterns,cars,vansandtaxisdominatewhenlookingat the distance travelled.
Oneinfivemenandoneinthreewomenovertheageof17do not hold driving licences.10 Of the total British population (including children), 42 per cent either cannot drive or do not hold a full driving licence.11 Nearly all these people makejourneyseverydaywhichareaffectedbytransportpolicy decisions, whether they are a parent navigating achildacrossabusyroadjunctionoradisabledpersonin a rural area with no bus service. For those who do not drive, transport means walking, cycling, public transport or getting a lift from friends or family who do have a car.
Inaresearchprojectlookingatscenariosforenvironmentally sustainable transport versus business as usual trends, the Organisation for Economic Co-operation
and Development (OECD) stated that about one third of the population are prevented from participating as fully as they could in the social and economic life of a country mainly dependent on the private car to meet its transport needs. They concluded “their disadvantage increases as society’s dependence on the car increases”.12
In its European Best Practice report, the Commission for Integrated Transport described the UK as having “the highest car dependency, and lowest public transport mode share, within the EU”.13
Buyingandrunningacarisexpensive.Thetotalcostofrunning a mid-range family car for 10,000 miles a year is estimatedatover£6000,14 or about a quarter of an average British salary. However many people would say that they do not feel they have any choice but to own a car in order to conduct their lives.
This is perhaps understandable given that over the past decade, the costs of public transport alternatives have risen in real terms while the cost of motoring has fallen (Figure 2).
3Car Dependency
“ Today, society and the lives we lead are increasingly organised around the assumption of having
access to a car. So much so, nine per cent of motorists say they never walk.”RAC Report on Motoring 2008
Figure 2 Changes�in�the�real�cost�of�transport�and�income:�1997�to�2009,�United�Kingdom15
40
1997 1998 1999 2000 2001 2002 2003 2004 2005 2006 2007 2008 2009
50
60
70
80
90
100
Inde
x: 1
997=
100
110
120
130
Bus and coach fares
Disposable income
Vehicle running costs
All motoringPurchase of vehicle
Rail fares

16 — Fairness in Transport – Finding an alternative to car dependency – Sustainable Development Commission
It is also the case that many car owners are unaware of the realcostsoftheirmotoring.Vehicleexciseduty,insurance,servicinganddepreciationareallfixedcostswhich,oncepaid, tend to be forgotten. When comparing alternatives to caruseforaspecificjourneymanymotoristslookonlyatthe cost of fuel.
In addition, they are often unaware of how big an impact car usage has or how far-reaching those impacts might be. In her book, Car Sick,16LynnSlomannotesthatthebenefitsof car ownership are primarily immediate and to the owner, whereas the disadvantages are primarily to others and often reveal themselves over a longer time.
She also discusses an issue that John Adams, Emeritus ProfessorofGeographyatUniversityCollegeLondonraises:If those who do not own cars are asked if they would like to,thevastmajorityreplyyes.Theyimaginetheworldasitisnowbutwiththemselveshavingthefreedomtoenjoyallthebenefitsofcarownership.Howeverthequestionwhichis not normally asked is ‘Would you like to live in a world in which everyone owns and uses a car?’ One can easily imagine that unrestricted use of cars by everyone would resultinmajorproblemsforsociety.Figure3illustratessome of the inter-relationships created by the growth of car dependency.
Figure 3 Impacts�of�Increasing�Car�Dependency17
Morecar
journeys
Morecongestion
Shops, etcmove to caraccesssiblelocations
Fewerpeoplewalking
and cycling
Unfitnessand
obesity
Carmore
attractive
Towncentres
degenerate
Longercar
journeysPeople
move tosuburbs
Morepeople
buy cars
Driversless bike
aware
Hostileroad
environment
Once youhave a cardriving ischeapest
Bussafety
worries
Lessticket
income
Morediffusejourneypatterns
Fewerbus
passengers
Hea
lth
and
Activ
e Travel Im
pacts Public Transport Im
pacts
Spatial Planning Impacts
Car usedfor school
run
Worsebus
service

3 – Car Dependency – 17
As the diagram shows, unrestricted growth of car use can lead to a vicious cycle of diminishing public transport quality. Incremental cuts to services and worsening reliability lead to declining public transport use which in turn leads to services becoming less viable and further cuts. Indeed over the longer term this cycle can even lead to decliningexpectationsforwhatconstitutesahighqualitypublic transport system as people lose sight of what might be possible.
Over the longer term, planning decisions and land use patternschangetoreflectcar-dependentlifestyleswithshops and services moving to car-dependent locations oftenresultingintheneedforlongerjourneys.Thisinturnresults in increased accessibility problems for those without car access.
It is often argued that it is unfair that motorists pay far moretoGovernmentintaxesandchargesthanisspentonroads. The 2009 Transport Select Committee report, Taxes and Charges on Road UserscalculatedthetotaltaxesandchargesonUKroadusersas£48billionperannum.Thereportquotedthetypicalannualexpenditureonroadsasabout£8-9billion.18
In the same report, the Department for Transport estimated thattheaveragemarginalexternalcostofdrivingacaran additional kilometre is 15.5 pence allowing for the congestion (estimated at 13.1 pence per kilometre), infrastructure, accidents, local air quality, noise and
greenhousegases.Thiscomparesto3.6penceperkilometre paid in fuel duty and VAT.
However there are other costs to society as a result of ourexistingcar-dependenttransportpatterns.Inlate2009aCabinetOfficeStrategyUnitreportonurbantransportattemptedtoquantifythecostsofourexistingurban transport patterns. Working with the Department for Transport, the Department for Communities and Local Government, the Department of Health and the Department for Environment, Food and Rural Affairs (Defra), they arrived at the costs shown in Figure 4.
3.1 The costs and revenues of motoring
Figure 4� Comparison�of�the�wider�cost�of�transport�in�English�urban�areas�(£billionperannum,2009pricesandvalues)19
0
2
4
6
8
10
12
£ bi
llion
per
ann
um
Excessdelays
£10.9billion
£8.7billion
£9.8billion
£4.5-£10.6billion
£1.2-£3.7
billion
£3-£5
billion
Accidents Poor airquality
Physicalinactivity
Greenhousegas emissions
Noiseamenity

18 — Fairness in Transport – Finding an alternative to car dependency – Sustainable Development Commission
Thefiguresarebasedonthebestavailableevidencesources,adjustedto2009prices.Wherethereisuncertaintyor disagreement, they have stated the likely range as shown in lighter shading in the bars. The conclusions changed policy makers’ understanding of the situation. Previously, congestion had been thought to represent the majorityoftransport’sexternalcoststosociety.Nowthecombined costs of accidents, air quality, physical inactivity, greenhousegasemissionsandnoiseat£27-38billionperannumrepresent71-78percentofthetotal.
The total cost for the English urban areas is estimated at £38-49billion.GiventhattheCabinetOffice’sreportstatesthatthiscovers81percentofthepopulation,scalinguptheappropriateimpactsgivesanestimateof£43-£56billionfor the whole of the UK.20
It is important to note that the report makes no attempt toquantifytheexternalcostsofnegativesocialimpacts,despite referring to reduced social cohesion and interaction asaresultoftraffic.YetresearchinNorwayestimatedthatthe cost of community severance (the ‘barrier effect’ due to transport infrastructure such as busy roads) is greater than the estimated cost of noise and almost equal to the cost of air pollution.21
TheCabinetOfficereportalsoexcludestheimpactsofnoisepollution on health, productivity and the ecosystem and does not attempt to quantify ‘quality of life’ impacts of the built environment. However it acknowledges that all theseareascouldrepresentsignificantadditionalcosts,mentioningforinstanceanadditional£4-5billionfornoiseimpacts on health and productivity alone.22
Alternatively, estimates of the marginal costs of road transport provided in a report commissioned by the Department of the Environment, Transport and the Regions23resultinahighertotalcostfigureof£71-95billion(in2006prices).24Thisexcludesthecostsofphysicalinactivity and other as yet un-monetised costs such as severance effects and loss of tranquillity.
So it would appear that the overall costs imposed on society by motoring outweigh the revenues obtained from motorists, probably very substantially.

4 – Fairness and Transport — 19
The UK transport system generates both positive and negative impacts, and these are spread across social, economic and environmental considerations.
From a fairness perspective, the important consideration is how these positive and negative impacts are distributed across different groups and generations in society. This
is a vast topic and it is beyond the scope of this report to include a thorough analysis of all its aspects. In this section some of the most important impacts on low income groups, children, older people, the disabled, rural communities, black, Asian and minority ethnic groups and future generations are considered.
“ …it is not right or fair when the opportunities open to people are not based on their ambition,
ability or hard work, but on who their parents are or where they live.”Rt. Hon Theresa May
17 November 2010
4Fairness and Transport
Key impacts for low income groups
� The�richest�10�per�cent�of�the�population�effectively�receive�four�times�as�much�public�spending� 1 on�transport�as�the�poorest�10�per�cent.
� The�children�of�the�lowest�socioeconomic�groups�are�up�to�28�times�more�likely�to�be�killed� 2 on�the�roads�than�those�of�the�top�socioeconomic�group.
� Car�owners�in�the�lowest�income�quintile�spend�25�per�cent�of�total�household�expenditure�on�motoring�3 (by�comparison�spending�10�per�cent�of�income�on�household�energy�bills�is�defined�as�‘fuel�poverty’).
4.1 Low income groups
Some of the clearest correlations between inequalities and transportareseenwhenexaminingdifferencesbetweenincome groups. There are a range of reasons for this.
Lower income groups generally travel less. Overall average figuresfortheamountoftravelintheUKdisguisehugevariations between different socioeconomic groups. The Department for Transport’s National Travel Survey shows
those in the highest income bracket travel over two and a half times further per year than those in the lowest income bracket.25 They travel over three times as far by car (see Figure 5).
4.1.1 Amount of travel by income group

20 — Fairness in Transport – Finding an alternative to car dependency – Sustainable Development Commission
Thisispartlyexplainedbythefactthatinthelowestincomequintile, less than half of adults hold a driving licence and less than half of households have a car. In comparison half of all households in the highest income quintile have two or more cars.
Forthoseclaimingincomesupportorjobseeker’sallowance,caraccessfiguresareevenlower.Almosttwothirds do not have access to a car and a licence to drive it.26
Manypeoplequotethefigurethat80percentofhouseholds have access to a car. However, household car access statistics can also mask problems of access
deprivation. For instance in a one-car household, if it is being used for a daily commute to work, it is effectively unavailable to other family members for a large portion of the time. This has been recognised as an issue for some time.27
Changes in car availability between 1995-7 and 2009 are showninFigure6.Whilethebiggestdropinthepercentageof carless households has been in the lowest income bracket, there are still 52 per cent of households without accesstoacarorvaninthiscategory.Thisisoverfivetimesthe percentage in the highest income bracket.
Figure 5 Distance�travelled�by�income�quintile (National Travel Survey)
Figure6 Change�in�percentage�of�households�without�a�car/van�1995-7�to�2009�(National Travel Survey)
0
20
40
60
80
90
10
30
50
70
100
Income quintile
1995
-7
2009
Hou
seho
lds
wit
hout
a c
ar/
van
(%)
Lowest HighestSecond Third Fourth
0
2,000
4,000
6,000
8,000
10,000
Car/Van
Walk/Cycle
Bus
Rail
Other
Second level
Mile
s pe
r pe
rson
per
yea
r
Lowest realincome level
Highest realincome level
Allincome levelsThird level Fourth level

4 – Fairness and Transport — 21
Growth has been fastest in the lowest income quintile, but allquintilesexceptthehighesthaveseencarsbecomeincreasingly available.
It is instructive to break down different income quintiles’ travel distances into the different modes. Figure 7 shows data from the 2009 National Travel Survey. When this is done, it is clear that while car and rail use tend to increase with income, bus use declines.
Data for walking shows little variation with income group although levels are slightly higher in the lowest income group (223 miles compared with 201 in the highest income quintile).28 Although it is often argued that we need to increase levels of walking to improve health, for those without a car in the lowest income groups, walking is often notanattractivechoiceandcanbeastressfulexperience.Walking through areas which are neglected, boarded up and strewn with litter has been shown to have detrimental health effects29 and deprived areas often have busy, noisy and congested roads causing further problems of trafficdangerandpollution.Howeverincreasingbusfaresmean that low income families often do walk, seeing the alternativeofbustravelasaluxury.30
Cycling has been consistently higher in the highest income quintile over the last few years, and particularly in the most
recent 2009 data (77 miles per person per year on average compared with 32 miles among people in the lowest income quintile). In general walking and cycling show less variation with income group than the other modes. In the Netherlands, Denmark and Germany where rates of cycling are much higher than the UK, cycle use is also similar across different income classes.31
These trends of transport use versus income quintile may be dominated by commuter patterns, but it is an important consideration when looking at fairness and transport funding decisions.
In fact, recent analysis by Horton and Reed32 illustrates (Figure8)thattheGovernment’sspendingontransport,unlike that for education, housing and health, is strongly biased towards higher income groups.
Figure 7 Distance�travelled�by�mode�by�income�quintile (National Travel Survey)
Lowestreal
incomelevel
Highestreal
incomelevel
Secondlevel
Thirdlevel
Fourthlevel
1,4001,2001,000
800600400200
0D
ista
nce (m
iles)
Rail
Lowestreal
incomelevel
Highestreal
incomelevel
Secondlevel
Thirdlevel
Fourthlevel
7,0008,0009,000
6,0005,0004,0003,0002,0001,000
0
Dis
tanc
e (m
iles)
Car and van
Lowestreal
incomelevel
Highestreal
incomelevel
Secondlevel
Thirdlevel
Fourthlevel
600
500
400
300
200
100
0
Dis
tanc
e (m
iles)
Local and non-local buses
Lowestreal
incomelevel
Highestreal
incomelevel
Secondlevel
Thirdlevel
Fourthlevel
300
250
200
150
100
50
0
Dis
tanc
e (m
iles)
Walk / Cycle
Walk
Cycle
22 — Fairness in Transport – Finding an alternative to car dependency – Sustainable Development Commission
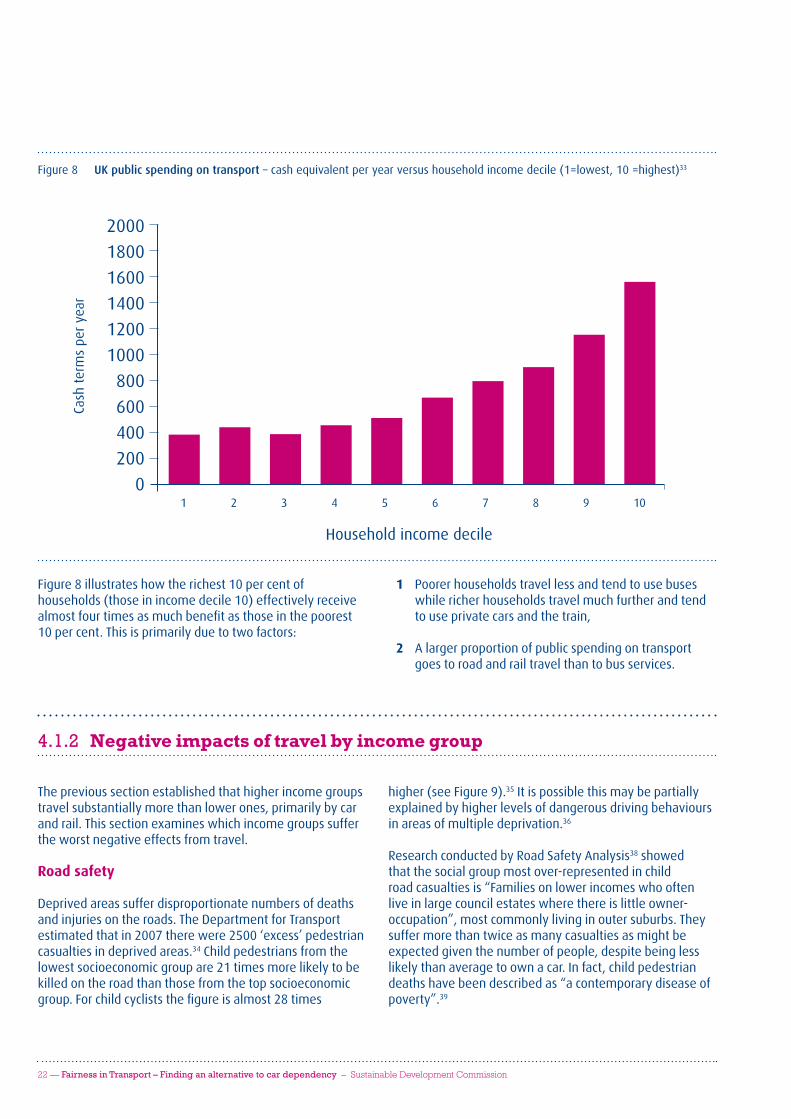
Figure8illustrateshowtherichest10percentofhouseholds (those in income decile 10) effectively receive almostfourtimesasmuchbenefitasthoseinthepoorest10percent.Thisisprimarilyduetotwofactors:
Poorer households travel less and tend to use buses 1 while richer households travel much further and tend to use private cars and the train,
A larger proportion of public spending on transport 2 goes to road and rail travel than to bus services.
Figure8 UK�public�spending�on�transport – cash equivalent per year versus household income decile (1=lowest, 10 =highest)33
Household income decile
2000
1800
1600
1400
1200
1000
800
600
400
200
01 2 3 4 5 6 7 8 9 10
Cash
ter
ms
per
year
4.1.2 Negative impacts of travel by income group
The previous section established that higher income groups travel substantially more than lower ones, primarily by car andrail.Thissectionexamineswhichincomegroupssufferthe worst negative effects from travel.
Road safety
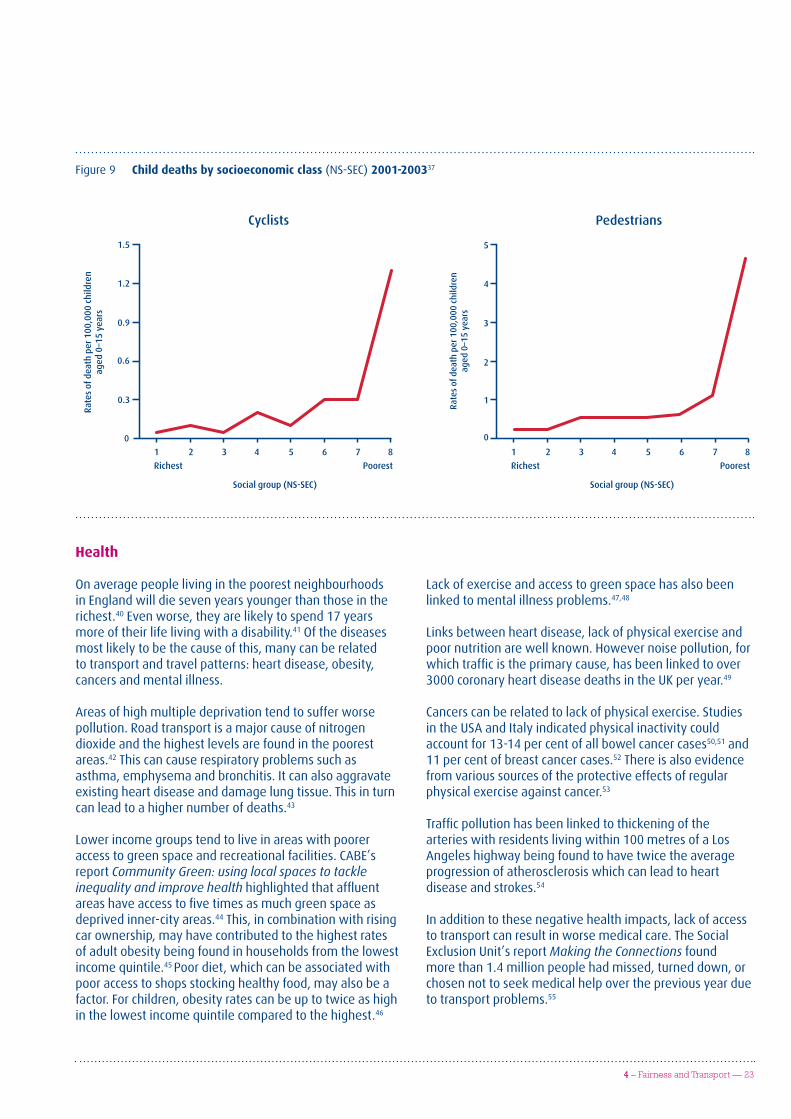
Deprived areas suffer disproportionate numbers of deaths andinjuriesontheroads.TheDepartmentforTransportestimatedthatin2007therewere2500‘excess’pedestriancasualties in deprived areas.34 Child pedestrians from the lowest socioeconomic group are 21 times more likely to be killed on the road than those from the top socioeconomic group.Forchildcycliststhefigureisalmost28times
higher (see Figure 9).35 It is possible this may be partially explainedbyhigherlevelsofdangerousdrivingbehavioursin areas of multiple deprivation.36
Research conducted by Road Safety Analysis38 showed that the social group most over-represented in child road casualties is “Families on lower incomes who often live in large council estates where there is little owner-occupation”, most commonly living in outer suburbs. They suffer more than twice as many casualties as might be expectedgiventhenumberofpeople,despitebeinglesslikely than average to own a car. In fact, child pedestrian deaths have been described as “a contemporary disease of poverty”.39
4 – Fairness and Transport — 23
On average people living in the poorest neighbourhoods in England will die seven years younger than those in the richest.40 Even worse, they are likely to spend 17 years more of their life living with a disability.41 Of the diseases most likely to be the cause of this, many can be related totransportandtravelpatterns:heartdisease,obesity,cancers and mental illness.
Areas of high multiple deprivation tend to suffer worse pollution.Roadtransportisamajorcauseofnitrogendioxideandthehighestlevelsarefoundinthepoorestareas.42 This can cause respiratory problems such as asthma, emphysema and bronchitis. It can also aggravate existingheartdiseaseanddamagelungtissue.Thisinturncan lead to a higher number of deaths.43
Lower income groups tend to live in areas with poorer access to green space and recreational facilities. CABE’s report Community Green: using local spaces to tackle inequality and improve healthhighlightedthataffluentareashaveaccesstofivetimesasmuchgreenspaceasdeprived inner-city areas.44 This, in combination with rising car ownership, may have contributed to the highest rates of adult obesity being found in households from the lowest income quintile.45 Poor diet, which can be associated with poor access to shops stocking healthy food, may also be a factor. For children, obesity rates can be up to twice as high in the lowest income quintile compared to the highest.46
Lackofexerciseandaccesstogreenspacehasalsobeenlinked to mental illness problems.47,48
Linksbetweenheartdisease,lackofphysicalexerciseandpoor nutrition are well known. However noise pollution, for whichtrafficistheprimarycause,hasbeenlinkedtoover3000 coronary heart disease deaths in the UK per year.49
Cancerscanberelatedtolackofphysicalexercise.Studiesin the USA and Italy indicated physical inactivity could account for 13-14 per cent of all bowel cancer cases50,51 and 11 per cent of breast cancer cases.52 There is also evidence from various sources of the protective effects of regular physicalexerciseagainstcancer.53
Trafficpollutionhasbeenlinkedtothickeningofthearteries with residents living within 100 metres of a Los Angeles highway being found to have twice the average progression of atherosclerosis which can lead to heart disease and strokes.54
In addition to these negative health impacts, lack of access to transport can result in worse medical care. The Social ExclusionUnit’sreportMaking the Connections found more than 1.4 million people had missed, turned down, or chosen not to seek medical help over the previous year due to transport problems.55
Figure 9 Child deaths by socioeconomic class (NS-SEC) 2001-200337
PedestriansCyclists
Rates�of�death�per�100,000
�children
aged�0–15�years
Richest�
Social�group�(NS-SEC)
Poorest
1� 2� 3� 4� 5� 6� 7� 8
0
0.3
0.6
0.9
1.2
1.5
Richest�
Social�group�(NS-SEC)
Poorest
1� 2� 3� 4� 5� 6� 7� 8
0
1
2
3
4
5
Rates�of�death�per�100,000�children
aged�0–15�years
Health

24 — Fairness in Transport – Finding an alternative to car dependency – Sustainable Development Commission
Cost and employment
For those low income families who do run a car, the total cost of car ownership can amount to a substantial proportionoftheirincome.TheSocialExclusionUnit’sreportidentifiedthatforcarowninghouseholdsinthelowest income quintile almost a quarter of household expenditureisonmotoringexpense.56 By comparison, fuel povertyisdefinedasspendingtenpercentofincomeonhousehold fuel bills. As has already been noted, the cost of public transport alternatives to car ownership have risen substantially in real terms over the last decade, while in many cases services have worsened. A transport system thatoffersonlylimitedandexpensivepublictransportoptionscanexacerbateunemploymentissues.TheSocialExclusionUnit’sreportfoundtwooutoffivejobseekersstated that lack of transport is a barrier to getting a jobandthetwomostcommonproblemsforyoungjobseekerswere“lackofpersonaltransport”and“nojob
nearby”.57Forthosecurrentlyhopingtomoveoffbenefits,transportproblemscanbeamajorworry.ResearchfortheDepartmentforWorkandPensionsfound:
“�Of�all�the�factors�associated�with�concern�about�moving�off�benefit,�one�(access�to�transportation)�stood�out�as�especially�important�in�predicting�anxiety.”58
Social cohesion
Livingonroadswithhigherlevelsoftrafficcanhavenegativesocialimpacts.Astudyin1969byDonaldAppleyard attempted to quantify this in San Francisco by recording the numbers of friends and acquaintances of peoplelivingonroadswithvaryingtrafficlevels.59 The studymethodologywasrepeatedin2008inBristol,UKwithvery similar results.60
Figure 10 Average�numbers�of�friends�and�acquaintances�of�people�living�on�three�different�roads�in�Bristol61
Light traffic
Frie
nds
Acq
uain
tan
ces
Medium traffic Heavy traffic
7
6
5
4
3
2
1
0
ThestudyinBristollookedatotherwaysthattrafficimpactssocial cohesion. It found various ways in which residents hadtriedtominimisetheimpactsoftraffic:fromliving
in the back of the house and building a wall in the front garden to curtailing the freedom and social lives of their children.ExamplesareshowninFigure11.

4 – Fairness and Transport — 25
InEurope,researchfromBaselinSwitzerlandindicatesthatpeoplearemoresociableonstreetswithlowertrafficspeeds. The number of people saying they ‘linger’ in their street increased from 24 per cent in a 50 kph (31 mph) street to 37 per cent in a 30 kph (19 mph) street.63
Social impacts such as these are not generally included in transport policy analysis yet millions of people from all social backgrounds now live with these effects on roads withheavytraffic.
Figure 11 Ways�in�which�residents�attempt�to�mitigate�traffic�impacts62
Over the last 20 years, children living in families with good access to transport are likely to have had much wider travel opportunities than previous generations. They may have hadtheopportunitytoexperiencedifferentculturesandlanguages through travelling abroad, as well as visiting more of their own country. They may also have had a wider geographical range of friends and leisure activities.
However in other respects their freedom to be ‘out and about’ has shrunk. In a speech to Barnados in June 2010, NickClegghighlightedthisissue:
“ … Every parent understands the importance of a secure environment for their children. Spaces where they can play, where they can feel completely free, where they can safely push at the boundaries,
4.2 Children and young people
20
18
16
14
12
10
8
6
4
2
0Shut
windowsLive morein the back
of the house
Forbid kidsfrom playingin the street
Go out onthe streetless often
Addheavy
curtains
Accompanykids toschool
Build a fenceor wall in
front garden
Add shrubsto frontgarden
Num
ber
of h
ouse
hold
s
Ligh
t
Med
ium
Hea
vy
Key impacts for children and young people
� The�most�common�cause�of�death�for�children�aged�5-14�is�being�hit�by�a�vehicle.1
� Children’s�independent�mobility�has�been�dramatically�curtailed�due�primarily� 2 to�fears�of�traffic�danger.
� Children’s�health�is�particularly�badly�affected�by�society’s�car�dependency�–� 3 obesity,�respiratory�illnesses�and�problems�caused�by�noise�pollution.

26 — Fairness in Transport – Finding an alternative to car dependency – Sustainable Development Commission
M1
learning and experimenting. Places where different generations can meet, binding the community together… If you ask adults if they used to play near their homes as children, 71 per cent will tell you they did. Every single day. That compares to just 21 per cent of children now. It’s not right, and it has to change.”64
The problem was graphically illustrated in a newspaper article in 2007 (Figure 12)65 It shows how the area that children are allowed to travel alone has shrunk through successive generations of one family.
Figure 12 Shrinking�childhood�travel�(Source:DailyMail)
Beighton
Chapeltown
Grenoside
SHEFFIELD
1919GeorgeGreat-GrandfatherAllowed to walk six miles to go fishing.
1950 JackGrandfatherAllowed to walk one mile to the woods.
Allowed to walk half a mile to the swimming pool.
1979VickyMother
Allowed to walk 300 yards to the end of his street.
2011EdSon
Sowhiletherearepotentialbenefitstochildrenfromincreased opportunity to travel, the question is whether this been outweighed by other changes. Have the changes
inourcollectivetravelpatternsbenefittedothergroupsattheexpenseofchildren’shealthorparticipationinthelocalcommunity?

4 – Fairness and Transport — 27
Everyday,28childrenandyoungpeoplearekilledorseriouslyinjuredonBritishroads.66 Between the ages of fiveto14,themostcommoncauseofdeathisbeinghitby a vehicle. On average, one child in every class is killed orinjuredasapedestrian,cyclistorpassengerinamotorvehiclebythetimetheyare16.67 Even between the ages of 14 to 35, the most common cause of death is being involved in a collision on the road.68 While progress has been made and there has been a substantial reduction in the absolute numbers of children and young people killed andseriouslyinjuredonUKroadsoverthepastfifteenyears,thesefiguresarestilltoohigh.Inaddition,theofficial
casualtyfiguresmaybesubstantialunderestimates. Thefiguresaretakenfrompolicerecords,butothersourcesindicatehighernumbers.Totalseriousinjuriestoallagesarerecordedasabout26,000peryear.TheDepartmentfor Transport has admitted that the actual number is likely to be somewhere between 50,000 and 120,000.69 This is equivalent to about 1,000 to 2,300 every week.
Although it is questionable whether one can put a value on alife,usingDepartmentforTransportfigures,thecosttothepublicpurseofdeathsandinjuriesofunder25yearoldsamountstoover£3billionayear.70
4.2.1 Road casualties
Learningtomakejourneysindependentlyandtotakeresponsibility for personal safety is an essential part of growing up. Children are eager to do this from an early age yet parents are often reluctant to allow them due to the dangerposedbytraffic.Forinstanceoneinthreechildrenwould like to cycle to school yet under two per cent actually do so.71
The report One False Move: A Study of Children’s
Independent Mobility72 published in 1990, looks at children’s independent mobility. It concluded that between 1971 and 1990, the independent mobility of children was dramatically curtailed. One of the commonly quoted examplesfromthereportwasthatin1971,80percentof seven to eight year olds walked home from school on theirown.By1990,thishaddroppedtojust9percent.ThistrendisconfirmedbymorerecentresultsfromtheNational Travel Survey.
4.2.2 Independent travel
Figure 13 From�presentation�by�University�College�London�–�Children�travelling�to�school�alone (National Travel Survey)
50
45
40
35
30
25
20
15
10
5
01985-86 1992-4 1998-2000 2008
Perc
enta
ge o
f ch
ildre
n
Age
5-1
0
Age
11-
16

28 — Fairness in Transport – Finding an alternative to car dependency – Sustainable Development Commission
Correspondingly, the number of children travelling to school by car over the past 20 years has doubled.73
Policy Studies Institute repeated the One False Move study in2010inEnglandandGermany.Theyfoundthatfiveoutofsixmeasuresoftravelindependencearelowerforchildrenin England than in Germany. The most marked difference
isforwalkingtoschoolalone.While7percentofEnglish8year olds are allowed to walk to school independently, the comparablefigureforGermanyis67percent.
There are various reasons that parents give for not allowing children to travel on their own. The most common is safety fearsduetotrafficdanger(Figure14).
Figure 14 Reasons�adults�give�for�accompanying�their�children�to�school(NationalTravelSurvey2008)
Aged 7-10 Aged 11-13
Traffic�danger 58 34
Fear�of�assault/molestation 29 23
Convenient�to�accompany�child 21 30
School�too�far�away 20 29
Child�might�not�arrive�on�time 18 15
Child�might�get�lost 19 7
Fear�of�bullying 6 6
Other 12 15
The ‘barrier effect’ or ‘severance’ due to transport infrastructure such as busy roads particularly affects children.Toachildabusymainroadcanbeamajorlimitation on their freedom to travel. As our report Every Child’s Future Matters highlighted, “it might as well be a river”.74
BRAKE, the road safety charity, surveyed children’s views oftrafficin2008.75 The results show some of the issues childrenface:
60percentsaidtheythoughttheroadsaround • their homes were dangerous,
50 per cent said they were scared all or some of • the time in cars by the driver driving too fast,
5 per cent said they had been hit by a vehicle and a • third (32 per cent) said they had nearly been hit on foot while walking without their parents,
Ofthechildrenwhocycleonroads,onein17(6per• cent) said they had been hit by a vehicle and almost four in ten (37 per cent) said they had been nearly hit while cycling without their parents.
Itiseasytoforgethowmodernurbandesignandtrafficimpacts children. This was summed up by the Mayor of Rome,WalterVeltroni,whenhesaid:76
“ We need to rethink the city as seen through the eyes of children, from a height of one metre and ten centimetres.”

4 – Fairness and Transport — 29
While levels of childhood obesity have declined from a peak of 17 per cent of 2-10 year olds in 2005 to 14 per cent in the mostrecent2008data,77 this is still a substantial increase over previous levels and concerns of an ‘obesity epidemic’ remain. Data from the National Child Measurement Programmesuggeststhatsince2006,levelsofobesityinreception class children have remained static and those in year6haverisenslightly.78
Obesityisaffectedbyexerciseaswellasdiet.Childhoodobesity has been related to restrictions in children’s opportunities to walk, cycle, or simply play outdoors. Research by the Centre for Transport Studies in University CollegeLondonhasexaminedthecaloriesburnedbychildren during different activities (see Figure 15).79
4.2.3 Obesity
Figure 15 Calories�burned�during�different�forms�of�travel�(on left)�and�different�activities (on right)80
Walking, cycling and playing outside are the activities which burn the most calories. Instead of being able to engage in these activities in their locality, children are increasingly being driven to organised activities. Walking and cycling to activities instead of being driven will burn
more calories. However researchers also found that once at a given activity, children that had been driven were less active than those who walked or cycled. These combined effects lead to a substantial overall reduction in calorie burn.
Walking
Cycling
Bus
Car
0.0 0.5 1.0 1.5 2.0 2.5
Activity calories per minute Activity calories per minute
0.0 0.5 1.0 1.5 2.0 2.5
Playing
Organised activities
Travel
Other
Out on trips
School
Other people’s homes
Being at home
Airpollutioncausedbyroadtrafficisaparticularissuefor children. Studies have shown around a 50 per cent increased risk of respiratory illnesses including asthma for children living near busy roads.81
The primary source of noise pollution is transport, whether itberoadtraffic,aviationortoalesserextentrail.Noise
pollution can particularly affect children. In our report on health inequalities Sustainable Development: The key to tackling health inequalities82 we highlighted evidence that noise can lead to sleep disturbance and increased cardiovascular risk, negative effects on learning, negative impacts on mental health and elevated stress levels.
4.2.4 Air and noise pollution

30 — Fairness in Transport – Finding an alternative to car dependency – Sustainable Development Commission
Young people are very conscious and concerned about the cost of public transport use and this can restrict their social life and employment opportunities.83,84 This can be a particular problem when they reach the age at which concessionary fare schemes are no longer available. Schemes available also vary markedly. In London anyone under16cantravelfreeonbusesandtrams,withextensionsto16and17yearoldsinfull-timeeducationor on work-based learning. Elsewhere child bus fares are generally either half or two-thirds of adult fares and are offereduptotheageof14,15or16.85
Once young people reach the age where they are legally allowedtodrive,theyfacesignificantbarrierstobecominga car owner. For many, the cost of driving lessons and insurance premiums are prohibitive. As a result licence holdinginthe16-29agebandhasbeenfalling(althoughthis trend has recently reversed).86 Licence holding in this band is now lower than for any other age as shown in Figure16.
4.2.5 Affordability
Figure16 Driver�Licence�holding�by�age�band87
0
20
40
60
80
90
10
30
50
70
100
Perc
enta
ge o
f ad
ults
16+
wit
h dr
ivin
g lic
ence
s
1990 1995 2000 2005
16-29
30-49
70+
50-69
The inability to be able to afford to run a car in a society that has increasingly been organised around the presumption of car ownership can be a barrier to accessing educational
and employment opportunities, especially in rural areas.88 Provision of realistic alternatives to car use can help address these issues.

4 – Fairness and Transport — 31
The UK has an ageing population demographic. Those overtheageof65currentlymakeup16percentoftheUKpopulation and this is predicted to rise to almost 25 per cent by 2033.89
Many older people now have much greater mobility than previous generations, primarily due to increased car ownership and use.90 In 2000 research suggested that the numbers of over 70 year olds holding driving licences wasexpectedtodoubleby2015.91Figure16illustrateshow licence holding has increased for those over 50 and particularly those over 70 in the last 20 years. This is likely tobeacohorteffectasthesearethefirstgenerationstohave grown up with mass car ownership. As a result many have lifestyles and travel patterns based around the car.
The growth in car ownership and use, and in many areas the lack of adequate alternative travel options, have meant that not having access to a car can have serious consequences. For those that lose their licence (and any non-driving partners) the sudden loss of independent mobility can have negative impacts on mental and physical health. The RAC Foundation in a recent report cite research fromFinlandintocarusebythoseover65,whichstates“Reduced mobility was found to be associated with loss of independence, reduced general activity, poorer health and increased depression”. They also cite research which shows thatolderpeoplemake80percentoftheirlongerjourneysby car.92
However, almost half of those over the age of 70 do not hold a licence. There is a correlation between people who do not have access to a private vehicle and multiple social exclusion. Those without a vehicle are less likely to be in contact with family and friends, or to go out to the cinema
ortheatre,andhavedifficultlyaccessinghealthservicesand shops.93 While the concessionary fare scheme has been a valuable means of addressing affordability and access issues for older people, it is still dependent on the availability and acceptability of the public transport services available.
Trafficisamajorbarrierforolderpeople.Astheirphysicalmobility becomes impaired it becomes harder for them to cross busy roads. Research conducted in Edinburgh concludedthatthoseagedover65weredisadvantagedby more than ten-fold compared to other adults in their ability to cross a shopping street.94 This was graphically illustrated by the recent news story of the pensioner who was discovered to be making a 14 mile round trip using her free bus pass in order to cross the road to her village shop as there was no pedestrian crossing in her village.95
Older people are also disproportionately at risk on the road. A recently released report reveals that for those over the ageof60,thefatalityriskifhitbyacarat30mphis47percent.96 This is almost seven times higher than the average ‘all-ages’figure.97Thishelpsexplainwhy35percentofall pedestrian fatalities are people over the age of 7098 – a disproportionately high share. The report reveals that the same is true for older car drivers who are much less likely to survive a crash due to increased frailty.
As people get older they drive less and they become increasingly reliant on alternatives such as lifts from others, publictransportandtaxis.Onestudyfoundthatwhilethepercentage of people who ‘mainly’ use public transport in middle age was 25 per cent, this increased to around 40 per centfor65to84yearolds.99 Yet their use of public transport can be dependent on overcoming a number of barriers.
4.3 Older people
Key impacts for older people
�Older�people�are�more�at�risk�of�death�or�injury�on�the�road�in�the�event�of�a�collision,�both�as�car�1 users�and�pedestrians.�Those�over�the�age�of�60�are�seven�times�more�likely�to�be�killed�if�hit�by�a�car�at�30�mph�and�35�per�cent�of�all�pedestrian�fatalities�are�people�over�the�age�of�70.
�Traffic,�personal�safety�fears�and�problems�with�the�reliability�of�public�transport�are�all�significant�2 barriers�to�older�people�maintaining�their�independence.
�There�is�a�correlation�between�lack�of�access�to�a�private�vehicle�and�multiple�social-exclusion�for�3 older�people�–�this�may�be�due�to�the�poor�choice�of�satisfactory�alternatives�available.

32 — Fairness in Transport – Finding an alternative to car dependency – Sustainable Development Commission
Concernsaboutpersonalsafetyanddifficultyincarryingheavy loads are two of the most common problems100 but other factors such as problems with the reliability of public transport and behaviour of transport staff and other passengers are also important. Perceptions of their own health – for instance fear of falling can also become a significantfactor.101
Older people are often reluctant to ask friends and family for lifts even for trips to doctors or hospital appointments,102 not wanting to be a burden on others.103
In general, disabled people are less likely to drive and are more likely to be reliant on public transport, community transportorliftsfromfriendsandfamilyfortheirjourneys.However, for some groups, for instance people with physical impairments and chronic health conditions, driving is still the predominant mode of transport.104
For those using public transport, the primary problem is accessibility. There are still many public transport services which are inaccessible to wheelchair users. The Social ExclusionUnit’sreportin2003foundonly10percentoftrains and 29 per cent of buses met the required standards of the 1995 Disability Discrimination Act. The Department for Transport’s goals under the previous administration werethatthebusfleetshouldbecompliantwiththesestandards by 2017 and heavy rail by 2020. While progress hasbeenmade,in2010approximately55percentoftrainsin use in Great Britain have not been built to modern access standards, and in 2009-10, 39 per cent of buses do not have accessibilitycertificates(althoughmostofthesedonowhavelowflooraccess).105 Accessibility of stations is also an issue with 41 per cent of stations not having step free access to all platforms.106 In Wales the fact that more than half the rail stations are not fully accessible led to protests in October 2010.107 In London only 37 over-ground stations
(47percentofthetotal)areexpectedtohavestep-freeaccess by 2017108 although this timing might now be delayed due to budget cuts.
The other key issue for disabled people using public transport is being able to obtain information such that they canbeconfidentthattheywillnotencounteraccessibilityissuesatanystageoftheirjourney.
As a result many disabled people are restricted in their travel options and in turn their choice of employment. A 2003 report surveying disabled people’s transport problemsfoundabouthalfhavingtoturndownajobofferor interview due to lack of accessible transport and half saying that lack of transport had restricted their choice of job.109Thesefiguresriseto62percentforwheelchairusersand86percentforthosewithavisualimpairment.
Itisnotjustemploymentthatisaffected.Thesamesurveyfound 21 per cent felt that transport problems had limited the availability of education and training, 30 per cent found difficultyinattendingsocialfunctions(45percentforthosewithoutaccesstoacar),and20percentfounditdifficultorimpossible to access the healthcare they needed.
4.4 People with disabilities
Key impacts for people with disabilities
�Fundamental�problems�of�inaccessibility�persist�despite�legislation�dating�back�to�1995�–� 1 55�per�cent�of�trains�in�use�in�Great�Britain�have�not�been�built�to�modern�access�standards� and�41�per�cent�of�stations�do�not�have�step�free�access�to�all�platforms.�39�per�cent�of�buses� do�not�have�accessibility�certificates.
�A�key�barrier�to�disabled�people’s�travel�is�uncertainty�regarding�potential�accessibility�problems�2 for�any�given�journey.�As�a�result�both�education�and�employment�opportunities�can�be�severely�compromised�as�can�their�social�inclusion.
4 – Fairness and Transport — 33
As the Department for Transport’s Evidence Base Review on Mobility states “policy initiatives to improve economic and social inclusion of disabled people, and to reduce health inequalities, will not be effective unless the important role of the provision of accessible public transport is recognised.”110
There are other ways in which disability leads to inequalities. The 2010 report from the Equality and Human Rights Commission revealed that disabled men earn on average 11 per cent less than other male workers.111 They therefore face not only direct accessibility problems but also additional inequalities as a result of lower income.
Key impacts for Black, Asian and minority ethnic groups
�Black�and�black�British�people�have�amongst�the�lowest�car�ownership�rates�yet�in�London�they�are�1 30�per�cent�more�likely�to�be�injured�on�the�road�than�those�in�white�ethnic�groups.
�Minority�ethnic�groups�are�generally�more�likely�to�be�public�transport�users�yet�they�face�greater�2 barriers�to�its�use�in�the�form�of�personal�safety�fears�and�inadequate�understanding�of�their�needs.
�Ethnic�minorities�have�much�worse�access�to�green�space�in�the�areas�in�which�they�live,�which,�3 in�combination�with�the�transport�barriers�they�face,�leads�to�greater�inequalities�in�mental�and�physical�health�outcomes.
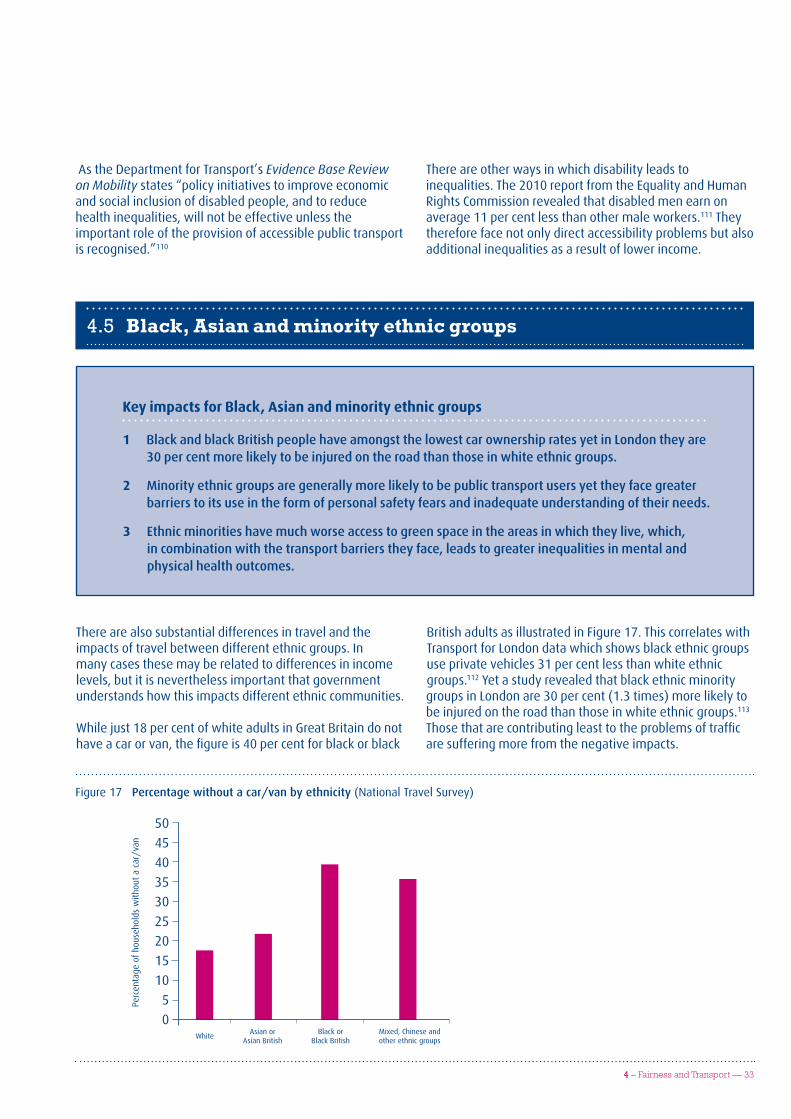
There are also substantial differences in travel and the impacts of travel between different ethnic groups. In many cases these may be related to differences in income levels, but it is nevertheless important that government understands how this impacts different ethnic communities.
Whilejust18percentofwhiteadultsinGreatBritaindonothaveacarorvan,thefigureis40percentforblackorblack
British adults as illustrated in Figure 17. This correlates with Transport for London data which shows black ethnic groups use private vehicles 31 per cent less than white ethnic groups.112 Yet a study revealed that black ethnic minority groups in London are 30 per cent (1.3 times) more likely to beinjuredontheroadthanthoseinwhiteethnicgroups.113 Thosethatarecontributingleasttotheproblemsoftrafficare suffering more from the negative impacts.
4.5 Black, Asian and minority ethnic groups
Figure 17 Percentage�without�a�car/van�by�ethnicity�(National Travel Survey)
50
45
40
35
30
25
20
15
10
5
0White
Asian orAsian British
Black orBlack British
Mixed, Chinese andother ethnic groups
Perc
enta
ge o
f ho
useh
olds
with
out
a ca
r/va
n

34 — Fairness in Transport – Finding an alternative to car dependency – Sustainable Development Commission
Department for Transport data also shows that the proportion of Asian adults who do not drive is twice that of white adults.114
While many black, Asian and minority ethnic groups are more dependent on public transport, they are also more likelytoencounterproblemsusingit.Forexample,ina2001 study, more than a third of Hindu, Muslim and Sikh organisations reported that their members had been discriminated against on public transport.115 Research for the Department for Transport also found almost a quarter of young people from black and minority ethnic groups have reported harassment due to their colour, race or religion.116 Personal safety fears, when using public transport and when walking to, or waiting at bus stops or train stations areasignificantbarrier.117
There are more practical problems too. Language barriers can prevent access to public transport information services. They can also prevent ethnic minority groups from participating in consultations and customer surveys which might otherwise help to raise these issues. The Department for Transport’s Evidence Base Review of Mobility suggests that inadequate understanding of the needs of minority ethnicandfaithcommunitiesmayalsoexcludethemfromaccessibility planning.
There are other ways in which ethnic minorities are affected. CABE’s work on access to green space118 highlights that wards with high ethnic minority populations (greater than 40 per cent) have eleven times less public green space than wards with very low ethnic minority populations (less than two per cent) based on area of green space per 1,000 population.
Figure18 Quantity�and�type�of�space�by�black�and�minority�ethnic�population (all measures based on hectares of green space per 1,000 population)119
200
340
320
300
280
260
240
220
180
160
140
120
100
80
60
40
20
0Under 2% 2-5% 6-10% 11-20% 21-40% Over 40%
Inde
x
Parks
General green space
Recreation grounds
Sports grounds
Playgrounds
Percentage of population who are black and minority ethnic

4 – Fairness and Transport — 35
Thisfindingisstronglyinterlinkedwithissuesoflowerpaidemployment levels for minority ethnic groups and higher likelihood of living in a deprived area.120
Much lower availability of green space, combined with the transport problems already described, is likely to result in much worse access to green space for black and minority ethnic populations. This in turn is likely to lead to inequalities in both mental and physical health outcomes.
The growth of car ownership has been accompanied by a steady decline in the provision of rural public transport services. People living in rural areas now see car ownership as a necessity121 and around 90 per cent of households have at least one car. By comparison, in London boroughs, the figureis57percent.122Thisislikelytoreflecttheavailabilityofpublictransportalternativesandamoredensifiedcity.
The fact that a car is almost a necessity in rural areas imposesasignificantadditionalcostonthoselivingthere.Since2008theJosephRowntreeFoundationhaspublishedreports on the ‘minimum income standard’ – the budget required to cover the cost of a basket of goods and services foraspecifiedhouseholdtypetomeetaminimumsociallyacceptable standard of living.123 The measure has been based on urban areas and did not include the cost of running a car as this was not considered a necessity by those living in urban areas.
However in November 2010, they published a report looking at minimum income standards for rural households.124Itexaminesdifferentsocialgroupslivinginrural towns, villages and hamlets. In all but one instance (pensioners living in rural towns), a car was deemed a necessity. Across the different groups and locations, the cost ofmotoringwasfoundtoaccountfor60to100percentof
the additional income calculated by JRF as being required for rural dwellers to meet a minimum socially acceptable standard of living commensurate with urban dwellers.
The 10 per cent of rural households who do not have accesstoacarcanfacedifficultiesaccessingemployment,education and other opportunities. Evidence from various sources suggests young people in rural areas without access toacarhave“extremelydisadvantagedjobopportunities”,particularly if they have low educational achievement.125 Yet40percentsaidthattheirdecisionsonpost-16educationhadbeeninfluencedbytransportissues.126 DepartmentforTransportfiguresshowonly51percentof rural households are within a 13 minute walk of a bus stopwithatleastanhourlyservice,incomparisonto96per cent of urban households.127 The Commission for Rural Communities’ Rural Insights survey showed public transport to be the area that people in rural areas most wanted improving.128
A further issue for rural dwellers is intimidation due to the danger posed by vehicles on rural roads. The Campaign to Protect Rural England found two thirds of people felt threatenedbymotortrafficonruralroadssomeorallofthe time.129Thestatisticsseemtoconfirmthesefears–accordingtotheDepartmentforTransport,over60percent
4.6 Rural communities
Key impacts for rural communities
�People�living�in�rural�areas�now�see�car�ownership�as�a�necessity�and�around�90�per�cent�of�1 households�have�at�least�one�car.�The�cost�of�motoring�was�found�to�account�for�60�to�100�per�cent�of�the�additional�income�calculated�as�being�required�for�rural�dwellers�to�meet�a�minimum�socially�acceptable�standard�of�living�commensurate�with�urban�dwellers.���
�Young�people�in�rural�areas�who�do�not�have�access�to�a�car�are�particularly�badly�disadvantaged�2 both�in�educational�and�employment�opportunities.
�Any�future�rises�in�the�costs�of�motoring�are�likely�to�have�a�stronger�impact�on�rural�communities�3 as�they�often�have�no�alternative�travel�options.

36 — Fairness in Transport – Finding an alternative to car dependency – Sustainable Development Commission
of all road fatalities happen on rural roads despite them carryingaround40percentoftraffic.130
For those who do have a car, the costs of travel can be prohibitive. Rural fuel prices can be as much as 10 or 15 pence higher than urban areas131 and those on lower incomes in rural areas drive much less than average.132
Ifthetaxesandchargesondriversaresupposedinparttocompensate for the costs of congestion and pollution, it has been argued that rural drivers pay too much and urban drivers too little in comparison to their relative contribution to these costs.133 The Commission for Rural Communities has raised concerns that any introduction of road pricing schemes should be rural proofed to ensure they do not further increase inequalities between urban and rural areas.134
Themostobviousimpactofexistingtransportpatternsonfuture generations will be changes to the global climate and weather patterns. A recent Swedish study estimates the health impacts suffered in developing countries as a consequence of emissions of greenhouse gases from the Swedish road transport system may be three times greater thanthemortalityfromroadtrafficaccidentsinSwedenitself (based on estimated disease burden related to global climate change).135
Yet it is those living in the developed countries that are disproportionately responsible for greenhouse gas emissions. According to Kevin Anderson of the Tyndall Centre for Climate Change Research, 50 per cent of global carbonemissionsareproducedbyjustonepercentoftheglobal population, with anyone in the UK who earns over £30,000ayearprobablybeinginthatonepercent.136
The Marmot Review of health inequalities states “Although low-income countries will suffer most acutely, in all countries the risks associated with climate change will
fall disproportionately on ‘the urban poor, the elderly and children, traditional societies, subsistence farmers, and coastal populations.’”137 Those who are already deprived by their level of income, health or housing will be most vulnerable to these impacts.138 In the UK poorer people are more likely to be living in urban areas which will be hotter with higher heat stroke risks.139 Their homes are more likely tobeinareasexposedtoweatherextremesandflooding140 and will be less well protected141 and they are less likely to have insurance against these risks.142
Research into greenhouse gas emissions from personal travel in the UK demonstrates that it is these low income groups who contribute least to climate change through their travel – as illustrated in Figure 19. Those earning above £40,000generatebetweenthreeandfourtimesasmanygreenhouse gas emissions from their travel as those who earn£10,000orless.
4.7 Future generations and poorer nations
Key impacts for future generations and poorer nations
�Those�who�have�contributed�least�to�the�problem�of�climate�change�through�their�transport�usage�1 are�likely�to�suffer�the�worst�impacts.
�There�is�evidence�that�growth�in�the�use�of�biofuels�to�mitigate�climate�change�is�already�leading�2 to�hardship�and�suffering�for�some�of�the�poorest�people�in�the�world.��Future�generations�are�at�risk�not�just�from�climate�change�impacts�but�biodiversity�loss,�acidification�and�pollution�and�social�unrest�created�by�diminishing�natural�resources.
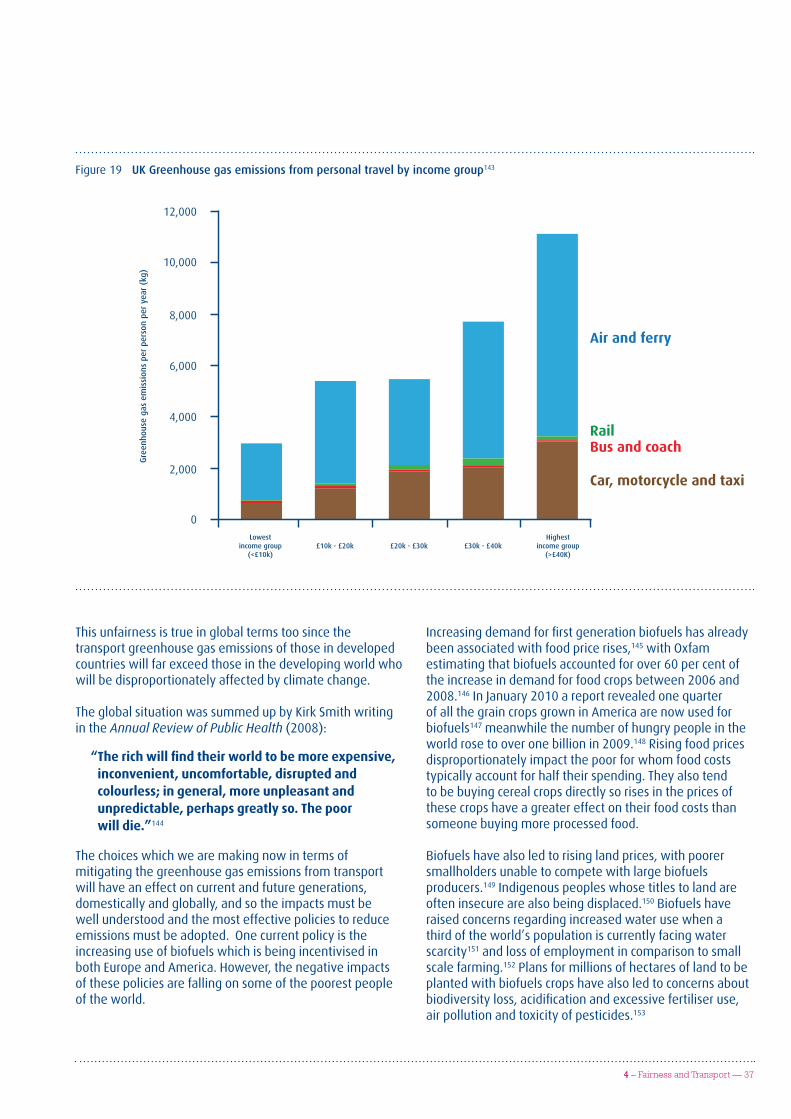
4 – Fairness and Transport — 37
This unfairness is true in global terms too since the transport greenhouse gas emissions of those in developed countrieswillfarexceedthoseinthedevelopingworldwhowill be disproportionately affected by climate change.
The global situation was summed up by Kirk Smith writing in the Annual Review of Public Health(2008):
“ The rich will find their world to be more expensive, inconvenient, uncomfortable, disrupted and colourless; in general, more unpleasant and unpredictable, perhaps greatly so. The poor will die.”144
The choices which we are making now in terms of mitigating the greenhouse gas emissions from transport will have an effect on current and future generations, domestically and globally, and so the impacts must be well understood and the most effective policies to reduce emissions must be adopted. One current policy is the increasing use of biofuels which is being incentivised in both Europe and America. However, the negative impacts of these policies are falling on some of the poorest people of the world.
Increasingdemandforfirstgenerationbiofuelshasalreadybeen associated with food price rises,145withOxfamestimatingthatbiofuelsaccountedforover60percentoftheincreaseindemandforfoodcropsbetween2006and2008.146 In January 2010 a report revealed one quarter of all the grain crops grown in America are now used for biofuels147 meanwhile the number of hungry people in the world rose to over one billion in 2009.148 Rising food prices disproportionately impact the poor for whom food costs typically account for half their spending. They also tend to be buying cereal crops directly so rises in the prices of these crops have a greater effect on their food costs than someone buying more processed food.
Biofuels have also led to rising land prices, with poorer smallholders unable to compete with large biofuels producers.149 Indigenous peoples whose titles to land are often insecure are also being displaced.150 Biofuels have raised concerns regarding increased water use when a third of the world’s population is currently facing water scarcity151 and loss of employment in comparison to small scale farming.152 Plans for millions of hectares of land to be planted with biofuels crops have also led to concerns about biodiversityloss,acidificationandexcessivefertiliseruse,airpollutionandtoxicityofpesticides.153
Figure 19 UK�Greenhouse�gas�emissions�from�personal�travel�by�income�group143
Air and ferry
Car, motorcycle and taxi
Bus and coachRail
0
2,000
4,000
6,000
8,000
10,000
12,000
Gre
enho
use
gas
emis
sion
s pe
r pe
rson
per
yea
r (k
g)
Lowestincome group
(<£10k)£30k - £40k
Highestincome group
(>£40K)£10k - £20k £20k - £30k
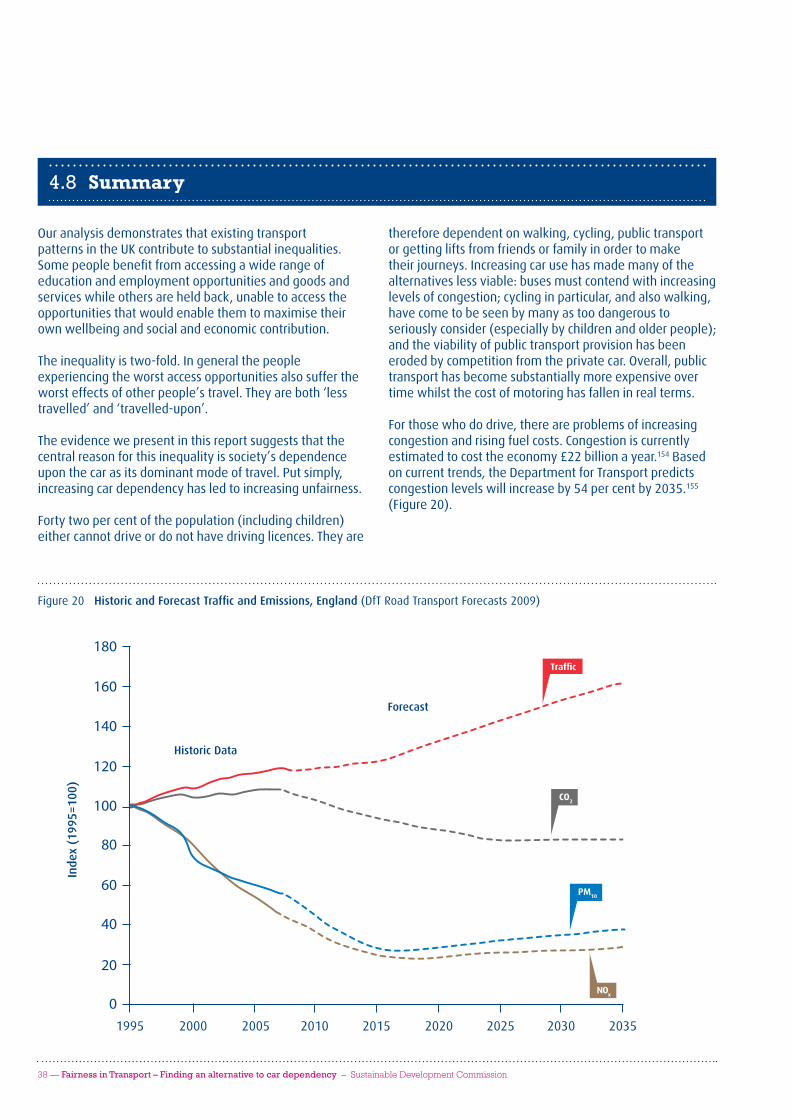
38 — Fairness in Transport – Finding an alternative to car dependency – Sustainable Development Commission
Ouranalysisdemonstratesthatexistingtransportpatterns in the UK contribute to substantial inequalities. Somepeoplebenefitfromaccessingawiderangeofeducation and employment opportunities and goods and services while others are held back, unable to access the opportunitiesthatwouldenablethemtomaximisetheirown wellbeing and social and economic contribution.
The inequality is two-fold. In general the people experiencingtheworstaccessopportunitiesalsosuffertheworst effects of other people’s travel. They are both ‘less travelled’ and ‘travelled-upon’.
The evidence we present in this report suggests that the central reason for this inequality is society’s dependence upon the car as its dominant mode of travel. Put simply, increasing car dependency has led to increasing unfairness.
Forty two per cent of the population (including children) either cannot drive or do not have driving licences. They are
therefore dependent on walking, cycling, public transport or getting lifts from friends or family in order to make theirjourneys.Increasingcarusehasmademanyofthealternativeslessviable:busesmustcontendwithincreasinglevels of congestion; cycling in particular, and also walking, have come to be seen by many as too dangerous to seriously consider (especially by children and older people); and the viability of public transport provision has been eroded by competition from the private car. Overall, public transporthasbecomesubstantiallymoreexpensiveovertime whilst the cost of motoring has fallen in real terms.
For those who do drive, there are problems of increasing congestion and rising fuel costs. Congestion is currently estimatedtocosttheeconomy£22billionayear.154 Based on current trends, the Department for Transport predicts congestion levels will increase by 54 per cent by 2035.155 (Figure 20).
4.8 Summary
Figure 20 Historic�and�Forecast�Traffic�and�Emissions,�England (DfT Road Transport Forecasts 2009)
Traffic
CO2
PM10
NOx
Historic Data
Forecast
0
60
100
140
20
40
80
120
180
160
Inde
x (1
995=
100)
1995 20052000 2010 2015 2020 2025 2030 2035

4 – Fairness and Transport — 39
The UK Energy Research Centre reported in 2009 that “a peak in conventional oil production before 2030 appears likelyandthereisasignificantriskofapeakbefore2020”.156 The UK Industry Taskforce on Peak Oil and Energy Security published a report in February 2010 in which they stated “the price of oil could rise to a new and sustained, level which is well above US $100 per barrel and that this is verylikelytobethecasewithinthenextfiveyears.”157 They go on to say that “the transport sector will be particularly hardhit,withmorevulnerablemembersofsocietythefirstto feel the impact.” This suggests that growing numbers ofpeoplewillfinditmoreandmoredifficulttoaccessessential services and educational and employment opportunities.
Transport systems must also respond to the imperative to reduce greenhouse gas emissions. Currently global greenhouse gas emissions are rapidly increasing. Leading researchers have calculated that unless we can reverse this and achieve a downward trend by 2020, then it will be impossible to limit average global warming to two degrees Celsius.158 Instead we may need to start planning for a four degrees Celsius rise and the substantial negative impacts this implies for the poorest people in the world. Over the
lastfiveyears,transporthasbeentheonlysectorintheUKto have a rising trend in greenhouse gas emissions.
The challenges set out above are entrenched and interlinked. Policies designed to make incremental adjustmentstoexistingtravelpatternsandimpactswillnotbesufficienttoaddressthem.Amorecomprehensiveandholistic approach is required.
Taketheexampleofultra-lowcarbonvehicles.Clearlythey can play a role in tackling climate change, but they do not solve other problems associated with car dependency such as congestion, health impacts and road danger. They mayevenexaggeratetheseproblems:thehigherinitialpurchase price in combination with much lower running costs may encourage owners to use these vehicles more in anattempttomaximisethebenefitsoftheirinvestment.Owners of electric vehicles may also feel less need to reduce their car use given the ‘clean’ image and absence of exhaustemissions.
A new approach based on long-term systems thinking is needed – in other words a truly sustainable approach.

40 — Fairness in Transport – Finding an alternative to car dependency – Sustainable Development Commission
As the previous chapter showed, if we are to create a fairer society we need to reduce our car dependency. However, wealsoneedtoavoidthepolarisedpro-car/anti-cardebateandacknowledgethatlowcarbon,efficientandsustainablecars will continue to have a role to play in the foreseeable future.Ultimatelypeoplewantchoice:theDepartmentforTransport’s own research shows that “nearly half of drivers say they would like to drive less than they do”.
Anidealtransportsystemenablespeopletofulfiltheirpotential and contribute fully to society. It minimises the negative social and environmental impacts of transport that wehaveidentified,andunderpinsathriving,lowcarbonand sustainable economy. It is also resilient to energy security issues such as rising oil prices, enables us to meet our commitments on climate change and designs out the problem of congestion.
5A Sustainable Approach to Transport
5.1 A new approach
Much transport policy has been based on detailed analysis ofexistingtrends,extrapolationoffutureneedsandplanningtomeettheseneeds:thesocalled‘predictandprovide’approach.The1998transportWhitePaperrecognised that this approach does not work for road transportandmovedto“managementofexistingroadsbefore building new ones”.159 After over a decade, some people are suggesting that this new management approach has worked. There is some evidence that car use in the UK is becoming saturated or perhaps even peaking before a decline.160 For the last ten years the average distance
travelled by car per person has remained static at about 5,500 miles per year. It is only due to population growth that overall distances driven have increased.
Given the environmental, social and economic challenges now facing transport policy makers, it is our belief that we need to move away from ‘predict and provide’ for all powered transport. We need instead to adopt a new approachwithaspecificvisionofcreatingasustainabletransport system. For this we will need new priorities.
5.2 A sustainable transport hierarchy
Therearemanyexamplesoftheuseofhierarchiestoguideprioritisationincomplexpolicyareas(seeAppendix 2 – Hierarchies in sustainability and transport). The best knownexampleisthewastehierarchy:‘reduce,reuse,recycle’.Thereareexamplestooinsomeexistingtransportpolicy literature. The Department for Transport’s Guidance on Transport Assessmentrecommendsthefirststepshouldalways be “reducing the need to travel, especially by car”.161 The Highway’s Agency recommends that capacity enhancements should be a “last resort”162 while Dalkmann and Brannigan recommend a three-level “avoid-shift-improve” model to classify (and prioritise) carbon reduction measures.163
Wefirstproposedanoverarchinghierarchicalapproachto transport policy in our consultation response to the Department for Transport’s Delivering a Sustainable Transport System consultation (2009).164 We used the hierarchy again to inform our approach in our Smarter Moves report (2010). This describes the four stages in more detail.165 The hierarchy is intended as a simple tool which can be used at all levels of transport policy making to structure thinking in generating and prioritising solutions.
The hierarchy (opposite) can be memorised using the mnemonic ‘DeMEChanise’ – a term implying a shift away from powered transport and towards travel avoidance and active travel.
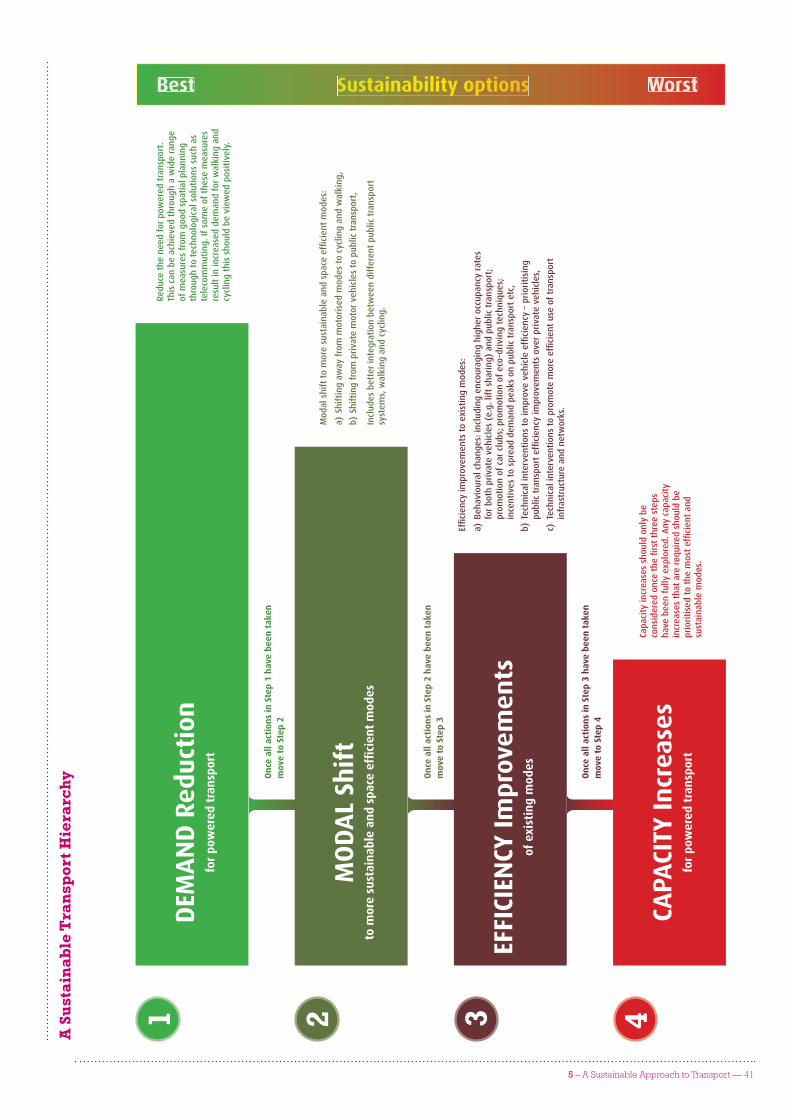
5 – A Sustainable Approach to Transport — 41
Mod
al s
hift
to
mor
e su
stai
nabl
e an
d sp
ace
effi c
ient
mod
es:
a) S
hift
ing
away
fro
m m
otor
ised
mod
es t
o cy
clin
g an
d w
alki
ng,
b) S
hift
ing
from
pri
vate
mot
or v
ehic
les
to p
ublic
tra
nspo
rt,
Incl
udes
bet
ter
inte
grat
ion
betw
een
diff
eren
t pu
blic
tra
nspo
rt
syst
ems,
wal
king
and
cyc
ling.
MO
DA
L Sh
ift
to m
ore
sust
ain
able
an
d sp
ace
effi
cien
t m
odes
EFFI
CIEN
CY Im
prov
emen
tsof
exi
stin
g m
odes
DEM
AN
D R
educ
tion
for
pow
ered
tra
nsp
ort
CAPA
CITY
Incr
ease
sfo
r po
wer
ed t
ran
spor
t
1 2 3 4
Best WorstSustainability options
Capa
city
incr
ease
s sh
ould
onl
y be
co
nsid
ered
onc
e th
e fi r
st t
hree
ste
ps
have
bee
n fu
lly e
xplo
red.
Any
cap
acit
y in
crea
ses
that
are
req
uire
d sh
ould
be
prio
riti
sed
to t
he m
ost
effi c
ient
and
su
stai
nabl
e m
odes
.
Effi c
ienc
y im
prov
emen
ts t
o ex
isti
ng m
odes
:
a) B
ehav
iour
al c
hang
es: i
nclu
ding
enc
oura
ging
hig
her
occu
panc
y ra
tes
for
both
pri
vate
veh
icle
s (e
.g. l
ift
shar
ing)
and
pub
lic t
rans
port
; pr
omot
ion
of c
ar c
lubs
; pro
mot
ion
of e
co-d
rivi
ng t
echn
ique
s;
ince
ntiv
es t
o sp
read
dem
and
peak
s on
pub
lic t
rans
port
etc
,
b) T
echn
ical
inte
rven
tion
s to
impr
ove
vehi
cle
effi c
ienc
y –
prio
riti
sing
pu
blic
tra
nspo
rt e
ffi c
ienc
y im
prov
emen
ts o
ver
priv
ate
vehi
cles
,
c) T
echn
ical
inte
rven
tion
s to
pro
mot
e m
ore
effi c
ient
use
of
tran
spor
t in
fras
truc
ture
and
net
wor
ks.
Redu
ce t
he n
eed
for
pow
ered
tra
nspo
rt.
This
can
be
achi
eved
thr
ough
a w
ide
rang
e of
mea
sure
s fr
om g
ood
spat
ial p
lann
ing
thro
ugh
to t
echn
olog
ical
sol
utio
ns s
uch
as
tele
com
mut
ing.
If s
ome
of t
hese
mea
sure
s re
sult
in in
crea
sed
dem
and
for
wal
king
and
cy
clin
g th
is s
houl
d be
vie
wed
pos
itiv
ely.
On
ce a
ll ac
tion
s in
Ste
p 1
hav
e be
en t
aken
mov
e to
Ste
p 2
On
ce a
ll ac
tion
s in
Ste
p 2
hav
e be
en t
aken
mov
e to
Ste
p 3
On
ce a
ll ac
tion
s in
Ste
p 3
hav
e be
en t
aken
mov
e to
Ste
p 4
A S
ust
ain
able
Tra
nsp
ort H
iera
rchy

42 — Fairness in Transport – Finding an alternative to car dependency – Sustainable Development Commission
Thefirststepistoexaminewhethertheneedtotravelcan be eliminated or reduced. If we can enable people to meet their needs without the need to travel then we create solutions for many of those people with limited transport options. The best way of achieving this is through good spatial planning; the built environment should be designed with a view to minimise the need for powered transport. Modern communications technologies (for exampleteleconferencing,workingfromhomeora‘work hub’, home shopping, etc) are also providing new ways of avoiding the need to travel as our report Smarter Moves has already shown. While we must always be consciousofavoidingcreatingsocialexclusionproblemsfor those with poor access to IT systems, there is strong potentialtoreduceoverallsocialexclusionthroughthesetechnologies. Demand reduction can also be achieved throughbehaviouralchangeandfiscalinterventions.Note that increased demand for ‘active travel’ (cycling and walking) as a result of these interventions should
beviewedpositivelyduetothehealthbenefits,reducedenvironmentalpollutionandbetterresourceefficiency.Walking and cycling are also two of the most affordable, accessible and inclusive forms of travel. Appendix 3 – Fairness benefits of active travel explainsthisinmoredetail.
Reducing the need for powered transport can reduce its associated negative environmental and social impacts which, as we have shown, fall disproportionately on the poorest and most vulnerable sections of society. We therefore welcome progress across the UK in recognising the need for transport demand reduction. The Department forTransport,forexample,hasstatedthatinvestigatingalternatives to travel will be one of its top three priorities.166 This team delivering this has an opportunity to look not only at technological solutions, but also with planning and policy and other departmental agendas to reduce transport demand rather than increase it.
5.3 How a sustainable transport hierarchy can improve fairness
5.3.1 Demand reduction for powered transport
5.3.2 Modal shift to more sustainable and space efficient modes
Onceallactionshavebeentakentoeliminateorreducetheneedtotravel,thenextstepinthehierarchyistoensuretheremainingjourneysareassustainableaspossible.Therearetwokeyelementstothisstep:
Shifting away from powered modes to cycling and 1 walking. Currently78percentoftwotothreemiletripsaremadebycar,yetshortjourneysarethemostinefficientuseofvehiclesasengineefficiencyisworstwhen cold. Shifting to walking and cycling for these tripswouldcreateamultitudeofbenefits:congestionreduction; health and air quality improvements; noise reduction; less greenhouse gas emissions and greater socialcohesion.Thesebenefitswouldimprovequalityof life for everyone, but particularly those sections of society who currently suffer from the worst of these effects. Environments which encourage walking and cycling are by their nature more inclusive as discussed in Appendix3–Fairnessbenefitsofactivetravel.Therearea range of measures available to enable this including reducing speed limits, restricting motorised transport volumes and creating high quality, safe and attractive routes and environments for cyclists and pedestrians.
Although electric bicycles are of course powered, they should be included in this step of the hierarchy in view of their potential to increase levels of cycling. Further details on this and other policy suggestions can be foundinAppendix4–Potentialpoliciestoimprovefairness.
Shifting from private motor vehicles to public 2 transport. Providing high quality, convenient, accessible and affordable public transport systems benefitsallsectionsofsociety,butparticularlythosewho do not have the option of a private car. Public transportisingeneralmorespaceefficientthanprivatevehicle use, helping to reduce congestion. Good public transportthatiswellusedisalsomoreenergyefficient,reducing energy use and pollution. Increasing passenger numbersonexistingpublictransportimprovesefficiency(in per passenger kilometre terms), improves viability

5 – A Sustainable Approach to Transport — 43
and can lead to improved quality of service. Regular public transport users also tend to have higher levels of walking and cycling. This category should therefore include measures to improve inter-modality between different forms of public transport and active travel.
Changing behaviours and encouraging people to make differenttransportchoicesiscomplex.Itwillrequireacombination of co-ordinated interventions. In particular considerationshouldbegivento‘changingcontexts’in
which decisions are made (i.e. what options are available and easy to access) rather than focusing on individuals’ personal responsibilities. Interventions also need to reflectinsightsfrombehaviouralscienceforagreaterunderstanding of people’s motivations and barriers. This is discussed further in the our submission to the House of Lords’ call for evidence on behaviour change167 and in our forthcoming report on the role of Government and others in enabling sustainable lives.
Once we have done everything possible to encourage themostsustainablemodechoice,thenextstepinthehierarchyisensuringthemostefficientuseofanygivenmode. Options such as lift-sharing schemes and car clubs notonlymakemoreefficientuseofexistingresources,but can offer low cost access to car travel for those who cannotaffordtorunacar.Encouragingmoreefficientbehaviours will reduce the number of private vehicles on our roads, reducing road danger, pollution and congestion. Improvingtheefficiencyofvehiclesandtransportnetworksthemselves further reduces pollution and emissions by reducing energy consumption. There are three key elementstothisstep:
Behaviouralchanges:includingencouraginghigher1 occupancyratesforbothprivatevehicles(forexamplelift sharing) and public transport; promotion of car clubs; promotion of eco-driving techniques; incentives to spread demand peaks on public transport etc.
Technicalinterventionstoimprovevehicleefficiency2�–prioritisingpublictransportefficiencyimprovementsover private vehicles
Technicalinterventionstopromotemoreefficientuse3�of transport infrastructure and networks.
Oneimportantconsiderationisthatimprovingefficiencycanleadtoso-called“reboundeffects”.Forexample,improving vehicle fuel consumption reduces the cost per mile and can therefore lead to increased vehicle use. Similarly,makingmoreefficientuseofroadspacecouldreducecongestionandthereforeinducefurthertraffic.Thisisoneofthereasonswhywehaveplacedefficiencyafter steps one and two of the hierarchy.
Rebound effects can be more severe than a simple reductionintheexpectedbenefitsofanefficiencyimprovement.Insomecases,efficiencyimprovementscan lead to increased resource consumption by rendering a technology more attractive and popular.168
5.3.3 Efficiency improvements to existing modes
Thisisthefinalstepinthehierarchy,andtheoptionoflastresort.Untiltheimpactsofthefirstthreestepsofthehierarchyhavebeenfullyexploredandappraiseditisnotpossible to determine what residual demand for increased capacity remains.
Ifsuchdemanddoesexist,anycapacityincreasesthatarerequiredshouldbeprioritisedtothemostefficient,sustainable and fair modes and must be compatible with wider sustainability principles.
Even then the provision of increased capacity must be carefully considered owing to the problem that new transport infrastructure tends to result in increased transport demand.
Recommendation: The Government and the Devolved Administrations adopt this over-arching transport hierarchy approach and promote its use at all levels of transport decision making as a tool to ensure that the most sustainable and fair transport solutions are prioritised.
5.3.4 Capacity increases for powered transport
44 — Fairness in Transport – Finding an alternative to car dependency – Sustainable Development Commission
A hierarchical approach to transport policy making will help to ensure that the most sustainable potential solutions are prioritised, but another critical area is the more detailed appraisal of transport scheme options.
The Coalition Government’s Programme for Government included the statement “We will reform the way decisions aremadeonwhichtransportprojectstoprioritise,sothatthebenefitsoflowcarbonproposals…arefullyrecognised”. We welcome this commitment. Given the challenge of creating a transport system which is not only low carbon, but also contributes to fairer outcomes in society and is robust to future energy security issues, it is essential to ensure that the tools available guide decision makers to the most sustainable outcomes. Now, perhaps more than ever, we need to ensure that we get the best possible value from public money spent on transport. This can be done through taking a system approach, one that applies a sustainable development analysis and considerationofalternativeinordertobetterreflectthevalue of social and environmental aspects in investment appraisalsandthiswillhelp“leveltheplayingfield”forwhen government assesses where it wishes to prioritise investment.
A key area to review is the appraisal of transport schemes. The Department for Transport has one of the most complextransportappraisalsystemsintheworld.TheNewApproachtoAppraisal(NATA)wascreatedin1998asamulti-criteriaanalysistoolfortheanalysisofmajorpotential transport schemes. It was developed for use across all modes and was intended to ensure that a wide rangeofobjectiveswereconsideredindecisionmaking.
Itgroupedobjectivesintofiveareas:environment;economy; safety; accessibility; and integration.
While this approach was laudable, many feel that since NATA was introduced the reality of transport appraisal has fallen well short of its intentions. In 2007 the Department for Transport launched a consultation on refreshing the NATA process. The Centre for Transport and Society observed in their response that the areas of policy most important in moving towards a sustainable transport system are “unfortunately the same as the list of aspects which are poorly treated in NATA, or not at all”.169
NATAincludescost-benefitanalysiswhichgivesausefulindication of what policies result in the best value for money.Thebenefittocostratio(BCR)indicateswhattheratioisbetweenthetotalbenefitsaccruingfromascheme(only including those which can be monetised) and the total costs of implementing that scheme. Thus if a scheme hasaBCRof10:1,thenitisestimatedthatforevery£1spentimplementingthescheme,£10ofbenefitswouldbeexpected.
MoredetailedcritiquesoftheexistingNATAprocesseshave been made by Keith Buchan in two reports for Green Alliance.170, 171 The second of these reports highlighted how changes made by the Department for Transport as a result oftheconsultationsignificantlychangedpreviousbenefitcost ratio calculations for different modal interventions. However it recommended further reforms which would resultinadditionalsignificantchangestotheresultsasshown in Figure 21.
5.4 Transport appraisal
“ The imperative created by the current fiscal circumstances and carbon budgets might offer the
best opportunity likely to become available to take and explain decisions which anyway need to
be taken to put transport programmes and spending on a more sustainable path.”
Commission for Integrated Transport, 2010

5 – A Sustainable Approach to Transport — 45
The report gave several key recommendations for changes totheprocess:
“Costing of all greenhouse gas emissions above the • transport sector reduction target, not a comparison with emissions under a completely unrealistic ‘Do Minimum’ scenario;
Clearimplementationoftheobjectivesledprocess• including the preparation of genuine alternatives and packages – if this has not been done schemes should be sent back to promoters
Pending further research, all appraisals should include • atestforthesensitivitytothesizeoftimesavings.ThiswouldinvolveproducingBCRs(benefitcostratios)withsmall time savings omitted, publishing them in the AST (appraisal summary table) and taking them into account when deciding which schemes to approve; and
AllappraisalstopublishabenefitprofileintheAST,• withBCRsat20and40yearsaswellas60,againensuring that they are taken into account in any approval decision.”
When these suggested further reforms are applied, the busandrailfreightschemes’valuesimprovesignificantly.However further changes need to be made in order to ensure that the NATA process, including the approach to BCR, supports the creation of a fairer transport system for the UK.
TheDepartmentforTransporthasidentifiedeightareasfor assessing social and distributional impacts in future transport appraisals. These are noise, air quality, safety, personal security, severance, accessibility and personal affordability. The methodology for their inclusion has now been published in draft guidance. This will be a very significantstepforwardinensuringthatfuturetransportdecisions take account of these issues. However since the appraisal process can involve trading off and balancing competingobjectivesitremainstobeseenwhetherthiswill result in fairer outcomes. Further information on this workisincludedinAppendix5–DepartmentforTransportworkonsocialanddistributionalimpactswhileAppendix6–Limitationsofcurrentapproachtocost-benefitanalysishighlights some of our concerns.
There are still social impacts which are known but for which itiscurrentlyjudgedthatthereisinsufficientevidenceor
* Basedonmovingtoa60yearappraisal.TheMerseytramcasestudyprovidesseveralexamplesofhowsmallchangesinthetreatmentoftaxrevenueshaveastrongimpactonthebenefits(seethereport,Investing in Transport: Making the Change172).
** Based on limited data.
*** Thecarbonbenefitoftherailfreightschemewasalreadyfactoredintotheoriginalanalysishencethereisnochange.
Benefit cost ratio appraisal model
OriginalRevised
(after consultation)With further
reforms
Tram Merseytram 1.97 2.07 2.85*
CycleGrand�Union�Canal� cycle�path
38.4 75 75
Road A14�Ellington�to�Fen�Ditton 10.83 6.69 1.3�-�3.25**
BusCambridge�to�St.�Ives� guided�busway
4.8 6.4 7.9**
Rail (Freight)Expansion�of�rail�freight�(Felixstowe�to�Nuneaton)
5.25 10.4 10.4***
Figure 21 Summary�of�comparative�results�under�different�NATA�assumptions173
46 — Fairness in Transport – Finding an alternative to car dependency – Sustainable Development Commission
no robust process for them to be included in appraisal. It is unacceptable for this to result in them being ignored or giveninsufficientaccount.
There are many transport impacts, particularly social impacts,whichareextremelydifficulttoquantifybutarenevertheless important. The problem of valuing social impacts has recently been acknowledged in Defra’s work with the Government Economic Service, reviewing the economics of sustainable development. The review highlightedthat:
“ The economic appraisal of social impacts was not nearly as well developed as that for economic and environmental impacts.”174
As a result, a cross-Government group on social impacts (the Social Impacts Task Force) has been established.
Recommendation: The Government and the Devolved Administrations should improve the handling of social and distributional impacts in transport decision making and appraisal. Changes made should be monitored to assess whether they are leading to fairer outcomes.
5.5 Conclusion
Decision making processes are central to the aim of putting sustainable development at the heart of policy making. Implementing these recommendations would substantially improve the sustainability and, therefore, the fairness of future transport policy decisions. For this reason we make one further recommendation.
Recommendation: In order to tackle unfairness in society, the Government and the Devolved Administrations should make reducing transport inequalities a specific goal of transport policy.

6 – Conclusion — 47
Over the last one hundred years there has been a revolution in personal travel. This has primarily been associated with the growth in car ownership. The widespread availability andaffordabilityofcartravelhasbroughtmanybenefitsfor many people. Cars have given the freedom to travel to almost any destination, at whatever time the user wishes, carrying passengers and luggage if necessary and with minimal need to plan ahead. They have made it easier to keep in touch with friends and family and to reach a wider rangeofjobopportunities.Astheyhavebecomemoreaffordable, they have dramatically increased the travel possibilities available to ordinary families. The car has grown to dominate transport. It has shaped our towns and cities, changed our landscapes and for many it has become an essential they feel they could not do without.
However, for many people the growth of car-dependent lifestyles and the changes they have brought about have created serious and entrenched problems. Local shops and services have moved further away. Children’s freedoms havebeenrestrictedduetoroaddanger.Manyjobsaredifficulttoaccesswithoutacar.Wherealternativesarelacking, not having access to car transport can lead to serioussocialexclusion.
A range of other serious problems result from car dependency. The most common cause of death for children is being hit by a vehicle. The primary cause of air and noise pollution is road transport. For those that do drive there are the problems of increasing congestion, rising fuel prices and the health impacts of obesogenic lifestyles.
Asthisreporthasshown,itisthepeopleexperiencingtheworst access opportunities who also suffer the worst effects of other people’s travel. They are both ‘less travelled’ and ‘travelled-upon’.
92 per cent of our domestic transport greenhouse gas emissions come from road transport. Yet from both a national and an international perspective, it is those who have contributed least to climate change through their travelwhowillexperienceitsworsteffects.
We cannot hope to solve these problems by continuing to makeincrementalchangestoourexistingtransportsystem.A fresh approach is needed based on long-term systems thinking – in other words a truly sustainable approach.
Applying the principles of sustainable development can help generate solutions to all these problems. A sustainable transport hierarchy can guide thinking to ensure that the fairest and most sustainable solutions are prioritised. Issues ofsocialandenvironmentaljusticecanalsobetakenintoaccount better in the transport appraisal process.
The recommendations in this report are designed to steer us towards fairer decision making in transport policy, helpingthepoorestandmostvulnerableinsocietyfirstandforemost, but in the process creating a transport system that works better for us all.
6Conclusion

48 — Fairness in Transport – Finding an alternative to car dependency – Sustainable Development Commission
Thewordsequalityandequityarebothusedinrelationtofairnessandjusticebuttheyarenotthesame.TheOxfordEnglishDictionarydistinguishesbetweenthem:
Appendix 1Defining fairness
Fairness
Equitableness, fair dealing, honesty, impartiality, 1 uprightness.
Justice
Thequalityofbeing(morally)justorrighteous;the1 principleofjustdealing;theexhibitionofthisqualityorprincipleinaction;justconduct;integrity,rectitude(One of the four cardinal virtues),
Conformity (of an action or thing) to moral right, 2 or to reason, truth, or fact; rightfulness; fairness; correctness; propriety.
Equity
The quality of being equal or fair; fairness, impartiality; 1 even-handed dealing,
What is fair and right; something that is fair and right.2
Equality
The condition of being equal in quantity, amount, 1 value, intensity, etc,
2 a) The condition of having equal dignity, rank, or privileges with others; the fact of being on an equal footing,
b) The condition of being equal in power, ability, achievement,orexcellence.
So, while equity is essentially the same as fairness, equality is not. Equality is not necessarily fair, and inequality is not necessarilyunfair.Forexample,ataxappliedequallytoall members of society regardless of their income is equal, but many would argue is not fair. Furthermore, while
equityrequiressomethingofamoraljudgement,equalitysuggestsanapproachthatcanbeobjectivelyquantified.Thismayexplainwhyequality,ratherthanequity,receivesmore policy attention.
Equality of opportunity and equality of outcome
Discussions on fairness often talk about equality of opportunity and equality of outcome. Providing people with equalopportunitieshasbeenaspecificpolicyaimandhasbeen enshrined in law for many groups and sectors, but it is accepted that this is unlikely to result in equal outcomes for all and indeed it would be unrealistic to aim to achieve this.
In recent policy documents, equality of opportunity is often expressedasequal life chances,forexampleintheMayorof London’s Equal life chances for all policy statement (July 2009).175 This may stem back to the Fabian Society’s Life Chances Commissionreport(2006).TheFabianSocietystates that “The ‘equal life chances’ agenda recognises that today’s unequal outcomes shape tomorrow’s unequal
opportunities, and has a particularly strong concern with the intergenerational transmission of inequalities, to prevent life chances being so strongly determined by the circumstances into which we are born as they are at present.”
Thebenefitoftakingsustainabledevelopmentastheframework in which to understand fairness is that it concernsthequalityoflifeofcitizensandtheirrelationshipto their compatriots now, whilst also acknowledging the impact this has on other countries and future generations. The Department for Education’s Sustainable Development Action Planencapsulatesthisbreadthwellindefiningequityasasituationinwhich:

Appendices — 49
“ Every person’s basic needs are met; burdens (such asenvironmentalimpacts,crime,financial)andrewards (such as community resources and leisure opportunities) are fairly spread; and everyone has access to employment opportunities. Equity extendsnotonlytoallmembersofoursociety,buttoallcitizensoftheworldnowandinfuturegenerations.”176
Theinclusionofenvironmentalbenefitsandcostsiscriticaltoaholisticapproachtofairness:environmentalinequitycompounds the consequences of social differentials.
AccordingtoGordonWalkerofLancasterUniversity,environmentalinequalitycanbemeasuredanddescribedintermsof:
Environmental inequality
Distribution of environmental bads and vulnerability to • theirimpacts(pollution,floodingetc),
Distribution of and ability to access environmental • goods (green space, healthy food etc),
Creation of environmental bads (e.g. resource • consumption, pollution, waste generation),
Accessto,influenceonandparticipationindecision-• making processes.
Inotherwords,boththepositivebenefitssocietyobtainsfromtheenvironmentandtheeffectofournegativeimpactsonthe environment can be unequally distributed across society.
Theconceptofjusticecanbeviewedasinvolvingjudgmentandprinciplesandisthusnoteasilymeasured.However,itisimportanttounderstandthesetworelatedterms:
Social and environmental justice
Social justice
Atermfirstusedbeforethe1800sandnowoneofthefourpillarsoftheGreenParty.SocialjusticeisdefinedbytheOxfordEnglishDictionaryas“justiceatthelevelofasocietyor state as regards the possession of wealth, commodities, opportunities, and privileges”. The term has also come to meanthemovementwhichseekstocreateasociallyjustworld.
Environmental justice
Environmentaljusticeattemptstomakethelinkbetweensocialandenvironmentalconcerns.Ithasbeendefinedas“equal access to a clean environment and equal protection from possible environmental harm irrespective of race, income or class or any other differentiating feature of socioeconomic status”.177 According to the SDC’s Vision for Sustainable Regeneration report178 the term was coined in America, referring primarily to the disproportionate impact of pollution on poorer communities, but is now being widened to include less tangible aspects of quality of life includingcommunityconfidence,cohesionandsafety,civicpride, empowerment and environmental education.

50 — Fairness in Transport – Finding an alternative to car dependency – Sustainable Development Commission
Thereareawiderangeofdefinitionswhichrelatetofairness.Theexistingsustainabledevelopmentprinciplesspeakofcreatingajustsocietyandtheexpressionssocialandenvironmentaljusticeareestablishedtermsbothinprevious work by the SDC and more widely. Organisations such as WWF and Care International have already adopted thelanguageofsocialandenvironmentaljustice179 and the
termjusticeisperhapsmorecommonlyunderstoodandhasgreater resonance with the public than equity and equality, while still embodying both.
Forthesereasons,thedefinitionoffairnessusedinthisreportis:Social and environmental justice for all, now and in the future.
Conclusion

Appendices — 51
In sustainability the use of decision-making hierarchies iswellestablished.Themostwellknownexampleisthe‘wastehierarchy’:
Reduce1
Reuse2
Recycle3
The importance of this simple and memorable tool in helping people to identify the most sustainable approach should not be under-estimated. Often discussions of solutionstotheproblemsofwastejumpstraighttovariousrecycling options. Referring back to the hierarchy ensures that the options of reducing the production of waste productsinthefirstplace,andfindingwaysofreusingthemshould be given priority over recycling options. Only by doing this will the most sustainable solutions be reached.
Perhaps recognising this, in April 2009, the Institution of Mechanical Engineers published a similar hierarchy for energy:
“�The�Energy�Hierarchy�links�closely�to�the�principles�of�sustainable�development�and�offers�an�integrated,�easy�to�use�approach�to�energy�demand�and�supply�decision�making.�A�common-sense�sustainable�energy�policy�should�make�its�first�priority�the�reduction�of�energy�use,�before�seeking�to�meet�the�remaining�demand�by�the�cleanest�means�possible:
Priority 1: Energy conservation – changing wasteful behaviour to reduce demand
Priority 2: Energy efficiency – using technology to reduce energy losses and eliminate energy waste
Priority 3: Exploitation of renewable, sustainable resources
Priority 4: Exploitation of non-sustainable resources using carbon dioxide emissions reduction technologies
Priority 5: Exploitation of conventional resources as we do now.”180
Thereareseveralexamplesofhierarchiesbeingusedintransport. The Department for Transport’s own Guidance on Transport Assessment publishedjointlywiththeDepartment of Communities and Local Government, recommends an iterative approach, stating “a transport assessmentshouldaddressthefollowingissues:
Reducing the need to travel, especially by car• – ensure, at the outset, that thought is given to reducing theneedtotravel;considerthetypesofuses(ormixof uses) and the scale of development in order to promote multipurpose or linked trips,
Sustainable accessibility• – promote accessibility by all modes of travel, in particular public transport, cycling and walking; assess the likely travel behaviour or travel pattern to and from the proposed site; and developappropriatemeasurestoinfluencetravelbehaviour,
Dealing with residual trips• – provide accurate quantitative and qualitative analyses of the predicted impacts of residual trips from the proposed development and ensure that suitable measures are proposed to manage these impacts,
Mitigation measures• – ensure as much as possible that the proposed mitigation measures avoid unnecessary physical improvements to highways and promote innovative and sustainable transport solutions.”181
The Highways Agency states that it will “seek to apply the followingsolutionsiteratively:
Impact avoidance through choice of sustainable • location,
Impact minimisation through realistic Travel Plans,•
Access management,•
Capacity enhancements as last resort and only where • compatible with suitable principles.”182
Appendix 2Hierarchies in sustainability and transport

52 — Fairness in Transport – Finding an alternative to car dependency – Sustainable Development Commission
The Department for Transport’s Manual for Streetsincludesauserhierarchy:
Figure 22 Manual�for�Streets�user�hierarchy
CONSIDER FIRST
CONSIDER LAST
Pedestrians
Cyclists
Public�transport�users
Specialist�service�vehicles (e.g. emergency vehicles, waste, etc.)
Other�motor�traffic
Meanwhile other government guidance has for many yearsrecommendedthatthefirstconsiderationshouldbereducingtheneedtotravel.Forexample,Planning Policy Guidance 13(PPG13)whichwasfirstpublishedin1994states “reduce the need to travel, reduce the length of journeysandmakeitsaferandeasierforpeopletoaccessjobs,shopping,leisurefacilitiesandservicesbypublictransport, walking and cycling.”183
This message is still being repeated in the latest documents. Defra published Using the Planning System to reduce Transport Emissions184 in January 2010, which reiterated the importance of the Department for Transport and Department for Communities and Local Government transport assessment guidance.
Figure 23 Flow�diagram�illustrating�an�iterative�approach�to�transport�assessment
PREPARATION OF TRANSPORT ASSESSMENT
REDUCING THE NEED TO TRAVEL
MAXIMISING SUSTAINABLE ACCESSIBILITY
DEALING WITH RESIDUAL TRIPS
FINAL TRANSPORT ASSESSMENT
MITIGATION MEASURES
Appendices — 53
Howevernoneoftheseexamplesprovideahighlevelprioritisation tool for transport policy development in the way that the ‘energy hierarchy’ does for energy policy. It is for this reason that we recommend the adoption of an over-arching sustainable transport hierarchy.

54 — Fairness in Transport – Finding an alternative to car dependency – Sustainable Development Commission
Environmentsthataresafeandattractiveforjourneysmade by foot or by bike are by their nature inclusive for all sections of society. They allow children to start making journeysindependentlyatanearlierage.Theyaresaferand better for those with disabilities, even those who are themselves unable to walk or cycle. They allow older people to continue to get about independently even if they have had to stop driving. Interestingly, the four countries which ranked highest in the UNICEF child wellbeing study185 also have the highest levels of cycling in Europe (Netherlands, Sweden, Denmark and Finland).
IntheNetherlandstheover-65sstillmake24percentoftheirtripsbybicycle.IntheUK,theequivalentfigureisjustone per cent.186 Staying mobile and physically active in this way helps the Dutch to maintain good health, but even for those who have to use wheelchairs and electric mobility scooters, the network of safe, well maintained, continuous cycle routes is a valuable resource.
Cycling is actually more accessible to those with disabilities than is perhaps commonly realised. In the Netherlands it is not uncommon to see older people cycling who are unable to walk without the aid of a stick – in fact hospitals sometimes provide special brackets for it to be carried safely on a bike. Tricycles can be used by those with balance problems, debilitating diseases such as multiple sclerosis and polio, or stroke victims and those with spinal cordinjuries.187 Specially adapted cycles or hand-cycles can be used by those with missing or nonfunctional limbs. Eventheblindandpartiallysightedcanenjoycyclingonatandem with a sighted partner.
The growing availability of electric bikes has further widened the number of potential cyclists to include those whodidnotpreviouslyhavethephysicalstrengthorfitness
tocycleforcertainjourneys.Therearetwotypesavailable:so called ‘pedelecs’, which require the rider to pedal before providing electric assistance and ‘twist and go’ versions in which pedalling is optional. ‘Twist and go’ variants are particularly useful for those with limited physical strength due to conditions such as chronic fatigue syndrome, diabetes, lung and heart conditions as they allow the user tochoosewhenandtowhatextenttheyareabletopedal.Technical developments from mountain biking are also helping to ensure that these bikes can cope with varied terrains. In fact there is even an electrically powered off-road four wheel wheelchair available now designed for para- and tetraplegics.188
While not everyone with a disability will be able to cycle foreverydayjourneys,andsomeofthemorespecialistdesignsavailableareexpensive(thoughclearlycheaperthan cars in terms of initial outlay and running costs), many peoplecouldbenefitbothphysicallyandmentallyfromtheopportunities that these bicycles and vehicles offer.
Walking and cycling are generally the lowest cost forms of transport and are therefore the most accessible to all levels of society. In a recent survey of residents in Portsmouth, the mostcommonreasongivenforcycling(76percent)wasitslow cost.189 Creating environments which encourage high levels of walking and cycling, helps to remove any negative social stigma associated with these healthy and inherently safe modes of travel. They are made ‘normal’, socially acceptable, and perhaps even fashionable.
High levels of walking and cycling also helps to encourage greater social cohesion. You are much more likely to stop and talk to neighbours if you are passing on foot or by bike. This breaks down barriers of mistrust and helps create societies in which all colours, races and creeds are valued.
Appendix 3Fairness benefits of active travel

Appendices — 55
Inthefollowingtables,selectedpolicyoptionsareexaminedfortheirpotentialtoimprovefairnessundertheheadingsofthe four steps of the sustainable transport hierarchy.
Appendix 4Potential policies to improve fairness
Policy Intervention Fairness implications
Car-free developments
Car-free developments – as long as they include access to high quality accessible public transport systems – can greatly improve inclusivity and fairness. Children can travel in the area on their own in comparative safety, the disabled and older people are better able to maintain theirindependenceandtheblindandpartially-sightedwouldfindminimalrisksintraffic-freestreets. Providing car-free developments also improves choice – allowing those who wish to live in an area free of cars the opportunity to do so.
Spatial planning Spatial planning which reduces the need for powered travel, and enables increased numbers ofjourneystobemadebyfootorbybikecanpromotefairness.Walkingandcyclingarethelowest cost and most accessible forms of transport. Creating environments which reduce the need for private vehicles reduce inequalities for those who do not drive as long as services are available locally. Good spatial planning should aim to manage both land use and transport demandtooptimisespatialefficiencyandminimisetheexternalcostsoftransport.190
Accessibility planning
An Accessibility Plan sets out how to improve access to employment, education, health care and other local services particularly for disadvantaged groups and areas. By ensuring that services are available locally it can contribute to reducing demand for powered transport. Accessibilityplanninghasbeeninplacesince2003andhasthepotentialtosignificantlyimprove fairness. However, there is a need to review progress and to establish best practice. WeendorsethePassengerTransportExecutiveGroup’s(PTEG)recommendationthattheDepartment for Transport “provide renewed leadership and momentum for the transport and social inclusion agenda”.191
Universal broadband provision
While not everyone can afford a computer and broadband access, the costs are substantially lower than those for car ownership. Home broadband can allow people to work from home someorallofthetimeiftheirjoballows.Thiscandramaticallyreducecommutingcostsandimpacts.Teleworkingisnotapanaceahowever:manymanualworkersorthosewhomustotherwiseattendspecificworkplaceswillnothavetheoptiontotelework,addingtoexistinginequalities.Flexibleworkingpoliciescanhelpsingleparentswithchildcareresponsibilitiesfindemployment.Homeshoppingdeliveriescanreduceproblemsofaccesstogoodquality,healthyfood.Ruralcommunitiescouldbenefitfrominnovationssuchas‘workhubs’reducingcommuterjourneys.TheCoalitionGovernment’sbroadbandstrategyshouldensurethatallsectionsofsocietyhaveaccesstothesepotentialbenefits,whilstbeingmindfuloftheneednot to disadvantage those who must be physically present in the workplace.
Video-conferencing Public provision of technologies such as telepresence could potentially enable public sector services such as health care to be delivered remotely with reduced need to travel, helping thosewhohavelimitedtransportoptions.Forexample,NHSLothianislookingatthepotentialto put ‘patient pods’ in local shopping centres. These would be linked using high quality video-conferencing to specialist clinicians in hospitals potentially saving patients a 50 mile round trip.192
Demand reduction for powered travel

56 — Fairness in Transport – Finding an alternative to car dependency – Sustainable Development Commission
Policy Intervention Fairness implications
Smarter Choices Smarter Choices describes a range of policy options designed to reduce reliance on private vehicle use.193 This will reduce the negative impacts of car use and support higher quality public transport, walking and cycling provision. As this report has shown this is likely to contribute to a fairer society.The three UK sustainable travel towns, Peterborough, Worcester and Darlington demonstrated thebenefitsofSmarter Choicesinterventions:Areductionincartripsofninepercent(therewasanestimatedfallofabout1percentinothermedium-sizedtownsoverthesameperiod); bus trips per person increased by 10-22 per cent (there was an estimated national fallof0.5percentinmediumsizedtowns);cycletripsperpersonincreasedby26-30percent(against other comparable towns seeing estimated cycling trips fall by 9 per cent); walking trips per person increased by 10-13 per cent (there was an estimated national decline in trips in similar towns of nine per cent).194 Sustrans’ TravelSmart programmes have also been showntodeliversignificantshiftsawayfromcardependency:reductionincardrivertripsof11percent,14percentincreaseinwalking,38percentincreaseincycling,20percentincrease in public transport use.195
Cycle training Thereisconcernthatthereisinsufficientknowledgeregardingsafecyclingtechniques,especiallyintoday’strafficconditions.Itisessentialthatchildreninparticularhaveaccesstotrainingtoensurethattheylearnhowtocyclesafelyinmoderntrafficconditions.Habitsformed in childhood will stay with them for the rest of their lives and can be passed on in time to their own children. Cycle training has been shown to be a highly cost-effective intervention,withaveragebenefitcostratiosof7:1.
Walking and cycling routes
Providinghighqualityandattractiverouteswhichfeelsafecansignificantlyincreaselevelsofwalking and cycling. Sustrans state that “two-thirds of users in areas of deprivation say that the National Cycle Network (NCN) helped them to increase their levels of regular physical activity”.196
Cycle storage Cyclestorageisoftenaparticularproblemforthoselivinginflatsandsmallterracedhouses.Many low income groups come into this category. A planning requirement that every dwelling no matter how small should include convenient secure storage space for at least one bicycle would solve this. This was one of the key planning criteria included in the advice for eco-town developments.197
Support for electric bikes
Electrically assisted bikes have strong potential to increase levels of cycling. Electric bikes canhelpolderpeopleorthosewhoarelessfitorhavehealthproblemstoseecyclingasaviable alternative to car use. In fact the main reason given for purchasing an electric bike inonesurveywas‘healthproblems/gettingold’.198Althoughtheyareexpensivetobuyincomparison to conventional bikes, electric bikes are a more affordable option than car use. TheGovernmentcouldexaminethecaseforprovidingincentivestoencouragesalesofelectric bikes.
Filtered permeability
A successful way of encouraging greater levels of walking, cycling and public transport use is to make it quicker and more convenient than using a car. This can be done in a variety of ways:ensuringthatwalkingandcyclingroutesareshorterandmoredirect(usinglinkingfootpathsand/or‘cyclegaps’)whileroutesaccessiblebycararemorecircuitous;using‘busgates’ to ensure certain roads are not accessible to private vehicles while remaining available anduncongestedforpublictransport;providingpedestrian-onlyzonesetc.Increasingwalkingand cycling will promote fairness since these are the lowest cost and most accessible forms of transport. Providing more reliable public transport encourages greater use.
Modal shift to more sustainable and space efficient modes

Appendices — 57
Policy Intervention Fairness implications
Area-wide 20mph speed limits
Transport for London’s Braking Pointreportfound20mphzoneshaveachievedoverallcasualtyreductionsof42percentandareductioninchildren’sdeathsandseriousinjuriesof50 per cent.199 The same report stated “they have directly reduced the disparities between the least and most deprived areas in terms of road casualties by 15 per cent”. Creating a built-up environment in which parents feel it is safe to allow children to travel independently is crucial to children’s development and wellbeing. It enables them to learn to take responsibility and improves their ability to access play areas and green space.
Reducing speed limits
Reducing speed limits on other roads, particularly some rural roads has the potential to significantlyreduceboththeactualdangerandtheperceivedthreatfromtraffic.Thiscanhelpreduce the disproportionate numbers of casualties on rural roads and encourage increased levels of walking and cycling.
Mixed priority routes and ‘shared
space’
DepartmentforTransportreportonmixedpriorityroutesfound24-60percentcasualtyreductions; noise and air quality improvements; increased levels of walking and cycling; and childrenandmobilityimpairedusersreportinggreaterconfidenceinthenewsurroundings.Interestingly the report also found that “improvements in the quality of streetscape have led to a reduction in vacant premises and a more vibrant local economy”.200 The Manual for Streets 2 highlights that shared space can be used to improve the built environment, give people freedom of movement, improve the ambience of places, enhance social capital, enhance the economic vitality of places and improve safety. The coalition government is also encouraging local authorities to reduce street clutter. A particular issue appears to be the need to ensure that all vulnerable road users and minority groups are engaged in the design process at an earlier stage when streets are redesigned. Concerns about shared space have been raised by blind and partially sighted groups as it tends to remove some of the navigational features they rely upon such as raised kerbs. The report Sight Line201 published by CABE aims to address these issues and makes a number of recommendations to improve the legibility of streets and shared spaces for low vision users. Thorough and early engagement with all users of a public space is essential prior to any redesign.Shared space is a valuable tool which contributes towards a wider need to rebalance transport infrastructure in built-up areas in favour of pedestrians and cyclists and improve the quality of life for everyone. As the Department for Transport report concludes, “Shared space schemes need to be understood as tactics designed to improve quality of life, visual amenity, local economic performance and environmental quality.”202

58 — Fairness in Transport – Finding an alternative to car dependency – Sustainable Development Commission
Policy Intervention Fairness implications
Smart Cards/Integrated ticketing
Initiatives such as integrated ticketing (where one ticket can cover more than one transport mode) and smart cards make public transport easier and more convenient to use, helping to further promote behaviour change programmes. Smart card technology will also allow much more accurate understanding of travel patterns allowing public transport operators to provide services better tailored to the needs of customers. The Commission for Integrated Transport’s report Transport Challenges and Opportunities – Getting more from less203 highlights that smart card technology that can be used on any public transport could then be used to deliver amoreefficientconcessionaryfaresscheme.
Eco-driving Encouraging widespread adoption of eco-driving techniques is a cost effective way of reducing the negative impacts of motoring which, as this report has shown, particularly impact low income and disadvantaged social groups. Encouraging smoother, slower driving canresultinaround8percentreductionsinfuelconsumptionandcarbonemissions.204 Lower engine speeds can reduce noise pollution levels by up to 32 times and eco-driving can also improve road safety and reduce the number of collisions by encouraging slower speeds and improved anticipation.205
Road pricing In the longer term, road pricing is likely to be necessary to tackle congestion problems, to compensateforreducingfueldutyrevenuesasvehicleefficiencyimprovesandtocreateafairerwayofchargingmotoriststhanthecurrentcombinationoffueldutyandvehicleexciseduty. The primary reason given for the planned introduction of road pricing in the Netherlands is to improve equity and fairness by creating a stronger link between the costs paid by road users and problems such as reducing congestion and improving accessibility. Moving to road pricing policies may help achieve greater equality by utilising charging which is proportional to the environmental impact of the vehicle used as well as the demand for the road used. Thuslowerincomemotoristsusingfuelefficientvehiclesonuncongestedruralrouteswillpaysubstantially less than those using high fuel consumption vehicles on congested routes. To gain public acceptance it is generally agreed that the introduction of road pricing would havetobemaderevenueneutral–thechargesreplacingfueldutyandannualvehicleexcisedutypayments.InterestinglytheDutchhavestatedthattheyexpectthistoleadto57percent of drivers being better off.206
Car sharing and car clubs
Car clubs could provide low cost access to car use for those who currently cannot afford to buy andruntheirownvehicle.Onjoiningacarclubmemberswhowerepreviouslycarownersreduce their annual mileage and increase their use of public transport, walking and cycling, avoidingunnecessarycarjourneys.Eachcarclubvehiclehasbeencalculatedtoreplacemorethan 20 privately owned cars.207 It is clear that some communities in rural areas could also benefitfromcarclubs.
Promotion of electric and ultra-
low carbon vehicles
EUlegislationoncarbondioxideemissionsfromnewcarsrequiresmanufacturerstoimprovetheefficiencyofthevehiclestheyoffer,usingfinancialpenaltiestoensurethatthetargetsforimprovementaremet.TheUKGovernmenthascommittedtooffer£5000subsidiestopurchasers of ultra-low carbon vehicles such as full electric cars in order to try to further promote growth of this market. While it is essential to achieve reductions in carbon emissions from car use, it is questionable whether these subsidies contribute to creating a fairer society. Thelikelybeneficiarieswillbetherichestsectionsofthepopulationwhowillbeabletoaffordthehighpricesofelectricvehiclesandwillthenbenefitfromthemuchlowerrunningcosts. The average income of Americans who have ordered new Nissan Leaf electric vehicles is$125,000(£78,500).208
Efficiency Improvements

Appendices — 59
Policy Intervention Fairness implications
Light rail/Trams Tramscanplayavaluableroleinreducingsocialexclusion.Moderntramsystemshavegoodaccessibility for disabled people and can prove more popular than dedicated services for the disabled.209 They can also tackle transport problems for workless households, providing fast and reliable services to city centres or regeneration sites. The Croydon Tramlink service halved journeytimesbetweenisolatedhousingestatesandthetowncentre.210 Research has shown that rail systems are preferred to bus transport by the general public as, amongst other reasons, they offer smoother, quieter, more reliable services.211 Research by PTEG also showed that trams are particularly successful at attracting motorists out of their cars, with 20 per cent of peak hour tram travellers formerly car commuters and at weekends up to half of all UK tramuserspreviouslyhavingmadethejourneybycar.212 However, without additional measures to ‘lock-in’ reductions in car use, the impact of this additional capacity could be an overall increase in travel. There are also concerns over the costsoftramschemes.Forexample,thecurrentEdinburghschemehasrunsignificantlyoverbudget and behind schedule.
High speed rail The creation of a high speed rail network is being promoted as a means of achieving modal shift away from road transport.213 If this results in a reduction in road transport, it may reducethenegativeexternalities,whichthisreporthasshowntofalldisproportionatelyondisadvantagedgroups.However,thereareobviouslynegativeexternalitiesassociatedwithboththebuildingandtheuseofhighspeedlines,forexample,noise,severanceissuesandimpacts on landscape.Therearepotentialfairnessbenefitsforregionaleconomies.ItisarguedthatahighspeedrailnetworkwouldhelptorebalancetheUKeconomyandcouldallowexistingraillinestobe dedicated to improved local rail services. However, others have suggested that rather than bolstering the economies of the Midlands and the North it will further imbalance the national economy towards London.214 High speed rail could also divert funds away from investment in local rail services.As section 4.1.1 showed, those in the highest income quintile are the greatest users of rail. Despite commitments to ensure that new high speed services would not be offered at premium prices it could therefore be argued that higher income groups would stand to benefitmostfromlargescaleinvestmentinahighspeedrailnetwork.Ultimately, the fairness impacts of a high speed rail network will depend on the detail of implementationplans,howitisintegratedintotheexistingtransportnetworkandwhatcomplementary transport policies are included.
Road building Many commentators have stated that further road building acts to increase car dependency which, as this report has shown, could lead to increasing unfairness. The options in steps one to three of the hierarchy proposed in this report are not only likely to result in fairer outcomes, but often offer better value for money.
Capacity increases

60 — Fairness in Transport – Finding an alternative to car dependency – Sustainable Development Commission
The Department for Transport has commissioned several reports investigating the treatment of social and distributional impacts (SDIs) in transport appraisal and evaluation.Thetermwasfirstintroducedinappraisalsforthe Transport Innovation Fund (TIF).215 The initial report examiningliteratureonthissubjectidentifiedmanypotential areas in which SDIs can apply.216Thefinalreportnarrowed these down to eight key ones based on the availabilityofevidencetoassessimpacts:
Reduceexposuretonoise1
Reduce air quality health costs2
Reducetheriskofdeathorinjury3
Reduce crime4
Reduce severance5
Improve accessibility6
Improve affordability7
Improveconnectivity/accesstoleisure 8 (userbenefits)217
Thesearethenassessedagainstspecificgroupsofpeople:
Income�groups• – most deprived to least deprived
User�groups• – Pedestrians; cyclists and motorcyclists
Social�groups• – Children and young people; young men; older people; carers; women; people with disabilities; black and minority ethnic
TheDepartmentforTransporthavecreatedasix-stepprocess setting out how SDIs should be appraised as part of the NATA appraisal process which is detailed in draft web-based transport appraised guidance (WebTAG) published in January 2010.218 This is a very positive step forward and will help to ensure that these considerations are taken into accountinfuturemajortransportschemes.However,dueto the nature of the NATA process which must inevitably attempt to consider and balance a range of sometimes conflictingobjectives,thisdoesnotguaranteethatfuturetransport decisions will result in a fairer society, only that these aspects should now have been considered before a majortransportdecisionismade.
Appendix 5Department for Transport work on social and distributional impacts

Appendices — 61
Cost-benefitanalysisiswidelyusedacrossGovernmentand will continue to be so. However, it is important that all decision makers are aware of some of the fundamental limitations of this approach with regard to creating fair outcomes for all, particularly future generations.
Thebenefittocostratio(BCR)thattheNATAprocesspredicts for many of the most sustainable transport interventions is very high. For instance, the Department for Transport’s guidance to local authorities on low carbon transport highlights three cycling schemes with BCRs of between18.5:1and38.4:1.219 So for every pound spent, up to£38ofbenefitswouldbeexpected.
SustransquoteanaverageBCRfortraffic-freewalkingandcyclingroutesof26:1butnotethatthiswouldincreaseto40:1ifinitiativesthatreducecartravelwerenotmarked
down because of loss of income to the Treasury from fuel tax.220
Initiatives such as travel plans and car sharing schemes also score highly on BCRs. The Highways Agency’s travel plan for Cambridge Science Park has been calculated to have aBCRof15:1,221 while recent calculations for lift sharing schemeshaveshownbenefitcostratiosofupto68:1.222 Furtherexamplesaresetoutbelowthoughitshouldbenoted that calculated BCRs should always be treated with care.Itisalsodifficulttomakecomparisonsbetweenthemboth because the methodology used to calculate BCRs is regularly updated and likely ranges will vary according to thesizeofthescheme.However,itisstillusefultoexaminetypicalBCRsfordifferentinterventionsgiventhesizeofthedifferences shown in the table below.
Appendix 6Limitations of current approaches to cost-benefit analysis
Intervention BCR Comment Source
Small scale cycling schemes
38:1Upgrading6kmexistingcanaltowpathtoimprove surface and connectivity – route for commuters. Featured in Delivering
Sustainable Low Carbon Travel: An Essential Guide for Local Authorities www.dft.gov.uk/webtag/documents/expert/unit3.14.php#05
22:1Upgrades to one kilometre length of ‘greenway’traffic-freeroutetoimprovesurfacequality and connectivity.
18:1New toucan crossing point for cyclists and walkers on busy road to promote safety.
Traffic free walking and cycling route
26:1-40:1
“26:1istheaveragebenefittocostratioofatraffic-freewalkingandcyclingroute,withthemajorityofbenefitcomingfromimprovedhealth. This would be even higher if initiatives that reduce car travel were not marked down becauseoflossofincomefromfueltax.Withsuchanomaliesstrippedout,thebenefittocostratiosarenearer40:1.” Sustrans – More Haste, Less Speed (p.11).
Sustrans (2009) The National Cycle Network Route User Monitoring Report – To end 2008

62 — Fairness in Transport – Finding an alternative to car dependency – Sustainable Development Commission
Intervention BCR Comment Source
Car share schemes18:1-68:1
Varies according to number of people with accesstoscheme.18:1isforstaffinaspecificcompany,68:1isforapublicsectorschemecoveringeveryoneinaspecificarea/county.
www.liftshare.com/download/Stakeholders%20newsletter%20-%20Summer%2010.pdf
Travel planning 15:1Highways agency sponsored scheme using travel planning for Cambridge Science park.
www.dft.gov.uk/pgr/sustainable/guidelocalauth/pdf/lowcarbontravel.pdf
Cycling Infrastructure
11:1 Based on the London cycle network.
An Economic Analysis of Environmental Interventions that Promote Physical Activity – York Health Economics Consortium (2007). www.nice.org.uk/nicemedia/live/11679/34737/34737.pdf
Intelligent Speed Adaptation
(system�to�control�vehicle�speeds)
10:1Mandatory – default enabled but cannot be overridden.
Commission for Integrated TransportreportOctober2008–based on conservative estimates of accident reductions, fuel costs and CO
2 savings. Found
insignificantbenefittonoiseand other pollutants. Did not considermodalshiftbenefitsorreduced policing costs. http://cfit.independent.gov.uk/mf/reports/isa08/pdf/isa-report.pdf
5:1Voluntary – default enabled, but can be overridden.
2.4:1 Advisory–warnsdriverwhenlimitexceeded.
Car clubs 9.5:1 Report prepared by Carplus.
Carplus 2007, The Car Club National Network Project Appraisal October 2007, Carplus, Leeds.
Personalised Travel Planning
7.6:1 TravelSmartfiguresfromSustrans.www.sustrans.org.uk/assets/files/travelsmart/sus649_TravelSmart%20review_print.pdf
Cycle training 7:1 Averagefigures
Valuing the Benefits of Cycling –CyclingEngland/SQWandAn Economic Analysis of Environmental Interventions to Promote Physical Activity – York Health Economics (2007)
Road schemes
4.7:1 Highways Agency schemes – average of 93. Eddington Review evidence base, analysed by RAC Foundation:Rates of Return on Public Spending on Transport4.2:1 Localroadschemes–averageof48.

Appendices — 63
Intervention BCR Comment Source
High Speed Rail
2.7:1 London to Birmingham
High Speed Rail. London to the West Midlands and beyond: A report to Government by High Speed Two Limited (Chapter 4).
1.6:1NetworkRailanalysis–LondontoGlasgow/Edinburgh with spurs to Liverpool and Birmingham.
www.networkrail.co.uk/documents/About%20us/New%20Lines%20Programme/5886_NewLineStudy_synopsis.pdf
Low carbon cars 1.2:1 EU new car CO2 regulation 130gCO
2/kmtarget.
www.dft.gov.uk/pgr/sustainable/carbonreduction/ia.pdf
Ultra low carbon cars
0.9:1 EU new car CO2 regulation 95gCO
2/kmtarget.
www.dft.gov.uk/pgr/sustainable/carbonreduction/ia.pdf
Biofuels 0.59:1 Renewable transport fuels obligation.www.dft.gov.uk/pgr/sustainable/carbonreduction/ia.pdf
By comparison the high speed rail line from London to Birmingham was described by the Department for Transport as offering“highvalueformoney…deliveringmorethan£2ofbenefitsforevery£1spent”.223 However, this substantially lowerBCRmustbeconsideredinthecontextoffulfillingaverydifferenttransportationneed.
Note:iffurtherchangesweremadetothecalculationstoaddresscriticismofovervaluationofsmalltimesavings,treatment of lost revenue from fuel duty and more appropriate valuation of carbon savings then the differences between these interventions may be even larger.
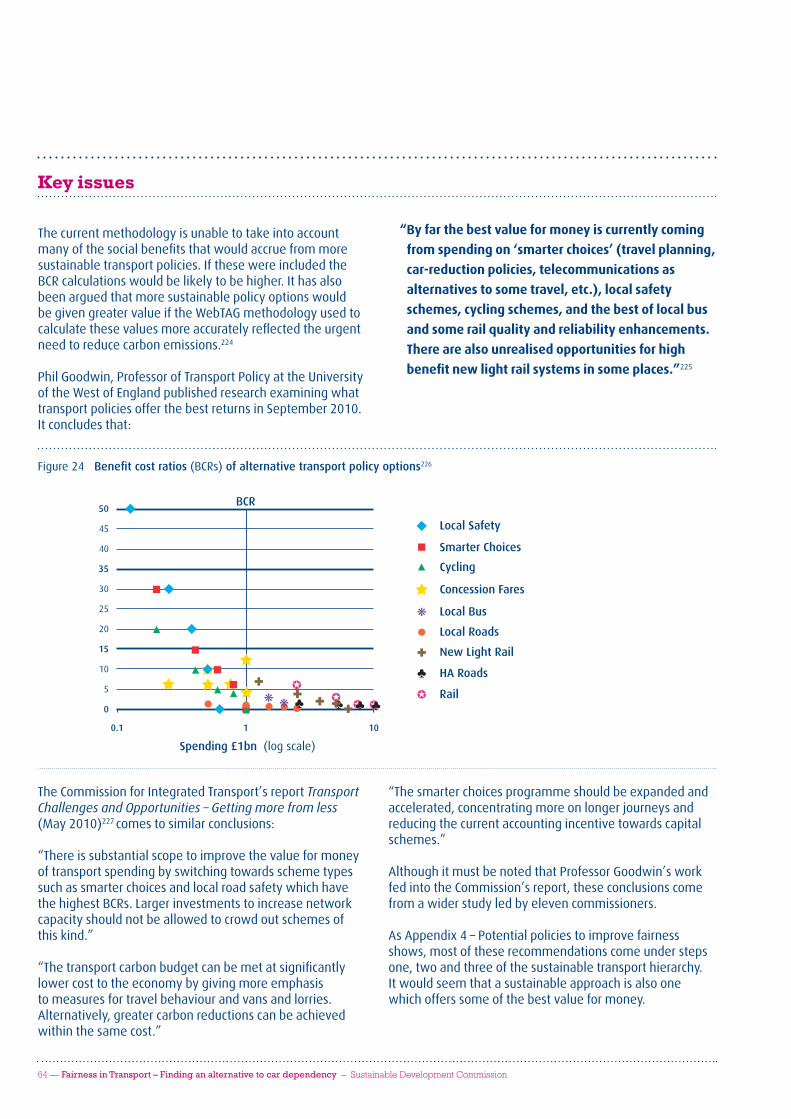
64 — Fairness in Transport – Finding an alternative to car dependency – Sustainable Development Commission
The Commission for Integrated Transport’s report Transport Challenges and Opportunities – Getting more from less (May 2010)227 comestosimilarconclusions:
“There is substantial scope to improve the value for money of transport spending by switching towards scheme types such as smarter choices and local road safety which have the highest BCRs. Larger investments to increase network capacity should not be allowed to crowd out schemes of this kind.”
“Thetransportcarbonbudgetcanbemetatsignificantlylower cost to the economy by giving more emphasis to measures for travel behaviour and vans and lorries. Alternatively, greater carbon reductions can be achieved within the same cost.”
“Thesmarterchoicesprogrammeshouldbeexpandedandaccelerated,concentratingmoreonlongerjourneysandreducing the current accounting incentive towards capital schemes.”
Although it must be noted that Professor Goodwin’s work fed into the Commission’s report, these conclusions come from a wider study led by eleven commissioners.
AsAppendix4–Potentialpoliciestoimprovefairnessshows, most of these recommendations come under steps one, two and three of the sustainable transport hierarchy. It would seem that a sustainable approach is also one which offers some of the best value for money.
The current methodology is unable to take into account manyofthesocialbenefitsthatwouldaccruefrommoresustainable transport policies. If these were included the BCR calculations would be likely to be higher. It has also been argued that more sustainable policy options would be given greater value if the WebTAG methodology used to calculatethesevaluesmoreaccuratelyreflectedtheurgentneed to reduce carbon emissions.224
Phil Goodwin, Professor of Transport Policy at the University oftheWestofEnglandpublishedresearchexaminingwhattransport policies offer the best returns in September 2010. Itconcludesthat:
“ By far the best value for money is currently coming
from spending on ‘smarter choices’ (travel planning,
car-reduction policies, telecommunications as
alternatives to some travel, etc.), local safety
schemes, cycling schemes, and the best of local bus
and some rail quality and reliability enhancements.
There are also unrealised opportunities for high
benefit new light rail systems in some places.”225
Key issues
Figure 24 Benefit�cost�ratios�(BCRs)�of�alternative�transport�policy�options226
0
1 100.1
5
10
15
20
25
30
35
40
45
50
Local Safety
Smarter Choices
Cycling
Concession Fares
Local Bus
Local Roads
HA Roads
New Light Rail
Rail
Spending £1bn (log scale)
BCR
Endnotes — 65
1 HM Government (2010) The Coalition: Our Programme for Government
2 HM Government (2005) Securing the Future: delivering UK sustainable development strategy.
3 For more information please see www.sd-commission.org.uk/pages/aviation.html
4 HM Government (2010) The Coalition: Our Programme for Government
5 Department for Transport (2010) Business Plan 2011-2015, www.dft.gov.uk/about/publications/business/plan2011-15/pdf/plan2011-2015.pdf
6 Department for Transport (2010) Transport Statistics Great Britain www.dft.gov.uk/pgr/statistics/datatablespublications/modal/passenger/tsgb0101.xls
7 www.telegraph.co.uk/motoring/news/7721591/Coalition-government-Transport-Secretary-Philip-Hammond-ends-Labours-war-on-motorists.html
8 Wood, C (2009) The Right to Travel: Seeing the World in a Globalised, Climate-Vulnerable Era
9 The Society of Motor Manufacturers and Traders (2010), Motor Industry Facts 2010, www.smmt.co.uk/downloads/MotorIndustryFacts.pdf
10 Department for Transport (2010) National Travel Survey:2009 Driving licence holding and vehicle availability, www.dft.gov.uk/pgr/statistics/datatablespublications/nts/
11 National Travel Survey data: estimated full car driving licence holders in Great Britain 2009: 34.7 million. Estimated population of Great Britain: 60 million (UK Population: 61.8 million: www.statistics.gov.uk/pdfdir/popnr0610.pdf,Northern Ireland population =1.8 million http://www.nisra.gov.uk/archive/demography/population/midyear/mye_report_2009.pdf)
12 OECD Project On Environmentally Sustainable Transport (2000) The Economic And Social Implications Of Sustainable Transportation, Proceedings from the Ottawa Workshop p.97
13 Commission for Integrated Transport (2006) European Best Practice 2006 Update (2), section 3-11
14 AA Motoring Costs (2010) Mid price band total standing and running costs = 61.84p/mile at 10,000 miles a year, www.theaa.com/motoring_advice/running_costs/petrol2010.pdf
15 Department for Transport (2009) Transport Trends 2009 Edition, section 2 personal travel by mode, www.dft.gov.uk/adobepdf/162469/221412/190425/220778/trends2009.pdf
16 Sloman, L (2006) Car Sick – Solutions for our Car-addicted Culture, published by Green Books www.greenbooks.co.uk
17 Adapted from diagram credited to Roger Levett, Levett-Therivel sustainability consultants in Sloman, L. and Taylor, I., (2008) Towards Transport Justice – Transport and Social Justice in an Oil-Scarce Future, Sustrans http://www.sustrans.org.uk/assets/files/Info%20sheets/towards_transport_justice_april08.pdf
18 Transport Select Committee (2009), Taxes and Charges on Road Users, page 12, Table 3, www.publications.parliament.uk/pa/cm200809/cmselect/cmtran/103/103.pdf
19 The Cabinet Office Strategy Unit (2009) The wider costs of transport in English urban areas in 2009, www.cabinetoffice.gov.uk/media/307739/wider-costs-transport.pdf
20 Based on scaling accidents, poor air quality, physical inactivity and greenhouse gas emissions figures by 1.23 to get from 81 per cent to 100 per cent of population. £56 billion quoted in Sustrans (2010) Moving forward – A year of delivering smarter travel choice, www.sustrans.org.uk/assets/files/rmu/Moving%20forward%20Sustrans%20Monitoring%20Report%20to%20end%202009%20September%202010.pdf
21 Sælensminde, K (1992) Environmental Costs Caused by Road Traffic in Urban Areas-Results from Previous Studies, Institute for Transport Economics, Oslo (www.toi.no).
22 The Cabinet Office Strategy Unit (2009) The wider costs of transport in English urban areas in 2009 p.27
23 Sansom et al, (2001) Surface Transport Costs and Charges: Great Britain 1998, www.its.leeds.ac.uk/projects/STCC/downloads/SurfaceTransportCostsReport.pdf
24 Transport Select Committee (2009) Taxes and Charges on Road Users, evidence 145, www.publications.parliament.uk/pa/cm200809/cmselect/cmtran/103/103.pdf
25 www.dft.gov.uk/pgr/statistics/datatablespublications/nts/latest/nts2009-07.pdf
Endnotes

66 — Fairness in Transport – Finding an alternative to car dependency – Sustainable Development Commission
26 Data from 2003, www.dwp.gov.uk/consultations/2010/21st-century-welfare
27 Moseley, M J (1979) Accessibility: the rural challenge, Methuen, London.
28 Department for Transport (2007) Cycling Personal Travel Factsheet
29 Burrows, R and Rhodes, D (1998) Unpopular Places? Area Disadvantage and the Geography of Misery
30 Bradshaw J and Holmes H (1989) Living on the Edge: A Study of the Living Standards of Families on Benefits in Tyne and Wear
31 Pucher, J and Buehler, R (2008), Making Cycling Irresistible: Lessons from The Netherlands, Denmark and Germany, http://policy.rutgers.edu/faculty/pucher/irresistible.pdf
32 Horton, T and Reed, H (2010) Where the money goes: How we benefit from public services, www.tuc.org.uk/extras/wherethemoneygoes.pdf
33 Graph reproduced from Horton, T and Reed, H (2010) Where the money goes: How we benefit from public services, p.26, www.tuc.org.uk/extras/wherethemoneygoes.pdf
34 House of Commons Health Committee – Health Inequalities Third report of 2008-2009 session, page 105, www.publications.parliament.uk/pa/cm200809/cmselect/cmhealth/286/286.pdf
35 Edwards, P, Roberts et al, (2006) Deaths from injury in children and employment status in family: analysis of trends in class specific death rates, British Medical Journal, 333, pp 119–121
36 Clarke, D, Ward, P, Truman, W, Bartle, C (2008) A poor way to die: social deprivation and road traffic fatalities
37 SDC (2010) Sustainable Development: The key to tackling health inequalities.
38 Road Safety Analysis (2010) Child Casualties Report 2010 – A study into resident risk of children on roads in Great Britain 2004-08, www.roadsafetyanalysis.org/wp-content/uploads/2010/08/Child-Casualty-Report-2010.pdf
39 Roberts I, Norton R and Tara B (1996) Child pedestrian injury rates: the importance of risk relating to socioeconomic and ethnic differences in Auckland, New Zealand
40 Marmot (2010) Fair Society, Healthy Lives, Strategic Review of Health Inequalities in England Post-2010, p.37, www.marmotreview.org
41 Marmot (2010) Fair Society, Healthy Lives, Strategic Review of Health Inequalities in England Post-2010, p.37, www.marmotreview.org
42 AEA Technology for Department of Environment, Food and Rural Affairs (2006) Air Quality and Social Deprivation in the UK: an environmental inequalities analysis, http://tiny.cc/ysVGb
43 Forastiere, F, Stafoggia, M, Tasco, C, Picciotto, S, Agabiti, N, Cesaroni, G, et al. (2007) Socioeconomic status, particulate air pollution, and daily mortality: differential exposure or differential susceptibility, American Journal of Industrial Medicine, 50(3):208-16.
44 CABE (2010) Urban green nation: Building the evidence base, www.cabe.org.uk/files/urban-green-nation-summary.pdf
45 Lynn Sloman, Transport for Quality of Life (2008) Towards Transport Justice p.10
46 Marmot (2010) Fair Society, Healthy Lives, Strategic Review of Health Inequalities in England Post-2010, figure 11, p.33, www.marmotreview.org
47 Mental Health Foundation (2009) Mental health, resilience and inequalities, www.mentalhealth.org.uk/publications/mentalhealth-resilience-and-inequalities-report/; Maller C, Townsend M, Ptyor A, Brown P, St Leger L (2005) Healthy nature healthy people: Contact with nature as an upstream health promotion intervention for populations. Oxford: Oxford University Press; Grahn P and Stigsdotter UA (2003) Landscape planning and stress. Jena: Urban Forestry Urban Greening; Mind (2007) Ecotherapy: The green agenda for mental health, www.mind.org.uk/NR/rdonlyres/D9A930D2-30D4-4E5B-BE79-1D401B804165/0/ecotherapy.pdf
48 Pretty J, Peacock J, Hine R, Sellens M, South N, Griffin M (2007) Green exercise in the UK Countryside: Effects on Health and Physiological Well-Being, and Implications for Policy and Planning. Journal of Environmental Planning and Management, 50(2), 211-231
49 WHO (2007) Noise Environmental Burden on Disease reported in The Guardian, www.guardian.co.uk/science/2007/aug/23/sciencenews.uknews
50 La Vecchia, C, et al. (1999) Population-attributable risk for colon cancer in Italy, www.ncbi.nlm.nih.gov/pubmed/10368816
51 Slattery, M, et al, (1997) Physical activity and colon cancer: a public health perspective, www.ncbi.nlm.nih.gov/pubmed/9099401

Endnotes — 67
52 Mezzetti, M et al, (1998) Population attributable risk for breast cancer: diet, nutrition, and physical exercise, www.ncbi.nlm.nih.gov/pubmed/9498489
53 Cancer Research UK (accessed 26/11/2010) Physical activity and cancer: the evidence, http://info.cancerresearchuk.org/healthyliving/exerciseandactivity/howdoweknow/#source4
54 Los Angeles Times (2010) Study finds traffic pollution can speed hardening of arteries, http://articles.latimes.com/2010/feb/14/local/la-me-freeway-pollution14-2010feb14
55 Social Exclusion Unit (2003) Making the Connections, www.cabinetoffice.gov.uk/media/cabinetoffice/social_exclusion_task_force/assets/publications_1997_to_2006/making_transport_2003.pdf
56 Social Exclusion Unit (2003) Making the Connections
57 Social Exclusion Unit (2003) Making the Connections
58 Woodland, S, Mandy, W, Miller, M (2003) Easing the transition into work (part 2 – client survey) p.58
59 Appleyard, D (1981) Livable Streets, Berkeley: University of California Press
60 Hart, J (2008), Driven to Excess: Impacts of motor vehicle traffic on residential quality of life in Bristol, UK, www.streets-ahead.org/Presentations/DTESummary.pdf
61 Figures taken from Driven to Excess MSc thesis by Joshua Hart.
62 Diagram reproduced from Driven to Excess MSc thesis by Joshua Hart.
63 Sauter, D and Hüttenmoser, M (2006) The contribution of good public spaces to social integration in urban neighbourhoods.
64 Nick Clegg (2010) Supporting families and children – speech to Barnados, www.libdems.org.uk/latest_news_detail.aspx?title=Nick_Clegg per cent27s_speech_on_supporting_families_and_children&pPK=6d739b75-08a1-4262-9309-39b0fc8fc45c
65 Daily Mail (15 June 2007) How children lost the right to roam in four generations, www.dailymail.co.uk/news/article-462091/How-children-lost-right-roam-generations.html
66 PACTS et al (2010) Perceptions and Realities – A closer look at the risks which children and young people face in Britain today and what we can do to reduce them, www.20splentyforus.org.uk/UsefulReports/Perceptions_and_Realities.pdf
67 www.roadsafetyanalysis.org/2010/08/child-casualties-2010/
68 Dorling, D (2008) Atlas of Mortality, based on 1981-2004 Office for National Statistics from 99 categories. Note that the most common cause of death will vary according to how causes are grouped.
69 Department for Transport (2010), Reported Road Casualties Great Britain: 2009 Annual Report p.73
70 PACTS et al (2010) Perceptions and Realities – A closer look at the risks which children and young people face in Britain today and what we can do to reduce them.
71 See www.bikeforall.net/content/cycling_to_school.php
72 Hillman, M, Adams, J, Whitelegg, J (1990), One False Move: A Study of Children’s Independent Mobility, Policy Studies Institute
73 Based on National Travel Survey data. Quoted by Living Streets on their website: www.walktoschool.org.uk/our-resources/free-stuff/statistics/
74 Sustainable Development Commission (2007) Every child’s future matters. Comment made by a trustee at Board Meeting of an urban Community Trust organisation in London, Stockwell Partnership, 2007.
75 BRAKE (2008) Road Safety Week 2008 survey of child safety in cars, on bikes and on foot, www.brake.org.uk/road-safety-week-2008-survey-of-child-safety-in-cars-on-bikes-and-on-foot
76 European Commission (2002) Kids on the move, http://ec.europa.eu/environment/youth/original/air/kids_on_the_move_en.pdf
77 NHS (2009) Health Survey for England 2008 – key findings, www.ic.nhs.uk/webfiles/publications/HSE/HSE08/HSE_08_Summary_of_key_findings.pdf
78 NHS Information Centre (2009) National Child Measurement Programme: England, 2008/09 school year
79 Mackett, R and Paskins, J (2004) Increasing Children’s Volume of Physical Activity Through Walk and Play.
80 From Roger Mackett presentation, University College London.
81 Royal Commission on Environmental Pollution (2007) Study on Urban Environments Wellbeing and Health.
82 Sustainable Development Commission (2010) Sustainable Development: The key to tackling health inequalities, www.sd-commission.org.uk/publications.php?id=1053

68 — Fairness in Transport – Finding an alternative to car dependency – Sustainable Development Commission
83 McWhannell, F and Braunholtz, S (2002) Young people and transport, Scottish Executive Social Research.
84 Cartmel, F and Furlong, A (2000) Youth unemployment in rural areas, Joseph Rowntree Foundation.
85 Department for Transport (2004) Young People and Transport: Understanding their needs and requirements.
86 Department for Transport (2009) National Travel Survey, www.dft.gov.uk/pgr/statistics/datatablespublications/nts/latest/nts2009-02.pdf
87 Taken from The Car in British Society, RAC Foundation.
88 McWhannell, F and Braunholtz, S (2002) Young people and transport, Scottish Executive Social Research.
89 RAC Foundation (2010) Maintaining Safe Mobility for the Ageing Population.
90 Noble, B (2000) Travel characteristics of older people, Transport Trends, 2000 Edition.
91 Noble, B (2000) Travel characteristics of older people, Transport Trends, 2000 Edition.
92 RAC Foundation (2010) Maintaining safe mobility for the ageing population.
93 Barnes, M, Blom, A, Cox, K, Lessof, C, Walker, A (2005) The Social Exclusion of Older People: Evidence from the first wave of the English Longitudinal Study of Ageing (ELSA), Office of the Deputy Prime Minister.
94 Russell, J and Hine, J (1996) The impact of traffic on pedestrian behaviour: 1. Measuring the traffic barrier, Traffic Engineering and Control, 37(1): 16-18.
95 www.dailymail.co.uk/news/article-1257182/Pensioner-forced-14-mile-bus-ride--time-wants-visit-shop-road.html
96 Department for Transport (2010) Road Safety Web Publication No. 16, Relationship between speed and risk of fatal injury: Pedestrians and car occupants, www.dft.gov.uk/pgr/roadsafety/research/rsrr/theme5/researchreport16/pdf/rswp116.pdf
97 Department for Transport (2010) Road Safety Web Publication No.16 FINDINGS, Relationship between speed and risk of fatal injury: Pedestrians and car occupants, www.dft.gov.uk/pgr/roadsafety/research/rsrr/theme5/researchreport16/pdf/rswp16f.pdf
98 National Audit Office and Department for Transport (2009) Improving road safety for pedestrians and cyclists in Great Britain.
99 Gilhooly, M, Hamilton, K, O’Neill, M, Gow, J, Webster, N, Pike, F, Bainbridge, C (2005) Transport and Ageing: Extending Quality of Life for Older People Via Public and Private Transport, ESRC Report.
100 Gilhooly, M, Hamilton, K, O’Neill, M, Gow, J, Webster, N, Pike, F, Bainbridge, C (2005) Transport and Ageing: Extending Quality of Life for Older People Via Public and Private Transport, ESRC Report.
101 Windle, G (2004) Transport in rural Wales, Working with older people.
102 Gilhooly, M, Hamilton, K, O’Neill, M, Gow, J, Webster, N, Pike, F, Bainbridge, C (2005) Transport and Ageing: Extending Quality of Life for Older People Via Public and Private Transport, ESRC Report.
103 Cattan, M (2001) Supporting older people to overcome social isolation and loneliness, British Gas Help the Aged Partnership.
104 Department for Transport (2009) Travel behaviour, experiences and aspirations of disabled people.
105 www.dft.gov.uk/pgr/statistics/datatablespublications/public/bus/vehicles/bus0603.xls
106 Association of Train Operating Companies (2009) Station Access Reports as at 9th December 2009.
107 www.bbc.co.uk/news/uk-wales-11632230
108 Transport for London (2009) Draft Revised Mayor’s Transport Strategy Integrated Impact Assessment: Appendix B: Supporting Data for Baseline, www.tfl.gov.uk/assets/downloads/corporate/appendix-b-supporting-data-for-baseline.pdf
109 Campion, J, Greenhalgh, C, Knight, J (2003) Mind the Gap: Leonard Cheshire’s social exclusion report 2003, Leonard Cheshire.
110 Department for Transport (2006) Evidence Base Review on Mobility: Choices & Barriers for Different Social Groups, www.dft.gov.uk/rmd/project.asp?intProjectID=12024
111 Equality and Human Rights Commission (2010) How fair is Britain? Equality, Human Rights and Good Relations in 2010, www.equalityhumanrights.com/uploaded_files/triennial_review/how_fair_is_britain_-_complete_report.pdf

Endnotes — 69
112 Transport for London (2007) London Travel Demand Survey supplement, page 7 – table shows black ethnic groups index at 76 and white groups at 107 compared to average for all Londoners of 100, www.tfl.gov.uk/assets/downloads/LTDS-research-supplement.pdf
113 Grundy C, Steinbach R, Edwards P, Green, J and Wilkinson, P (2008) The effect of 20mph zones on inequalities in road casualties in London: A report to the London Road Safety Unit: LSHTM, www.tfl.gov.uk/assets/downloads/the-effect-of-20-mph_-zones-on-inequalities_in-road-casualties-in-london.pdf
114 Department for Transport (2010) National Travel Survey: 2009 – Travel by car availability, income, ethnic group and household type, www.dft.gov.uk/pgr/statistics/datatablespublications/nts/
115 Weller, P, Feldman, A, Purdam K (2001) Religious discrimination in England and Wales, http://rds.homeoffice.gov.uk/rds/pdfs/hors220.pdf
116 Department for Transport (2004) People’s perceptions of personal security and their concerns about crime on public transport.
117 Department for Transport (2003) Public Transport Needs of Minority Ethnic and Faith Communities Guidance Pack.
118 CABE (2010) Urban green nation: Building the evidence base, www.cabe.org.uk/publications/urban-green-nation
119 CABE (2010) Urban green nation: Building the evidence base.
120 Government Equalities Office (2010) An anatomy of economic inequality in the UK – summary, http://sticerd.lse.ac.uk/dps/case/cr/CASEreport60_summary.pdf
121 Stokes, G (2010) Can we afford to ignore travel behaviour in rural areas?
122 Department for Transport (2008) National Travel Survey, www.dft.gov.uk/pgr/statistics/datatablespublications/nts/
123 See for example Davis, A, Hirsch, D, Smith, N (2010) A minimum income standard for the UK in 2010, Joseph Rowntree Foundation, www.jrf.org.uk/publications/minimum-income-standard-2010
124 Davis, A, Hirsch, D, Smith, N (2010) A minimum income standard for rural households, Joseph Rowntree Foundation, www.jrf.org.uk/sites/files/jrf/minimum-income-standards-rural-full.pdf
125 Department for Transport (2006), Evidence base review on mobility www.dft.gov.uk/rmd/project.asp?intProjectID=12024
126 Storey, P, Branner, J (2000) Young people and transport in rural areas, www.jrf.org.uk/publications/young-people-and-transport-rural-areas
127 Department for Transport (2005) Focus on Personal Travel 2005 edition.
128 Commission for Rural Communities (2010) Rural Insights Resident Survey 2009, Final report to CRC by Ipsos Mori, http://ruralcommunities.gov.uk/2010/03/10/rural-insights-resident-survey-2009/
129 Campaign for the Protection of Rural England (1999) Rural Traffic Fear Survey, www.cpre.org.uk/filegrab/rural-traffic-fear.pdf?ref=1880
130 Department for Transport (2009) A Safer Way: Consultation on Making Britain’s Roads the Safest in the World, www.dft.gov.uk/consultations/archive/2009/roadsafetyconsultation/
131 House of Commons Hansard Debates (2010) Fuel Duty (Rural areas), www.publications.parliament.uk/pa/cm200910/cmhansrd/cm100210/halltext/100210h0001.htm
132 Stokes, G (1995) Assessing the effects of new transport policies on rural residents – An analysis of National Travel Survey data, Transport Studies Unit, Oxford.
133 Transport Select Committee (2009) Taxes and Charges on Road Users, www.publications.parliament.uk/pa/cm200809/cmselect/cmtran/103/103.pdf
134 Commission for Rural Communities (2008) Thinking about rural transport, The potential impacts of road pricing on rural areas, www.ruralcommunities.gov.uk/files/CRC%20Potential%20Impacts.pdf
135 Sustainable Development Commission (2010) Sustainable Development – The key to tackling health inequalities, www.sd-commission.org.uk/publications.php?id=1053
136 Kevin Anderson and Alice Bows (2009) Reframing Climate Change: How recent emission trends & the latest science change the debate, http://policydialogue.org/files/events/Anderson_Reframing_Climate_Change_Presentation.pdf
137 IPCC (2007) Climate Change 2007: Impacts, Adaptation and Vulnerability. Contribution of Working Group II to the Fourth Assessment Report of the Intergovernmental Panel on Climate Change, www.ipcc.ch/ipccreports/ar4-wg2.htm

70 — Fairness in Transport – Finding an alternative to car dependency – Sustainable Development Commission
138 Power, A, Davis, J, Plant, P and Kjellstrom, T (2009) The built environment and health inequalities. Task group submission to the Marmot Review, www.ucl.ac.uk/gheg/marmotreview/consultation/ Built_environment_report; Stern, N (2006) The economics of climate change, The Stern review, Cabinet Office and HM Treasury, p.10.
139 Stern, N (2006) The economics of climate change: The Stern Review, Cabinet Office and HM Treasury.
140 Environment Agency (2006) Addressing environmental inequalities: Flood risk, Bristol: Environment Agency.
141 Stern, N (2006) The economics of climate change: The Stern Review, Cabinet Office and HM Treasury.
142 Pitt, M (2008) The Pitt review: Lessons learned from the 2007 floods, London: The Cabinet Office; Chapter 2.
143 Brand, C and Boardman, B (2007) Taming of the few – The unequal distribution of greenhouse gas emissions from personal travel in the UK.
144 Smith, K (2008) Mitigating, adapting and suffering, how much of each? Annual Review of Public Health 2008 29: 11–25, www.abuhrc.org/Documents/Lancet per cent20Climate per cent20Change.pdf
145 www.guardian.co.uk/environment/2010/jan/22/quarter-us-grain-biofuels-food
146 Bailey, R Senior Policy Adviser, Oxfam (2008) Biofuels: their potential and the risks attached.
147 www.guardian.co.uk/environment/2010/jan/22/quarter-us-grain-biofuels-food
148 FAO (2010) The State of Food Insecurity in the World, www.fao.org/publications/sofi/en/
149 Lorenzo Cotula, Nat Dyer and Sonja Vermeulen (2008) Fuelling exclusion? The biofuels boom and poor people’s access to land, FAO and IIED.
150 Victoria Tauli-Corpuz and Parshuram Tamang (2007), Oil Palm and Other Commercial Tree Plantations, Monocropping: Impacts on Indigenous Peoples’ Land Tenure and Resource Management Systems and Livelihoods.
151 Charlotte de Fraiture et al (2007) Biofuels: implications for agricultural water use, International Water Management Institute.
152 Lorenzo Cotula, Nat Dyer and Sonja Vermeulen (2008) Fuelling exclusion? The biofuels boom and poor people’s access to land, FAO and IIED.
153 Richard Doornbosch and Ronald Steenblik (2007) OECD Round Table on Sustainable Development, Biofuels: Is the cure worse than the disease?
154 The Parliamentary Advisory Council for Transport Safety (2010), Submission to the transport select committee enquiry on transport and the economy.
155 Department for Transport (2009), Road Transport Forecasts 2009, www.dft.gov.uk/pgr/economics/ntm/forecasts2009/pdf/forecasts2009.pdf
156 UK Energy Research Centre (2009) Global Oil Depletion: An assessment of the evidence of a near term peak in global oil production, www.ukerc.ac.uk/support/Global per cent20Oil per cent20Depletion
157 UK Industry Taskforce on Peak Oil and Energy Security (2010) The Oil Crunch – A wake-up call for the UK economy p.6
158 Kevin Anderson and Alice Bows (2009) Reframing Climate Change: How recent emission trends and the latest science change the debate, http://policydialogue.org/files/events/Anderson_Reframing_Climate_Change_Presentation.pdf
159 Department for Environment, Transport and the Regions (1998), A new deal for transport: better for everyone http://webarchive.nationalarchives.gov.uk/+/http://www.dft.gov.uk/adobepdf/187604/A_new_deal_for_transport_be1.pdf
160 Phil Goodwin writing in Local Transport Today magazine (2010) Peak Car?
161 Department for Transport, Department for Communities and Local Government (2007), Guidance on Transport Assessment, http://webarchive.nationalarchives.gov.uk/+/http://www.dft.gov.uk/adobepdf/165237/202657/guidanceontapdf
162 Highways Agency website, Tackling congestion through influencing travel behaviour, www.highways.gov.uk/knowledge/9573.aspx
163 Dalkmann, H and Brannigan, C (2007) Transport and Climate Change. Module 5e. Sustainable Transport: A Sourcebook for Policy-makers in Developing Cities, www.gtz.de/de/dokumente/en-transport-and-climate-change-2007.pdf

Endnotes — 71
164 Sustainable Development Commission (2009) Response to Delivering a Sustainable Transport System: Consultation on Planning for 2014 and Beyond, www.sd-commission.org.uk/publications/downloads/SDC_response_DaSTS_consultationbb.pdf
165 Sustainable Development Commission (2010) Smarter Moves – How information communications technology can promote sustainable mobility p.9, www.sd-commission.org.uk/publications.php?id=1050
166 Graham Pendlebury, Director of Environment and International, Department for Transport (2010) speaking at the Westminster Energy, Environment and Transport Forum’s Decarbonising Transport conference.
167 Sustainable Development Commission (2010) House of Lords Science and Technology Select Committee Call for Evidence: Behaviour Change Submission, www.sd-commission.org.uk/publications/downloads/SDC_HoL_STSC_Submission1.pdf
168 This is known as the Jevons paradox, first highlighted in 1865 by William Stanley Jevons in his paper The Coal Question. In the 1980s a further issue was highlighted by two economists: that increasing energy efficiency would simply raise demand for energy in the economy as a whole. This was later dubbed the Khazzoom-Brookes Postulate which states that “improvements in energy efficiency work to increase, rather than decrease, energy consumption”.
169 The Centre for Transport and Society University of the West of England, Bristol (2008), Making NATA fit for purpose – A Submission for the NATA Refresh Consultation.
170 Buchan, K (2008) Decision making for sustainable transport, Green Alliance, www.green-alliance.org.uk/uploadedFiles/Publications/reports/Decision-making%20for%20sustainable%20transport.pdf
171 Buchan, K (2009) Investing in transport: making the change, Green Alliance, www.mtru.com/mtru%20publications/NATA_making%20the%20change.pdf
172 Buchan, K (2009) Investing in transport: making the change, Green Alliance, www.mtru.com/mtru%20publications/NATA_making%20the%20change.pdf
173 Table adapted from Buchan, K (2009) The right route – Improving transport decision making Green Alliance, www.green-alliance.org.uk/grea_p.aspx?id=4619
174 Defra/GES (2010) GES Review of the Economics of Sustainable Development, www.defra.gov.uk/evidence/economics/susdev/documents/esd-review-report.pdf
175 Greater London Authority (2009) Equal Life Chances for All, www.london.gov.uk/archive/mayor/equalities/docs/equal-life-chances-240709.pdf
176 Department for Education (2010) The best place to grow up: Sustainable Development Action Plan 2010-2012, p.17
177 Cutter, (1995) Race, class and environmental justice, Progress in Human Geography, vol.19 no.1 pp.11-22.
178 Sustainable Development Commission (2002) Vision for sustainable regeneration, environment and poverty – The missing link.
179 http://assets.panda.org/downloads/socialenvironmentaljustice2.pdf
180 Institution of Mechanical Engineers (2009) Energy Theme Position Statement – Promoting sustainable energy use, Engineering sustainable energy supply.
181 Department for Transport & Department for Communities and Local Government (2007) Guidance on Transport Assessment http://webarchive.nationalarchives.gov.uk/+/http://www.dft.gov.uk/adobepdf/165237/202657/guidanceontapdf
182 Highways Agency website, Tackling congestion through influencing travel behaviour, www.highways.gov.uk/knowledge/9573.aspx
183 Department for Communities and Local Government (2006 first published 1994), Planning Policy Guidance 13: Transport, www.communities.gov.uk/documents/planningandbuilding/pdf/155634.pdf
184 Defra (2010) Low Emissions Strategies: using the planning system to reduce transport emissions – Good practice Guidance, www.defra.gov.uk/environment/quality/air/airquality/local/guidance/documents/low-emissions-strategies-2010.pdf
185 UNICEF (2007) An overview of child well-being in rich countries, http://news.bbc.co.uk/nol/shared/bsp/hi/pdfs/13_02_07_nn_unicef.pdf
186 Pucher, J and Buehler, R (2008), Making Cycling Irresistible: Lessons from The Netherlands, Denmark and Germany, http://policy.rutgers.edu/faculty/pucher/irresistible.pdf
187 See www.berkelbike.com
188 See www.moltenrock.co.uk

72 — Fairness in Transport – Finding an alternative to car dependency – Sustainable Development Commission
189 Department for Transport (2010), Interim Evaluation of the Implementation of 20 mph Speed Limits in Portsmouth www.dft.gov.uk/pgr/roadsafety/speedmanagement/20mphPortsmouth/pdf/20mphzoneresearch.pdf
190 See for instance Campaign to Protect Rural England (2004) Back Together Again.
191 PTEG (2010) Transport and social inclusion: Have we made the connections in our cities?
192 http://edinburghnews.scotsman.com/news/Shopping-centres-to-get-TVs.6607612.jp
193 Cairns, S, Sloman, L, Newson, C, Anable, J, Kirkbride, A and Goodwin, P (2004) Smarter Choices – Changing the Way We Travel.
194 Department for Transport (2010) Summary of Sustainable Travel Town results evaluation, www.dft.gov.uk/pgr/sustainable/ltp3planning/travelguide/sttresults/
195 Sustrans (2010) Moving Forward – A year of delivering smarter travel choice.
196 www.nottingham.ac.uk/~lazwww/confer/cycling/report_2006/Philip_Insall.pdf
197 Town and Country Planning Association (2008) Design to delivery: eco-towns transport worksheet, www.tcpa.org.uk/data/files/etws_transport.pdf
198 Guthrie, N (2001) Key findings of Powabyke Owners’ Survey, www.acttravelwise.org/uploads/docs/Electricbikeresearchsummary.pdf
199 London Assembly (2009) Braking point 20mph speed limits in London.
200 Department for Transport (2008) Local Transport Note 3/08 Mixed Priority Routes: Practitioners’ Guide.
201 CABE (2010) Sight Lines – Designing Better Streets for People with Low Vision, www.cabe.org.uk/files/sight-line.pdf
202 Department for Transport (2008) Local Transport Note 3/08 Mixed Priority Routes: Practitioners’ Guide.
203 Commission for Integrated Transport (2010) Transport Challenges and Opportunities: Getting more from less, http://cfit.independent.gov.uk/pubs/2010/tco/index.htm
204 http://actonco2.direct.gov.uk/home/what-you-can-do/On-the-move/driving-your-car.html#b2
205 www.ecodrive.org/Benefits-of-ecodriving.277.0.html
206 Local Transport Today #533 (2010) All eyes on Netherlands as ministers publish Bill for national road pricing, www.transportxtra.com/magazines/local_transport_today/news/?id=18171
207 Carplus (2010) Annual Survey 2009-2010, www.carplus.org.uk/wordpress/wp-content/uploads/2010/05/Annual-Survery-Report-2009-10.pdf
208 All cars electric (2010) Just who is a typical 2011 Nissan Leaf buyer? www.allcarselectric.com/blog/1049202_just-who-is-a-typical-2011-nissan-leaf-buyer-we-find-out
209 Passenger Transport Executive Group and Transport for London (2006), What modern trams can do for cities.
210 Passenger Transport Executive Group and Transport for London (2006), What modern trams can do for cities.
211 Edson L Tennyson (1989) Impact on Transit Patronage of Cessation or Inauguration of Rail Service, Transportation Research Record 1221.
212 Passenger Transport Executive Group and Transport for London (2006), What modern trams can do for cities.
213 www.dft.gov.uk/press/speechesstatements/speeches/hammond20101104
214 Chris Stokes (former Executive Director for the Strategic Rail Authority) (2010) Do we really need HS2? Modern Railways.
215 www.dft.gov.uk/webtag/documents/project-manager/pdf/unit2.13d.pdf
216 Centre for Transport & Society (2009) Literature Review – The Treatment of Social and Distributional Impacts in Appraisal and Evaluation.
217 Atkins Limited for Department for Transport (2010) Assessing Social and Distributional Impacts in Transport Scheme Appraisal and Evaluation, Final Report.
218 Department for Transport (2010) Detailed Guidance on Social and Distributional Impacts of Transport Interventions, TAG Unit 3.17, In Draft.

Endnotes — 73
219 Department for Transport (2009) Delivering Sustainable Low Carbon Travel: An Essential Guide for Local Authorities, www.dft.gov.uk/pgr/sustainable/guidelocalauth/pdf/lowcarbontravel.pdf
220 Sustrans (2010) More Haste, Less Speed p.11.
221 Department for Transport (2009) Delivering Sustainable Low Carbon Travel: An Essential Guide for Local Authorities, www.dft.gov.uk/pgr/sustainable/guidelocalauth/pdf/lowcarbontravel.pdf
222 www.liftshare.com/download/stakeholders%20newsletter%20-%20summer%2010.pdf
223 Department for Transport (2010) High Speed Rail Summary
224 Buchan, K (2009) Investing in transport: making the change, Green Alliance, www.mtru.com/mtru%20publications/NATA_making%20the%20change.pdf
225 Goodwin, P (2010) Transport and the Economy: Submission of evidence to the House of Commons Transport Select Committee, http://eprints.uwe.ac.uk/13130/2/Goodwin_Transport_Committee_Transport_and_the_Economy_submission.pdf
226 Reproduced from Phil Goodwin article in Local Transport Today issue 556, 15th October 2010.
227 Commission for Integrated Transport (2010) Transport Challenges and Opportunities: Getting more from less, http://cfit.independent.gov.uk/pubs/2010/tco/index.htm

74 — Fairness in Transport – Finding an alternative to car dependency – Sustainable Development Commission
© Sustainable Development Commission February 2011
Design Andy�Long


Low
Carb
on W
ales Reg
ional Priorities for Action
England(Main office)
55 WhitehallLondon SW1A 2HH
0300 068 6305
ScotlandOsborne House1 Osborne TerraceEdinburgh EH12 5HG
0131 625 1880
www.sd-commission.org.uk/scotland
WalesRoom 1, University of WalesUniversity RegistryKing Edward VII AvenueCardiff CF10 3NS
029 2037 6956
www.sd-commission.org.uk/wales
Northern IrelandRoom E5.11, Castle BuildingsStormont Estate,Belfast BT4 3SR
028 9052 0196
www.sd-commission.org.uk/northern_ireland
Sustainable Developm
ent Comm
ission
The Sustainable Development Commission is the Government’s independent watchdog on sustainable development, reporting to the Prime Minister, the First Ministers of Scotland and Wales and the First Minister and Deputy First Minister of Northern Ireland.
Through advocacy, advice and appraisal, we help put sustainable development at the heart of Government policy.
www.sd-commission.org.uk
Regional Priorities for Action
Low Carbon Wales