FAIRFAX COUNTY REAL ESTATE SNAPSHOT
14
YEAR-END 2020 INCLUDING DATA THROUGH DECEMBER 31, 2020 REAL ESTATE 14.6% DIRECT OFFICE VACANCY RATE 2.7M SQUARE FEET OF OFFICE SPACE UNDER CONSTRUCTION 6.4% DIRECT INDUSTRIAL/FLEX VACANCY RATE FAIRFAX COUNTY REAL ESTATE SNAPSHOT YEAR-END 2020 THE OFFICE VACANCY RATE ROSE FOR THE FIRST TIME IN FIVE YEARS DUE TO THE IMPACT OF THE COVID-19 PANDEMIC. INDUSTRIAL SPACE WAS IN HIGH DEMAND DUE TO DISTRIBUTION NEEDS RELATED TO THE SURGE IN ONLINE SHOPPING. DESPITE IMPACTS OF COVID-19, CONSTRUCTION TIMELINES AND ACTIVITY WERE UNCHANGED.
Transcript of FAIRFAX COUNTY REAL ESTATE SNAPSHOT

YEAR-END 2020 INCLUDING DATA THROUGH DECEMBER 31, 2020
REAL ESTATE
14.6%DIRECT OFFICE VACANCY RATE
2.7 M SQUARE FEET OF OFFICE SPACE
UNDER CONSTRUCTION
6.4%DIRECT INDUSTRIAL/FLEX
VACANCY RATE
FAIRFAX COUNTY REAL ESTATE SNAPSHOT YEAR-END 2020
THE OFFICE VACANCY RATE ROSE FOR THE FIRST TIME IN FIVE YEARS DUE TO THE IMPACT OF THE COVID-19 PANDEMIC.
INDUSTRIAL SPACE WAS IN HIGH DEMAND DUE TO DISTRIBUTION NEEDS RELATED TO THE SURGE
IN ONLINE SHOPPING.
DESPITE IMPACTS OF COVID-19, CONSTRUCTION TIMELINES AND ACTIVITY WERE UNCHANGED.

2 REAL ESTATE REPORT YEAR-END 2020
COUNTYWIDE OFFICE SPACE TRENDS (SQUARE FEET)
1 ln some years, total leasing reflects the preleasing of buildings under construction and about to be constructed, as well as new and relet space.
OFFICE MARKET OVERVIEW
COUNTYWIDE OFFICE SPACE INVENTORY AND VACANCY RATES
Direct Direct Standing Vacancy Total New Relet Total Direct New Relet Year Inventory Rate (%) Leased Leased Leased Available Available Available
2000 93,563,753 3.5 12,750,968 6,918,762 5,832,206 3,236,371 1,007,213 2,229,158 2001 97,602,908 6.4 5,174,234 2,606,024 2,568,210 6,281,688 2,312,291 3,969,397 2002 100,912,347 12.1 7,648,790 1,022,910 2,631,385 12,176,938 3,291,394 8,885,544 2003 101,507,385 11.2 10,570,315 1,788,402 4,898,701 11,393,801 1,870,915 9,522,886 2004 102,117,697 8.6 10,969,819 1,762,757 6,028,830 8,764,801 919,191 7,845,610 2005 103,520,646 7.8 9,659,060 537,974 5,920,239 8,054,510 1,053,457 7,001,053 2006 105,054,801 7.7 10,805,683 2,249,866 7,569,360 8,115,057 1,155,235 6,959,822 2007 107,232,650 9.2 9,382,013 1,378,208 6,832,122 9,857,339 2,164,415 7,692,924 2008 111,189,301 12.1 9,976,277 1,808,055 7,146,620 13,422,946 3,419,220 10,003,726 2009 112,556,702 14.0 10,330,158 1,162,887 8,425,631 15,723,157 3,076,675 12,646,482 2010 113,191,835 13.3 13,586,158 1,317,120 11,590,346 15,091,196 1,926,139 13,165,057 2011 113,624,952 13.7 11,656,935 1,300,674 9,694,529 15,600,787 1,267,677 14,333,110 2012 114,056,515 14.4 10,717,111 1,251,127 8,833,486 16,454,250 1,039,607 15,414,643 2013 114,771,222 14.4 12,280,230 823,756 10,307,898 16,577,368 1,404,234 15,173,134 2014 116,238,615 16.3 9,833,053 521,971 8,711,025 18,897,111 1,498,179 17,398,932 2015 116,164,112 16.2 10,272,600 419,402 4,459,714 18,857,819 1,109,091 17,748,728 2016 116,673,208 15.8 10,712,374 1,085,720 8,910,443 18,402,938 991,003 17,411,935 2017 117,330,199 15.5 11,733,522 888,998 10,311,824 18,124,440 1,197,418 16,927,022 2018 118,521,926 14.9 9,688,103 1,516,050 7,603,075 17,647,155 1,001,607 16,645,548 2019 118,779,830 13.9 9,104,688 749,961 7,983,819 16,531,554 873,443 15,658,111 2020 119,205,408 14.6 5,315,506 545,054 4,506,707 17,421,462 703,624 16,717,838
1
2000
2001
2002
2003
2004
2005
2006
2007
2008
2009
2010
2011
2012
2013
2014
2015
2016
2017
2018
2019
2020
SquareFeet
0
20 mil
40 mil
60 mil
80 mil
100 mil
120 mil
0%
5%
10%
15%
20%
Vacancy rate including sublet space (figures available for 2001–current only)
Vacancy RatePANDEMIC IMPACT:
OFFICE LEASING (SQUARE FEET OF SPACE)
4.7 MYE 2019
3.5 MMY 2020
1.9 MYE 2020
Volkswagen Group of America decided to keep its headquarters in Fairfax County, leasing 196,000 square feet at the the future RTC Next development in Reston. The first phase of RTC Next will deliver more than 1.1 million square feet of trophy office space and is slated to deliver in 2022.

REAL ESTATE REPORT YEAR-END 2020 3
TOP TEN OFFICE LEASES – SECOND HALF 2020
1
2
3
4
5
6
7
8
9
10
VOLKSWAGEN12034 Sunset Hills Road • Reston196,000 s.f. • Relet
GSA4755 Meadow Wood Lane • Chantilly104,000 s.f. • Relet
THE AEROSPACE CORPORATION4851 Stonecroft Boulevard • Chantilly88,100 s.f. • Renewal
GDIT14700 Lee Road • Chantilly84,700 s.f. • Renewal
GSA-ICE1953 Gallows Road • Tysons67,600 s.f. • Relet
CALIBRE SYSTEMS6361 Walker Lane • Springfield56,700 s.f. • Relet
FIREEYE11951 Freedom Drive • Reston48,000 s.f. • Relet
MAG AEROSPACE12730 Fair Lakes Circle • Fairfax Center38,000 s.f. • Renewal
CSCI6225 Brandon Avenue • Springfield34,800 s.f. • Renewal
LINQUEST2551 Dulles View Drive • Dulles29,800 s.f. • Relet

4 REAL ESTATE REPORT YEAR-END 2020
OFFICE SELECTED LEASES – SECOND HALF 2020SELECT OFFICE LEASING ACTIVITY – SECOND HALF 2020
Tenant Building Address Square Feet
CHANTILLY/CENTREVILLE Aerospace Corporation Westfields 4851 Stonecroft Boulevard 88,100 America’s Charities Victory Point at Westfields 14200 Park Meadow Drive 6,000 Arete Associates Penrose Center I 14425 Penrose Place 17,300 Avenu Insights & Analytics Trinity Center II 5860 Trinity Parkway 6,800 Battelle Penrose Center I 14425 Penrose Place 4,000 Buffalo Group Wynwood 5160 Parkstone Drive 5,800 CACI Newbrook III 14150 Newbrook Drive 7,300 CACI International Independence Center 2 15040 Conference Center Drive 18,300 Comusult Systems Incorporated Venture Park 4795 Meadow Wood Lane 14,900 General Dynamics Information Technology Inc Opus at Westfields 14700 Lee Road 84,700 GSA-TSA Albemarle Point 14420 Albemarle Point Place 29,100 MBA Consulting Services Inc Venture Park 4795 Meadow Wood Lane 11,700 Net Services Southgate Center II 4511 Singer Court 3,400 SASSI Avion MidRise II 14520 Avion Parkway 2,300 Stellar Solutions Inc Penrose Center I 14425 Penrose Place 12,200 Zolon Tech Wynwood 5160 Parkstone Drive 9,300
FAIRFAX CENTER/OAKTON
AVIXA Fairfax Ridge 11242 Waples Mill Road 29,000 3 Pillar Global Fairfax Corner South 4100 Monument Corner Drive 11,200 Homeside Financial Centerpointe II 4000 Legato Road 4,300 MAG Aerospace Fair Lakes 7 12730 Fair Lakes Circle 38,000 NOVA Safe Hands Academy Fair Center Office Building 11240 Waples Mill Road 2,900 Ritter and Company Oakwood 11781 Lee Jackson Hwy 1,900Tiber Creek Consulting Greenwood 12015 Lee Jackson Memorial Hwy 19,900 Vellum Mortgage Fair Lakes 4 12700 Fair Lakes Circle 3,300 WMC Global Inc Oakwood 11781 Lee Jackson Highway 10500
HERNDON/DULLES
Accenture South Pointe I 2350 Corporate Park Drive 28,000 ALKU Liberty Park 13605 Dulles Technology Drive 12,000 Allstate Sugarland Professional Bldg 203 Elden Street 1,000 Authentic8 Inc The Atrium at Worldgate 205 Van Buren Street 5,900 Center for Vein Restoration Elden Plaza 150 Elden Street 2,800 CSG The Atrium at Worldgate 205 Van Buren Street 22,400 HySpecIQ Liberty Park 13655 Dulles Technology Drive 3,800 LinQuest Corporation Dulles View North 2551 Dulles View Drive 29,800 Occam Solutions Caywood21 13221 Woodland Park Road 3,700 Smartronix Monument II 12950 Worldgate Drive 8,600 SRC Coppermine Commons I 13861 Sunrise Valley Drive 18,000
MCLEAN
ContactEngine Inc McLean Gateway 6849 Old Dominion Drive 4,000Debt Advisory International 6862 Elm Street 1,300
MERRIFIELD Center For Advanced Ortho 3650 Joseph Siewick Drive 4,700 CJ Coakley Co Prosperity Metro 2677 Prosperity Avenue 10,300 United States Department of Defense One Jefferson Park 8111 Gatehouse Road 70,100
NEWINGTON/LORTON
Oaklare Management Alban Road Business Center 7406 Alban Station Court 1,400
RESTON
AMI NewPointe West 12030 Sunrise Valley Drive 3,300Canvas Solutions One Freedom Square 11951 Freedom Drive 12,600 Evolver International Tower 11800 Sunrise Valley Drive 12,900 FireEye One Freedom Square 11951 Freedom Drive 48,000 General Dynamics 11111 Sunset Hills Road 19,400 HIDTA 1800 Alexander Bell Drive 17,900
REAL ESTATE REPORT YEAR-END 2020 5
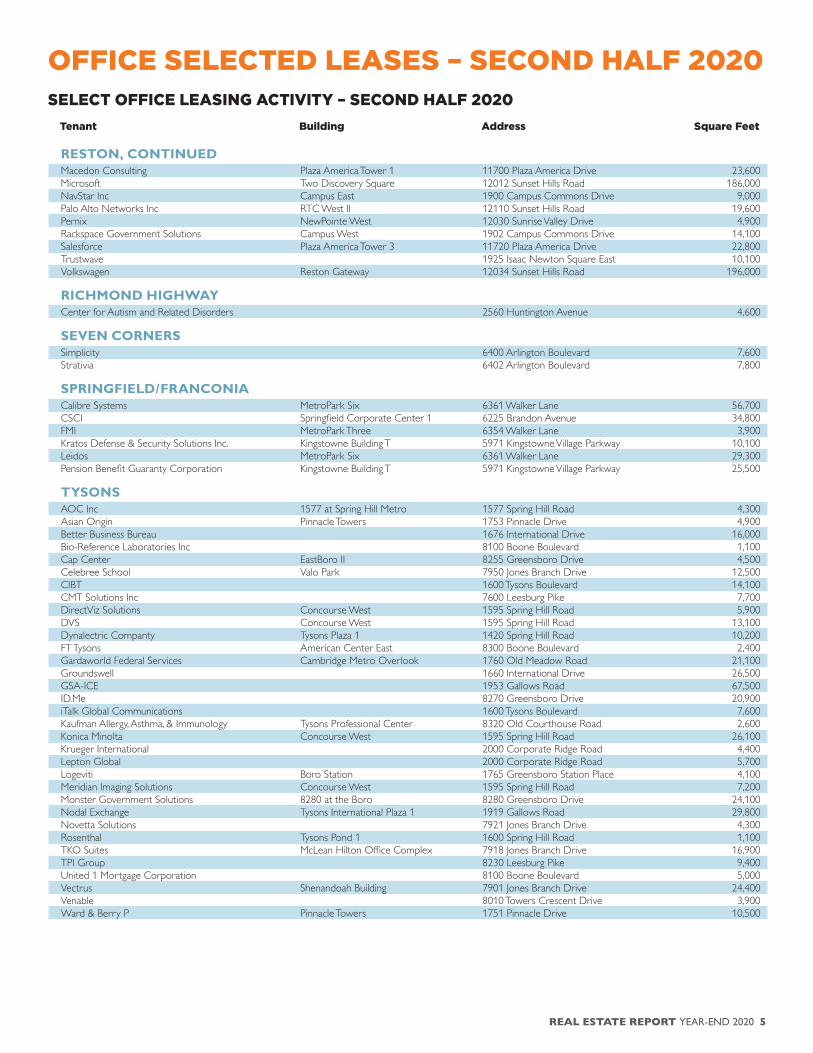
OFFICE SELECTED LEASES – SECOND HALF 2020SELECT OFFICE LEASING ACTIVITY – SECOND HALF 2020
Tenant Building Address Square Feet
RESTON, CONTINUED
Macedon Consulting Plaza America Tower 1 11700 Plaza America Drive 23,600 Microsoft Two Discovery Square 12012 Sunset Hills Road 186,000 NavStar Inc Campus East 1900 Campus Commons Drive 9,000Palo Alto Networks Inc RTC West II 12110 Sunset Hills Road 19,600 Pernix NewPointe West 12030 Sunrise Valley Drive 4,900Rackspace Government Solutions Campus West 1902 Campus Commons Drive 14,100 Salesforce Plaza America Tower 3 11720 Plaza America Drive 22,800 Trustwave 1925 Isaac Newton Square East 10,100 Volkswagen Reston Gateway 12034 Sunset Hills Road 196,000
RICHMOND HIGHWAY
Center for Autism and Related Disorders 2560 Huntington Avenue 4,600
SEVEN CORNERS
Simplicity 6400 Arlington Boulevard 7,600Strativia 6402 Arlington Boulevard 7,800
SPRINGFIELD/FRANCONIA
Calibre Systems MetroPark Six 6361 Walker Lane 56,700 CSCI Springfield Corporate Center 1 6225 Brandon Avenue 34,800 FMI MetroPark Three 6354 Walker Lane 3,900Kratos Defense & Security Solutions Inc. Kingstowne Building T 5971 Kingstowne Village Parkway 10,100 Leidos MetroPark Six 6361 Walker Lane 29,300 Pension Benefit Guaranty Corporation Kingstowne Building T 5971 Kingstowne Village Parkway 25,500
TYSONS
AOC Inc 1577 at Spring Hill Metro 1577 Spring Hill Road 4,300 Asian Origin Pinnacle Towers 1753 Pinnacle Drive 4,900 Better Business Bureau 1676 International Drive 16,000 Bio-Reference Laboratories Inc 8100 Boone Boulevard 1,100Cap Center EastBoro II 8255 Greensboro Drive 4,500 Celebree School Valo Park 7950 Jones Branch Drive 12,500 CIBT 1600 Tysons Boulevard 14,100 CMT Solutions Inc 7600 Leesburg Pike 7,700 DirectViz Solutions Concourse West 1595 Spring Hill Road 5,900DVS Concourse West 1595 Spring Hill Road 13,100 Dynalectric Companty Tysons Plaza 1 1420 Spring Hill Road 10,200 FT Tysons American Center East 8300 Boone Boulevard 2,400Gardaworld Federal Services Cambridge Metro Overlook 1760 Old Meadow Road 21,100 Groundswell 1660 International Drive 26,500 GSA-ICE 1953 Gallows Road 67,500 ID.Me 8270 Greensboro Drive 20,900 iTalk Global Communications 1600 Tysons Boulevard 7,600Kaufman Allergy, Asthma, & Immunology Tysons Professional Center 8320 Old Courthouse Road 2,600 Konica Minolta Concourse West 1595 Spring Hill Road 26,100 Krueger International 2000 Corporate Ridge Road 4,400 Lepton Global 2000 Corporate Ridge Road 5,700Logeviti Boro Station 1765 Greensboro Station Place 4,100Meridian Imaging Solutions Concourse West 1595 Spring Hill Road 7,200 Monster Government Solutions 8280 at the Boro 8280 Greensboro Drive 24,100 Nodal Exchange Tysons International Plaza 1 1919 Gallows Road 29,800 Novetta Solutions 7921 Jones Branch Drive 4,300 Rosenthal Tysons Pond 1 1600 Spring Hill Road 1,100 TKO Suites McLean Hilton Office Complex 7918 Jones Branch Drive 16,900 TPI Group 8230 Leesburg Pike 9,400 United 1 Mortgage Corporation 8100 Boone Boulevard 5,000Vectrus Shenandoah Building 7901 Jones Branch Drive 24,400 Venable 8010 Towers Crescent Drive 3,900Ward & Berry P Pinnacle Towers 1751 Pinnacle Drive 10,500

6 REAL ESTATE REPORT YEAR-END 2020
OFFICE BUILDING SALES OF NOTE DURING SECOND HALF 2020
$650MTOTAL VALUE OF COUNTYWIDE
OFFICE BUILDING SALES – SECOND HALF OF 2020
19 OFFICE BUILDINGS COUNTYWIDE
SOLD IN THE SECOND HALF OF 2020
MONUMENT II12950 Worldgate Drive • Herndon
208,871 square feet / $53,000,000 ($253 psf)
Buyer: Westbrook PartnersSeller: Washington REIT
Washington REIT sold 12950 Worldgate Drive, a 208,871 square foot office building in Herndon to Westbrook Partners, for $53,000,000. Monument II is anchored by Expel and was part of a two-building portfolio sale for a total of $106,000,000.
PATRIOTS PARK12290-12310 Sunrise Valley Drive • Reston
754,587 square feet / $325,000,000 ($431 psf)
Buyer: Boyd Watterson Asset Management Seller: Hyundai Group
Boyd Watterson Asset Management acquired Patriots Park, a Reston office park leased to the Office of the Director of National Intelligence for $325 million. The three-building campus totals more than 700,000 square feet.
FAIRVIEW PARK3150 Fairview Park Drive • Merrifield
257,489 square feet / $90,000,000 ($350 psf)
Buyer: Apollo Global Management Inc.Seller: Clarion Partners
Clarion Partners sold the Fairview Park office building to Apollo Global Management Inc. for $90 million. The 257,489 square foot office building is fully occupied by GDIT.

REAL ESTATE REPORT YEAR-END 2020 7
OFFICE BUILDING DELIVERIES – SECOND HALF 2020 Project Name Address Submarket Square Feet Lead Tenant(s) Delivery
TSA Headquarters 6595 Springfield Center Drive Springfield 625,000 Transportation Security Administration August 2020 Total: 625,000
OFFICE BUILDING DEMOLITIONS/CONVERSIONS – SECOND HALF 2020 Address Submarket Square Feet Demolished
1517 Westbranch Drive Tysons 135,296 October 2020 1860 Michael Faraday Drive Reston 79,500 August 20205205 Leesburg Pike Baileys Crossroads 294,158 December 2020 Total: 508,954
625K SQUARE FEET OF
OFFICE SPACE
DELIVERED IN SECOND HALF
2020
Transportation Security Administration headquarters, courtesy Gensler/Boston Properties
OFFICE BUILDING DELIVERIES AND DEMOLITIONS – SECOND HALF 2020

8 REAL ESTATE REPORT YEAR-END 2020
OFFICE BUILDINGS UNDER CONSTRUCTION – SECOND HALF 2020 Project Name Address Submarket Square Feet Lead Tenant(s) Delivery
Tysons Central 1750 Tysons Central Street Tysons 385,000 Speculative April 2022Capital One 1675 Capital One Drive Tysons 613,000 Capital One June 2022Reston Station 3 1902 Reston Metro Plaza Reston 260,000 ICF August 2021RTC Next A Sunset Hills Road Reston 548,500 Fannie Mae March 2022RTC Next B Sunset Hills Road Reston 674,700 Fannie Mae March 2022Park Center III 4860 Stonecroft Boulevard Chantilly 190,000 General Services Administraton July 2021 2931 Gallows Road Merrifield 3,676 ESB Advertising May 2021 Total 2,674,876
WASHINGTON,D.C.
BurkeSpringfield
Annandale
Reston
Tysons
City ofFairfax
TOWN OFCLIFTON
McLean
CITY OFALEXANDRIA
7
28
MARYLAND
GreatFalls
Chantilly
Centreville
7
Mount Vernon
ARLINGTONCOUNTY
RONALD REAGANWASHINGTON
NATIONAL AIRPORT
Fairfax
Merrifield
Franconia
Town ofVienna
Town ofHerndon
Dulles
50
50
2929
1
City ofFalls Church
236
267
123
FORTBELVOIR
1
PRINCE WILLIAMCOUNTY
LOUDOUN
C
OUNTY
1
Oakton
County Parkway
123
BaileysCrossroads
SevenCorners
Richmond Hwy95
495 395
Newington
Lorton
66FairfaxCenter
Dulles Airport Access & Toll Road
495
66
WASHINGTON DULLESINTERNATIONAL
AIRPORT
7
3
1
5 4
6
2
The first phase of RTC Next contains approximately 1.1 million square feet of office space currently under construction and slated to deliver in 2022. RTC Next will connect Reston Town Center with the future Metro stop.
2.7M AT YEAR-END, 2,674,876
SQUARE FEET OF OFFICE SPACE WAS
UNDER CONSTRUCTION COUNTYWIDE.
1
2
3
4
5
6
7
Capital One Center is currently in the next phase of construction of its 26-acre campus, with 613,000 square feet of office under construction. (Photo courtesy Reston Skylines)
OFFICE CONSTRUCTION ACTIVITY – SECOND HALF 2020

REAL ESTATE REPORT YEAR-END 2020 9
OFFICE CONSTRUCTION ACTIVITY – SECOND HALF 2020
Absorption Available Construction Activity Inventory Total Relet New* Sublet Total Relet New Sublet Underway Delivered
Annandale 1,825,139 8,900 8,900 0 0 253,114 253,114 0 0 0 0Baileys Crossroads 2,946,805 5,014 5,014 0 0 1,208,273 1,208,273 0 0 0 0Burke 531,064 2,722 2,722 0 0 24,527 23,307 0 1,220 0 0Centreville 981,928 12,650 12,650 0 0 74,047 72,047 0 2,000 0 0Chantilly 11,953,922 324,736 322,546 0 2,190 1,687,016 1,605,549 35,000 46,467 190,000 0Dulles 9,926,535 116,574 116,574 0 0 1,620,061 1,525,823 37,968 56,270 0 0Fairfax Center/Oakton 10,418,541 107,266 107,266 0 0 2,258,166 2,070,951 16,780 170,435 0 0Herndon (Town) 5,676,406 48,713 48,713 0 0 808,344 786,784 0 21,560 0 0McLean/Great Falls 4,232,706 22,196 12,417 0 9,779 212,211 212,211 0 0 0 0Merrifield 10,591,863 35,166 31,414 3,752 0 1,324,812 1,261,349 9,200 54,263 3,676 0Newington/Lorton 1,330,539 9,025 9,025 0 0 446,406 166,305 280,101 0 0 0Reston 20,696,689 611,691 395,498 196,000 20,193 2,919,248 2,405,444 154,685 359,119 1,483,200 0Richmond Highway 844,699 18,951 18,951 0 0 93,439 93,439 0 0 0 0Seven Corners 1,007,960 3,424 3,424 0 0 166,647 161,757 0 4,890 0 0Springfield/Franconia 5,663,664 119,289 115,134 0 4,155 875,562 815,588 48,829 11,145 0 625,000 Tysons 28,005,290 406,957 316,653 0 90,304 4,374,830 3,890,294 121,061 363,475 998,000 0Vienna 2,571,708 9,011 9,011 0 0 177,232 165,603 0 11,269 0 0Fairfax County 119,205,458 1,862,285 1,535,912 199,752 126,621 18,523,935 16,717,838 703,624 1,102,113 2,674,876 625,000
Direct w/SubletAnnandale 13.9% ▼ 14.0% ▼Baileys Crossroads 41.0% ▼ 41.0% ▼Burke 4.4% ▼ 4.6% ▼Centreville 7.3% ▼ 7.5% ▼Chantilly 13.7% ▼ 14.1% ▼Dulles 15.8% ▲ 16.3% ▲Fairfax Center/Oakton 20.0% ▲ 21.7% ▲Herndon (Town) 13.9% ▲ 14.2% ▲McLean/Great Falls 5.0% ▲ 5.0% ▲Merrifield 12.0% ▲ 12.5% ▲Newington/Lorton 33.6% ▲ 33.6% ▲Reston 12.4% ▲ 14.1% ▲Richmond Highway 11.1% ▼ 11.1% ▼Seven Corners 16.0% ▼ 16.5% ▼Springfield/Franconia 15.3% ▼ 15.5% ▼Tysons 14.3% ▲ 15.6% ▲Vienna 6.4% ▼ 6.9% ▲Fairfax County 14.6% ▲ 15.5% ▲
Relet Lease Rates New Lease Rates* Sublet Lease RatesAnnandale $15.00–$32.00 nnn NA NABaileys Crossroads $18.00–$26.00 NA NABurke $17.00 nnn–$34.50 fs NA NAChantilly $13.00 nnn–$36.00 fs $28.00–$34.00 fs $19.50–$28.50Dulles $22.00–$40.00 fs $26.50–$35.00 fs $19.00–$22.00Fairfax Center/Oakton $14.00 fs–$35.50 fs NA $18.00 fs–$32.00Herndon $16.00 nnn–$38.00 fs NA $25.50 fs–$33.00 fs
McLean/Great Falls $21.00 fs–$40.00 fs NA NAMerrifield $19.00 mg–$38.50 fs NA $30.00 fs–$32.50 fs
Mount Vernon $12.00 mg–$25.00 nnn NA NANewington/Lorton $15.00 fs–$27.00 fs NA NAReston $17.00 fs–$45.00 fs $38.00–$51.00 fs $17.00fs–$36.00Richmond Highway $12.00–$25.00 fs NA NASeven Corners $14.00–$34.00 fs NA $18.00 mg
Springfield/Franconia $14.00 fs–$36.50 fs NA 20.00 fs
Tysons $23.00 fs–$49.00 fs $40.00–$61.00 fs $21.50 fs–$41.00 fs
Vienna $16.00 nnn–$ 36.00 nnn NA NA
* Includes buildings under construction
OFFICE SPACE INVENTORY BY SUBMARKET (SQUARE FEET) – SECOND HALF 2020
OFFICE LEASE RATES BY SUBMARKET (PER SQUARE FOOT) – SECOND HALF 2020
* Includes buildings under construction
NOTE: The lease rates listed above are based on quoted rates of property available on December 31, 2020. It is important to note that this is just a snapshot of quoted rates at a given point in time and that all rates are subject to change.
For an explanation of lease rates, see glossary on page 13.
OFFICE VACANCY RATE BY SUBMARKET – SECOND HALF 2020
OFFICE MARKET ACTIVITY BY SUBMARKET –SECOND HALF 2020
10 REAL ESTATE REPORT YEAR-END 2020
Direct Direct Standing Vacancy Total New Relet Total Direct New Relet Year Inventory Rate (%) Leased Leased Leased Available Available Available
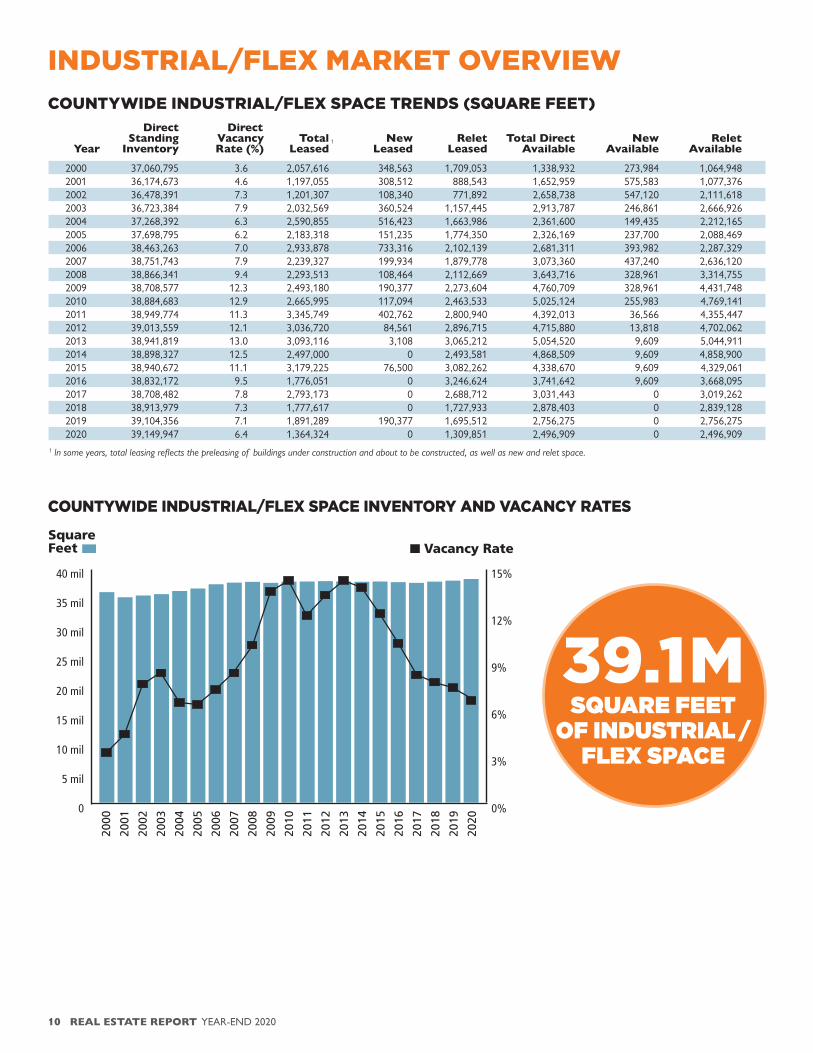
2000 37,060,795 3.6 2,057,616 348,563 1,709,053 1,338,932 273,984 1,064,948 2001 36,174,673 4.6 1,197,055 308,512 888,543 1,652,959 575,583 1,077,376 2002 36,478,391 7.3 1,201,307 108,340 771,892 2,658,738 547,120 2,111,618 2003 36,723,384 7.9 2,032,569 360,524 1,157,445 2,913,787 246,861 2,666,926 2004 37,268,392 6.3 2,590,855 516,423 1,663,986 2,361,600 149,435 2,212,165 2005 37,698,795 6.2 2,183,318 151,235 1,774,350 2,326,169 237,700 2,088,469 2006 38,463,263 7.0 2,933,878 733,316 2,102,139 2,681,311 393,982 2,287,329 2007 38,751,743 7.9 2,239,327 199,934 1,879,778 3,073,360 437,240 2,636,120 2008 38,866,341 9.4 2,293,513 108,464 2,112,669 3,643,716 328,961 3,314,755 2009 38,708,577 12.3 2,493,180 190,377 2,273,604 4,760,709 328,961 4,431,748 2010 38,884,683 12.9 2,665,995 117,094 2,463,533 5,025,124 255,983 4,769,141 2011 38,949,774 11.3 3,345,749 402,762 2,800,940 4,392,013 36,566 4,355,447 2012 39,013,559 12.1 3,036,720 84,561 2,896,715 4,715,880 13,818 4,702,062 2013 38,941,819 13.0 3,093,116 3,108 3,065,212 5,054,520 9,609 5,044,911 2014 38,898,327 12.5 2,497,000 0 2,493,581 4,868,509 9,609 4,858,900 2015 38,940,672 11.1 3,179,225 76,500 3,082,262 4,338,670 9,609 4,329,061 2016 38,832,172 9.5 1,776,051 0 3,246,624 3,741,642 9,609 3,668,095 2017 38,708,482 7.8 2,793,173 0 2,688,712 3,031,443 0 3,019,262 2018 38,913,979 7.3 1,777,617 0 1,727,933 2,878,403 0 2,839,128 2019 39,104,356 7.1 1,891,289 190,377 1,695,512 2,756,275 0 2,756,275 2020 39,149,947 6.4 1,364,324 0 1,309,851 2,496,909 0 2,496,909 1 ln some years, total leasing reflects the preleasing of buildings under construction and about to be constructed, as well as new and relet space.
1
COUNTYWIDE INDUSTRIAL/FLEX SPACE TRENDS (SQUARE FEET)
INDUSTRIAL/FLEX MARKET OVERVIEW
COUNTYWIDE INDUSTRIAL/FLEX SPACE INVENTORY AND VACANCY RATES
0
5 mil
10 mil
15 mil
20 mil
25 mil
30 mil
35 mil
40 mil
0%
3%
6%
9%
12%
15%
Vacancy RateSquareFeet
2000
2001
2002
2003
2004
2005
2006
2007
2008
2009
2010
2011
2012
2013
2014
2015
2016
2017
2018
2019
2020
39.1M SQUARE FEET
OF INDUSTRIAL / FLEX SPACE

REAL ESTATE REPORT YEAR-END 2020 11
TOP TEN INDUSTRIAL/FLEX LEASE DEALS – SECOND HALF 2020 (SQUARE FEET)
INDUSTRIAL/FLEX MARKET – SECOND HALF 2020
The Transportation Security Administration renewed its lease for 103,000 square feet at 13555 EDS Drive in Herndon.
Rahi Systems signed a lease for 35,500 square feet at 13970-14002 Park Center Road in Herndon.
1.36 MSQUARE FEET OF INDUSTRIAL/FLEX
SPACE LEASED COUNTYWIDE IN
2020
Transportation Security Administration / Herndon
Tiles Space Inc / Newington
Rahi Systems / Herndon
Iron Mountain / Newington
Horizon industries / Springfield
Carvana / Newington
Car Collision Center / Newington
Qinetiq / Newington
Tesla Motors / Tysons
Tailored Living / Chantilly
103,500
37,400
35,500
31,700
20,700
13,700
13,10012,700
12,200
11,500

12 REAL ESTATE REPORT YEAR-END 2020
Absorption Available Construction Activity Inventory Total Relet New* Sublet Total Relet New Sublet Underway Delivered
Annandale 91,450 0 0 0 0 0 0 0 0 0 0Baileys Crossroads 318,502 8,955 8,955 0 0 0 0 0 0 0 0Burke 239,924 3,000 3,000 0 0 6,491 6,491 0 0 0 0Chantilly 9,728,571 95,293 95,293 0 0 705,550 677,163 0 28,387 0 0Dulles 1,669,866 8,080 8,080 0 0 172,343 149,355 0 22,988 0 0Fairfax Center/Oakton 43,660 8,245 8,245 0 0 0 0 0 0 0 0Herndon 1,154,782 22,529 22,529 0 0 253,676 228,710 0 24,966 0 0McLean/Great Falls 9,390 0 0 0 0 0 0 0 0 0 0Merrifield 2,545,564 14,489 9,104 0 5,385 187,526 160,852 0 26,674 0 0Newington/Lorton 10,743,543 287,916 238,983 0 48,933 966,780 874,594 0 92,186 0 0Reston 433,775 0 0 0 0 7,176 7,176 0 0 0 0Richmond Highway 32,766 0 0 0 0 0 0 0 0 0 0Seven Corners 35,706 0 0 0 0 0 0 0 0 0 0Springfield/Franconia 10,329,634 54,795 54,795 0 0 323,671 316,391 0 7,280 0 0Tysons 1,118,521 15,828 15,828 0 0 41,177 41,177 0 0 0 0Vienna 418,325 4,807 4,807 0 0 35,000 35,000 0 0 0 0Total 39,149,947 523,937 469,619 0 54,318 2,699,390 2,496,909 0 202,481 0 0
Direct w/SubletAnnandale NA NABaileys Crossroads NA NABurke 2.7%▼ 2.7%▼
Chantilly 7.0%▼ 7.3%▼
Dulles 8.9% ▲ 10.3% ▲Fairfax Center/Oakton NA NAHerndon 19.8% ▲ 22.0% ▲McLean/Great Falls NA NAMerrifield 6.3% ▲ 7.4% ▲Newington/Lorton 8.1%▼ 9.0%▼
Reston 1.7%▼ 1.7%▼
Richmond Highway NA NASeven Corners NA NASpringfield/Franconia 3.1% ▲ 3.1% ▲Tysons 3.7% ▲ 3.7% ▲Vienna 8.4%— 8.4%—Total 6.4%▼ 6.9%▼
Relet Lease Rates New Lease Rates* Sublet Lease RatesAnnandale NA NA NABaileys Crossroads NA NA NABurke $15.00 ig–$16.80 mg NA NAChantilly $7.00 nnn–$22.50 fs NA $13.25 nnn–$18.00Dulles $9.75 nnn–$10.50 nnn NA $11.00 nnn
Fairfax Center/Oakton NA NA NAHerndon $10.00 nnn–$16.50 nnn NA $14.00 fs
McLean/Great Falls NA NA NAMerrifield $14.00 ig–$22.75 ig NA $10.00 nnn–$17.00 fs
Mount Vernon NA NA NANewington/Lorton $6.50 nnn–$26.00 mg NA $12.50 nnn–$16.00 nnn
Reston $19.50 fs NA $17.00 fs–$36.00Richmond Highway NA NA NASeven Corners NA NA NASpringfield/Franconia $6.95 nnn–$19.00 fs NA $16.50 fs
Tysons $14.50 nnn NA NAVienna NA NA NA
* Includes buildings under construction
INDUSTRIAL/FLEX SPACE INVENTORY BY SUBMARKET (SQUARE FEET) – SECOND HALF 2020
INDUSTRIAL/FLEX LEASE RATES BY SUBMARKET (PER SQUARE FOOT) – SECOND HALF 2020
* Includes buildings under construction
NOTE: The lease rates listed above are based on quoted rates of property available on December 31, 2020. It is important to note that this is just a snapshot of quoted rates at a given point in time and that all rates are subject to change.
For an explanation of lease rates, see glossary on page 13.
INDUSTRIAL/FLEX VACANCY RATE BY SUBMARKET – SECOND HALF 2020
INDUSTRIAL/FLEX MARKET ACTIVITY BY SUBMARKET– SECOND HALF 2020

REAL ESTATE REPORT YEAR-END 2020 13
Glossary
Absorption
• Total: The sum of all reported transactions, including new, relet, sublet and pre-leasing. This figure is the total of all leasing activity within the previous six months.
• Relet: Previously occupied space leased.
• New: Newly constructed space leased.
• Sublet: Leased space, via an existing tenant and not the landlord.
Deliveries
Buildings for which a certificate of occupancy has been issued. This figure is for the previous six months only.
Inventory
Office: The total amount of existing rentable square feet. All buildings, including commercial condominiums, owner-occupied properties and single-tenant buildings are included.
Industrial/Flex: The total amount of existing rentable square feet. All buildings, including com-mercial condominiums, owner-occupied properties and single-tenant buildings are included.
LEED
Leadership in Energy and Environmental Design (LEED) is a green building certification system developed in 2000 by the U.S. Green Building Council to verify that commercial and residential buildings are designed, constructed, operated and renovated in environmentally sustainable and efficient ways. LEED ratings are Certified, Silver, Gold and Platinum, which are awarded to a project based on a 100-point scale. For details, visit www.usgbc.org.
Leases
Full-Service (FS) Leases: Sometimes referred to as Gross Rent. This rate includes operating expenses, common area maintenance (CAM), real estate taxes and insurance for which the landlord is responsible. A tenant may pay for increases in these costs over a base year, which is stipulated in a lease. Most common for office leases.
Industrial Gross (IG) Leases: Base rent includes insurance and real estate taxes with tenant respon-sible for increases over this base year. Tenant is also responsible for the CAM charge.
Modified Gross (MG) Leases: Similar to a full-service lease, but some base services are not included. Typically, maintenance, janitorial and utilities are excluded. Covered expenses are controlled by either a base year or an expense stop. Most common in medical office buildings or single-story, multi-tenant buildings.
Net Leases: The tenant is responsible for some or all of the operating expenses, such as real estate taxes, insurance, utilities and CAM charges. Most common for industrial/flex leases. The primary types of Net Leases are:
• Net (N): In addition to rent, tenant typically pays for utilities.
• Double Net (NN): In addition to rent, tenant typically pays for utilities and cleaning.
• Triple Net (NNN): Sometimes referred to as a Pure Net Lease, in which the tenant is re-sponsible for all or almost all of the operating expenses, such as utilities, CAM, real estate taxes and insurance.
WASHINGTON,D.C.
BurkeSpringfield
Annandale
Reston
Tysons
City ofFairfax
TOWN OF CLIFTON
McLean
CITY OFALEXANDRIA
7
28
MARYLAND
GreatFalls
Chantilly
Centreville
7
Mount Vernon
3
5 4
ARLINGTONCOUNTY
RONALD REAGANWASHINGTON
NATIONAL AIRPORT
Fairfax
Merrifield
Franconia
5
4
15
3
Town ofVienna
Town ofHerndon
Dulles
50
50
2929
1
City ofFalls Church
14
236
267
123
2
FORTBELVOIR
1
PRINCE WILLIAMCOUNTY
LOUDOUN
C
OUNTY
1
8
Oakton
County Parkway
123
1
BaileysCrossroads
2
SevenCorners
Richmond Hwy 1395
495 395
10
Newington
Lorton
16
66
6
FairfaxCenter
Dulles Airport Access & Toll Road
4
5
1 2 3
495
66
7
17
912
11
6
WASHINGTON DULLESINTERNATIONAL
AIRPORT
7 8 9
10
6 McLean 7 Tysons 8 Greensboro 9 Spring Hill10 Wiehle-Reston East
1 Huntington2 Franconia-Springfield3 West Falls Church4 Merrifield/Dunn Loring5 Vienna/Fairfax/George Mason University
Fairfax County Submarket Map
Space Available
• Total: Sum of relet, new and sublet available space.
• Relet: Previously occupied available space.
• New: Newly constructed available space.
• Sublet: Available space, via an existing tenant and not the landlord. May or may not be occupied.
Under Construction
Buildings where construction has begun as evidenced by site work such as excavation or foundation placement. Site grading and demolition of existing structures do not meet these criteria. This figure is for the previous six months only.
Vacancy Rates
• Direct: The direct vacancy rate is total direct avail-able space divided by the inventory. Direct available space consists of space, new or relet, that is available directly through the landlord and not a third party such as an existing tenant. Buildings under construc-tion are not included in this figure.
• Sublet: The sublet vacancy rate is the aggregate of direct available space plus sublet available space available divided by the inventory. As such, the sublet vacancy rate will always be equal to or higher than the direct vacancy rate. Buildings under construc-tion are not included in this figure.
USING THIS REPORT

REAL ESTATE REPORT PRODUCTION TEAM
Stephen Tarditi, Content Valentine W. Southall, Research and Photography
Vicki Reeve Jackson, Graphic Designer
FAIRFAX COUNTY BOARD OF SUPERVISORS
Walter L. Alcorn • John W. Foust • Pat HerrityRodney L. Lusk • Dalia A. Palchik • Kathy L. Smith
Daniel G. Storck • James R. Walkinshaw
FCEDA SENIOR STAFFVictor Hoskins, President and CEOAlex Iams, Executive Vice President
Alan A. Fogg, Vice President, CommunicationsDonna Hurwitt, Vice President, Operations
Catherine W. Riley, Vice President, Business Investment Michael Batt, Director, Talent Initiative
David Kelley, Director, National Business InvestmentJan Mul, Director, International Business InvestmentConnie Royal, Director, Protocol and Special Events
Karen Smaw, Director, Diversity Business Investment and Entrepreneurship
Stephen Tarditi, Director, Market IntelligenceSandra White, Director, Operations and HR
Cheryl Martelli, Executive Assistant
FCEDA BOARD
Catherine Lange Chairman
James Quigley Vice Chairman
Ronald C. Johnson Secretary
Steven Partridge Treasurer
Linnie Haynesworth
Roderick (Rocky) Mitchell
Rick Wagner
Jeffrey C. McKayChairman
Penelope A. GrossVice Chairman
FAIRFAX COUNTY ECONOMIC DEVELOPMENT AUTHORITY (FCEDA) promotes Fairfax County as one of the world’s best business locations. The FCEDA’s free services can help you take advantage of the unlimited possibilities in Fairfax County. We have comprehensive,
up-to-date data on labor force trends, taxes, utilities, real estate, housing and meeting accommodations, along with scores of other facts and figures to help businesses grow and prosper. We can also help you navigate the county’s regulatory and zoning policies and procedures.
Contact the FCEDA today to help you locate the perfect office or industrial space for your new or growing business. 8300 Boone Boulevard, Suite 450, Tysons, Virginia 22182 USA • 703-790-0600 • [email protected] • fairfaxcountyeda.org • @FairfaxEDA
fairfaxcountyeda.org@FairfaxEDA
8300 Boone Boulevard, Suite 450, Tysons, Virginia 22182 USA +1 703-790-0600 | [email protected]
Offices in Bangalore/Mumbai, Berlin, London, Los Angeles, Seoul and Tel Aviv