Fairfax County Comprehensive Transit Plan - Technical …€¦ · Fairfax County Comprehensive...
15
FAIRFAX COUNTY DEPARTMENT OF TRANSPORTATION: FAIRFAX CONNECTOR Comprehensive Transit Plan Technical Memorandum 8: Prioritization and Programming of Proposed Improvements October 29, 2015 Prepared for: Fairfax County Department of Transportation By: and In association with: WBA Research
Transcript of Fairfax County Comprehensive Transit Plan - Technical …€¦ · Fairfax County Comprehensive...

FAIRFAX COUNTY DEPARTMENT OF TRANSPORTATION:
FAIRFAX CONNECTOR
Comprehensive Transit Plan
Technical Memorandum 8: Prioritization and Programming of
Proposed Improvements
October 29, 2015
Prepared for:
Fairfax County Department of Transportation
By:
and
In association with:
WBA Research

Contents
8. Prioritization and Programming of Proposed Improvements ....................................... 8-2 8.1. Prioritization Process ................................................................................................................................. 8-2 8.2. Ridership Estimation ................................................................................................................................... 8-3 8.3. Cost Estimation ........................................................................................................................................... 8-4 8.4. Recommendations Previously Programmed ......................................................................................... 8-4 8.5. Ratings of the Recommendations ............................................................................................................ 8-6 8.6. Metrobus Projects ..................................................................................................................................... 8-10 8.7. Vehicle Requirements and Garage Capacity ....................................................................................... 8-13
Fairfax County Comprehensive Transit Plan
October 2015 8-2
8. Prioritization and Programming of Proposed Improvements
8.1. Prioritization Process
The development of this Comprehensive Transit Plan (CTP) included a review of existing services and
the creation of numerous individual recommendations to improve existing routes and add new routes.
These recommendations were developed and refined in consultation with County staff, the Technical
Advisory Group (TAG), other regional partners, and the public. The outreach process and the service
recommendations themselves are documented in separate technical memoranda.
After the list of recommendations was finalized, the study team estimated the operating costs and
ridership impacts for each of the changes. The results were then used to rate and rank the
recommendations. The 10-year CTP is not cost-constrained; the six-year Transit Development Plan
(TDP), created in a parallel process, is cost-constrained per Virginia Department of Rail and Public
Transportation (DRPT) guidelines. The first six years of the CTP match the recommendations of the
TDP and are therefore limited by funding that is anticipated to be available. The remaining projects –
those not proposed to be funded within the TDP period – were rated in terms of priority, but not
programmed by year.
At the time of the prioritization, the Fairfax County Department of Transportation (FCDOT) had
already programmed several route improvements for FY2016 and FY2017; these changes were not part
of the rating process. Route changes that are related to the Silver Line Phase 2 opening in FY2020 were
programmed for that year and were also not rated.
The remaining recommendations were coded by type of improvement using the categories in Table 8-1.
Generally Type 1 recommendations (fix problems) generally rated highly because they consist primarily
of lower-cost improvements that respond to specific problems associated with existing bus service.
Table 8-1: Types of Recommendations
# Type Description
1 Fix problems Reduce crowding, adjust the schedule, reduce unproductive service, or make
small alignment changes to existing routes.
2 Improve existing Improve span or frequency of existing route (including new evening,
Saturday, or Sunday service), generally to make route closer to service
guidelines or to accommodate future expected ridership.
3 New connection New route that permits a one-seat connection between major nodes in the
County that cannot now be easily made by transit.
4 New area Service to parts of the county that do not currently have bus service.
The ratings were developed using the following methodology:
1. Calculate average subsidy per boarding as forecast net operating cost (operating cost less fare
revenue) per forecast riders for each route.
2. Calculate incremental subsidy per boarding as change in net operating cost per change in
boardings. This measure is not defined for new routes.
3. Determine a “Priority A” cost-effectiveness rating based on average cost per boarding where
High is ≤ $10; Medium is <$20 and >$10; Low is ≥ $20.

Fairfax County Comprehensive Transit Plan
October 2015 8-3
4. Determine a “Priority B” cost-effectiveness rating based on incremental cost per boarding using
the same thresholds as for Priority A (High is ≤ $10; Medium is <$20 and >$10; Low is ≥ $20).
5. Determine a final priority rating based on the Priority A rating modified as follows: Routes that
had overall low cost-effectiveness (Priority A), but whose incremental improvement in cost
effectiveness (Priority B) was high (meaning the route would see a significant boost as a result of
the proposed improvement) had their final rating upgraded from low to medium or from
medium to high. Similarly, if the incremental cost effectiveness (Priority B) of a change was low,
then a recommendation with a high Priority A rating was downgraded to the medium group, and
a medium-ranking recommendation to the low group.
6. Program projects for FY2018 and FY2019. For FY2018, 10 low-cost and cost-saving projects
were selected, six of which were the “Fix Problems” type and three of which were the
“Improve Existing” type (as defined previously). All of these 10 projects had a “high” rating,
except for one that was rated “medium.”
The following sections describe the development of ridership and cost estimates that were used as
inputs to the rating process and the use of the ratings to program projects not previously programmed
for a specific year.
8.2. Ridership Estimation
Route-level ridership estimates for proposed changes (or new routes) were developed using a variety of
techniques depending on the type of recommendation. The following is a summary of the techniques
used relative to the type of improvement proposed:
Changes in headway – The impact of headway changes was estimated using industry-standard
elasticities drawn from the TCRP Report 95, Traveler Response to Transportation System Changes,
Chapter 9. Midpoint arc elasticities were applied to the existing ridership during the relevant
time period for the proposed headway change to estimate the future ridership.
Changes in span of service – The impact of the extension of service into a new time
period—be it midday, evening, or weekend—was estimated using ratios of ridership in the new
time period to ridership in the existing time period. These ratios were drawn from routes
operating in the same area with similar service levels. If there were no analogous routes, then
the ratios were based on typical industry experience.
New routes – The ridership on an entirely new service is necessarily more speculative.
Whenever possible, the productivity of a similar route serving a similar area was used as the
basis for the estimate. That productivity was then multiplied by the projected number of
revenue hours to produce a ridership estimate.
Multiple changes – In some cases, a route was being changed in more than one way, such as
revised headways and a new alignment, and perhaps a new span as well. In addition, routes in
the northwestern part of the county were strongly affected by the Silver Line Phase 2
implementation. The impacts of each of these changes were accounted for separately. For
instance, Route 950 is expected to lose many riders to the Silver Line when Phase 2 opens
(specifically, those who currently ride between Herndon-Monroe and Wiehle-Reston East
Metrorail station), but it will gain riders from Route 505, which it is recommended to absorb.
The headway will also be improved. Thus it was necessary to take account of all of these factors
in order to estimate the total ridership impact of the recommendations.

Fairfax County Comprehensive Transit Plan
October 2015 8-4
The ridership estimates were based on current-year base ridership; that is, without adjusting for any
potential background increase in transit demand over time (e.g., due to population growth). This was
necessary because it was not known initially in which year the changes would be implemented. Equally
importantly, it was important to separate the ridership effects of the recommendations from those of
background growth in transit demand. Existing route-level ridership was taken from September 2014
farebox data for Fairfax Connector and from automatic passenger counter averages for the fall quarter
of 2014 for Metrobus.
8.3. Cost Estimation
The cost for each of the recommendations was calculated by subtracting the current cost of service on
a route from the estimated future cost based on the proposed operating parameters. If the
recommendation was a wholly new route, then the full cost of the future service was used. The cost of
existing service was based on FCDOT figures on daily revenue hours by route for May 2015. These daily
hours for Saturdays, Sundays, and weekdays were annualized by multiplying by the number of days of
each type per year. For Metrobus routes, revenue hours of service was available only at the line level.
Where changes were proposed for only one route within a line, the incremental change in revenue
hours was calculated using the change in service rather than by subtracting existing service from future
service. For example, if the proposal was to increase weekday service by four round-trips, the revenue
hours for those four round-trips was calculated directly from the schedule, and that figure was the basis
of the incremental service cost.
The annual operating cost estimate for each recommendation was calculated by multiplying the net
change in annual revenue hours by the current operating cost of $103.04 per revenue hour (for Fairfax
Connector routes) or $144.22 per revenue hour (for Metrobus routes), as shown in Table 8-2 below.
The difference in the cost per revenue hour rates between the two systems can be attributed to the
difference in business models. WMATA directly operates the Metrobus service; the Fairfax Connector is
operated by a contractor.
To derive the net cost of each recommendation, the estimated change in fare revenue was subtracted
from the incremental change in operating cost. The fare revenue was calculated by multiplying the
change in ridership (forecast less existing) by an average fare revenue of $1.21 per boarding (for Fairfax
Connector) or $1.12 per boarding (for Metrobus).
Table 8-2: Assumptions Used in Cost Estimates
Operating Cost per
Revenue Hour
(2015)
Passenger Revenue per
Boarding (2015)
Fairfax Connector $103.04 $1.21
Metrobus $144.22 $1.12
8.4. Recommendations Previously Programmed
As mentioned above, a number of recommendations that were developed during the CTP/TDP process
were already programmed by FCDOT for the coming two years. For FY2016, which was already
underway as the study was being completed, the program included improvements to Routes 109,
151/152, and the 620-650 series. These projects are:

Fairfax County Comprehensive Transit Plan
October 2015 8-5
Route 109 – Add Sunday service.
Route 151 – Improve headways from 60 to 30 minutes for weekday midday and weekends.
Route 152 – Add selected off-peak trips.
Routes 621, 630, 640, and 650 - Add weekend service and adjust the schedule to improve
reliability.
Route 624/634 – Create two new routes to supplement existing routes 631 and 632 to serve
the newly expanded Stringfellow Road Park and Ride.
As shown in Table 8-3, these improvements together are expected to increase ridership by 444,000
boardings per year and are expected to cost an additional $3.35 million in annual operating subsidies.
Table 8-3: Recommendations Programmed for FY2016
Route Number
Existing Cost Proposed Cost Existing Ridership
Forecast Ridership
Change in Riders
Change in Operating Cost
Change in Net Cost
109 $1,202,742 $1,336,159 153,004 159,274 6,270 $133,417 $125,830 151 $1,955,231 $2,902,998 401,195 497,353 96,158 $947,766 $831,415 152 $1,742,103 $1,831,289 192,528 197,628 5,100 $89,186 $83,015 621 $453,302 $895,429 64,171 105,129 40,958 $442,127 $392,568 630 $427,653 $625,007 55,947 90,371 34,424 $197,354 $155,700 640 $324,011 $804,704 26,928 43,998 17,070 $480,693 $460,039 650 $364,316 $1,001,454 56,738 91,325 34,587 $637,138 $595,287
624/634 $0 $960,753 - 209,610 209,610 $960,753 $707,125 TOTAL $6,469,359 $10,357,793 950,510 1,394,688 444,177 $3,888,433 $3,350,979
For FY2017, FCDOT has proposed improvements to Route 321/322 plus the addition of new routes
308, 313, and 451. These improvements are:
Route 313 - Create a new cross-county route between the Franconia-Springfield Metrorail/VRE
Station and Fair Oaks/Fairfax County Government Center via Fairfax County Judicial Center.
Route 308 - Create a new cross-county route between the Franconia-Springfield Metrorail/VRE
Station and Mount Vernon Hospital via Beulah Road and Telegraph Road.
Route 321/322 – Streamline the route alignment; improve weekday peak headways; add late
evening service.
Route 451 – Create a new route, the Merrifield Circulator, to serve new development south of
the Dunn Loring Metrorail Station.
As shown in Table 8-4, these changes together are expected to increase annual ridership by 428,000
boardings and are expected to require $4.7 million in additional operating subsidy.
Table 8-4: Projects Programmed for FY2017
Route Number
Existing Cost Proposed Cost
Existing Ridership
Forecast Ridership
Change in Riders
Change in Operating
Cost
Change in Net Cost
308 $0 $1,539,150 - 145,750 145,750 $1,539,150 $1,362,793 313 $0 $1,643,548 - 82,000 82,000 $1,643,548 $1,544,328 451 $0 $541,269 - 61,200 61,200 $541,269 $467,217
321/322 $2,877,471 $4,375,842 510,165 649,295 139,130 $1,498,371 $1,330,024 TOTAL $2,877,471 $8,099,809 510,165 938,245 428,080 $5,222,338 $4,704,361

Fairfax County Comprehensive Transit Plan
October 2015 8-6
The Service Recommendations Technical Memorandum also identified 20 separate route changes
intended to complement the opening of Silver Line Phase 2 service, currently expected for FY2020.
These recommendations are:
Eliminate selected routes that will be covered by the extended Silver Line or new/expanded bus
routes (Routes 505, 926, 980, 981, 985);
Streamline existing routes (Routes 574, 983);
Expand coverage in Herndon (Routes 921, 922, 954);
Modify existing routes to connect to the new stations and/or improve levels of service (Routes
585, 605, 924, 927, 929, 950, 951, 952).
As shown in Table 8-5, the recommended changes related to the Silver Line Phase 2 opening will result
in an increase of about 175,000 riders on the improved and new bus routes in the corridor. Of course,
bus riders on the eliminated routes (especially 980, 981, and the truncated 983) will become Silver Line
riders, resulting in an overall corridor decline in bus boardings, more than made up for by the
anticipated increase in Silver Line boardings. The total cost of these changes, combining both service
increases and decreases, is expected to require a $2.35 million increase in annual operating subsidy.
Table 8-5: Projects Programmed for FY2020, with Silver Line Phase 2
Route Number
Existing Cost Proposed Cost Existing Boardings
Forecast Boardings
Change in Boardings
Change in Operating
Cost
Change in Net Cost
505 $1,278,850 $0 140,724 - (140,724) ($1,278,850) ($1,108,574)
574 $1,583,450 $1,637,994 115,281 107,541 (7,740) $54,544 $63,909
585 $466,769 $1,125,840 68,085 116,025 47,940 $659,071 $601,063
605 $1,556,703 $2,172,851 133,868 179,543 45,675 $616,148 $560,881
921 $0 $573,188 - 55,530 55,530 $573,188 $505,997
922 $0 $573,188 - 55,530 55,530 $573,188 $505,997
924 $406,454 $1,000,048 57,108 104,280 47,172 $593,594 $536,516
926 $344,949 $0 26,100 - (26,100) ($344,949) ($313,368)
927 $212,256 $669,865 33,915 73,855 39,940 $457,609 $409,281
929 Ph. 2 $514,994 $963,459 50,235 84,660 34,425 $448,465 $406,811
950 $3,012,381 $3,590,595 867,074 868,907 1,833 $578,215 $575,997
951 $249,682 $608,928 28,050 30,600 2,550 $359,245 $356,160
952 $339,191 $608,928 30,090 32,640 2,550 $269,737 $266,651
954 $0 $378,888 - 38,250 38,250 $378,888 $332,606
980 $566,366 $0 346,290 - (346,290) ($566,366) ($147,355)
981 $583,325 $0 57,459 - (57,459) ($583,325) ($513,800)
983 $1,888,002 $1,260,839 165,836 55,388 (110,449) ($627,163) ($493,521)
985 $376,419 $0 21,517 - (21,517) ($376,419) ($350,383)
RIBS 1 $1,547,331 $1,624,948 155,196 155,196 0 $77,617 $77,617
RIBS 3 $1,546,186 $1,624,761 178,752 178,752 0 $78,575 $78,575
TOTAL $16,473,306 $18,414,319 2,475,580 2,136,697 (338,883) $1,941,013 $2,351,062
8.5. Ratings of the Recommendations
The remaining recommended Fairfax Connector route improvements and new routes identified in the
Service Recommendations Technical Memorandum were rated based on cost effectiveness: the net cost
per rider and change in net cost per rider. The net cost per rider is calculated as the total annual
operating cost less the total annual fare revenue divided by the total annual ridership. The change in net

Fairfax County Comprehensive Transit Plan
October 2015 8-7
cost per rider represents the same ratio, but for the increment between the proposed future service
and the present-day service. These measures are equivalent for any wholly new routes.
There were several route-level changes in the Service Recommendations that must be implemented in
conjunction with another route change, either because they involve moving one part of a route
alignment to another route or because the routes are operationally conjoined (for example, all buses
operating on Route 161 also operate 162 in an alternating pattern). For the purposes of rating the
recommendations, the routes listed in Table 8-6 were packaged together.
Table 8-6: Routes Combined for Rating
Route Numbers
161/162
171/172
231/232
305/372/373
321/322
333/340/341
401/402/401L/402L
624/634
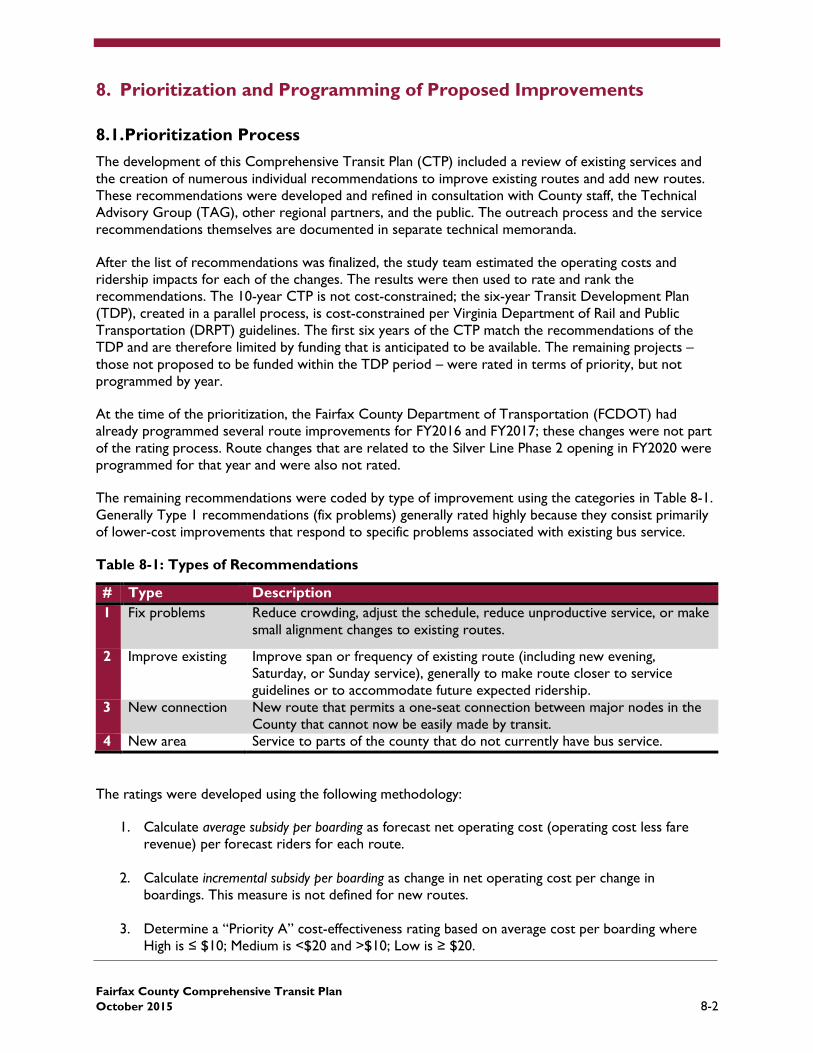
Table 8-7 lists, by route number, the recommendations not included in the previous section (that is, not
programmed for FY2016, FY2017, or FY2020), showing both existing and forecast operating costs and
ridership, and the calculation of net operating costs (operating subsidy).
Fairfax County Comprehensive Transit Plan
October 2015 8-8
Table 8-7: Service Recommendations Not Programmed for FY2016, FY2017, or FY2020
Route Number
Type Existing Cost Proposed Cost
Existing Boardings
Forecast Boardings
Change in Cost
Change in Boardings
Net Operating Costs
101 1 $1,225,500 $1,265,133 181,715 181,715 $39,632 - $1,045,257
161/162 1 $1,808,764 $1,846,683 293,610 267,215 $37,919 (26,395) $1,523,353
171/172 2 $4,306,678 $5,241,254 1,101,081 1,111,536 $934,576 10,455 $3,896,296
231/232 1 $1,174,868 $1,210,639 134,117 134,117 $35,770 - $1,048,357
305/372/373 1 $1,793,055 $1,899,854 179,890 196,465 $106,800 16,575 $1,662,132
315 3 $0 $1,643,548 - 88,690 $1,643,548 88,690 $1,536,233
333/340/341 1 $553,541 $1,010,369 89,735 102,000 $456,828 12,266 $886,949
334 1 $797,727 $826,274 42,725 52,585 $28,546 9,860 $762,646
335 2 $405,178 $520,972 54,022 56,572 $115,794 2,550 $452,520
395 1 $589,951 $757,777 127,730 127,730 $167,825 - $603,224
401/402(+L) 2 $6,658,562 $8,824,655 1,536,276 1,626,036 $2,166,092 89,760 $6,857,151
463 1 $1,732,730 $1,672,787 101,081 138,056 ($59,943) 36,975 $1,505,739
464 4 $0 $202,976 - 28,000 $202,976 28,000 $169,096
466 1 $257,011 $595,396 49,215 91,290 $338,385 42,075 $484,935
496 3 $0 $2,561,583 - 344,000 $2,561,583 344,000 $2,145,343
552 2 $359,082 $347,314 40,800 41,820 ($11,768) 1,020 $296,712
607 3 $0 $1,810,651 - 82,000 $1,810,651 82,000 $1,711,431
610 Ph. 1 3 $0 $1,732,061 - 122,400 $1,732,061 122,400 $1,583,957
610 Ph. 2 3 $1,732,061 $2,293,071 122,400 145,750 $561,010 23,350 $2,116,713
622 2 $323,750 $449,178 54,570 66,045 $125,429 11,475 $369,264
623 2 $393,891 $494,134 117,938 143,438 $100,243 25,500 $320,574
625 4 $0 $243,571
42,840 $243,571 42,840 $191,735
631 1 $426,344 $776,045 120,437 151,037 $349,700 30,600 $593,290
632 2 $494,130 $756,649 123,254 148,754 $262,519 25,500 $576,656
641 2 $538,623 $727,781 71,171 86,471 $189,158 15,300 $623,152
642 2 $601,698 $1,076,975 114,521 137,471 $475,277 22,950 $910,636
644 2 $510,095 $717,001 109,829 122,579 $206,906 12,750 $568,681
651 2 $472,146 $962,106 76,067 99,017 $489,960 22,950 $842,296
652 2 $477,118 $905,724 75,531 98,481 $428,605 22,950 $786,562
724 1 $322,717 $304,464 14,535 11,985 ($18,253) (2,550) $289,962
724 Flex 4 $0 $175,912 - 6,120 $175,912 6,120 $168,507
734 1 $229,821 $676,586 6,120 12,750 $446,765 6,630 $661,159
901 3 $0 $1,810,651 - 99,950 $1,810,651 99,950 $1,689,712
924 Ph. 2 2 $970,920 $1,208,489 104,280 113,835 $237,569 9,555 $1,070,749
929 2 $545,690 $498,870 46,410 50,235 ($46,820) 3,825 $438,085
929 Ph. 3 4 $935,397 $1,039,237 84,660 87,210 $103,840 2,550 $933,713
929 Ph. 4 2 $1,008,968 $1,129,172 87,210 97,810 $120,205 10,600 $1,010,822
Flex 1 4 $0 $757,777 - 42,840 $757,777 42,840 $705,940
Flex 2 4 $0 $757,777 - 42,840 $757,777 42,840 $705,940
Flex 3 4 $0 $757,777 - 57,120 $757,777 57,120 $688,662
RIBS 2 3 $588,167 $558,638 40,390 58,540 ($29,529) 18,150 $487,805
TOTAL
$32,234,186 $53,047,509 5,301,316 6,715,341 $20,813,324 1,414,026 $44,921,947
The application of ratings (high, medium, low) for each project is shown in Table 8-8.

Fairfax County Comprehensive Transit Plan
October 2015 8-9
Table 8-8: Rating of Recommendations
Route Number
Type Avg Subsidy
per Boarding
Incr. Subsidy
per Boarding
Priority A:
Average Subsidy
Priority B: Incremental
Subsidy
Rating Year Programmed
623 2 $2.23 $2.72 H H H 2018
552 2 $7.09 -$12.75 H H H 2018
RIBS 2 3 $8.33 -$2.84 H H H 2018
929 2 $8.72 -$13.45 H H H 2018
161/162 1 $5.70 -$2.65 H H H 2018
101 1 $5.75
H
H 2018
231/232 1 $7.82
H
H 2018
463 1 $10.91 -$2.83 M H H 2018
334 1 $14.50 $1.69 M H H 2018
724 1 $24.19 $5.95 L H M 2018
625 4 $4.48 $4.48 H H H 2019
466 1 $5.31 $6.83 H H H 2019
622 2 $5.59 $9.72 H H H 2019
464 4 $6.04 $6.04 H H H 2019
305/372/373 1 $8.46 $5.23 H H H 2019
632 2 $3.88 $9.08 H H H 2019
496 3 $6.24 $6.24 H H H
171/172 2 $3.51 $88.18 H L M 2019
631 1 $3.93 $10.22 H M M
401/402L 2 $4.22 $22.92 H L M
644 2 $4.64 $15.02 H M M
642 2 $6.62 $19.50 H M M
641 2 $7.21 $11.15 H M M
652 2 $7.99 $17.47 H M M
335 2 $8.00 $44.20 H L M
651 2 $8.51 $20.14 H L M
333/340/341 1 $8.70 $36.03 H L M
924 Phase 2 2 $9.41 $23.65 H L M
929 Phase 4 2 $10.33 $10.13 M M M
Flex 3 4 $12.06 $12.06 M M M
610 phase 2 3 $14.52 $22.82 M L M
Flex 1 4 $16.48 $16.48 M M M
Flex 2 4 $16.48 $16.48 M M M
901 3 $16.91 $16.91 M M M
315 3 $17.32 $17.32 M M M
610 Phase 1 3 $12.94 $12.94 M M M
395 1 $4.72
H
L
929 Phase 3 4 $10.71 $39.51 M L L
607 3 $20.87 $20.87 L L L
724 Flex 4 $27.53 $27.53 L L L
734 1 $51.86 $66.18 L L L
Note: H=High, M=Medium, L=Low
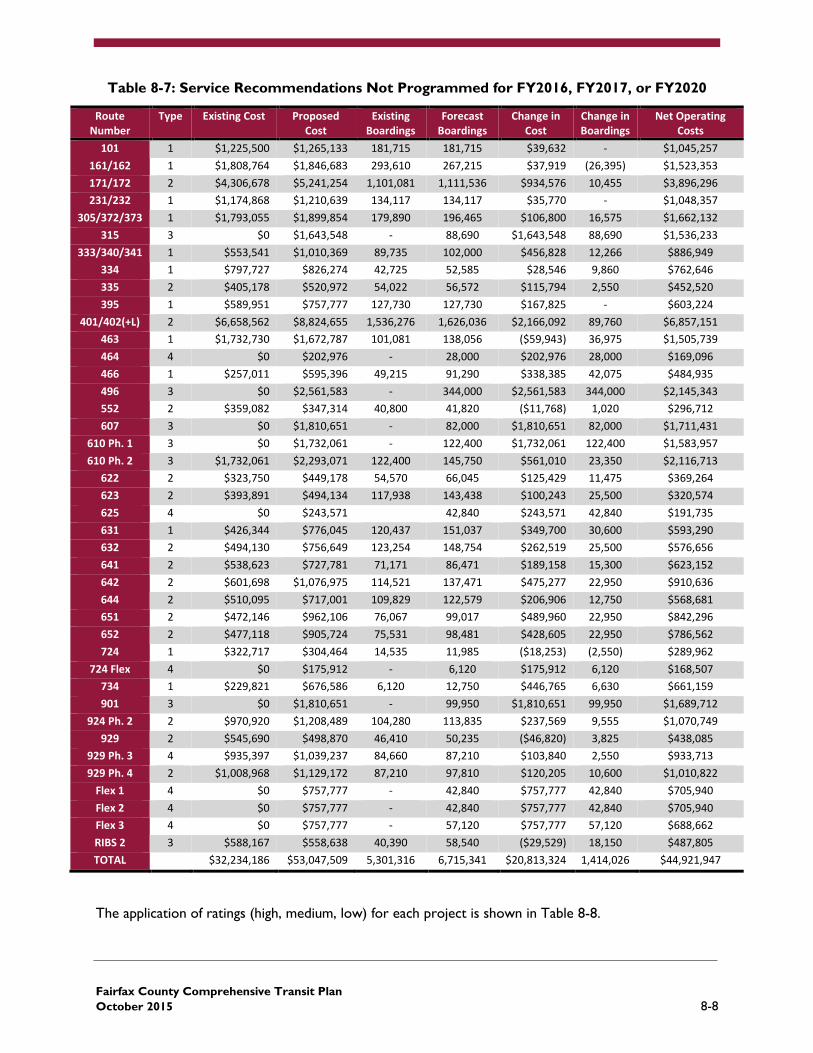
Table 8-9 summarizes the projects recommended to be implemented in FY2018 and shows that the net
cost of the changes will be very small, with a modest increase in ridership of about 66,000 boardings per
year.
Fairfax County Comprehensive Transit Plan
October 2015 8-10
Table 8-9: Proposed Projects for FY2018
Route Number
Project Type
Existing Cost Proposed Cost
Existing Boardings
Forecast Boardings
Change in Boardings
Change in Operating
Cost
Change in Net Cost
101 1 $1,225,500 $1,265,133 181,715 181,715 - $39,632 $39,632
161/162 1 $1,808,764 $1,846,683 293,610 267,215 (26,395) $37,919 $69,857
231/232 1 $1,174,868 $1,210,639 134,117 134,117 - $35,770 $35,770
334 1 $797,727 $826,274 42,725 52,585 9,860 $28,546 $16,616
463 1 $1,732,730 $1,672,787 101,081 138,056 36,975 ($59,943) ($104,683)
552 2 $359,082 $347,314 40,800 41,820 1,020 ($11,768) ($13,002)
623 2 $393,891 $494,134 117,938 143,438 25,500 $100,243 $69,388
724 1 $322,717 $304,464 14,535 11,985 (2,550) -$18,253 -$15,168
929 2 $545,690 $498,870 46,410 50,235 3,825 -$46,820 -$51,448
RIBS 2 3 $588,167 $558,638 40,390 58,540 18,150 -$29,529 -$51,490
TOTAL
$8,949,136 $9,024,934 1,013,321 1,079,706 66,385 $75,798 -$4,528
As shown in Table 8-10, for FY2019 seven projects are proposed, consisting of all but one of the
remaining high-rated projects, plus one medium-rated project. These projects include two “Fix
Problems” projects: expanded service on three routes (171/172, 622, and 632), and two new routes
(464 and 625). The projects combined will require a $2.0 million annual increase in operating subsidy.
Table 8-10: Proposed Projects for FY2019
Route Number
Project Type
Existing Cost
Proposed Cost
Existing Boardings
Forecast Boardings
Change in Boardings
Change in Operating
Cost
Change in Net Cost
171/172 2 $4,306,678 $5,241,254 1,101,081 1,111,536 10,455 $934,576 $921,925 305/372/373 1 $1,793,055 $1,899,854 179,890 196,465 16,575 $106,800 $86,744
464 4 $0 $202,976
28,000 28,000 $202,976 $169,096 466 1 $257,011 $595,396 49,215 91,290 42,075 $338,385 $287,475 622 2 $323,750 $449,178 54,570 66,045 11,475 $125,429 $111,544 625 4 $0 $243,571
42,840 42,840 $243,571 $191,735
632 2 $494,130 $756,649 123,254 148,754 25,500 $262,519 $231,664 TOTAL
$7,174,624 $9,388,879 1,508,010 1,684,930 176,920 $2,214,255 $2,000,182
For FY2021 and beyond, no specific projects have yet been programmed. Instead, the County should
consider the ratings calculated here as one element of its decision on which route improvements to
implement as funding becomes available. Other considerations should include geographic balance of
improvements as well as any changes that will have occurred, such as new land development projects
completed, new major employers, etc.
8.6. Metrobus Projects
The CTP/TDP included a comprehensive review of all WMATA Metrobus routes that operate within
Fairfax County. A number of modifications of routes were suggested and two new inter-state routes
were recommended in consultation with WMATA staff. However, WMATA, in conjunction with Fairfax
County and other affected jurisdictions, will ultimately decide on when—and whether—to implement
these recommendations. WMATA periodically conducts a “State of Good Operations” (SOGO) process
that recommends changes to bus service designed to produce more efficient use of available resources.
In September 2015, WMATA put forward the following proposals that affect service in Fairfax, for
implementation in January 2016:

Fairfax County Comprehensive Transit Plan
October 2015 8-11
1A,B,E,Z Wilson Boulevard-Vienna Line: Change 1Z trips to 1A and eliminate 1Z
designation; change route 1B to bypass Seven Corners Shopping Center, Eliminate route 1E (by
Dominion Hills). This change was also recommended by the CTP.
1C Fair Oaks-Dunn Loring Line: Add additional time to weekday, Saturday, and Sunday
schedules.
2B Fair Oaks-Jermantown Road Line: Add service on Sunday at 60 minute headways. This
change was also recommended by the CTP.
2T Tysons Corner-Dunn Loring Line: Eliminate Sunday service.
3T Pimmit Hills Line: Eliminate the section between East Falls Church and West Falls
Church. The CTP recommended this as well as other modifications to the route.
5A DC-Dulles Line: Eliminate service (alternative service available via Silver Line). This change
was recommended by the CTP to occur coincident with the opening of Silver Line Phase 2.
15M George Mason University-Tysons Corner Line: Eliminate service. This change was
also recommended by the CTP.
18E,F Springfield Line: Eliminate service.
23A,B,T McLean-Crystal City Line: Run the 23B and 23T in place of the 23A weekdays
non-rush hour, and all day Saturdays and Sundays.
26A Annandale-East Falls Church Line: Increase peak frequency from 1 to 2 buses per
hour.
28X Leesburg Pike Limited Line: Option 1: Have the bus come every 30 minutes instead of
every 15 minutes or, Option 2: Restructure the route to go between Mark Center and East Falls
Church Metro Station with a combined headway of 20 - 25 minutes.
29N Alexandria-Fairfax Line: Improve weekend frequency from 60 to 30 minute headways.
The CTP recommends increasing peak-period frequency on this route and route 29K by
reducing frequency on the 29CG express routes.
The remaining Metrobus recommendations from the CTP not already included in the list above are
itemized in Table 8-11. Implementing all of these changes would require an increase in Metrobus annual
operating subsidy of $6.3 million and would generate an estimated 650,000 additional annual boardings.
Most of the increase in cost is due to the two proposed new routes: Route 14A between Tysons and
Bethesda, and Route NH7 between Huntington Metrorail Station and National Harbor, which together
account for $3.8 million of the $6.3 million additional annual subsidy and also 364,000 of the expected
650,000 annual additional boardings.

Fairfax County Comprehensive Transit Plan
October 2015 8-12
Table 8-11: Metrobus Recommendations
Route Number
Regional Route
Improvement Type
Change in Boardings
Change in Operating Subsidy
11Y Y 1 25,500 $65,036 29G Y 1 (12,750) -$235,991 29KN Y 1 71,400 $724,475 28X Y 2 7,650 $36,123 2B Y 2 27,075 $300,006 3T Y 2 34,050 $589,120 14A Y 3 114,240 $1,874,294 NH7 Y 3 162,000 $1,842,462 NH7 Phase 2 Y 3 87,480 $101,644 26A Y 2 30,600 $278,567 17ABFM N 2 59,930 $234,000
17A Phase2 N 2 2,260 $24,000
17GHKL N 2 19,890 $201,000
17GKL Phase2 N 2 8,540 $156,000
18GHJK N 2 37,300 $214,000
18G Phase 2 N 2 5,780 $37,000
18PRS N 2 (40,590) ($445,000)
18PS Phase 2 N 2 7,020 $353,000
TOTAL
647,375 $6,349,736
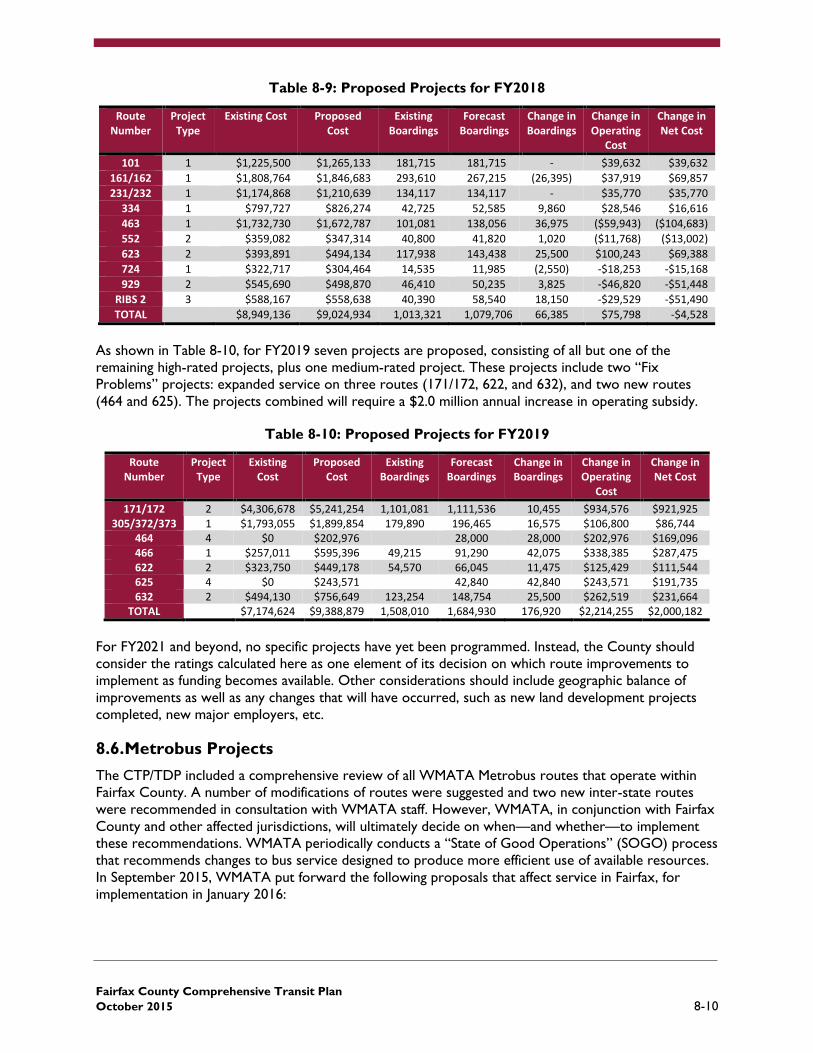
These recommendations were rated using the same procedure as used for the Fairfax Connector
recommendations, using the same thresholds for designation of High, Medium, and Low ratings. All of
the recommendations received either a High or Medium rating. These improvements have not been
programmed for a specific year, as decisions on Metrobus improvements must be made in conjunction
with WMATA for non-regional service (the 17/18 lines) and with WMATA and other jurisdictions for
any changes to regional service (the remaining Metrobus lines with recommendations).
Fairfax County Comprehensive Transit Plan
October 2015 8-13
Table 8-12: Rating of Metrobus Recommendations
Route Number Average Subsidy per
Boarding
Incr. Subsidy per
Boarding
Priority A: Average Subsidy
Priority B: Incremental
Subsidy
Final Rating
11Y $1.32 $2.55 H H H
29G $7.78 $18.51 H M H
29KN $1.94 $10.15 H M H
28X $4.37 $4.72 H H H
2B $6.49 $11.08 H M H
3T $13.33 $17.30 M M M
14A $16.41 $16.41 M M M
NH7 $11.37 $11.37 M M M
NH7 Phase 2 $7.79 $1.16 H H H
26A $5.07 $9.10 H H H
17ABFM $6.77 $3.93 H H H
17A Phase2 $5.12 $10.62 H M H
17GHKL $5.23 $10.11 H M H
17GKL Phase2 $4.65 $18.27 H M H
18GHJK $2.50 $5.74 H H H
18G Phase 2 $0.64 $6.40 H H H
18PRS $1.51 $10.96 H M H
18PS Phase 2 $5.35 $50.28 H L M
Note: H=High, M=Medium, L=Low
8.7. Vehicle Requirements and Garage Capacity
For each recommended improvement, the number of vehicles by type of service day was estimated, as
shown in Table 8-15. The total fleet increase was estimated for all recommended improvements
grouped together by programmed year, assuming a 20% spare ratio. The table also shows the planned
fleet expansion. The 20 buses expected to become available in 2016-2017 fall slightly short of the
estimated 21 additional peak buses needed. However, the additional peak vehicle requirement
calculation overstates needs because it does not take into account interlining of routes. However, if the
vehicle needs end up being as great as suggested by Table 8-15, the 7 buses expected for 2018 delivery
would bring the fleet almost to the required 20% spare ratio. Currently there are not enough buses
planned for the service improvements suggested for 2019. If Fairfax County does not increase bus
orders, these proposed projects will need to be delayed to 2020, when 14 of the 15 required buses will
become available (considering both new vehicles on order and a reduction in peak requirements due to
the Silver Line Phase 2 opening). Delaying the FY2019 service proposal to FY2020 could still leave a
shortfall of up to four buses, including the required spares, unless there is significant interlining that will
reduce the peak requirement.

Fairfax County Comprehensive Transit Plan
October 2015 8-14
Table 8-13: Additional Vehicles Required
Fiscal Year
Additional Peak Vehicle Requirement
With 20% Spares
Planned Fleet Expansion
2016 7 8 12
2017 14 17 8*
2018 1 1 7
2019 15 18 0
2020 -2 -2 12
Total 34 41 39 *Five of the 13 vehicles on order for 2017 will be used for I-495
express service, replacing buses temporarily taken out of spare
availability, and returning the system to its preferred spare ratio.
In FY2016, Fairfax County began construction on a $20 million expansion of administrative and
maintenance space and service buildings at the West Ox Bus Garage. Parking to support the expansion
was built concurrently with the initial construction of the facility. When the project is completed in mid
FY2017, the West Ox Bus Operations Center will be able to both maintain and park 170 buses, 80
more than before the project. Thus there will be ample maintenance and storage capacity for additional
buses when the facility is complete.