
Fair Work Commission Minimum Wage Panel Annual Minimum ... · 13.03.2018 · the rights and...
65
Fair Work Commission Minimum Wage Panel Annual Minimum Wage Review 2017-18 13 March 2018
Transcript of Fair Work Commission Minimum Wage Panel Annual Minimum ... · 13.03.2018 · the rights and...

Fair Work Commission Minimum Wage Panel Annual Minimum Wage Review 2017-18 13 March 2018

Contents Contents 2
1 Introduction 1
2 Which employers and employees are directly affected by the review of the NMW and award wages 2
3 The approach of the Panel 6
4 Relationship between wage increases and employment 9
5 Economic considerations – lower growth and higher risk 12
5.1 Introduction 12 5.2 Growth, national income, output and investment 13 5.3 Growth in GDP 14 5.4 Profits and shares of them 17 5.5 Investment 18 5.6 Inflation 19 5.7 Wage growth 21 5.8 Productivity and competitiveness 25 5.9 Employment and participation 28 5.10 International competitiveness 33 5.11 Outlooks and Forecasts 34
6 Social considerations – relative living standards and the needs of the low paid 37
6.1 Introduction 37 6.2 Assessing Data and Research 38 6.3 Budget Standards research 40 6.4 The research rests on numerous subjective judgements 42 6.5 Housing 43 6.6 Temporal assumptions 44 6.7 Missing material 44 6.8 This is not the measure “most poverty researchers use” 45 6.9 A work in process 45 6.10 Inconsistency 46 6.11 The Harvester analogy 47 6.12 Does this cut both ways? 47 6.13 What to make of this 47 6.14 Other Considerations 48
7 The need to encourage enterprise bargaining 49
8 Challenges confronting the apprenticeships and traineeships system 54

9 Changes to penalty rates should not influence the Panel’s decision 57
10 About the Australian Chamber 61
Australian Chamber Members 62
WORKING FOR BUSINESS. WORKING FOR AUSTRALIA Telephone 02 6270 8000 Email [email protected] Website www.australianchamber.com.au
CANBERRA OFFICE Commerce House Level 3, 24 Brisbane Avenue Barton ACT 2600 PO BOX 6005 Kingston ACT 2604
MELBOURNE OFFICE Level 2, 150 Collins Street Melbourne VIC 3000 PO BOX 18008 Collins Street East Melbourne VIC 8003
SYDNEY OFFICE Level 15, 140 Arthur Street North Sydney NSW 2060 Locked Bag 938 North Sydney NSW 2059 ABN 85 008 391 795 © Australian Chamber of Commerce and Industry 2017
This work is copyright. No part of this publication may be reproduced or used in any way without acknowledgement to the Australian Chamber of Commerce and Industry.
Disclaimers & Acknowledgements The Australian Chamber of Commerce and Industry has taken reasonable care in publishing the information contained in this publication but does not guarantee that the information is complete, accurate or current. In particular, the Australian Chamber is not responsible for the accuracy of information that has been provided by other parties. The information in this publication is not intended to be used as the basis for making any investment decision and must not be relied upon as investment advice. To the maximum extent permitted by law, the Australian Chamber disclaims all liability (including liability in negligence) to any person arising out of use or reliance on the information contained in this publication including for loss or damage which you or anyone else might suffer as a result of that use or reliance.

1 Fair Work Commission Minimum Wage Panel Annual Minimum Wage Review 2017-18 – 13 March 2018
1 Introduction
1. This submission has been prepared by the Australian Chamber of Commerce and Industry (Australian Chamber) in consultation with our members to assist the Expert Panel (Panel) in conducting and completing its 2017-2018 annual review of the national minimum wage (NMW) and modern award minimum wages (AWR 2017-2018).
2. The Panel needs to exercise this regulatory function in accordance with the statutory framework set out in the Fair Work Act 2009 (Cth)(Act). As acknowledged by the Panel, the annual wage review is “essentially a regulatory function the end result of which will affect the rights and responsibilities of the employees who are covered by the NMW order or a modern award and their employers”.1
3. Accordingly, in undertaking its review, the Australian Chamber submits that the Panel should give particular consideration to the circumstances of those who are directly affected by this regulatory function – i.e. NMW and award-reliant employees and the businesses that employee them and who are required to fund any increase flowing from the Panel’s decision. The available data and other evidence suggest that award-reliant businesses are more likely to ne small businesses. These small businesses employ over a third of award-reliant employees.
4. In taking into account social inclusion through workforce participation, those not in employment are also a relevant consideration and the Panel has previously stated that this:
...involves a consideration of the increased incentives that higher minimum wages can provide to those not in employment to seek paid work, balanced against potential impacts on the demand for low-paid workers and hence the supply of low-paid jobs, from large increases in minimum wages.2
5. A balancing up of the interests of the key stakeholders in the system, award-reliant
employers (particularly small businesses), award-reliant employees (particularly low paid employees) and those seeking employment, when reconciled alongside the relevant objects in the Act, has led us to recommend an increase in the national minimum wage and award wages not exceeding 1.9%.
1 [2017] FWCFB 3500 at para [9], [2016] FWCFB 3500 at para. 2. 2 [2014] FWCFB 3500, para 404.
Recommendation The Australian Chamber recommends an increase in the National Minimum Wage and award wages not exceeding 1.9%.

2 Fair Work Commission Minimum Wage Panel Annual Minimum Wage Review 2017-18 – 13 March 2018
6. This is higher than the increase we recommended last year, acknowledging that key economic indicators, when national aggregate data is considered, suggest signs of improvement in the economy and labour market relative to last year. It is also in line with the current rate of inflation, as measured by the Consumer Price Index (CPI). However we are also cognisant that these improvements in the economy and labour market are not consistent across all regions, states, territories and industries.
7. While we note the Panel’s previous wage setting decisions have been largely considered against (among other factors) a macro-economic assessment of the economy, we remain concerned that minimum wage decisions disproportionately impact particular employers and sectors of the economy and that the broad domestic economy focus risks ignoring the impact on struggling industries, regions and vulnerable small and medium employing businesses. Australian Chamber members may make submissions relevant to the industries and geographical areas they represent and we encourage a consideration of the effects of minimum wages from their perspectives.
8. We are continuing to see volatility even in the national data suggesting that the economy needs time to rebalance. Of note, the Australian economy lost momentum in the final quarter of 2017 according to figures released last week by the Australian Bureau of Statistics. Annual growth slowed to a below trend rate of 2.4% in the December quarter, compared to 2.9% in the September quarter, while the quarterly growth rate of 0.4% was nearly half that of the previous quarter. This is a soft result and while we remain optimistic that the economy is still building momentum overall, growth is below trend and quite patchy.
9. It is also worth noting that Government spending has been a key driver of growth lately and rose by a further 1.9% in the December quarter and 4.1% over the year. Private demand, in contrast, was very weak rising only 0.1% in the quarter. It is important that we see the economy rebalance away from the public sector and more toward private enterprise so we can see productivity, jobs and incomes increase over time.
10. While economic rebalancing occurs it is important that we don’t see excessive and unexpected wage increases imposed on the private sector businesses paying pursuant to modern awards, particularly SMEs in labour intensive industries that are operating on lean margins and less able to sustain increases without cutting costs and reducing hours/headcount.
2 Which employers and employees are directly affected by the review of the NMW and award wages
11. The ABS Survey of Employee Earnings and Hours (EEH) is the primary data source for identifying the number of employee’s affected by the Panel’s decision. The May 2016 EEH establishes that:

3 Fair Work Commission Minimum Wage Panel Annual Minimum Wage Review 2017-18 – 13 March 2018
a. 22.7 % and over 2.3 million employees had their pay set by an award; b. A further 66 100 employees on individual arrangements are paid the NMW.3
12. The Department of Employment estimated that in May 2016 around 196,300 employees
were paid the minimum wage rate (whether through the NMW or an equivalent rate in a modern award award) which only represents around 1.9% of all employees – other award-reliant employees are paid above this.4
13. As noted in the Fair Work Commission’s Research Report 3/2018, ‘Characteristics of workers earning the national minimum wage rate and of the low paid’ (Research Report 3/2018), younger (i.e., 15–24 years) and older employees (i.e., 60 years and above) are been found to be relatively more likely to be NMW-reliant, especially younger employees.5 Research Report 3/2018 also observed that “based on data from the HILDA Survey, Bray (2013) noted that the incidence of minimum wage employment follows a U-shaped distribution with age”.6
14. The Government’s submission to the Annual Wage Review 2016-2017 (Government Submission) also identified that the NMW rate features in just 45 of the 122 modern awards. In one of these awards, workers may receive commission on top of the weekly NMW, and in a further two awards, workers have shorter ordinary working hours resulting in a higher hourly wage than the NMW. Also, in several of the 45 awards, the lowest rate is paid as an introductory rate or a trainee rate. In the remaining 77 modern awards, all wage rates are above the NMW rate.7 As noted in Research Report 3/2018, the Panel has noted that the NMW wage rate in most of these 45 awards is a transitional rate limited to an initial period of employment (usually 3 months) or the attainment of certain competencies.8
15. The Government Submission also identified that in May 2016, the median full-time award-reliant wage ($1,139.00) was 82.8 % of the median full-time wage among all workers ($1,376.00), reflecting that the vast majority of award-reliant workers are paid higher wages than the NMW (73.4 % higher on average).9
16. It was also observable from the Government Submission that the majority of award-reliant employees (over 70 per cent) did not fall within the Panel’s definition of low paid, i.e. an
3 ABS, Employee Earnings and Hours, Australia, May 2014, Catalogue No. 6306.0. 4 Australian Government Submission to the Fair Work Commission Annual Wage Review 2017, 29 March 2017, p. 2. 5 Fair Work Commission, Research Report 3/2018, Characteristics of workers earning the national minimum wage rate and of the low paid, February 2018, p. 4. 6 Fair Work Commission, Research Report 3/2018, Characteristics of workers earning the national minimum wage rate and of the low paid, February 2018, p. 4. 7 Australian Government Submission to the Fair Work Commission Annual Wage Review 2017, para 39. 8 Fair Work Commission, Research Report 3/2018, Characteristics of workers earning the national minimum wage rate and of the low paid, February 2018, p. 4. 9 Australian Government Submission to the Fair Work Commission Annual Wage Review 2017, para 40, with reference to ABS Employee Earnings and Hours. The full-time median wage for award-reliant workers only includes non-managerial employees paid at the adult rate.

4 Fair Work Commission Minimum Wage Panel Annual Minimum Wage Review 2017-18 – 13 March 2018
employee earning less than two-thirds of the median hourly wage.10 The characteristics of the low paid are discussed further in this submission.
17. The Government Submission noted that award-reliant employees were most likely to be: a. working part-time or casually employed; b. working in small to medium businesses; c. working in the accommodation and food services, administrative and support
services, retail trade, other services, health care and social assistance, rental, hiring and real estate services and arts and recreation services industries.11
18. Research Report 3/2018 noted that people with the lowest levels of education were more
likely to earn around the NMW with adults who have completed the up to year 11 having the highest incidence of NMW employment, following by those who have completed up to Year 12 with over half of adult minimum wage workers less having no qualifications beyond Year 12.12
19. Research Report 3/2018 also pointed to research showing that accommodation and food services was the largest employing industry of minimum wage workers and that a higher than average proportion of minimum wage workers were found in administrative and support services, other services, construction, retail trade, rental, hiring and real estate, and manufacturing.13
20. Research Report 2/2018 also noted that minimum wage employment appears to be more prevalent across small businesses and in the not-for-profit sector.14
21. The table below provides a snapshot of the industries in which award-reliant employees work.
10 Australian Government Submission to the Fair Work Commission Annual Wage Review 2017, Chart 2.1. 11 Australian Government Submission to the Fair Work Commission Annual Wage Review, p. 37. 12 Fair Work Commission, Research Report 3/2018, Characteristics of workers earning the national minimum wage rate and of the low paid, February 2018, p. 4. 13 Fair Work Commission, Research Report 3/2018, Characteristics of workers earning the national minimum wage rate and of the low paid, February 2018, p. 4. 14 Fair Work Commission, Research Report 3/2018, Characteristics of workers earning the national minimum wage rate and of the low paid, February 2018, p. 4.

5 Fair Work Commission Minimum Wage Panel Annual Minimum Wage Review 2017-18 – 13 March 2018
Table 1: Award reliance by industry
Award reliance 2008 2010 2012 2014 2016 All industries 16.5 15.2 16.1 18.8 24.5 Accommodation and food services 50.3 45.2 44.8 42.8 42.7 Administrative and support services 33.9 31.4 29 37.3 42.1 Retail trade 28.9 22.3 25.6 28.5 34.5 Health care and social assistance 17.2 17.1 19 22.3 28.8 Rental, hiring and real estate services 20.2 22.8 20.9 22.1 27.2 Arts and recreation services 14.2 15.1 19.7 22 26.2 Education and training 8.4 5.1 6.8 5.1 26 Construction 9.1 10 10.6 13.7 19.7 Public administration and safety 3.6 1.9 6.9 12.8 18.1 Manufacturing 12.2 14.6 11.3 15.7 17.7 Wholesale trade 9 10.9 8.1 11.9 16.8 Transport, postal and warehousing 8.3 8 7.3 10.9 13.4 Professional, scientific and technical services 5.4 4.2 6 9.9 9.3 Electricity, gas, water and waste services 5.4 3.1 4.3 6.9 6.5 Information media and telecommunications 5.6 5.7 5.7 5.2 5.5 Mining 1.2 1.9 0.6 0.8 n/a Financial and insurance services 2.2 2.1 4.7 5 n/a Other services 25.4 27.2 24.6 25.1 34.3
Source FWC Annual Wage Review Statistical Report – Annual Wage Review 2016-17, Table 7.1, p.30
22. On balance, the performance of award-reliant sectors was worse than sectors with lower levels of award-reliance and this is discussed further in this submission.
23. Small businesses also have higher levels of award-reliance that larger businesses and this is a factor to be taken into account as the Panel approaches its review, particularly as s. 3(g) of the Act requires acknowledgement of the special circumstances of small and medium business. The Panel has previously identified this stating:
We accept that small businesses are more award reliant than larger businesses and will be particularly affected by changes in award rates of pay; have less capacity to adjust to adverse changes in business conditions; and have found it harder to bounce back from the GFC than larger businesses.15
24. This acknowledgement remains relevant to the 2017-18 AWR. The Panel went on to say:
Business conditions for small businesses are harder than for larger business, but this has been true for almost a decade and has not deteriorated recently.16
15 [2016] FWCFB 3500 at [47]. 16 [2016] FWCFB 3500 at [47].

6 Fair Work Commission Minimum Wage Panel Annual Minimum Wage Review 2017-18 – 13 March 2018
25. However in approaching this review we encourage the Panel to consider that the fact that business conditions have been harder over a long period of time does not make the plight of small business any less difficult and would in fact compound that difficulty.
3 The approach of the Panel 26. The Act requires the Panel to take into account a number of considerations as part of its
review of modern award minimum wages and the NMW, including the minimum wages objective, the modern awards objective, and the overall objectives of the Act.17
27. The minimum wages objective, as contained in a. 3 of the Act, requires the Panel to take into account the following matters in establishing and maintaining ‘a safety net of fair minimum wages’: (a) the performance and competitiveness of the national economy, including
productivity, business competitiveness and viability, inflation and employment growth; and
(b) promoting social inclusion through increased workforce participation; and (c) relative living standards and the needs of the low paid; and (d) the principle of equal remuneration for work of equal or comparable value; and (e) providing a comprehensive range of fair minimum wages to junior employees,
employees to whom training arrangements apply and employees with a disability.18
28. In ensuing a ‘fair and relevant minimum safety net of terms and conditions’, the following matters must also be taken into account by the Panel, as required by the modern awards objective: (a) relative living standards and the needs of the low paid; and (b) the need to encourage collective bargaining; and (c) the need to promote social inclusion through increased workforce participation; and
(d) the need to promote flexible modern work practices and the efficient and productive performance of work; and
(da) the need to provide additional remuneration for:
(i) employees working overtime; or 17 See ss. 3, 284 and 134. 18 S. 284(1).

7 Fair Work Commission Minimum Wage Panel Annual Minimum Wage Review 2017-18 – 13 March 2018
(ii) employees working unsocial, irregular or unpredictable hours; or (iii) employees working on weekends or public holidays; or (iv) employees working shifts; and
(e) the principle of equal remuneration for work of equal or comparable value; and (f) the likely impact of any exercise of modern award powers on business, including on
productivity, employment costs and the regulatory burden; and (g) the need to ensure a simple, easy to understand, stable and sustainable modern
award system for Australia that avoids unnecessary overlap of modern awards; and (h) the likely impact of any exercise of modern award powers on employment growth,
inflation and the sustainability, performance and competitiveness of the national economy.19
29. In undertaking the Fair Work Commission’s functions under Part 2-6 of the Act, the Panel
must also take the Act’s general objects into account which include ‘providing a balanced framework for cooperative and productive workplace relations that promotes national economic prosperity and social inclusion for all Australians by’: (a) providing workplace relations laws that are fair to working Australians, are flexible
for businesses, promote productivity and economic growth for Australia’s future economic prosperity and take into account Australia’s international labour obligations; and
(b) ensuring a guaranteed safety net of fair, relevant and enforceable minimum terms
and conditions through the National Employment Standards, modern awards and national minimum wage orders; and
(c) ensuring that the guaranteed safety net of fair, relevant and enforceable minimum terms and conditions can no longer be undermined by the making of statutory individual employment agreements of any kind …;and
(d) assisting employees to balance their work and family responsibilities by providing for flexible working arrangements and;
(e) enabling fairness and representation at work and the prevention of discrimination
…; and (f) achieving productivity and fairness through an emphasis on enterprise-level
collective bargaining…; and
19 S. 134(1).

8 Fair Work Commission Minimum Wage Panel Annual Minimum Wage Review 2017-18 – 13 March 2018
(g) acknowledging the special circumstances of small and medium sized businesses.20
30. In applying these provisions, the Panel has grouped them under three broad categories:
[Economic considerations] For example, promoting productivity and economic growth (s.3(a)); promoting flexible modern work practices and the efficient and productive performance of work (s.134(1)(d)); the likely impact of any determination on business including on productivity, employment costs and the regulatory burden (s.134(1)(f)); the likely impact of any determination on employment growth, inflation and the sustainability, performance, and competitiveness of the national economy (s.134(1)(h)); the performance and competitiveness of the national economy, including productivity, business competitiveness and viability, inflation and employment growth (s.284(1)(a)); and acknowledging the special circumstances of small and medium-sized businesses (s.3(g)).
[Social considerations] For example; the establishment and maintenance of a safety net of fair, relevant and enforceable minimum wages within the context of an easy to understand, stable and sustainable modern award system (ss.3(b), 134(1), 134(1)(g) and 284(1)); the promotion of social inclusion and [sic] through increased workplace participation (ss.134(1)(c) and 284(1)(b)); relative living standards and the needs of the low paid (ss.134(1)(a) and 284(1)(c)); the principle of equal remuneration for work of equal or comparable value (ss.134(1)(e) and 284(1)(d)); and providing a comprehensive range of fair minimum wages to junior employees, employees to whom training arrangements apply and employees with a disability (s.284(1)(e)).
[Collective Bargaining] For example, the need to encourage collective bargaining (s.134(1)(b); see also s.3(f)).21
31. The Panel attempts to balance these objectives applying broad judgment rather than a mechanistic approach.22 The Panel has consistently noted that while it identifies the issues that have impacted its decisions, it does not quantify the weight given to particular considerations.23
32. In undertaking this exercise of broad judgment the Panel considers the relevant statutory criteria in the context of the prevailing economic and social environment.24 It has described its approach as assessing changes over the past year and to consider longer term trends.25 In explaining the reason for this approach the Panel has said:
20 S. 3. 21 [2014] FWCFB 3500, endnotes 8-10. 22 [2014] FWCFB 3500, endnotes 8-10. 23 [2017] FWCFB 3500 at paras 15-17. 24 [2017] FWCFB 3500 at para. 7. 25 [2017] FWCFB 3500 at para. 7.

9 Fair Work Commission Minimum Wage Panel Annual Minimum Wage Review 2017-18 – 13 March 2018
A focus on developments over the past 12 months enables us to see how things have changed since the previous Review decision. The longer-term perspective reduces our reliance on contemporary data that can be volatile and subject to error. It also enables us to see the cumulative effects of the annual changes on which we focus, including our own decisions.26
33. The Panel has also acknowledged the need to periodically assess the medium and long-
term consequences of successive decisions, recognising that its decisions have both an immediate and cumulative impact.27
4 Relationship between wage increases and employment 34. Participation in paid work is critical to maintaining adequate living standards and to prevent
poverty and social exclusion. The Australian Chamber has consistently cautioned against large increases in the minimum wage which we submit risk negative employment effects, i.e. a reduction in hours or job loss, particularly for those marginally attached to and most vulnerable in the labour market.
35. We note that recent attention has been given to notions of a “living wage” promoted by unions which, according to the United Voice proposal put to the Panel last year would see minimum wages rise by 6.5% per year across four review cycles. While less than 2% of employees are paid the NMW, the approach of the Panel has been to flow the same percentage increases its awards in relation to the NMW through to all award wage classifications. Assuming this approach is maintained, the union’s living wage proposal would result in a significant increase in labour costs with regard to all 2.3 million award-reliant employees.
36. We also encourage the Panel to consider that the increase in the base rate is not the only employment cost that increases following an Annual Wage Review decision. The increase is compounded by other award conditions such as penalty rates and loadings and employment on-costs including 9.5% superannuation, workers compensation and payroll tax which are payable in addition to award wages.
37. If there is no ability for an employer to off-set the minimum wages increases (e.g. because they are unable to pass costs on to consumers in a price sensitive environment) there will be firm specific impacts, including reducing the number of hours offered or number of employees.
38. In the Annual Wage Review 2016-17 decision (2016-17 Decision) the Panel stated that:
… our consideration of the international research on the impact of increases in minimum wages on employment, particularly the United Kingdom (UK) research, has
26 [2017] FWCFB 3500 at para. 8. 27 [2017] FWCFB 3500 at para 35.

10 Fair Work Commission Minimum Wage Panel Annual Minimum Wage Review 2017-18 – 13 March 2018
fortified our view that modest and regular wage increases do not result in disemployment effects. Further, that research suggests that the Panel’s past assessment of what constitutes a ‘modest’ increase may have been overly cautious, in terms of its assessed disemployment effects…28
39. We respectfully disagree with the Panel’s view that its past assessment of what constitutes a ‘modest’ increase may has been overly cautious and the Panel should be careful not to rely on international research in support of this finding given the unique statutory context for minimum wage setting in Australia. For a start, the statutory minimum wages in Australia are the highest in the world. The fact that Australia already has a much higher minimum wage than most other countries means it is likely that the impacts of increasing the minimum wage further are likely to be more pronounced.
40. In other jurisdictions where statutory minimum wages are prescribed, there is typically a single adult minimum wage (although the minimum wage varies in the UK based on the age of the employee).
41. Australia’s NMW sits at $18.29 per hour. By comparison:29 a. The US federal minimum wage is $7.25 per hour. In AUD this translates to $9.22.30 b. In Canada the figure is set to the province or territory where the employee is usually
employed. The minimum wage ranges as high as $15 in Ontario to $10.85 in Nova Scotia. In AUD this translates to $14.89 in Ontario and $10.77 in Nova Scotia.31
c. In the UK the rates vary by age and are as follows: i. for employees aged 25 and over – 7.83 GBP – In AUD this translates to $13.79 ii. for employees 21-24 – 7.38 GBP iii. for employees 18-20 – 5.90 GBP iv. for employees under 18 – 4.20 GBP v. for apprentices – 3.70 GBP.32
d. The New Zealand minimum wage is: $15.75 per hour – In AUD this translates to $14.65.33
42. However in Australia there are 122 modern awards incorporating over 2,000 adult rates of
pay. Indeed, the Department of Employment estimated that in May 2016 around 196,300 employees were paid the minimum wage rate which only represents around 1.9% of all employees – other award-reliant employees are paid above this.34
28 [2017] FWCFB 3500 at para 14. 29 Exchange rates as at 12 March 2018. 30 https://www.dol.gov/general/topic/wages/minimumwage 31 http://srv116.services.gc.ca/dimt-wid/sm-mw/rpt1.aspx 32 http://www.minimum-wage.co.uk/ 33 https://www.govt.nz/browse/work/workers-rights/minimum-wage/ 34 Australian Government Submission to the Fair Work Commission Annual Wage Review 2017, 29 March 2017, p. 2.

11 Fair Work Commission Minimum Wage Panel Annual Minimum Wage Review 2017-18 – 13 March 2018
43. In Australia, statutory minimum wage fixation affects a much larger number of employees than just those employees on the national minimum wage. The increases awarded by the Panel apply to some 2.3 million employees, around 22.7% of the workforce.
44. Other features of the Australian workplace relations system (including but not limited to penalty rates, allowances and loadings – including 25% casual loading) also amplify the difference between minimum wage rates in Australia and minimum wage rates overseas.
45. To the extent that international research demonstrates negative employment impacts caused by the minimum wages overseas, these impacts may be compounded in Australia due to our high statutory minimum wages.
46. The Panel should also proceed with caution when considering research that places an over-reliance on the short-term effects of minimum wage changes. The long-term effect of minimum wage changes on employment can be significant, even if it were established that there are no short-term effects35 as can the cumulative effect of multiple wage increases.
47. If wages are increased by too great an amount this will also discourage investment and entrepreneurship. If wage increases are not supported by higher productivity or higher prices for consumers are likely to cost jobs. Many award-reliant businesses operate in a highly competitive environment and are unable to pass costs on. This can be seen in the retail sector where the competitive environment, including competition from an online, global marketplace, is driving a low inflationary environment.
48. The circumstances of the small businesses that overwhelmingly pay minimum wage rates must be taken into account in considering union proposals to increase wages by significant amounts. Small, award-reliant businesses that run on lean margins and are unable to pass on increases to consumers may need to cut costs by either reducing headcount and hours or substituting capital for labour. It is very possible that short-term gains in the earnings of those who remain in employment come at the expense of those who are negatively impacted with broader economic consequences.
49. The employment impacts arising from the Panel’s decisions are relevant as the Panel is required to take into account social inclusion through workforce participation. The Panel has previously stated that this:
...involves a consideration of the increased incentives that higher minimum wages can provide to those not in employment to seek paid work, balanced against potential impacts on the demand for low-paid workers and hence the supply of low-paid jobs, from large increases in minimum wages.36
35 Sorkin, Isaac. “Are There Long-Run Effects of the Minimum Wage?” Review of Economic Dynamics. Accessed March 26, 2015. https://ideas.repec.org/a/red/issued/13-225.html. 36 [2014] FWCFB 3500, at para 404.
12 Fair Work Commission Minimum Wage Panel Annual Minimum Wage Review 2017-18 – 13 March 2018
50. The Australian Chamber has previously expressed support for this interpretation and encourages the Panel to take into consideration the “stepping stone” effect of low paid jobs given that the data suggests that most people don’t remain in low paid jobs for long. As noted by the Government in its submission to the Annual Wage Review 2016-17, data from the Household, Income and Labour Dynamics Australia (HILDA) survey suggest that more than half of those who meet the Panel’s definition of low paid one year move into a higher paying job the following year.37
5 Economic considerations – lower growth and higher risk 5.1 Introduction 51. Recently, there has been significant debate on the causes of low wage growth, currently
being experienced domestically and internationally, comparatively to the past. While this may cause concern and is a point of significant policy interest, the Australian Chamber discourages policy makers to promote a particular policy outcome through regulated wage increases.
52. While it is clear that wage growth has been slower over the last few years comparative to the past, there are five clear reasons for this38:
a. Inflation is lower;
b. Economic recovery post GFC and mining boom is recent and wages lag growth;
c. Underemployment remains very high and is a sign of spare capacity;
d. Strong growth in part-time employment;
e. Competition and technological disruption.
53. Higher inflation outcomes are associated with higher wage growth and vice versa. For instance, in the mid-to-late 1980’s, wage growth (as measured by AWOTE) was often 6-7% annually on some measures.39 At that time, inflation was also running at a similar rate, or more.40
54. More recently, in the period from 2006 to 2008, inflation growth averaged 3.5% annually, while wage growth (Wage Price Index - WPI) averaged about 3.5% to 4% annually. Today, annual wage growth (WPI) has averaged about 2% to 2.5% over the last few years and annual inflation growth about 1.6% (on average over the last few years).41
55. Another factor weighing on wage growth is that, until recently, the private domestic economy was very weak. The data from the Australian Bureau of Statistics (ABS) shows
37 Australian Government Submission to the Fair Work Commission Annual Wage Review 2017, 29 March 2017, p. 3. 38 Insights into Low wage Growth in Australia, RBA Bulletin, March quarter, 2017. 39 ABS, Cat. No. 6302.0 - Average Weekly Earnings, States and Australia. 40 ABS, Cat. No. 6401.0 - Consumer Price Index. 41 Philip Lowe, RBA Governor, Some Evolving Questions (Speech), Address to the Australian Business Economists Annual Dinner - Sydney, 21 November 2017.

13 Fair Work Commission Minimum Wage Panel Annual Minimum Wage Review 2017-18 – 13 March 2018
that as recently as late 2016, domestic demand growth was low at 1.5% year-on-year (the average over the last 30 years is 3.7%). Private demand growth was even weaker at 0.2% year-on-year (the 30-year average is 3.7%). At the same time, monthly employment growth averaged just under 4,000 jobs per month in the first 9 months of that year. Full-time employment growth fell by more than 13,000 per month over the same period.
56. Since February 2003, the underemployment rate has been higher than the unemployment rate.42 The underemployment rate hit a record high in early 2017 at 8.9% and it has only come down gradually since (currently 8.3%). Prior to the GFC, underemployment rates around 6-7% were more common and the peak was 7.3%.43
57. Another factor is the strong growth in part-time employment. Over the last 12 months, 72% of jobs growth has been in full-time roles. However, on a longer-term basis, part-time employment growth has played a much greater role. While part-time employment growth comprises only 32% of the jobs market, it has made up around 50% of total jobs growth over the last three years.44
58. It is likely that the strong growth in part-time employment, and the associated lift in underemployment, means that affected employees may be forgoing wage increases in exchange for working additional hours. Equally likely is that a large number of employees want, and are getting, more flexible working conditions in the workplace. This is a good thing if employees would prefer to forgo wage increases in exchange for greater flexibility.45 An increased flexibility-wage trade off may, in that instance, reflect a realised employee preference.
59. Finally, technological advancement has disrupted a number of industries such as retail, media and financial services. This is having an impact on the ability of firms to give pay rises to employees in affected industries.
60. The Panel has previously accepted that the impact of its decisions extends beyond award-reliant employees and employers as increases flow-on to other employees.46 As the Panel approaches this review, it is important to acknowledge that the statutory objectives the Panel is required to take into account do not require or empower the Panel to apply minimum wage fixation as a way to stimulate growth in market wages or for broader economic stimulus. The task of the Panel is to set the NMW and award wages so as to provide a fair and relevant safety net.
5.2 Growth, national income, output and investment 61. There are clear signs that the performance of the economy has taken small steps towards
recovery since the 2016-17 AWR and last increase in award wage rates.
62. In its 2016-2017 AWR Decision the Panel found:
42 ABS, Cat. No. 6202.0 - Labour Force, Australia, Nov 2016, Spotlight on Underemployment. 43 ABS, Cat. No. 6202.0 - Labour Force, Australia. 44 ABS, Cat. No. 6202.0 - Labour Force, Australia. 45 Standing Committee on Economics 16/02/2018, Reserve Bank of Australia Annual Report 2017, p. 27. 46 [2015] FWCFB 3500 at para. 208, [2017] FWCFB 3500 at para. 5.

14 Fair Work Commission Minimum Wage Panel Annual Minimum Wage Review 2017-18 – 13 March 2018
Gross domestic product (GDP) growth in Australia outperformed the average of the major 7 OECD countries across 4 of the 5 quarters to the December quarter 2016. Real net national disposable income (RNNDI) has grown more quickly than GDP over the past year, as the terms of trade have improved. Economic conditions have varied across states, with stronger growth in New South Wales and Victoria and weakest growth in Western Australia…47
63. Growth in GDP remains inconsistent across different parts of the economy as the Panel approaches this year’s review.
5.3 Growth in GDP 64. GDP growth is a relevant consideration in assessing the performance of the national
economy. While GDP growth does not directly translate into a case for a higher or lower minimum wage increase, GDP and the economic outlook more broadly should be considered in assessing the risk that increases in minimum wages may exacerbate any underlying vulnerabilities or negatively impact on jobs, living standards and other indicators.
65. The Australian economy has picked up somewhat since the weaker growth outcomes recorded at the time of the last annual wage review decision.
66. Australian GDP rose by 0.4% in the December quarter 2017, to be 2.4% higher over the year. This quarterly growth reflected a 0.1% lift in private demand and a 1.9% increase in public demand. Net exports took off 0.5 percentage points from growth in the December quarter 2017.48 This GDP growth is patchy and remains below trend.
67. The recent, albeit modest, pick-up in economic growth is welcome. However, in the context of a national wage decision with permanent effect, it is important to realise that the acceleration in GDP is only very recent and it is not broad-based.
68. At the time of the wage decision last year, annual GDP growth to the March quarter 2017 was only 1.7%.49 Much of the rebound since then has been driven by public demand and exports with annualised average quarterly growth of 4.4% and 3.2% respectively to the December quarter 2017.50
69. In contrast annual private demand at 2.9% to the December quarter 2017 is still well below the trend of 3.75% and, while the rebound in GDP is about a year old, the rebound in private demand is even more recent. Private demand only picked up in earnest late 2017. Average quarterly growth in the previous four years was only 0.2%, which annualises to only 2% growth – well below trend.51
70. Private demand growth has posted only three quarters of solid growth (0.7% or above) in the last three years. Indeed average quarterly growth in the previous 2 years was only 0.4% which annualises to only 1.6% growth – again well below trend.
47 [2017] FWCFB 3500 at para. 29. 48 ABS, Cat. No. 5206.0 - Australian National Accounts: National Income, Expenditure and Product, Dec 2017. 49 ABS, Cat. No. 5206.0 - Australian National Accounts: National Income, Expenditure and Product, Mar 2017 50 ABS, Cat. No. 5206.0 - Australian National Accounts: National Income, Expenditure and Product, Dec 2017 51 ABS, Cat. No. 5206.0 - Australian National Accounts: National Income, Expenditure and Product, Dec 2017

15 Fair Work Commission Minimum Wage Panel Annual Minimum Wage Review 2017-18 – 13 March 2018
71. Importantly household consumption, which has historically comprised between 60 and 66% of total GDP, is still very weak. Annual growth of 2.9% is higher than what was recorded at the time of the last wage decision (2.3%) but it is still well below the average from 2000 until the GFC of 4.1%. This is important as many of the award-reliant industries, such as retail and the accommodation and food services sectors, rely heavily on consumer spending.52
72. More recent household consumption outcomes show an acceleration from the trough reached in 2013 of 1.3% annual growth however recent gains have been accompanied by a decline in the savings rate and rising household debt.53 This raises questions as to how sustainable it is.
73. Another important factor weighing on household spending is the rising burden of personal income tax. Household disposable income rose by only 3.0% in the year to the December 2017 quarter (the 20-year average is just under 6%), while tax paid by households rose by 6.2% over the same period.54
74. While it is tempting to assume that a regulated lift in wage growth would be the answer to weak household consumption, the Australian Chamber would urge the Panel to resist those temptations. This is because of the dominance of cost cutting in driving profitability in the award-reliant sectors, low productivity growth in that space and the already high wage share evident in those industries. Furthermore, and as noted above, the statutory considerations do not empower the Panel to apply the wage setting function as a tool for economic stimulus.
75. At the time of the 2016-17 AWR Decision, GDP growth by industry showed very weak growth in the award-reliant industries. March quarter 2017 figures showed annual growth of only 0.3% for those industries compared to annual GDP growth at the time of 1.8%.55
76. Since the 2016-17 AWR Decision growth has picked-up in the award-reliant industries, although it remains volatile. For instance, quarterly growth in the September quarter 2017 was strong. In contrast, growth was weak in the December quarter 2017. Looking over a longer time frame average annualised growth over the last two years is only 2%, which is very weak, and half the pre-GFC trend of 4% annualised growth.
52 ABS, Cat. No. 5206.0 - Australian National Accounts: National Income, Expenditure and Product. 53 ABS, Cat. No. 5206.0 - Australian National Accounts: National Income, Expenditure and Product, Dec 2013. 54 ABS, Cat. No. 5206.0 - Australian National Accounts: National Income, Expenditure and Product, Dec 2017. 55 ABS, Cat. No. 5206.0 - Australian National Accounts: National Income, Expenditure and Product, Mar 2017.

16 Fair Work Commission Minimum Wage Panel Annual Minimum Wage Review 2017-18 – 13 March 2018
Table 2 - Growth by industries56
Industry % change Sept 17
to Dec 17 % change Dec 16
to Dec 17 Agriculture, forestry and fishing -2.7 -8.8
Mining 1.3 1.0
Manufacturing -1.0 2.5
Electricity, gas, water and waste services -0.8 1.3
Construction 0.3 4.9
Wholesale trade -0.2 -0.4
Retail trade 0.3 2.5
Accommodation and food services 1.0 6.7
Transport, postal and warehousing -0.8 0.3
Information media, and telecommunications 2.9 4.2
Financial and insurance services 0.1 4.1
Rental, hiring and real estate services 2.5 2.5
Professional, scientific and technical services 0.3 3.7
Administrative and support services -0.6 3.8
Public administration and safety 1.2 1.3
Education and training 0.5 2.1
Health care and social assistance 1.9 6.4
Arts and recreation services 2.2 2.8
Other services 1.9 -0.6
Gross domestic product 0.4 2.4
56 ABS, Cat. No. 5206.0 - Australian National Accounts: National Income, Expenditure and Product, Dec 2017, Seasonally Adjusted.

17 Fair Work Commission Minimum Wage Panel Annual Minimum Wage Review 2017-18 – 13 March 2018
77. The terms of trade was little changed in the December quarter 2017, but is down 6% from the time of the last wage decision and is down 24% from the 2011 peak.
78. As a result of the moderation in the terms of trade, growth in real net national disposable income moderated to 4.4% from 6.6% at the time of the last wage decision.57 While RNNDI is stronger than GDP growth we would remind the Panel that only a small proportion of the labour force works in the mining sector and so growth in RNNDI cannot be used as any kind of benchmark for the broader economy.
79. GDP grew 2% during the 2016-17 financial year, compared with 2.8% during 2015-16.58
2016-17 recorded the lowest annual GDP growth since the GFC in 2008-09, where GDP grew 1.9%. GDP growth per capita was also lacklustre during the 2016-17 financial year, growing 0.5% during the year in comparison to 1.4% during the 2015-16 financial year.59 While living standards are continuing to improve, they are doing so at a well below average rates.
5.4 Profits and shares of them 80. Profits as a share of total factor income increased marginally from 26.8% in December
2016 to 27.0% in December 2017. The wages share also increased marginally from 52.4% to 52.9%.60 Wage share of total factor income is also quite high in the award-reliant industries. Conversely profit share in the award-reliant industries is very low compared to the all industry average.
81. Over the four years to December 2016 the wage share of total factor income averaged 53.7%, which is slightly above the average of the prior twelve years to 2000 (53.8%).61
82. The data shows a clear and sharp drop in wage share of total factor income from the September quarter 2016 to the December quarter 2016. This was largely driven by a sharp lift in commodity prices in that quarter (just under 30%). Another factor explaining the sharp drop in in wage share at that time was the very weak full-time employment growth in the lead up to that quarter. Indeed for the year of 2016 as a whole, full-time employment fell 20,000. This also weighed on the wage share on total factor income.62
83. Strong employment growth since then has seen the wage share of total factor income gradually rise.
84. It is important for the Panel to consider that aggregate wage and profit share data often don’t provide an accurate read of what is going on in the award-reliant industries.
85. For instance, industry specific data shows that the wage share of industry factor income (for the 2017 financial year) in the ‘accommodation and food services’ industry is 74% compared to the all-industries average of 55%. Similarly, in the ‘administrative and support
57 ABS, Cat. No. 5206.0 - Australian National Accounts: National Income, Expenditure and Product, Dec 2017. 58 ABS, Cat. No. 5206.0 - Australian National Accounts: National Income, Expenditure and Product, Dec 2017. 59 ABS, Cat. No. 5206.0 - Australian National Accounts: National Income, Expenditure and Product, Dec 2017. 60 ABS Cat No. 5206.0 - Australian National Accounts: National Income, Expenditure and Product, Dec 2017. 61 ABS Cat No. 5206.0 - Australian National Accounts: National Income, Expenditure and Product, Dec 2017. 62 ABS Cat No. 5206.0 - Australian National Accounts: National Income, Expenditure and Product.

18 Fair Work Commission Minimum Wage Panel Annual Minimum Wage Review 2017-18 – 13 March 2018
services’ sector, the wage share is 85% while in the retail industry the wage share is 68%. In each instance the latest wage share numbers are above the average of the last decade.63
86. Although overall company profits rose by 2.2% in the December quarter 2017 and 4.3% over the year in 2017,64 it is important to note that profits can be driven by increased revenues or by cutting costs. On a three year time horizon, profits were 27.4% higher, although sales were only 10.2% higher.
87. Similarly, profit share by industry shows clear divergences. In the award-reliant industries, the profit share of total industry factor income is low – 14.7% in the Administrative and Support Service Sector, 25.8% in the Accommodation and Food Services sector, and 32% in the retail sector. The all-industries average is just under 47%.65
88. While there is evidence of a pick-up in profit growth in the award-reliant industries, sales data shows that profit growth in the award-reliant industries is largely driven by cost cutting. Sales themselves remain weak, rising by only 1.0% in the retail sector and 0.9% in accommodation and food services for the December 2017 quarter.66
5.5 Investment 89. Despite signs of growth in the December quarter 2017, a tentative investment environment
persists. Non-mining investment has remained relatively subdued for some years reflecting ongoing economic uncertainty. Private investment excluding dwellings grew by 1.5% in the December quarter, with the first rise in non-dwelling construction of 2.3% since the June quarter 2014.67 New private business investment increased by 6.0% over the year to December 2017, a positive result for the first time since 2012.68
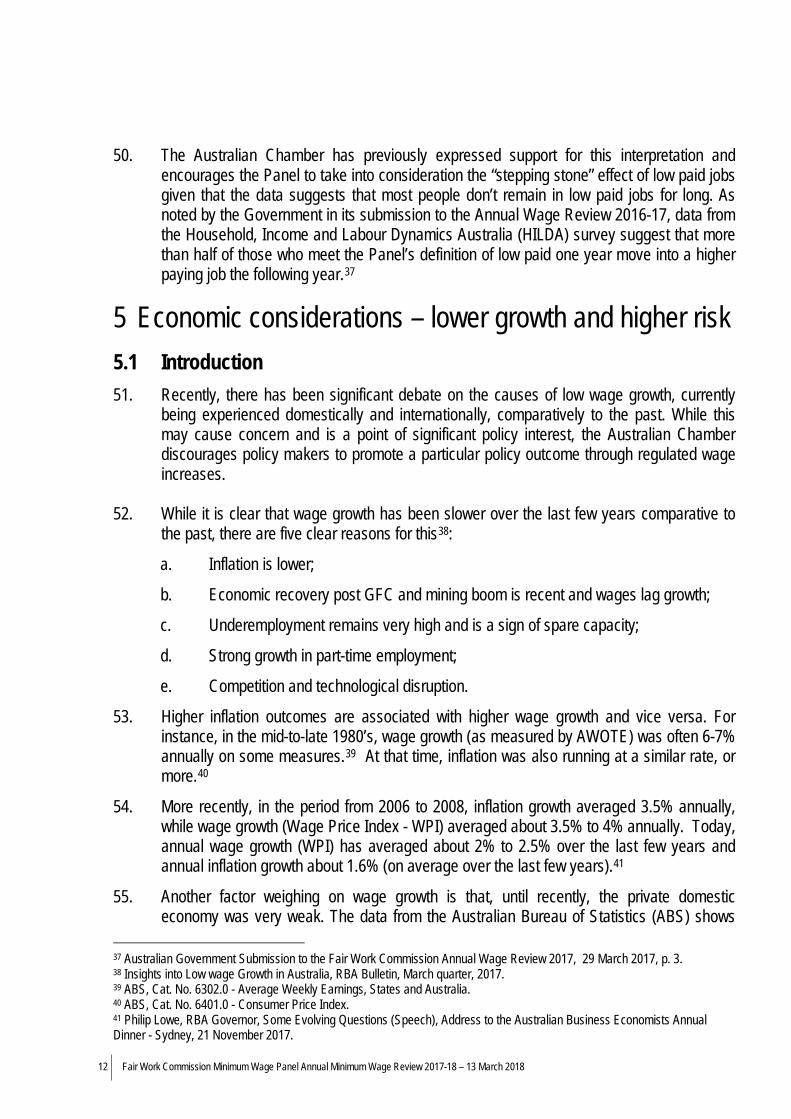
90. Business investment – measured as private gross fixed capital formation – increased by 2.8% over the year to December 2017.69 This is an improvement after consistent decreases in the years ending December 2016, 2015, 2014 and 2013.70
63 ABS Cat No 5204.0 - Australian System of National Accounts, 2016-17. 64 ABS Cat No 5676.0 - Business Indicators, Australia, Dec 2017, seasonally adjusted. 65 ABS Cat No 5676.0 - Business Indicators, Australia, Dec 2017. 66 ABS Cat No.5676.0 - Business Indicators, Australia Dec 2017, in volume terms, seasonally adjusted. 67 ABS Cat No.5206.0 Australian National Accounts: National Income, expenditure and product Dec 2017. 68 ABS Cat No.5206.0 Australian National Accounts: National Income, expenditure and product Dec 2017. 69 ABS Cat No.5206.0 Australian National Accounts: National Income, expenditure and product Dec 2017. 70 ABS Cat.No.5206.0 Australian National Accounts: National income, expenditure and product .
19 Fair Work Commission Minimum Wage Panel Annual Minimum Wage Review 2017-18 – 13 March 2018
Chart 1 – Industry share of business investment71
91. Notably, public investment grew 2.9% during the December quarter 2017, significantly
outpacing private sector investment which decreased by 2.2% during the same quarter.72 Of course it is not the public sector that pays the increases in minimum wages that arise from these reviews.
92. Significant disparities also exist in gross fixed capital formation across states. The only two regions of Australia that experienced an increase in private investment in the December quarter 2017 were New South Wales (0.8%) and the Australian Capital Territory (11.5%).73
93. The only areas of private investment that increased during December quarter 2017 were in machinery and equipment (3.3%) and intellectual property products (0.6%). Overall, during 2017, private investment in dwellings contracted by 5.8% while the remaining areas recorded a positive result. These fluctuations during the year indicate that the economy is still on the tentative road to recovery.74
5.6 Inflation 94. Recent low inflation outcomes have been a key driver of lower nominal wage growth.
Research conducted by the Reserve Bank of Australia (RBA) suggests that inflation and inflation expectations influence wage outcomes. As the RBA notes: “employees generally
71 RBA, The Australian Economy and Financial Markets, Chart Pack, February 2018. 72 ABS Cat No.5206.0 Australian National Accounts: National Income, expenditure and product Dec 2017. 73 ABS Cat No.5206.0 Australian National Accounts: National Income, expenditure and product Dec 2017. 74 ABS Cat No.5206.0 Australian National Accounts: National Income, expenditure and product Dec 2017.
20 Fair Work Commission Minimum Wage Panel Annual Minimum Wage Review 2017-18 – 13 March 2018
look for higher nominal wage growth when inflation is higher, in order to maintain the purchasing power of their earnings.”75
95. While nominal wage growth is low, real wage growth is only modestly below trend and NMW and award wage outcomes have been considerably higher. In the context of the 2017-18 AWR and the Panel’s task of providing a fair, relevant safety net, the Australian Chamber believes it will be difficult for businesses if the Panel were to award anything above a 1.9% increase, especially after last year’s high 3.3% increase.
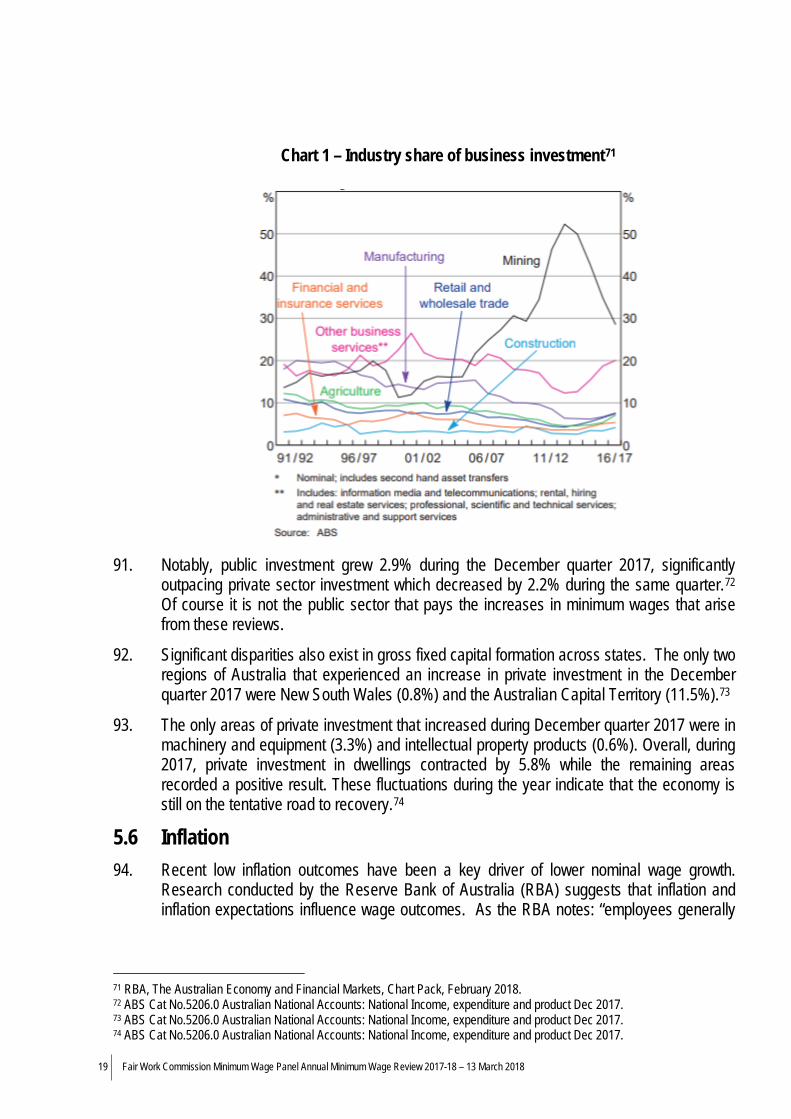
96. Consumer prices rose by 0.6% in the December 2017 quarter to be 1.9% higher annually.76 This is below the RBA’s inflation target of between 2-3% over the course of the cycle.77
Chart 2 – Inflation Percentage Change from Previous Year 78
97. Excluding food and energy prices, inflation is even lower, rising 0.3% in the December
2017 quarter to be 1.6% higher over the year. Indeed energy costs and government influenced costs - health, education, utilities and insurance – are the key drivers of inflation. Excluding these government led prices increases, inflation is even lower rising only 1.1% over 2017.79
75 RBA, Reserve Bank Statement on Monetary Policy – August 2013. 76 ABS, Cat No 6401.0 - Consumer Price Index, Australia, Dec 2017. 77 RBA, Inflation Target, https://www.rba.gov.au/inflation/inflation-target.html. 78 ABS Cat No 6401.0 - Consumer Price Index, Australia, Dec 2017. 79 ABS, Cat No 6401.0 - Consumer Price Index, Australia, Dec 2017.
0.00.51.01.52.02.53.03.54.04.55.0
%
Australia Sydney Melbourne
Brisbane Adelaide Perth
Hobart Linear (Australia)

21 Fair Work Commission Minimum Wage Panel Annual Minimum Wage Review 2017-18 – 13 March 2018
Table 3: Inflation (year-ended percentage change)80
2012-13
(%) 2013-14
(%) 2014-15
(%) 2015-16
(%) 2016-17
(%) Food & non-alcoholic beverages
0.5 1.3 2.1 0.2 1.7
Alcohol & tobacco 3.9 5.9 6.1 5.8 5.9
Clothing & footwear -0.5 -0.2 -1.4 -0.4 -0.3
Housing 4.9 3.9 2.5 2.0 2.2 Furnishings, household equipment and services
0.8 0.7 1.0 1.8 0.6
Health 6.9 4.4 4.4 4.8 3.8 Transport 1.1 2.4 -2.6 -1.7 0.5 Communication 1.7 1.3 -3.2 -6.0 -5.5 Recreation & culture -0.9 2.3 1.4 0.9 0.0
Education 5.9 5.4 5.4 4.3 3.3 Insurance & financial services 2.8 1.7 1.7 2.2 2.6
All groups 2.3 2.6 1.7 1.4 1.8
98. These low inflation outcomes indicate that businesses do not have much in the way of pricing power. Market conditions, forces and competitive pressures make for a very tough pricing environment.
5.7 Wage growth 99. Considerable excess capacity is still evident in the labour market notwithstanding strong
employment growth and a declining unemployment rate. This is especially the case in the award-reliant industries where part-time jobs growth has dominated in some sectors and where underemployment rates are well in excess of the national average (13-22% compared to 8.3%).
100. The Australian Chamber maintains that trends in non-statutory private sector wage growth remain a key indicator of the strength of the labour market. Growth in non-statutory private sector wages also reflects the market’s response to factors such as productivity and business performance and the environment in which business operates.
80 ABS Cat No.6401.0 – Consumer Price Index, Australia, Dec 2017.

22 Fair Work Commission Minimum Wage Panel Annual Minimum Wage Review 2017-18 – 13 March 2018
101. The Wage Price Index (WPI) is the most appropriate indicator of wage growth because it controls for changes in the composition of the workforce. In contrast, average weekly ordinary time earnings (AWOTE) is affected by changes in the jobs that people do rather than how much is paid to those holding those jobs. Similarly, the average annualised wage increase (AAWI) in collective agreements does not take into account changes in other conditions or work practices that may have been exchanged for wage increases.
102. Private sector WPI should be also preferred to over headline WPI because the capacity of the public sector to grant wages increases is divorced from the capacity of private firms.
103. The private sector WPI has continued to record sustained weakness over several years. Decreasing in 2015 and 2016, the latest WPI figures show a small increase in private sector WPI between December 2016 and 2017 of 0.1%. Additionally, public sector wage growth is higher at 2.4% annually than wage growth in the private sector (1.9% annually).81
104. Quarterly real wage growth (WPI/CPI) has been slightly weaker on average over the last two years at 0.1% compared to the historical average of 0.15%. The difference of 0.05% per quarter amounts to a drop off in real wage growth (on average over that time) of 0.2% annually.82
81 ABS Cat.No. 6345.0 - Wage Price Index, Australia, Dec 2017 and ABS, Cat No 6401.0 - Consumer Price Index, Australia, Dec 2017. 82 ABS Cat.No. 6345.0 - Wage Price Index, Australia, Dec 2017.

23 Fair Work Commission Minimum Wage Panel Annual Minimum Wage Review 2017-18 – 13 March 2018
Table 4 – WPI private sector growth by industry83
Industry
WPI % change between 2006 and
2011
WPI % change between 2012 and
2017
WPI % change between 2016 and
2017 Mining 25.3 9.7 1.4
Manufacturing 19.6 12.9 2.3 Electricity, gas, water and waste services 21.7 14.1 1.8
Construction 22.1 10.9 1.9
Wholesale trade 19.0 10.2 1.8
Retail trade 19.1 11.3 1.6
Accommodation and food services 16.6 12.1 2.0
Transport, postal and warehousing 20.7 10.7 1.6 Information media, and telecommunications 16.6 11.5 2.0
Financial and insurance services 19.9 12.9 2.1 Rental, hiring and real estate services 18.6 10.3 1.6
Professional, scientific and technical services 23.8 8.5 1.8
Administrative and support services 19.6 9.1 1.8
Public administration and safety 19.2 11.9 2.2
Education and training 22.9 13.9 2.2
Health care and social assistance 19.3 13.8 2.6
Arts and recreation services 20.4 13.8 2.5
Other services 18.7 11.6 2.4
105. Compared to the September quarter 2016, real wages in the September quarter 2017 are 0.2% higher, which compares to annual average growth of 0.6%.
106. Since the GFC commenced (September quarter 2008) real wages are 7% higher, real wage growth over the comparable period (December quarter 1999 to the September quarter 2008) was lower at 3%.
107. Slower wages growth in comparison to the period of high wages growth during the mining boom is in part a consequence of the structural adjustment in the Australian economy.
83 ABS, Cat. No. 6345.0 – Wage Price Index, Australia, All WPI Series: Original (Quarterly Index Numbers), December 2017.

24 Fair Work Commission Minimum Wage Panel Annual Minimum Wage Review 2017-18 – 13 March 2018
108. Investment, productivity and growth are required across the broader economy if we are to create the economic gains needed to drive growth in wages (and jobs) into the future. However this economic rebalancing is taking time and we are seeing uneven outcomes in sectors, states and regions in the economy.
109. This is reflected in labour market outcomes. Although global economic conditions have strengthened during 2017, there is still spare capacity in the labour market in Australia and globally.84 Spare capacity is most strongly reflected in the unemployment rate and, to a certain extent, the underemployment rate. The Panel acknowledged this in the 2016-17 decision.85 While excess capacity remains, wage growth will be restrained.86
Chart 3 – Australian Labour Market, Seasonally adjusted87
110. Wage growth is intrinsically linked to the performance of the national economy, such as
GDP growth. During 2017, Australia’s economic conditions improved, leading to an overall increase in private sector WPI. Over 2018, Australia’s economic growth is expected to be stronger than in 2017, which is expected to reduce spare capacity in the market and fuel increases in wages.88 Australian GDP growth has been slow to strengthen as a result of the slow transition of the economy from the resources sector to other growth sectors.89
84 Luci Ellis, RBA Assistant Governor (Economic), ‘Three Questions About the Outlook’ (Speech), 13 February 2018 85 [2017] FWCFB 3500 at [74]. 86 House of Representatives Standing Committee on Economics, Reserve Bank of Australia annual report 2017, 16 February 2018. 87 Luci Ellis, RBA Assistant Governor (Economic), ‘Three Questions About the Outlook’ (Speech), 13 February 2018. 88 RBA Statement on Monetary Policy – February 2018. 89 Parliament of Australia, Parliamentary Library Briefing Book – 44th Parliament: The Australian Economy – supporting the transition, Robert Dolamore (Economics), December 2013.

25 Fair Work Commission Minimum Wage Panel Annual Minimum Wage Review 2017-18 – 13 March 2018
Chart 4 – WPI and GDP Growth90
5.8 Productivity and competitiveness 111. Productivity and unit labour costs can be an important consideration in determining the
capacity of any firms to increase wages, but they need to be carefully interpreted.
112. In its 2016-2017 Annual Wage Review Decision the Panel found:
Labour productivity in the market sector grew more strongly across 2016 than it had in the previous 2 years. After some years of decline, multifactor productivity (MFP) continued its more recent modest growth. It grew more strongly over the year to the June quarter 2016 than it had in all but one of the past 10 years. The 2.3 per cent per annum growth in labour productivity in the period 2007–08 to 2014–15 exceeds or is virtually the same as growth in all periods from 1973–74, except 1993–94 to 1998–99.91
113. Productivity growth is often used as an indicator measure of the performance of the economy. In the context of a wage decision, it is a measure of the capacity of the economy to handle a broad-based regulated wage increase. If productivity growth is high then employees should be receiving a greater wage share, and presumably vice versa.
114. The Productivity Commission notes that “the ABS [Australian Bureau of Statistics] aggregate multifactor productivity (value adding output produced per unit of combined inputs of labour and capital) is the measure that comes closest to the underlying concept of productivity — efficiency of producers in producing output using both labour and capital.”92
115. On the usefulness of labour productivity as a measure of national productivity, the OECD states:
90 ABS Cat.No. 6345.0 - Wage Price Index, Australia, Dec 2017 and Cat No.5206.0 Australian National Accounts: National Income, expenditure and product Dec 2017. 91 [2017] FWCFB 3500 at [41]. 92 Productivity Commission, PC Productivity Update 2015, 20 July 2015.
0.0%
1.0%
2.0%
3.0%
4.0%
5.0%
Private sector WPI Public sector WPI GDP Annual Growth

26 Fair Work Commission Minimum Wage Panel Annual Minimum Wage Review 2017-18 – 13 March 2018
Labour productivity is a useful measure: it relates to the single most important factor of production, is intuitively appealing and relatively easy to measure. Also, labour productivity is a key determinant of living standards, measured as per capita income, and from this perspective is of significant policy relevance. However, it only partially reflects the productivity of labour in terms of the personal capacities of workers or the intensity of their efforts. Labour productivity reflects how efficiently labour is combined with other factors of production, how many of these other inputs are available per worker and how rapidly embodied and disembodied technical change proceed. This makes labour productivity a good starting point for the analysis of some of these factors. One way of carrying out further analysis is to turn to multifactor productivity (MFP) measures. [emphasis added].93
116. With that in mind, the Australian Chamber notes that MFP grew just 0.8% (annual average) from 2011-12 to 2016-17. While this is an improvement on weak outcomes experienced in the aftermath of the GFC, it is still markedly weaker than the experience from 2000-2005 when annual MFP growth rates averaged 1.5%.94
Chart 5 – Changes to productivity indexes, 2006-201795
117. The improvement in MFP is also skewed toward five industries (just under one-third of the
total number):
a. Rental, hiring and real estate
b. Wholesale trade
c. Information, media and telecommunications
93 OECD, Measuring Productivity - OECD Manual: Measurement of Aggregate and Industry-Level Productivity Growth (2001), p. 20. 94 ABS, Cat No 5260.0.55.002 - Estimates of Industry Multifactor Productivity, 2016-17. 95 ABS, Cat No 5260.0.55.002 - Estimates of Industry Multifactor Productivity, 2016-17.
-4.00
-3.00
-2.00
-1.00
0.00
1.00
2.00
3.00
4.00
5.00
%
Labour productivity Multifactor productivity Capital productivity

27 Fair Work Commission Minimum Wage Panel Annual Minimum Wage Review 2017-18 – 13 March 2018
d. Agriculture, forestry and fishing, and
e. Financial and insurance services.
118. This does not represent a broad-based or aggregate improvement in labour productivity across the economy or across all award-reliant industries. Average productivity growth across industry, excluding those sectors, was 0.0%.
119. Similarly, while labour productivity (LP) growth was higher at 1.9% in 2016-17, it was not broad-based. Stronger productivity growth was observed in eight industry sectors, which had an average LP growth of 4.6% during 2016-17. Comparatively the bottom eight industry sectors had average productivity growth of -0.05%.96 This is not indicative of a broad-based improvement in national productivity.
120. Three of the top four award reliant industries experienced very weak productivity growth in the years from 2011-12 to 2016-17. The notable exception was the retail sector. Although, as discussed below, this is not representative of strong conditions in the retail space but rather improvements in the distribution of goods and services. Indeed, retail trade conditions continue to be weak.
Table 5– Multifactor productivity – hours worked basis97 2011-
12 2012-13
2013-14
2014-15
2015-16
2016-17
Agriculture, Forestry and Fishing 1.92 0.60 -0.27 2.24 -7.05 16.77 Mining -9.45 -4.53 1.55 7.04 2.98 0.52 Manufacturing 2.73 -2.42 0.90 -0.66 1.72 -4.85 Electricity, Gas, Water and Waste Services -2.84 1.12 -5.75 2.53 0.35 1.17 Construction 10.19 2.38 0.75 -3.53 -2.49 -7.55 Wholesale Trade 5.46 0.39 4.15 2.20 7.64 3.92 Retail Trade 3.08 1.46 0.97 0.55 1.65 3.16 Accommodation and Food Services 3.56 -2.17 2.95 -0.47 3.32 -1.56 Transport, Postal and Warehousing 3.50 0.68 -1.91 -2.57 -0.20 1.81 Information, Media and Telecommunications -2.27 -2.53 6.95 3.22 5.98 -0.28 Financial and Insurance Services 2.33 3.55 1.29 3.52 1.18 2.08 Rental, Hiring and Real Estate Services 3.60 7.24 6.16 1.12 7.68 0.07 Professional, Scientific and Technical Services 0.83 0.68 0.04 -3.84 0.38 3.90 Administrative and Support Services -2.11 0.48 7.17 0.58 -2.83 -3.42 Arts and Recreation Services 0.79 -2.74 6.56 -5.85 -2.14 6.04 Other Services 3.99 -3.72 -3.55 2.03 -0.04 -4.70
121. The International Monetary Fund (IMF) recently noted that slow productivity growth can be a bigger reason for slow nominal wage growth, comparative to a country’s unemployment rate.98
96 ABS, Cat. No. 5260.0.55.002 - Estimates of Industry Multifactor Productivity, 2016-17. 97 ABS, Cat. No. 5260.0.55.002 - Estimates of Industry Multifactor Productivity, 2016-17.
28 Fair Work Commission Minimum Wage Panel Annual Minimum Wage Review 2017-18 – 13 March 2018
122. The Australian Chamber submits that the productivity figures conclude that the economy is not performing well enough for a sizeable, broad-based, regulated increase in wages.
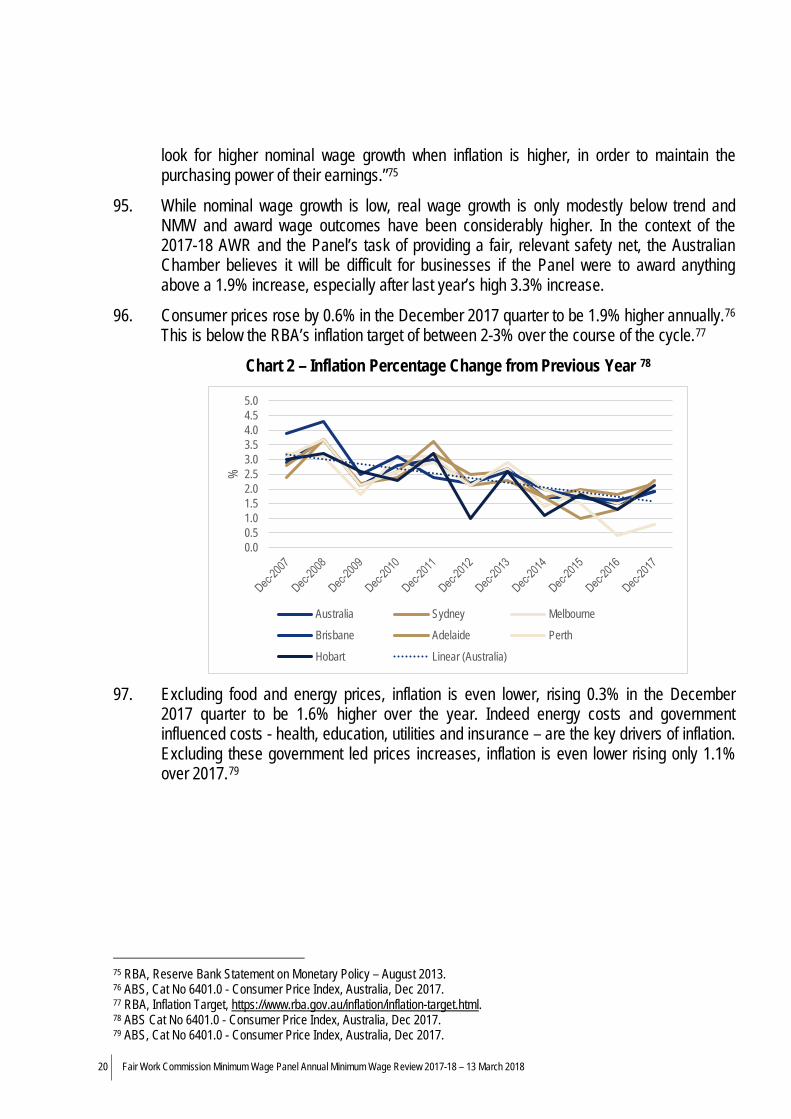
5.9 Employment and participation 123. Employment increased by 16,000 in the month of January 2018, reflecting a 65,900
increase in part-time employment and a 49,800 drop in full-time employment. The participation rate fell from 65.7% to 65.6%. The unemployment rate slipped from 5.6% to 5.5%.99
124. Over the year to January 2018, 403,000 jobs have been created with 293,000 of those full-time jobs. Part-time jobs rose by 110,000. The unemployment rate has declined from 5.7% to 5.5%.100
125. Over the past year there has been strong growth in full-time jobs, with the number of employed persons in full-time jobs rising by 3.3% over the year to January 2018. Over the same period, part-time employment rose by 2.8%.101 As Table 6 shows, employment growth of this magnitude has not been witnessed since over the year to January 2008, pre GFC.
Table 6: Year on year changes in labour force between 2007 and 2018102
Total employed Employed full-time Employed part-time
Jan 07 – Jan 08 3.4% 3.2% 4.1% Jan 08 – Jan 09 1.6% 1.8% 1.0% Jan 09 – Jan10 1.3% -1.1% 7.4% Jan 10 – Jan 11 2.4% 2.9% 1.2% Jan 11 – Jan 12 1.0% 1.3% 0.2% Jan 12 – Jan 13 1.4% 1.3% 1.7% Jan 13 – Jan 14 0.1% -1.3% 3.5% Jan 14 – Jan 15 1.3% 1.2% 1.7% Jan 15 – Jan 16 2.6% 2.0% 3.9% Jan 16 – Jan 17 1.0% -0.5% 4.3% Jan 17 – Jan 18 3.3% 3.6% 2.8%
126. While employment growth in the award-reliant industries has been robust as a whole, in some industries (notably the retail and accommodation and food sectors) most of the jobs growth has been driven by part-time employment (63% and 64% respectively). Across all
98 Gee Hee Hong, Zsoka Koczan, Weicheng Lian, Malhar Nabar. ‘The Disconnect Between Unemployment and Wages’, IMF Blog, 27 Sept 2017. 99 ABS Cat No 6202.0 - Labour Force, Australia, Jan 2018. 100 ABS Cat No 6202.0 - Labour Force, Australia, Jan 2018. 101 ABS, Cat. No. 6202.0 Labour Force, Australia, Jan 2018. 102 ABS, Cat. No. 6202.0 Labour Force, Australia, Jan 2018.

29 Fair Work Commission Minimum Wage Panel Annual Minimum Wage Review 2017-18 – 13 March 2018
industries, part-time employment growth accounts for 20% of the total growth in the 12 months to November 2017.103
127. The fact that part-time employment growth is such a significant component of employment growth in many of the award-reliant industries most likely reflects the competitive tension award-reliant industries face in trying to deliver services and goods, while fighting weak profit and sales growth.
128. While employment outcomes have been strong and the labour market clearly continues to improve, there still remains clear excess capacity – especially in the award-reliant industries. This is evidenced by the still high rate of underemployment and also low wage growth.
129. As the Panel identified in the 2016-17 decision, different parts of Australia continue to have diverse economic outcomes.104 As Table 7 shows Greater Sydney, for example, has one of the lowest unemployment rates in Australia at 4.8%. Conversely, the rest of NSW has the highest unemployment rate at 7.2%.
Table 7: Unemployment rates for states, territories and regions105 Region January 2018 January 2017
New South Wales 5.5% 5.5% Greater Sydney 4.8% 5.2% Rest of NSW 7.2% 6.1% Victoria 6.1% 6.3% Greater Melbourne 6.2% 6.5% Rest of VIC 5.9% 5.6% Queensland 6.5% 6.6% Greater Brisbane 7.1% 6.6% Rest of QLD 5.9% 6.7% South Australia 6.3% 6.8% Greater Adelaide 6.8% 7.1% Rest of SA 4.6% 5.5% Western Australia 6.1% 6.8% Greater Perth 6.0% 7.0% Rest of WA 6.6% 5.9% Tasmania 5.4% 5.9%
103 ABS Cat No 6202.0 - Labour Force, Australia. 104 [2017] FWCFB 3500 at [39]. 105 ABS Cat.No. 6291.0.55.001 Labour Force, Australia, Detailed, Jan 2018, Table 2, Original.

30 Fair Work Commission Minimum Wage Panel Annual Minimum Wage Review 2017-18 – 13 March 2018
Greater Hobart 5.7% 5.1% Rest of TAS 5.2% 6.4% Australia 6.0% 6.1%
Table 8: Unemployment rate, states and territories106
State Seasonally adjusted
January 2018 January 2017 New South Wales 5.1% 5.1% Victoria 5.6% 5.8% Queensland 6.1% 6.2% South Australia 6.0% 6.4% Western Australia 5.7% 6.4% Tasmania 5.3% 5.7% Australia 5.5% 5.7%
130. As Chart 6 shows, the seasonally adjusted unemployment rate for Australia has been trending down for the past year. This can camouflage the differences in employment growth across regions, states and territories.
Chart 6: Unemployment rate, seasonally adjusted107
106 ABS Cat.No. 6202.0 - Labour Force, Australia, Jan 2018, Table 12. 107 ABS, Cat. No. 6202.0 Labour Force, Australia, Jan 2018, Table 1.
5.1
5.2
5.3
5.4
5.5
5.6
5.7
5.8
5.9
%
Unemployment rate Linear (Unemployment rate)

31 Fair Work Commission Minimum Wage Panel Annual Minimum Wage Review 2017-18 – 13 March 2018
131. The participation rate in seasonally adjusted terms rose 1% from 64.6% in January 2017 to 65.6% in January 2018.108
132. Hours worked per employee continue to decline, falling to 137 hours per month per employee compared to 140.23 hours at the time of last year’s wage decision and 143.1 hours per month a decade ago.109
133. Seasonally adjusted monthly hours worked in all jobs decreased by 1.39%, or 24.1 million hours, in January 2018 to 1 708.1 million hours.110 Underlying compositional changes show a larger decrease in hours worked by full-time workers (22 million hours), than part-time workers (2 million).111
134. The underemployment rate has decreased from 9.7% in January 2017 to 9.6% in January 2018.112 Underemployment is especially high in South Australia, Queensland and Tasmania, all with rates above 10% in January 2018.113 Female underemployment in these states and Western Australia is particularly high, exceeding 12%.114
135. There were over 1 million underemployed persons in January 2018 - 630,000 were female and 462,000 were male. Of the underemployed approximately 92% were part-time and, of those, 60% were female part-time employees.115
136. Based on age cohort, just over one-third (18.5%) of the total number of underemployed are those aged between 15-24.116 Just under half of those are male and just over half female. A further 18% are in the 25-34 age cohort (underemployment ratio of 6.8%) with 45% of those male and 55% female.
137. In the 45-54 age cohort (18% of total underemployed), females have much higher representation and account for 70% of the total number of underemployed in that age cohort.
138. The underemployment rate previously fluctuated within a stable range of approximately 6% to 7% from 1992 till the GFC. In the wake of the GFC, the underemployment rate has been on a clear upward trend, peaking in 2017 at the time of the last wage review decision.117
139. This stability occurred even as the proportion of the labour force working part-time rose from 23% in early 1992 to 28% by mid-2008. The underemployment rate reached a cycle trough in 2008 even as the proportion of part-time employment was continuing to rise.
140. In the award-reliant industries rates of underemployment are significantly higher than the all industry average, reflecting the weaker profit and sales growth environment for those
108 ABS, Cat. No. 6202.0 Labour Force, Australia, Jan 2018, Table 1. 109 ABS, Cat. No. 6202.0 Labour Force, Australia, Jan 2018. 110 ABS Cat.No. 6202.0 Labour Force, Jan 2018. 111 ABS Cat.No. 6202.0 Labour Force, Jan 2018. 112 ABS Cat.No. 6202.0 Labour Force, Jan 2018, Table 25. 113 ABS Cat.No. 6202.0 Labour Force, Jan 2018, Table 25. 114 ABS Cat.No. 6202.0 Labour Force, Jan 2018, Table 25. 115 ABS Cat.No. 6202.0 Labour Force, Jan 2018. 116 ABS Cat.No. 6202.0 Labour Force, Jan 2018. 117 ABS Cat.No. 6202.0 Labour Force.

32 Fair Work Commission Minimum Wage Panel Annual Minimum Wage Review 2017-18 – 13 March 2018
industries. The underemployment ratio in the retail industry was 17.4% in the three months to November 2017. In the accommodation, café and food services industry, the underemployment ratio was 22.6%, while in the administrative and support services sector the ratio was 13.2%.118
141. These labour market conditions indicate that there is ongoing spare capacity in our labour market, and that employment is following the slow marginal growth of the Australian economy following the collapse of the mining boom in 2012. This is not a strong labour market and is only just beginning to show signs of recovery. It should cause the Panel to constrain increases in statutory wages growth at this time to the reasonable level proposed by the Australian Chamber.
142. It is also important to take into account that some areas of Australia have much weaker labour markets than others, as Table 7 shows. Some sections of the Australian labour market are also weaker than others, with long term unemployment and youth employment continuing to be a significant challenge. The youth unemployment rate was 13.5% in January 2017 and remains the same in January 2018.119
Table 9: Youth unemployment rate by state120 Unemployed Unemployed Looked for full
time work Looked for part time work
Total unemployed Unemployment rate %
State ‘000 ‘000 ‘000 % New South Wales 47.2 28.1 75.3 11.0 Victoria 40.6 45.9 86.4 15.0 Queensland 42.5 28.9 71.4 14.8 South Australia 11.9 10.1 22.0 15.2 Western Australia 18.5 12.0 30.5 13.5 Tasmania 3.5 2.3 5.8 12.9 Northern Territory 1.7 0.3 2.0 10.1 ACT 3.3 2.4 5.7 13.8 Australia 169.2 130.0 299.2 13.5
143. In the year to December 2017, the only region in Australia where state final demand contracted was Western Australia (-3.1%).121 In contrast the remaining states and territories experienced economic growth during 2017, led by the Australian Capital Territory (5.0%) and South Australia (4.9%).122
118 ABS Cat No 6291.0.55.003 - Labour Force, Australia, Detailed, Quarterly, Feb 2017. 119ABS Cat.No. 6291.0.55.001 Labour Force, Australia, Detailed, Jan 2018. 120ABS Cat.No. 6291.0.55.001 Labour Force, Australia, Detailed, Jan 2018. 121 ABS Cat.No. 5206.0 - Australian National Accounts: National Income, Expenditure and Product, Dec 2017. 122 ABS Cat.No. 5206.0 - Australian National Accounts: National Income, Expenditure and Product, Dec 2017.
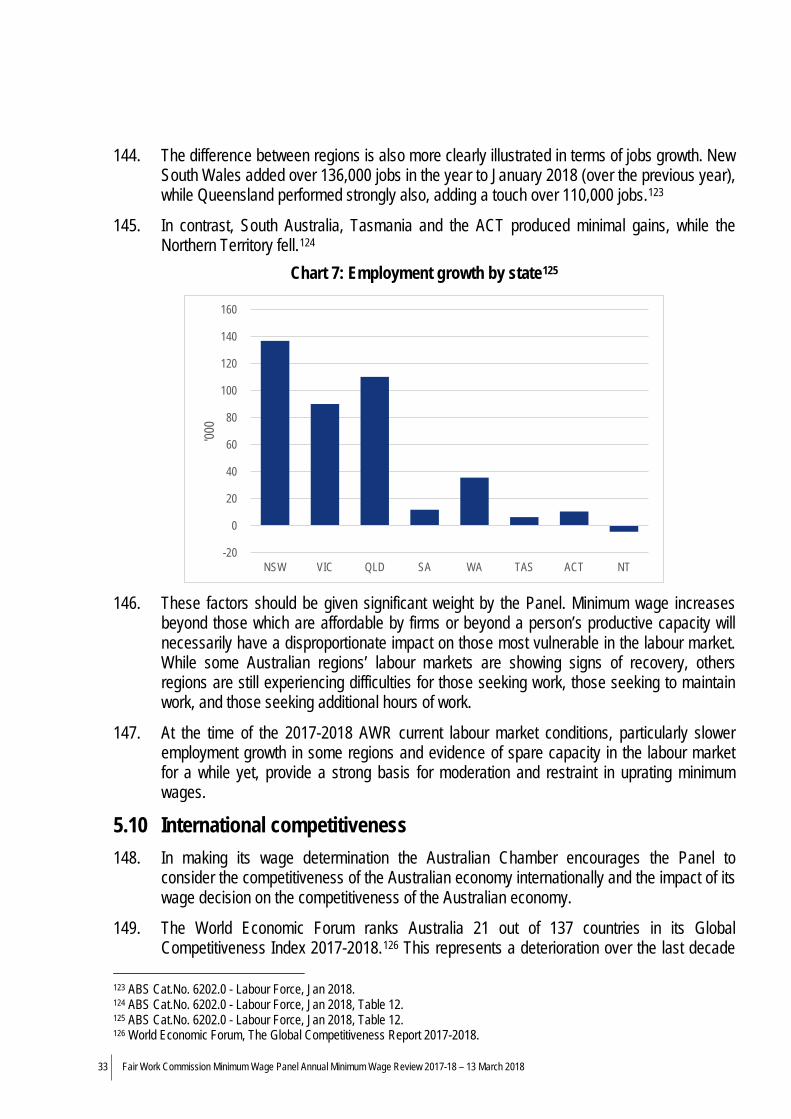
33 Fair Work Commission Minimum Wage Panel Annual Minimum Wage Review 2017-18 – 13 March 2018
144. The difference between regions is also more clearly illustrated in terms of jobs growth. New South Wales added over 136,000 jobs in the year to January 2018 (over the previous year), while Queensland performed strongly also, adding a touch over 110,000 jobs.123
145. In contrast, South Australia, Tasmania and the ACT produced minimal gains, while the Northern Territory fell.124
Chart 7: Employment growth by state125
146. These factors should be given significant weight by the Panel. Minimum wage increases
beyond those which are affordable by firms or beyond a person’s productive capacity will necessarily have a disproportionate impact on those most vulnerable in the labour market. While some Australian regions’ labour markets are showing signs of recovery, others regions are still experiencing difficulties for those seeking work, those seeking to maintain work, and those seeking additional hours of work.
147. At the time of the 2017-2018 AWR current labour market conditions, particularly slower employment growth in some regions and evidence of spare capacity in the labour market for a while yet, provide a strong basis for moderation and restraint in uprating minimum wages.
5.10 International competitiveness 148. In making its wage determination the Australian Chamber encourages the Panel to
consider the competitiveness of the Australian economy internationally and the impact of its wage decision on the competitiveness of the Australian economy.
149. The World Economic Forum ranks Australia 21 out of 137 countries in its Global Competitiveness Index 2017-2018.126 This represents a deterioration over the last decade
123 ABS Cat.No. 6202.0 - Labour Force, Jan 2018. 124 ABS Cat.No. 6202.0 - Labour Force, Jan 2018, Table 12. 125 ABS Cat.No. 6202.0 - Labour Force, Jan 2018, Table 12. 126 World Economic Forum, The Global Competitiveness Report 2017-2018.
-20
0
20
40
60
80
100
120
140
160
NSW VIC QLD SA WA TAS ACT NT
'000

34 Fair Work Commission Minimum Wage Panel Annual Minimum Wage Review 2017-18 – 13 March 2018
when Australia ranked 19th. As an advanced, wealthy nation Australia could and should be performing better.
150. Australia’s ranking of 28 in the labour market efficiency pillar shared the weakest ranking across all indicators for Australia, bringing it below the top 25 countries. Worryingly, Australia ranked 72 out of 137 countries for ‘cooperation in labour-employer relations’, suggesting that there was very little co-operation in our labour market. Australia was ranked even lower for the ‘flexibility of wage determination’ indicator, being ranked 109 out of 137 countries.127
151. The international competitiveness of Australia’s economy is vital to its economic success. Australia benefits from foreign capital being invested here. As such, it is absolutely essential Australia be an attractive place for foreign capital for its future prosperity and therefore improve its international competitiveness.128
5.11 Outlooks and Forecasts 152. GDP growth is expected to pick up over 2018 and 2019 to a little above 3%, supported by
low interest rates, the diminishing drag on growth from falling resource investment and rising resource exports.129
153. World economic growth is expected to increase slightly, with forecasts for global growth being upgraded in 2018. Global output was estimated to have grown 3.7% in 2017, 0.5 percentage points higher than in 2016.130 Internationally, there remains uncertainty around inflation and wage growth. There is a risk that global growth in 2018 continues at its 2017 pace, which may result in countries experiencing capacity constraints and weaker growth in 2019.131
Table 10: Mid-Year Economic and Fiscal outlook, 2017-18132
2016 Outcomes
2017 Forecasts
2018 Forecasts
2019 Forecasts
World 3.2 3.5 3.5 3.75
Major trading partners 4 4.25 4 4
127 World Economic Forum, The Global Competitiveness Report 2017-2018, pages 51-52. 128 House of Representatives Standing Committee on Economics, Reserve Bank of Australia annual report 2017, 16 February 2018. 129 RBA, Statement on Monetary Policy, February 2018, Table 6.1. 130 IMF, World Economic Outlook, January 2018. 131 Australian Government, Mid-Year Economic and Fiscal Outlook 2017-18, page 12. 132 Australian Government, Mid-Year Economic and Fiscal Outlook 2017-18, page 13.

35 Fair Work Commission Minimum Wage Panel Annual Minimum Wage Review 2017-18 – 13 March 2018
Table 11: IMF World Economic Outlook133
2017 Estimates
2018 Forecasts
2019 Forecasts
Australia 2.2 2.9 3.1
Advanced Economies
2.3 2.3 2.2
World 3.7 3.9 3.9
154. It is worth noting that Australia’s future growth is not without its vulnerabilities. The IMF recently noted that Australia needs to raise long-term productivity and address financial vulnerabilities. The Australian economy still has not returned to full employment.134
155. This is significant, and points to a weaker and more susceptible Australian economy, with significant spare capacity. The Panel should be mindful of this as a further factor warranting caution and moderation in uprating minimum wages.
Table 12: RBA economy forecasts, year-ended growth rates135
Dec-17 Jun-18 Dec-18 Jun-19 Dec-19 Jun-20
GDP growth 2 ½ 2 ¾ 3 ¼ 3 ½ 3 ¼ 3
Unemployment 5.5 5 ¼ 5 ¼ 5 ¼ 5 ¼ 5 ¼
CPI inflation 1.9 2 2 ¼ 2 ¼ 2 ¼ 2 ¼
Underlying inflation
1 ¾ 1 ¾ 1 ¾ 2 2 2 ¼
133 IMF, World Economic Outlook, January 2018. 134 IMF, Australia : 2017 Article IV Consultation-Press Release; Staff Report; and Statement by the Executive Director for Australia, February 2018. 135 RBA, Statement on Monetary Policy, February 2018, Table 6.1

36 Fair Work Commission Minimum Wage Panel Annual Minimum Wage Review 2017-18 – 13 March 2018
Table 13: Mid-year Economic and Fiscal Outlook 2017-18, Domestic economy forecasts, disaggregated136
Outcomes Forecasts 2016-17 2017-18 2018-19
Real gross domestic product 2.0 2.5 3 Household consumption 2.4 2.25 2.75 Dwelling investment 2.6 -1.5 -1.5 Total business investment -4.0 2 3 Mining investment -24.2 -8 -3 Non-mining investment 6.0 5 5 Private final demand 1.3 1.75 2.5 Public final demand 5.0 4 3 Change in inventories 0.1 0 0 Gross national expenditure 2.2 2.5 2.75 Exports of goods and services 5.4 3 4 Imports of goods and services 4.8 3 2.5 Net exports 0 0 0.25 Nominal gross domestic product 5.8 3.5 4 Prices and wages Consumer price index 1.9 2 2.25 Wage price index 1.9 2.25 2.75 GDP deflator 3.7 1 0.75 Labour market Participation rate (%) 64.9 65 64.75 Employment 1.9 1.75 1.5 Unemployment rate (%) 5.6 5.5 5.25 Balance of payments Terms of trade 14.5 -2 -5 Current account balance (per cent of GDP) -1.9 -2 -2.5
136 Australian Government, Mid-Year Economic and Fiscal outlook 2017-18, Canberra .

37 Fair Work Commission Minimum Wage Panel Annual Minimum Wage Review 2017-18 – 13 March 2018
156. The Panel has maintained over successive reviews that there is a primary focus on actual data rather than forecasts as it is considered more reliable”.137 However, to the extent that forecasts are considered, the Panel does this in the context of the immediate future year.138 Given ongoing uncertainty, spare capacity in the labour market and tentative signs of economic recovery the Australian Chamber encourages the Panel to treat forecast data with caution, and as warranting caution, in approaching the 2017-2018 AWR and the uprating of minimum wages.
6 Social considerations – relative living standards and the needs of the low paid
6.1 Introduction
157. The Australian Chamber has consistently noted that minimum wage fixation is not an effective way of addressing the needs of the low paid and that the tax and transfer system is better targeted to address the actual household circumstances of low paid employees and provide any necessary support. As noted by the Australian Government during the Annual Wage Review 2016-17 among the low-paid, household financial situations are diverse with a significant proportion of the low paid residing in higher income households, 17.9% of low-paid employees in the bottom two household income deciles and 13.6% in the top two deciles.139
158. Research Report 3/2018 also found that:
a. Minimum wage earners are found throughout the distribution of household income, with most residing in the middle-income households which could reflect findings indicating that many minimum wages workers are not the primary earner of a multiple-earner household;140
b. While minimum wage earners are strongly concentrated among low-income households compared to other employed persons, when compared with the wider population, lower income groups are dominated by the unemployed and those outside the labour force.141 This limits the effectiveness of wage setting in the context of the needs of the low paid.
159. Nevertheless, the minimum wages objective requires that this consideration be taken into account in conducting annual wage reviews. As the Panel set out in its 2017 decision:
137 [2016] FWCFB 3500 at [190]. 138 [2016] FWCFB 3500 at [203]. 139 Australian Government Submission to the Fair Work Commission Annual Wage Review 2017, 29 March 2017, p. 2. 140 Fair Work Commission, Research Report 3/2018, Characteristics of workers earning the national minimum wage rate and of the low paid, February 2018, pp. 4-5. 141 Fair Work Commission, Research Report 3/2018, Characteristics of workers earning the national minimum wage rate and of the low paid, February 2018, pp. 5.

38 Fair Work Commission Minimum Wage Panel Annual Minimum Wage Review 2017-18 – 13 March 2018
[360] The Panel is required by both the minimum wages objective and the modern award objective to take into account relative living standards and the needs of the low paid when setting fair and relevant minimum wage rates. Those matters are different, but related, concepts and must be considered, together with the other matters in ss.3, 134(1) and 284(1) of the Act, in the context of available data and research.142
160. The Panel also broadly sketched how it goes about this assessment: [361] The assessment of relative living standards requires a comparison of the living standards of workers reliant on the NMW and minimum award rates determined by the Review with those of other groups that are deemed to be relevant and focuses on the comparison between low-paid workers (including NMW and award-reliant workers) and other employed workers, especially non-managerial workers.
[362] The assessment of the needs of the low paid requires an examination of the extent to which low-paid workers are able to purchase the essentials for a ‘decent standard of living’ and to engage in community life, assessed in the context of contemporary norms.143
161. The Australian Chamber has in previous years argued that the comparisons referred to in paragraph [361] of the 2016-2017 AWR Decision above should extend to those out of work, and others have also argued for comparisons to those in our community not participating in the labour market / not in employment. We note the following clarification in the 2016 decision:
…Consistent with our past approach, our assessment of relative living standards focusses mainly on the comparison between award-reliant workers and other employed workers, especially non managerial workers. This focus does not exclude a comparison with other relevant groups...144
162. We maintain that the unemployed, small business income and welfare recipients should be included in comparisons undertaken under the minimum wage setting schema of the Act. The Australian Chamber cannot identify anything in the statutory framework that would suggest that an assessment of relative living standards should only entail a comparison of award-reliant employees and employees that are not employed pursuant to awards. However we acknowledge that this view departs from the Panel’s interpretation and that the Panel attaches limited relevant to a comparison with pensioners.145
6.2 Assessing Data and Research
142 [2017] FWCFB 3500. 143 [2017] FWCFB 3500. 144 [2016] FWCFB 3500 at [354] 145 [2016] FWCFB 3500 at [354] – [357].

39 Fair Work Commission Minimum Wage Panel Annual Minimum Wage Review 2017-18 – 13 March 2018
163. We urge caution in how the Panel approaches research brought forward from any party to advance its position in Annual Wage Review. Returning to paragraph [360] of the 2016-17 AWR Decision:
Those matters are different, but related, concepts and must be considered, together with the other matters in ss.3, 134(1) and 284(1) of the Act, in the context of available data and research (emphasis added).146
164. An important caveat is not included in this description, but we say it is logical and implied. The mere availability of data and research cannot of itself make it determinative or relevant to the Panel’s considerations or the weighing of those considerations.
165. Any particular piece of research and data that is available should only become part of the considerations in this matter to the extent that it is: a. Valid and not subject to technical or methodological caveats or criticisms (or
alternatively those criticisms or caveats will go to the weight that can be attached to the material and caution in the extent it is persuasive);
b. Demonstrably relevant and applicable to the considerations at hand; and
c. Not outweighed by competing data or analysis (or such competing information should go to the weight which can be attached to both pieces of research / data).
166. To speak plainly, the mere existence and availability of the Budget Standards research from Peter Saunders and Megan Bedford for this review does not automatically dictate that: a. This research is relevant to this matter or should be relied upon by the Panel;
b. It should automatically or axiomatically be accorded any particular, or additional, determinative weight;
c. Any submitting party can treat this material as an unquestioned or automatically authoritative source which they do not need to properly argue to have weight in the Panel’s decision making.
167. The availability of the Budget Standards research does not in itself make it relevant or reliable for the task before the Panel in relation to s. 284(1)(c) of the Act, nor does it elevate relative living standards and the needs of the low paid above other considerations – even were it to show stark minimum wage inadequacy (which it does not). The Panel has previously stated that no particular primacy is attached to any of the considerations identified in the modern awards objective (s.134(1)(a)-(h)) or in the minimum wages objective (s. 284(1)(a)(e)) and this formed the primary basis for its rejection of a medium-term target proposal advanced by United Voice and the ACTU linked to median wages with
146 [2017] FWCFB 3500, p.92, emphasis added.

40 Fair Work Commission Minimum Wage Panel Annual Minimum Wage Review 2017-18 – 13 March 2018
the Panel finding that such a target would effectively elevate one statutory consideration (‘relative living standards and the needs of the low paid’) above the other considerations the Panel is required to take into account.147
168. As set out below, employers argue for a cautious, iterative approach to this material which is new to this annual wage review process. To the extent the Panel is attracted to the Budget Standards material and wishes to accord weight to it in its decision making, we suggest the Panel advance any conclusions tentatively or provide suggestions of its thinking at this point which can be responded to and engaged with in 2019 and beyond. This material is new and a conversation needs to be started around it, which may not be assisted by too definitive an approach to its relevance or reliability in this first instance of minimum wage uprating.
169. We commend the authors for their frankness on the limitations of the material and where they made assumptions. This supports the caution we urge as to its usage.
170. Above all however, we reiterate that the budget standards cannot of themselves be determinative of the NMW or any uprating in minimum award rates.
6.3 Budget Standards research
171. The Australian Chamber thanks Professor Saunders and Ms Bedford for this research, and for a potentially relevant new contribution to minimum wage uprating through these reviews, noting the above approach we say the panel should adopt in regard to it. We also thank them for the presentation of the material on 27 November 2017, engagement with questions and openness on the strengths versus limitations of the approach taken and various caveats and assumptions they relied upon.
172. The Australian Chamber will in part wait to see what others ask the Panel to make of this material and respond accordingly. However we do urge the Panel to be guided by the numerous limitations the authors draw for the relevance of their own findings, including:
Budget standards are not a panacea but they provide important information that can inform and assist decisions taken about adequacy – at the very least, they open up debate about the meaning of adequacy, what is needed to achieve it and how the associated costs can be identified and estimated.148
173. We also rely on our earlier written submissions on this matter. Budget standards are not a panacea in this matter, and nor could they be given that relative living standards and needs
147 [2017] FWCFB 1931 at paras 64 and 66. 148 Peter Saunders and Megan Bedford ,Seminar Presentation to the Fair Work Commission, New Budget Standards for Low-Paid and Unemployed Australians – Project Methods and Key Findings, Social Policy Research Centre University of New South Wales, Monday 27 November 2017.

41 Fair Work Commission Minimum Wage Panel Annual Minimum Wage Review 2017-18 – 13 March 2018
are one consideration to be balanced among a number. The budget standards are useful and relevant to informing the Panel, however: a. They are most useful as the authors indicate in opening up debates on the income
adequacy, and debates on what more we can know about “relative living standards and the needs of the low paid”, based on this material.
b. The authors also point to the need to debate and understand means to achieve income adequacy and the “associated costs” of any decisions. These known unknowns favour the cautious approach we commend to the Panel.
c. The authors appear to indicate that the costs of any changes of approach based on this material are yet to be determined. They also seem make clear that it is early days for the latest iteration / substantial revision of this research, and that their research can be subject to subsequent revisions for errors:
I hate to admit this as a researcher, where we didn't document carefully enough what we did. So in our report we published last time we said this is how we did something, but when we looked at the budgets it didn't appear to be consistent with that, at least not for all families, so we had to go and unravel the budgets again and find out exactly what we did last time, to decide whether we wanted to do the same this time or something slightly different, so that also took quite a long time.149
174. What follows are a number of comments and observations on the budget standards that should, in addition to the limitations and cautions drawn by the authors, favour the Panel: a. Adopting a cautious approach to the Budget Standards material.
b. Not relying upon to it to inflate or add to any sensible level of uprating that would otherwise be awarded on this occasion.
175. Reading through the transcript of 27 November 2017, it seems clear that the researchers want to add to our collective capacities to assess needs against payments, and create tools that can be manipulated to model scenarios. However it seems equally clear that the authors are opening up their assumptions (which are numerous and highly subjective) for debate and input from others.
So there's all kinds of questions thrown up by this work and, as I say, we're not suggesting that this is the last word on the subject, I'd like to think of it as opening a debate and I hope that bodies like the Fair Work Commission will continuously use these results. The more we use these results the better people will get at them and the more likely we are to reach a consensus on how to do things that we might disagree with now. So rather than the Fair Work Commission having the industry groups and the ACOSS's of this world putting in mutually contradictory submissions
149 27 November 2017, Transcript, PN27

42 Fair Work Commission Minimum Wage Panel Annual Minimum Wage Review 2017-18 – 13 March 2018
each time, about budget standards, one saying they're brilliant, the other one saying they're rubbish, can't we actually think about a mechanism that would allow us to identify what the differences are and see if we can come closer together in terms of what we think is a reasonable approach to dealing with these issues and what those approaches produce, in terms of final results.150
176. This paints a picture of a part completed contribution that needs to be refined and bedded down, and Professor Saunders calls for more funding to continue the project seem consistent with that.
177. As business representatives, we are not saying the budget standards of no worth but we are saying they fall well short of reliability at this stage.
178. This favours caution and limitation in any impact this material could have on the level of any 2018 increase. There is no smoking gun in the budget standards material, and no sea change of approach or uprating of an otherwise merited level of increase can be justified based on this material.
6.4 The research rests on numerous subjective judgements
179. The question for the Panel is one of confidence and the extent to which the Panel can conclude the Budget Standards have got close enough to actual needs and spending to inform the decision on this matter. We say there is a distance to go, and that the standards research needs to be approached with caution based on its inherent limitations, which the authors are clear and upfront about.
180. Professor Saunders and Ms Bedford, in presenting the research, pointed to the numerous subjective judgements that have gone into the standards.151 Excluding cigarettes and alcohol, and applying NHMRC nutritional guidelines may seem logical and defensible, but it is not clear whether this reflects how households with award wage earners actually spend their income. It is also clear from Ms Bedford’s explanation that significant and repeated subjective judgements were necessary to deliver the standards materials – and these would need external validation to be defensible.
181. A good example is the inclusion of a car in the budget for employed households but not unemployed ones. Of course many people in receipt of award wages absolutely need a car, but equally others do not and judgments are made about where economies can be made. Other examples of subjectivity include approaches to childcare, housing and holidays.
150 27 November 2017, Transcript, PN60. 151 For example 27 November 2017, Transcript, PN12 – PN14.

43 Fair Work Commission Minimum Wage Panel Annual Minimum Wage Review 2017-18 – 13 March 2018
182. We note the acknowledgement of this criticism in the standards paper,152 but suggest that it has by no means been disposed of.
6.5 Housing
183. It seems clear that the housing assumptions and housing costs are all but determinative of the standards and what they show. Housing is the largest component of all the budgets,153and changes in the assumptions on housing seem to push particular incomes into the adequate vs inadequate basket.
184. It also seems clear that: a. Housing costs vary markedly, if not wildly between capitals and this can determine or
distort the data depending on your perspective.
b. Sydney and to a lesser extent Melbourne are outliers (and we note that unemployment is lowest in parts of those cities, along with the ACT).
c. There are subjective judgments in the housing standards, some of which do not necessarily stand up to scrutiny. This includes:
i. The assumption childless couples on a single award wage would live in a two bedroom rather than one bedroom dwelling.
ii. The assumption that a family with two children would have a three bedroom rather than two bedroom house.
185. It is also clear however that the Panel sets a single national level of increase, without state or regional differences. The Budget Standards seem only to be relevant to a highest common denominator approach.
186. Mr Barklamb of the Australian Chamber had an instructive exchange with Professor Saunders on the assumptions behind the housing standards.154
187. In essence (if we have understood it correctly): a. The Budget Standards research as presented155 shows “adequacy” for three of five
low paid scenarios (single adults, couples with one child, and sole parents with one
152 Saunders, P. and Bedford, M. (2018) New Minimum Income for Healthy Living Budget Standards for Low-Paid and Unemployed Australians, p.13. 15327 November 2017, Transcript, PN44 .. 154 27 November 2017, Transcript, PN61 – PN68. 155 Peter Saunders and Megan Bedford ,Seminar Presentation to the Fair Work Commission, New Budget Standards for Low-Paid and Unemployed Australians – Project Methods and Key Findings, Social Policy Research Centre University of New South Wales, Monday 27 November 2017, PowerPoint slide “Assessing the Adequacy of the Social Safety Net”, unnumbered.

44 Fair Work Commission Minimum Wage Panel Annual Minimum Wage Review 2017-18 – 13 March 2018
child). That is, the existing minimum wage without significant uprating is adequate in three of five projected scenarios.
b. However, we question the assumption that couples with no children need to have a two bedroom dwelling, or that adequacy need be assessed against this standard. To paraphrase our understanding of the discussion on 27 November, Professor Saunders acknowledged that if the childless couple on a single safety net income shared a single bedroom apartment, their income would also be adequate.
c. This means that under the existing minimum wage / approach of recent years, four of five family types are adequately covered, and only in one scenario is adequacy called into question. We cannot see, in such a scenario, that the Budget Standards can be any form of game changer in how award rates are uprated.
188. We can add to this that the table in the Powerpoint headed “Average Rents for Assigned Dwellings” shows Sydney is clearly distorting the housing figures. The Sydney rents were materially higher than the highest of the other capitals for each of the low paid family scenarios. The “Sydney, Brisbane, & Melbourne” average rents are all so distorted by Sydney that they exceed the highest of all other capitals.
189. We do however note that local labour markets in parts of Sydney are amongst strongest nationally.
190. Professor Saunders seems to acknowledge that looking at costs in Sydney is inherently distortionary and unrepresentative. Again this is a factor favouring caution, in particular this time in the generalisability of Sydney base calculations.156
6.6 Temporal assumptions
191. We also note that the putative 2016 data does not include the 2.4% increase payable on 1 July of that year (nor indeed the even higher 3.3% awarded in 2017).157 This would seem to limit the analysis and its relevance, particularly in light of a low inflationary environment across the period.
6.7 Missing material
192. It is clear that the authors judged that three elements of research158 were necessary to get close enough with confidence to the needs and expenditures of the low paid:
156 27 November 2017, Transcript, PN22 – PN26. 157 Saunders, P. and Bedford, M. (2018) New Minimum Income for Healthy Living Budget Standards for Low-Paid and Unemployed Australians, p.102. 158 27 November 2017, Transcript, PN14.

45 Fair Work Commission Minimum Wage Panel Annual Minimum Wage Review 2017-18 – 13 March 2018
a. Expert evidence / normative data; and
b. Behavioural evidence / survey data; and
c. Experiential evidence / focus groups with low income people.
193. Professor Saunders made clear however that his team could not run the necessary focus groups with low paid people159 (Part (c)). Professor Saunders indicated that “we had far fewer focus groups with the low paid groups than we did with the unemployed”.
194. This means that an important validation that was to be fundamental to the budget standards research could not be completed.
195. He further makes clear that with more effort, planning and money the research could have been improved in line with the full range of components the researchers wanted to deliver upon. Again, this does not invalidate the Budget Standards material, but it favours caution in what can be made of this initial attempt to generate such data.
6.8 This is not the measure “most poverty researchers use”
196. Again, if we understood Professor Saunders correctly, and the slide entitled “Comparisons with Existing Poverty Lines ($ per week, June 2016)”, then the budget standards calculations for those on safety net wages exceed both the Henderson poverty line and 50% of median income markedly.160 We presume if these long standing measures were used, existing minimum wages would essentially present as adequate, with no case for uprating or for any uprating in excess of inflation.
197. Professor Saunders also makes clear that “most researchers”161 currently use the more traditional measures that generate lower ‘standards’ against which current wages can be compared.
198. Respectfully, and in his own words, we understood Professor Saunders to be acknowledging that the Budget Standards were new and exceeded the existing academic consensus on adequacy. Again this does not invalidate the standards, but favours caution and limited weight being attached to them, and not using the new standards material to significantly uprate any increase being considered on this occasion.
6.9 A work in process
159 27 November 2017, Transcript, PN20. 160 Peter Saunders and Megan Bedford ,Seminar Presentation to the Fair Work Commission, New Budget Standards for Low-Paid and Unemployed Australians – Project Methods and Key Findings, Social Policy Research Centre University of New South Wales, Monday 27 November 2017. 161 27 November 2017, Transcript, PN51.

46 Fair Work Commission Minimum Wage Panel Annual Minimum Wage Review 2017-18 – 13 March 2018
199. It also appears from Professor Saunders presentation of the research that it is very new, many new assumptions had to be made, and it is being refined and evolved over time. We heard him as saying that he would like a funding commitment to refine and improve the model over time.162 If this is Mark I research, this further favours the caution in relying on it.
200. Some of the framing of the research report seems to indicate this initial material is “proof of concept”, rather than a refined product upon which greater reliance could be placed. This includes for example “the research demonstrates that budget standards are still capable of generating income adequacy and living standard benchmarks”.163
201. The report gives further backing to the view this is a work in progress: Only when the budgets have been fully developed, is it possible to vary or omit certain items and examine the consequences, not only for the overall cost of the budget, but also for the standard of living or lifestyle that it is designed to support. The criticisms levelled at budget standards raise important issues about what items to include and why, and these need to be kept in mind, but they do not provide a case for dispensing with the approach altogether. It is only through the development of a comprehensive and coherent framework and the use of these to draw together the assumptions and judgements with relevant data that these important issues can be examined systematically.164
202. We do not concede the vision for the ultimate relevance of this material once completed, but we do say this supports the view that the direct utility of this initial, proof of concept, iteration of the standards is limited.
6.10 Inconsistency
203. If we have understood the material correctly, part of the rationale for this research was to update an established basket of goods by a means other than inflation, and to reflect prevailing community standards of acceptability.165 We further note that the research was as much about the unemployed as those on minimum wages.
204. This invites the Panel into an inconsistency. The Panel has said it will focus on comparisons between award reliant employees and other employees, and less so on comparisons to the unemployed or those on pensions. Yet here, it is whole of community
162 27 November 2017, Transcript, passim. 163 Saunders, P. and Bedford, M. (2018) New Minimum Income for Healthy Living Budget Standards for Low-Paid and Unemployed Australians, p.3. 164 Saunders, P. and Bedford, M. (2018) New Minimum Income for Healthy Living Budget Standards for Low-Paid and Unemployed Australians, p.13. 165 27 November 2017, Transcript, PN6.

47 Fair Work Commission Minimum Wage Panel Annual Minimum Wage Review 2017-18 – 13 March 2018
expectations that are being used to update budget standards, not the needs of the low paid as the Panel has framed it (those on safety net award wages).
6.11 The Harvester analogy
205. There may be a certain romance in likening the budget standards research to the Harvester Judgement,166 but this is of no relevance to the decision at hand: a. The legislative scheme of 1907 and that of 2018 are simply not comparable.
b. It is unquestioned that the Panel must weigh and balance the competing considerations in s.284(1) including economic and employment considerations, which dictates that the basic wage approach can no longer be relevant.
c. The Standards’ authors are selling themselves a touch short; Higgins did not undertake any form of rigorous research and his assumptions are clearly those of more than a century ago.
6.12 Does this cut both ways?
206. As a matter of logic, where the Budget Standards research shows income adequacy, for a cohort, area or as a whole (and it does under various scenarios), would this be a factor weighing against any minimum wage up-rating?
207. If not and the answer is that other factors would weigh against this, then as a matter of logic the alchemy of different factors that are weighed could not see undue or additional weight placed on the budget standards.
6.13 What to make of this
208. The Budget Standards research is interesting and may in time make some contribution to the Panel’s consideration of these matters.
209. However, the current material is no game changer or revelation in this which would warrant a marked change of approach to minimum wage setting or a radical uprating of levels of increase that have already consistently exceeded inflation.
210. The cautions of the Budget Standards authors and the observations above favour a cautious approach to this material by the Panel. The panel should weigh the consideration of relative living standards and the needs of the low paid essentially as it has on previous occasions. It is difficult to conclude based on the budget standards materials that there is any case for even higher levels of increase in 2018.
166 ‘What is a Budget Standard’ Slide, Budget Standards PowerPoint Slides, 27 November 2017.

48 Fair Work Commission Minimum Wage Panel Annual Minimum Wage Review 2017-18 – 13 March 2018
6.14 Other Considerations
211. We have reviewed Sections 8 and 9 of the 2018 Statistical Report, and make the following observations: a. The ratio of the C14 rate relative to median weekly earnings of full-time employees is
the same (53.8%) in August 2016 as it was in August 2006 (Table 8.1).167 This means that those paid on the lowest award rates are not going backwards relative to other wage earners in the community. It also provides no basis for any inflated increase in 2018.
b. 2/3 of median incomes continues to be markedly higher than the existing minimum wage, pursuing this course would necessitate a safety net increase of $160 per week (Table 8.2).168 This remains a utopian and unrealistic ask, quite irreconcilable with the minimum wage objective and general objects of the Act.
c. The real value of the NMW ha increased markedly in the past three years (Chart 8.2).169
d. The ratio of the C14 rate relative to median weekly earnings for full-time is unchanged in roughly 9 years (Chart 8.2).170 This cannot be a recipe for any markedly different or uprated level of increase in 2018.
212. The assessment of relative living standards does not, in the Australian Chamber’s submission, require the Panel to set rates such that they match market rates of pay or a certain percentage of them.
213. This has been long accepted by Australia’s employment tribunals with the Full Bench of the Australian Industrial Relations Commission (AIRC) stating in its 2005 Safety Net Review Decision:
[384] The Commonwealth rejected the ACTU's submission that there should be an appropriate nexus between average award movements and average movements in the WPI. It reiterated the position it has put in other safety net reviews that market rates and movements in earnings should not be the basis for safety net adjustments. In the alternative it submitted that if movements in market rates are to be taken into account, comparison should be limited to the WPI.
[385] In relation to these submissions we accept that the statutory concept of an award safety net requires that there be a separation between minimum rates and agreement rates and that bargained wage outcomes should not be transmitted through the award system. The Commission has also previously accepted, as the
167 (2018) Statistical Report, p.38. 168 (2018) Statistical Report, p.38. 169 (2018) Statistical Report, p.40. 170 (2018) Statistical Report, p.41.

49 Fair Work Commission Minimum Wage Panel Annual Minimum Wage Review 2017-18 – 13 March 2018
Commonwealth also pointed out, that the WPI is the most useful indicator for our purposes.171
214. It should not be forgotten that the minimum wages objective requires the Fair Work Commission to set a fair and relevant minimum safety net of terms and conditions. In the Australian Chamber’s submission, setting a safety requires an assessment of need and living standards of other groups, not what others falling outside the award system are paid in the labour market.
215. In relation to these other groups we note that the Panel has previously stated that:
The assessment of relative living standards requires a comparison of the living standards of workers reliant on the NMW and modern award minimum rates with those of other groups that are deemed to be relevant and focuses on the comparison between award-reliant workers and other employed workers, especially non-managerial workers.172
216. As noted earlier in this submission it is also relevant that a significant portion of employees that meet the Panel’s definition of ‘low paid’ are not situated in low income households.
217. As submitted in previous years, the Australian Chamber reiterates that the Act’s objectives do not suggest that the Annual Wage Review process be used as a vehicle for income distribution. While exercising its wage setting function under the Workplace Relations Act 1996 (Cth) the following statement of the AIRC can equally apply when considering the statutory considerations the Panel is required to take into account under the current Act:
As noted in previous decisions the statutory scheme does not give to the Commission a supervening social welfare responsibility either for incomes generally or their distribution. The scheme regulates wages and conditions of employment and requires the adjustment of the minimum wages safety net contained in awards having regard to particular considerations. The information about income levels and distribution provided by the parties is informative of Australian living standards. However, it must be taken into account having regard to the limited nature of our task and statutory responsibilities.173
218. We look forward to further information from Government, and the contentions and claims advanced by other parties. However an examination of the material available to date does not seem to reveal any pressing or material change such as to justify a markedly different, and materially higher, approach to uprating the minimum wage on this occasion
7 The need to encourage enterprise bargaining 171 2005 Safety Net Review Decision [PR002005]. 172 [2017] FWCFB 3500 at para. 52. 173 (2001) Safety Net Review, [Print PR002001], at [125].

50 Fair Work Commission Minimum Wage Panel Annual Minimum Wage Review 2017-18 – 13 March 2018
219. Enterprise bargaining is intended to be a central tenet of our workplace relations system as evidenced by the general objects of the Act which include:
achieving productivity and fairness through an emphasis on enterprise-level collective bargaining underpinned by simple good faith bargaining obligations and clear rules governing industrial action; …174
and the express reference to “the need to encourage collective bargaining” in the modern awards objective.175
220. The 2017-2018 AWR takes place in the context of a regulatory environment that is now failing to adequately support and encourage enterprise bargaining. This regrettable trend towards increased award reliance and recentralisation is at odds with both the needs of businesses who require capacity to tailor terms and conditions of employment to suit the circumstances of the enterprise and enhance productivity as well as the needs of employees who will be unable to enjoy the flexibility and benefits that enterprise bargaining can deliver.
221. The general objects in s. 3 of the Act and objects in Part 2-4 of the Act envisage a framework for enterprise agreement making that is simple, fair, flexible, enterprise focused, concerned with delivering productivity and conducive to an efficient approval process. However enterprise bargaining is not operating consistent with these principles.
222. The Act requires that any agreement be assessed against a test requiring that employees covered by the enterprise agreement be “better off overall” compared to the relevant modern award and also requires that agreement not contravene the National Employment Standards. A body of law has emerged which clearly indicates this is a highly complex assessment that gives rise to considerable uncertainty and cost in the bargaining process. We note that the application of the better off overall test (BOOT) in the context of enterprise agreements containing ‘loaded rates’ is currently under consideration by a five member Full Bench of the Commission.
223. The decline in the number of private sector enterprise agreements has continued since the 2016-17 Review. The Federal Department of Jobs and Small Business (the recently renamed Department of Employment) has released its Trends in Federal Enterprise Bargaining Report for the September Quarter 2017.176 These reports provide interesting data on usage of the enterprise agreement system and average wages increases under agreements.
224. The September 2017 Report shows: 174 S 3(f). 175 S 134(1)(b). 176 Trends in Federal Enterprise Bargaining Report for the September Quarter 2017.

51 Fair Work Commission Minimum Wage Panel Annual Minimum Wage Review 2017-18 – 13 March 2018
a. A continued slowing of wages growth under new enterprise agreements, down to an average 2.4% in the private sector, from 2.6% in the June quarter.177
b. New agreement wage increases being lower than those under all current agreements, indicating that agreement wage rises generally are set to remain subdued for some time (or that employers could come under pressure to raise agreement wages if market wage pressures return towards longer-term trend levels).
c. The Construction industry (3.1%), Administrative and Support Services (3.0%), and Accommodation and Food Services (2.9%) had the highest average wage increases in the September quarter 2017.
d. Industries with the lowest average increases were Retail (1.1%), Information Media and Telecommunications (1.9%), and Mining (1.9%).178
e. Average wage increases were highest in Victorian agreements (3.1%) and lowest in Tasmanian agreements (1.5%).
f. New non-union agreements are paying more (2.5%) than new union covered agreements (2.1%).179
225. The data also supports enterprise agreement making being in continuing decline: a. Total numbers of current agreements declined from the June to September quarters
(down from 14,495 to 12,915 agreements) – an ongoing trend. b. Overall employee coverage declined from 1.9m to 1.8m employees.180 c. During the past three years, we have gone from more than 1,500 agreements being
approved per quarter to 680).181 d. Numbers of current (in term) agreements have declined in every industry sector
across the past three years.182 e. Award coverage is increasing, and agreement coverage is decreasing, between
2010 and 2016 – a point we also address in the annual wage review.
Table 14: Instrument providing rate of pay for all employees – 2010-2016
177 Trends in Federal Enterprise Bargaining Report for the September Quarter 2017, Table 1. 178 Trends in Federal Enterprise Bargaining Report for the September Quarter 2017, Chart 3. 179 Trends in Federal Enterprise Bargaining Report for the September Quarter 2017, Table 13. 180 Trends in Federal Enterprise Bargaining Report for the September Quarter 2017, Chart 4. 181 Trends in Federal Enterprise Bargaining Report for the September Quarter 2017, Table 5. 182 Trends in Federal Enterprise Bargaining Report for the September Quarter 2017, Table 8.
52 Fair Work Commission Minimum Wage Panel Annual Minimum Wage Review 2017-18 – 13 March 2018
226. The decline in enterprise bargaining in the retail sector is significant, In December 2013 there were 1,049 current retail agreements, applying to 390,700 employees (31.2% of 1,250,500 then employees working in the industry). In December 2016 there were 237 current retail agreements, applying to 59,300 employees23 (4.6% of 1,247,300 employees then working in the industry). This represents a 77.4% decrease in three years. The total number of employees covered by retail agreements also fell 84.8% across the same period.
227. Accommodation and food services also saw a reduction in the overall number of agreements between 2013 (829 current agreements) and 2016 (413 current agreements), although the fall of in overall numbers of employees working under agreements was less dramatic (from 157,800 to 143,300). This may suggest larger accommodation and food services employers continue to bargain and finalise agreements but that fewer medium and smaller enterprises do so.
228. In addition to the declining number of enterprise agreements (most pronounced in the retail sector where “loaded rates” feature) we are seeing exponential growth in the number of enterprise agreements approved with undertakings.
Chart 8: Trends in Enterprise Agreement Approval183
183 Fair Work Commission.

53 Fair Work Commission Minimum Wage Panel Annual Minimum Wage Review 2017-18 – 13 March 2018
229. The Panel has previously found that “the recent increase in award reliance does not support the contention that recent minimum wage increases have acted as a disincentive to collective bargaining”184 and instead suggested that the research “points to a complex mix of factors that may contribute to employee and employer decision making about whether or not to bargain”.185 While the Australian Chamber accepts that decision making about whether or not to bargain is a complex one. Australian Chamber maintains that the level of award wages, combined with award conditions and the increasingly more prescriptive application of the BOOT are acting as disincentives to enterprise agreement making.
230. The concerns regarding the operation of the BOOT are not new but are worsening. In 2011 the Productivity Commission conducted an inquiry into the ‘Economic Structure and Performance of the Australian Retail Industry’186 and registered employer concerns that the ‘every worker must be better off overall test’ was increasing the cost and complexity of negotiating enterprise agreements thus making productivity improvements more difficult to achieve.187 It referred to the example of Woolworths which submitted:
Whilst retailers can negotiate flexibly to open stores during this time [outside the period Monday to Friday between 9am and 5pm] (as Woolworths has done through agreements such as Woolworths National Supermarket Agreement) there is a considerable cost in doing so. This is because retailers must effectively negotiate
184 [2016] FWCFB 3500 at [78]. 185 [2016] FWCFB 3500 at [79]. 186 Productivity Commission 2011, Economic Structure and Performance of the Australian Retail Industry, Report no. 56, Canberra. 187 Productivity Commission 2011, Economic Structure and Performance of the Australian Retail Industry, Report no. 56, Canberra, pp xxx, 313.

54 Fair Work Commission Minimum Wage Panel Annual Minimum Wage Review 2017-18 – 13 March 2018
higher average wage rates and in most instances will still have to pay penalty rates for hours of work done outside these “standard” hours.188
231. Two further major reviews have flagged concern with the BOOT. The panel appointed at the end of 2011 to review the Act recommended that the application of the BOOT be monitored by Government to ensure it was not being applied too rigidly. Of note, it stated:
It was submitted that It was submitted that the change from applying a ‘collective’ test has made it substantially more difficult to apply the BOOT than it was to apply the no-disadvantage test, which has been a disincentive to agreement making. We are concerned that this may be the case, and note that some individual examples have been provided in submissions to this effect. We are concerned that the change between the BOOT and the no-disadvantage test may mean that employers are now required to meet a more rigid standard, as agreements are no longer permitted to disadvantage certain employees where the group of employees is, as a whole, advantaged. We have considered whether there should be additional flexibility in the BOOT such that not every relevant award-covered employee must be better off in appropriate circumstances. However, we are unaware of the widespread impacts of this issue and accordingly are reluctant to recommend change at this stage (references omitted).189
232. When the Productivity Commission conducted its inquiry into the workplace relations framework it also found that the BOOT was having the practical effect of discouraging enterprise bargaining and recommended it be replaced by a new no-disadvantage test.190
233. Bargaining is, by its nature, intended to be a two way street and it goes without saying that parties to a bargain are unlikely to reach agreement unless it delivers benefits for both parties. Minimum wages, combined with award conditions, provide a floor against which the BOOT applies so they are intrinsically linked to this issue. The higher the minimum wages and the more difficult it is to secure productivity improvements through bargaining, the less incentive there is to bargain as trade-offs become too difficult to secure or too costly. We encourage the Panel to consider this context when determining the quantum of any increase.
8 Challenges confronting the apprenticeships and traineeships system
234. Statistics from NCVER show that there were 268,600 apprentices and trainees in-training as at 30 June 2017, a decrease of 4.7% from 30 June 2016.
188 Productivity Commission 2011, Economic Structure and Performance of the Australian Retail Industry, Report no. 56, Canberra, p 368. 189 Towards more productive and equitable workplaces: An evaluation of the Fair Work legislation, pp 165-166. 190 Productivity Commission 2015, Workplace Relations Framework, Final Report, Canberra, p. 59.

55 Fair Work Commission Minimum Wage Panel Annual Minimum Wage Review 2017-18 – 13 March 2018
235. Apprenticeship commencements followed the same trend with a 5.3% decline for the 2017 June Quarter compared to the 2016 June quarter
236. Cancellations and Withdrawals increased to 23,700 in the 2017 June Quarter, a 2% increase over the 2016 June quarter
237. In the 12 months ending 30 June 2017, compared with the previous 12 months:
a. Commencements decreased by 2.9% to 164,000, with trade commencements decreasing by 6.3% to 71,340 and non-trade commencements decreasing 0.1% to 92,645.
b. Completions decreased by 9.1% to 97,700
c. Cancellations and withdrawals increased by 0.2% to 93,700
238. The quarterly figures for the June quarter 2017 show a significant difference in commencements and completions depending on age in a trade, but not in non-trade, illustrating the impact of the removal of adult subsidies and significant increase in adult wages:
a. Trade commencements for those aged: 24 years and younger decreased by 1.8%, 25 years and older decreased by 9.1%
b. Non-trades commencements for those aged 24 years and younger decreased by 5.6%, 25 years and older decreased by 7%
c. Trades completions for those aged 24 years and younger decreased by 6.9%, 25 years and older increased by 1%
d. Non-trades completions for those aged 24 years and younger increased by 28.9%, 25 years and older decreased by 11.7%
239. Figure 1 below shows the previous decade of trades and non-trade commencements as well as the predictions for the September 2017 quarter for which the information is not yet available. The complete data for June 2017 can be found at www.ncver.edu.au.

56 Fair Work Commission Minimum Wage Panel Annual Minimum Wage Review 2017-18 – 13 March 2018
240. As seen in Figure 2, below the free fall in in-training number of apprenticeships and trainees is alarming.
241. Despite 54% of employers using the VET system and 75% of employers satisfied with skills gained through vocational education, commencements and in-training numbers have declined.
242. The Government announced a ‘Real Skills for Real Careers’ message to improve the status of VET but more needs to be done and it is important that any policy levers available to key decision makers do not exacerbate the challenges confronting the VET system.
243. In undertaking this review we urge the Panel to consider the trend decline in the commencement and completion of apprenticeships and traineeships which are likely to be attributable in part to the cumulative effects of increases to award wages. As noted earlier in this submission, the Panel has also acknowledged the need to periodically assess the

57 Fair Work Commission Minimum Wage Panel Annual Minimum Wage Review 2017-18 – 13 March 2018
medium and long-term consequences of successive decisions, recognising that its decisions have both an immediate and cumulative impact.191
9 Changes to penalty rates should not influence the Panel’s decision
244. On 23 February the Commission handed down a decision (Penalty Rates decision)192
which, subject to transitional arrangements, would modestly reduce some penalty rates in some awards applying in the retail, pharmacy and hospitality sectors. This change is to be phased in across as many as four wage review cycles
245. In its 2016-2017 AWR Decision the Panel considered that the Penalty Rates decision formed part of the broad factual matrix against which the review is to be conducted and to that limited extent took it into account.193 The 2016-2017 AWR Decision saw a significant 3.3% increase in the NMW and award wages and impacted over 2.3 million employees.
246. Some of the claims made about the impact of the penalty rates decision on individuals are overstated and factually incorrect. Independent analysis applying the Household Income and Labour Dynamics in Australia Survey has demonstrated that the penalty rates decision affects fewer than 220,000 employees,194 less than 10% of award-reliant employees, and at most 3.8% of Australia’s 12 million employees. We submit that the penalty rates decision this should not weigh into the Panel’s considerations which impact a much larger number of employees and employers.
247. An ABC/RMIT University “fact check” also found that: 700,000 people did not get a pay cut on 1 July 2017 as some have claimed and it critiqued the estimate prepared by the McKell Institute on the basis that it:
a. Did not take into account many people do or can work on a Sunday;
b. Wrongly took into account people who work for an employer that never works on a Sunday;
c. Did not factor in at not all award workers in the hospitality industry will see a reduction in Sunday penalty rates noting there is no change to Sunday rates for any
191 [2017] FWCFB 3500 at para 35. 192 [2017] FWCFB 1001. 193 [2017] FWCFB 3500 at para 30. 194 RMIT/ABC Fact check: Have 700,000 of the poorest-paid people received an effective pay cut?; 24 July 2017 Joshua Healy and Rebecca Cassells in The Conversation, FactCheck: will 700,000 workers be ‘ripped off’ by penalty rate cuts, as Bill Shorten said?, 25 May 2017.

58 Fair Work Commission Minimum Wage Panel Annual Minimum Wage Review 2017-18 – 13 March 2018
worker on the Restaurant Industry Award or casuals on the Hospitality Industry (General) Award;
d. Did not take into account that some employers may choose to pay above the award.195
248. In some cases the decision will have the effect of returning Sunday rates to the level they were in the state-based industry awards before the modern awards came into effect. In particular, in the retail industry in New South Wales Sunday penalty rates for retail award employees rose from 150% to 200% between 2010 and 2014. This is of note given retail trade, a significant employment of young people, is confronting a highly challenging competitive landscape. While there are a complex range of factors contributing to this, excessive penalty rates have not helped.
249. The decision on penalty rates is limited to certain employees paid award wages in retail and hospitality industries. On 1 July this year, the majority of these employees saw an increase in their rates of pay, even on a Sunday, and the rates for days on which penalty rates apply in these industries remain very high. Following last year’s 3.3 % increase For example:
i. an entry level, retail shop assistant is paid, at a minimum: $39.16 per hour on a Sunday;
ii. a retail store manager it is paid, at a minimum: $47.91 per hour on a Sunday;
iii. a casual level 1 pharmacy assistant is pad a minimum of $44.18 per hour on a Sunday;
iv. a pharmacist manager is paid a minimum of $72.20 an hour on a Sunday if they are casual and $64 an hour if they are permanent.
250. Businesses operating across a seven day week have reported significant increases in their payroll costs following last year’s decision despite the penalty rates decision. We caution against an approach that would see minimum wages increased to somehow ‘compensate’ for reductions in penalty rates.
251. In making its decision the Fair Work Commission, found that the rates altered in the relevant retail and hospitality awards were having the effect that those awards were not providing a fair and relevant safety net. The Full Bench made this decision with full knowledge of what the base rates in those awards were at the time of that decision. On any assessment the case was a large one involving 10 expert witnesses, 133 lay witnesses and 39 days of hearing giving rise to 28,606 paragraphs of transcript. It also had some
195 RMIT/ABC Fact check: Have 700,000 of the poorest-paid people received an effective pay cut?; 24 July 2017

59 Fair Work Commission Minimum Wage Panel Annual Minimum Wage Review 2017-18 – 13 March 2018
distinctive features. Proceedings were opened up to public submissions and the Opposition and some state governments made submissions. The decision is lengthy, delivered over 12 Chapters within 551 pages. It was not a decision that was arrived at lightly.
252. The unique characteristics of the industries impacted were also acknowledged by the Fair Work Commission and are worth stating here as retail and accommodation and food services are among the industries with the highest levels of award reliance. In particular, the Fair Work Commission identified that the businesses impacted by the decision include small and medium businesses with lower profit margins, many with higher wages and salaries as a proportion of total expenses, lower survival rates, facing strong or intense competition and many that are operating weekends.196
253. Also of note, small businesses account for:
a. 34% of the value added of both the retail and accommodation and food services industries.197
b. 38% of total employment in the retail industry.198
c. 42% of total employment in the accommodation and food services industry.199
254. These industries are in the top five in terms of total employment in small businesses200 and make significant contributions to youth employment.
255. In its 23 February 2017 decision the Fair Work Commission accepted evidence demonstrating that the current level of penalty rates has led employers in these industries to reduce labour costs associated with Sunday and public holiday trading by imposing a number of operational limitations, such as:
a. Restricting trading hours;
b. Lowering staff levels; and
c. Restrictions on the type and range of services provided.
196 [2017] FWCFB 1001 ay paras [742], [1463]. 197 Australian Small Business and Family Enterprise Ombudsman (2016) Small Business Counts: Small Business in the Australian Economy, p.12 198 Australian Small Business and Family Enterprise Ombudsman (2016) Small Business Counts: Small Business in the Australian Economy, Table 8, p.17 199 Australian Small Business and Family Enterprise Ombudsman (2016) Small Business Counts: Small Business in the Australian Economy, Table 8, p.17 200 Australian Small Business and Family Enterprise Ombudsman (2016) Small Business Counts: Small Business in the Australian Economy, Table 10, p.19

60 Fair Work Commission Minimum Wage Panel Annual Minimum Wage Review 2017-18 – 13 March 2018
256. The Fair Work Commission also accepted that the evidence that a reduction in penalty rates is likely to lead to:
a. Increased trading hours on Sundays and public holidays;
b. A reduction in the hours worked by some owner operations;
c. An increase in the level and range of services offered on Sundays and public holidays; and
d. An increase in overall hours worked.201 The Fair Work Commission noted that 65.5 per cent of respondents to a retail survey said that they would allocate more hours to employees on Sunday if the Sunday penalty rate was reduced (from 200 per cent to 150 per cent).202
257. However transitional arrangements mean the changes will take a long time to come into full effect and the retail sector will continue to confront significant challenges across this period. The Reserve Bank of Australia has noted that competitive pressures in the retail sector continue to put downward pressure on consumer prices.203 This is a key reason for sustained levels of low inflation and evidences the inability of retailers to pass on escalating costs in competitive, digitally connected marketplace. Cost increases are absorbed by retail businesses and when this becomes unsustainable it risks seeing businesses closed and jobs lost or cuts to jobs and hours.
258. Too high an increase in award wages will exacerbate the risk that there will be increasingly fewer entry level jobs for Australia’s growing population.
201 [2017] FWCFB 1001 at paras [71], [1619], [1620]. 202 [2017] FWCFB 1001 at paras [1620], [1671]. 203 Reserve Bank of Australia, Statement on Monetary Policy, May 2017, p. 49.
61 Fair Work Commission Minimum Wage Panel Annual Minimum Wage Review 2017-18 – 13 March 2018
10 About the Australian Chamber The Australian Chamber of Commerce and Industry is the largest and most representative business advocacy network in Australia. We speak on behalf of Australian business at home and abroad.
Our membership comprises all state and territory chambers of commerce and dozens of national industry associations. Individual businesses are also able to be members of our Business Leaders Council.
We represent more than 300,000 businesses of all sizes, across all industries and all parts of the country, employing over 4 million Australian workers.
The Australian Chamber strives to make Australia a great place to do business in order to improve everyone's standard of living.
We seek to create an environment in which businesspeople, employees and independent contractors can achieve their potential as part of a dynamic private sector. We encourage entrepreneurship and innovation to achieve prosperity, economic growth and jobs.
We focus on issues that impact on business, including economics, trade, workplace relations, work health and safety, and employment, education and training.
We advocate for Australian business in public debate and to policy decision-makers, including ministers, shadow ministers, other members of parliament, ministerial policy advisors, public servants, regulators and other national agencies. We represent Australian business in international forums.
We represent the broad interests of the private sector rather than individual clients or a narrow sectional interest.
62 Fair Work Commission Minimum Wage Panel Annual Minimum Wage Review 2017-18 – 13 March 2018
Australian Chamber Members CHAMBER MEMBERS BUSINESS SA | CANBERRA BUSINESS CHAMBER | CHAMBER OF COMMERCE & INDUSTRY QUEENSLAND | CHAMBER OF COMMERCE AND INDUSTRY OF WESTERN AUSTRALIA | CHAMBER OF COMMERCE NORTHERN TERRITORY | NSW BUSINESS CHAMBER | TASMANIAN CHAMBER OF COMMERCE AND INDUSTRY | VICTORIAN CHAMBER OF COMMERCE AND INDUSTRY NATIONAL INDUSTRY ASSOCIATION MEMBERS ACCORD – HYGIENE, COSMETIC AND SPECIALTY PRODUCTS INDUSTRY | AIR CONDITIONING & MECHANICAL CONTRACTORS' ASSOCIATION | ANIMAL MEDICINES AUSTRALIA | ASSOCIATION OF FINANCIAL ADVISERS | ASSOCIATION OF INDEPENDENT SCHOOLS OF NSW | AUSTRALIA ARAB CHAMBER OF COMMERCE & INDUSTRY | AUSTRALIAN AUTOMOTIVE DEALER ASSOCIATION | AUSTRALIAN BEVERAGES COUNCIL | AUSTRALIAN DENTAL ASSOCIATION | AUSTRALIAN DENTAL INDUSTRY ASSOCIATION | AUSTRALIAN FEDERATION OF EMPLOYERS & INDUSTRIES | AUSTRALIAN GIFT & HOMEWARES ASSOCIATION | AUSTRALIAN HOTELS ASSOCIATION | AUSTRALIAN INSTITUTE OF CREDIT MANAGEMENT | AUSTRALIAN MADE CAMPAIGN | AUSTRALIAN MEAT PROCESSOR CORPORATION | AUSTRALIAN MINES AND METALS ASSOCIATION | AUSTRALIAN MOBILE TELECOMMUNICATIONS ASSOCIATION | AUSTRALIAN PAINT MANUFACTURERS' FEDERATION | AUSTRALIAN RECORDING INDUSTRY ASSOCIATION | AUSTRALIAN RESTRUCTURING INSOLVENCY & TURNAROUND ASSOCIATION | AUSTRALIAN RETAILERS ASSOCIATION | AUSTRALIAN SELF MEDICATION INDUSTRY | AUSTRALIAN STEEL INSTITUTE | AUSTRALIAN TOURISM EXPORT COUNCIL | AUSTRALIAN TOURISM INDUSTRY COUNCIL | AUSTRALIAN TRUCKING ASSOCIATION | AUSTRALIAN VETERINARY ASSOCIATION | BOATING INDUSTRY ASSOCIATION | BUS INDUSTRY CONFEDERATION | BUSINESS COUNCIL OF CO-OPERATIVES AND MUTUALS | CARAVAN INDUSTRY ASSOCIATION OF AUSTRALIA | CEMENT CONCRETE & AGGREGATES AUSTRALIA | CHEMISTRY AUSTRALIA | CHIROPRACTORS' ASSOCIATION OF AUSTRALIA | CONCRETE MASONRY ASSOCIATION OF AUSTRALIA | CONSULT AUSTRALIA | COUNCIL OF PRIVATE HIGHER EDUCATION | CPA AUSTRALIA | CRUISE LINES INTERNATIONAL ASSOCIATION AUSTRALASIA | CUSTOMER OWNED BANKING ASSOCIATION | DIRECT SELLING AUSTRALIA | EXHIBITION & EVENT ASSOCIATION OF AUSTRALASIA | FINANCIAL PLANNING ASSOCIATION OF AUSTRALIA | FITNESS AUSTRALIA | FRANCHISEE FEDERATION AUSTRALIA | HOUSING INDUSTRY ASSOCIATION | LARGE FORMAT RETAIL ASSOCIATION | LIVE PERFORMANCE AUSTRALIA | MASTER BUILDERS AUSTRALIA | MASTER PLUMBERS | MEDICAL TECHNOLOGY ASSOCIATION OF AUSTRALIA | MEDICINES AUSTRALIA | NATIONAL AUTOMOTIVE LEASING & SALARY PACKAGING ASSOCIATION | NATIONAL DISABILITY SERVICES | NATIONAL ELECTRICAL AND COMMUNICATIONS ASSOCIATION | NATIONAL EMPLOYMENT SERVICE ASSOCIATION | NATIONAL FIRE INDUSTRY ASSOCIATION | NATIONAL RETAIL ASSOCIATION | NATIONAL ROADS AND MOTORISTS’ ASSOCIATION | NORA | NSW HIRE CAR ASSOCIATION | NSW TAXI COUNCIL | OUTDOOR MEDIA ASSOCIATION | PHARMACY GUILD OF AUSTRALIA | PHONOGRAPHIC PERFORMANCE COMPANY OF AUSTRALIA | PRINTING INDUSTRIES ASSOCIATION OF AUSTRALIA | RECRUITMENT, CONSULTING AND STAFFING ASSOCIATION | RESTAURANT & CATERING AUSTRALIA | ROOFING TILE ASSOCIATION OF AUSTRALIA | SCREEN PRODUCERS AUSTRALIA | THE TAX INSTITUTE | THINK BRICK AUSTRALIA | VICTORIAN AUTOMOBILE CHAMBER OF COMMERCE


