![COMPETITION AND FAIR TRADING ACT CHAPTER 90:07goinvest.gov.gy/...90-07-Competition-and-Fair-Tradingfull-permission.… · Competition and Fair Trading Cap. 90:07 ] 11 L.R.O. 1/2012](https://static.fdocuments.net/doc/165x107/5eb91554b6ac113281738c22/competition-and-fair-trading-act-chapter-90-competition-and-fair-trading-cap-9007.jpg)
FAIR VALUE TRANSFER - FW Cook | Executive … · consider looking at the company’s fair value...
21
FVT FAIR VALUE TRANSFER FREDERIC W. COOK & CO., INC. Alternative Approach to Determining Aggregate Long-Term Incentive Grant Sizes JANUARY 2006
Transcript of FAIR VALUE TRANSFER - FW Cook | Executive … · consider looking at the company’s fair value...

FVTFAIR VALUE TRANSFER
F R E D E R I C W . C O O K & C O . , I N C .
Alternat ive Approach to Determining Aggregate Long-Term
Incent ive Grant Size s
J A N U A R Y 2 0 0 6

FVTF R E D E R I C W . C O O K & C O . , I N C .
Alternat ive Approach to Determining Aggregate Long-Term
Incent ive Grant Size s
J A N U A R Y 2 0 0 6
FAIR VALUE TRANSFER
1FREDERIC W. COOK & CO., INC.
BACKGROUND
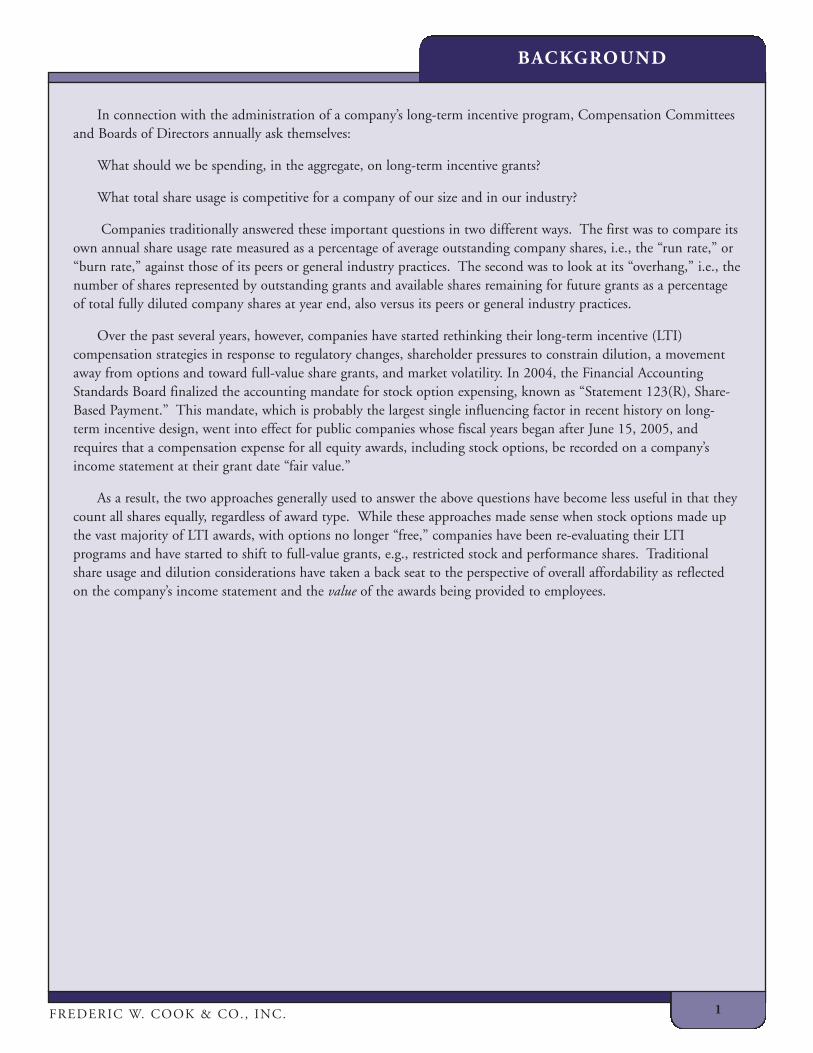
In connection with the administration of a company’s long-term incentive program, Compensation Committeesand Boards of Directors annually ask themselves:
What should we be spending, in the aggregate, on long-term incentive grants?
What total share usage is competitive for a company of our size and in our industry?
Companies traditionally answered these important questions in two different ways. The first was to compare itsown annual share usage rate measured as a percentage of average outstanding company shares, i.e., the “run rate,” or“burn rate,” against those of its peers or general industry practices. The second was to look at its “overhang,” i.e., thenumber of shares represented by outstanding grants and available shares remaining for future grants as a percentageof total fully diluted company shares at year end, also versus its peers or general industry practices.
Over the past several years, however, companies have started rethinking their long-term incentive (LTI)compensation strategies in response to regulatory changes, shareholder pressures to constrain dilution, a movementaway from options and toward full-value share grants, and market volatility. In 2004, the Financial AccountingStandards Board finalized the accounting mandate for stock option expensing, known as “Statement 123(R), Share-Based Payment.” This mandate, which is probably the largest single influencing factor in recent history on long-term incentive design, went into effect for public companies whose fiscal years began after June 15, 2005, andrequires that a compensation expense for all equity awards, including stock options, be recorded on a company’sincome statement at their grant date “fair value.”
As a result, the two approaches generally used to answer the above questions have become less useful in that theycount all shares equally, regardless of award type. While these approaches made sense when stock options made upthe vast majority of LTI awards, with options no longer “free,” companies have been re-evaluating their LTIprograms and have started to shift to full-value grants, e.g., restricted stock and performance shares. Traditionalshare usage and dilution considerations have taken a back seat to the perspective of overall affordability as reflectedon the company’s income statement and the value of the awards being provided to employees.

FAIR VALUE TRANSFER 20062
OUR SUGGESTION: FAIR VALUE TRANSFER “FVT”
In order to more accurately evaluate the aggregate cost of equity incentive programs, we suggest that companiesconsider looking at the company’s fair value transfer (FVT), which measures the aggregate grant value and potentialcost of LTI compensation awards.
The FVT method:
• Provides a measure of aggregate pre-tax compensation cost of grants made in a given year even though cost willlikely be spread over multiple future years for profit and loss purposes
• Facilitates trade-offs between various LTI vehicles since all forms of awards are expressed on an economicallyequivalent basis
• Provides a better way of comparing proportionate costs of various grant types in an option expensingenvironment
• Differentiates the dilutive impact of various grant types; i.e., recognizes that an option has less immediatedilution than a full-value share
• For comparison purposes, annual FVT can be measured against either:
— A company’s total equity market capitalization, or
— An internal financial measure, such as revenue or net income

3FREDERIC W. COOK & CO., INC.
FAIR VALUE TRANSFER “FVT”
THE BENEFITS OF MEASURING FVT AS A PERCENTAGE OF MARKETCAPITALIZATION/REVENUE/NET INCOME
• Allows comparisons to be made across companies to assess the competitiveness and reasonableness of a givencompany’s aggregate LTI budget
• Eliminates distortion from stock price fluctuation, especially for those companies establishing grant guidelinesbased on competitive LTI values
• Is generally consistent with the way investor advisory groups, such as Institutional Shareholder Services (ISS),assess the reasonableness of company aggregate grant practices and new share requests
— ISS recognized the issues associated with traditional measures of potential dilution and switched its primarymethodology for evaluating the reasonableness of share authorization requests from traditional potentialdilution to Shareholder Value Transfer (SVT). SVT measures outstanding and potential grant value as apercentage of market capitalization
— In theory, ISS measures the portion of the company’s market value that can potentially be transferred toexecutives and employees through LTI grants. The ISS methodology infers that investors regard companymarket-cap value as a relevant reference point for comparing grant values (and costs) across companies
— Although similar in concept to ISS’ SVT calculation, our FVT analysis focuses on annual usage (as opposedto total potential dilution), and uses a different methodology

FAIR VALUE TRANSFER 20064
METHODOLOGY
CALCULATION OF FAIR VALUE TRANSFER
• FVT measures the pre-tax “fair value” of equity awards granted during the year. For the purposes of this report,pre-tax fair value of equity awards was calculated for the most recent three years available using each company’sform 10-K disclosure, supplemented with information from the proxy statement as necessary
• Fair value is calculated as follows:
— Options are valued using the weighted-average fair value of options granted during the year. If fair value isnot disclosed in public filings, it was calculated using the binomial option pricing model and the FAS 123input assumptions reported by that company
— Restricted shares are valued at fair market value on grant date
— Performance shares are valued at fair market value on grant date using target number of shares; cash-basedLTI awards are valued at grant-date target value
Note: if aggregate grant data for restricted shares, performance shares and cash-based (performance unit)programs were not provided, aggregate grants made to the named executive officers disclosed in proxystatements were used, under the assumption that these executives receive the majority of the awards
• FVT as a percentage of market capitalization is calculated using an approximation of the weighted-averagemarket capitalization at the time the grants were made
FVT % = Pre-Tax Fair Value of Equity Awards Granted During the Year
Weighted-Average Market Capitalization
EXAMPLE:
Options Granted 1,000,000 Weighted-Average Exercise Price $50.00 Weighted-Average Fair Value of Options $15.00 Aggregate Pre-Tax Option Fair Value $15,000,000
Restricted/Performance Shares Granted 100,000 Weighted-Average Grant Price $50.00 Aggregate Pre-Tax R.S. Fair Value $5,000,000
FVT $20,000,000
Weighted-Average Basic Shares O/S 50,000,000 Weighted-Average Market Capitalization $2,500,000,000
FVT % of Market Cap 0.80%

5FREDERIC W. COOK & CO., INC.
A simple example illustrates the need to focus on value, highlighting the fact that while one stock option andone share of restricted stock are comparable on a share basis, they are clearly different in terms of value. In theexample below, we grant half the number of shares as restricted stock, but double the value:
ASSUMPTIONS:
Shares Outstanding 100,000Stock Price $10.00Binomial % of Stock Price 25%
Stock RestrictedOptions Shares Change
# of 1,000 500
Run Rate 1.00% 0.50% –50%
Pre-Tax Value 2,500 5,000
Fair Value Transfer 0.25% 0.50% +100%
METHODOLOGY

FAIR VALUE TRANSFER 20066
METHODOLOGY
RESEARCH SAMPLE
• To identify patterns in FVT usage among companies of different sizes and industry sectors, we selected 180publicly traded companies based on market capitalization as of May 31, 2005 and industry categorizationaccording to Standard & Poor’s Global Industry Classification Standard Industry Group codes:
Small Cap Mid Cap Large Cap Total(Mkt. Cap. < $1B) (Mkt. Cap. $1B-$5B) (Mkt. Cap. > $5B)
Industrials 20 20 20 60
Retail 20 20 20 60
Hi-Tech 20 20 20 60
Total 60 60 60 180
— The selected companies are identified in the Appendix. 92% of the companies are the same as thoseevaluated in our February 2005 report; the remaining 8% were eliminated due to acquisitions and replacedwith similar companies in terms of size and industry.
• Market capitalizations as of December 31, 2005 and trailing four quarters’ revenues break down as follows:
Market Capitalization Trailing 4 Qtrs. Revenue Market Cap. As Multipleas of 12/31/05 ($mil.) of Revenue
25P Median 75P 25P Median 75P 25P Median 75PSize Categories
Small $336 $623 $872 $255 $710 $1,255 1.3 0.9 0.7 Mid $1,512 $2,301 $3,305 $824 $1,688 $3,585 1.8 1.4 0.9 Large $9,924 $17,406 $47,919 $5,653 $12,547 $27,609 1.8 1.4 1.7
Industry SectorsIndustrial $881 $1,972 $8,938 $1,165 $3,011 $10,801 0.8 0.7 0.8 Retail $742 $2,527 $8,690 $1,330 $3,563 $8,649 0.6 0.7 1.0 Hi-Tech $682 $1,862 $10,761 $243 $647 $1,894 2.8 2.9 5.7
Total Sample $822 $2,205 $9,751 $726 $1,976 $6,990 1.1 1.1 1.4

7FREDERIC W. COOK & CO., INC.
SUMMARY FINDINGS
• The charts on the following pages summarize median historical FVT results from this year’s study vs. last year’sin the aggregate and by various categories:
— By Size– Small, Mid, and Large Cap companies
— By Industry
– Industrial, Retail, and Hi-Tech companies
— By accounting treatment of stock options, i.e., FAS 123 vs. Non-FAS 123 companies
• For additional comparisons we have also shown FVT as a percentage of revenue and net income
• As expected, the data illustrate the following:
— Aggregate results are generally showing a decline in FVT run rates as a percent of market capitalization inthis year’s study vs. last year’s, indicating the continuous limitations being placed on LTI compensation
– Traditional share run rates are also exhibiting a pattern of decline; aggregate median run rate among thesample companies has fallen from 2.54% in 2002 to 2.02% in 2004
These numbers are high due to the high annual usage among the technology companies
• The negative correlation between company size and aggregate FVT granted as a percentage of marketcapitalization supports the logic that smaller companies need to deliver greater LTI opportunity as a percentageof market capitalization than larger companies do in order to maintain competitive compensation programs
— Hi-Tech companies have significantly higher FVT than other industries, with retail companies having thenext highest and industrials having the lowest
– Human capital-intensive companies such as those in the Hi-Tech industry are expected to need largeraggregate LTI budgets
— Companies that have adopted FAS 123 are granting fewer (or less dilutive) long-term incentives than thosewho have not

FAIR VALUE TRANSFER 20068
IMPLICATIONS
With the implementation of Statement 123(R) and the continued uncertainty as to how the financial marketswill react to lower EPS levels, it was correctly anticipated that companies would begin to moderate the aggregateamount “spent” on long-term equity incentive programs. As illustrated by the summary findings that follow,aggregate FVT is generally dropping among all companies, with the drop more pronounced in those companies thathave voluntarily adopted FAS 123. We believe that this shift is a harbinger of more reductions in the future.

9FREDERIC W. COOK & CO., INC.
SUMMARY FINDINGS
MEDIAN FVT % OF MARKET CAPITALIZATION: DETAIL BY SIZE – SMALL CAP
MEDIAN FVT % OF MARKET CAPITALIZATION: DETAIL BY SIZE – MID CAP
0.00%
1.00%
2.00%
3.00%
4.00%Small Cap Companies
Industrials Hi-Tech Retail
0.00%
1.00%
2.00%
3.00%
4.00%
5.00%
6.00%Mid Cap Companies
Industrials Hi-Tech Retail

FAIR VALUE TRANSFER 200610
SUMMARY FINDINGS
MEDIAN FVT % OF MARKET CAPITALIZATION: DETAIL BY SIZE – LARGE CAP
FVT % OF MARKET CAPITALIZATION: DETAIL BY SIZE – AGGREGATE
0.00%
0.50%
1.00%
1.50%
2.00%
2.50%Large Cap Companies
Industrials Hi-Tech Retail
0.00%
1.00%
0.50%
2.50%
1.50%
2.00%
3.50%
3.00%
3 Year Average Results by Size: 2004 vs. 2003
25th Median 75th
20032004

FREDERIC W. COOK & CO., INC. 11
SUMMARY FINDINGS
MEDIAN FVT % OF MARKET CAPITALIZATION: DETAIL BY INDUSTRY – INDUSTRIALS
MEDIAN FVT % OF MARKET CAPITALIZATION: DETAIL BY INDUSTRY – RETAIL
0.00%
0.20%
0.40%
0.60%
1.00%
0.80%
1.20%Industrials
Small Cap Mid Cap Large Cap
0.00%
0.20%
0.40%
0.60%
1.00%
0.80%
1.60%
1.20%
1.40%
1.80%
Retail
Small Cap Mid Cap Large Cap

FAIR VALUE TRANSFER 200612
MEDIAN FVT % OF MARKET CAPITALIZATION: DETAIL BY INDUSTRY – HI-TECH
FVT % OF MARKET CAPITALIZATION: DETAIL BY INDUSTRY – AGGREGATE
0.00%
2.00%
1.00%
5.00%
3.00%
4.00%
6.00%Hi-Tech
Small Cap Mid Cap Large Cap
0.00%
1.00%
3.00%
2.00%
5.00%
4.00%
3 Year Average Results by Industry: 2004 vs. 2003
25th Median 75th
20032004
SUMMARY FINDINGS

13FREDERIC W. COOK & CO., INC.
FVT % OF MARKET CAPITALIZATION – AGGREGATE REPORT RESULTS
0.0
0.5
1.0
1.5
2.0
2.5
3.0
3.5
4.0
4.5
5.0
0.00%
0.50%
1.00%
1.50%
2.00%
2.50%
3.00%
3.50%
4.00%
4.50%
5.00%
2003 2004 2003 2004 2003 2004
Industrials 0.94% 0.76% 0.86% 0.78% 0.54% 0.49%
High-Tech 3.15% 2.48% 4.60% 3.57% 1.74% 1.44%
Retail 1.49% 1.59% 1.32% 1.16% 0.80% 0.74%
Small Cap Mid Cap
3-Year Average Median FVT as % of Market Cap
Large Cap
SUMMARY FINDINGS
FAIR VALUE TRANSFER 200614
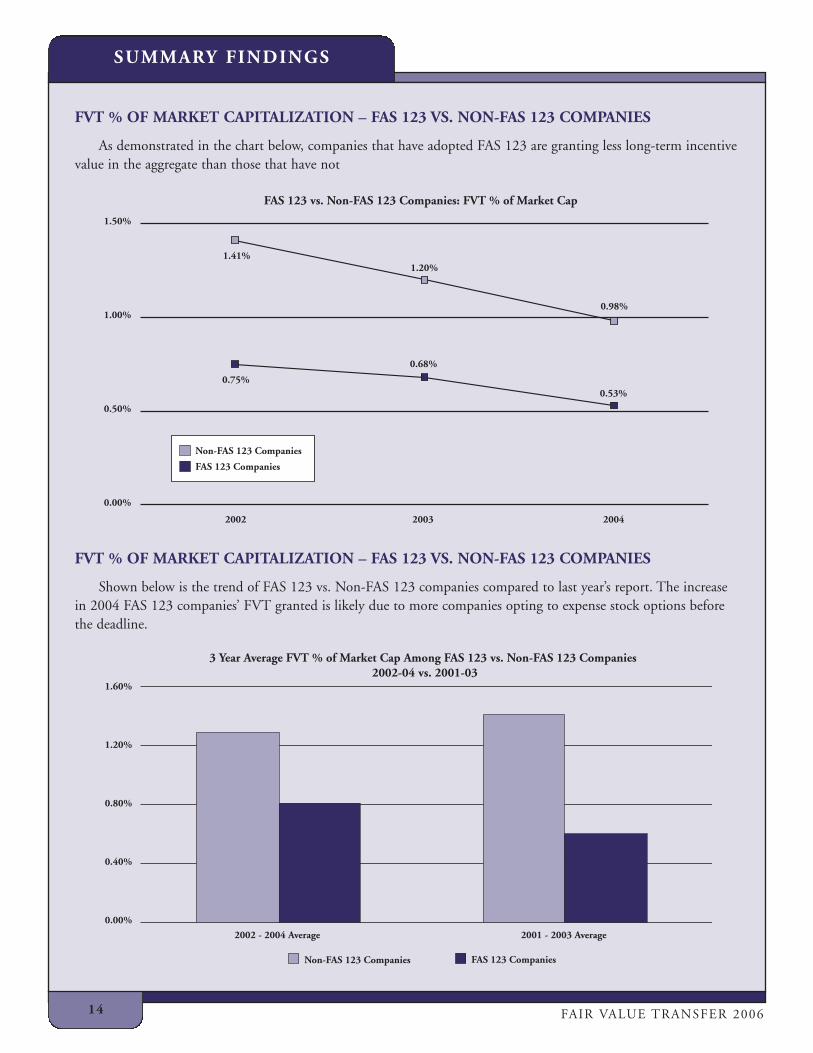
FVT % OF MARKET CAPITALIZATION – FAS 123 VS. NON-FAS 123 COMPANIES
As demonstrated in the chart below, companies that have adopted FAS 123 are granting less long-term incentivevalue in the aggregate than those that have not
FVT % OF MARKET CAPITALIZATION – FAS 123 VS. NON-FAS 123 COMPANIES
Shown below is the trend of FAS 123 vs. Non-FAS 123 companies compared to last year’s report. The increasein 2004 FAS 123 companies’ FVT granted is likely due to more companies opting to expense stock options beforethe deadline.
0.00%
0.40%
1.20%
0.80%
1.60%
3 Year Average FVT % of Market Cap Among FAS 123 vs. Non-FAS 123 Companies2002-04 vs. 2001-03
Non-FAS 123 Companies FAS 123 Companies
2001 - 2003 Average2002 - 2004 Average
0.0
0.5
1.0
1.5
0.00%
0.50%
1.00%
1.50%
2002 2003 2004
Non-FAS 123 Companies
FAS 123 Companies
1.41%
0.75%
1.20%
0.68%
0.98%
0.53%
FAS 123 vs. Non-FAS 123 Companies: FVT % of Market Cap
SUMMARY FINDINGS

15FREDERIC W. COOK & CO., INC.
SUMMARY FINDINGS
OTHER FINANCIAL MEASURES: MEDIAN FVT % OF REVENUE – BY SIZE
OTHER FINANCIAL MEASURES: MEDIAN FVT % OF REVENUE – BY INDUSTRY
0.0
0.5
1.0
1.5
0.00%
0.50%
1.00%
1.50%
Small Cap Mid Cap Large Cap
2004 1.00% 1.07% 0.64%
2003 0.86% 0.76% 0.63%
2002 0.86% 0.74% 0.76%
3 Year Average 0.98% 1.04% 0.65%
Median FVT as % of Revenue: by Size
0
1
2
3
4
5
6
7
8
9
10
0.00%
1.00%
2.00%
3.00%
4.00%
5.00%
6.00%
7.00%
8.00%
9.00%
10.00%
Industrials Hi-Tech Retail
2004 0.37% 6.74% 0.48%
2003 0.44% 6.91% 0.47%
2002 0.43% 8.82% 0.49%
3 Year Average 0.48% 7.98% 0.54%
Median FVT as % of Revenue: by Industry

FAIR VALUE TRANSFER 200616
SUMMARY FINDINGS
OTHER FINANCIAL MEASURES: MEDIAN FVT % OF NET INCOME – BY SIZE
OTHER FINANCIAL MEASURES: MEDIAN FVT % OF NET INCOME – BY INDUSTRY
0
10
20
30
40
0.00%
10.00%
20.00%
30.00%
Small Cap Mid Cap Large Cap
2004 22.76% 28.79% 11.33%
2003 26.22% 18.28% 11.33%
2002 20.99% 20.87% 15.87%
3 Year Average 26.85% 24.93% 13.71%
Median LTI as % of Net Income: by Size
0
10
20
30
40
50
60
70
80
0
10
20
30
40
50
60
70
80
Industrials Hi-Tech Retail
2004 8.55% 47.84% 14.56%
2003 11.53% 47.85% 14.07%
2002 12.11% 70.54% 16.82%
3 Year Average 11.67% 62.58% 17.67%
Median LTI as % of Net Income: by Industry

17FREDERIC W. COOK & CO., INC.
APPENDIX
3M CO
ABERCROMBIE & FITCH
ABM INDUSTRIES
ADOBE SYSTEMS
ADVANCE AUTO PARTS
AGILYSYS
ALADDIN KNOWLEDGESYSTEMS
ALASKA AIR GROUP
ALBERTSONS
AMDOCS
AMERICAN STANDARDCOMPANIES
AMERICAN WOODMARK
ANNTAYLOR STORES
APPLE COMPUTER
APPLIED MATERIALS
ARAMARK
ARIBA
ARMOR HOLDINGS
ASK JEEVES
ATARI
AUTOBYTEL
AUTODESK
AUTOZONE
BARNES & NOBLE
BEA SYSTEMS
BED BATH & BEYOND
BEST BUY
BOEING
BOMBAY COMPANY
BORDERS GROUP
BRINKS
BROOKSTONE
BURLINGTON NORTHERNSANTA FE
CACHE
CARLISLE
CARMAX
CATERPILLAR
CHILDRENS PLACE RETAILSTORES
CIBER
CISCO SYSTEMS
CITRIX SYSTEMS
CNF
COMPUTER ASSOCIATES
CONTINENTAL AIRLINES
COOPER INDUSTRIES
COST PLUS
COSTAR GROUP
COSTCO WHOLESALE
DEERE & CO
DELL
DIODES
DOLLAR THRIFTYAUTOMOTIVE
R.R. DONNELLEY & SONS
DOVER
EATON
ECOLLEGE.COM
EGL
ELECTRONIC ARTS
EMERSON ELECTRIC
EXPRESSJET HOLDINGS
FEDERAL SIGNAL
FEDERATED DEPT STORES
FEDEX
FINISH LINE
FOOT LOCKER
FRONTIER AIRLINES
GAP
GENERAL ELECTRIC
GLOBAL POWEREQUIPMENT
GUESS
GUITAR CENTER
GYMBOREE
HEARTLAND EXPRESS
HEWLETT-PACKARD
HIBBETT SPORTINGGOODS
HOME DEPOT
HONEYWELLINTERNATIONAL
IDEX
ILLINOIS TOOL WORKS
INFORMATICA
INFOSPACE
INTEGRATED DEVICETECH
INTERNATIONALRECTIFIER
INTUIT
JETBLUE AIRWAYS
JLG INDUSTRIES
JO-ANN STORES
JOS A BANK CLOTHIERS
JOY GLOBAL
KEANE
KOHL'S
KROGER CO
KRONOS
LIMITED BRANDS
LINDSAYMANUFACTURING
LINENS N THINGS
MACROMEDIA
MAY DEPARTMENT STORES
MENS WEARHOUSE
MERCURY INTERACTIVE
MESA AIR GROUP
MICROMUSE
MICROSEMI
HERMAN MILLER
MIVA
MOOG
MOVADO GROUP
MYKROLIS
NACCO INDUSTRIES
NAVISTARINTERNATIONAL
NCI BUILDING SYSTEMS
NEIMAN-MARCUS GROUP
NORDSTROM
NORFOLK SOUTHERN
OFFICE DEPOT
OLD DOMINION FREIGHT
OPEN TEXT
ORACLE
OSHKOSH TRUCK
PENTAIR
PEP BOYS
PETSMART
PIER 1 IMPORTS
PITNEY BOWES
PROGRESS SOFTWARE
QUALCOMM
QUEST SOFTWARE
RADIOSHACK
RAMBUS
RED HAT
RELIANCE STEEL &ALUMINUM
RESEARCH IN MOTION
RESTORATION HARDWARE
RUDOLPH TECHNOLOGIES
RYDER SYSTEM
SAKS
SERENA SOFTWARE
SHARPER IMAGE
SHERWIN-WILLIAMS
SHOPKO STORES
SIEBEL SYSTEMS
SMART & FINAL
SOHU.COM
SONIC AUTOMOTIVE
SOUTHWEST AIRLINES
SPORTS AUTHORITY
SUNGARD DATA SYSTEMS
SUPERVALU
SYBASE
SYMANTEC
SYNOPSYS
TALX
TARGET
TELEDYNETECHNOLOGIES
TEXAS INSTRUMENTS
TEXTRON
TIBCO SOFTWARE
TJX COMPANIES
TOO
TORO COMPANY
TOYS R US
TREX COMPANY
TRIUMPH GROUP
UNITED PARCEL SERVICE
UNITED STATIONERS
URBAN OUTFITTERS
USA TRUCK
VALMONT INDUSTRIES
VALUECLICK
VERISIGN
VERITAS SOFTWARE
VERITY
WAL-MART STORES
WEBEXCOMMUNICATIONS
WEBSENSE
WHOLE FOODS MARKET
WILD OATS MARKETS
WILLIAMS-SONOMA
YAHOO
ZALE

FAIR VALUE TRANSFER 200618
COMPANY PROFILE
Frederic W. Cook & Co., Inc. is an independent consulting firm specializing in executive and directorcompensation and related corporate governance matters. Formed in 1973, our firm has served more than 1,700corporations, including 40 percent of the current Fortune 200 during the past two years, in a wide variety of industriesfrom our offices in New York, Chicago, Los Angeles, and San Francisco. Our primary focus is on performance-basedcompensation programs that help companies attract and retain business leaders, motivate and reward them forimproved performance, and align their interests with shareholders. Our range of consulting services includes:
• Annual Incentive Plans • Directors’ Remuneration • Regulatory Services• Change-in-Control and Severance • Incentive Grants and Guidelines • Restructuring Incentives • Compensation Committee Advisor • Long-term Incentive Design • Shareholder Voting Matters• Competitive Assessment • Ownership Programs • Specific Plan Reviews• Corporate Governance Matters • Performance Measurement • Strategic Incentives• Corporate Transactions • Recruitment/Retention Incentives • Total Compensation Reviews
OUR OFFICE LOCATIONS:
New York Chicago Los Angeles San Francisco 90 Park Avenue One North Franklin 2121 Avenue of the Stars 1 Post Street35th Floor Suite 910 Suite 990 Suite 825New York, NY 10016 Chicago, IL 60606 Los Angeles, CA 90067 San Francisco, CA 94104212-986-6330 phone 312-332-0910 phone 310-277-5070 phone 415-659-0201 phone212-986-3836 fax 312-332-0647 fax 310-277-5068 fax 415-659-0220 fax
London(through our affiliation with New Bridge Street Consultants)
20 Little BritainLondon, EC1A 7DH
020-7282-2030 phone020-7282-0011 fax
www.nbsc.co.uk
Website address: www.fwcook.com
This report was prepared by Silvana Nuzzo with assistance from Connie Alexakis, Evelyn Chin, Scott Evenson,Jeff Kanter, Alexa Kierzkowski, James Kim, Steven Knotz, Aaron Miller, Michael Reznick, Ben Segal, Eric Winikoffand David Yang. Questions and/or comments should be directed to Miss Nuzzo at [email protected] or (212) 986-6330.


![FINANCIAL RESULTS OF GK PEM FOR H1 2016...mkt cap (bez dywidend) dyw. z zysku 2013 dyw. z zysku 2014 dyw. z zysku 2015 ãF]QDZ DUWR$þ 159 Data in PLN million mkt cap (without dividends)](https://static.fdocuments.net/doc/165x107/5f416a2101e49f2b162f431b/financial-results-of-gk-pem-for-h1-mkt-cap-bez-dywidend-dyw-z-zysku-2013.jpg)


![Resumen Cap 4 - Lib[1] MKT Estrategico](https://static.fdocuments.net/doc/165x107/577daece1a28ab223f9162c0/resumen-cap-4-lib1-mkt-estrategico.jpg)


