Fair Isaac Corporation Analyst Day - library.corporate...
67
© 2007 Fair Isaac Corporation. Fair Isaac Corporation Analyst Day 15 May 2007 San Francisco May 15, 2007
-
Upload
nguyenngoc -
Category
Documents
-
view
215 -
download
0
Transcript of Fair Isaac Corporation Analyst Day - library.corporate...
© 2007 Fair Isaac Corporation.
Fair Isaac CorporationAnalyst Day15 May 2007San Francisco
May 15, 2007
© 2007 Fair Isaac Corporation.
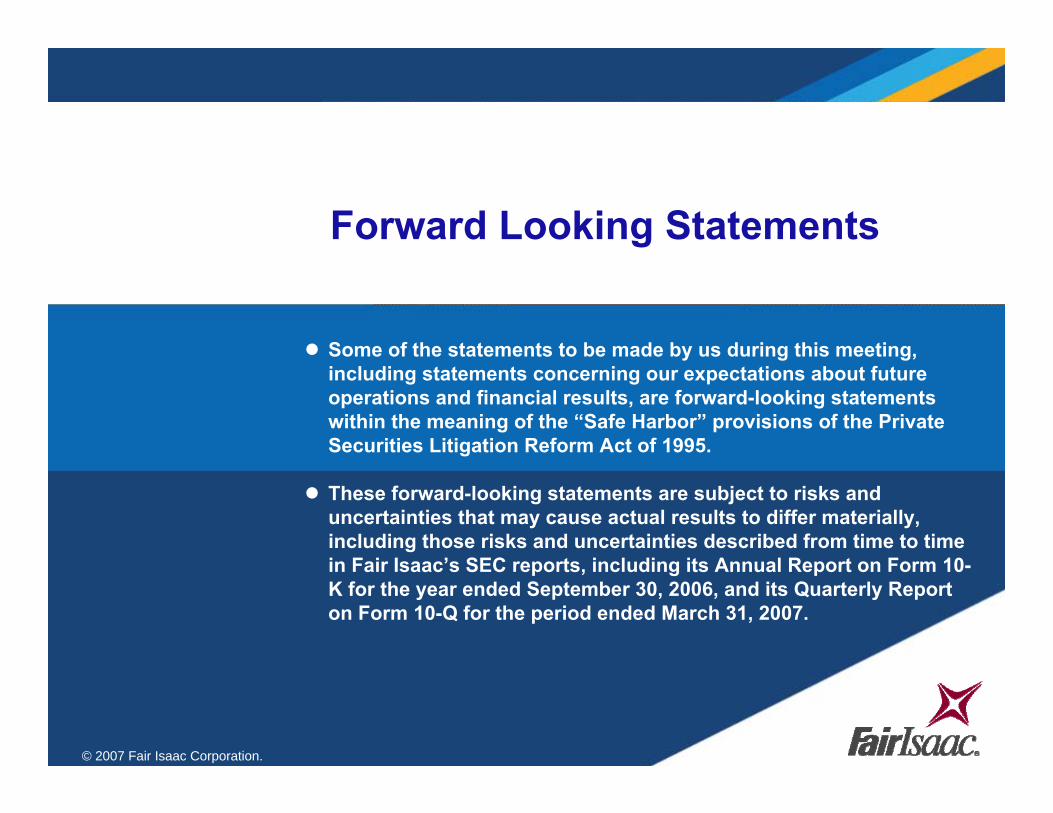
Forward Looking Statements
Some of the statements to be made by us during this meeting, including statements concerning our expectations about future operations and financial results, are forward-looking statements within the meaning of the “Safe Harbor” provisions of the Private Securities Litigation Reform Act of 1995.
These forward-looking statements are subject to risks and uncertainties that may cause actual results to differ materially, including those risks and uncertainties described from time to time in Fair Isaac’s SEC reports, including its Annual Report on Form 10-K for the year ended September 30, 2006, and its Quarterly Report on Form 10-Q for the period ended March 31, 2007.

© 2007 Fair Isaac Corporation.
Corporate Overview
Mark GreeneChief Executive Officer
4© 2007 Fair Isaac Corporation.
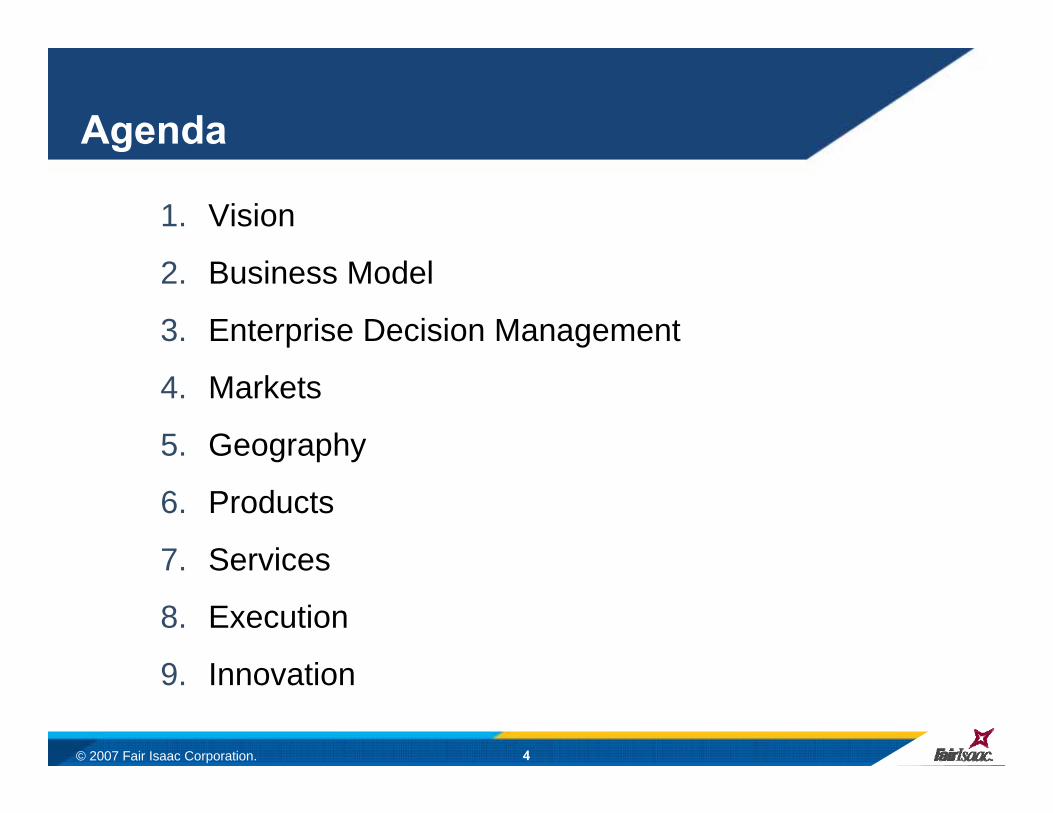
Agenda
1. Vision
2. Business Model
3. Enterprise Decision Management
4. Markets
5. Geography
6. Products
7. Services
8. Execution
9. Innovation
5© 2007 Fair Isaac Corporation.
1
1 VISION
2 3 4 5 6 7 8 9
6© 2007 Fair Isaac Corporation.
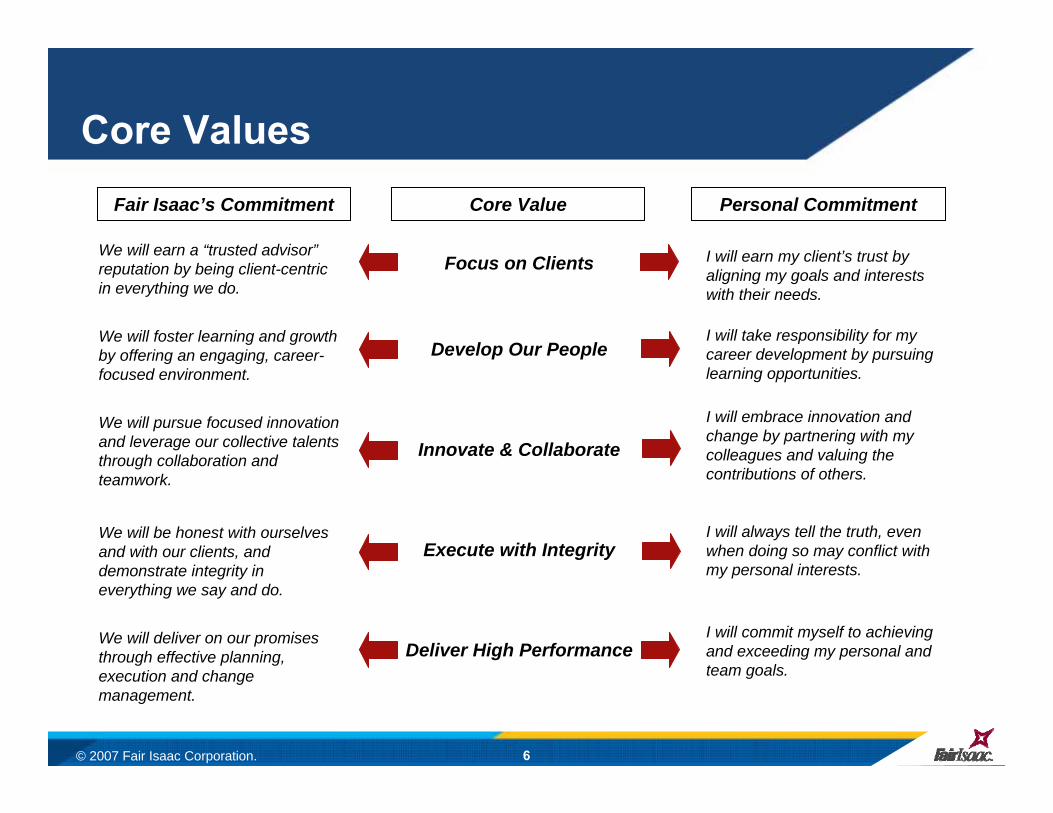
Core Values
Focus on Clients
Develop Our People
Innovate & Collaborate
Execute with Integrity
Deliver High Performance
We will earn a “trusted advisor”reputation by being client-centric in everything we do.
We will foster learning and growth by offering an engaging, career-focused environment.
We will pursue focused innovation and leverage our collective talents through collaboration and teamwork.
We will be honest with ourselves and with our clients, and demonstrate integrity in everything we say and do.
We will deliver on our promises through effective planning, execution and change management.
I will earn my client’s trust by aligning my goals and interests with their needs.
I will take responsibility for my career development by pursuing learning opportunities.
I will embrace innovation and change by partnering with my colleagues and valuing the contributions of others.
I will always tell the truth, even when doing so may conflict with my personal interests.
I will commit myself to achieving and exceeding my personal and team goals.
Fair Isaac’s Commitment Personal CommitmentCore Value
7© 2007 Fair Isaac Corporation.
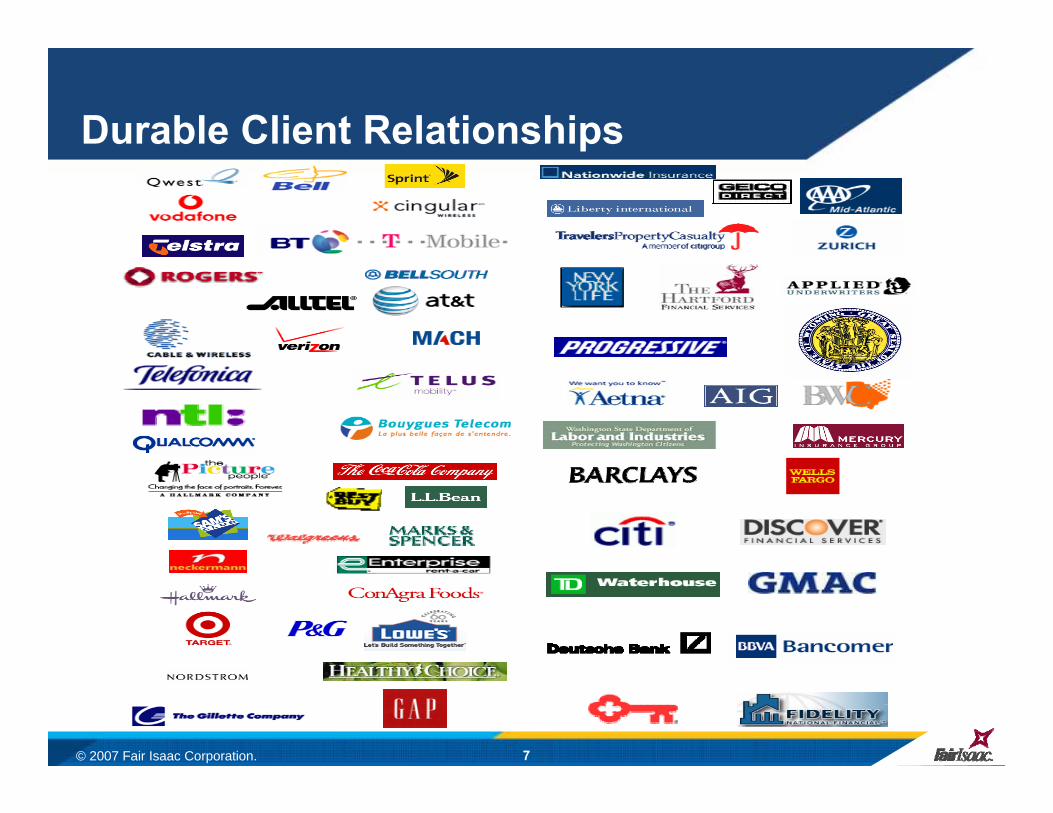
Durable Client Relationships
8© 2007 Fair Isaac Corporation.
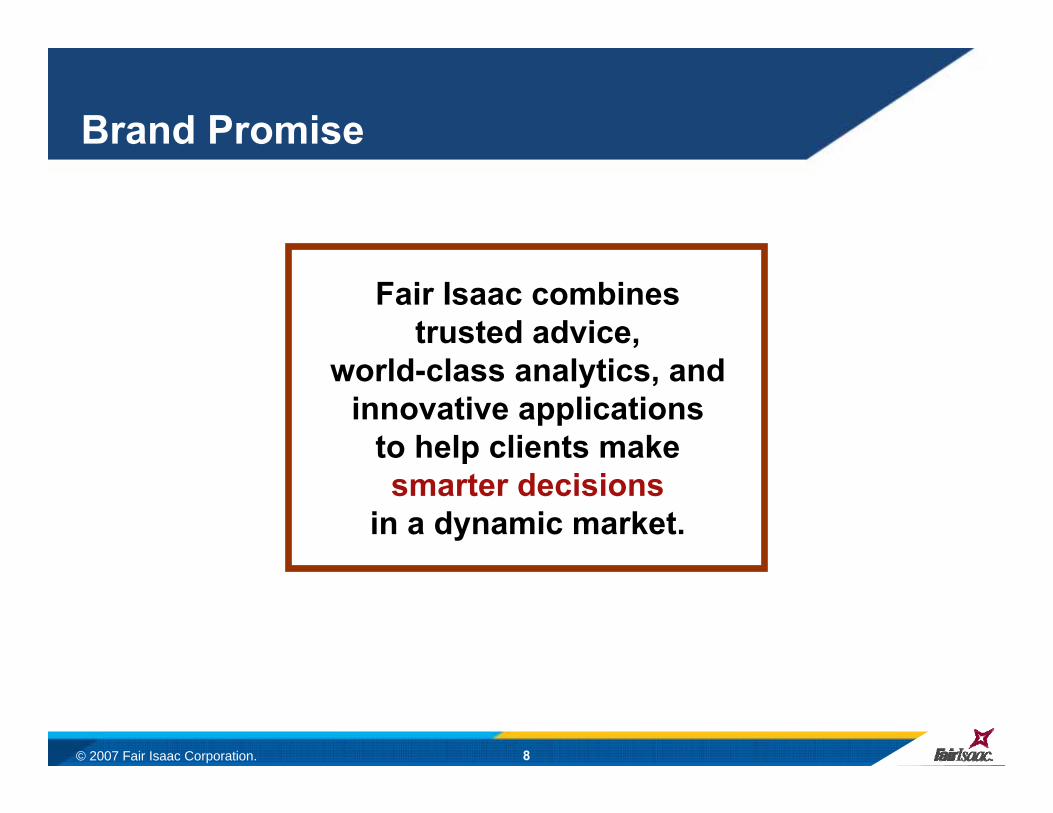
Brand Promise
Fair Isaac combinestrusted advice,
world-class analytics, andinnovative applications
to help clients makesmarter decisions
in a dynamic market.
9© 2007 Fair Isaac Corporation.
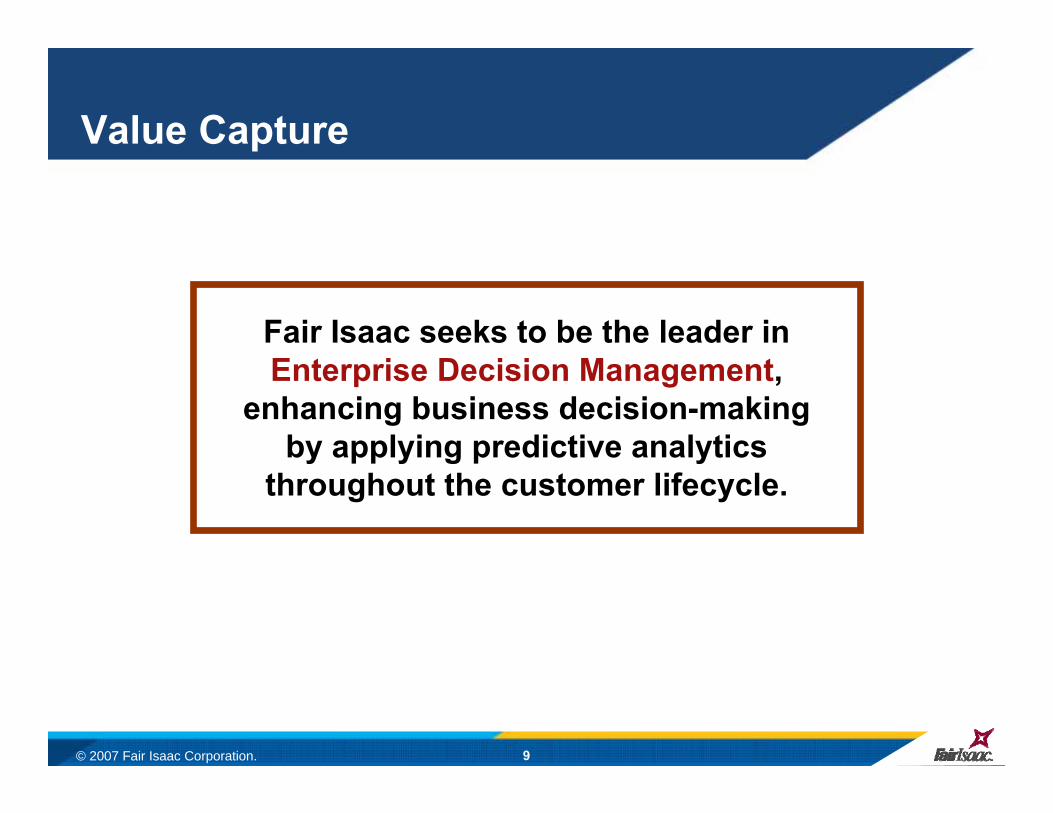
Value Capture
Fair Isaac seeks to be the leader inEnterprise Decision Management,
enhancing business decision-makingby applying predictive analytics
throughout the customer lifecycle.
10© 2007 Fair Isaac Corporation.
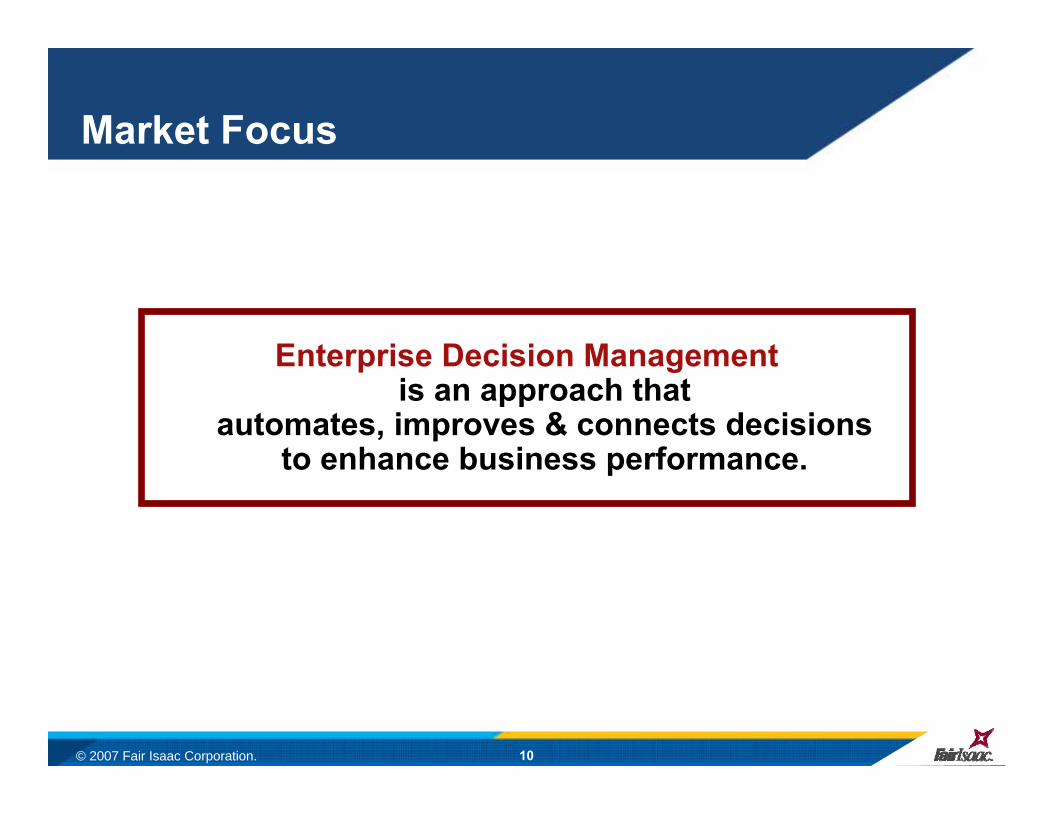
Market Focus
Enterprise Decision Managementis an approach that
automates, improves & connects decisions to enhance business performance.
11© 2007 Fair Isaac Corporation.
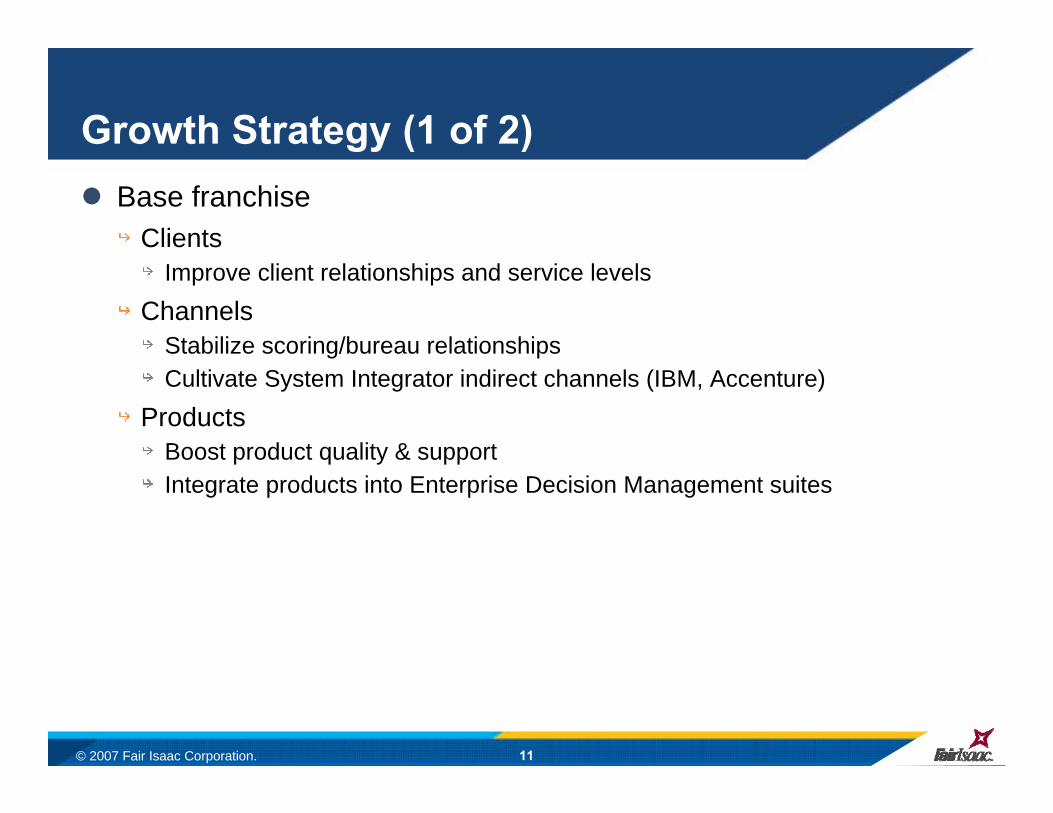
Growth Strategy (1 of 2)Base franchise
ClientsImprove client relationships and service levels
ChannelsStabilize scoring/bureau relationshipsCultivate System Integrator indirect channels (IBM, Accenture)
ProductsBoost product quality & supportIntegrate products into Enterprise Decision Management suites
12© 2007 Fair Isaac Corporation.
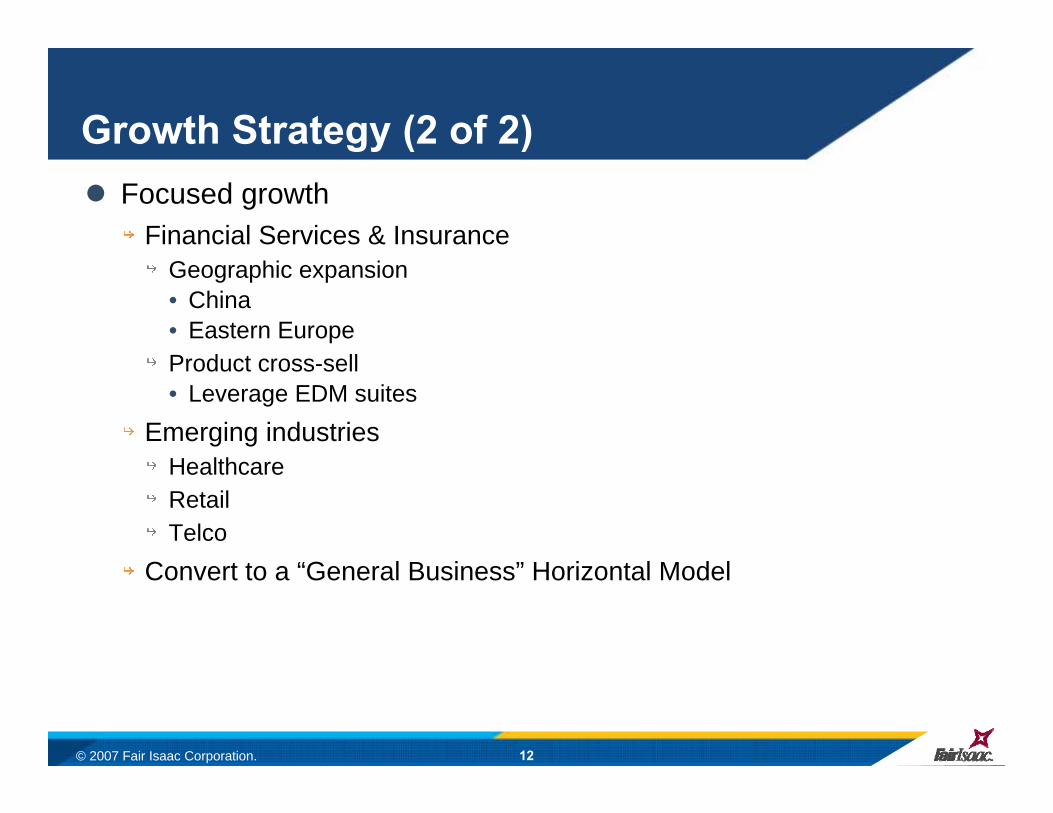
Growth Strategy (2 of 2)Focused growth
Financial Services & InsuranceGeographic expansion• China • Eastern EuropeProduct cross-sell• Leverage EDM suites
Emerging industriesHealthcareRetailTelco
Convert to a “General Business” Horizontal Model
13© 2007 Fair Isaac Corporation.
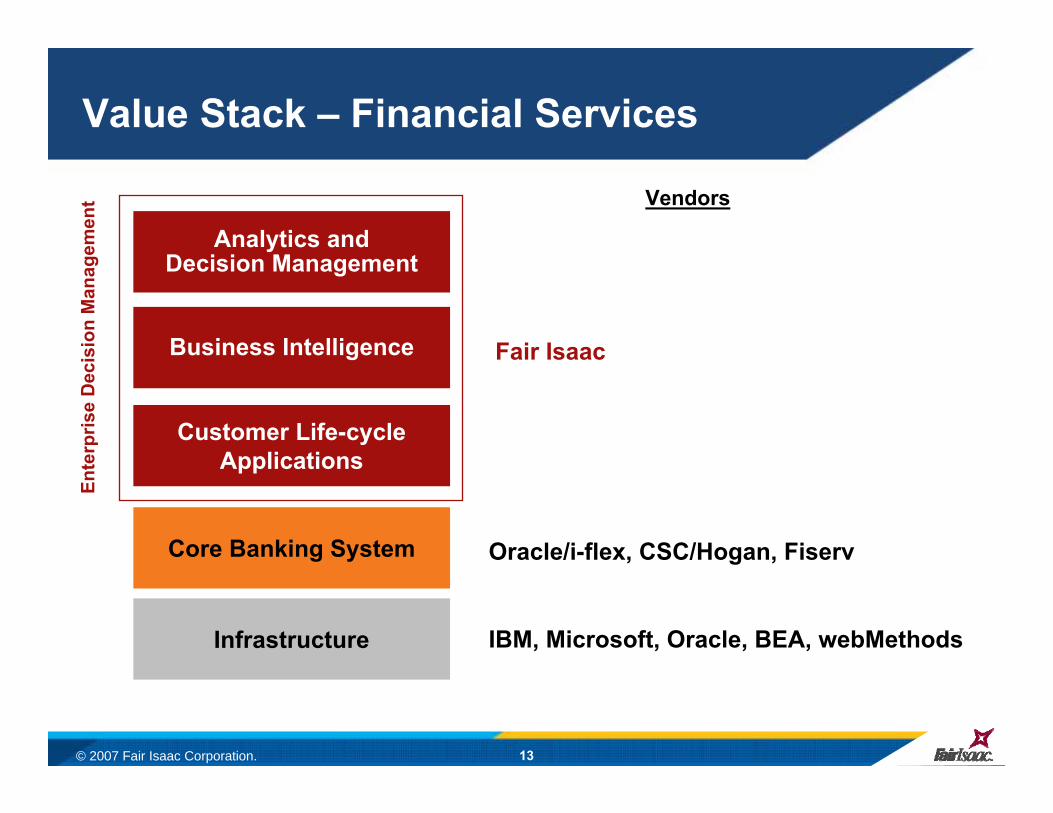
Value Stack – Financial Services
Analytics andDecision Management
Customer Life-cycle Applications
Business Intelligence
Core Banking System
Infrastructure
Vendors
Oracle/i-flex, CSC/Hogan, Fiserv
IBM, Microsoft, Oracle, BEA, webMethods
Fair Isaac
Ente
rpris
e D
ecis
ion
Man
agem
ent
14© 2007 Fair Isaac Corporation.
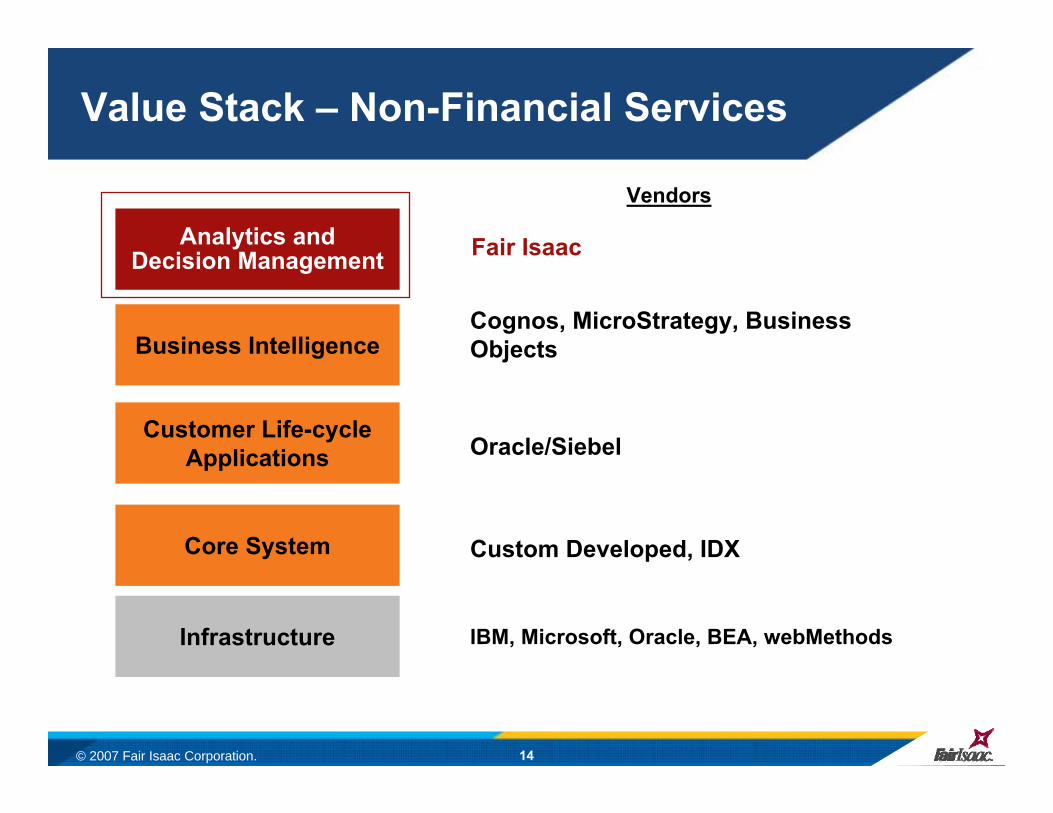
Analytics andDecision Management
Customer Life-cycle Applications
Business Intelligence
Core System
Infrastructure
Vendors
Custom Developed, IDX
IBM, Microsoft, Oracle, BEA, webMethods
Fair Isaac
Cognos, MicroStrategy, Business Objects
Oracle/Siebel
Value Stack – Non-Financial Services
15© 2007 Fair Isaac Corporation.
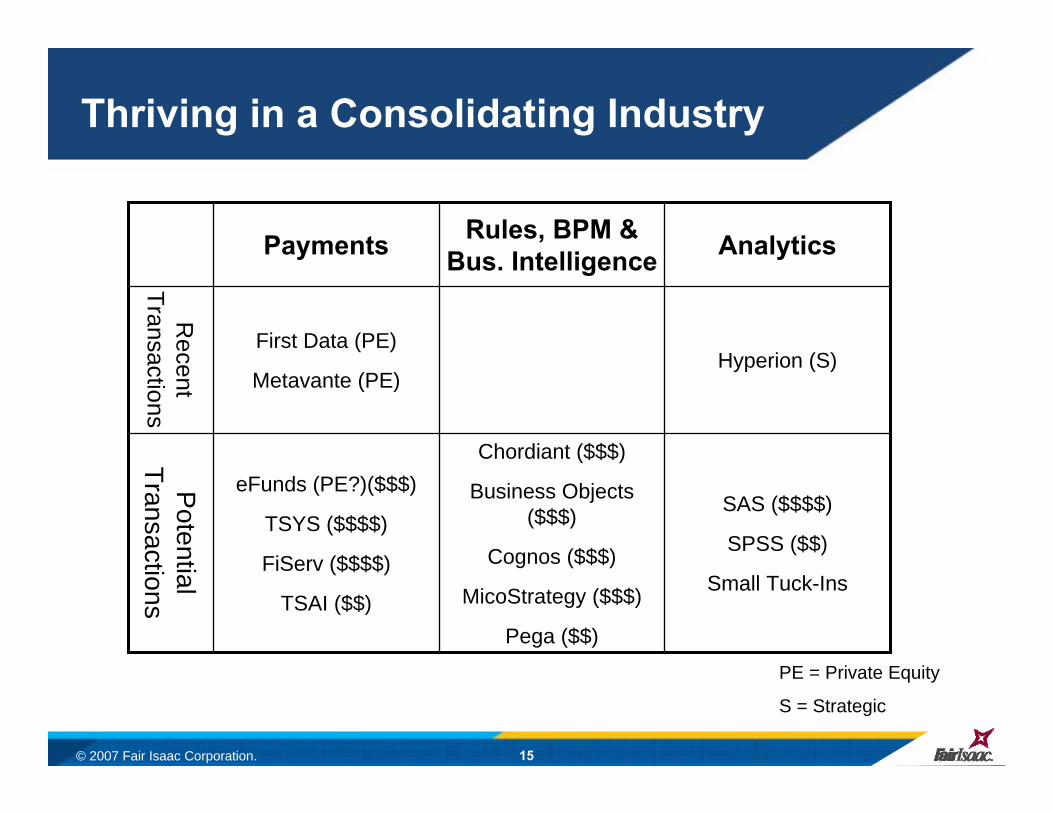
Thriving in a Consolidating Industry
Potential
TransactionsR
ecent Transactions
Hyperion (S)First Data (PE)
Metavante (PE)
SAS ($$$$)
SPSS ($$)
Small Tuck-Ins
Chordiant ($$$)
Business Objects ($$$)
Cognos ($$$)
MicoStrategy ($$$)
Pega ($$)
eFunds (PE?)($$$)
TSYS ($$$$)
FiServ ($$$$)
TSAI ($$)
AnalyticsRules, BPM &Bus. IntelligencePayments
PE = Private Equity
S = Strategic
16© 2007 Fair Isaac Corporation.
1
2 BUSINESS MODEL
2 3 4 5 6 7 8 9
17© 2007 Fair Isaac Corporation.
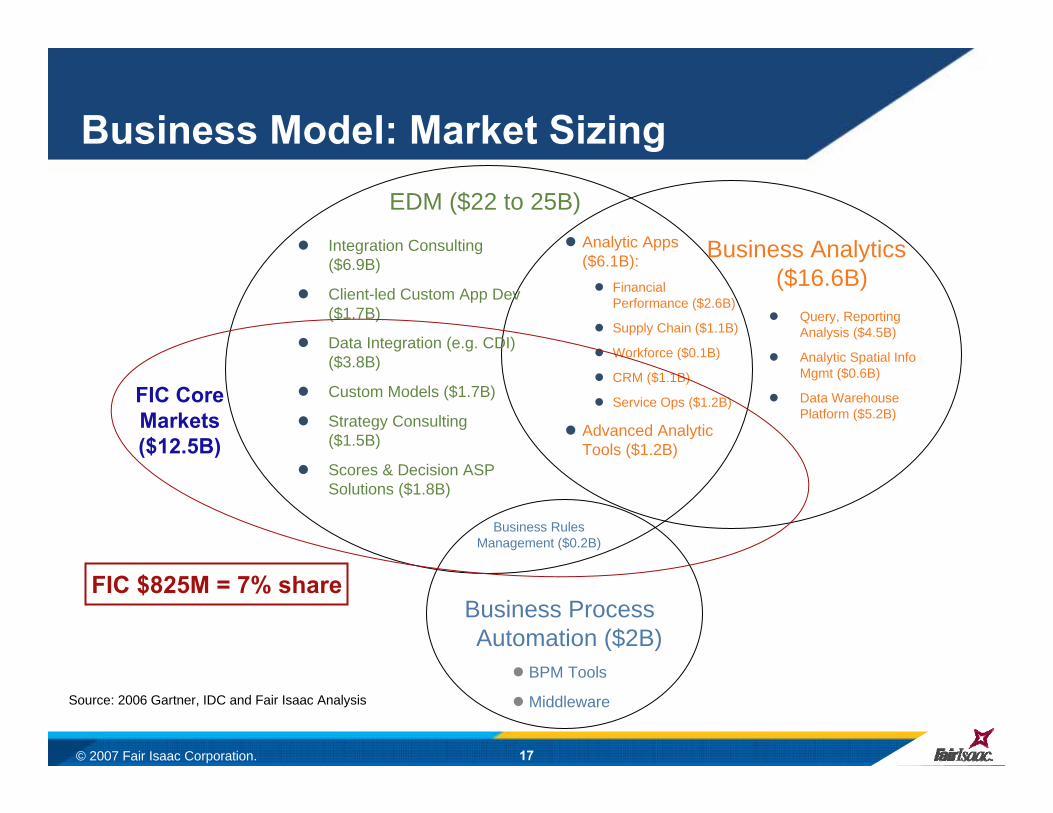
Business Model: Market Sizing
Source: 2006 Gartner, IDC and Fair Isaac Analysis
Business Process Automation ($2B)
BPM Tools
Middleware
EDM ($22 to 25B)
Business Analytics ($16.6B)
Analytic Apps ($6.1B):
Financial Performance ($2.6B)
Supply Chain ($1.1B)
Workforce ($0.1B)
CRM ($1.1B)
Service Ops ($1.2B)
Advanced Analytic Tools ($1.2B)
Integration Consulting ($6.9B)
Client-led Custom App Dev ($1.7B)
Data Integration (e.g. CDI) ($3.8B)
Custom Models ($1.7B)
Strategy Consulting ($1.5B)
Scores & Decision ASP Solutions ($1.8B)
Business Rules Management ($0.2B)
FIC Core Markets ($12.5B)
FIC $825M = 7% share
Query, Reporting Analysis ($4.5B)
Analytic Spatial Info Mgmt ($0.6B)
Data Warehouse Platform ($5.2B)
18© 2007 Fair Isaac Corporation.
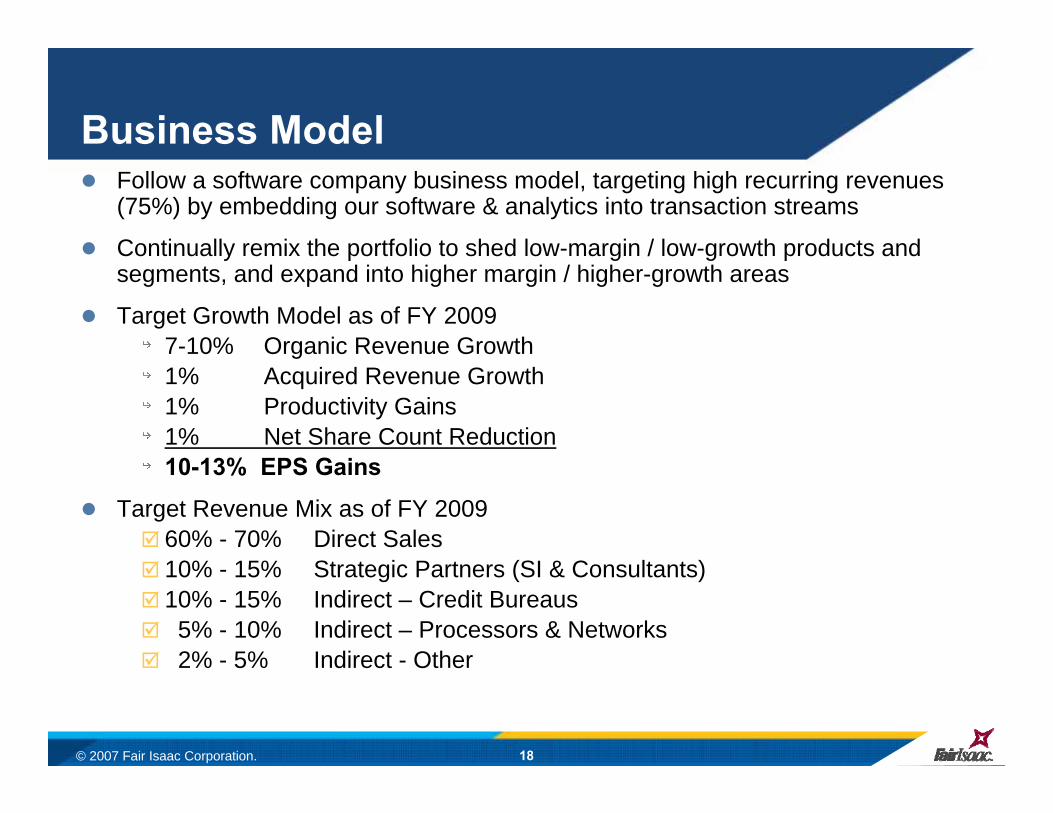
Business ModelFollow a software company business model, targeting high recurring revenues (75%) by embedding our software & analytics into transaction streams
Continually remix the portfolio to shed low-margin / low-growth products and segments, and expand into higher margin / higher-growth areas
Target Growth Model as of FY 20097-10% Organic Revenue Growth1% Acquired Revenue Growth1% Productivity Gains1% Net Share Count Reduction10-13% EPS Gains
Target Revenue Mix as of FY 200960% - 70% Direct Sales10% - 15% Strategic Partners (SI & Consultants)10% - 15% Indirect – Credit Bureaus5% - 10% Indirect – Processors & Networks2% - 5% Indirect - Other
19© 2007 Fair Isaac Corporation.
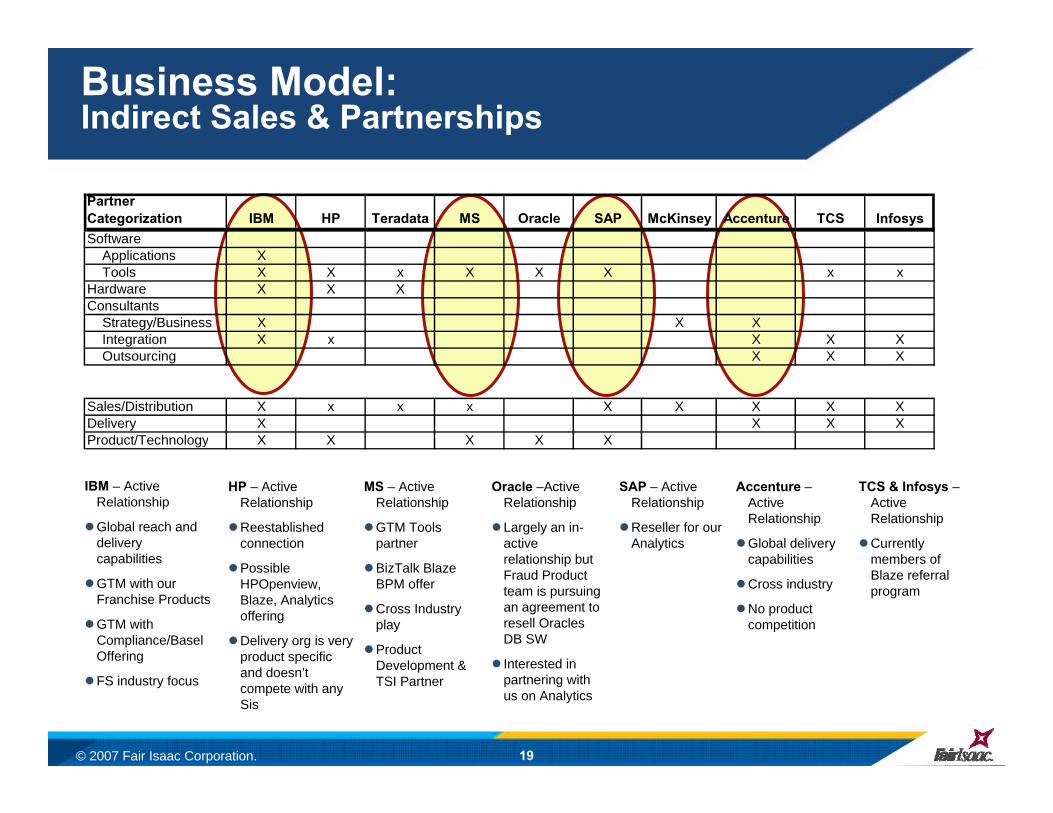
Partner Categorization IBM HP Teradata MS Oracle SAP McKinsey Accenture TCS InfosysSoftware Applications X Tools X X x X X X x xHardware X X XConsultants Strategy/Business X X X Integration X x X X X Outsourcing X X X
Sales/Distribution X x x x X X X X XDelivery X X X XProduct/Technology X X X X X
Business Model: Indirect Sales & Partnerships
IBM – Active Relationship
Global reach and delivery capabilities
GTM with our Franchise Products
GTM with Compliance/Basel Offering
FS industry focus
HP – Active Relationship
Reestablished connection
Possible HPOpenview, Blaze, Analytics offering
Delivery org is very product specific and doesn’t compete with any Sis
MS – Active Relationship
GTM Tools partner
BizTalk Blaze BPM offer
Cross Industry play
Product Development & TSI Partner
Oracle –Active Relationship
Largely an in-active relationship but Fraud Product team is pursuing an agreement to resell Oracles DB SW
Interested in partnering with us on Analytics
SAP – Active Relationship
Reseller for our Analytics
Accenture –Active Relationship
Global delivery capabilities
Cross industry
No product competition
TCS & Infosys –Active Relationship
Currently members of Blaze referral program
20© 2007 Fair Isaac Corporation.
1
3 Enterprise Decision Management
2 3 4 5 6 7 8 9
21© 2007 Fair Isaac Corporation.
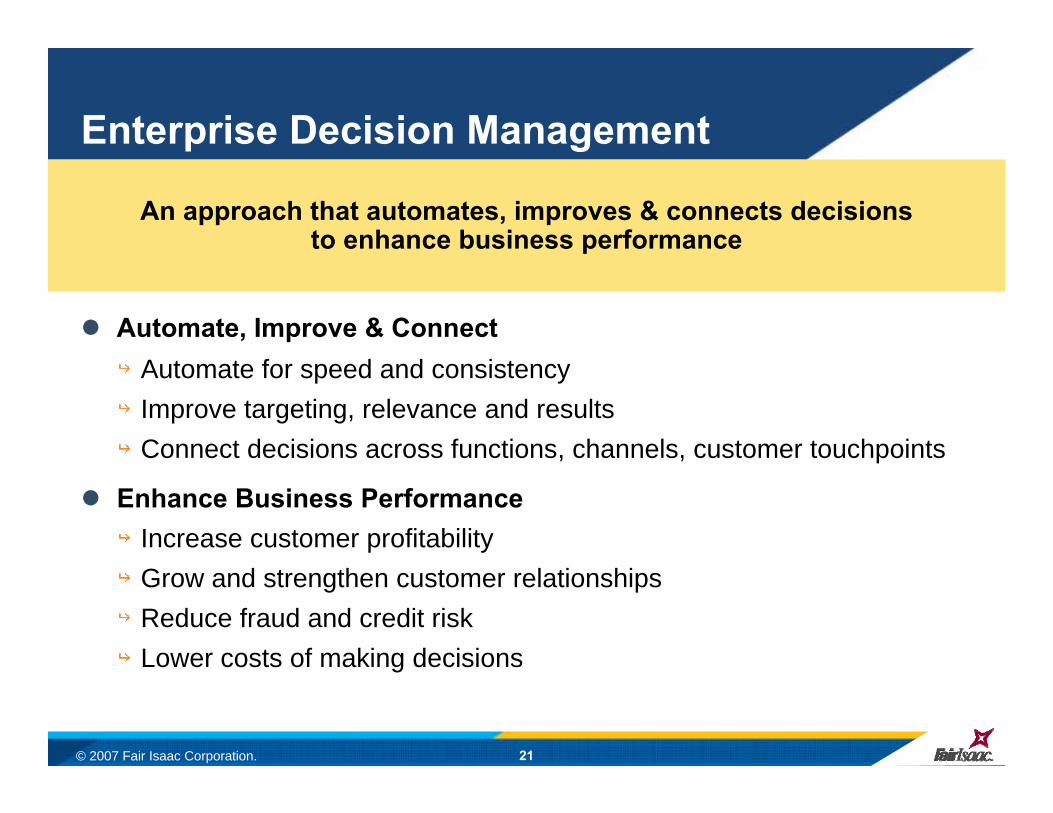
Enterprise Decision Management
Automate, Improve & ConnectAutomate for speed and consistencyImprove targeting, relevance and resultsConnect decisions across functions, channels, customer touchpoints
Enhance Business PerformanceIncrease customer profitability Grow and strengthen customer relationshipsReduce fraud and credit riskLower costs of making decisions
An approach that automates, improves & connects decisions to enhance business performance
22© 2007 Fair Isaac Corporation.
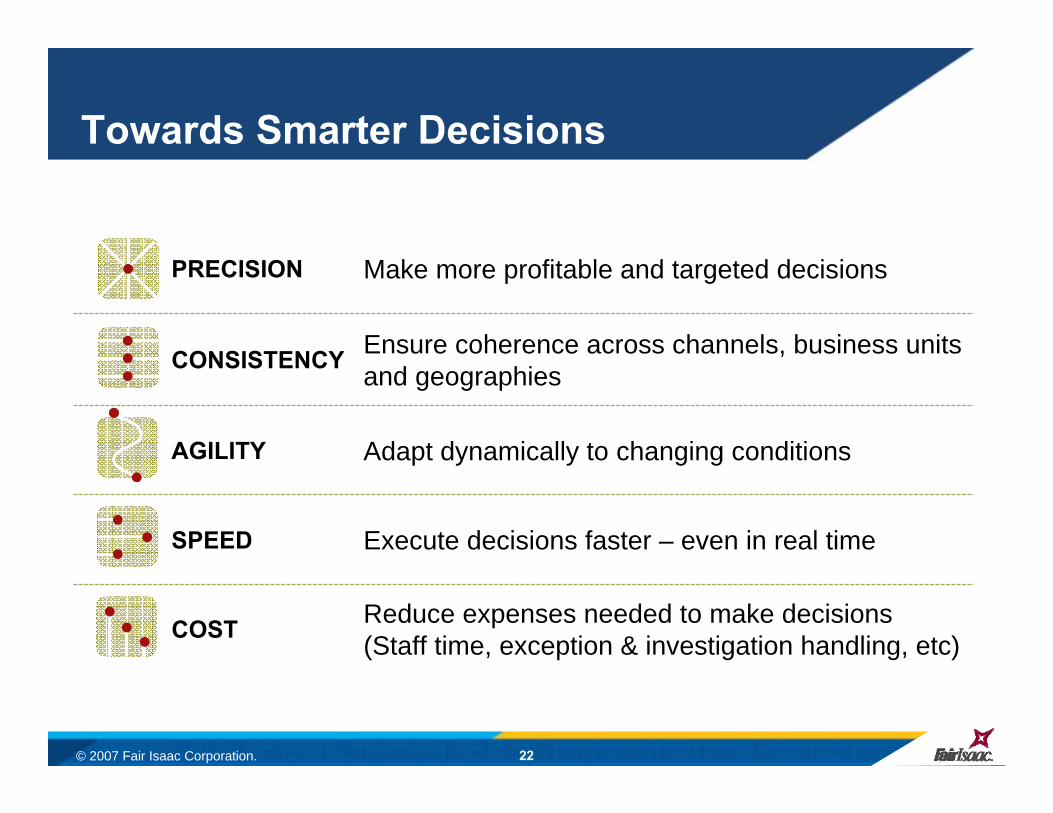
Towards Smarter Decisions
Reduce expenses needed to make decisions(Staff time, exception & investigation handling, …) COST
Execute decisions and modify processes quicklySPEED
Adapt dynamically to changing conditionsAGILITY
Ensure coherence across channels, business units and geographiesCONSISTENCY
Make more profitable and targeted decisionsPRECISION
Reduce expenses needed to make decisions(Staff time, exception & investigation handling, etc) COST
Execute decisions faster – even in real timeSPEED
Adapt dynamically to changing conditionsAGILITY
Ensure coherence across channels, business units and geographiesCONSISTENCY
Make more profitable and targeted decisionsPRECISION
23© 2007 Fair Isaac Corporation.
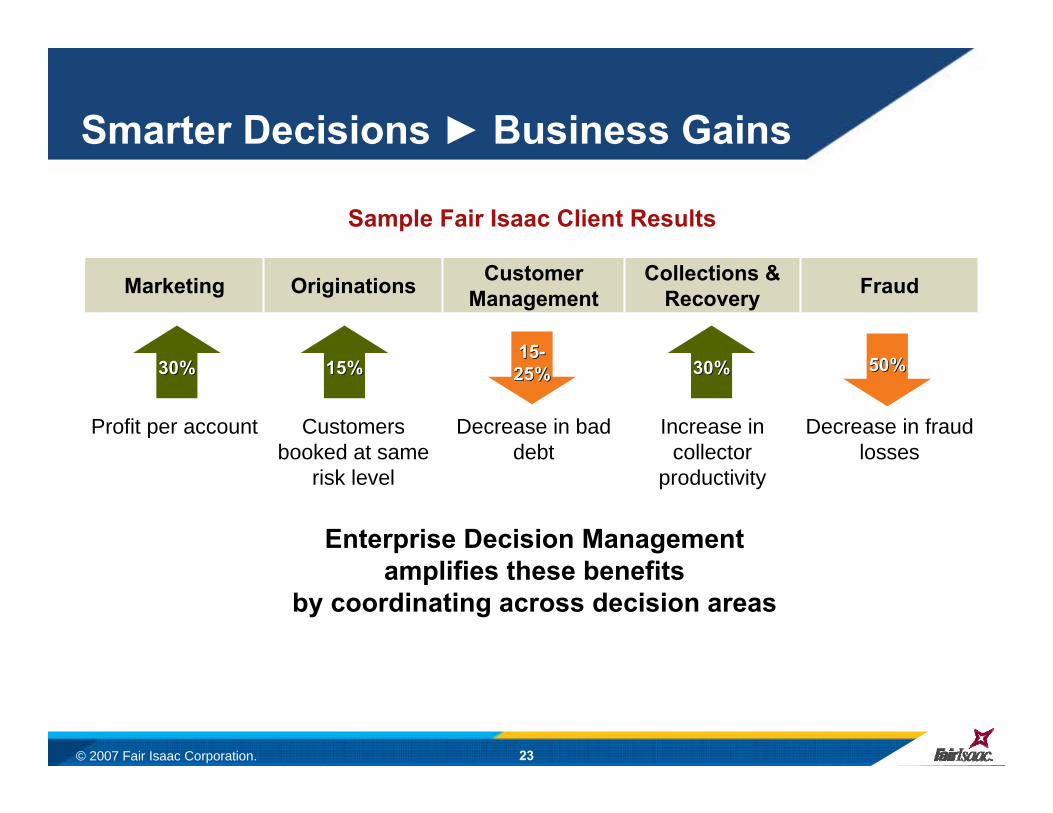
Smarter Decisions ► Business Gains
Decrease in fraud losses
Increase in collector
productivity
Decrease in bad debt
Customers booked at same
risk level
Profit per account
Collections & Recovery
Customer ManagementOriginations FraudMarketing
30%30% 15%15% 30%30% 50%50%
Sample Fair Isaac Client Results
1515--25%25%
Enterprise Decision Managementamplifies these benefits
by coordinating across decision areas
24© 2007 Fair Isaac Corporation.
EDMPredict Future BehaviorRecommended ActionsClosed-loop learning
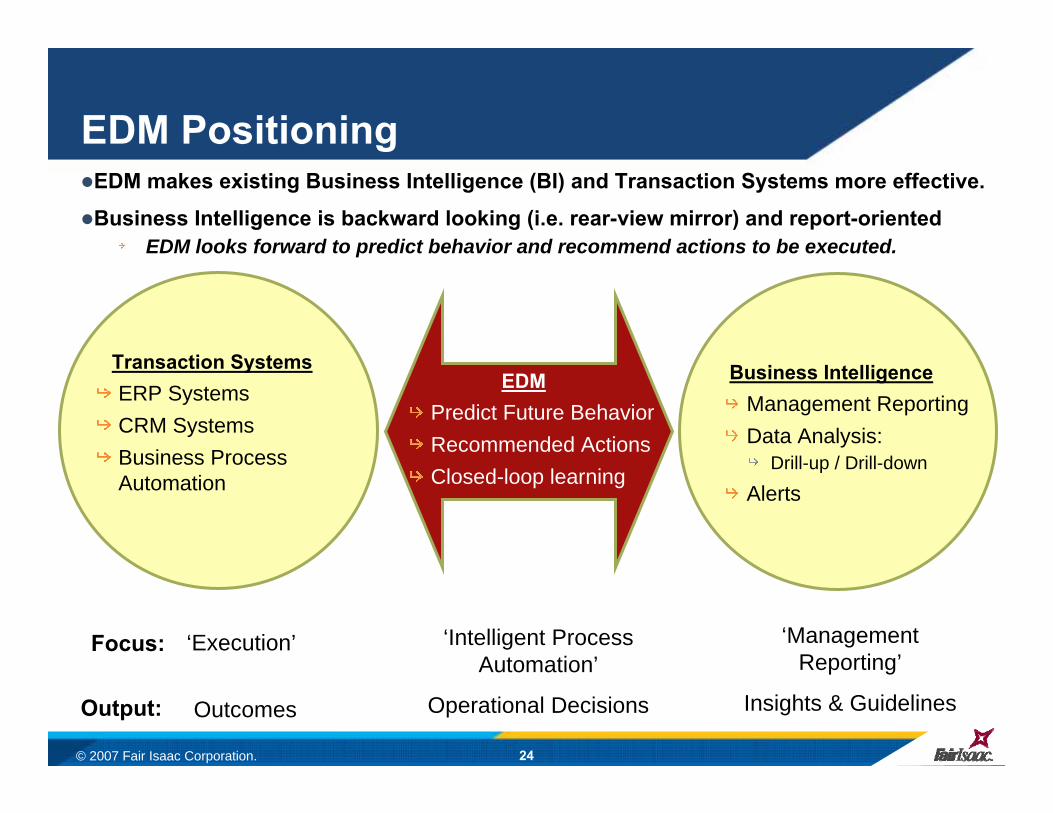
EDM Positioning
Transaction SystemsERP Systems CRM SystemsBusiness Process Automation
Business IntelligenceManagement ReportingData Analysis:
Drill-up / Drill-down
Alerts
EDM makes existing Business Intelligence (BI) and Transaction Systems more effective.
Business Intelligence is backward looking (i.e. rear-view mirror) and report-orientedEDM looks forward to predict behavior and recommend actions to be executed.
‘Intelligent Process Automation’
Operational Decisions
‘Management Reporting’
Insights & Guidelines
‘Execution’Focus:
Output: Outcomes
25© 2007 Fair Isaac Corporation.
EDM ContinuumB
usin
ess
Impa
ct
Degree of EDM Adoption
Rules Management Software
Predictive Analytics
Decision Models
Adaptive Control
Consistency,Speed, Agility
Enterprise Coordination
Poi
nt /
Func
tiona
l Li
ftE
xten
sive
/ C
ontin
ual L
ift
ReusableComponents
Shared Decision Capabilities
Precision and Adaptation
Connect
Decisions Across Channels,
Systems and Customer Lifecycle
Automate
High-Volume
Operational Decisions
Improve
the Quality and Results
from Decisions
26© 2007 Fair Isaac Corporation.
Connect
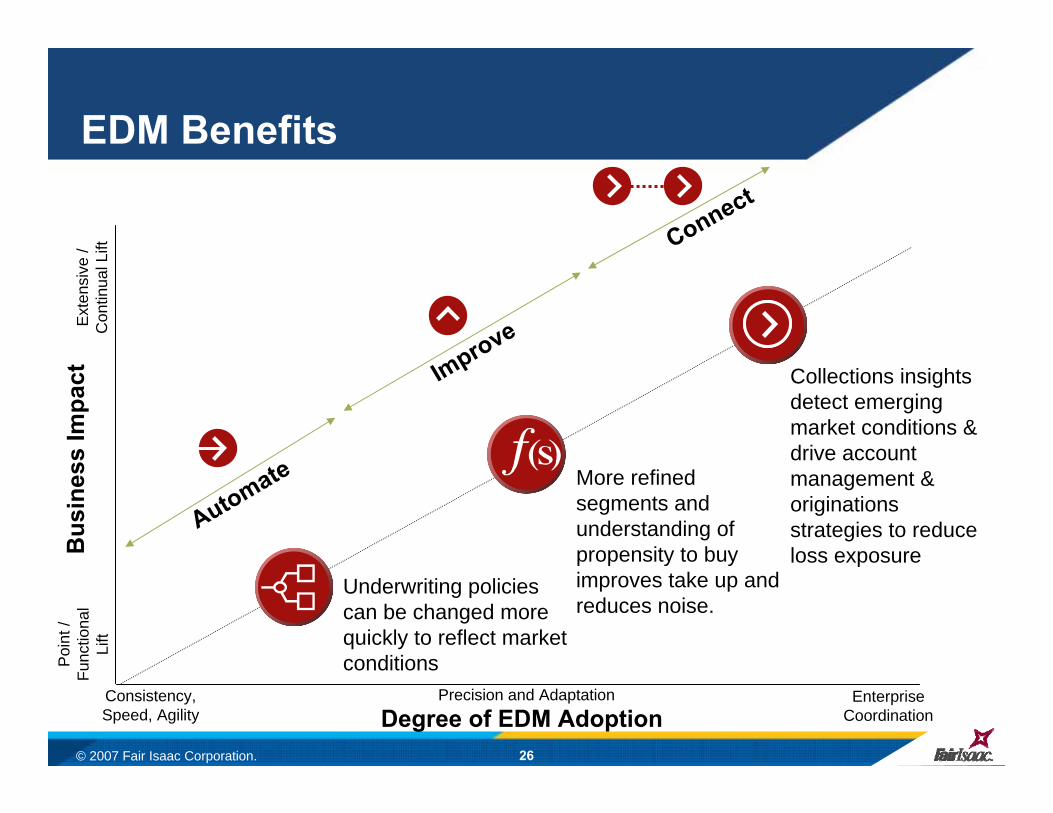
EDM BenefitsB
usin
ess
Impa
ct
Degree of EDM AdoptionConsistency,Speed, Agility
Enterprise Coordination
Poi
nt /
Func
tiona
l Li
ftE
xten
sive
/ C
ontin
ual L
ift
Automate
Improve
Underwriting policies can be changed more quickly to reflect market conditions
More refined segments and understanding of propensity to buy improves take up and reduces noise.
Collections insights detect emerging market conditions & drive account management & originations strategies to reduce loss exposure
Precision and Adaptation
27© 2007 Fair Isaac Corporation.
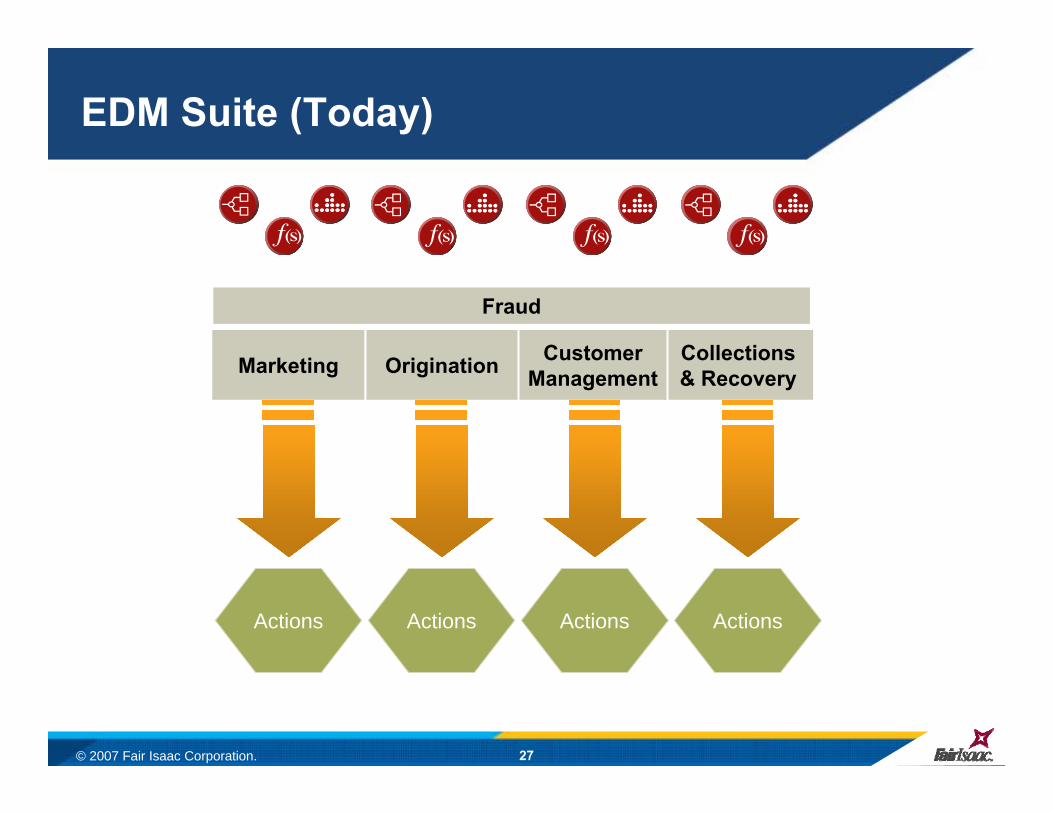
EDM Suite (Today)
Actions Actions Actions Actions
Collections & Recovery
Fraud
Customer ManagementOriginationMarketing
28© 2007 Fair Isaac Corporation.
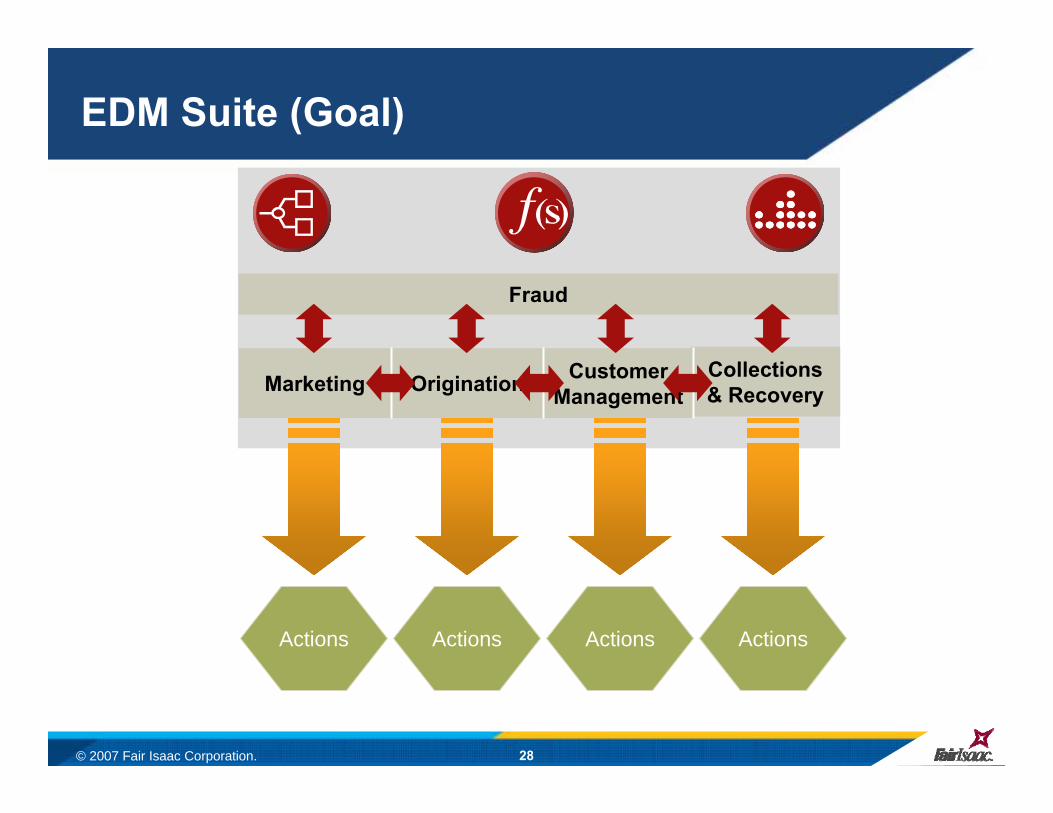
EDM Suite (Goal)
Collections & Recovery
Fraud
Customer ManagementOriginationMarketing
Actions Actions Actions Actions
29© 2007 Fair Isaac Corporation.
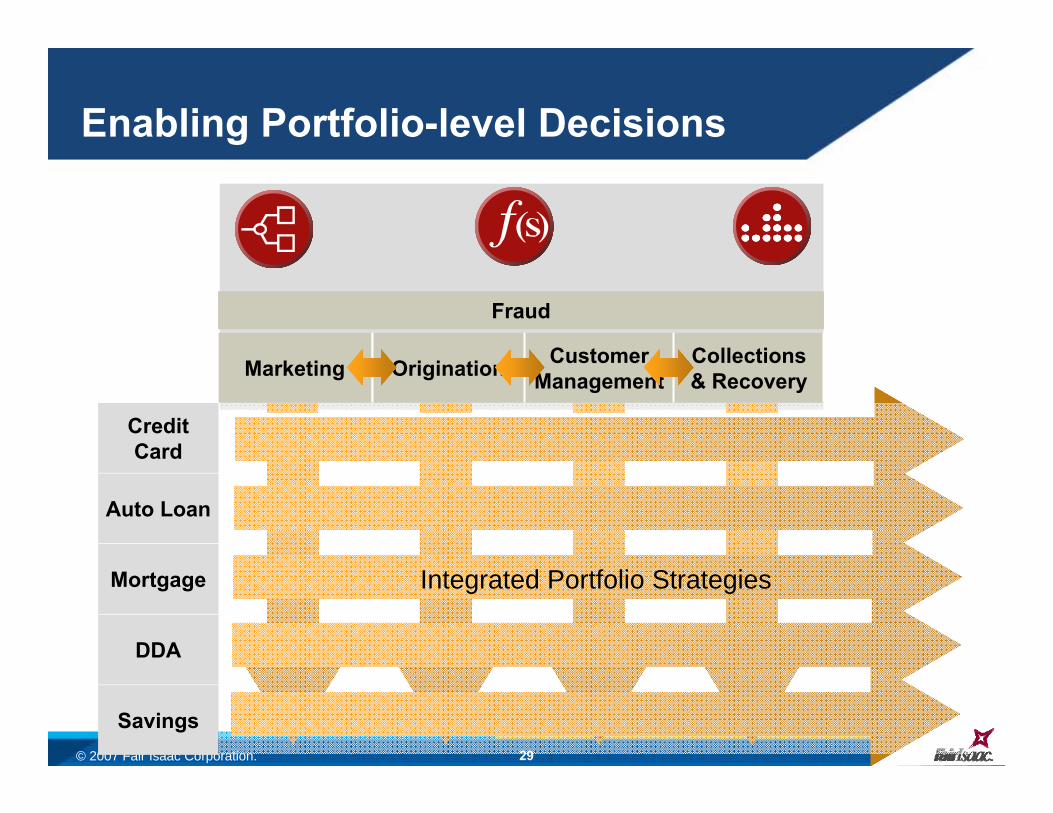
Enabling Portfolio-level Decisions
Collections & Recovery
Fraud
Customer ManagementOriginationMarketing
Credit Card
Auto Loan
Mortgage
DDA
Savings
Integrated Portfolio Strategies
30© 2007 Fair Isaac Corporation.
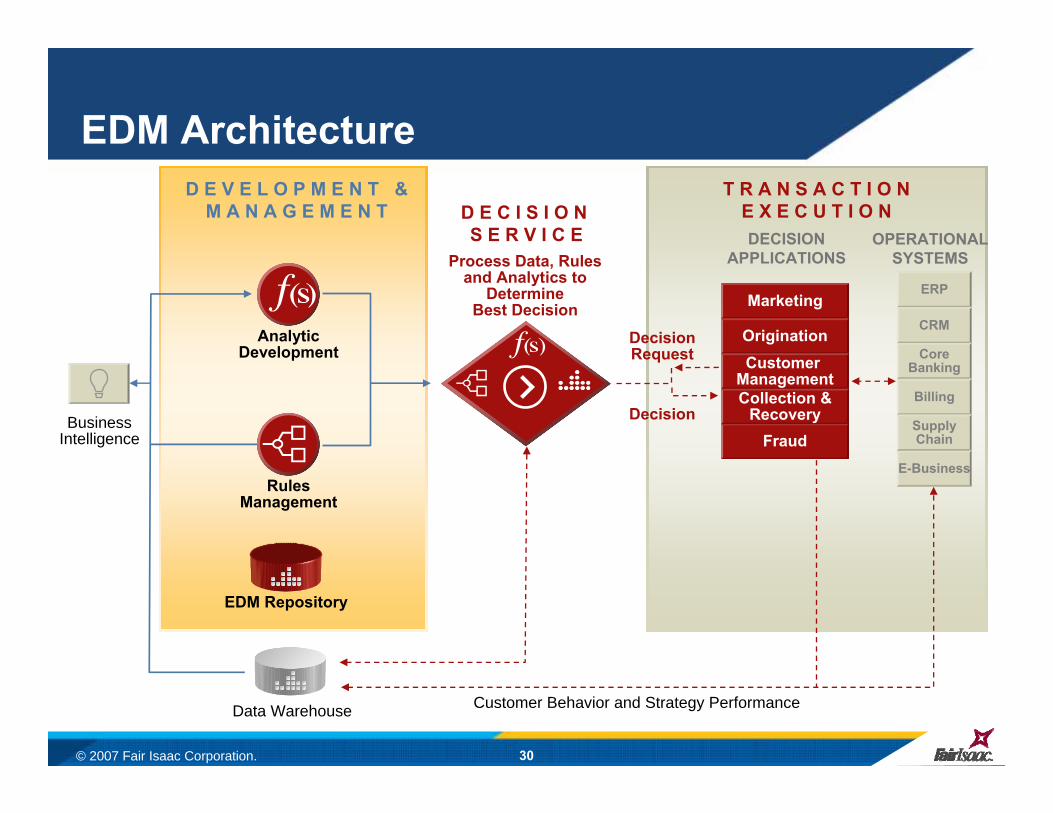
Data Warehouse
EDM Architecture
Customer Behavior and Strategy Performance
AnalyticDevelopment
RulesManagement
BusinessIntelligence
T R A N S A C T I O NE X E C U T I O N
D E V E L O P M E N T &M A N A G E M E N T D E C I S I O N
S E R V I C E OPERATIONALSYSTEMS
E-Business
Process Data, Rules and Analytics to
Determine Best Decision
DecisionRequest
Decision
EDM Repository
Fraud
DECISIONAPPLICATIONS
ERP
CRM
Core Banking
Billing
SupplyChain
Marketing
OriginationCustomer
ManagementCollection &
Recovery

31© 2007 Fair Isaac Corporation.
1
4 MARKETS
2 3 4 5 6 7 8 9
32© 2007 Fair Isaac Corporation.
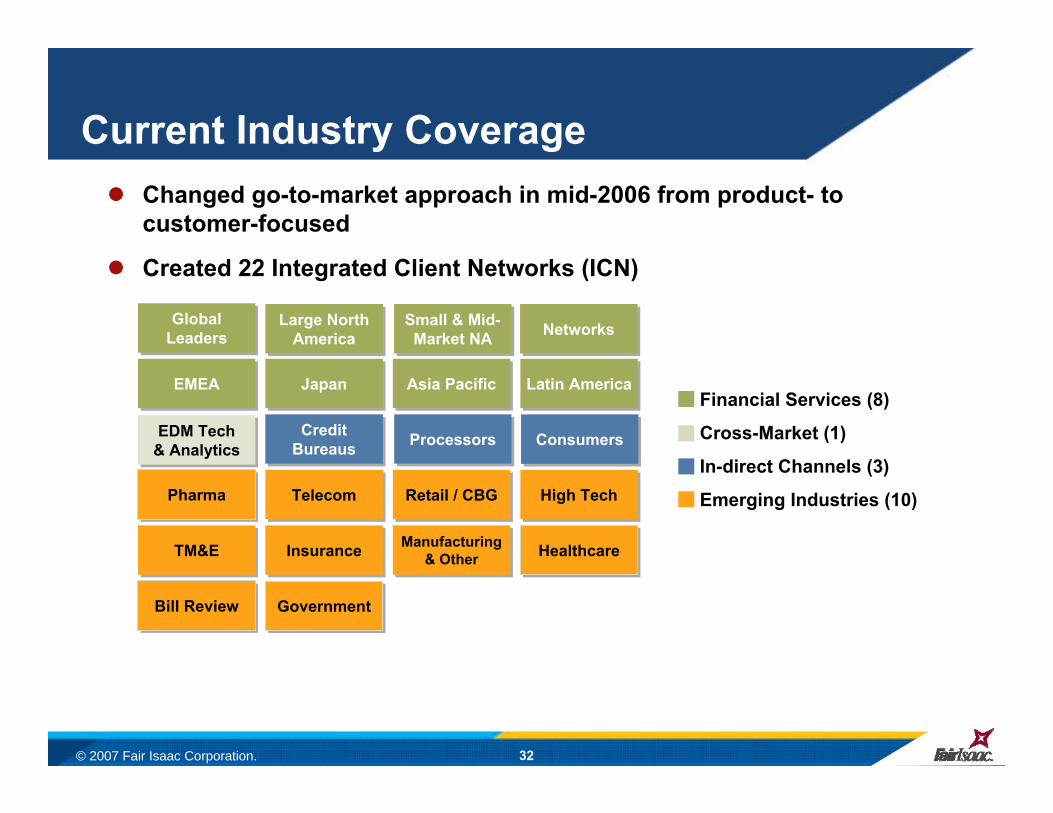
Changed go-to-market approach in mid-2006 from product- to customer-focused
Created 22 Integrated Client Networks (ICN)
Current Industry Coverage
Global LeadersGlobal
Leaders
EMEAEMEA
Small & Mid-Market NA
Small & Mid-Market NA
InsuranceInsurance
PharmaPharma TelecomTelecom
EDM Tech& AnalyticsEDM Tech
& Analytics
JapanJapan
Credit BureausCredit
Bureaus
Manufacturing & Other
Manufacturing & Other
Retail / CBGRetail / CBG
NetworksNetworks
Asia PacificAsia Pacific
ProcessorsProcessors
HealthcareHealthcare
GovernmentGovernment
High TechHigh Tech
Large North America
Large North America
Latin America Latin America
ConsumersConsumers
Bill ReviewBill Review
TM&ETM&E
Financial Services (8)
Cross-Market (1)
In-direct Channels (3)
Emerging Industries (10)
33© 2007 Fair Isaac Corporation.
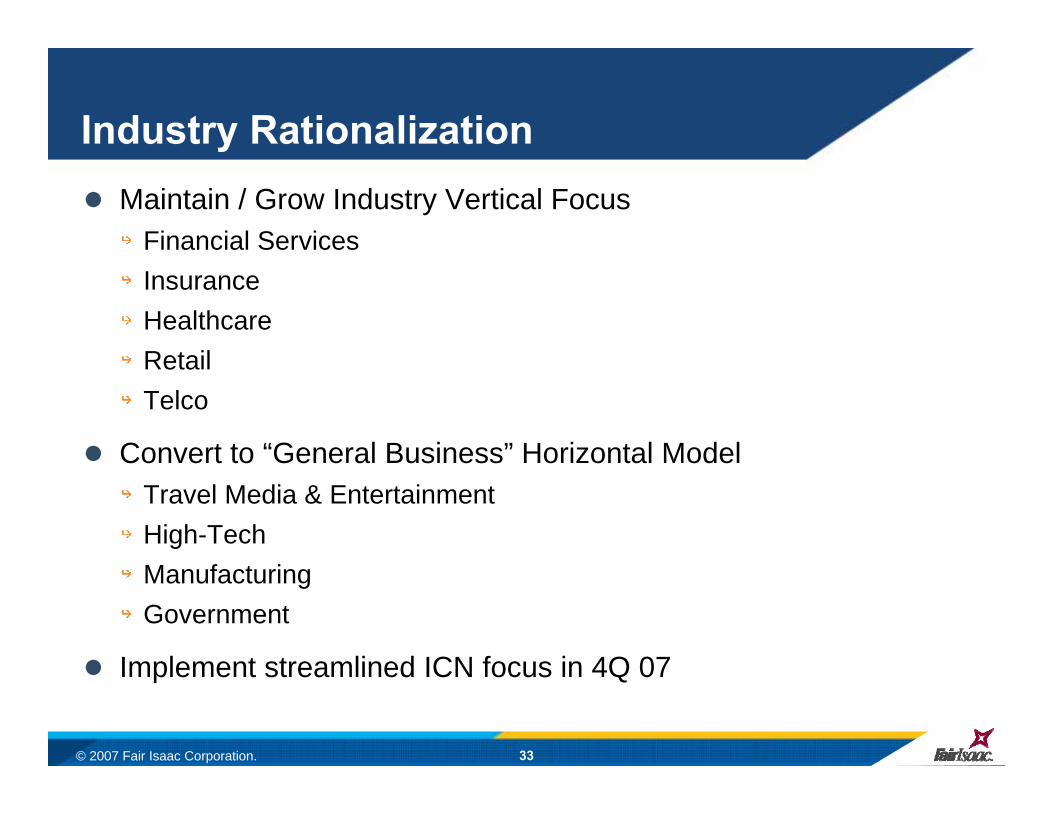
Industry RationalizationMaintain / Grow Industry Vertical Focus
Financial ServicesInsuranceHealthcareRetailTelco
Convert to “General Business” Horizontal ModelTravel Media & EntertainmentHigh-TechManufacturingGovernment
Implement streamlined ICN focus in 4Q 07

34© 2007 Fair Isaac Corporation.
1
5 GEOGRAPHY
2 3 4 5 6 7 8 9
35© 2007 Fair Isaac Corporation.
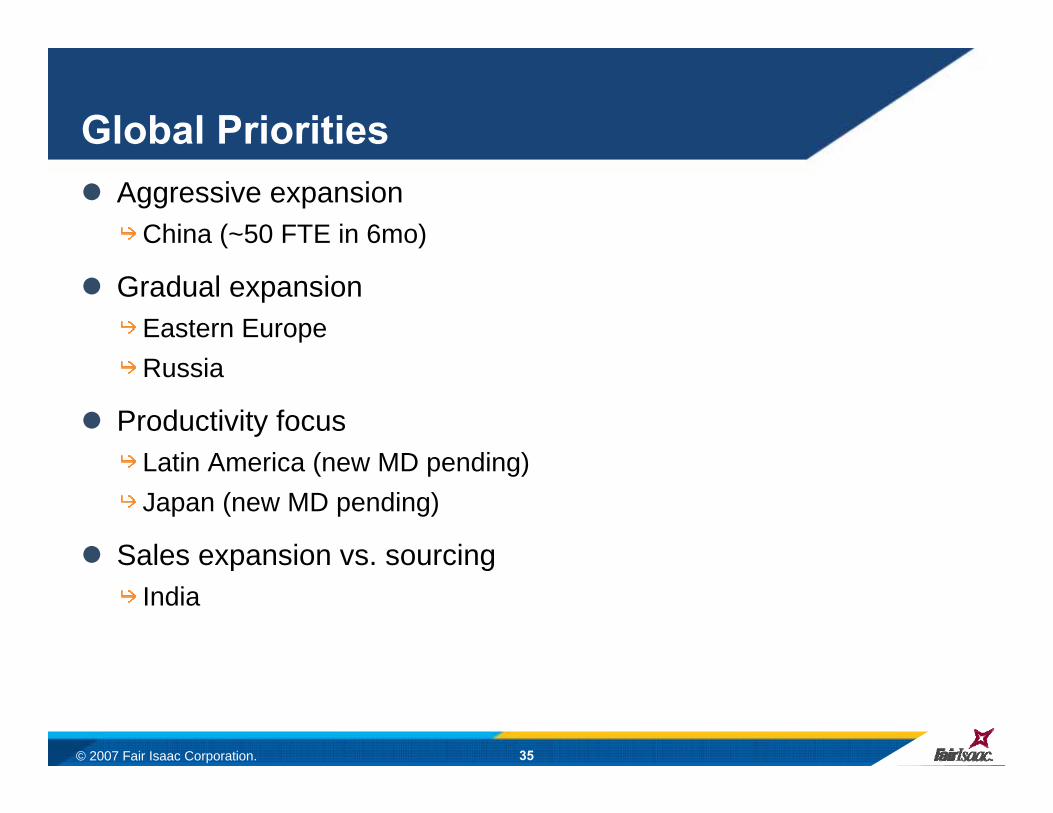
Global PrioritiesAggressive expansion
China (~50 FTE in 6mo)
Gradual expansionEastern EuropeRussia
Productivity focusLatin America (new MD pending)Japan (new MD pending)
Sales expansion vs. sourcingIndia
36© 2007 Fair Isaac Corporation.
1
6 PRODUCTS
2 3 4 5 6 7 8 9
37© 2007 Fair Isaac Corporation.
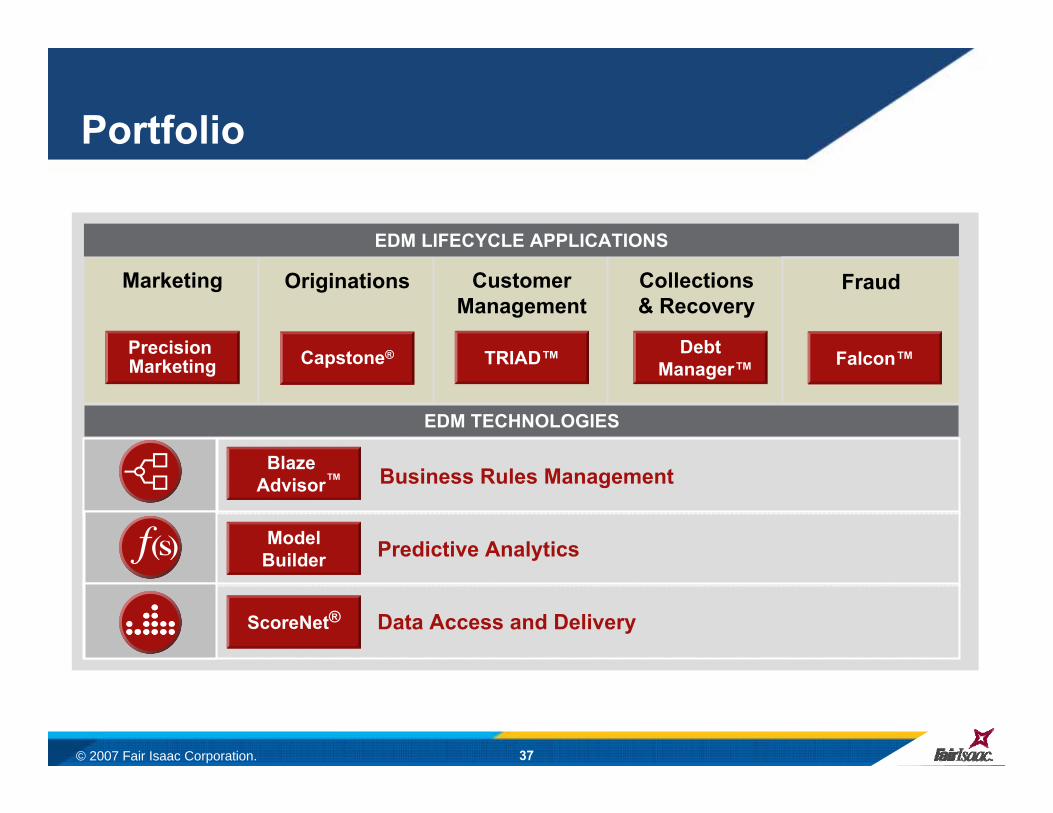
Portfolio
Marketing
Precision Marketing
Originations
Capstone®
Customer Management
TRIAD™
Collections & Recovery
DebtManager™
EDM TECHNOLOGIES
Business Rules Management
Predictive Analytics
Data Access and Delivery
EDM LIFECYCLE APPLICATIONS
Blaze Advisor™
ModelBuilder
ScoreNet®
Fraud
Falcon™
38© 2007 Fair Isaac Corporation.
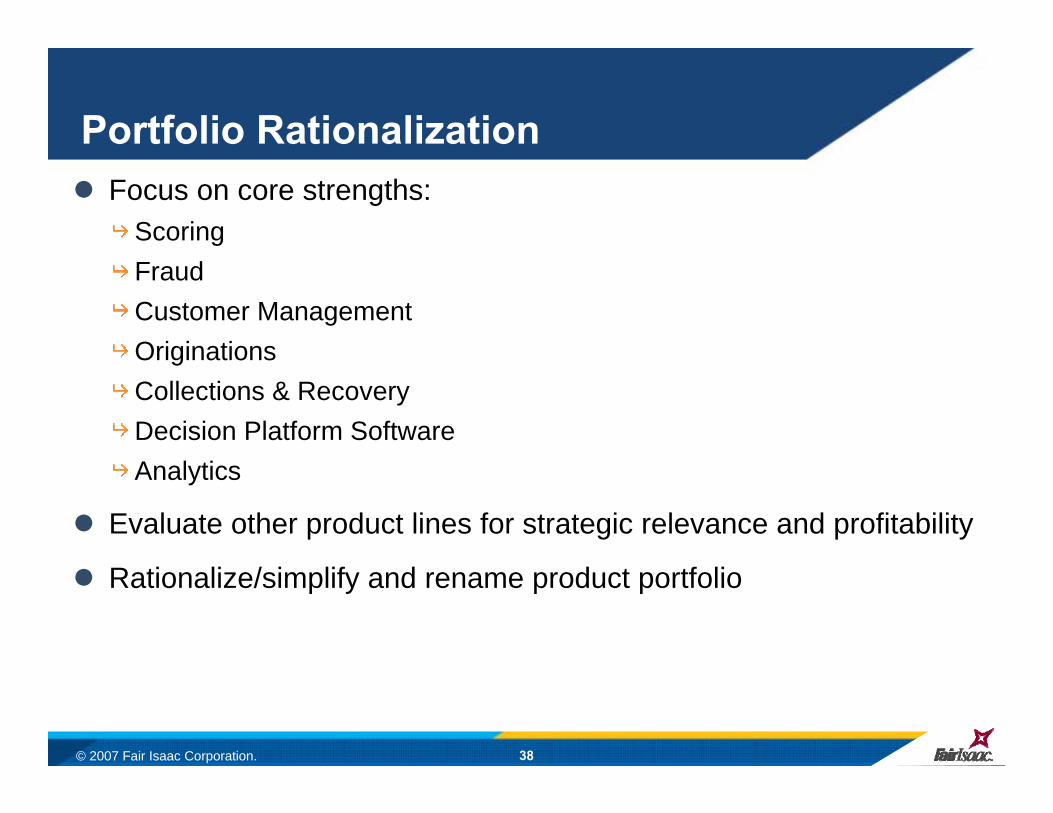
Portfolio RationalizationFocus on core strengths:
ScoringFraudCustomer ManagementOriginationsCollections & RecoveryDecision Platform SoftwareAnalytics
Evaluate other product lines for strategic relevance and profitability
Rationalize/simplify and rename product portfolio
39© 2007 Fair Isaac Corporation.
1
7 SERVICES
2 3 4 5 6 7 8 9
40© 2007 Fair Isaac Corporation.
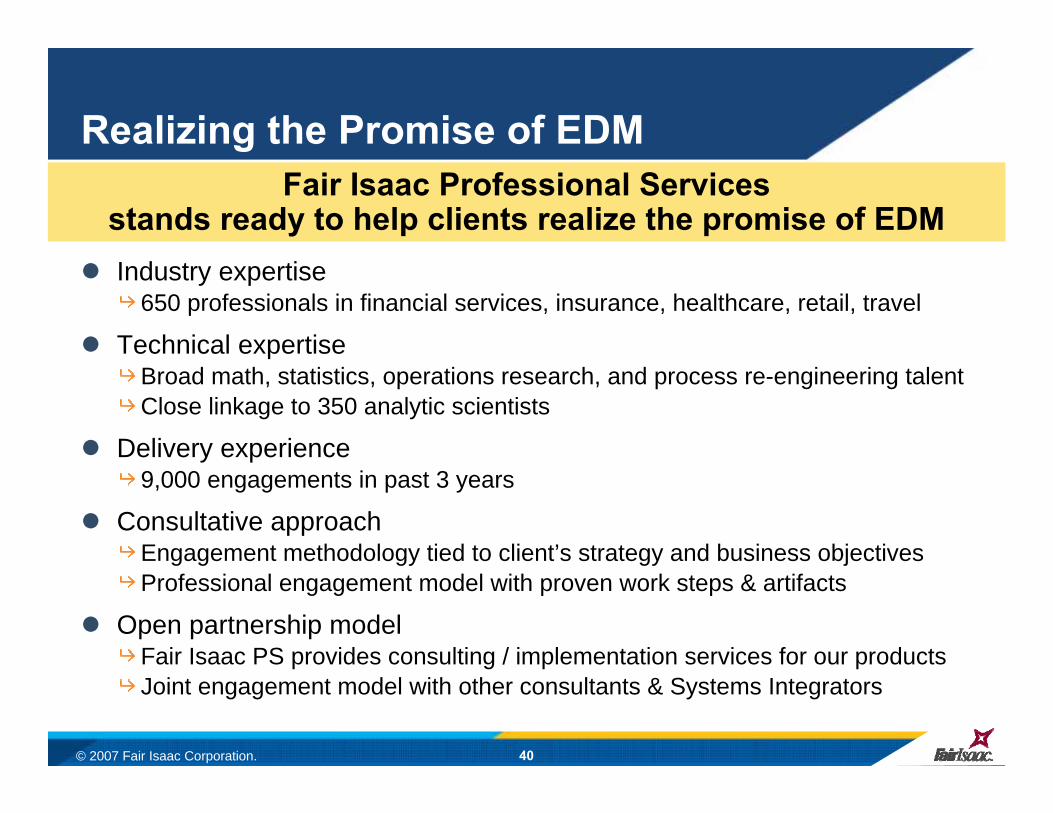
Realizing the Promise of EDM
Industry expertise650 professionals in financial services, insurance, healthcare, retail, travel
Technical expertiseBroad math, statistics, operations research, and process re-engineering talentClose linkage to 350 analytic scientists
Delivery experience9,000 engagements in past 3 years
Consultative approachEngagement methodology tied to client’s strategy and business objectivesProfessional engagement model with proven work steps & artifacts
Open partnership modelFair Isaac PS provides consulting / implementation services for our productsJoint engagement model with other consultants & Systems Integrators
Fair Isaac Professional Servicesstands ready to help clients realize the promise of EDM
41© 2007 Fair Isaac Corporation.
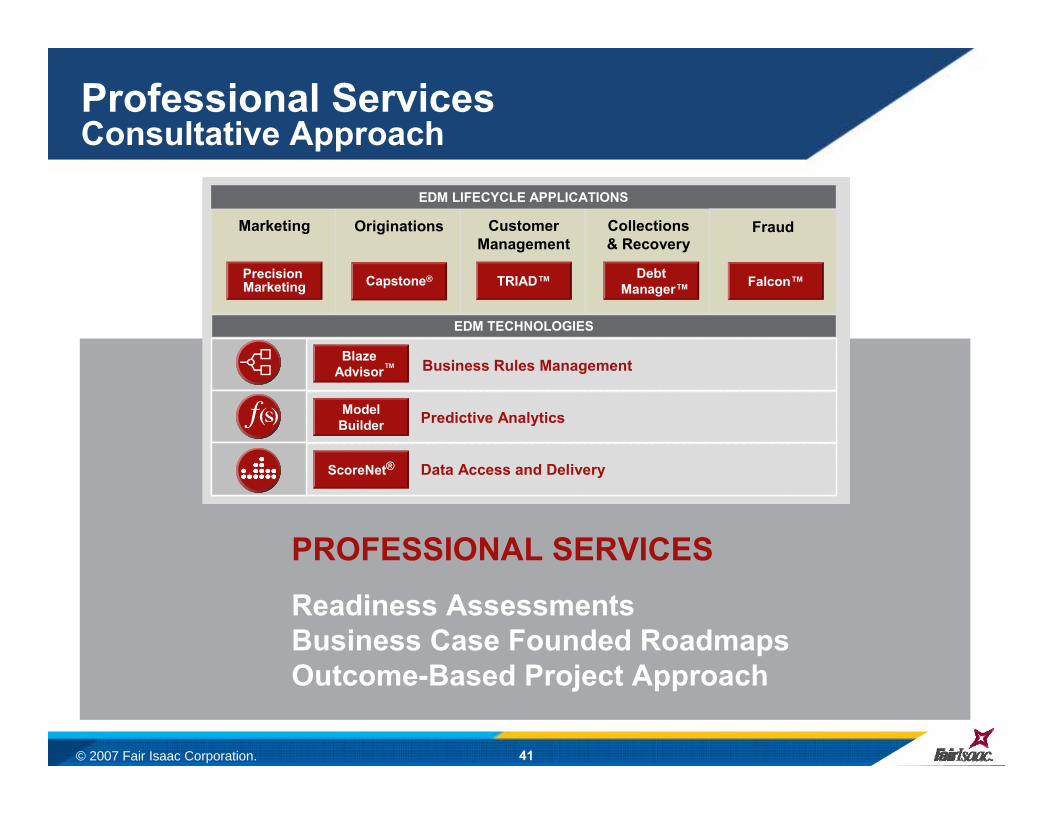
Professional Services Consultative Approach
PROFESSIONAL SERVICESReadiness AssessmentsBusiness Case Founded RoadmapsOutcome-Based Project Approach
Marketing
Precision Marketing
Originations
Capstone®
Customer Management
TRIAD™
Collections & Recovery
DebtManager™
EDM TECHNOLOGIES
Business Rules Management
Predictive Analytics
Data Access and Delivery
EDM LIFECYCLE APPLICATIONS
Blaze Advisor™
ModelBuilder
ScoreNet®
Fraud
Falcon™
Marketing
Precision Marketing
Marketing
Precision Marketing
Originations
Capstone®
Originations
Capstone®
Customer Management
TRIAD™
Customer Management
TRIAD™
Collections & Recovery
DebtManager™
Collections & Recovery
DebtManager™
EDM TECHNOLOGIES
Business Rules Management
Predictive Analytics
Data Access and Delivery
EDM LIFECYCLE APPLICATIONS
Blaze Advisor™
ModelBuilder
ScoreNet®
Fraud
Falcon™
Fraud
Falcon™
42© 2007 Fair Isaac Corporation.
Professional Services focus areasDelivery excellence
Project ManagementResource planning and availabilityQuality assurance programs
Value RealizationRoadmaps as a deliverableBusiness case collaborationPost implementation reviews
EDM Breadth and DepthEDM specific offeringsQuantity and quality of resources
Market shareAdvanced services – significantly grow analytic/decision strategy, modelingTraditional services – grow product implementation services, introduce partneringIntegration services – rely on partners
EDM Enablement SupportProductize EDM migration road mapping, readiness and related services
PartnershipsDevelop blended services engagement model with IBM, Accenture and others
43© 2007 Fair Isaac Corporation.
1
8 EXECUTION
2 3 4 5 6 7 8 9
44© 2007 Fair Isaac Corporation.
Execution AgendaProduct Management
Unified portfolio managementRemix portfolio to higher-value solutionsSimpler portfolio with new naming architectureProvide EDM product roadmap & timeline
Development Rationalize development tools & methodologiesProvide EDM architecture incl. info managementMove to SOA / web-services interoperability
MarketingImprove value propositionBoost brand imageDrive thought leadership
SalesTighten Integrated Client Network structureBoost # and skills of Client Partners and Client Relationship ManagersFocus on client satisfaction / resolving critical situations
DeliveryBuild skills and staffingImprove service qualityMigrate clients from products to EDM suites
ResearchManage Innovation pipeline to improve yieldEngage clients around new IPFIC Research Exchange program
45© 2007 Fair Isaac Corporation.
More Responsive Organization
Increased Focus on Core Strengths
More Client Support Managers
Specialized TeamsCore CompetenciesSolution Architects
Multi-National Structure
Stronger Product Support
Streamlined Escalations

46© 2007 Fair Isaac Corporation.
1
9 INNOVATION
2 3 4 5 6 7 8 9
47© 2007 Fair Isaac Corporation.
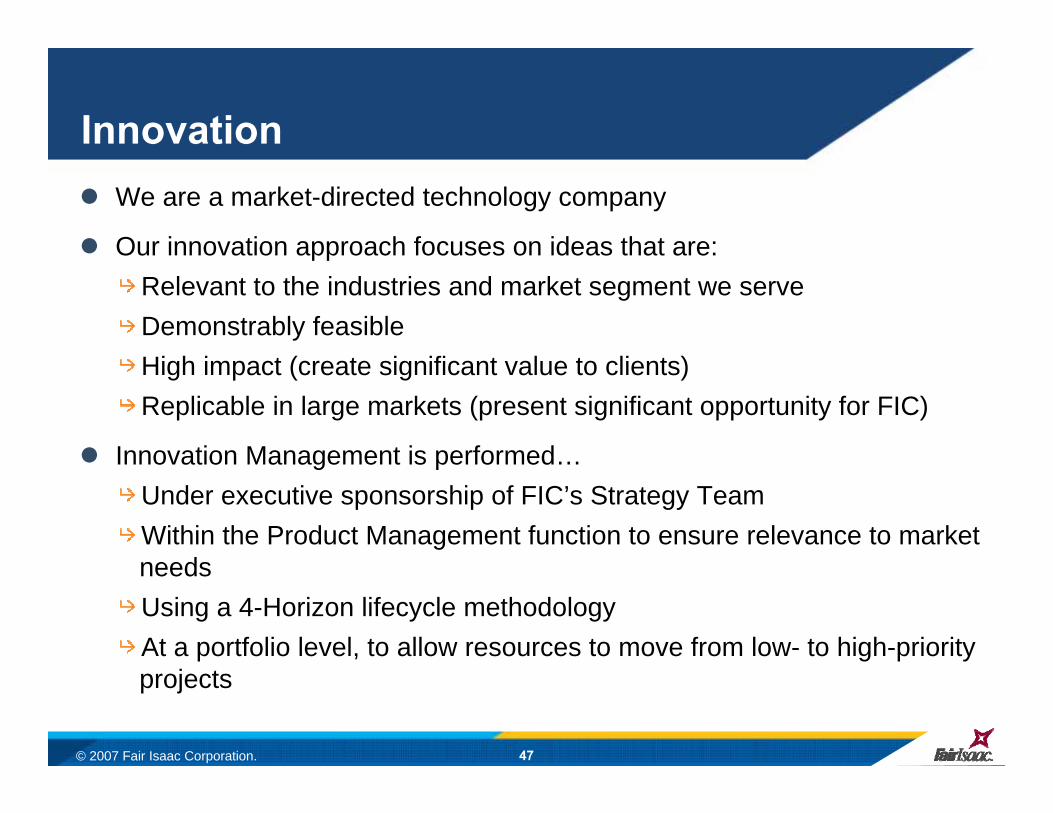
InnovationWe are a market-directed technology company
Our innovation approach focuses on ideas that are:Relevant to the industries and market segment we serveDemonstrably feasibleHigh impact (create significant value to clients)Replicable in large markets (present significant opportunity for FIC)
Innovation Management is performed…Under executive sponsorship of FIC’s Strategy TeamWithin the Product Management function to ensure relevance to market needsUsing a 4-Horizon lifecycle methodologyAt a portfolio level, to allow resources to move from low- to high-priority projects
48© 2007 Fair Isaac Corporation.
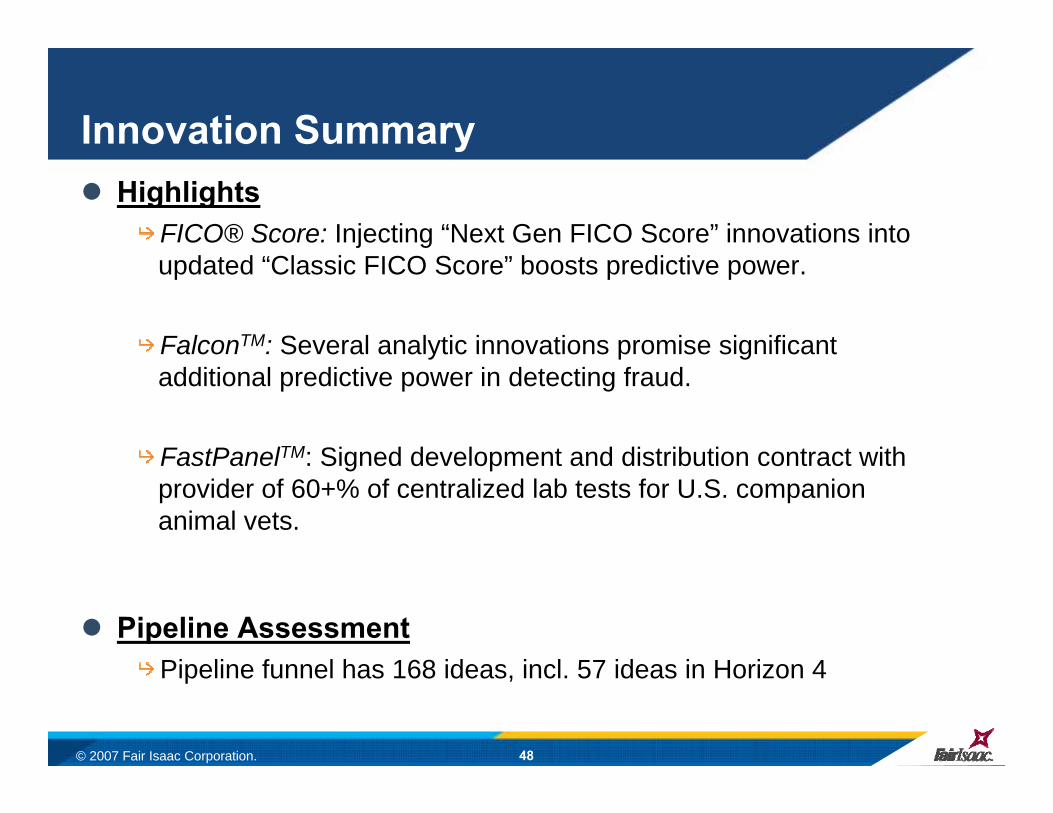
Innovation SummaryHighlights
FICO® Score: Injecting “Next Gen FICO Score” innovations into updated “Classic FICO Score” boosts predictive power.
FalconTM: Several analytic innovations promise significant additional predictive power in detecting fraud.
FastPanelTM: Signed development and distribution contract with provider of 60+% of centralized lab tests for U.S. companion animal vets.
Pipeline AssessmentPipeline funnel has 168 ideas, incl. 57 ideas in Horizon 4
49© 2007 Fair Isaac Corporation.
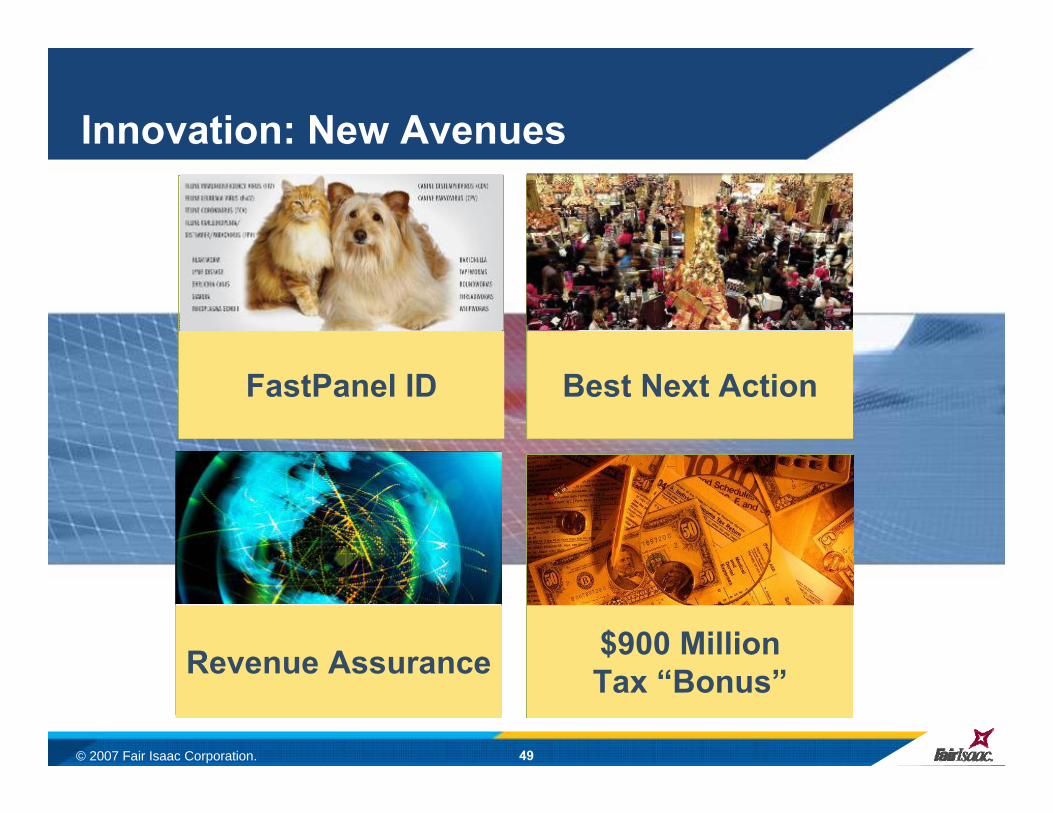
Innovation: New Avenues
INNOVATION
FastPanel ID
INNOVATION
Revenue Assurance
INNOVATION
Best Next Action
INNOVATION$900 Million Tax “Bonus”
© 2007 Fair Isaac Corporation.
Financial Overview
Chuck OsborneChief Financial Officer
51© 2007 Fair Isaac Corporation.
$0
$100
$200
$300
$400
$500
$600
$700
$800
$900
FY 2001A FY 2002A FY 2003A FY 2004A FY 2005A FY 2006A FY 2007E
Total Revenue Recurring Revenue
$629.3 $706.2$329.1 $392.4
(In m
illio
ns)
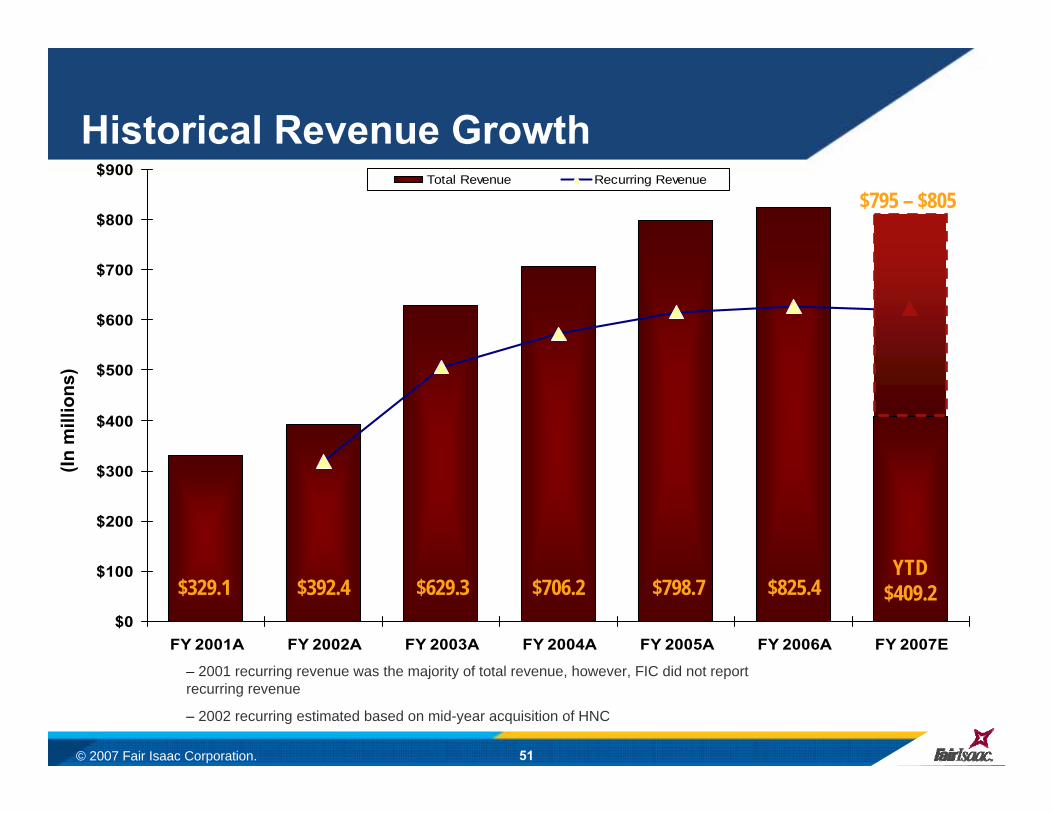
Historical Revenue Growth
– 2001 recurring revenue was the majority of total revenue, however, FIC did not report recurring revenue
– 2002 recurring estimated based on mid-year acquisition of HNC
$798.7 $825.4
$795 – $805
YTD $409.2
52© 2007 Fair Isaac Corporation.
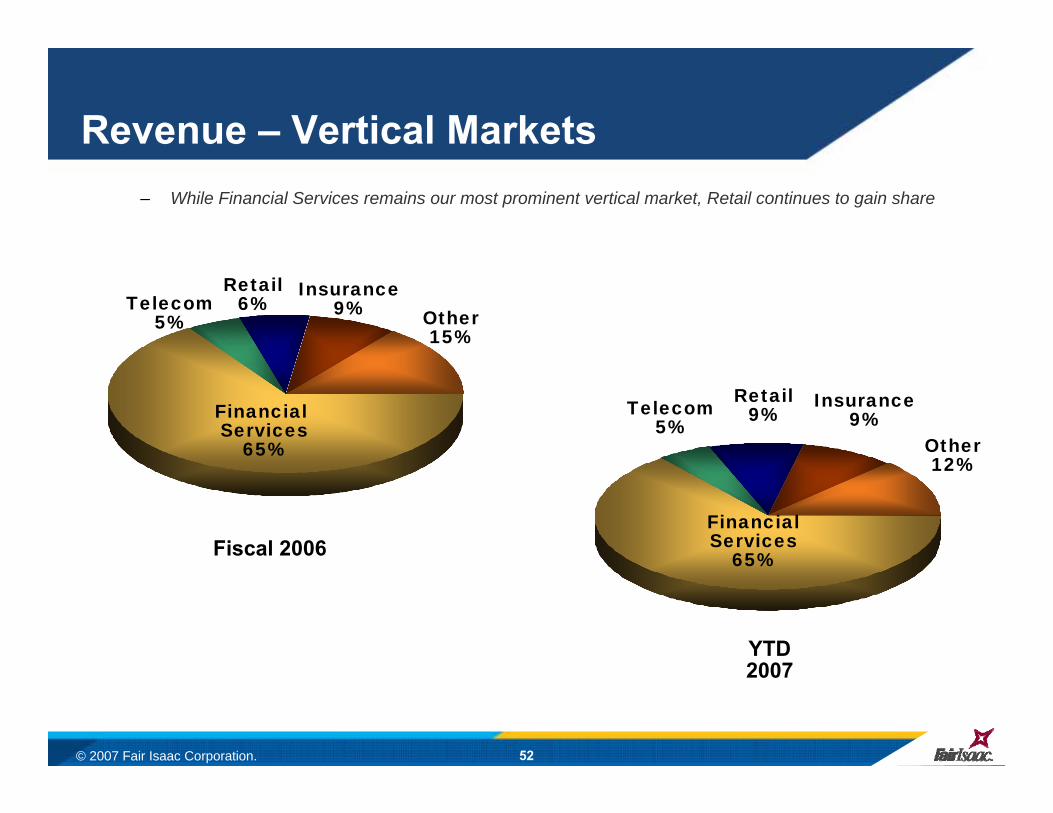
Revenue – Vertical Markets
Financial Services
65%
Telecom5%
Insurance9%
Retail9%
Other12%
Financial Services
65%
Telecom5%
Insurance9%
Retail6%
Other15%
YTD2007
Fiscal 2006
– While Financial Services remains our most prominent vertical market, Retail continues to gain share
53© 2007 Fair Isaac Corporation.
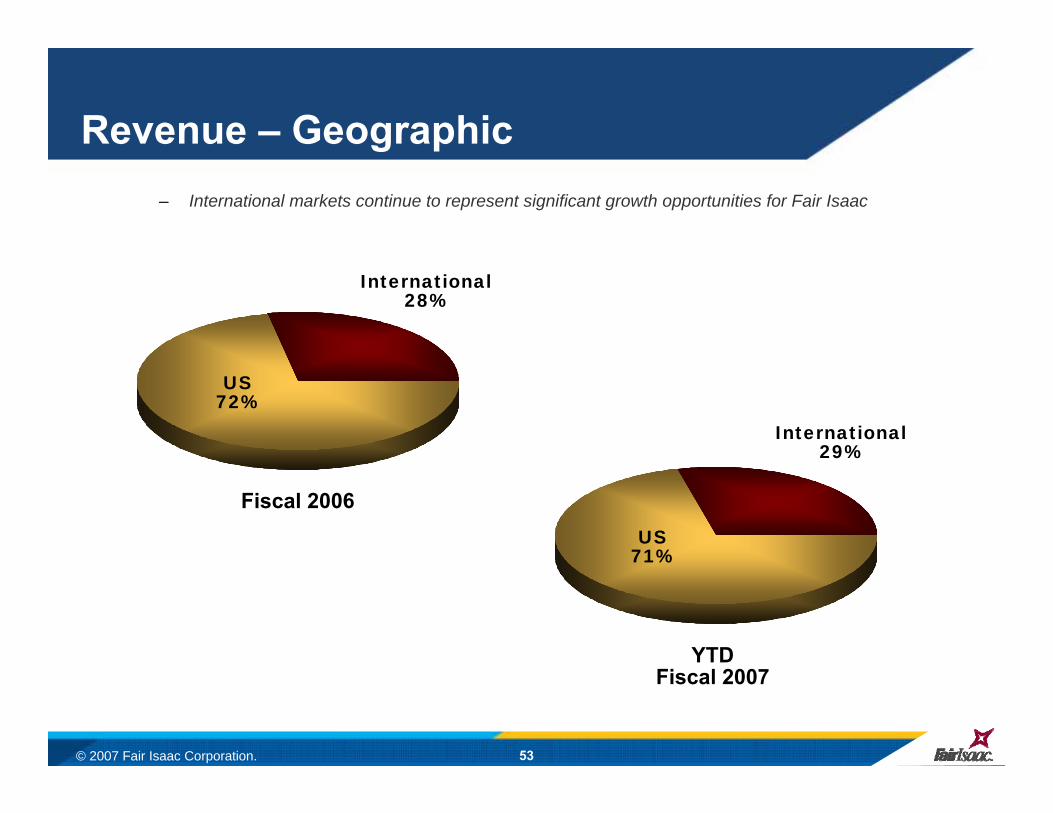
Revenue – Geographic
YTDFiscal 2007
US71%
International29%
Fiscal 2006
US72%
International28%
– International markets continue to represent significant growth opportunities for Fair Isaac
54© 2007 Fair Isaac Corporation.
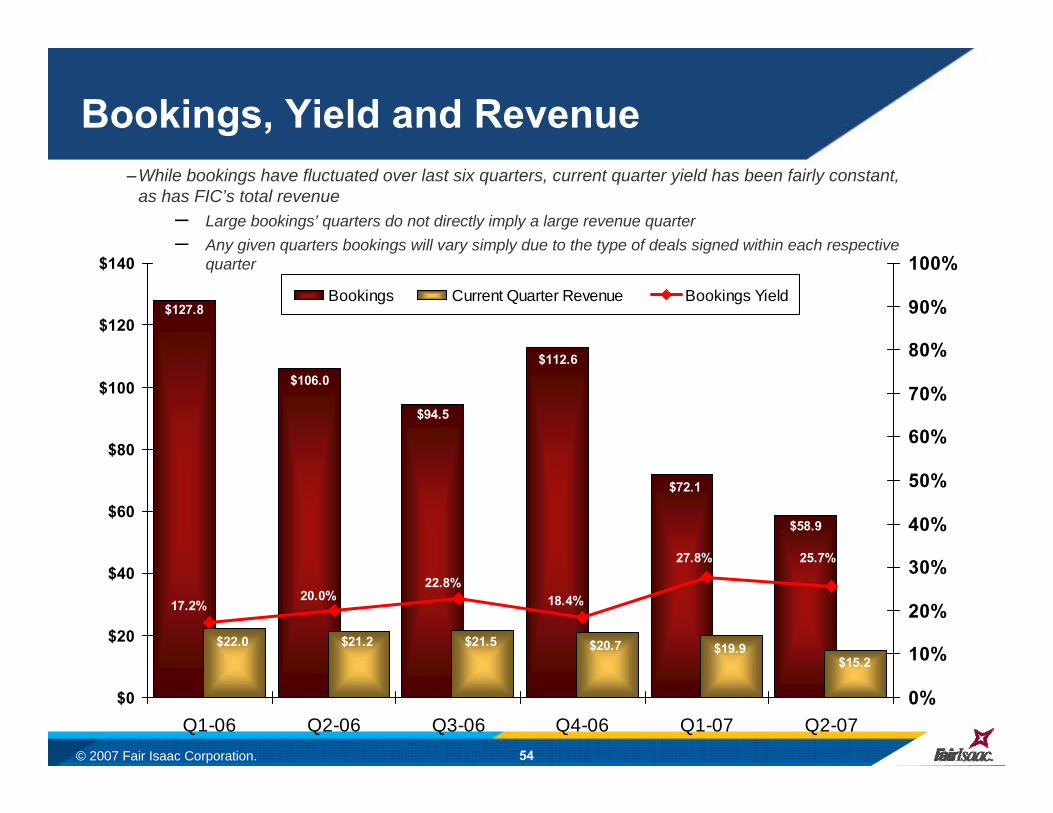
Bookings, Yield and Revenue–While bookings have fluctuated over last six quarters, current quarter yield has been fairly constant,
as has FIC’s total revenue– Large bookings’ quarters do not directly imply a large revenue quarter – Any given quarters bookings will vary simply due to the type of deals signed within each respective
quarter
$58.9
$72.1
$112.6
$94.5
$106.0
$127.8
$15.2$19.9$20.7$21.5$22.0 $21.2
25.7%27.8%
18.4%22.8%
20.0%17.2%
$0
$20
$40
$60
$80
$100
$120
$140
Q1-06 Q2-06 Q3-06 Q4-06 Q1-07 Q2-070%
10%
20%
30%
40%
50%
60%
70%
80%
90%
100%Bookings Current Quarter Revenue Bookings Yield
55© 2007 Fair Isaac Corporation.
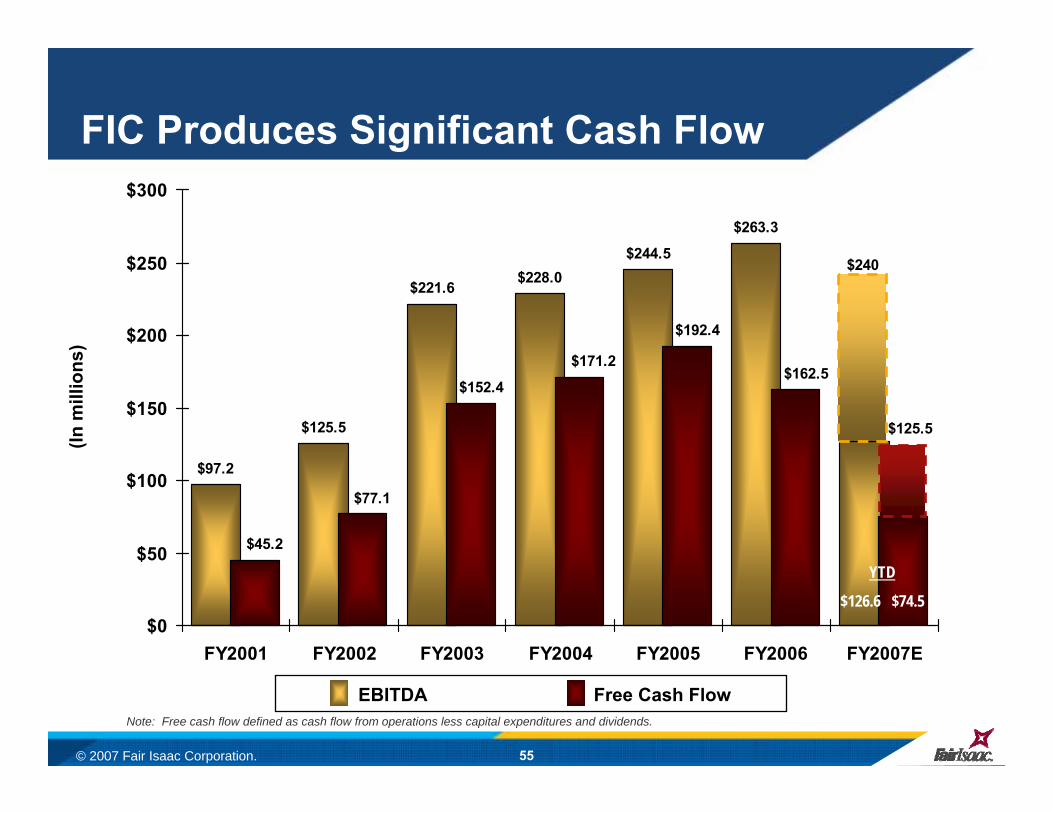
$97.2
$125.5
$221.6 $228.0$244.5
$263.3
$240
$162.5
$192.4
$171.2
$152.4
$77.1
$45.2
$125.5
$0
$50
$100
$150
$200
$250
$300
FY2001 FY2002 FY2003 FY2004 FY2005 FY2006 FY2007E
FIC Produces Significant Cash Flow(In
mill
ions
)
$45.2
$77.1
EBITDA Free Cash FlowNote: Free cash flow defined as cash flow from operations less capital expenditures and dividends.
YTD
$126.6 $74.5
56© 2007 Fair Isaac Corporation.
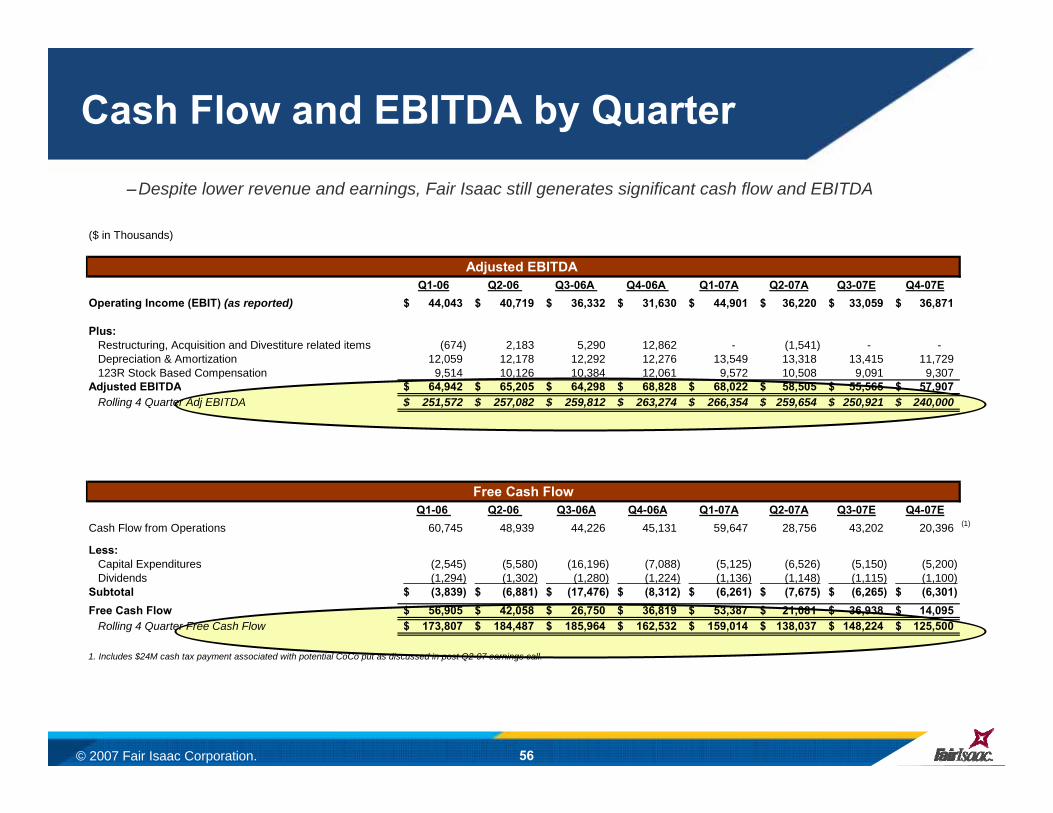
Cash Flow and EBITDA by Quarter
–Despite lower revenue and earnings, Fair Isaac still generates significant cash flow and EBITDA
($ in Thousands)
Adjusted EBITDA Q1-06 Q2-06 Q3-06A Q4-06A Q1-07A Q2-07A Q3-07E Q4-07E
Operating Income (EBIT) (as reported) 44,043$ 40,719$ 36,332$ 31,630$ 44,901$ 36,220$ 33,059$ 36,871$
Plus:Restructuring, Acquisition and Divestiture related items (674) 2,183 5,290 12,862 - (1,541) - - Depreciation & Amortization 12,059 12,178 12,292 12,276 13,549 13,318 13,415 11,729 123R Stock Based Compensation 9,514 10,126 10,384 12,061 9,572 10,508 9,091 9,307
Adjusted EBITDA 64,942$ 65,205$ 64,298$ 68,828$ 68,022$ 58,505$ 55,565$ 57,907$ Rolling 4 Quarter Adj EBITDA 251,572$ 257,082$ 259,812$ 263,274$ 266,354$ 259,654$ 250,921$ 240,000$
Free Cash FlowQ1-06 Q2-06 Q3-06A Q4-06A Q1-07A Q2-07A Q3-07E Q4-07E
Cash Flow from Operations 60,745 48,939 44,226 45,131 59,647 28,756 43,202 20,396 (1)
Less:Capital Expenditures (2,545) (5,580) (16,196) (7,088) (5,125) (6,526) (5,150) (5,200) Dividends (1,294) (1,302) (1,280) (1,224) (1,136) (1,148) (1,115) (1,100)
Subtotal (3,839)$ (6,881)$ (17,476)$ (8,312)$ (6,261)$ (7,675)$ (6,265)$ (6,301)$ Free Cash Flow 56,905$ 42,058$ 26,750$ 36,819$ 53,387$ 21,081$ 36,938$ 14,095$
Rolling 4 Quarter Free Cash Flow 173,807$ 184,487$ 185,964$ 162,532$ 159,014$ 138,037$ 148,224$ 125,500$
1. Includes $24M cash tax payment associated with potential CoCo put as discussed in post Q2-07 earnings call.
57© 2007 Fair Isaac Corporation.
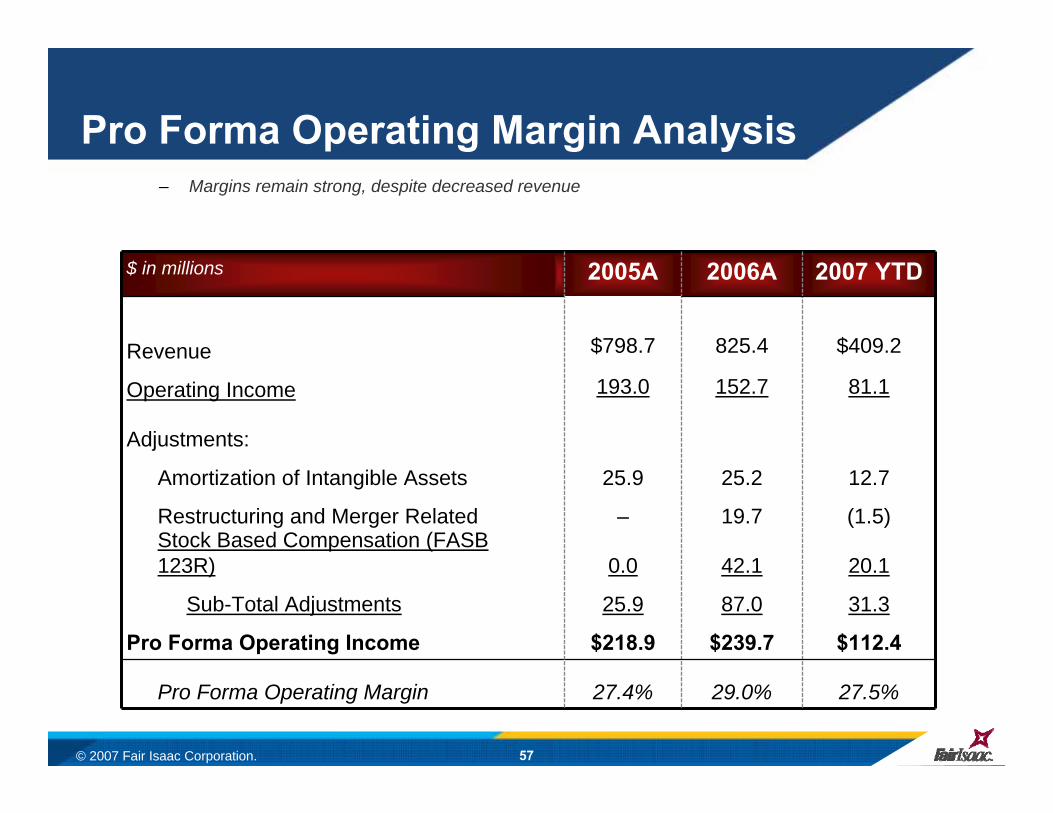
Pro Forma Operating Margin Analysis
27.5%29.0%27.4%Pro Forma Operating Margin
$112.4$239.7$218.9Pro Forma Operating Income
31.387.025.9Sub-Total Adjustments
42.1
19.7
25.2
152.7
825.4
2006A
20.10.0Stock Based Compensation (FASB 123R)
(1.5)–Restructuring and Merger Related
12.725.9Amortization of Intangible Assets
Adjustments:
81.1193.0Operating Income
$409.2$798.7Revenue
2007 YTD2005A$ in millions
– Margins remain strong, despite decreased revenue
58© 2007 Fair Isaac Corporation.
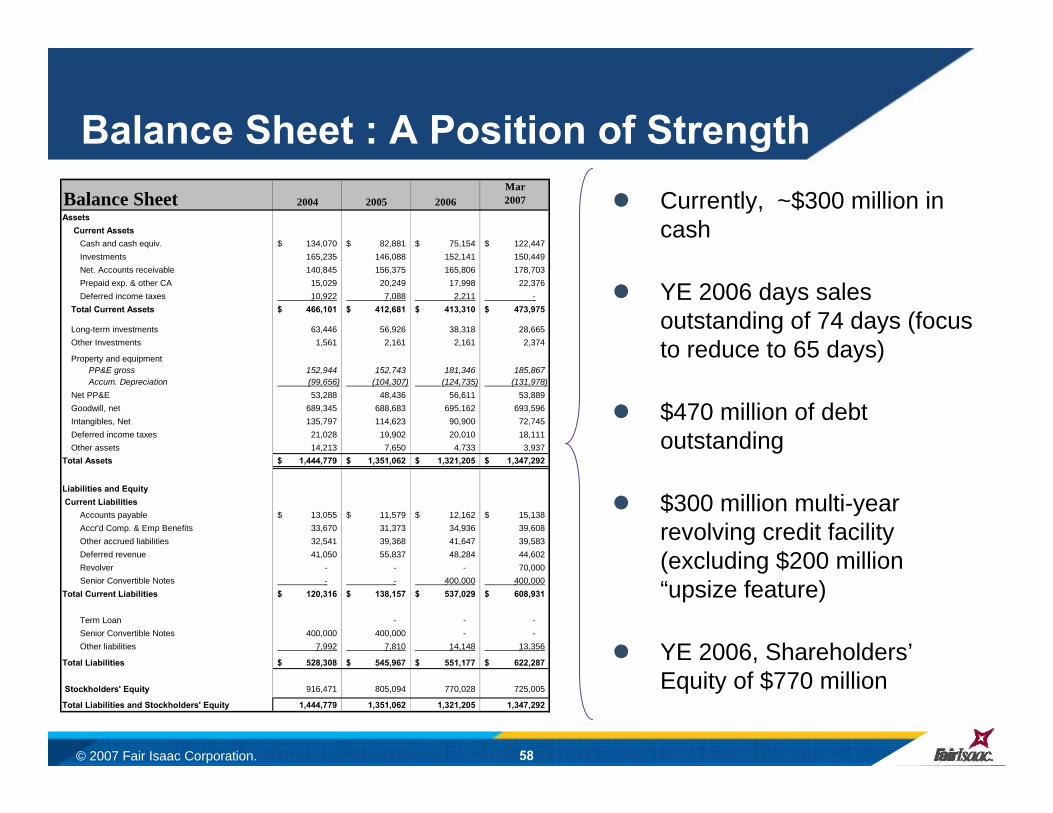
Balance Sheet : A Position of StrengthCurrently, ~$300 million in cash
YE 2006 days sales outstanding of 74 days (focus to reduce to 65 days)
$470 million of debt outstanding
$300 million multi-year revolving credit facility (excluding $200 million “upsize feature)
YE 2006, Shareholders’Equity of $770 million
Balance Sheet 2004 2005 2006Mar2007
Assets Current Assets
Cash and cash equiv. 134,070$ 82,881$ 75,154$ 122,447$ Investments 165,235 146,088 152,141 150,449
Net. Accounts receivable 140,845 156,375 165,806 178,703 Prepaid exp. & other CA 15,029 20,249 17,998 22,376 Deferred income taxes 10,922 7,088 2,211 -
Total Current Assets 466,101$ 412,681$ 413,310$ 473,975$
Long-term investments 63,446 56,926 38,318 28,665 Other Investments 1,561 2,161 2,161 2,374
Property and equipmentPP&E gross 152,944 152,743 181,346 185,867 Accum. Depreciation (99,656) (104,307) (124,735) (131,978)
Net PP&E 53,288 48,436 56,611 53,889 Goodwill, net 689,345 688,683 695,162 693,596 Intangibles, Net 135,797 114,623 90,900 72,745 Deferred income taxes 21,028 19,902 20,010 18,111 Other assets 14,213 7,650 4,733 3,937
Total Assets 1,444,779$ 1,351,062$ 1,321,205$ 1,347,292$
Liabilities and Equity Current Liabilities Accounts payable 13,055$ 11,579$ 12,162$ 15,138$ Accr'd Comp. & Emp Benefits 33,670 31,373 34,936 39,608 Other accrued liabilities 32,541 39,368 41,647 39,583 Deferred revenue 41,050 55,837 48,284 44,602
Revolver - - - 70,000 Senior Convertible Notes - - 400,000 400,000
Total Current Liabilities 120,316$ 138,157$ 537,029$ 608,931$
Term Loan - - - Senior Convertible Notes 400,000 400,000 - - Other liabilities 7,992 7,810 14,148 13,356
Total Liabilities 528,308$ 545,967$ 551,177$ 622,287$
Stockholders' Equity 916,471 805,094 770,028 725,005
Total Liabilities and Stockholders' Equity 1,444,779 1,351,062 1,321,205 1,347,292
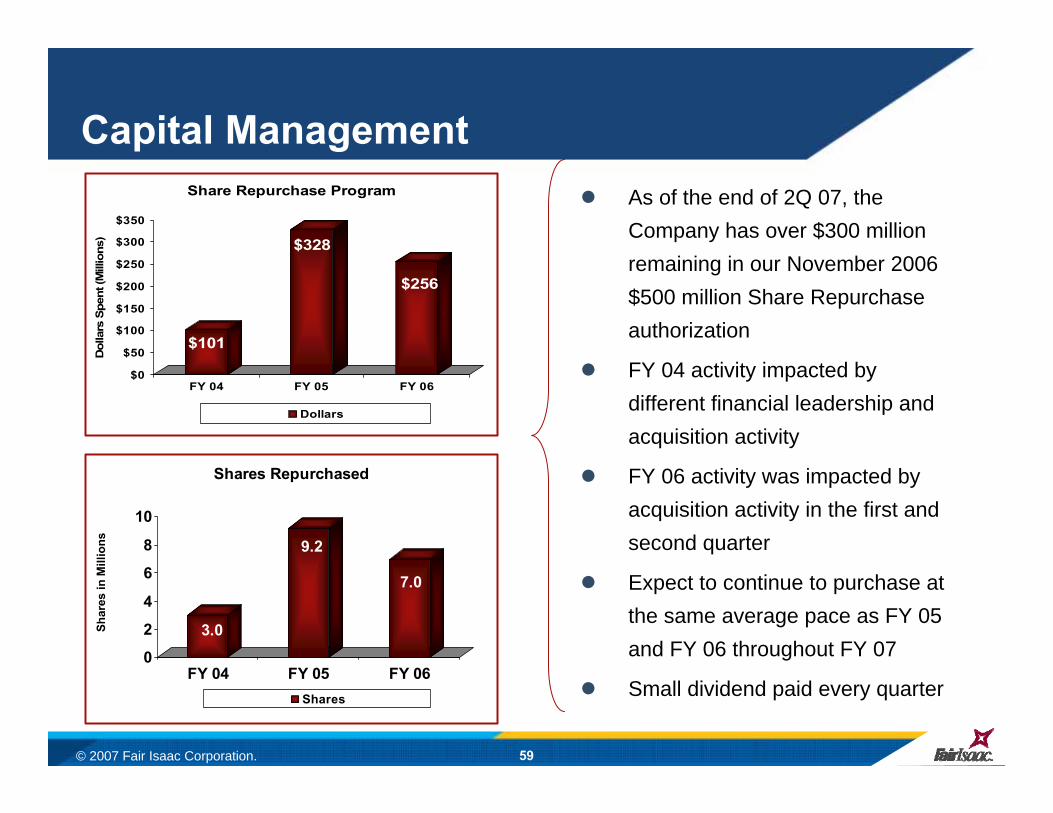
59© 2007 Fair Isaac Corporation.
Capital ManagementAs of the end of 2Q 07, the Company has over $300 million remaining in our November 2006 $500 million Share Repurchase authorization
FY 04 activity impacted by different financial leadership and acquisition activity
FY 06 activity was impacted by acquisition activity in the first and second quarter
Expect to continue to purchase at the same average pace as FY 05 and FY 06 throughout FY 07
Small dividend paid every quarter
$101
$328
$256
$0
$50
$100
$150
$200
$250
$300
$350
Dol
lars
Spe
nt (M
illio
ns)
FY 04 FY 05 FY 06
Share Repurchase Program
Dollars
3.0
9.2
7.0
0
2
4
6
8
10
Shar
es in
Mill
ions
FY 04 FY 05 FY 06
Shares Repurchased
Shares
60© 2007 Fair Isaac Corporation.
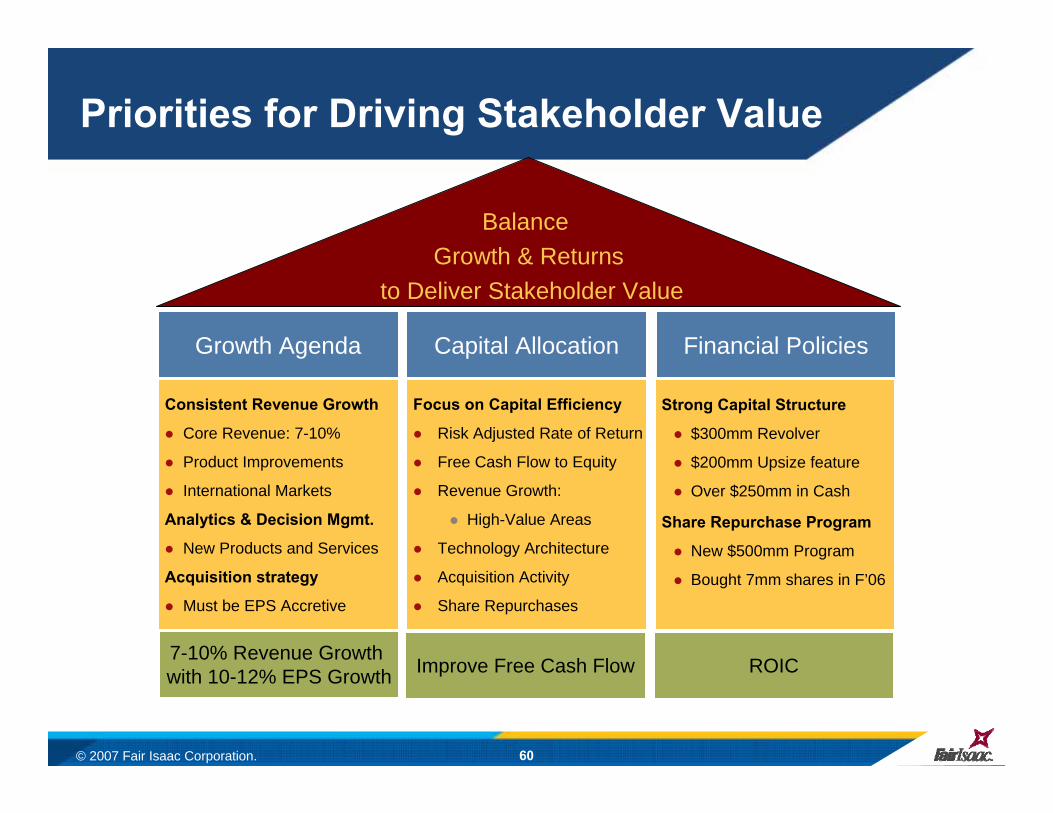
Priorities for Driving Stakeholder Value
Balance Growth & Returns
to Deliver Stakeholder Value
Consistent Revenue Growth
Core Revenue: 7-10%
Product Improvements
International Markets
Analytics & Decision Mgmt.
New Products and Services
Acquisition strategy
Must be EPS Accretive
Growth Agenda
7-10% Revenue Growth with 10-12% EPS Growth
Focus on Capital Efficiency
Risk Adjusted Rate of Return
Free Cash Flow to Equity
Revenue Growth:
High-Value Areas
Technology Architecture
Acquisition Activity
Share Repurchases
Capital Allocation
Improve Free Cash Flow
Strong Capital Structure
$300mm Revolver
$200mm Upsize feature
Over $250mm in Cash
Share Repurchase Program
New $500mm Program
Bought 7mm shares in F’06
Financial Policies
ROIC
61© 2007 Fair Isaac Corporation.
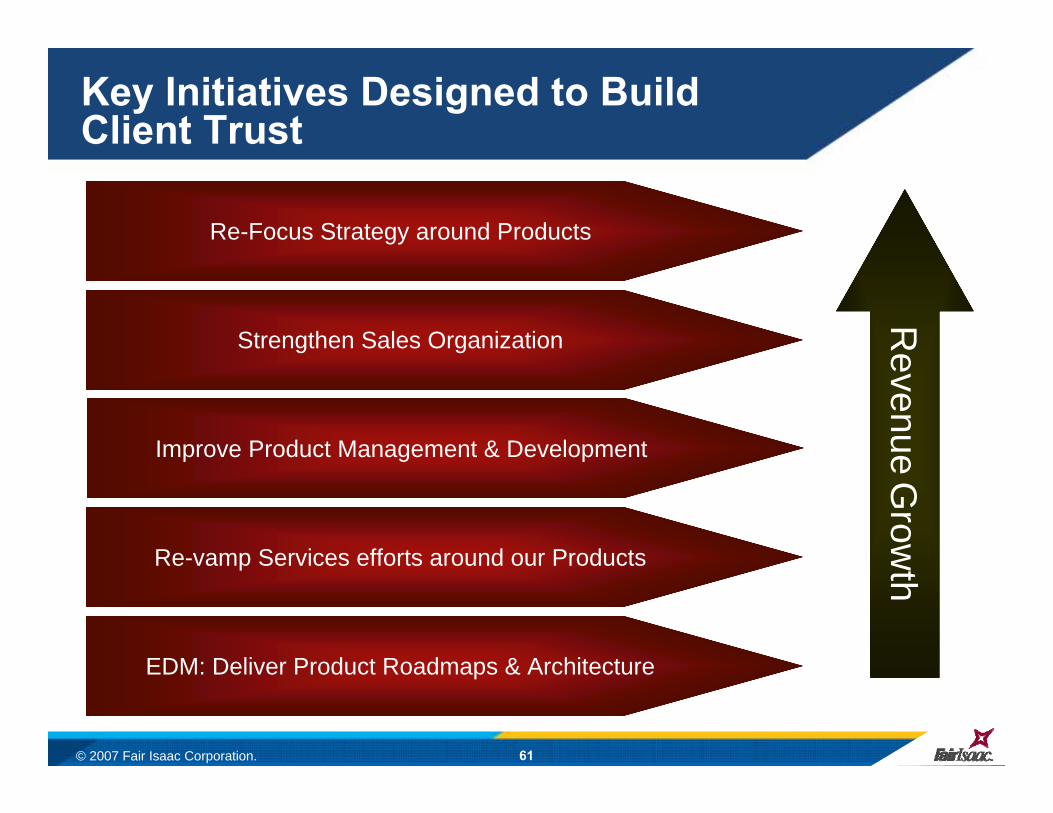
Key Initiatives Designed to Build Client Trust
Re-Focus Strategy around Products
Strengthen Sales Organization
Improve Product Management & Development
Re-vamp Services efforts around our Products
EDM: Deliver Product Roadmaps & Architecture
Revenue
Grow
th
62© 2007 Fair Isaac Corporation.
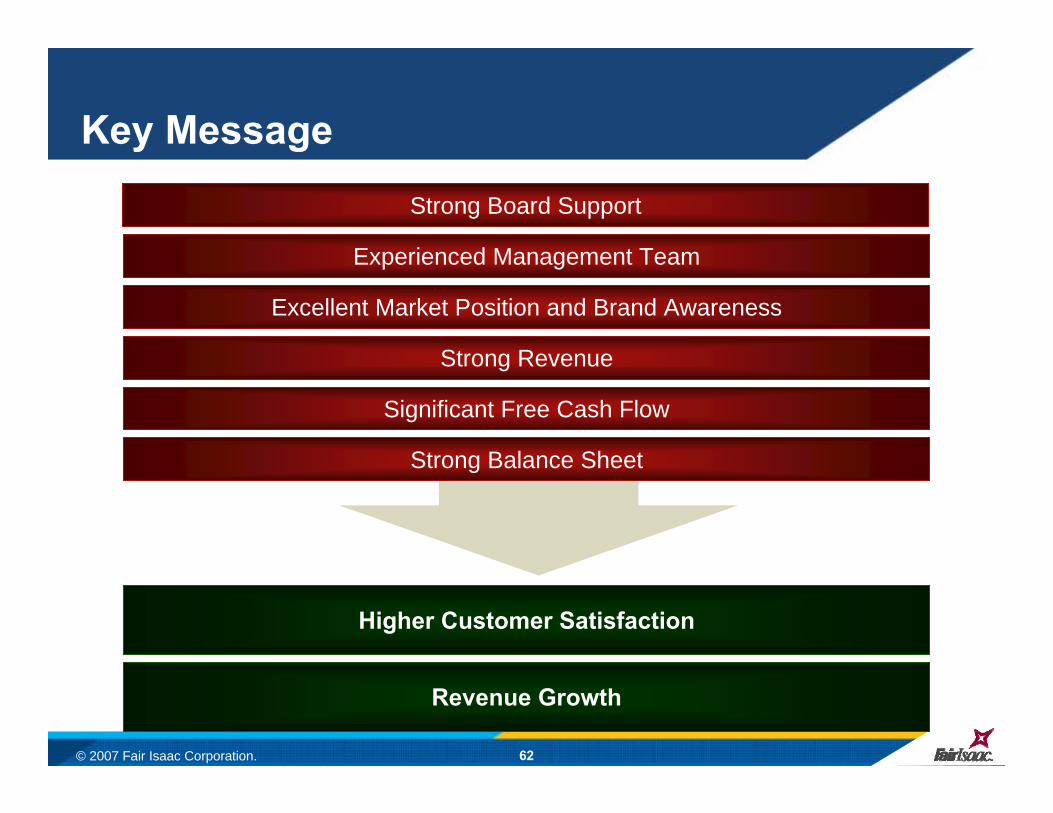
Key Message
Strong Board Support
Experienced Management Team
Excellent Market Position and Brand Awareness
Strong Revenue
Significant Free Cash Flow
Strong Balance Sheet
Higher Customer Satisfaction
Revenue Growth
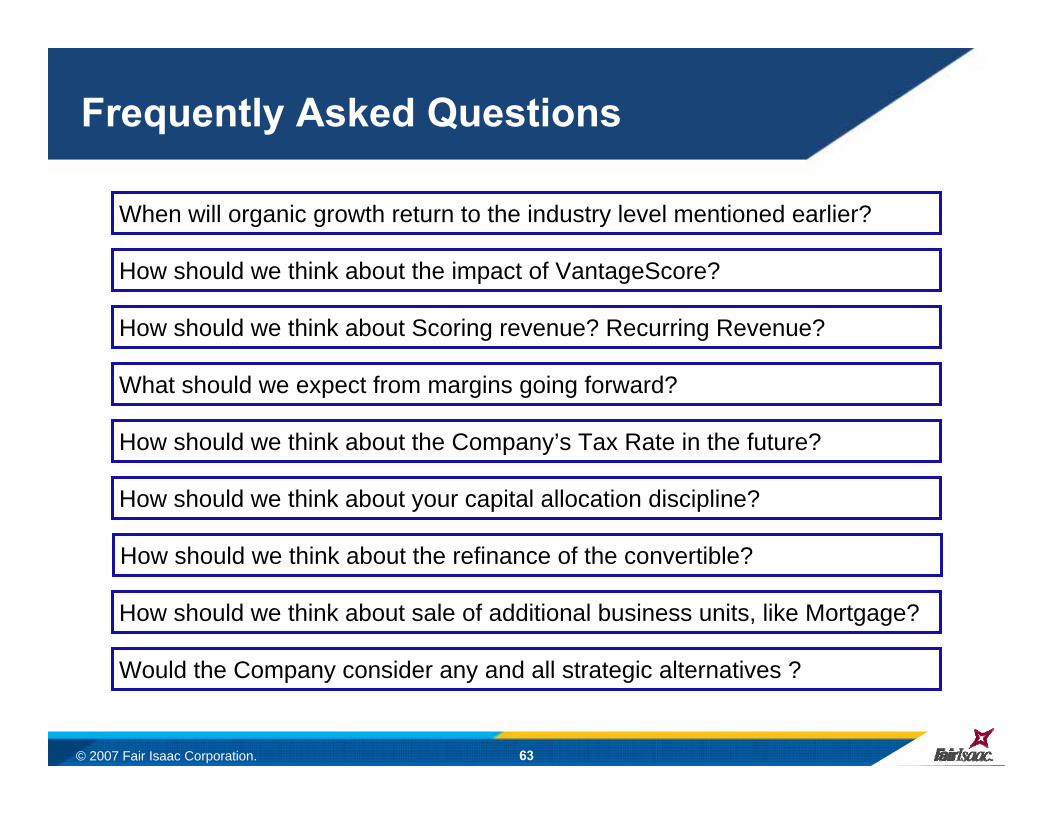
63© 2007 Fair Isaac Corporation.
Frequently Asked Questions
When will organic growth return to the industry level mentioned earlier?
How should we think about the impact of VantageScore?
How should we think about Scoring revenue? Recurring Revenue?
What should we expect from margins going forward?
How should we think about your capital allocation discipline?
How should we think about the Company’s Tax Rate in the future?
How should we think about the refinance of the convertible?
Would the Company consider any and all strategic alternatives ?
How should we think about sale of additional business units, like Mortgage?
© 2007 Fair Isaac Corporation.
Appendix
65© 2007 Fair Isaac Corporation.
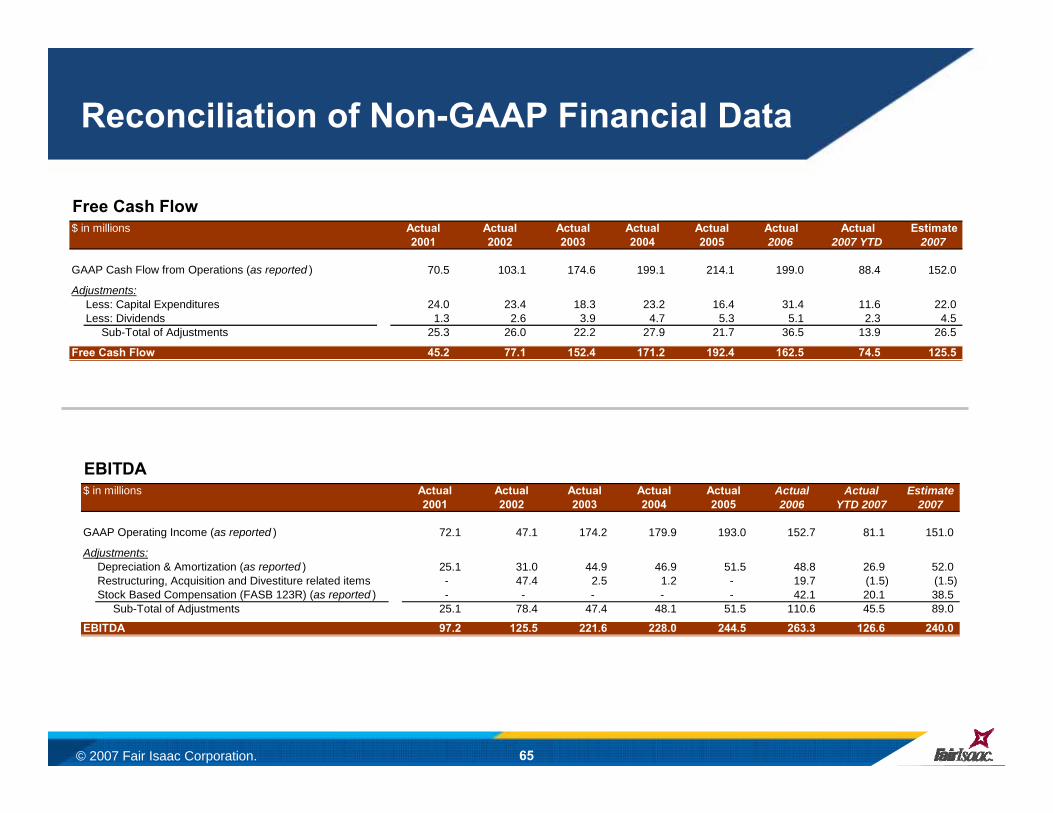
Free Cash Flow$ in millions Actual Actual Actual Actual Actual Actual Actual Estimate
2001 2002 2003 2004 2005 2006 2007 YTD 2007
GAAP Cash Flow from Operations (as reported ) 70.5 103.1 174.6 199.1 214.1 199.0 88.4 152.0
Adjustments:Less: Capital Expenditures 24.0 23.4 18.3 23.2 16.4 31.4 11.6 22.0 Less: Dividends 1.3 2.6 3.9 4.7 5.3 5.1 2.3 4.5 Sub-Total of Adjustments 25.3 26.0 22.2 27.9 21.7 36.5 13.9 26.5
Free Cash Flow 45.2 77.1 152.4 171.2 192.4 162.5 74.5 125.5
Reconciliation of Non-GAAP Financial Data
EBITDA$ in millions Actual Actual Actual Actual Actual Actual Actual Estimate
2001 2002 2003 2004 2005 2006 YTD 2007 2007
GAAP Operating Income (as reported ) 72.1 47.1 174.2 179.9 193.0 152.7 81.1 151.0
Adjustments:Depreciation & Amortization (as reported ) 25.1 31.0 44.9 46.9 51.5 48.8 26.9 52.0 Restructuring, Acquisition and Divestiture related items - 47.4 2.5 1.2 - 19.7 (1.5) (1.5) Stock Based Compensation (FASB 123R) (as reported ) - - - - - 42.1 20.1 38.5 Sub-Total of Adjustments 25.1 78.4 47.4 48.1 51.5 110.6 45.5 89.0
EBITDA 97.2 125.5 221.6 228.0 244.5 263.3 126.6 240.0
66© 2007 Fair Isaac Corporation.
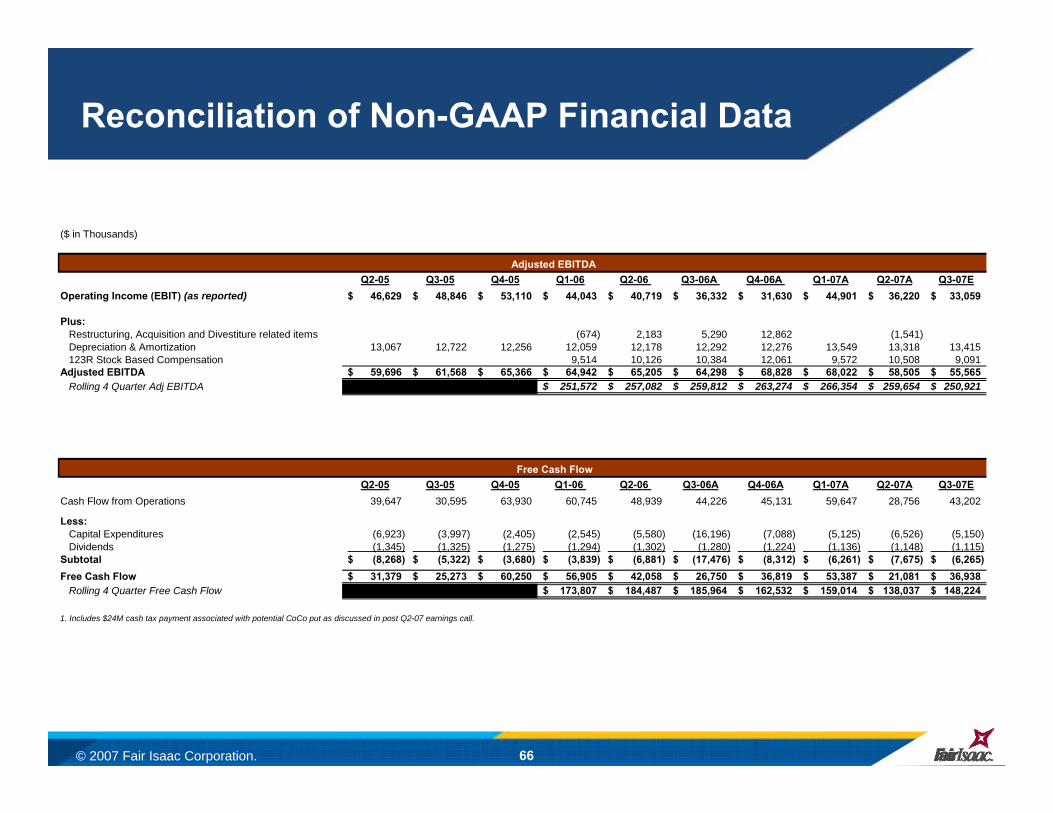
Reconciliation of Non-GAAP Financial Data
($ in Thousands)
Adjusted EBITDA Q2-05 Q3-05 Q4-05 Q1-06 Q2-06 Q3-06A Q4-06A Q1-07A Q2-07A Q3-07E
Operating Income (EBIT) (as reported) 46,629$ 48,846$ 53,110$ 44,043$ 40,719$ 36,332$ 31,630$ 44,901$ 36,220$ 33,059$
Plus:Restructuring, Acquisition and Divestiture related items (674) 2,183 5,290 12,862 (1,541) Depreciation & Amortization 13,067 12,722 12,256 12,059 12,178 12,292 12,276 13,549 13,318 13,415 123R Stock Based Compensation 9,514 10,126 10,384 12,061 9,572 10,508 9,091
Adjusted EBITDA 59,696$ 61,568$ 65,366$ 64,942$ 65,205$ 64,298$ 68,828$ 68,022$ 58,505$ 55,565$ Rolling 4 Quarter Adj EBITDA 251,572$ 257,082$ 259,812$ 263,274$ 266,354$ 259,654$ 250,921$
Free Cash FlowQ2-05 Q3-05 Q4-05 Q1-06 Q2-06 Q3-06A Q4-06A Q1-07A Q2-07A Q3-07E
Cash Flow from Operations 39,647 30,595 63,930 60,745 48,939 44,226 45,131 59,647 28,756 43,202
Less:Capital Expenditures (6,923) (3,997) (2,405) (2,545) (5,580) (16,196) (7,088) (5,125) (6,526) (5,150) Dividends (1,345) (1,325) (1,275) (1,294) (1,302) (1,280) (1,224) (1,136) (1,148) (1,115)
Subtotal (8,268)$ (5,322)$ (3,680)$ (3,839)$ (6,881)$ (17,476)$ (8,312)$ (6,261)$ (7,675)$ (6,265)$ Free Cash Flow 31,379$ 25,273$ 60,250$ 56,905$ 42,058$ 26,750$ 36,819$ 53,387$ 21,081$ 36,938$
Rolling 4 Quarter Free Cash Flow 173,807$ 184,487$ 185,964$ 162,532$ 159,014$ 138,037$ 148,224$
1. Includes $24M cash tax payment associated with potential CoCo put as discussed in post Q2-07 earnings call.
67© 2007 Fair Isaac Corporation.