Failure Contributors of MV Electrical Equipment and...
12
Abstract: Implementation of condition assessment, or condition-based-maintenance, involves many disciplines such as failure analysis, on-line diagnostics, diagnostic data interpretation, management and communication, follow-up corrective actions and lastly the program maintenance. One of the difficult areas in the development of a comprehensive condition assessment program is the analysis of the probable contributing causes of failures, and selection of the appropriate on-line diagnostic tools to address the correct failure contributors. The specific failure contributors of the electrical power transmission and distribution equipment are documented in various sources, such as IEEE. This paper will illustrate the process of development of a comprehensive condition assessment program for medium voltage switchgear using the statistical data pertaining to the equipment failure contributing causes. Particular attention will be given to the selection of specific on-line diagnostic techniques that are available today and that will address the specific failure contributors. Presented only briefly will be the outage costs and RCM (Reliability Centered Maintenance) concepts, related to a condition assessment program. Condition Assessment Both condition assessment and condition-based- maintenance are concepts involving the application of new technologies and techniques of equipment diagnostics while the equipment remains in full operation. While some terminology may imply relatively new techniques, it should be born in mind that the idea of condition-based maintenance has been around for many years. As an example, a thermal replica, used in many temperature monitoring and protective devices, addresses one of the most important contributors of the electrical insulation aging, temperature. The benefits of the condition-based maintenance programs lie in elimination of many time-based maintenance tasks, in exchange for maintenance tasks deemed necessary due to the actual condition of the equipment. While the specific condition is always monitored during normal operation, its evaluation serves to better manage the life and therefore the reliability of a specific asset. The corrective actions may take various forms such as through changes to the equipment-operating regime or specific discrete corrective actions to be conveniently scheduled for future planned outages [1]. The condition-based approach constitutes a dramatic qualitative leap in managing the equipment reliability compared to the conventional off-line diagnostics, where the condition of the equipment often remains unknown until an outage is underway. It follows that the condition-based maintenance approach offers reduction in the equipment downtime, improvement in the equipment reliability and dramatic reduction of the asset operating costs. Another advantage is the deferral of planned maintenance hence an increase in production equipment availability. Failure Contributing Causes IEEE Standard 493-1997, IEEE Recommended Practice for Design of Reliable Industrial and Commercial Power Systems documents the equipment failure data obtained through end-user surveys. This standard comprises of detailed data related to the reliability of various components of the electrical systems. The document appendixes contain the listing of specific causes that were identified as contributing to the failure of the equipment. For example, Appendix E contains such data for the switchgear bus and Appendix K for the circuit breakers. A switchgear bus and circuit breakers are the two main components of the medium voltage switchgear, therefore by combining data from the two categories one can derive a composite distribution of failure contributing causes, ranked by their relative importance. While the IEEE standard did not aim at identification of specific initiating causes of the failures, it is possible to do so using intuitive approach, based on experience with medium voltage switchgear systems. Such step is necessary for selection of the appropriate on-line diagnostic technologies that could provide a predictive indicator for each specific initiating cause. On-Line Diagnostic Technologies Once the initiating cause of the failure modes has been identified and the appropriate on-line diagnostic technologies assigned, each on-line diagnostic practice can be ranked by its importance. The diagnostic technologies available today will be briefly discussed with the emphasis on their predictive indicators [3]. The following assumptions have been made concerning the appropriate on-line diagnostic technologies available today: a) Diagnostics can be safely performed while the equipment is in full operation. Failure Contributors of MV Electrical Equipment and Condition Assessment Program Development Gabe Paoletti, P.E.- IEEE Senior Member, Martin Baier, P.E. – IEEE Member, Eaton’s Cutler-Hammer Performance Power Solutions
Transcript of Failure Contributors of MV Electrical Equipment and...
Abstract: Implementation of conditionassessment, or condition-based-maintenance,involves many disciplines such as failureanalysis, on-line diagnostics, diagnostic datainterpretation, management and communication,follow-up corrective actions and lastly theprogram maintenance. One of the difficult areasin the development of a comprehensive conditionassessment program is the analysis of theprobable contributing causes of failures, andselection of the appropriate on-line diagnostictools to address the correct failure contributors.The specific failure contributors of the electricalpower transmission and distribution equipmentare documented in various sources, such asIEEE. This paper will illustrate the process ofdevelopment of a comprehensive conditionassessment program for medium voltageswitchgear using the statistical data pertaining tothe equipment failure contributing causes.Particular attention will be given to the selectionof specific on-line diagnostic techniques that areavailable today and that will address the specificfailure contributors. Presented only briefly will bethe outage costs and RCM (Reliability CenteredMaintenance) concepts, related to a conditionassessment program.
Condition AssessmentBoth condition assessment and condition-based-maintenance are concepts involving theapplication of new technologies and techniquesof equipment diagnostics while the equipmentremains in full operation. While someterminology may imply relatively new techniques,it should be born in mind that the idea ofcondition-based maintenance has been aroundfor many years. As an example, a thermalreplica, used in many temperature monitoringand protective devices, addresses one of themost important contributors of the electricalinsulation aging, temperature.
The benefits of the condition-based maintenanceprograms lie in elimination of many time-basedmaintenance tasks, in exchange for maintenancetasks deemed necessary due to the actualcondition of the equipment. While the specificcondition is always monitored during normaloperation, its evaluation serves to better managethe life and therefore the reliability of a specificasset. The corrective actions may take variousforms such as through changes to theequipment-operating regime or specific discretecorrective actions to be conveniently scheduledfor future planned outages [1].
The condition-based approach constitutes adramatic qualitative leap in managing the
equipment reliability compared to theconventional off-line diagnostics, where thecondition of the equipment often remainsunknown until an outage is underway. It followsthat the condition-based maintenance approachoffers reduction in the equipment downtime,improvement in the equipment reliability anddramatic reduction of the asset operating costs.Another advantage is the deferral of plannedmaintenance hence an increase in productionequipment availability.
Failure Contributing CausesIEEE Standard 493-1997, IEEE RecommendedPractice for Design of Reliable Industrial andCommercial Power Systems documents theequipment failure data obtained through end-usersurveys. This standard comprises of detaileddata related to the reliability of variouscomponents of the electrical systems. Thedocument appendixes contain the listing ofspecific causes that were identified ascontributing to the failure of the equipment. Forexample, Appendix E contains such data for theswitchgear bus and Appendix K for the circuitbreakers.
A switchgear bus and circuit breakers are the twomain components of the medium voltageswitchgear, therefore by combining data from thetwo categories one can derive a compositedistribution of failure contributing causes, rankedby their relative importance. While the IEEEstandard did not aim at identification of specificinitiating causes of the failures, it is possible to doso using intuitive approach, based on experiencewith medium voltage switchgear systems. Suchstep is necessary for selection of the appropriateon-line diagnostic technologies that could providea predictive indicator for each specific initiatingcause.
On-Line Diagnostic TechnologiesOnce the initiating cause of the failure modes hasbeen identified and the appropriate on-linediagnostic technologies assigned, each on-linediagnostic practice can be ranked by itsimportance. The diagnostic technologiesavailable today will be briefly discussed with theemphasis on their predictive indicators [3].
The following assumptions have been madeconcerning the appropriate on-line diagnostictechnologies available today:
a) Diagnostics can be safely performed whilethe equipment is in full operation.
Failure Contributors of MV Electrical Equipment andCondition Assessment Program Development
Gabe Paoletti, P.E.- IEEE Senior Member, Martin Baier, P.E. – IEEE Member,Eaton’s Cutler-Hammer Performance Power Solutions

b) Diagnostics can be obtained periodically orvia continuous monitoring of the specificcondition.
c) Predictive indicators are clearly identifiable.
Failure Contributing CausesTable 1 lists the failure contributing causes thatrelate to the switchgear bus category [2], for boththe insulated bus and the bare bus.
Switchgear Bus Failure ContributingCauses (%)From IEEE Std 493-1997Appendix E - Table XVIII
Ins.Bus
BareBus
Thermocycling 6.6 -Mechanical Structure Failure 3.0 8.0Mechanical Damage FromForeign Source
6.6 -
Shorting by Tools or MetalObjects
- 15.0
Shorting by Snakes, Birds,Rodents, etc.
3.0 -
Malfunction of Protective Relays 10.0 4.0Improper Setting of ProtectiveDevice
- 4.0
Above Normal AmbientTemperature
3.0 -
Exposure to Chemical or Solvents 3.0 15.0Exposure to Moisture 30.0 15.0Exposure to Dust or OtherContaminants
10.0 19.0
Exposure to Non-Electrical Fire orBurning
6.6 -
Obstruction of Ventilation - 8.0Normal Deterioration from Age 10.0 4.0Severe Weather Condition 3.0 4.0Testing Error - 4.0
Total 94.8 100.0
Table 1
Table 2 lists the failure contributing causesrelated to circuit breaker category [2] of twovoltage levels. In the last column, the rates arecombined for both voltage classes andnormalized to a new 100 % base.
Circuit Breaker Failure Contributing Causes (%)From IEEE Std 493-1997Appendix K, Table # 6
601Vto
15kV
34.5kVto
138kV
Norm.
Overload - Persistent 25.0 - 12.5Normal Deterioration fromAge
- 22.0 11.0
Lubricant Loss, orDeficiency
25.0 11.0 18.0
Lack of PreventiveMaintenance
25.0 11.0 18.0
Other 25.0 56.0 40.5Total 100.0 100.0 100.0
Table 2
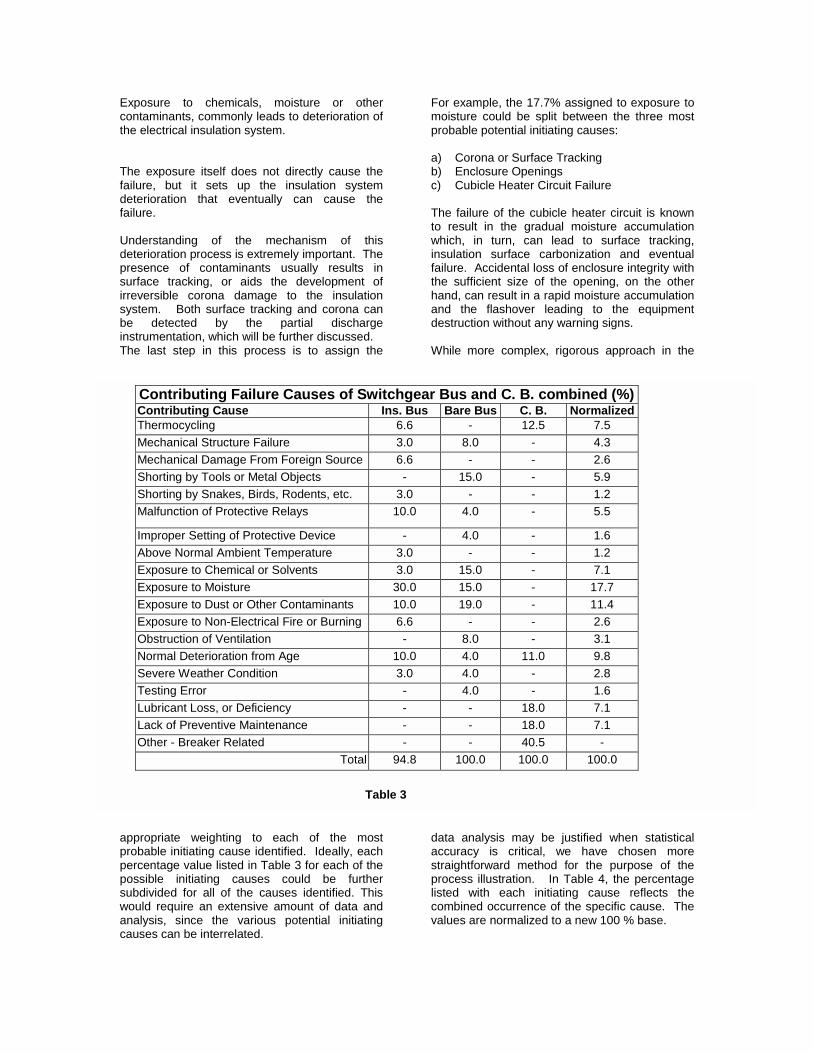
It is interesting to note that the two leadingcontributors were the exposure to moisture of 30% in the insulated bus category (Table 1), andthe exposure to dust and other contaminants of19 % in the bare bus category, respectively. ForMV circuit breakers (Table 2), such leadingcontributor is “other”, followed by the lubricantloss or lack of preventive maintenance. Tables 1and 2 are combined into Table 3 to show anoverall ranking of the failure contributing causes.The numbers for the insulated bus, bare bus andcircuit breakers were combined and resultsnormalized to the new 100 % base.
The most probable top three failure contributingcauses for medium voltage switchgear are:a) Exposure to moisture (17.7 %).b) Exposure to dust and other contaminants
(11.4 %).c) Normal deterioration from age (9.8 %).
Note that the “other” category of 40.5 %, relatedonly to circuit breakers, is not included in thecumulative ranking. As a result, only 86.3 % ofall possible failure contributing causes are beingaddressed.
The assumption that only 86.3% of all possiblefailure contributing causes are being addressedis considered conservative since it is oftendifficult to separate the causes related to theswitchgear bus and enclosures from those thatpertain to circuit breakers. For example, a reportof a switchgear failure related to thermal cycling,obstruction of ventilation, above normal ambienttemperature or mechanical structure failures mayinvolve the rear primary disconnect assemblies ofcircuit breakers, which are solely part of thecircuit breaker. Similarly, above normaltemperature and associated deterioration of thespring tension and mechanical structure failurescan result in the failure of a rear disconnectassembly of the circuit breaker, thus beingreported as "Other" in the circuit breaker surveyresults. Therefore, it can be concluded that someof the contributing causes identified as "Other" inthe Circuit Breaker Failure Contributing Causes(Table 2) may have been reported as part of theSwitchgear Bus Failure Contributing Causes(Table 1) and vice versa.
Now that the contributing causes for mediumvoltage switchgear have been prioritized, a listingcan be developed of the most probable initiatingcauses. Table 4 cross-references the two.Several instances exist where more than oneprobable failure initiating cause contributes to aspecific failure contributing cause identified byIEEE. For example, thermal cycling can resultfrom loose electrical connections, variations ofload current or ambient temperature, operation ofswitchgear cubicle heaters, and other causes.
Exposure to chemicals, moisture or othercontaminants, commonly leads to deterioration ofthe electrical insulation system.
The exposure itself does not directly cause thefailure, but it sets up the insulation systemdeterioration that eventually can cause thefailure.
Understanding of the mechanism of thisdeterioration process is extremely important. Thepresence of contaminants usually results insurface tracking, or aids the development ofirreversible corona damage to the insulationsystem. Both surface tracking and corona canbe detected by the partial dischargeinstrumentation, which will be further discussed.The last step in this process is to assign the
appropriate weighting to each of the mostprobable initiating cause identified. Ideally, eachpercentage value listed in Table 3 for each of thepossible initiating causes could be furthersubdivided for all of the causes identified. Thiswould require an extensive amount of data andanalysis, since the various potential initiatingcauses can be interrelated.
For example, the 17.7% assigned to exposure tomoisture could be split between the three mostprobable potential initiating causes:
a) Corona or Surface Trackingb) Enclosure Openingsc) Cubicle Heater Circuit Failure
The failure of the cubicle heater circuit is knownto result in the gradual moisture accumulationwhich, in turn, can lead to surface tracking,insulation surface carbonization and eventualfailure. Accidental loss of enclosure integrity withthe sufficient size of the opening, on the otherhand, can result in a rapid moisture accumulationand the flashover leading to the equipmentdestruction without any warning signs.
While more complex, rigorous approach in the
data analysis may be justified when statisticalaccuracy is critical, we have chosen morestraightforward method for the purpose of theprocess illustration. In Table 4, the percentagelisted with each initiating cause reflects thecombined occurrence of the specific cause. Thevalues are normalized to a new 100 % base.
Contributing Failure Causes of Switchgear Bus and C. B. combined (%)Contributing Cause Ins. Bus Bare Bus C. B. NormalizedThermocycling 6.6 - 12.5 7.5Mechanical Structure Failure 3.0 8.0 - 4.3Mechanical Damage From Foreign Source 6.6 - - 2.6Shorting by Tools or Metal Objects - 15.0 - 5.9Shorting by Snakes, Birds, Rodents, etc. 3.0 - - 1.2Malfunction of Protective Relays 10.0 4.0 - 5.5
Improper Setting of Protective Device - 4.0 - 1.6Above Normal Ambient Temperature 3.0 - - 1.2Exposure to Chemical or Solvents 3.0 15.0 - 7.1Exposure to Moisture 30.0 15.0 - 17.7Exposure to Dust or Other Contaminants 10.0 19.0 - 11.4Exposure to Non-Electrical Fire or Burning 6.6 - - 2.6Obstruction of Ventilation - 8.0 - 3.1Normal Deterioration from Age 10.0 4.0 11.0 9.8Severe Weather Condition 3.0 4.0 - 2.8Testing Error - 4.0 - 1.6Lubricant Loss, or Deficiency - - 18.0 7.1Lack of Preventive Maintenance - - 18.0 7.1Other - Breaker Related - - 40.5 -
Total 94.8 100.0 100.0 100.0
Table 3

For example, the initiating cause of “enclosureopenings”, or enclosure integrity, was listed withsix different failure contributing causes:
a) Mechanical damage from foreign source(2.6 %)
b) Shorting by tools or metal objects (5.9 %)
c) Shorting by snakes, birds, rodents, etc.(1.2 %)
d) Exposure to chemicals or solvents (7.1 %)
e) Exposure to moisture (17.7 %)
f) Exposure to non-electrical fire or burning(2.6 %).
The last item was included since it involves thearea around the enclosure that would beaddressed by a maintenance-type correctiveaction. The above causes related to enclosureopenings, enclosure integrity or the areasurrounding the switchgear enclosure combine to37.1 % of occurrences.
As another example, corona or surface tracking,was identified for four failure contributing causes:
Failure Contributing Causes forSwitchgear Bus and Circuit Breakers
Most Probable Initiating Cause of Failure(Contributor)
(%)
Thermocycling Loose connections, load current, internal temperature,ambient, cubicle heaters, etc.
7.5
Mechanical Structure Failure Fatigue, vibration, electrical loose components 4.3
Mechanical Damage From Foreign Source Accidental action during maintenance / EnclosureOpenings
2.6
Shorting by Tools or Metal Objects Accidental action during maintenance / EnclosureOpenings
5.9
Shorting by Snakes, Birds, Rodents, etc. Enclosure Openings 1.2
Malfunction of Protective Relays Excessive mechanical/thermal stresses duringabnormal system operation
5.5
Improper Setting of Protective Device Excessive mechanical/thermal stresses duringabnormal system operation
1.6
Above Normal Ambient Temperature Ambient Temperature 1.2
Exposure to Chemical or Solvents Corona or Surface Tracking / Enclosure Openings 7.1
Exposure to Moisture Corona or Surface Tracking / Enclosure Openings /Cubicle Heater Circuit Failure
17.7
Exposure to Dust or Other Contaminants Corona or Surface Tracking 11.4
Exposure to Non-Electrical Fire or Burning External activity 2.6
Obstruction of Ventilation Clogged door or other filters 3.1
Normal Deterioration from Age Normal deterioration: corona or surface tracking of theinsulation; contacts, interrupters, springs, mechanisms.
9.8
Severe Weather Condition External activity 2.8
Testing Error External activity 1.6
Lubricant Loss, or Deficiency Overheating of the equipment and lubrication, agedlubricants or loss-of lubricants
7.1
Lack of Preventive Maintenance External activity 7.1
Table 4
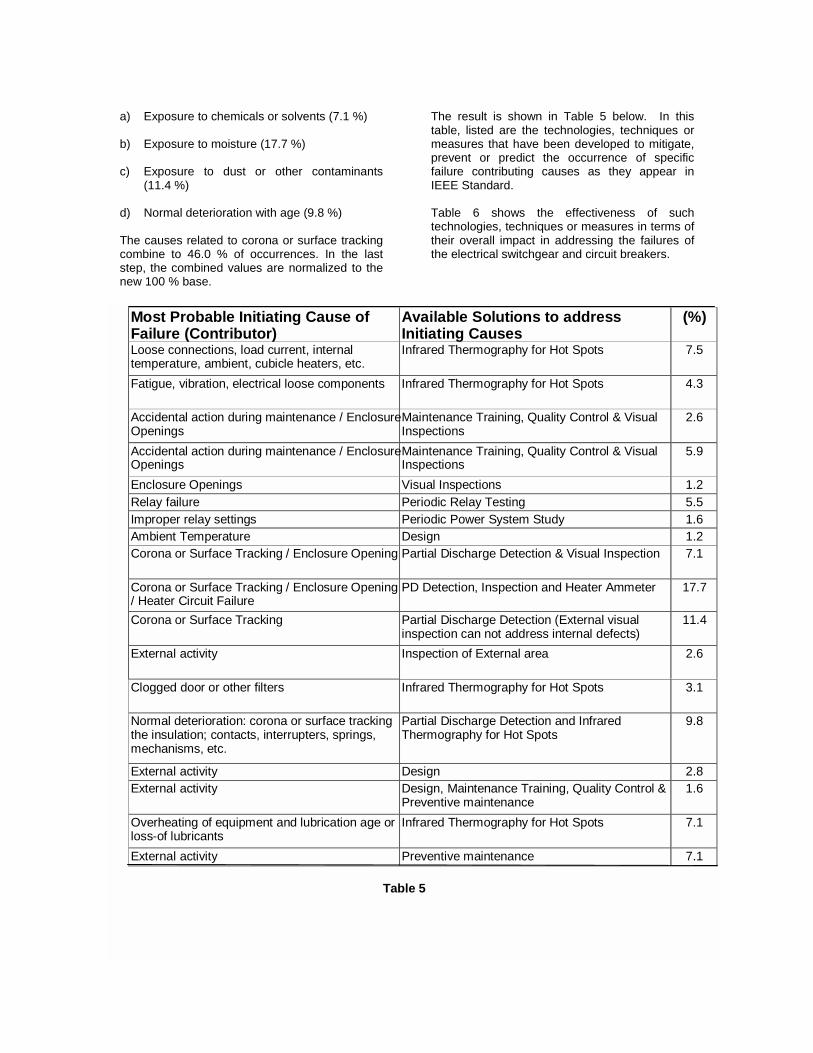
a) Exposure to chemicals or solvents (7.1 %)
b) Exposure to moisture (17.7 %)
c) Exposure to dust or other contaminants(11.4 %)
d) Normal deterioration with age (9.8 %)
The causes related to corona or surface trackingcombine to 46.0 % of occurrences. In the laststep, the combined values are normalized to thenew 100 % base.
The result is shown in Table 5 below. In thistable, listed are the technologies, techniques ormeasures that have been developed to mitigate,prevent or predict the occurrence of specificfailure contributing causes as they appear inIEEE Standard.
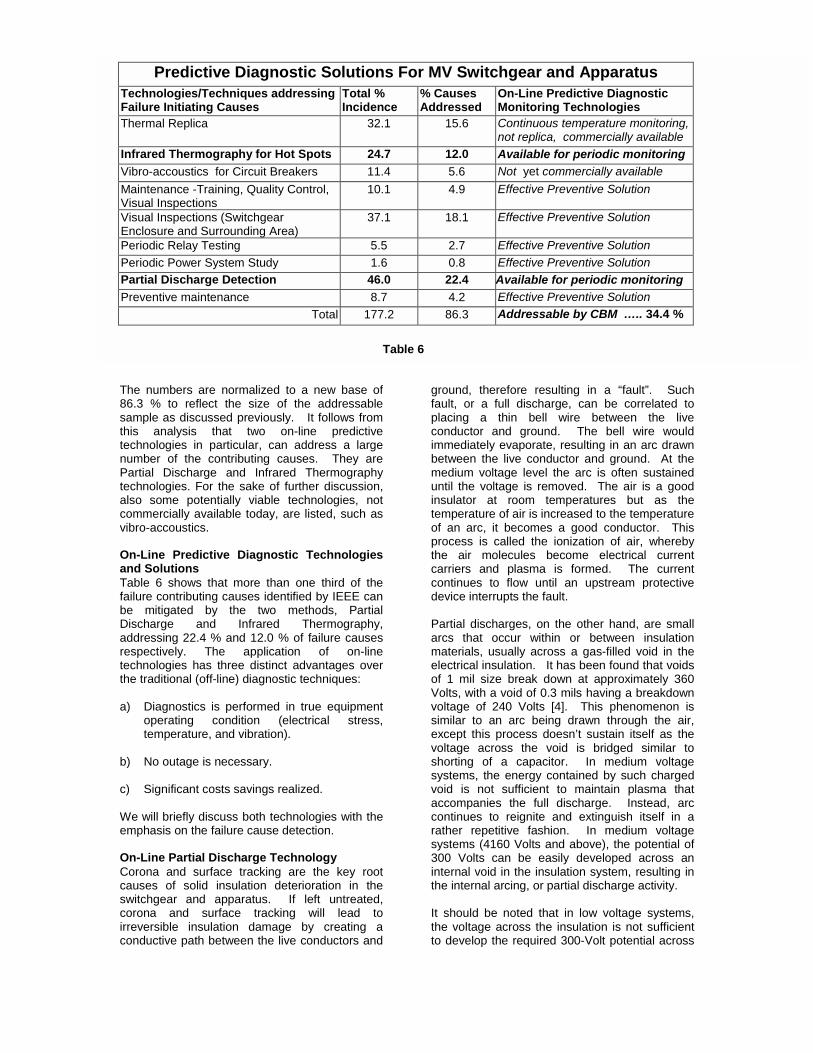
Table 6 shows the effectiveness of suchtechnologies, techniques or measures in terms oftheir overall impact in addressing the failures ofthe electrical switchgear and circuit breakers.
Most Probable Initiating Cause ofFailure (Contributor)
Available Solutions to addressInitiating Causes
(%)
Loose connections, load current, internaltemperature, ambient, cubicle heaters, etc.
Infrared Thermography for Hot Spots 7.5
Fatigue, vibration, electrical loose components Infrared Thermography for Hot Spots 4.3
Accidental action during maintenance / EnclosureOpenings
Maintenance Training, Quality Control & VisualInspections
2.6
Accidental action during maintenance / EnclosureOpenings
Maintenance Training, Quality Control & VisualInspections
5.9
Enclosure Openings Visual Inspections 1.2Relay failure Periodic Relay Testing 5.5Improper relay settings Periodic Power System Study 1.6Ambient Temperature Design 1.2Corona or Surface Tracking / Enclosure Opening Partial Discharge Detection & Visual Inspection 7.1
Corona or Surface Tracking / Enclosure Opening/ Heater Circuit Failure
PD Detection, Inspection and Heater Ammeter 17.7
Corona or Surface Tracking Partial Discharge Detection (External visualinspection can not address internal defects)
11.4
External activity Inspection of External area 2.6
Clogged door or other filters Infrared Thermography for Hot Spots 3.1
Normal deterioration: corona or surface trackingthe insulation; contacts, interrupters, springs,mechanisms, etc.
Partial Discharge Detection and InfraredThermography for Hot Spots
9.8
External activity Design 2.8External activity Design, Maintenance Training, Quality Control &
Preventive maintenance1.6
Overheating of equipment and lubrication age orloss-of lubricants
Infrared Thermography for Hot Spots 7.1
External activity Preventive maintenance 7.1
Table 5
The 86.3 sampthis technnumbPartiatechnalso commvibro
On-Land STablefailurbe mDischaddrerespetechnthe tr
a) Dot
b) N
c) S
We wemph
On-LCorocausswitccoronirrevecond
TechFailuTher
InfraVibroMainVisuaVisuaEncloPerioPerioPartiPrev
Predictive Diagnostic Solutions For MV Switchgear and Apparatusnologies/Techniques addressingre Initiating Causes
Total %Incidence
% CausesAddressed
On-Line Predictive DiagnosticMonitoring Technologies
mal Replica 32.1 15.6 Continuous temperature monitoring,not replica, commercially available
red Thermography for Hot Spots 24.7 12.0 Available for periodic monitoring-accoustics for Circuit Breakers 11.4 5.6 Not yet commercially availabletenance -Training, Quality Control,l Inspections
10.1 4.9 Effective Preventive Solution
l Inspections (Switchgearsure and Surrounding Area)
37.1 18.1 Effective Preventive Solution
dic Relay Testing 5.5 2.7 Effective Preventive Solutiondic Power System Study 1.6 0.8 Effective Preventive Solutional Discharge Detection 46.0 22.4 Available for periodic monitoringentive maintenance 8.7 4.2 Effective Preventive Solution
Total 177.2 86.3 Addressable by CBM ….. 34.4 %
Table 6
numbers are normalized to a new base of% to reflect the size of the addressablele as discussed previously. It follows fromanalysis that two on-line predictive
ologies in particular, can address a largeer of the contributing causes. They arel Discharge and Infrared Thermographyologies. For the sake of further discussion,some potentially viable technologies, notercially available today, are listed, such as
-accoustics.
ine Predictive Diagnostic Technologiesolutions 6 shows that more than one third of the
e contributing causes identified by IEEE canitigated by the two methods, Partial
arge and Infrared Thermography,ssing 22.4 % and 12.0 % of failure causesctively. The application of on-lineologies has three distinct advantages overaditional (off-line) diagnostic techniques:
iagnostics is performed in true equipmentperating condition (electrical stress,
emperature, and vibration).
o outage is necessary.
ignificant costs savings realized.
ill briefly discuss both technologies with theasis on the failure cause detection.
ine Partial Discharge Technologyna and surface tracking are the key rootes of solid insulation deterioration in thehgear and apparatus. If left untreated,a and surface tracking will lead torsible insulation damage by creating a
uctive path between the live conductors and
ground, therefore resulting in a “fault”. Suchfault, or a full discharge, can be correlated toplacing a thin bell wire between the liveconductor and ground. The bell wire wouldimmediately evaporate, resulting in an arc drawnbetween the live conductor and ground. At themedium voltage level the arc is often sustaineduntil the voltage is removed. The air is a goodinsulator at room temperatures but as thetemperature of air is increased to the temperatureof an arc, it becomes a good conductor. Thisprocess is called the ionization of air, wherebythe air molecules become electrical currentcarriers and plasma is formed. The currentcontinues to flow until an upstream protectivedevice interrupts the fault.
Partial discharges, on the other hand, are smallarcs that occur within or between insulationmaterials, usually across a gas-filled void in theelectrical insulation. It has been found that voidsof 1 mil size break down at approximately 360Volts, with a void of 0.3 mils having a breakdownvoltage of 240 Volts [4]. This phenomenon issimilar to an arc being drawn through the air,except this process doesn’t sustain itself as thevoltage across the void is bridged similar toshorting of a capacitor. In medium voltagesystems, the energy contained by such chargedvoid is not sufficient to maintain plasma thataccompanies the full discharge. Instead, arccontinues to reignite and extinguish itself in arather repetitive fashion. In medium voltagesystems (4160 Volts and above), the potential of300 Volts can be easily developed across aninternal void in the insulation system, resulting inthe internal arcing, or partial discharge activity.
It should be noted that in low voltage systems,the voltage across the insulation is not sufficientto develop the required 300-Volt potential across
a small void, therefore we do not witness coronadamage or surface tracking in low voltagesystems.
Corona can often be “heard” as distinct crackingsound. Although occurring in air, this arcing alsocauses deterioration of the solid insulation, whichbreaks down into a white powdery residue on itssurface. Another byproduct of corona is thesmell of ozone, which is the result of the oxygenmolecule decomposition. Corona can also beobserved visually if the arcing is severe and thearea is in complete darkness.
Lastly, corona arcing is also accompanied byemission of electromagnetic waves at radiofrequencies from 100 kHz to 100 MHz. Suchradiation can be detected on the outside if thearcing is severe, directly observable or notshielded by metal barriers. As the internalinsulation of the medium voltage metal-clad ormetal-enclosed switchgear is very effectivelyshielded by design, a task of reliable sensing ofpartial discharges and corona poses us with asignificant challenge.
Even clean and dry insulation will exhibit coronadamage, as is often a case with older switchgeardesigns. Many older designs feature flat cooper
bus covered with an insulation sleeve. Theinsulation sleeve enters the switchgear cellthrough a surrounding insulating support barrierwith inherent small air gaps between the copperand the sleeve and between the sleeve and thesupport barrier. Sufficient potential can becapacitively coupled across these multiple airgaps. For this reason, it is common to findcorona damage on older switchgear designs, atthe point where the internal bus passes betweencubicles.
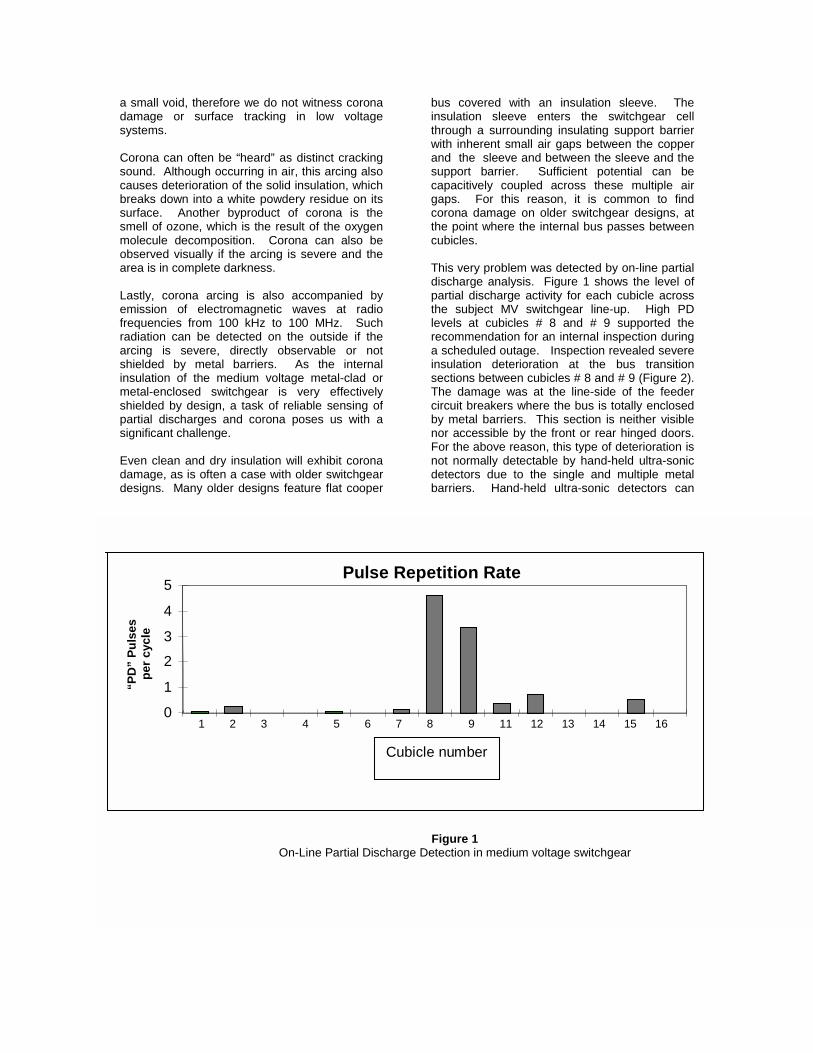
This very problem was detected by on-line partialdischarge analysis. Figure 1 shows the level ofpartial discharge activity for each cubicle acrossthe subject MV switchgear line-up. High PDlevels at cubicles # 8 and # 9 supported therecommendation for an internal inspection duringa scheduled outage. Inspection revealed severeinsulation deterioration at the bus transitionsections between cubicles # 8 and # 9 (Figure 2).The damage was at the line-side of the feedercircuit breakers where the bus is totally enclosedby metal barriers. This section is neither visiblenor accessible by the front or rear hinged doors.For the above reason, this type of deterioration isnot normally detectable by hand-held ultra-sonicdetectors due to the single and multiple metalbarriers. Hand-held ultra-sonic detectors can
Pulse Repetition Rate
0
1
2
3
4
5
1 2 3 4 5 6 7 8 9 11 12 13 14 15 16
Cubicle number
Figure 1On-Line Partial Discharge Detection in medium voltage switchgear
“PD
” Pu
lses
pe
r cyc
le

help to pinpoint the specific source of PD within aswitchgear cell, during an off-line AC HighPotential test. This can be completed during thenext scheduled outage, should on-line PDmeasurements indicate a potential problem.
Through the use of specially designed partialdischarge sensors, the partial discharge activitycan be detected behind the metal barrierassemblies, therefore allowing for on-linediagnostics of insulation deterioration associatedwith corona damage.
Surface tracking canelectrical stress poiinsulation surface mtracking to progress.contaminants and msurface, a surface leaassociated heat lossewater and reduction o
semi-conductive coating, thereby formation ofsmall arcs. These small arcs continue to burn atthe insulation surface producing permanentcarbon traces. Carbon is a conductor and itsformation of the insulation surface aid inpropagation of the “needle points” along thesurface. This process of surface tracking andtree propagation (treeing) is irreversible. Anexample of surface tracking is shown in Figure 3.
This 4160-Volt bushing from an air circuit breakerhas only about 5/8” of its surface intact.Inspection determined that the root cause of thisdamage was the surface tracking due to agradual build-up of moisture in the cell due to thefaulty cell heater for extended amount of time.
Corona damage and surface tracking are twoprimary root causes of insulation deterioration inmedium voltage electrical systems. An on-linemethod for reliable detection of internal partialdischarges was developed and experimentallyverified for the voltage classes from 5 kV to 38kV.
As shown earlier, a few on-line diagnostictechniques can address a significant number offailure causes in medium voltage switchgear andapparatus. To further economic return fromimplementation of any of the discussedtechniques, also more conventional methods can
FigCorona detected and damag
FSurface Tracking on a 41
ure 2e found between cubicles # 8-9
start as corona, at highnts, but a contaminatedust exist for the surface With a combination ofoisture on the insulationkage current can flow. Thes can help evaporation off the contamination to thin
be employed. For example, periodic surveysaddressing partial discharges can be suitablycombined with inspections addressing theintegrity of the enclosures and surrounding areas,thereby addressing an additional 18% of thefailure contributing causes at virtually noadditional costs.
Infrared ThermographyThermographic inspections of electricalswitchgear have been an extremely valuablepredictive diagnostic tool for many years. Thethermographic instrumentation detects theinfrared radiation, which is emitted by the surfaceof equipment under observation. A thermalimage is constructed of the equipment under test,much like the video camera processes the visualimage. Different colors represent differentsurface temperatures. Corrections often need tobe applied to adjust for different reflectivity of thesurfaces and other factors.
Hot spots from loose or deteriorated bus joints, orexcessive heat from overheating contacts can bequickly identified. When different readings fromphase conductors are obtained, individual phaseloading needs to be taken into account. Varioustechniques are used to help the operator reliablypinpoint the source of heat and its probablecause, leading to reliable identification ofappropriate corrective actions. With the help of a
igure 360-Volt Circuit Breaker Bushing

computer, thermographic images or video scanscan be conveniently stored for documentationpurposes.
Thermography requires the direct line-of-sightbetween the camera (gun) and the equipment tobe inspected. The medium voltage switchgearneeds to have hinged front and rear doors. Extracaution and maximum safety must be alwaysexercised when opening enclosures of liveequipment. While safety implications areobvious, care must be taken to minimize thepossibility of an accidental trip from protectiverelays or interlocks. Extra care should also betaken around the switchgear equipped withflashover protection that uses light sensors totrigger the back-up protection. If the rear-hingeddoors are opened, extreme caution must beexercised, as the bus may run very close to thedoors or covers. The integrity of the hinges mustbe verified to ensure that the hinged door will notdislodge or otherwise come in contact with thelive bus during opening.
NOTE: It is not recommended to attempt aninspection of live electrical equipment,without proper training and observing allsafety precautions.
Other options are infrared view-through sites thatare designed to allow for the passage of infraredradiation, whereas maintaining a safety barrierbetween the camera operator and the livecomponents. These are usually small indiameter matching the infrared camera lens.Thermographic inspections are very effective inidentifying deterioration related to:
a) Thermal cycling, resulting in formation of hotspots.
b) Mechanical failures from loose connections.
c) Overheating from obstruction of ventilation.
d) Normal deterioration with age resulting inloose connections.
Care must be exercised to complete thethermographic inspection in a safe manner,usually with two personnel present. Figure 4shows an outdoor oil circuit breaker, with theclose-up picture of “hot spot” in one of thebushing connections at the right-hand side of thecircuit breaker.
Failure Related CostsWhen implementing effective condition-basemaintenance programs, the costs of suchprogram and its benefits have to be scrutinized indetail. The IEEE Standard 493-1997 documentsequipment failure rates in per unit-year notationfor both switchgear bus and circuit breakers.Unit-years are defined as the number ofswitchgear cubicles or switches, in a plant,multiplied by the number of years of operation ofthe switchgear between expected failures.
For switchgear bus, the expected failure rate is0.015 per unit-years with an average downtime of29 hours per failure (Appendix K - Table I, page388 – 601V-15kV and 34.5-138kV categoriescombined) [2]. For circuit breakers, the expectedfailure rate is 0.001 per unit-years, with anaverage downtime of 28 hours per failure(Appendix E - Table I, page 309) [2]. Thecombined failure rate for both switchgear bus andcircuit breakers is 0.016 failures per unit-years,with an average downtime of 28.5 hours perfailure.
Table 7 shows the data extrapolation for plantswith 25, 50, 75 and 100 MV circuit breakers(cubicles or cells); for five years between failureevents.
The effect of extending the time interval betweenfailures is a potentially longer outage required toreturn the equipment back to operation.
For example, a plant with twenty-five MV cubiclesmay experience a single circuit breaker or cellfailure every year. According to the IEEE data,11.4 hours of downtime would be required onaverage to return the equipment to fullfunctionality. One can speculate that the outagewill be shorter if the failure is only related to the
circuit breaker itself and a spare device isavailable. On the other hand, if the cubicle hasbeen damaged by fire, significantly longer outagewill be required to clean up the switchgearcubicle before installing the spare circuit breaker.A five-year event, with associated 57-houroutage, can be thought of as a failure of the mainbus of the switchgear lineup or a failure occurringat multiple locations in a distribution system.Such serious failure will require the following:Figure 4
Infrared scan identifying overheated bushingconnection on an outdoor Oil Circuit Breaker

a) De-energization of the entire switchgear line-up.
b) Removal of all damaged bus and insulation.c) Repair or replacement of components often
requiring custom bus fitting.d) Inspection and cleaning of all associated
equipment, testing and startup.
Such a 57-hour long outage translates toapproximately 2.5 days of round-the-clockemergency repair. In the case of entire line-upfailure, 2.5 days is a reasonable estimate toperform all of the above work.
In another example we will assume that a planthad fifty MV circuit breaker cells, and had notexperienced a cubicle or a circuit breaker failurein three years. The expected hours of downtimefor the probable failure in year # 3 would be:(0.016 failures/unit-years) times (50 breakerunits) times (3 Years) times (28.5 hours perfailure), or 68.4 hours of expected downtime dueto a failure associated with the medium voltageswitchgear bus or circuit breakers. This equalsto three days of round-the-clock emergencyrepair, but it may involve multiple failures; hence1.5 days of round-the-clock emergency repair fortwo separate failures.
Table 7 shows the worst case of a 228-houroutage for a plant with one hundred of MVcubicles and no failure in five years. Such eventequals to one major outage of completeswitchgear (line-side bus) for 9.5 days, or fiveseparate failures (load-side bus or circuitbreakers) averaging 2 days.
Although the above examples are based on theofficial IEEE survey data [2], actual experiencemay suggest somewhat lower numbers. This maycome from the fact that the survey may tend tofavor most of the serious incidents while thesmall, local failures may have been unreported.Those of us who experienced such majorswitchgear failures are well aware of theextensive work involved, and the length ofassociated downtime.
As an example, a plant may operate for manyyears without a major bus or circuit breakerfailure, putting such extrapolations in question,especially for recently erected installations. Theabove IEEE derived data is the composite ofresponses from many facilities with variedoperating and environmental conditions, as wellas varied maintenance practices. The adaptationof this data attempts to provide a relative costsfor such failures, which will vary from plant toplant.
To translate the outage data into actual costs thefollowing factors must be considered:
a) Lost Salesb) Lost production marginc) Downturn and start-up costsd) Product waste costse) Repair or replacement costsf) Environmental cleanup costs
When expressed in per-unit notation the costsneed to be multiplied by the “Hours of Outage”from Table 7 above.
Reliability Centered Maintenance (RCM)Reliability Centered Maintenance involves theevaluation of complete systems and sub-systemsfor the proper allocation of resources [1]. Thisstudy is performed by outside consultants or in-house personnel after proper RCM training.
In the area of electrical switchgear assemblies,there is a basis to perform an RCM review oneach switchgear assembly, or substation, as asingle-unit. In other words, the criticality of allsystem busses needs to be evaluated on thebasis of the loads supplied and the effects onsafety, environment and production. This type ofanalysis should first be completed by evaluatingeach switchgear assembly as a complete unit,since a failure in one switchgear bus, or onecircuit breaker can result in the entire line-upbeing de-energized. Following this evaluation,each circuit breaker can then be evaluated withthe appropriate review of the individual loadssupplied.
The results can aid in the appropriation ofresources from one switchgear assembly toanother, or one substation to another.
SummaryThis paper has presented a concept ofdevelopment of a Condition AssessmentProgram for medium voltage switchgear andcircuit breakers. The program developmentstarted with an analysis of the equipment failurecontributing causes and the survey datadocumented by IEEE. Using experience andintuitive approach, the data was analyzed and themost probable initiating causes of each failuremode were assigned to each contributing cause.
Probable Hoursof DowntimeYears betweenFailure Events 25 50 75 100
One (1) 11.4 22.8 34.2 45.6Three (3) 34.2 68.4 102.6 136.8
Five (5) 57.0 114.0 171.0 228.0
# of MV Breakers in thePlant
Table 7

The available on-line monitoring diagnostictechnologies were reviewed and selected toaddress the failure initiating causes in the orderof their importance. It was concluded thatapproximately 50% of the contributing failurecauses identified by IEEE could be addressed bythe commercially available technologies andtechniques.
The two on-line diagnostic technologies wereidentified:
a) Partial Discharge Diagnostics, addressingapproximately 22.4% of the failures, and
b) Infrared Thermography with the potential ofaddressing approximately 12.0% of thefailures.
Most products in this category are still based onperiodic (discreet) rather than continuousmonitoring. However, significant achievementshave recently been accomplished in developmentof the partial discharge continuous monitoringsystems. It is the authors’ strong belief thatespecially the latter technologies will form thebasis for implementation of the economicallyviable condition-based monitoring programs forthe medium voltage switchgear in the near future.The first application of these concepts willundoubtedly be in the processes of highercriticality, such as in the distribution systems inthe paper mills, electronic manufacturing, powerplants, refineries and other industries.
It was also demonstrated that the application ofthe condition-based maintenance can beconveniently combined with more conventionalmaintenance approaches. For example, theadditional 18 % of contributing failure causes,related to enclosure and surrounding areas, canbe cost effectively addressed by inspection eitherduring the partial discharge or thermographicsurveys.
Finally, safety related issues were shown ashaving probable effect on approximately 5 % ofthe contributing failure causes for MV switchgear.Regardless of the probabilistic results, safetyissues should always be given the highestpriority.
References[1] J. Moubray, Reliability-centered Maintenance,Industrial Press Inc., 1997
[2] IEEE Standard 493-1997, IEEERecommended Practice for Design of ReliableIndustrial and Commercial Power Systems –Gold Book, IEEE Inc., New York, NY, 1998.
[3] P. Gill, Electrical Power EquipmentMaintenance and Testing, Marcel Dekker, Inc.,New York, NY, 1998
[4] James E. Smith, “Corona (Partial Discharge)Testing of Metalclad Switchgear”, TheAssociation of Professional Engineers of theProvince of Ontario, 1985
AcknowledgmentsThe authors wish to acknowledge theconsiderable input from IEEE reviewers: CliffNormand, Jim Rooks, Jim Closson and GusHenson.
Authors:
Gabriel J. Paoletti, P.E. received a B.S.E.Edegree from Drexel University, Philadelphia, Pa.in 1976. Mr. Paoletti has over twenty-six years ofengineering service experience withWestinghouse, ABB and Cutler-HammerEngineering Service. His electrical distributionequipment experience includes field testing,predictive and preventive maintenance, RCMprograms, applications engineering, failureanalysis, and power systems studies. He hasdesign experience with vacuum circuit breakermodernization, low voltage circuit breaker cell-retrofits and motor and transformer repairexperience. Mr. Paoletti is a RegisteredProfessional in the States of Pennsylvania andDelaware. Mr. Paoletti is currently PowerAssurance Manager for Eaton’s Cutler-HammerPerformance Power Solutions Group.
Martin Baier, P.E. received his Masters fromCzech Technical University, Prague in 1973. Mr.Baier has over twenty-six years of engineeringexperience with the utility, Westinghouse andCutler-Hammer Engineering Service. Hiselectrical distribution experience includes fieldtesting, predictive and preventive maintenanceprograms implementation and execution,application engineering and substation design,failure analysis and power system studies. Otherareas of his experience include power generatingplants, protection systems, power quality and

energy management schemes design. Mr. Baieris a Registered Professional Engineer in theState of Pennsylvania and Ontario, Canada.