Faculty Profile: Systemwide Total
24
1 of 24 Students Lecturers Tenure-Track All Faculty (Lect + TT) Student to TT Faculty Student to All Faculty Tenure Density (TT/All Fac) 2011 361,675.9 5,957.1 9,813.0 15,770.1 36.9 22.9 62.2% 2012 369,163.7 6,227.0 9,702.7 15,929.7 38.0 23.2 60.9% 2013 379,387.1 6,821.7 9,669.0 16,490.7 39.2 23.0 58.6% 2014 391,531.8 7,459.4 9,796.9 17,256.3 40.0 22.7 56.8% 2015 404,746.3 7,909.9 10,042.9 17,952.8 40.3 22.5 55.9% 2016 409,382.1 8,156.6 10,394.3 18,550.9 39.4 22.1 56.0% 2017 419,518.1 8,429.0 10,586.0 19,015.0 39.6 22.1 55.7% 2018 418,062.1 8,464.1 10,745.6 19,209.7 38.9 21.8 55.9% 2019 422,219.9 8,768.0 10,853.8 19,621.8 38.9 21.5 55.3% 2020 426,719.1 8,497.9 10,940.0 19,437.9 39.0 22.0 56.3% • FTEF reflects the sum of all appointments per campus for each included faculty member. Notes: • Data as of Fall snapshots (employee and student) for each year. • Student data includes students at all levels; excludes CalStateTEACH and International Programs. Faculty Profile: Systemwide Total Fall Term Full-Time Equivalents (FTE) Ratios • Faculty data includes only lecturers and tenure/tenure-track instructors based on primary classification code; excludes faculty on leave. • Lecturer totals include visiting professors; tenure-track totals include grant-related instructional faculty 62.2% 60.9% 58.6% 56.8% 55.9% 56.0% 55.7% 55.9% 55.3% 56.3% 0% 10% 20% 30% 40% 50% 60% 70% 80% 2011 2012 2013 2014 2015 2016 2017 2018 2019 2020 Tenure Density Tenure Density Trend 0 10 20 30 40 50 60 2011 2012 2013 2014 2015 2016 2017 2018 2019 2020 Ratio Student/Faculty Ratio Trend Student to TT Faculty Student to All Faculty Data Source: October snapshot; Institutional Research and Analyses Fall Enrollment Summary SWHR Data Analysis: HS 3/29/2021
Transcript of Faculty Profile: Systemwide Total

1 of 24
Students Lecturers Tenure-TrackAll Faculty (Lect + TT)
Student to TT Faculty
Student to All Faculty
Tenure Density (TT/All Fac)
2011 361,675.9 5,957.1 9,813.0 15,770.1 36.9 22.9 62.2%2012 369,163.7 6,227.0 9,702.7 15,929.7 38.0 23.2 60.9%2013 379,387.1 6,821.7 9,669.0 16,490.7 39.2 23.0 58.6%2014 391,531.8 7,459.4 9,796.9 17,256.3 40.0 22.7 56.8%2015 404,746.3 7,909.9 10,042.9 17,952.8 40.3 22.5 55.9%2016 409,382.1 8,156.6 10,394.3 18,550.9 39.4 22.1 56.0%2017 419,518.1 8,429.0 10,586.0 19,015.0 39.6 22.1 55.7%2018 418,062.1 8,464.1 10,745.6 19,209.7 38.9 21.8 55.9%2019 422,219.9 8,768.0 10,853.8 19,621.8 38.9 21.5 55.3%2020 426,719.1 8,497.9 10,940.0 19,437.9 39.0 22.0 56.3%
• FTEF reflects the sum of all appointments per campus for each included faculty member.
Notes:• Data as of Fall snapshots (employee and student) for each year.
• Student data includes students at all levels; excludes CalStateTEACH and International Programs.
Faculty Profile: Systemwide Total
Fall Term
Full-Time Equivalents (FTE) Ratios
• Faculty data includes only lecturers and tenure/tenure-track instructors based on primary classification code; excludes faculty on leave.• Lecturer totals include visiting professors; tenure-track totals include grant-related instructional faculty
62.2% 60.9% 58.6% 56.8% 55.9% 56.0% 55.7% 55.9% 55.3% 56.3%
0%
10%
20%
30%
40%
50%
60%
70%
80%
2011 2012 2013 2014 2015 2016 2017 2018 2019 2020
Tenu
re D
ensit
yTenure Density Trend
0
10
20
30
40
50
60
2011 2012 2013 2014 2015 2016 2017 2018 2019 2020
Ratio
Student/Faculty Ratio Trend
Student to TT Faculty Student to All Faculty
Data Source: October snapshot; Institutional Research and Analyses Fall Enrollment SummarySWHR Data Analysis: HS 3/29/2021
2 of 24
Students Lecturers Tenure-TrackAll Faculty (Lect + TT)
Student to TT Faculty
Student to All Faculty
Tenure Density (TT/All Fac)
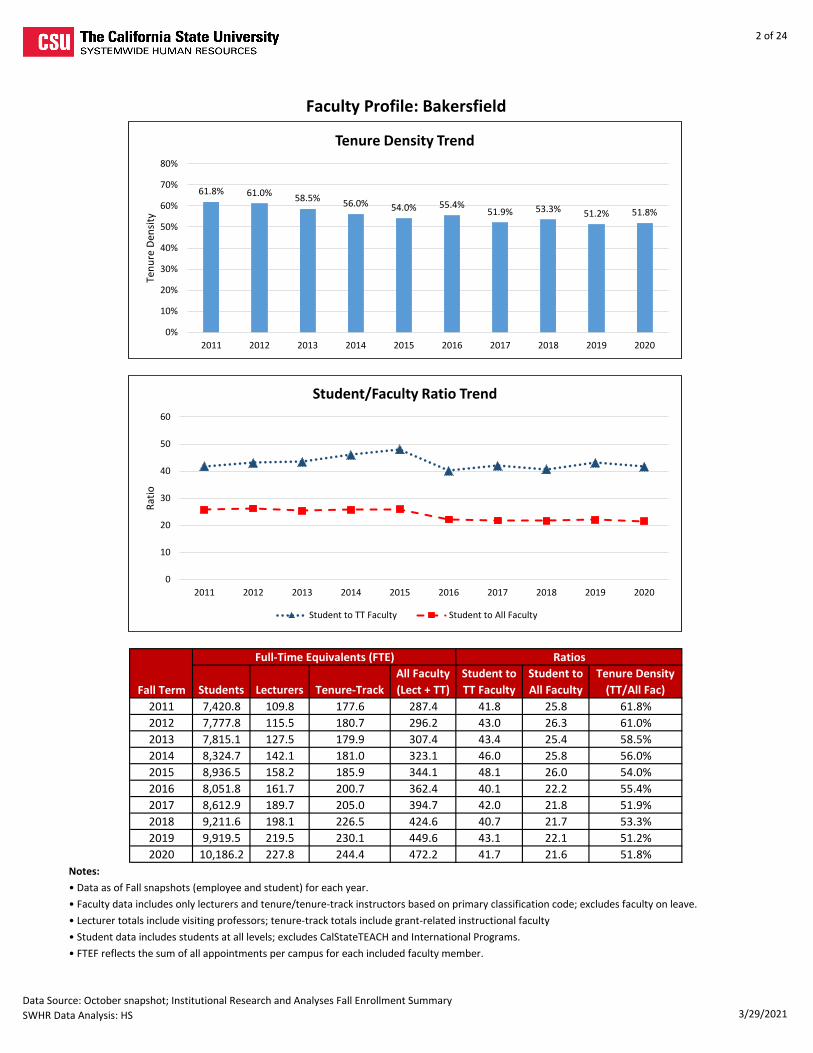
2011 7,420.8 109.8 177.6 287.4 41.8 25.8 61.8%2012 7,777.8 115.5 180.7 296.2 43.0 26.3 61.0%2013 7,815.1 127.5 179.9 307.4 43.4 25.4 58.5%2014 8,324.7 142.1 181.0 323.1 46.0 25.8 56.0%2015 8,936.5 158.2 185.9 344.1 48.1 26.0 54.0%2016 8,051.8 161.7 200.7 362.4 40.1 22.2 55.4%2017 8,612.9 189.7 205.0 394.7 42.0 21.8 51.9%2018 9,211.6 198.1 226.5 424.6 40.7 21.7 53.3%2019 9,919.5 219.5 230.1 449.6 43.1 22.1 51.2%2020 10,186.2 227.8 244.4 472.2 41.7 21.6 51.8%
• FTEF reflects the sum of all appointments per campus for each included faculty member.
Notes:• Data as of Fall snapshots (employee and student) for each year.
• Student data includes students at all levels; excludes CalStateTEACH and International Programs.
Faculty Profile: Bakersfield
Fall Term
Full-Time Equivalents (FTE) Ratios
• Faculty data includes only lecturers and tenure/tenure-track instructors based on primary classification code; excludes faculty on leave.• Lecturer totals include visiting professors; tenure-track totals include grant-related instructional faculty
61.8% 61.0% 58.5% 56.0% 54.0% 55.4%51.9% 53.3% 51.2% 51.8%
0%
10%
20%
30%
40%
50%
60%
70%
80%
2011 2012 2013 2014 2015 2016 2017 2018 2019 2020
Tenu
re D
ensit
yTenure Density Trend
0
10
20
30
40
50
60
2011 2012 2013 2014 2015 2016 2017 2018 2019 2020
Ratio
Student/Faculty Ratio Trend
Student to TT Faculty Student to All Faculty
Data Source: October snapshot; Institutional Research and Analyses Fall Enrollment SummarySWHR Data Analysis: HS 3/29/2021

3 of 24
Students Lecturers Tenure-TrackAll Faculty (Lect + TT)
Student to TT Faculty
Student to All Faculty
Tenure Density (TT/All Fac)
2011 3,599.0 118.7 79.5 198.2 45.3 18.2 40.1%2012 4,315.0 144.7 85.0 229.7 50.8 18.8 37.0%2013 4,569.5 155.4 94.0 249.4 48.6 18.3 37.7%2014 5,179.1 168.0 105.5 273.5 49.1 18.9 38.6%2015 5,448.6 176.1 113.0 289.1 48.2 18.8 39.1%2016 5,816.8 189.7 125.4 315.1 46.4 18.5 39.8%2017 6,186.1 185.4 139.4 324.8 44.4 19.0 42.9%2018 6,277.3 191.4 146.7 338.1 42.8 18.6 43.4%2019 6,405.9 191.9 152.3 344.2 42.1 18.6 44.2%2020 6,194.7 172.1 154.3 326.4 40.1 19.0 47.3%
• FTEF reflects the sum of all appointments per campus for each included faculty member.
Notes:• Data as of Fall snapshots (employee and student) for each year.
• Student data includes students at all levels; excludes CalStateTEACH and International Programs.
Faculty Profile: Channel Islands
Fall Term
Full-Time Equivalents (FTE) Ratios
• Faculty data includes only lecturers and tenure/tenure-track instructors based on primary classification code; excludes faculty on leave.• Lecturer totals include visiting professors; tenure-track totals include grant-related instructional faculty
40.1%37.0% 37.7% 38.6% 39.1% 39.8%
42.9% 43.4% 44.2% 47.3%
0%
10%
20%
30%
40%
50%
60%
70%
80%
2011 2012 2013 2014 2015 2016 2017 2018 2019 2020
Tenu
re D
ensit
yTenure Density Trend
0
10
20
30
40
50
60
2011 2012 2013 2014 2015 2016 2017 2018 2019 2020
Ratio
Student/Faculty Ratio Trend
Student to TT Faculty Student to All Faculty
Data Source: October snapshot; Institutional Research and Analyses Fall Enrollment SummarySWHR Data Analysis: HS 3/29/2021

4 of 24
Students Lecturers Tenure-TrackAll Faculty (Lect + TT)
Student to TT Faculty
Student to All Faculty
Tenure Density (TT/All Fac)
2011 14,984.5 209.1 447.8 656.9 33.5 22.8 68.2%2012 15,256.7 222.2 435.3 657.5 35.0 23.2 66.2%2013 15,374.6 259.8 422.6 682.4 36.4 22.5 61.9%2014 16,251.5 295.0 424.5 719.5 38.3 22.6 59.0%2015 16,140.3 296.5 441.9 738.4 36.5 21.9 59.8%2016 16,343.4 297.2 458.9 756.1 35.6 21.6 60.7%2017 16,647.2 293.0 462.5 755.5 36.0 22.0 61.2%2018 16,437.3 291.9 465.9 757.8 35.3 21.7 61.5%2019 16,181.2 300.6 442.8 743.4 36.5 21.8 59.6%2020 15,607.9 283.3 431.4 714.7 36.2 21.8 60.4%
• FTEF reflects the sum of all appointments per campus for each included faculty member.
Notes:• Data as of Fall snapshots (employee and student) for each year.
• Student data includes students at all levels; excludes CalStateTEACH and International Programs.
Faculty Profile: Chico
Fall Term
Full-Time Equivalents (FTE) Ratios
• Faculty data includes only lecturers and tenure/tenure-track instructors based on primary classification code; excludes faculty on leave.• Lecturer totals include visiting professors; tenure-track totals include grant-related instructional faculty
68.2% 66.2%61.9% 59.0% 59.8% 60.7% 61.2% 61.5% 59.6% 60.4%
0%
10%
20%
30%
40%
50%
60%
70%
80%
2011 2012 2013 2014 2015 2016 2017 2018 2019 2020
Tenu
re D
ensit
yTenure Density Trend
0
10
20
30
40
50
60
2011 2012 2013 2014 2015 2016 2017 2018 2019 2020
Ratio
Student/Faculty Ratio Trend
Student to TT Faculty Student to All Faculty
Data Source: October snapshot; Institutional Research and Analyses Fall Enrollment SummarySWHR Data Analysis: HS 3/29/2021

5 of 24
Students Lecturers Tenure-TrackAll Faculty (Lect + TT)
Student to TT Faculty
Student to All Faculty
Tenure Density (TT/All Fac)
2011 10,518.7 224.8 210.9 435.7 49.9 24.1 48.4%2012 10,189.6 226.6 198.0 424.6 51.5 24.0 46.6%2013 10,917.2 263.5 202.9 466.4 53.8 23.4 43.5%2014 10,972.5 275.4 213.3 488.7 51.4 22.5 43.6%2015 11,325.3 292.1 230.7 522.8 49.1 21.7 44.1%2016 11,533.1 298.7 236.8 535.5 48.7 21.5 44.2%2017 12,168.4 320.2 239.4 559.6 50.8 21.7 42.8%2018 12,711.4 321.7 265.8 587.5 47.8 21.6 45.2%2019 13,947.8 361.1 284.3 645.4 49.1 21.6 44.1%2020 14,574.5 345.4 301.1 646.5 48.4 22.5 46.6%
• FTEF reflects the sum of all appointments per campus for each included faculty member.
Notes:• Data as of Fall snapshots (employee and student) for each year.
• Student data includes students at all levels; excludes CalStateTEACH and International Programs.
Faculty Profile: Dominguez Hills
Fall Term
Full-Time Equivalents (FTE) Ratios
• Faculty data includes only lecturers and tenure/tenure-track instructors based on primary classification code; excludes faculty on leave.• Lecturer totals include visiting professors; tenure-track totals include grant-related instructional faculty
48.4% 46.6%43.5% 43.6% 44.1% 44.2% 42.8% 45.2% 44.1% 46.6%
0%
10%
20%
30%
40%
50%
60%
70%
80%
2011 2012 2013 2014 2015 2016 2017 2018 2019 2020
Tenu
re D
ensit
yTenure Density Trend
0
10
20
30
40
50
60
2011 2012 2013 2014 2015 2016 2017 2018 2019 2020
Ratio
Student/Faculty Ratio Trend
Student to TT Faculty Student to All Faculty
Data Source: October snapshot; Institutional Research and Analyses Fall Enrollment SummarySWHR Data Analysis: HS 3/29/2021

6 of 24
Students Lecturers Tenure-TrackAll Faculty (Lect + TT)
Student to TT Faculty
Student to All Faculty
Tenure Density (TT/All Fac)
2011 11,999.1 179.8 296.8 476.6 40.4 25.2 62.3%2012 12,206.7 190.7 290.5 481.2 42.0 25.4 60.4%2013 12,763.6 217.2 297.2 514.4 42.9 24.8 57.8%2014 13,017.1 227.0 309.2 536.2 42.1 24.3 57.7%2015 13,538.7 255.1 320.0 575.1 42.3 23.5 55.6%2016 13,904.5 249.9 333.1 583.0 41.7 23.8 57.1%2017 13,730.8 253.2 335.2 588.4 41.0 23.3 57.0%2018 12,371.1 228.2 337.4 565.6 36.7 21.9 59.7%2019 12,805.4 247.0 344.4 591.4 37.2 21.7 58.2%2020 12,910.2 242.4 349.0 591.4 37.0 21.8 59.0%
• FTEF reflects the sum of all appointments per campus for each included faculty member.
Notes:• Data as of Fall snapshots (employee and student) for each year.
• Student data includes students at all levels; excludes CalStateTEACH and International Programs.
Faculty Profile: East Bay
Fall Term
Full-Time Equivalents (FTE) Ratios
• Faculty data includes only lecturers and tenure/tenure-track instructors based on primary classification code; excludes faculty on leave.• Lecturer totals include visiting professors; tenure-track totals include grant-related instructional faculty
62.3% 60.4% 57.8% 57.7% 55.6% 57.1% 57.0% 59.7% 58.2% 59.0%
0%
10%
20%
30%
40%
50%
60%
70%
80%
2011 2012 2013 2014 2015 2016 2017 2018 2019 2020
Tenu
re D
ensit
yTenure Density Trend
0
10
20
30
40
50
60
2011 2012 2013 2014 2015 2016 2017 2018 2019 2020
Ratio
Student/Faculty Ratio Trend
Student to TT Faculty Student to All Faculty
Data Source: October snapshot; Institutional Research and Analyses Fall Enrollment SummarySWHR Data Analysis: HS 3/29/2021

7 of 24
Students Lecturers Tenure-TrackAll Faculty (Lect + TT)
Student to TT Faculty
Student to All Faculty
Tenure Density (TT/All Fac)
2011 19,274.7 279.7 524.2 803.9 36.8 24.0 65.2%2012 19,686.8 339.7 506.6 846.3 38.9 23.3 59.9%2013 20,152.1 372.9 520.9 893.8 38.7 22.5 58.3%2014 20,138.1 389.2 529.3 918.5 38.0 21.9 57.6%2015 21,051.9 417.0 529.9 946.9 39.7 22.2 56.0%2016 21,587.4 436.0 561.8 997.8 38.4 21.6 56.3%2017 22,349.8 473.6 596.6 1,070.2 37.5 20.9 55.7%2018 22,236.0 468.2 615.7 1,083.9 36.1 20.5 56.8%2019 21,640.6 451.1 603.3 1,054.4 35.9 20.5 57.2%2020 22,412.7 480.2 588.9 1,069.1 38.1 21.0 55.1%
• FTEF reflects the sum of all appointments per campus for each included faculty member.
Notes:• Data as of Fall snapshots (employee and student) for each year.
• Student data includes students at all levels; excludes CalStateTEACH and International Programs.
Faculty Profile: Fresno
Fall Term
Full-Time Equivalents (FTE) Ratios
• Faculty data includes only lecturers and tenure/tenure-track instructors based on primary classification code; excludes faculty on leave.• Lecturer totals include visiting professors; tenure-track totals include grant-related instructional faculty
65.2%59.9% 58.3% 57.6% 56.0% 56.3% 55.7% 56.8% 57.2% 55.1%
0%
10%
20%
30%
40%
50%
60%
70%
80%
2011 2012 2013 2014 2015 2016 2017 2018 2019 2020
Tenu
re D
ensit
yTenure Density Trend
0
10
20
30
40
50
60
2011 2012 2013 2014 2015 2016 2017 2018 2019 2020
Ratio
Student/Faculty Ratio Trend
Student to TT Faculty Student to All Faculty
Data Source: October snapshot; Institutional Research and Analyses Fall Enrollment SummarySWHR Data Analysis: HS 3/29/2021

8 of 24
Students Lecturers Tenure-TrackAll Faculty (Lect + TT)
Student to TT Faculty
Student to All Faculty
Tenure Density (TT/All Fac)
2011 28,919.0 550.1 715.6 1,265.7 40.4 22.8 56.5%2012 30,286.9 602.3 722.3 1,324.6 41.9 22.9 54.5%2013 30,777.0 613.2 728.3 1,341.5 42.3 22.9 54.3%2014 30,819.4 669.3 746.3 1,415.6 41.3 21.8 52.7%2015 31,405.1 665.2 779.1 1,444.3 40.3 21.7 53.9%2016 32,306.1 663.9 803.3 1,467.2 40.2 22.0 54.8%2017 33,066.6 687.0 798.0 1,485.0 41.4 22.3 53.7%2018 32,529.7 650.0 792.3 1,442.3 41.1 22.6 54.9%2019 33,202.2 666.7 811.6 1,478.3 40.9 22.5 54.9%2020 34,563.3 650.5 820.8 1,471.3 42.1 23.5 55.8%
• FTEF reflects the sum of all appointments per campus for each included faculty member.
Notes:• Data as of Fall snapshots (employee and student) for each year.
• Student data includes students at all levels; excludes CalStateTEACH and International Programs.
Faculty Profile: Fullerton
Fall Term
Full-Time Equivalents (FTE) Ratios
• Faculty data includes only lecturers and tenure/tenure-track instructors based on primary classification code; excludes faculty on leave.• Lecturer totals include visiting professors; tenure-track totals include grant-related instructional faculty
56.5% 54.5% 54.3% 52.7% 53.9% 54.8% 53.7% 54.9% 54.9% 55.8%
0%
10%
20%
30%
40%
50%
60%
70%
80%
2011 2012 2013 2014 2015 2016 2017 2018 2019 2020
Tenu
re D
ensit
yTenure Density Trend
0
10
20
30
40
50
60
2011 2012 2013 2014 2015 2016 2017 2018 2019 2020
Ratio
Student/Faculty Ratio Trend
Student to TT Faculty Student to All Faculty
Data Source: October snapshot; Institutional Research and Analyses Fall Enrollment SummarySWHR Data Analysis: HS 3/29/2021

9 of 24
Students Lecturers Tenure-TrackAll Faculty (Lect + TT)
Student to TT Faculty
Student to All Faculty
Tenure Density (TT/All Fac)
2011 7,617.7 139.2 223.0 362.2 34.2 21.0 61.6%2012 7,620.4 150.9 220.0 370.9 34.6 20.5 59.3%2013 7,771.6 156.2 226.8 383.0 34.3 20.3 59.2%2014 7,959.6 169.8 214.2 384.0 37.2 20.7 55.8%2015 8,227.9 177.6 223.5 401.1 36.8 20.5 55.7%2016 8,020.5 178.8 238.8 417.6 33.6 19.2 57.2%2017 7,934.4 172.2 255.3 427.5 31.1 18.6 59.7%2018 7,362.0 161.3 236.3 397.6 31.2 18.5 59.4%2019 6,658.2 152.9 242.9 395.8 27.4 16.8 61.4%2020 5,941.6 137.6 232.7 370.3 25.5 16.0 62.8%
• FTEF reflects the sum of all appointments per campus for each included faculty member.
Notes:• Data as of Fall snapshots (employee and student) for each year.
• Student data includes students at all levels; excludes CalStateTEACH and International Programs.
Faculty Profile: Humboldt
Fall Term
Full-Time Equivalents (FTE) Ratios
• Faculty data includes only lecturers and tenure/tenure-track instructors based on primary classification code; excludes faculty on leave.• Lecturer totals include visiting professors; tenure-track totals include grant-related instructional faculty
61.6% 59.3% 59.2%55.8% 55.7% 57.2% 59.7% 59.4% 61.4% 62.8%
0%
10%
20%
30%
40%
50%
60%
70%
80%
2011 2012 2013 2014 2015 2016 2017 2018 2019 2020
Tenu
re D
ensit
yTenure Density Trend
0
10
20
30
40
50
60
2011 2012 2013 2014 2015 2016 2017 2018 2019 2020
Ratio
Student/Faculty Ratio Trend
Student to TT Faculty Student to All Faculty
Data Source: October snapshot; Institutional Research and Analyses Fall Enrollment SummarySWHR Data Analysis: HS 3/29/2021

10 of 24
Students Lecturers Tenure-TrackAll Faculty (Lect + TT)
Student to TT Faculty
Student to All Faculty
Tenure Density (TT/All Fac)
2011 29,096.0 576.3 777.8 1,354.1 37.4 21.5 57.4%2012 29,593.7 542.4 769.7 1,312.1 38.4 22.6 58.7%2013 29,524.6 582.8 759.3 1,342.1 38.9 22.0 56.6%2014 30,657.0 655.1 773.4 1,428.5 39.6 21.5 54.1%2015 31,199.5 697.4 772.0 1,469.4 40.4 21.2 52.5%2016 31,598.5 714.7 803.3 1,518.0 39.3 20.8 52.9%2017 31,729.1 711.4 817.8 1,529.2 38.8 20.7 53.5%2018 31,571.1 723.8 815.3 1,539.1 38.7 20.5 53.0%2019 32,673.0 756.1 808.0 1,564.1 40.4 20.9 51.7%2020 33,836.8 787.1 814.3 1,601.4 41.6 21.1 50.8%
• FTEF reflects the sum of all appointments per campus for each included faculty member.
Notes:• Data as of Fall snapshots (employee and student) for each year.
• Student data includes students at all levels; excludes CalStateTEACH and International Programs.
Faculty Profile: Long Beach
Fall Term
Full-Time Equivalents (FTE) Ratios
• Faculty data includes only lecturers and tenure/tenure-track instructors based on primary classification code; excludes faculty on leave.• Lecturer totals include visiting professors; tenure-track totals include grant-related instructional faculty
57.4% 58.7% 56.6% 54.1% 52.5% 52.9% 53.5% 53.0% 51.7% 50.8%
0%
10%
20%
30%
40%
50%
60%
70%
80%
2011 2012 2013 2014 2015 2016 2017 2018 2019 2020
Tenu
re D
ensit
yTenure Density Trend
0
10
20
30
40
50
60
2011 2012 2013 2014 2015 2016 2017 2018 2019 2020
Ratio
Student/Faculty Ratio Trend
Student to TT Faculty Student to All Faculty
Data Source: October snapshot; Institutional Research and Analyses Fall Enrollment SummarySWHR Data Analysis: HS 3/29/2021

11 of 24
Students Lecturers Tenure-TrackAll Faculty (Lect + TT)
Student to TT Faculty
Student to All Faculty
Tenure Density (TT/All Fac)
2011 17,262.4 272.1 513.5 785.6 33.6 22.0 65.4%2012 17,951.6 284.3 505.2 789.5 35.5 22.7 64.0%2013 18,705.7 332.5 491.7 824.2 38.0 22.7 59.7%2014 20,446.3 422.6 491.2 913.8 41.6 22.4 53.8%2015 23,251.9 502.9 502.3 1,005.2 46.3 23.1 50.0%2016 22,855.7 576.1 514.4 1,090.5 44.4 21.0 47.2%2017 23,742.7 616.8 531.7 1,148.5 44.7 20.7 46.3%2018 23,605.6 626.3 526.2 1,152.5 44.9 20.5 45.7%2019 22,678.0 593.4 535.4 1,128.8 42.4 20.1 47.4%2020 22,746.0 528.7 557.1 1,085.8 40.8 20.9 51.3%
• FTEF reflects the sum of all appointments per campus for each included faculty member.
Notes:• Data as of Fall snapshots (employee and student) for each year.
• Student data includes students at all levels; excludes CalStateTEACH and International Programs.
Faculty Profile: Los Angeles
Fall Term
Full-Time Equivalents (FTE) Ratios
• Faculty data includes only lecturers and tenure/tenure-track instructors based on primary classification code; excludes faculty on leave.• Lecturer totals include visiting professors; tenure-track totals include grant-related instructional faculty
65.4% 64.0%59.7%
53.8%50.0% 47.2% 46.3% 45.7% 47.4%
51.3%
0%
10%
20%
30%
40%
50%
60%
70%
80%
2011 2012 2013 2014 2015 2016 2017 2018 2019 2020
Tenu
re D
ensit
yTenure Density Trend
0
10
20
30
40
50
60
2011 2012 2013 2014 2015 2016 2017 2018 2019 2020
Ratio
Student/Faculty Ratio Trend
Student to TT Faculty Student to All Faculty
Data Source: October snapshot; Institutional Research and Analyses Fall Enrollment SummarySWHR Data Analysis: HS 3/29/2021

12 of 24
Students Lecturers Tenure-TrackAll Faculty (Lect + TT)
Student to TT Faculty
Student to All Faculty
Tenure Density (TT/All Fac)
2011 986.7 20.6 42.7 63.3 23.1 15.6 67.5%2012 1,073.1 20.2 44.3 64.5 24.2 16.6 68.7%2013 1,141.5 25.3 48.6 73.9 23.5 15.4 65.8%2014 1,124.2 27.6 50.8 78.4 22.1 14.3 64.8%2015 1,173.1 27.3 50.9 78.2 23.0 15.0 65.1%2016 1,197.3 27.1 51.1 78.2 23.4 15.3 65.3%2017 1,133.0 28.1 53.1 81.2 21.3 14.0 65.4%2018 1,106.5 28.1 52.1 80.2 21.2 13.8 65.0%2019 989.6 24.0 56.6 80.6 17.5 12.3 70.2%2020 971.8 23.8 51.1 74.9 19.0 13.0 68.2%
• FTEF reflects the sum of all appointments per campus for each included faculty member.
Notes:• Data as of Fall snapshots (employee and student) for each year.
• Student data includes students at all levels; excludes CalStateTEACH and International Programs.
Faculty Profile: Maritime Academy
Fall Term
Full-Time Equivalents (FTE) Ratios
• Faculty data includes only lecturers and tenure/tenure-track instructors based on primary classification code; excludes faculty on leave.• Lecturer totals include visiting professors; tenure-track totals include grant-related instructional faculty
67.5% 68.7% 65.8% 64.8% 65.1% 65.3% 65.4% 65.0%70.2% 68.2%
0%
10%
20%
30%
40%
50%
60%
70%
80%
2011 2012 2013 2014 2015 2016 2017 2018 2019 2020
Tenu
re D
ensit
yTenure Density Trend
0
10
20
30
40
50
60
2011 2012 2013 2014 2015 2016 2017 2018 2019 2020
Ratio
Student/Faculty Ratio Trend
Student to TT Faculty Student to All Faculty
Data Source: October snapshot; Institutional Research and Analyses Fall Enrollment SummarySWHR Data Analysis: HS 3/29/2021
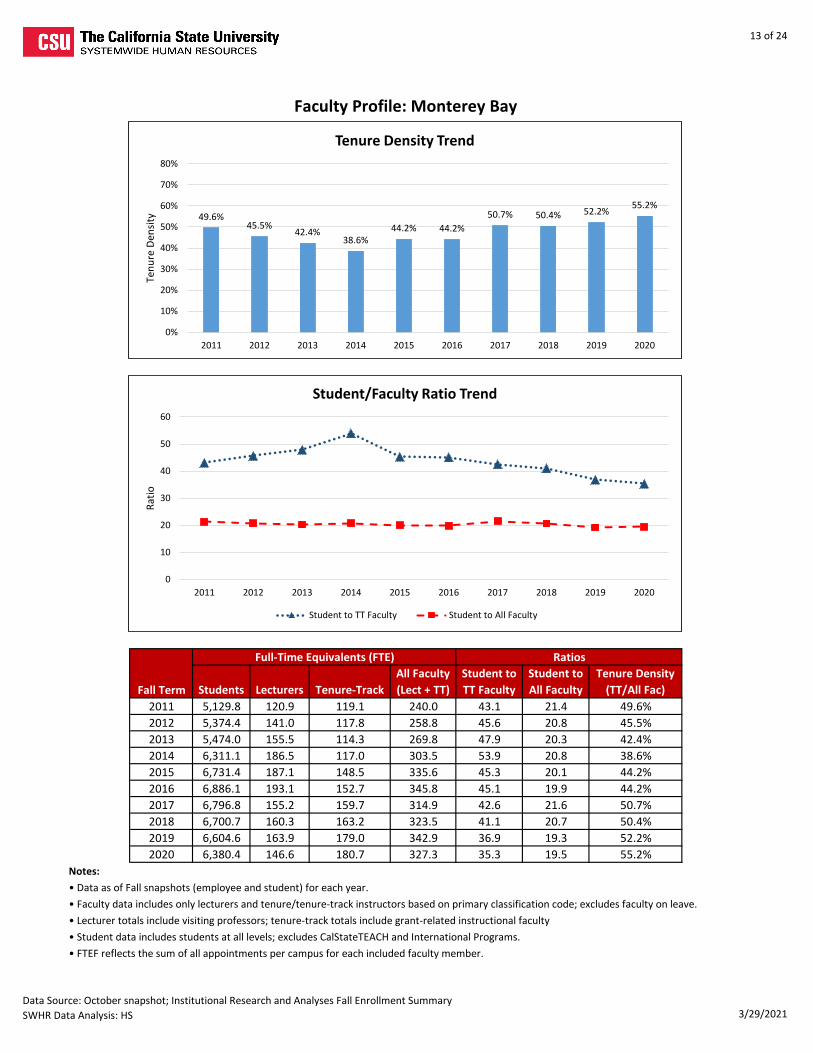
13 of 24
Students Lecturers Tenure-TrackAll Faculty (Lect + TT)
Student to TT Faculty
Student to All Faculty
Tenure Density (TT/All Fac)
2011 5,129.8 120.9 119.1 240.0 43.1 21.4 49.6%2012 5,374.4 141.0 117.8 258.8 45.6 20.8 45.5%2013 5,474.0 155.5 114.3 269.8 47.9 20.3 42.4%2014 6,311.1 186.5 117.0 303.5 53.9 20.8 38.6%2015 6,731.4 187.1 148.5 335.6 45.3 20.1 44.2%2016 6,886.1 193.1 152.7 345.8 45.1 19.9 44.2%2017 6,796.8 155.2 159.7 314.9 42.6 21.6 50.7%2018 6,700.7 160.3 163.2 323.5 41.1 20.7 50.4%2019 6,604.6 163.9 179.0 342.9 36.9 19.3 52.2%2020 6,380.4 146.6 180.7 327.3 35.3 19.5 55.2%
• FTEF reflects the sum of all appointments per campus for each included faculty member.
Notes:• Data as of Fall snapshots (employee and student) for each year.
• Student data includes students at all levels; excludes CalStateTEACH and International Programs.
Faculty Profile: Monterey Bay
Fall Term
Full-Time Equivalents (FTE) Ratios
• Faculty data includes only lecturers and tenure/tenure-track instructors based on primary classification code; excludes faculty on leave.• Lecturer totals include visiting professors; tenure-track totals include grant-related instructional faculty
49.6%45.5%
42.4%38.6%
44.2% 44.2%50.7% 50.4% 52.2% 55.2%
0%
10%
20%
30%
40%
50%
60%
70%
80%
2011 2012 2013 2014 2015 2016 2017 2018 2019 2020
Tenu
re D
ensit
yTenure Density Trend
0
10
20
30
40
50
60
2011 2012 2013 2014 2015 2016 2017 2018 2019 2020
Ratio
Student/Faculty Ratio Trend
Student to TT Faculty Student to All Faculty
Data Source: October snapshot; Institutional Research and Analyses Fall Enrollment SummarySWHR Data Analysis: HS 3/29/2021

14 of 24
Students Lecturers Tenure-TrackAll Faculty (Lect + TT)
Student to TT Faculty
Student to All Faculty
Tenure Density (TT/All Fac)
2011 29,670.3 494.8 751.1 1,245.9 39.5 23.8 60.3%2012 29,180.4 506.3 776.9 1,283.2 37.6 22.7 60.5%2013 31,288.0 574.4 767.8 1,342.2 40.8 23.3 57.2%2014 32,513.3 619.6 760.4 1,380.0 42.8 23.6 55.1%2015 33,501.8 641.8 801.3 1,443.1 41.8 23.2 55.5%2016 32,255.4 643.9 793.4 1,437.3 40.7 22.4 55.2%2017 32,801.3 659.8 800.7 1,460.5 41.0 22.5 54.8%2018 32,409.0 629.3 815.1 1,444.4 39.8 22.4 56.4%2019 32,470.8 631.6 781.7 1,413.3 41.5 23.0 55.3%2020 33,092.6 583.3 780.2 1,363.5 42.4 24.3 57.2%
• FTEF reflects the sum of all appointments per campus for each included faculty member.
Notes:• Data as of Fall snapshots (employee and student) for each year.
• Student data includes students at all levels; excludes CalStateTEACH and International Programs.
Faculty Profile: Northridge
Fall Term
Full-Time Equivalents (FTE) Ratios
• Faculty data includes only lecturers and tenure/tenure-track instructors based on primary classification code; excludes faculty on leave.• Lecturer totals include visiting professors; tenure-track totals include grant-related instructional faculty
60.3% 60.5%57.2% 55.1% 55.5% 55.2% 54.8% 56.4% 55.3% 57.2%
0%
10%
20%
30%
40%
50%
60%
70%
80%
2011 2012 2013 2014 2015 2016 2017 2018 2019 2020
Tenu
re D
ensit
yTenure Density Trend
0
10
20
30
40
50
60
2011 2012 2013 2014 2015 2016 2017 2018 2019 2020
Ratio
Student/Faculty Ratio Trend
Student to TT Faculty Student to All Faculty
Data Source: October snapshot; Institutional Research and Analyses Fall Enrollment SummarySWHR Data Analysis: HS 3/29/2021

15 of 24
Students Lecturers Tenure-TrackAll Faculty (Lect + TT)
Student to TT Faculty
Student to All Faculty
Tenure Density (TT/All Fac)
2011 18,138.5 283.7 474.3 758.0 38.2 23.9 62.6%2012 18,984.5 292.5 490.5 783.0 38.7 24.2 62.6%2013 19,339.6 319.5 478.2 797.7 40.4 24.2 59.9%2014 20,518.5 361.0 502.9 863.9 40.8 23.8 58.2%2015 20,702.4 393.5 508.1 901.6 40.7 23.0 56.4%2016 22,077.9 393.0 535.0 928.0 41.3 23.8 57.7%2017 22,975.9 413.0 527.7 940.7 43.5 24.4 56.1%2018 23,078.2 432.9 521.4 954.3 44.3 24.2 54.6%2019 24,783.7 500.6 542.5 1,043.1 45.7 23.8 52.0%2020 26,202.5 477.4 563.6 1,041.0 46.5 25.2 54.1%
• FTEF reflects the sum of all appointments per campus for each included faculty member.
Notes:• Data as of Fall snapshots (employee and student) for each year.
• Student data includes students at all levels; excludes CalStateTEACH and International Programs.
Faculty Profile: Pomona
Fall Term
Full-Time Equivalents (FTE) Ratios
• Faculty data includes only lecturers and tenure/tenure-track instructors based on primary classification code; excludes faculty on leave.• Lecturer totals include visiting professors; tenure-track totals include grant-related instructional faculty
62.6% 62.6% 59.9% 58.2% 56.4% 57.7% 56.1% 54.6% 52.0% 54.1%
0%
10%
20%
30%
40%
50%
60%
70%
80%
2011 2012 2013 2014 2015 2016 2017 2018 2019 2020
Tenu
re D
ensit
yTenure Density Trend
0
10
20
30
40
50
60
2011 2012 2013 2014 2015 2016 2017 2018 2019 2020
Ratio
Student/Faculty Ratio Trend
Student to TT Faculty Student to All Faculty
Data Source: October snapshot; Institutional Research and Analyses Fall Enrollment SummarySWHR Data Analysis: HS 3/29/2021

16 of 24
Students Lecturers Tenure-TrackAll Faculty (Lect + TT)
Student to TT Faculty
Student to All Faculty
Tenure Density (TT/All Fac)
2011 23,423.8 298.8 631.4 930.2 37.1 25.2 67.9%2012 23,188.6 309.9 598.1 908.0 38.8 25.5 65.9%2013 23,768.3 356.1 592.4 948.5 40.1 25.1 62.5%2014 24,098.6 384.6 614.3 998.9 39.2 24.1 61.5%2015 25,173.2 417.9 613.2 1,031.1 41.1 24.4 59.5%2016 26,094.2 463.9 626.5 1,090.4 41.7 23.9 57.5%2017 26,413.8 464.3 662.6 1,126.9 39.9 23.4 58.8%2018 26,719.4 467.2 689.2 1,156.4 38.8 23.1 59.6%2019 27,144.0 498.7 700.4 1,199.1 38.8 22.6 58.4%2020 27,534.9 510.6 699.2 1,209.8 39.4 22.8 57.8%
• FTEF reflects the sum of all appointments per campus for each included faculty member.
Notes:• Data as of Fall snapshots (employee and student) for each year.
• Student data includes students at all levels; excludes CalStateTEACH and International Programs.
Faculty Profile: Sacramento
Fall Term
Full-Time Equivalents (FTE) Ratios
• Faculty data includes only lecturers and tenure/tenure-track instructors based on primary classification code; excludes faculty on leave.• Lecturer totals include visiting professors; tenure-track totals include grant-related instructional faculty
67.9% 65.9%62.5% 61.5% 59.5% 57.5% 58.8% 59.6% 58.4% 57.8%
0%
10%
20%
30%
40%
50%
60%
70%
80%
2011 2012 2013 2014 2015 2016 2017 2018 2019 2020
Tenu
re D
ensit
yTenure Density Trend
0
10
20
30
40
50
60
2011 2012 2013 2014 2015 2016 2017 2018 2019 2020
Ratio
Student/Faculty Ratio Trend
Student to TT Faculty Student to All Faculty
Data Source: October snapshot; Institutional Research and Analyses Fall Enrollment SummarySWHR Data Analysis: HS 3/29/2021

17 of 24
Students Lecturers Tenure-TrackAll Faculty (Lect + TT)
Student to TT Faculty
Student to All Faculty
Tenure Density (TT/All Fac)
2011 15,113.8 208.2 373.7 581.9 40.4 26.0 64.2%2012 15,957.5 239.5 372.7 612.2 42.8 26.1 60.9%2013 16,107.5 249.2 380.5 629.7 42.3 25.6 60.4%2014 16,402.4 256.4 387.1 643.5 42.4 25.5 60.2%2015 17,465.3 301.5 384.0 685.5 45.5 25.5 56.0%2016 18,069.8 289.8 403.7 693.5 44.8 26.1 58.2%2017 17,966.6 303.5 396.4 699.9 45.3 25.7 56.6%2018 17,748.7 309.8 398.2 708.0 44.6 25.1 56.2%2019 18,319.5 332.4 406.8 739.2 45.0 24.8 55.0%2020 16,756.8 286.6 428.9 715.5 39.1 23.4 59.9%
• FTEF reflects the sum of all appointments per campus for each included faculty member.
Notes:• Data as of Fall snapshots (employee and student) for each year.
• Student data includes students at all levels; excludes CalStateTEACH and International Programs.
Faculty Profile: San Bernardino
Fall Term
Full-Time Equivalents (FTE) Ratios
• Faculty data includes only lecturers and tenure/tenure-track instructors based on primary classification code; excludes faculty on leave.• Lecturer totals include visiting professors; tenure-track totals include grant-related instructional faculty
64.2%60.9% 60.4% 60.2%
56.0% 58.2% 56.6% 56.2% 55.0%59.9%
0%
10%
20%
30%
40%
50%
60%
70%
80%
2011 2012 2013 2014 2015 2016 2017 2018 2019 2020
Tenu
re D
ensit
yTenure Density Trend
0
10
20
30
40
50
60
2011 2012 2013 2014 2015 2016 2017 2018 2019 2020
Ratio
Student/Faculty Ratio Trend
Student to TT Faculty Student to All Faculty
Data Source: October snapshot; Institutional Research and Analyses Fall Enrollment SummarySWHR Data Analysis: HS 3/29/2021

18 of 24
Students Lecturers Tenure-TrackAll Faculty (Lect + TT)
Student to TT Faculty
Student to All Faculty
Tenure Density (TT/All Fac)
2011 27,462.0 336.5 742.7 1,079.2 37.0 25.4 68.8%2012 28,025.3 324.3 706.0 1,030.3 39.7 27.2 68.5%2013 28,982.1 371.3 690.2 1,061.5 42.0 27.3 65.0%2014 29,814.7 422.3 694.0 1,116.3 43.0 26.7 62.2%2015 30,764.7 443.6 703.1 1,146.7 43.8 26.8 61.3%2016 31,527.4 448.2 720.5 1,168.7 43.8 27.0 61.6%2017 31,811.9 473.9 718.5 1,192.4 44.3 26.7 60.3%2018 31,987.8 497.9 758.9 1,256.8 42.2 25.5 60.4%2019 32,169.2 512.2 774.1 1,286.3 41.6 25.0 60.2%2020 32,943.1 525.3 777.5 1,302.8 42.4 25.3 59.7%
• FTEF reflects the sum of all appointments per campus for each included faculty member.
Notes:• Data as of Fall snapshots (employee and student) for each year.
• Student data includes students at all levels; excludes CalStateTEACH and International Programs.
Faculty Profile: San Diego
Fall Term
Full-Time Equivalents (FTE) Ratios
• Faculty data includes only lecturers and tenure/tenure-track instructors based on primary classification code; excludes faculty on leave.• Lecturer totals include visiting professors; tenure-track totals include grant-related instructional faculty
68.8% 68.5%65.0% 62.2% 61.3% 61.6% 60.3% 60.4% 60.2% 59.7%
0%
10%
20%
30%
40%
50%
60%
70%
80%
2011 2012 2013 2014 2015 2016 2017 2018 2019 2020
Tenu
re D
ensit
yTenure Density Trend
0
10
20
30
40
50
60
2011 2012 2013 2014 2015 2016 2017 2018 2019 2020
Ratio
Student/Faculty Ratio Trend
Student to TT Faculty Student to All Faculty
Data Source: October snapshot; Institutional Research and Analyses Fall Enrollment SummarySWHR Data Analysis: HS 3/29/2021

19 of 24
Students Lecturers Tenure-TrackAll Faculty (Lect + TT)
Student to TT Faculty
Student to All Faculty
Tenure Density (TT/All Fac)
2011 24,782.0 348.2 731.2 1,079.4 33.9 23.0 67.7%2012 25,792.2 398.0 715.8 1,113.8 36.0 23.2 64.3%2013 25,119.9 414.5 726.6 1,141.1 34.6 22.0 63.7%2014 24,499.4 412.4 720.9 1,133.3 34.0 21.6 63.6%2015 24,850.0 422.6 719.0 1,141.6 34.6 21.8 63.0%2016 24,107.5 437.5 743.3 1,180.8 32.4 20.4 62.9%2017 24,887.7 450.3 730.3 1,180.6 34.1 21.1 61.9%2018 25,093.6 456.2 730.1 1,186.3 34.4 21.2 61.5%2019 24,582.9 500.8 735.2 1,236.0 33.4 19.9 59.5%2020 23,178.7 444.0 728.3 1,172.3 31.8 19.8 62.1%
• FTEF reflects the sum of all appointments per campus for each included faculty member.
Notes:• Data as of Fall snapshots (employee and student) for each year.
• Student data includes students at all levels; excludes CalStateTEACH and International Programs.
Faculty Profile: San Francisco
Fall Term
Full-Time Equivalents (FTE) Ratios
• Faculty data includes only lecturers and tenure/tenure-track instructors based on primary classification code; excludes faculty on leave.• Lecturer totals include visiting professors; tenure-track totals include grant-related instructional faculty
67.7%64.3% 63.7% 63.6% 63.0% 62.9% 61.9% 61.5% 59.5% 62.1%
0%
10%
20%
30%
40%
50%
60%
70%
80%
2011 2012 2013 2014 2015 2016 2017 2018 2019 2020
Tenu
re D
ensit
yTenure Density Trend
0
10
20
30
40
50
60
2011 2012 2013 2014 2015 2016 2017 2018 2019 2020
Ratio
Student/Faculty Ratio Trend
Student to TT Faculty Student to All Faculty
Data Source: October snapshot; Institutional Research and Analyses Fall Enrollment SummarySWHR Data Analysis: HS 3/29/2021

20 of 24
Students Lecturers Tenure-TrackAll Faculty (Lect + TT)
Student to TT Faculty
Student to All Faculty
Tenure Density (TT/All Fac)
2011 24,257.1 549.9 635.3 1,185.2 38.2 20.5 53.6%2012 24,530.0 515.0 640.8 1,155.8 38.3 21.2 55.4%2013 25,407.0 522.3 640.5 1,162.8 39.7 21.8 55.1%2014 26,525.0 547.3 627.0 1,174.3 42.3 22.6 53.4%2015 26,569.0 545.7 645.0 1,190.7 41.2 22.3 54.2%2016 26,659.8 555.6 674.3 1,229.9 39.5 21.7 54.8%2017 28,196.1 590.6 687.3 1,277.9 41.0 22.1 53.8%2018 27,978.8 602.1 695.8 1,297.9 40.2 21.6 53.6%2019 28,490.3 642.7 703.2 1,345.9 40.5 21.2 52.2%2020 28,599.2 652.5 729.7 1,382.2 39.2 20.7 52.8%
• FTEF reflects the sum of all appointments per campus for each included faculty member.
Notes:• Data as of Fall snapshots (employee and student) for each year.
• Student data includes students at all levels; excludes CalStateTEACH and International Programs.
Faculty Profile: San José
Fall Term
Full-Time Equivalents (FTE) Ratios
• Faculty data includes only lecturers and tenure/tenure-track instructors based on primary classification code; excludes faculty on leave.• Lecturer totals include visiting professors; tenure-track totals include grant-related instructional faculty
53.6% 55.4% 55.1% 53.4% 54.2% 54.8% 53.8% 53.6% 52.2% 52.8%
0%
10%
20%
30%
40%
50%
60%
70%
80%
2011 2012 2013 2014 2015 2016 2017 2018 2019 2020
Tenu
re D
ensit
yTenure Density Trend
0
10
20
30
40
50
60
2011 2012 2013 2014 2015 2016 2017 2018 2019 2020
Ratio
Student/Faculty Ratio Trend
Student to TT Faculty Student to All Faculty
Data Source: October snapshot; Institutional Research and Analyses Fall Enrollment SummarySWHR Data Analysis: HS 3/29/2021

21 of 24
Students Lecturers Tenure-TrackAll Faculty (Lect + TT)
Student to TT Faculty
Student to All Faculty
Tenure Density (TT/All Fac)
2011 17,952.1 262.8 630.5 893.3 28.5 20.1 70.6%2012 18,074.0 254.9 631.1 886.0 28.6 20.4 71.2%2013 19,006.9 288.3 623.6 911.9 30.5 20.8 68.4%2014 19,625.8 315.2 635.4 950.6 30.9 20.6 66.8%2015 20,240.6 345.6 654.5 1,000.1 30.9 20.2 65.4%2016 20,717.8 366.0 666.9 1,032.9 31.1 20.1 64.6%2017 21,527.6 381.6 680.6 1,062.2 31.6 20.3 64.1%2018 21,204.2 381.6 690.4 1,072.0 30.7 19.8 64.4%2019 20,697.6 388.4 697.9 1,086.3 29.7 19.1 64.2%2020 21,674.0 374.9 697.5 1,072.4 31.1 20.2 65.0%
• FTEF reflects the sum of all appointments per campus for each included faculty member.
Notes:• Data as of Fall snapshots (employee and student) for each year.
• Student data includes students at all levels; excludes CalStateTEACH and International Programs.
Faculty Profile: San Luis Obispo
Fall Term
Full-Time Equivalents (FTE) Ratios
• Faculty data includes only lecturers and tenure/tenure-track instructors based on primary classification code; excludes faculty on leave.• Lecturer totals include visiting professors; tenure-track totals include grant-related instructional faculty
70.6% 71.2% 68.4% 66.8% 65.4% 64.6% 64.1% 64.4% 64.2% 65.0%
0%
10%
20%
30%
40%
50%
60%
70%
80%
2011 2012 2013 2014 2015 2016 2017 2018 2019 2020
Tenu
re D
ensit
yTenure Density Trend
0
10
20
30
40
50
60
2011 2012 2013 2014 2015 2016 2017 2018 2019 2020
Ratio
Student/Faculty Ratio Trend
Student to TT Faculty Student to All Faculty
Data Source: October snapshot; Institutional Research and Analyses Fall Enrollment SummarySWHR Data Analysis: HS 3/29/2021

22 of 24
Students Lecturers Tenure-TrackAll Faculty (Lect + TT)
Student to TT Faculty
Student to All Faculty
Tenure Density (TT/All Fac)
2011 8,336.2 170.4 232.2 402.6 35.9 20.7 57.7%2012 8,613.4 181.7 229.0 410.7 37.6 21.0 55.8%2013 9,395.1 203.9 229.8 433.7 40.9 21.7 53.0%2014 10,154.6 223.0 239.5 462.5 42.4 22.0 51.8%2015 10,709.0 248.0 251.6 499.6 42.6 21.4 50.4%2016 10,924.4 253.3 262.9 516.2 41.6 21.2 50.9%2017 11,671.7 286.4 282.2 568.6 41.4 20.5 49.6%2018 12,288.4 292.5 286.4 578.9 42.9 21.2 49.5%2019 12,389.2 285.0 287.5 572.5 43.1 21.6 50.2%2020 12,687.6 297.5 280.7 578.2 45.2 21.9 48.5%
• FTEF reflects the sum of all appointments per campus for each included faculty member.
Notes:• Data as of Fall snapshots (employee and student) for each year.
• Student data includes students at all levels; excludes CalStateTEACH and International Programs.
Faculty Profile: San Marcos
Fall Term
Full-Time Equivalents (FTE) Ratios
• Faculty data includes only lecturers and tenure/tenure-track instructors based on primary classification code; excludes faculty on leave.• Lecturer totals include visiting professors; tenure-track totals include grant-related instructional faculty
57.7% 55.8% 53.0% 51.8% 50.4% 50.9% 49.6% 49.5% 50.2% 48.5%
0%
10%
20%
30%
40%
50%
60%
70%
80%
2011 2012 2013 2014 2015 2016 2017 2018 2019 2020
Tenu
re D
ensit
yTenure Density Trend
0
10
20
30
40
50
60
2011 2012 2013 2014 2015 2016 2017 2018 2019 2020
Ratio
Student/Faculty Ratio Trend
Student to TT Faculty Student to All Faculty
Data Source: October snapshot; Institutional Research and Analyses Fall Enrollment SummarySWHR Data Analysis: HS 3/29/2021

23 of 24
Students Lecturers Tenure-TrackAll Faculty (Lect + TT)
Student to TT Faculty
Student to All Faculty
Tenure Density (TT/All Fac)
2011 8,075.7 101.9 244.8 346.7 33.0 23.3 70.6%2012 8,133.4 114.0 234.2 348.2 34.7 23.4 67.3%2013 8,378.2 133.1 220.5 353.6 38.0 23.7 62.4%2014 8,468.9 147.1 217.6 364.7 38.9 23.2 59.7%2015 8,563.4 147.3 224.8 372.1 38.1 23.0 60.4%2016 8,605.4 153.7 232.8 386.5 37.0 22.3 60.2%2017 8,646.2 149.3 245.9 395.2 35.2 21.9 62.2%2018 8,673.5 156.5 247.1 403.6 35.1 21.5 61.2%2019 8,250.1 147.2 254.7 401.9 32.4 20.5 63.4%2020 7,428.6 115.3 250.6 365.9 29.6 20.3 68.5%
• FTEF reflects the sum of all appointments per campus for each included faculty member.
Notes:• Data as of Fall snapshots (employee and student) for each year.
• Student data includes students at all levels; excludes CalStateTEACH and International Programs.
Faculty Profile: Sonoma
Fall Term
Full-Time Equivalents (FTE) Ratios
• Faculty data includes only lecturers and tenure/tenure-track instructors based on primary classification code; excludes faculty on leave.• Lecturer totals include visiting professors; tenure-track totals include grant-related instructional faculty
70.6%67.3%
62.4% 59.7% 60.4% 60.2% 62.2% 61.2% 63.4%68.5%
0%
10%
20%
30%
40%
50%
60%
70%
80%
2011 2012 2013 2014 2015 2016 2017 2018 2019 2020
Tenu
re D
ensit
yTenure Density Trend
0
10
20
30
40
50
60
2011 2012 2013 2014 2015 2016 2017 2018 2019 2020
Ratio
Student/Faculty Ratio Trend
Student to TT Faculty Student to All Faculty
Data Source: October snapshot; Institutional Research and Analyses Fall Enrollment SummarySWHR Data Analysis: HS 3/29/2021
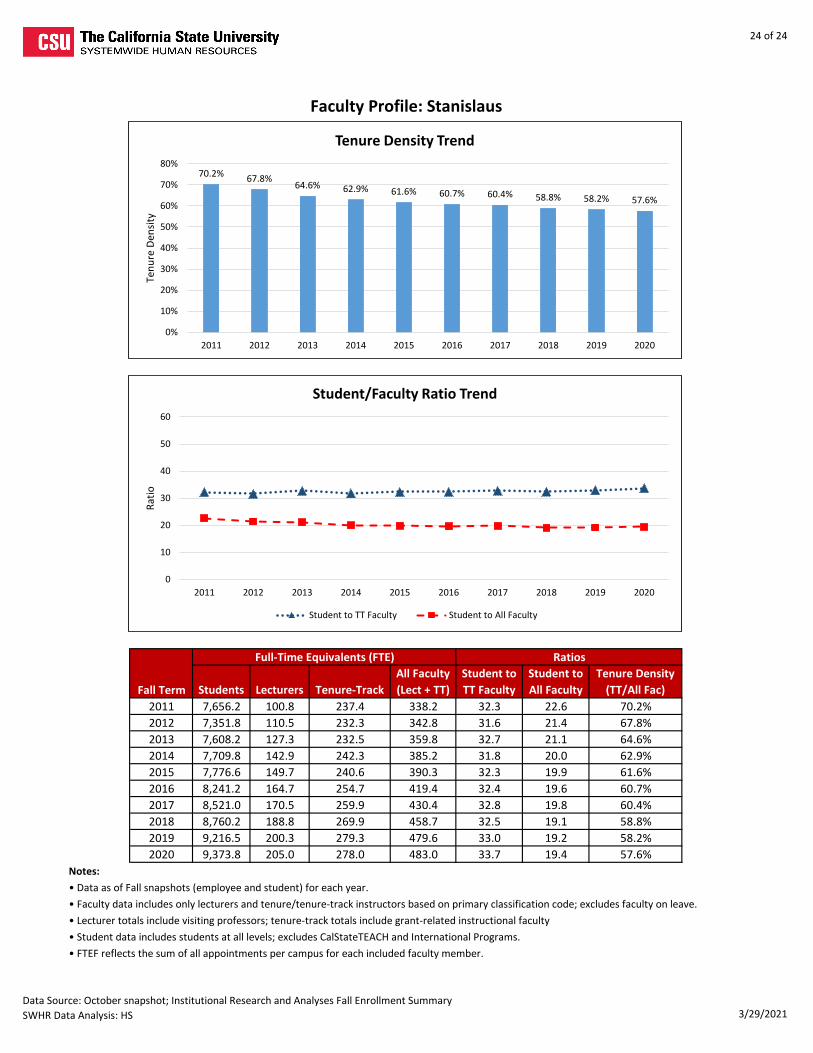
24 of 24
Students Lecturers Tenure-TrackAll Faculty (Lect + TT)
Student to TT Faculty
Student to All Faculty
Tenure Density (TT/All Fac)
2011 7,656.2 100.8 237.4 338.2 32.3 22.6 70.2%2012 7,351.8 110.5 232.3 342.8 31.6 21.4 67.8%2013 7,608.2 127.3 232.5 359.8 32.7 21.1 64.6%2014 7,709.8 142.9 242.3 385.2 31.8 20.0 62.9%2015 7,776.6 149.7 240.6 390.3 32.3 19.9 61.6%2016 8,241.2 164.7 254.7 419.4 32.4 19.6 60.7%2017 8,521.0 170.5 259.9 430.4 32.8 19.8 60.4%2018 8,760.2 188.8 269.9 458.7 32.5 19.1 58.8%2019 9,216.5 200.3 279.3 479.6 33.0 19.2 58.2%2020 9,373.8 205.0 278.0 483.0 33.7 19.4 57.6%
• FTEF reflects the sum of all appointments per campus for each included faculty member.
Notes:• Data as of Fall snapshots (employee and student) for each year.
• Student data includes students at all levels; excludes CalStateTEACH and International Programs.
Faculty Profile: Stanislaus
Fall Term
Full-Time Equivalents (FTE) Ratios
• Faculty data includes only lecturers and tenure/tenure-track instructors based on primary classification code; excludes faculty on leave.• Lecturer totals include visiting professors; tenure-track totals include grant-related instructional faculty
70.2% 67.8%64.6% 62.9% 61.6% 60.7% 60.4% 58.8% 58.2% 57.6%
0%
10%
20%
30%
40%
50%
60%
70%
80%
2011 2012 2013 2014 2015 2016 2017 2018 2019 2020
Tenu
re D
ensit
yTenure Density Trend
0
10
20
30
40
50
60
2011 2012 2013 2014 2015 2016 2017 2018 2019 2020
Ratio
Student/Faculty Ratio Trend
Student to TT Faculty Student to All Faculty
Data Source: October snapshot; Institutional Research and Analyses Fall Enrollment SummarySWHR Data Analysis: HS 3/29/2021