Faculty of Islamic Economics and Business-State Islamic University ...
14
Global Review of Islamic Economics and Business, Vol. 1, No.1 (2013) 071-084 Faculty of Islamic Economics and Business-State Islamic University Sunan Kalijaga Yogyakarta ISSN 2338-7920 (O) / 2338-2619 (P) Relationship between Islamic Stock Prices and Macroeconomic Variables: Evidence from Jakarta Stock Exchange Islamic Index 1 Muhammad Rizky Prima Sakti, 2 MD.Yousuf Harun 1 Kulliyah of Economic and Management Sciences IIUM 2 Master of Science in Finance, IIUM. Khazanah Asia Scholars. Former Investment Analyst at IDLC Investments Ltd in Bangladesh Abstract: This paper attempts to analyze the relationship between Jakarta Stock Exchange Islamic Index (JII) and selected macroeconomic variables namely exchange rate, industrial production, inflation rate, and money supply. We used monthly data from January 2000 to December 2010.The methodology used in this paper is time series techniques of co-integration and vector autoregression (VAR). In the analysis, we rely on variance decompositions and impulse-response functions to capture the strength of interactions among variables. The results revealed that there is co-integration between Islamic stock prices and macroeconomic variables. Specifically, Indonesian Islamic stock market are driven more by domestic factors. These macroeconomic factors considered to be emphasized as the policy instruments by the governments in order to stabilize Islamic stock prices. Keywords: Jakarta Stock Exchange Islamic Index (JII), Islamic Stock Prices, Macroeconomic Variables, Vector Autoregression (VAR) Introduction Indonesia is one of the countries that is most resilience toward global financial crisis. Indonesia was the least exposed and has larger capacity to bring in stimulus measures should the world economy meltdown due to its large domestic economy. The impact of the crisis was much weaker than during 1997 financial crisis. Overall growth rate for 2008 was 6.2 percent, slightly decreased from 6.3 percent in 2007, and further declined to around 4.2 percent in 2009. For the recent GDP in year 2011, it was $ 846.8 billion. In addition, the Indonesian economy strengthened in 2011 with real GDP expanding by 6.5%. The table below shows a clear picture of Indonesia economy from certain periods. Table 1: Comparison of GDP, Exchange Rate, and Inflation by Years Source: World Bank Database Year GDP (in million) Exchange Rate (Rp/US$) CPI Index 2005 439,484 9,830 89.55 2006 466,101 9,020 95.46 2007 493,332 9,419 102.55 2008 519,392 10,950 113.78 2009 561,637 9,400 117.03 2010 585,812 8,891 125.17
-
Upload
phungthien -
Category
Documents
-
view
220 -
download
1
Transcript of Faculty of Islamic Economics and Business-State Islamic University ...
Global Review of Islamic Economics and Business, Vol. 1, No.1 (2013) 071-084
Faculty of Islamic Economics and Business-State Islamic University Sunan Kalijaga Yogyakarta ISSN 2338-7920 (O) / 2338-2619 (P)
Relationship between Islamic Stock Prices and Macroeconomic Variables:
Evidence from Jakarta Stock Exchange Islamic Index
1 Muhammad Rizky Prima Sakti,
2MD.Yousuf Harun
1Kulliyah of Economic and Management Sciences IIUM
2Master of Science in Finance, IIUM. Khazanah Asia Scholars. Former Investment Analyst at
IDLC Investments Ltd in Bangladesh
Abstract: This paper attempts to analyze the relationship between Jakarta Stock Exchange
Islamic Index (JII) and selected macroeconomic variables namely exchange rate, industrial
production, inflation rate, and money supply. We used monthly data from January 2000 to
December 2010.The methodology used in this paper is time series techniques of co-integration
and vector autoregression (VAR). In the analysis, we rely on variance decompositions and
impulse-response functions to capture the strength of interactions among variables. The results
revealed that there is co-integration between Islamic stock prices and macroeconomic variables.
Specifically, Indonesian Islamic stock market are driven more by domestic factors. These
macroeconomic factors considered to be emphasized as the policy instruments by the
governments in order to stabilize Islamic stock prices.
Keywords: Jakarta Stock Exchange Islamic Index (JII), Islamic Stock Prices, Macroeconomic
Variables, Vector Autoregression (VAR)
Introduction
Indonesia is one of the countries that is most resilience toward global financial crisis.
Indonesia was the least exposed and has larger capacity to bring in stimulus measures should the
world economy meltdown due to its large domestic economy. The impact of the crisis was
much weaker than during 1997 financial crisis. Overall growth rate for 2008 was 6.2 percent,
slightly decreased from 6.3 percent in 2007, and further declined to around 4.2 percent in 2009.
For the recent GDP in year 2011, it was $ 846.8 billion. In addition, the Indonesian economy
strengthened in 2011 with real GDP expanding by 6.5%. The table below shows a clear picture
of Indonesia economy from certain periods.
Table 1: Comparison of GDP, Exchange Rate, and Inflation by Years
Source: World Bank Database
Year GDP (in million) Exchange Rate (Rp/US$) CPI Index
2005 439,484 9,830 89.55
2006 466,101 9,020 95.46
2007 493,332 9,419 102.55
2008 519,392 10,950 113.78
2009 561,637 9,400 117.03
2010 585,812 8,891 125.17
72 Sakti and Yousuf: Relationship between Islamic Stock Prices and Macroeconomic Variables: Evidence from Jakarta Stock Exchange Islamic Index
The economy was still showing some resilience toward the crisis; however, in the final
quarter of 2008, Indonesia economic performance began to show signs of impact from global
financial downturn. One of the institutions that affected was Indonesian stock market. The
equity market plummeted reversing all gains that took place between 2005 and 2008. The
exchange rate depreciated significantly. The market capitalization of Jakarta Stock Exchange
Composite Index (JCI) fell by 54 percent in 2008. Market price index also fell by 10.38 percent.
Furthermore, not only conventional capital market experienced this effect, Islamic capital
market counterpart was also experienced the same condition. The market capitalization of
Jakarta Stock Exchange Islamic Index (JII) fell by 61 percent in 2008, while the market price
index declined by 22 percent during the same period (Source: Bloomberg).
Jakarta Stock Exchange Islamic Index (JII) is stock market index that consists of
companies whereby their business activities in accordance with the provisions of Islamic stocks
regulated by National Shariah Board. Companies involved in JII must do not engaged with riba
(interest), gharar (speculation), and maisyir (gambling) activities. Companies also required such
filters criteria’s, for instance leverage ratios, interest, and income from non-halal activities
which is allowing JII differentiate as compared to conventional capital market counterparts. The
JII may not list equities that produce or distribute food, drink, or morally harmful items that
stand in contradiction with Islamic values. JII was established in year 2000 as a benchmark for
Islamic stock market which would provide as an accurate performance indicator of the Islamic
stock market of Indonesia as well as the country economy. It contains 30 companies which
comprise of multi-sectors companies across the year 2000-2008.
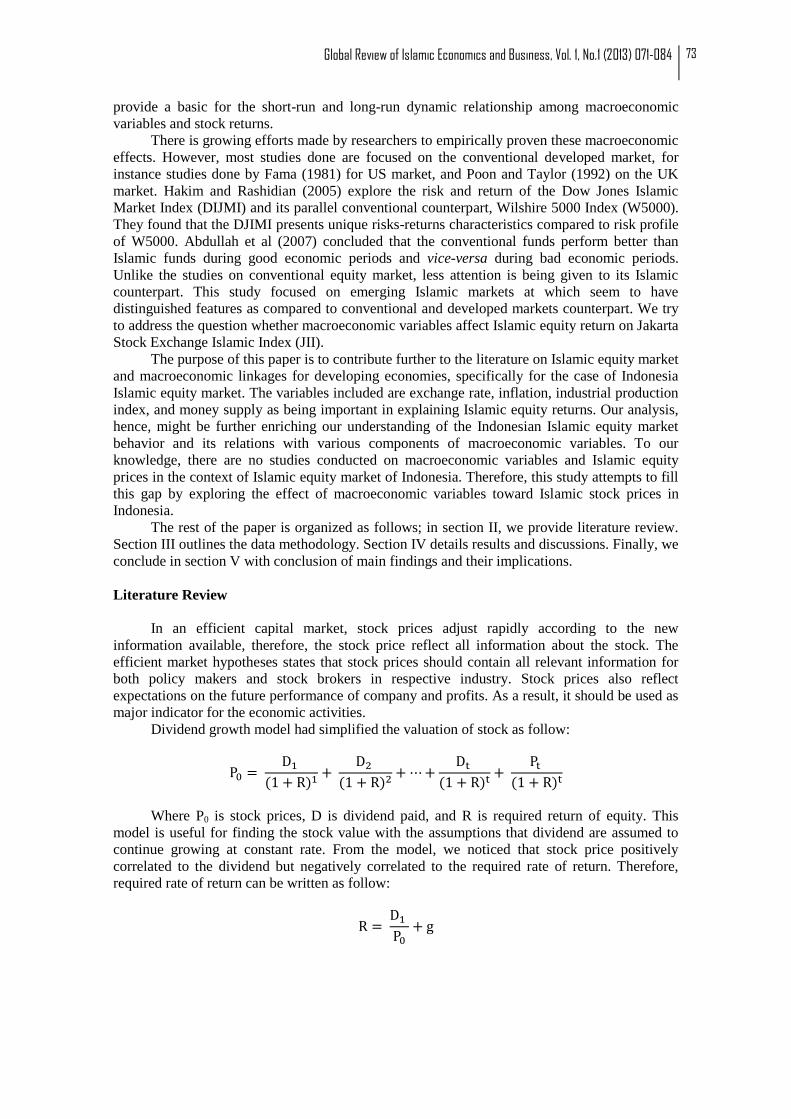
Prior to global financial crisis happened in September 2008, the performance of JII was at
the peak level. However, as we can see from the graph, the JII point declined substantially at
300 points from year 2007 to 2008 due to financial meltdown. There were some changes in the
JII during the post crisis. The JII achieved 483 point at the final quarter of 2010 after the
climbing up from the financial crisis. The rationale behind this, perhaps, due to the significant
growth during the year as resulted in large domestic economy.
Figure 1. Trend of Jakarta Stock Exchange Islamic Index (JII)
Source: Bloomberg
The dynamic linkage between macroeconomic variables and stock returns is well
established theory in financial economics literature. Based on the stock valuation model,
macroeconomic forces might have systematic influences on stock prices via their influence on
discounted future cash flows. Alternatively, the relationship between them might be triggered
using the arbitrage pricing theory (APT) model developed by Ross (1976). Moreover, Friedman
(1988) argued that the standard aggregate demand and aggregate supply framework also allows
for the roles of equity markets in term of specification of money demand. Thus, these models
Global Review of Islamic Economics and Business, Vol. 1, No.1 (2013) 071-084
73
provide a basic for the short-run and long-run dynamic relationship among macroeconomic
variables and stock returns.
There is growing efforts made by researchers to empirically proven these macroeconomic
effects. However, most studies done are focused on the conventional developed market, for
instance studies done by Fama (1981) for US market, and Poon and Taylor (1992) on the UK
market. Hakim and Rashidian (2005) explore the risk and return of the Dow Jones Islamic
Market Index (DIJMI) and its parallel conventional counterpart, Wilshire 5000 Index (W5000).
They found that the DJIMI presents unique risks-returns characteristics compared to risk profile
of W5000. Abdullah et al (2007) concluded that the conventional funds perform better than
Islamic funds during good economic periods and vice-versa during bad economic periods.
Unlike the studies on conventional equity market, less attention is being given to its Islamic
counterpart. This study focused on emerging Islamic markets at which seem to have
distinguished features as compared to conventional and developed markets counterpart. We try
to address the question whether macroeconomic variables affect Islamic equity return on Jakarta
Stock Exchange Islamic Index (JII).
The purpose of this paper is to contribute further to the literature on Islamic equity market
and macroeconomic linkages for developing economies, specifically for the case of Indonesia
Islamic equity market. The variables included are exchange rate, inflation, industrial production
index, and money supply as being important in explaining Islamic equity returns. Our analysis,
hence, might be further enriching our understanding of the Indonesian Islamic equity market
behavior and its relations with various components of macroeconomic variables. To our
knowledge, there are no studies conducted on macroeconomic variables and Islamic equity
prices in the context of Islamic equity market of Indonesia. Therefore, this study attempts to fill
this gap by exploring the effect of macroeconomic variables toward Islamic stock prices in
Indonesia.
The rest of the paper is organized as follows; in section II, we provide literature review.
Section III outlines the data methodology. Section IV details results and discussions. Finally, we
conclude in section V with conclusion of main findings and their implications.
Literature Review
In an efficient capital market, stock prices adjust rapidly according to the new
information available, therefore, the stock price reflect all information about the stock. The
efficient market hypotheses states that stock prices should contain all relevant information for
both policy makers and stock brokers in respective industry. Stock prices also reflect
expectations on the future performance of company and profits. As a result, it should be used as
major indicator for the economic activities.
Dividend growth model had simplified the valuation of stock as follow:
Where P0 is stock prices, D is dividend paid, and R is required return of equity. This
model is useful for finding the stock value with the assumptions that dividend are assumed to
continue growing at constant rate. From the model, we noticed that stock price positively
correlated to the dividend but negatively correlated to the required rate of return. Therefore,
required rate of return can be written as follow:
74 Sakti and Yousuf: Relationship between Islamic Stock Prices and Macroeconomic Variables: Evidence from Jakarta Stock Exchange Islamic Index
The rate of return for constant growth stock consists of two components which are
dividend yield and capital gains yield. The former can be thought of as the rate of return for a
stock whose dividend is constant, an investor who purchased a share of common stock for price
, and who received constant dividend of D1, would be receiving a perpetuity whose yield is
equal to D1/P0.
There have been many attempts in the past to figure out relationship between stock
returns and macroeconomic variables. Maysami and Koh (2000) examine the dynamic relations
between macroeconomic variables (exchange rate, long and short term interest rate, inflation,
money supply, and industrial production) and Singapore stock markets using vector error
correction model (VECM) which covered the period from 1988 to 1995. They found that all
macroeconomic variables have cointegrating relations with the changes in Singapore stock
market levels. Ibrahim and Yusoff (2001) examined the Malaysian equity market and macroeconomic
variables. Using cointegration and vector autoregression (VAR) method with monthly data of
Malaysian stock market index from year 1978 to September 1992, they found that long-run
relationship between macroeconomic variables and the stock prices and substantial short-run
interactions among them. The exchange rate, however, is negatively associated with the stock
prices. While Hakim and Rashidian (2005) explore the risk and return of the Dow Jones Islamic
Market Index (DIJMI) and its parallel conventional counterpart, Wilshire 5000 Index (W5000).
They found that the DJIMI presents unique risks-returns characteristics compared to risk profile
of W5000. Humpe and Macmillan (2007) study the influence of macroeconomic variables on stock
prices in the context of US and Japan. They found that for US are consistent with single
cointegrating vector, where stock prices are positively related to industrial production and
money supply, yet negatively related to both consumer price index and long term interest.
However for Japanese data, they found two cointegrating vectors. One vectors that stock prices
are influenced positively by industrial production and negatively by the money supply. For the
second cointegrating vector they found industrial production to be negatively influenced by
consumer price index and a long term interest rate. Asmy et al (2009) studied on effects of macroeconomic variables on stock prices in
Malaysia. Selected macroeconomic variables are inflation, money supply, and nominal effective
exchange rate during pre and post crisis from 1987 untill 1995 and from 1999 until 2007 by
using monthly data. They used time series econometric techniques, for instance, unit root test,
cointegration test, error correction model (ECM), variance decomposition, and impulse response
function. They found that there is cointegration between stock prices and macroeconomic
variables. Inflation, money supply and exchange rate seem to significantly affect KLCI.
Shabri and Rosylin (2009) studied on long-run relationship between Islamic stock returns
and macroeconomic variables using autoregressive distributed lag model (ARDL). The results
suggest that real effective exchange rate, money supply M3, treasury bill rate (TBR), and
federal fund rate (FFR) seem to be suitable target to focus on, in order to stabilize the Islamic
stock market and to encourage more capital flows into the market. They also stated that when
interest rate raised either domestically (TBR) or internationally (FFR), the Muslim investors
will buy more Shariah compliant stocks, thereby escalating the Islamic stock prices. From the discussion above, it seems that there are a number of studies on the
macroeconomic variables and its impacts on stock return. However, there are few studies that
try to explore relationship between Islamic equity return and macroeconomic variables.
Therefore, we find interesting to investigate these effects and their relationship for Indonesian
context. We analyze the relationship between macroeconomic variables and Islamic equity
return on JII.
Global Review of Islamic Economics and Business, Vol. 1, No.1 (2013) 071-084
75
Data and Methodology
This study investigates empirically the relationship between macroeconomic variables
and Islamic equity returns on Jakarta Stock Exchange Islamic Index (JII). It is argues that there
is causal relationship between macroeconomic variables and Islamic stock prices. The data
retrieved from Bloomberg are Islamic stock prices (JII), exchange rates (ER), Consumer Price
Index (CPI), industrial production index (IP), and M2 money supply (M2). We are using
monthly time series data, covering 10 years period from January 2000 to December 2010. For
JII, we use end of the month values of JII price index. For the inflation, we use CPI (consumer
price index) as a proxy to inflation. Real output is measured by real industrial production index
(IP). The M2 money supply is used as the money supply variable and is expressed in the
domestic currency, Indonesian Rupiah. The ER represented by employing nominal effective
exchange rate, the bilateral exchange rate with reference to US$. The JII is used as it
encompasses the Islamic stocks traded in Indonesia.
In this paper, time series analysis of co-integration and vector autoregression (VAR) will
be utilized for assessment of macroeconomic variables and Islamic equity returns on Jakarta
Stock Exchange Islamic Index (JII). The VAR model is well suited for the purposes of
evaluating the strength and the direction of the transmission of shocks across the markets. This
paper hypothesis to answer the following question: “Is Islamic stock prices driven by
macroeconomic variables in case of Indonesia?” Therefore, hypotheses developed in this study
are:
H1 : Islamic stock prices on Jakarta Stock Exchange Islamic Index is determined by
exchange rates; (ER);
H2 : Islamic stock prices on Jakarta Stock Exchange Islamic Index is determined by real
industrial production index (IP)
H3 : Islamic stock prices on Jakarta Stock Exchange Islamic Index is determined by inflation;
H4 : Islamic stock prices on Jakarta Stock Exchange Islamic Index is determined by M2
money supply;
Our model examines the impacts of macroeconomic variables on Islamic stock prices on
Jakarta Stock Exchange Islamic Index. In the model, Islamic stock price is a function of its
macroeconomic variables. First of all, we assume that Islamic stock price (JII) is a function of
its macroeconomic variables expressed by equation (1):
Secondly, the relationship between LRJII and its macroeconomic variables is expressed
by following equation (2)
Where:
JIIt = Islamic stock prices on JII at time t
ERt = Exchange rates against USD at time t
= industrial production index at time t
CPIt = Consumer price index as a proxy for inflation at time t
M2t = M2 money supply at time t
𝛆t = Random error term
Unit Root Test: We test for the stationary of the variables in order to avoid the spurious results.
Time series is considered as stationary if a series is mean-reverting, that is, the series repeatedly
returns back to its mean and does not have tendency to drift. Therefore, if the mean and variance
of the series are constant overtime, while the value of the covariance between the two periods

76 Sakti and Yousuf: Relationship between Islamic Stock Prices and Macroeconomic Variables: Evidence from Jakarta Stock Exchange Islamic Index
depends only on the gap between the periods and not on the actual time at which the covariance
is considered, then the series is considered stationary. However, if one or more of the above
mentioned conditions are not fulfilled, then the series is non-stationary.
There are several methods for testing the presence of unit roots. The most widely used is
that Augmented Dickey-Fuller (ADF). ADF is applied when the error term 𝛆it are correlated.
ADF performed by adding the lagged values of the dependent variable . The null hypothesis
for ADF test for unit root test is 𝜶1= 0. The following regression for ADF test purpose is
expressed by equation:
∑
Where is a white noise error term and = ( and so on are the number
of lagged difference term which is empirically determined (Gujarati, 2010). Aside from that,
Philips-Perron (PP) has developed a more comprehensive theory of unit root non-stationarity.
The test looks like similar with ADF test; however, they incorporate an automatic correction to
DF procedure to allow for auto-correlated residuals. To some extent, the test often gives the
same conclusions as the ADF test (Brooks, 2008).
Johansen Juselius Co-integration test: Co-integration means that even though variables are not
stationary individually; the linear combination between two or more variables might be
stationary. In other words, this analysis is to determine whether the time series of these variables
display a stationary process in a linear combination. In order to test the co-integration, Johansen
co-integration method is employed. When two or more variables are co-integrated, they will
show the existence of long term relationship if the variables contain mutual stochastic trend. If
this is the case, there exist at least one Granger’s causality either one or bi-directional (feedback
effect).
The Johansen and Juselius method used to tests to determine the number of co-integrating
vectors, namely “likelihood ratio trace test-LRT” and the “maximum eigen value-ME”. The
likelihood trace statistics expressed as:
∑
For this null hypotheses, it is said that the number of co-integrating vectors is less than or
equal to r, in which r is 0, 1, 2, 3…..so on. The alternative hypothesis against this is that r=n.
Meanwhile the maximum Eigen value can be expressed as:
The null hypothesis is that the existence of r co-integrating vector and alternative
hypothesis is r+1 co-integrating vectors.
Granger Causality Tests: The short run relationships between dependent variable and each of
the variables can be tested by using Granger causality tests. A test of causality is to know
whether the lags of one variable enter into the equation for another variable. There are two
important steps involved with Granger causality test. First, stationary data is needed rather than
non-stationary data, the Granger methodology is somewhat sensitive to the length used. So for
selecting the appropriate lag length for our purposes, there are various lag length criteria
available. For our purpose we use Schwarz information criteria, final prediction error,
Likelihood ratio test, etc.
Global Review of Islamic Economics and Business, Vol. 1, No.1 (2013) 071-084
77
Vector autoregressions (VAR): Our empirical method is based on recent standard method of
cointegration and vector autoregressions (VAR). This approach is chosen because VAR
modeling places no a priori structural restrictions and provides good approximation to the data
generation process of vector time series variables when sufficient lags are included. Moreover,
the model captures empirical regularities in the data in an unrestricted fashion. Lastly, from
variance decomposition and impulse response function generated from VAR, we might have
insight on the strength and direction of transmission of shocks in the system.
The VAR model may be written as:
Where;
A(L) = matrix of polynomials in the lag operators,
X = vector consisting of appropriately transformed variables,
U = vector of innovations to these variables.
Variance Decomposition and Impulse Response Function: Once the VAR model is estimated,
then we employ the short run dynamic analysis called impulse response function and variance
decomposition. Both analyses allow us to investigate the behavior of an error shock to each
variable on its own future dynamics as well as on the future dynamics of the other variables in
the VAR system. Meanwhile, variance decomposition is used to detect the causal relations
among the variables. It is explains the degree at which the variable is explained by the shocks in
all variables in the VAR system. Response function is used to detect the dynamic interaction
among variables. For computing impulse response function, it is necessary that variables in the
system, are in ordered and that a moving average process represents the system.
Results
Unit Root Tests
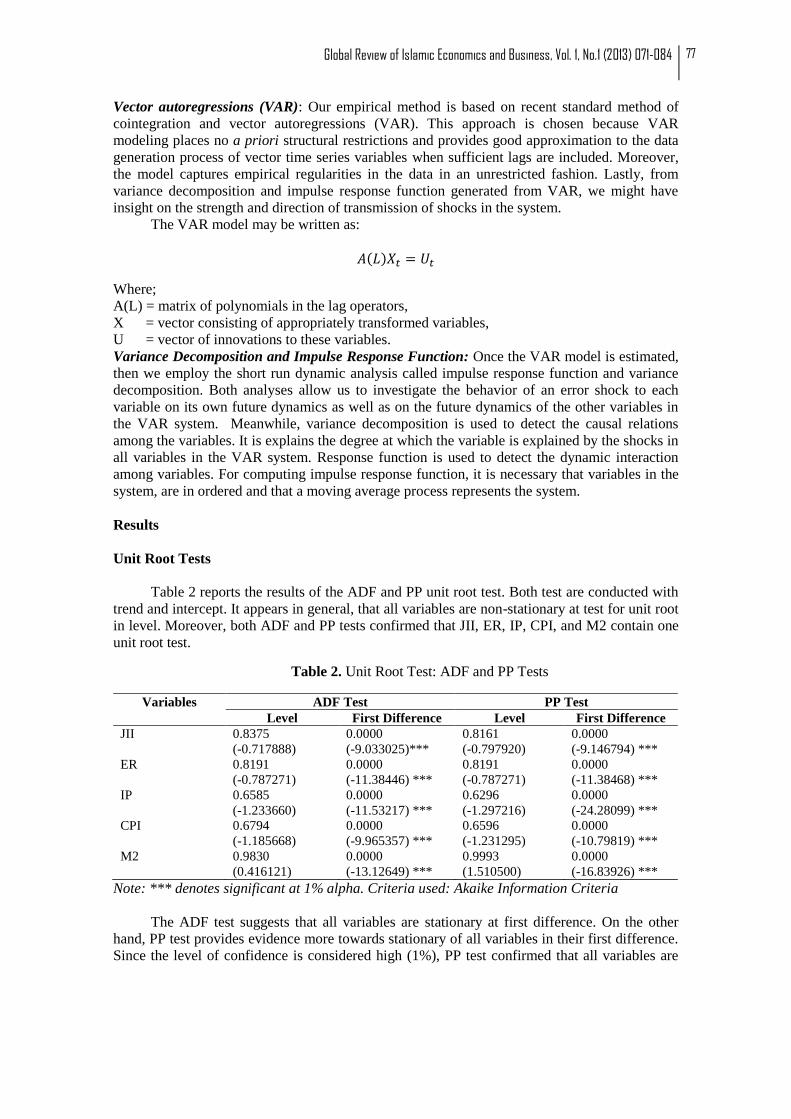
Table 2 reports the results of the ADF and PP unit root test. Both test are conducted with
trend and intercept. It appears in general, that all variables are non-stationary at test for unit root
in level. Moreover, both ADF and PP tests confirmed that JII, ER, IP, CPI, and M2 contain one
unit root test.
Table 2. Unit Root Test: ADF and PP Tests
Variables ADF Test PP Test
Level First Difference Level First Difference
JII 0.8375
(-0.717888)
0.0000
(-9.033025)***
0.8161
(-0.797920)
0.0000
(-9.146794) ***
ER 0.8191
(-0.787271)
0.0000
(-11.38446) ***
0.8191
(-0.787271)
0.0000
(-11.38468) ***
IP 0.6585
(-1.233660)
0.0000
(-11.53217) ***
0.6296
(-1.297216)
0.0000
(-24.28099) ***
CPI 0.6794
(-1.185668)
0.0000
(-9.965357) ***
0.6596
(-1.231295)
0.0000
(-10.79819) ***
M2 0.9830
(0.416121)
0.0000
(-13.12649) ***
0.9993
(1.510500)
0.0000
(-16.83926) ***
Note: *** denotes significant at 1% alpha. Criteria used: Akaike Information Criteria
The ADF test suggests that all variables are stationary at first difference. On the other
hand, PP test provides evidence more towards stationary of all variables in their first difference.
Since the level of confidence is considered high (1%), PP test confirmed that all variables are

78 Sakti and Yousuf: Relationship between Islamic Stock Prices and Macroeconomic Variables: Evidence from Jakarta Stock Exchange Islamic Index
stationary at first difference. The unit root tests revealed that all variables observed, are seemly
integrated of order of 1 or I(1). Since the level of confidence is considered high (1%), ADF and
PP test confirmed that all variables are stationary at first difference. Thus, using the Johansen
Juselius co-integration test is appropriate in this study.
Co-integration test
Having concluded that each of the series is stationary, and then we go further to assess
whether there exists a long-run equilibrium between variables selected. Table 3 provides the
results of the Johansen co-integration test, as well as the trace and maximum eigenvalue tests.
We set the lag length equal to 2 which using the Akaike Information Criterion (AIC) whereas
we found sufficient to render the error term serially uncorrelated in conducting the test. An
overview of the overall resulted is showed in table 3 below.
Table 3. Johansen-Juselius Cointegration Tests
Null Hypothesis Trace Max.eigenvalue Variables Long run
Coefficient
r = 0 86.52473 ** 38.88271** JII 1.0000
r ≤ 1 47.64202 23.51857 ER 0.191006
r ≤ 2 24.12345 13.38711 IP 27.40417
r ≤ 3 10.73634 10.62435 CPI -2.961316
r ≤ 4 0.111993 0.111993 M2 -0.000230
Notes: ** denote significant at 5% alpha
According to above co-integration results, we find enough evidence that all variables are
co-integrated at 5% significance level. The trace statistic indicates the presence of one co-
integrating vectors. While maximum eigenvalue statistics also indicates similar facts whereby
there is one co-integrating vectors existed. From these results, we conclude that there is a unique
co-integrating vector governing the long run association among variables. In other words, we
might say that all macroeconomic factors and JII stock prices are co-integrated having tested by
Johansen-Juselius tests. These variables are tied together in the long run and their deviations
from the long run equilibrium path will be corrected. The presence of co-integration also rules
out non-causality among the variables.
The long run relationship between JII and exchange rates are positive relationship. As for
exchange rates, the result shows that currency depreciation seems to be associated with increase
in JII. Theoretically, currency depreciation may have either positive or negative relationship
with stock prices depend on the nature of economy. In the context of net-exporting economies,
currency depreciation leads to an increase in net exports as domestic products become cheaper
in the world market. Thus, the increase in the company profitability will be reflected in the
value of stocks. For economy that depends heavily on imports, however, currency depreciation
may lead to higher import prices that might be able causing a decline in company profit margin
and also in turn the stock prices. In other words, the effect of currency depreciation will depend
on which of these factors is more dominant. Our result shows that positive effect is dominant
whereas creating upward pressure on Islamic equity prices. This results, also, consistent with
Asmy (2003) on Malaysian stock market found that positive effects are more dominant in the
pre-crisis period.
In the context of industrial production, the long run relationship between Islamic equity
prices and industrial production is positive. This should be expected as the changes in stock
prices reflect expectations of future economic conditions. Likewise, in Islamic stock prices
counterpart, changes in Islamic stock prices also reflects the future economic condition of
Global Review of Islamic Economics and Business, Vol. 1, No.1 (2013) 071-084
79
Islamic economic activities. Current changes in the industrial production may influence the
company expected future cash flows. Our finding is consistent with Ibrahim and Yusoff (2001),
Maysamai and Koh (2000) proved that positive long run association between stock prices and
industrial production for Malaysia and Singapore respectively.
In respect with inflation, the long run relationship between JII and CPI is negative
relationship. As inflation high, it can actually squeeze profit margins of companies and
influence stock prices to declining level. Moreover, when inflation is higher, the economy is
sputtering and affected stock prices. When Islamic stock prices are low the company is reluctant
to tap the capital market. Unless bank finance can substitute adequately for capital market,
company investment would possible be hit and production would decline. This negative
relationship between JII and CPI also supported results obtained by Bruno (1983) that stock
prices movements signal negative revisions in inflationary expectations. As inflation expected
increase, stock prices will be declined.
Finally, there is negative relationship between M2 and JII. Our finding is consistent with
study done by Ibrahim and Yusoff (2001) which stated that there is negative long run
relationship in the context of Malaysian equity prices. The increase in money supply results
increase in inflation, therefore, it generates depreciation expectation and influence the declining
on stock prices.
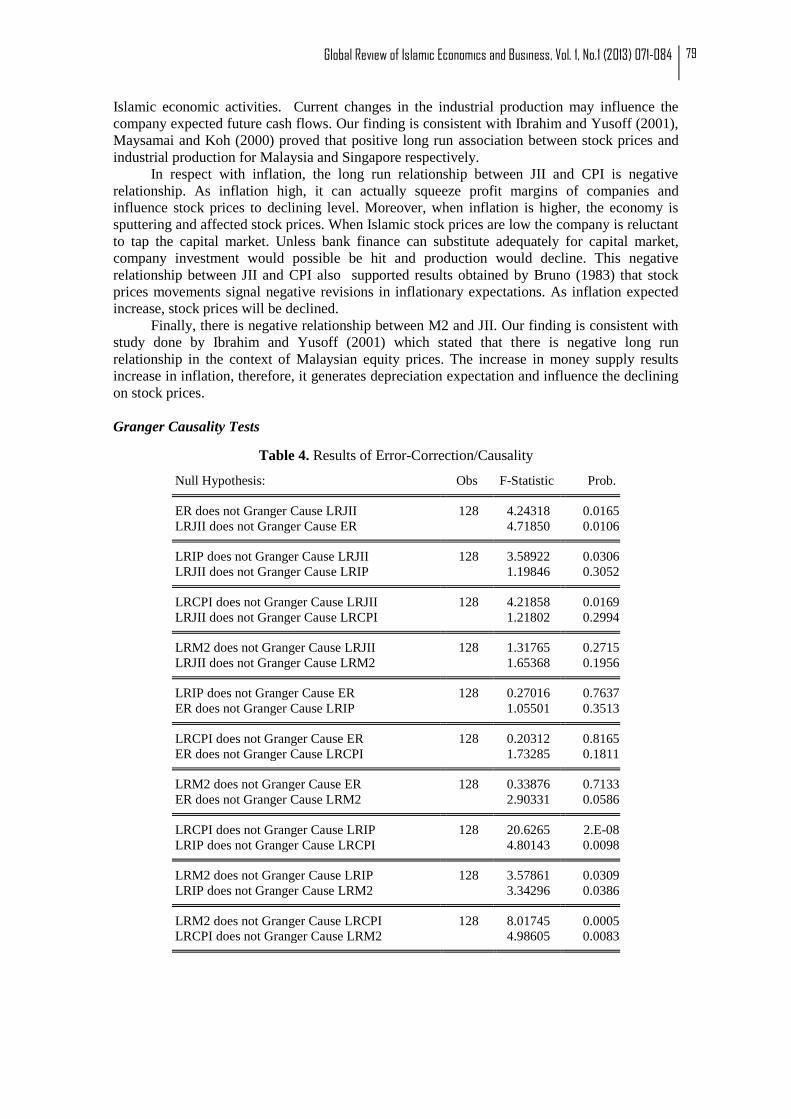
Granger Causality Tests
Table 4. Results of Error-Correction/Causality
Null Hypothesis: Obs F-Statistic Prob.
ER does not Granger Cause LRJII 128 4.24318 0.0165
LRJII does not Granger Cause ER 4.71850 0.0106
LRIP does not Granger Cause LRJII 128 3.58922 0.0306
LRJII does not Granger Cause LRIP 1.19846 0.3052
LRCPI does not Granger Cause LRJII 128 4.21858 0.0169
LRJII does not Granger Cause LRCPI 1.21802 0.2994
LRM2 does not Granger Cause LRJII 128 1.31765 0.2715
LRJII does not Granger Cause LRM2 1.65368 0.1956
LRIP does not Granger Cause ER 128 0.27016 0.7637
ER does not Granger Cause LRIP 1.05501 0.3513
LRCPI does not Granger Cause ER 128 0.20312 0.8165
ER does not Granger Cause LRCPI 1.73285 0.1811
LRM2 does not Granger Cause ER 128 0.33876 0.7133
ER does not Granger Cause LRM2 2.90331 0.0586
LRCPI does not Granger Cause LRIP 128 20.6265 2.E-08
LRIP does not Granger Cause LRCPI 4.80143 0.0098
LRM2 does not Granger Cause LRIP 128 3.57861 0.0309
LRIP does not Granger Cause LRM2 3.34296 0.0386
LRM2 does not Granger Cause LRCPI 128 8.01745 0.0005
LRCPI does not Granger Cause LRM2 4.98605 0.0083

80 Sakti and Yousuf: Relationship between Islamic Stock Prices and Macroeconomic Variables: Evidence from Jakarta Stock Exchange Islamic Index
Table 4 reveals several findings from Granger causality test for all variables selected in
this study. Each of them shows a different causal relationship in respect to macroeconomic
variables changed and the degree of changes on Islamic equity prices. By looking out p-value or
critical value, we can justify the presence of short run causality. The result indicate that there
three bidirectional relationship in the system, namely from ER to LRJII, LRM2 to LRIP, and
LRM2 to LRCPI, vice versa, whereby the respective p-values significant at 5% level. In other
words, the presence of shocks on ER, LRJII, LRM2, and LRIP in the short run would cause the
disequilibrium on LRM2 and LRCPI variables. Similarly, any shock occurred on LRM2 and
LRCPI would trigger disequilibrium on ER, LRJII, LRM2, and LRIP variables.
Variance Decomposition
Variance decomposition measures the percentage of forecast error of variation that
explained by another variable in the short-run dynamics and interactions. It does not provide
information on how variable of interest responds to shocks or innovations in other variables. We
explore variance decomposition and impulse response based on VAR specification for the
purpose. In line with JJ test, we set the lag length of VAR in level to 2, which is sufficient to
render the error term serially uncorrelated. The ordering chosen is IP, CPI, M2, ER, and JII
which is consistent with the study done by Ibrahim and Yusof (2001). Table 5 below reports the
results of variance decomposition.
Table 5. Variance Decompositions
Ordering: IP, CPI, M2, ER, and JII
Variable Period Innovation in (%)
JII ER IP CPI M2
JII 12 95.61296 3.354198 0.033454 0.491533 0.507859
24 91.88017 4.722575 0.223489 0.424697 2.749072
ER 12 2.641658 1.595795 92.37859 3.011508 0.372449
24 4.562389 2.345443 88.12882 4.532022 0.431325
IP 12 33.06628 64.01889 2.458769 0.055598 0.400471
24 33.11446 63.89723 2.495120 0.059423 0.433768
CPI 12 7.698208 19.12849 11.42767 59.47329 2.272339
24 26.31801 23.88748 9.037672 38.98644 1.770398
M2 12 1.666656 9.672541 1.834279 0.819872 86.00665
24 5.124111 8.916917 4.100996 0.582897 81.27508
Table 5 above shows the results for variance decomposition at 12- and 24- month
horizons. The findings suggest the presence of interaction among the variables. We observe that
variations in JII are predominantly attributed to its own variations and ER variations, accounting
for 95.61% and 3.35% respectively after 12 month. Innovations in IP, CPI, and M2, however,
only explain small fractions of JII forecast error variance. They respectively account for 0.03%,
0.49%, and 0.51% after 12 month. The same things, also, happened for variance decomposition
after 24 month on each variable. The variations in JII also predominantly attributed to its own
variations and ER variations, accounting for 91.88% and 4.72%. Innovations in IP and CPI also
explain small fractions of JII variations, account for 0.22% and 0.42% respectively. However,
the fractions of M2 toward JII fractions have inclined to 2.75% after 24 month horizons. Thus,
from these variance decompositions on JII, we might be able inferred that movements in
Indonesian Islamic equity market are domestically driven. It responds more to monetary shock
as compared to real shock.
Global Review of Islamic Economics and Business, Vol. 1, No.1 (2013) 071-084
81
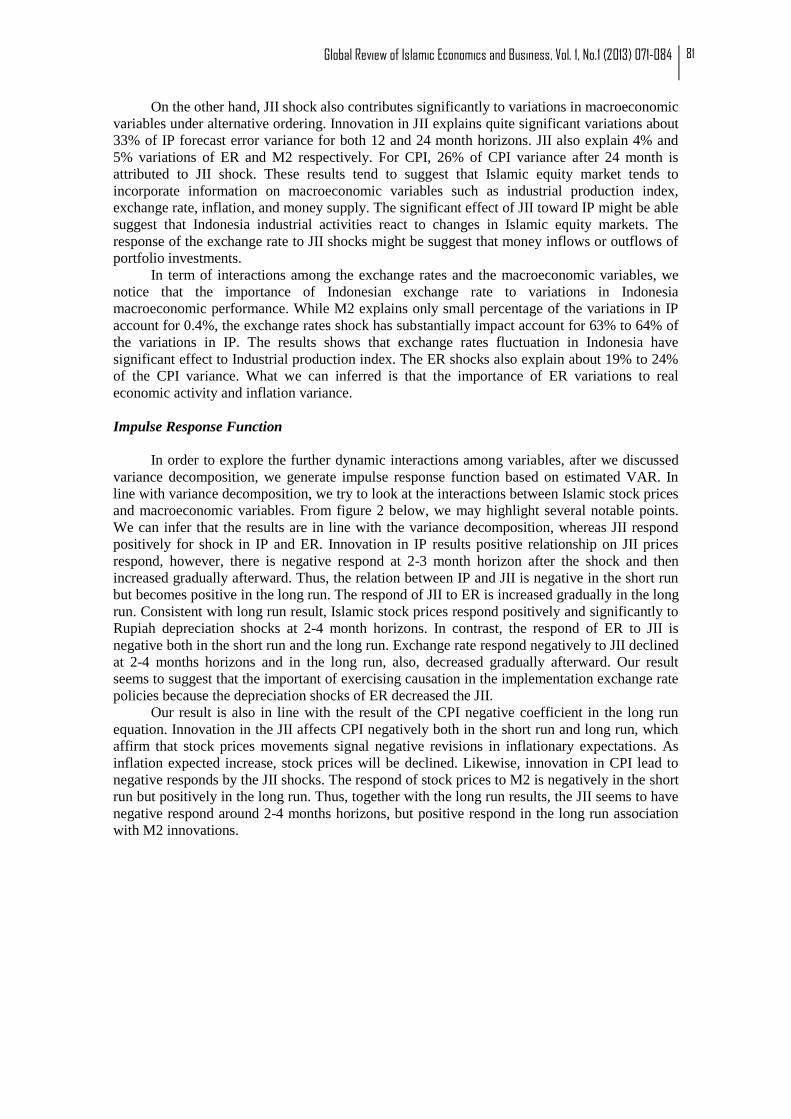
On the other hand, JII shock also contributes significantly to variations in macroeconomic
variables under alternative ordering. Innovation in JII explains quite significant variations about
33% of IP forecast error variance for both 12 and 24 month horizons. JII also explain 4% and
5% variations of ER and M2 respectively. For CPI, 26% of CPI variance after 24 month is
attributed to JII shock. These results tend to suggest that Islamic equity market tends to
incorporate information on macroeconomic variables such as industrial production index,
exchange rate, inflation, and money supply. The significant effect of JII toward IP might be able
suggest that Indonesia industrial activities react to changes in Islamic equity markets. The
response of the exchange rate to JII shocks might be suggest that money inflows or outflows of
portfolio investments.
In term of interactions among the exchange rates and the macroeconomic variables, we
notice that the importance of Indonesian exchange rate to variations in Indonesia
macroeconomic performance. While M2 explains only small percentage of the variations in IP
account for 0.4%, the exchange rates shock has substantially impact account for 63% to 64% of
the variations in IP. The results shows that exchange rates fluctuation in Indonesia have
significant effect to Industrial production index. The ER shocks also explain about 19% to 24%
of the CPI variance. What we can inferred is that the importance of ER variations to real
economic activity and inflation variance.
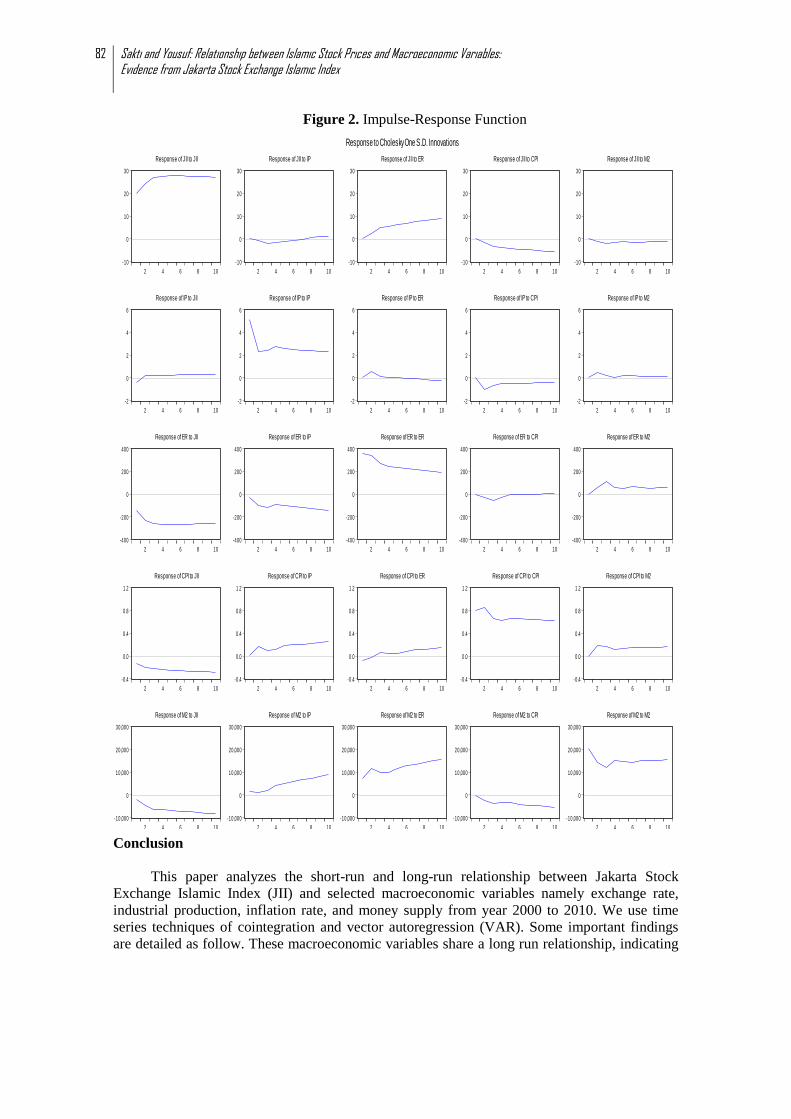
Impulse Response Function
In order to explore the further dynamic interactions among variables, after we discussed
variance decomposition, we generate impulse response function based on estimated VAR. In
line with variance decomposition, we try to look at the interactions between Islamic stock prices
and macroeconomic variables. From figure 2 below, we may highlight several notable points.
We can infer that the results are in line with the variance decomposition, whereas JII respond
positively for shock in IP and ER. Innovation in IP results positive relationship on JII prices
respond, however, there is negative respond at 2-3 month horizon after the shock and then
increased gradually afterward. Thus, the relation between IP and JII is negative in the short run
but becomes positive in the long run. The respond of JII to ER is increased gradually in the long
run. Consistent with long run result, Islamic stock prices respond positively and significantly to
Rupiah depreciation shocks at 2-4 month horizons. In contrast, the respond of ER to JII is
negative both in the short run and the long run. Exchange rate respond negatively to JII declined
at 2-4 months horizons and in the long run, also, decreased gradually afterward. Our result
seems to suggest that the important of exercising causation in the implementation exchange rate
policies because the depreciation shocks of ER decreased the JII.
Our result is also in line with the result of the CPI negative coefficient in the long run
equation. Innovation in the JII affects CPI negatively both in the short run and long run, which
affirm that stock prices movements signal negative revisions in inflationary expectations. As
inflation expected increase, stock prices will be declined. Likewise, innovation in CPI lead to
negative responds by the JII shocks. The respond of stock prices to M2 is negatively in the short
run but positively in the long run. Thus, together with the long run results, the JII seems to have
negative respond around 2-4 months horizons, but positive respond in the long run association
with M2 innovations.
82 Sakti and Yousuf: Relationship between Islamic Stock Prices and Macroeconomic Variables: Evidence from Jakarta Stock Exchange Islamic Index
Figure 2. Impulse-Response Function
Conclusion
This paper analyzes the short-run and long-run relationship between Jakarta Stock
Exchange Islamic Index (JII) and selected macroeconomic variables namely exchange rate,
industrial production, inflation rate, and money supply from year 2000 to 2010. We use time
series techniques of cointegration and vector autoregression (VAR). Some important findings
are detailed as follow. These macroeconomic variables share a long run relationship, indicating
-10
0
10
20
30
2 4 6 8 10
Response of JII to JII
-10
0
10
20
30
2 4 6 8 10
Response of JII to IP
-10
0
10
20
30
2 4 6 8 10
Response of JII to ER
-10
0
10
20
30
2 4 6 8 10
Response of JII to CPI
-10
0
10
20
30
2 4 6 8 10
Response of JII to M2
-2
0
2
4
6
2 4 6 8 10
Response of IP to JII
-2
0
2
4
6
2 4 6 8 10
Response of IP to IP
-2
0
2
4
6
2 4 6 8 10
Response of IP to ER
-2
0
2
4
6
2 4 6 8 10
Response of IP to CPI
-2
0
2
4
6
2 4 6 8 10
Response of IP to M2
-400
-200
0
200
400
2 4 6 8 10
Response of ER to JII
-400
-200
0
200
400
2 4 6 8 10
Response of ER to IP
-400
-200
0
200
400
2 4 6 8 10
Response of ER to ER
-400
-200
0
200
400
2 4 6 8 10
Response of ER to CPI
-400
-200
0
200
400
2 4 6 8 10
Response of ER to M2
-0.4
0.0
0.4
0.8
1.2
2 4 6 8 10
Response of CPI to JII
-0.4
0.0
0.4
0.8
1.2
2 4 6 8 10
Response of CPI to IP
-0.4
0.0
0.4
0.8
1.2
2 4 6 8 10
Response of CPI to ER
-0.4
0.0
0.4
0.8
1.2
2 4 6 8 10
Response of CPI to CPI
-0.4
0.0
0.4
0.8
1.2
2 4 6 8 10
Response of CPI to M2
-10,000
0
10,000
20,000
30,000
2 4 6 8 10
Response of M2 to JII
-10,000
0
10,000
20,000
30,000
2 4 6 8 10
Response of M2 to IP
-10,000
0
10,000
20,000
30,000
2 4 6 8 10
Response of M2 to ER
-10,000
0
10,000
20,000
30,000
2 4 6 8 10
Response of M2 to CPI
-10,000
0
10,000
20,000
30,000
2 4 6 8 10
Response of M2 to M2
Response to Cholesky One S.D. Innovations
Global Review of Islamic Economics and Business, Vol. 1, No.1 (2013) 071-084
83
that deviations in the short run Islamic stock prices will be adjusted toward the long run value.
The movement of Islamic equity market in Indonesia contains information on future
information on future variations of these variables. Specifically, Indonesian Islamic stock
market are driven more by domestic factors. It responds more to monetary shock as compared to
real shock.
Furthermore, the long run equilibrium shows that there is positive relationship between
JII and exchange rates. We note from the analysis that there is negative long run association
between JII and exchange rates. In other words, in the long run currency depreciation seems to
be associated with an increase in Islamic stock prices. In contrast, the respond of ER to JII is
negative both in the short run and the long run. Our result seems to suggest that the important of
exercising causation in the implementation exchange rate policies because the depreciation
shocks of ER decreased the JII prices. The results also indicate that exchange rate have
significant influence on the Indonesian economy. Thus, the Indonesian monetary authorities
should consider on stabilizing the exchange rate.
On the other hand, the relationship between inflation rate (CPI) and Islamic stock price is
negative association. Innovation in the JII affects CPI negatively both in the short run and long
run, which affirm that stock prices movements signal negative revisions in inflationary
expectations. As inflation expected increase, stock prices will be declined. Likewise, innovation
in CPI also leads to negative responds by the JII shocks. This result indicates that once inflation
is high, it can actually squeeze profit margins of companies and influence stock prices to
declining level. Bruno (1983) stated that that stock prices movements signal negative revisions
in inflationary expectations. As inflation expected increase, stock prices will be declined.
Lastly, there is negative relationship between money supply (M2) and Islamic stock
prices. This negative association can be due to increase in inflation uncertainty that may lead to
declined in Islamic stock prices. The results of variance decomposition and impulse response
function indicate that JII respond to shock in money supply negatively in the short run, but the
effects become positive in the long run. This findings help in giving input to the government of
emerging markets in employing exchange rates policies since they may have repercussions on
domestic equity markets (Abdulla and Murinde (1997), Ibrahim and Yusoff (2001).

84 Sakti and Yousuf: Relationship between Islamic Stock Prices and Macroeconomic Variables: Evidence from Jakarta Stock Exchange Islamic Index
References
Abdalla, Issam S.A., and V. Murinde. 1997. Exchange Rate and Stock Price Interactions in
Emerging Financial Markets: Evidence on India, Korea, Pakistan, and Philippines,
Applied Financial Economics Volume 7, pp.25-35.
Asmy, M. et al. 2009. Effects of Macroeconomic Variables on Stock Prices in Malaysia: An
Approach of Error Correction Model, available at: http://mpra.ub.uni-
muenchen.de/20970/ (accessed on 15 March 2013)
Fama, E.F. 1981. Stock returns, real activity, inflation, and money, The American Economic
Review, Vol. 71 No. 4, pp. 545-65.
Gujarati, D. N. 2009. Basic Econometrics, 5th ed., New York: McGraw-Hill.
Hakim, S. and Rashidian, M. 2005. Risk and returns of Islamic stock market indexes, available
at: www.mafhoum.com/press4/136E15.pdf (accessed 15 March 2013)
Humpe, A. & Macmillan, P.D. 2005. Can macroeconomic variables explain long term stock
market movements? A comparison of the US and Japan, CRIEFF Discussion Papers
0511, Centre for Research into Industry, Enterprise, Finance and the Firm.
Ibrahim, M and Wan Yusoff,W.S. 2001. Macroeconomics Variables, Exchange Rate and Stock
Prices: A Malaysian Perspective, IIUM Journal of Economics and Management, Vol.9
No.2, pp.141-163.
Jeong, J-G et al. 2002. Intra and Inter-Continental Transmission of Inflation in Africa. Applied
Financial Economics, 12, 731-741.
Johansen, S. 1988. Statistical analysis of cointegration vectors, Journal of Economic Dynamics
and Control, Vol. 12, pp. 231-54.
Maysami, R.C., and T.S. Koh. 2000. A Vector Error Correction Model of the Singapore Stock
Market, International Review of Economics and Finance Vol.9, pp.79-96.
Mishkin, F. 2007. The Economics of Money, Banking, and Financial Market. Pearson, Boston
Paramiah Ch. & Akway O.A 2008. Econometric Analysis of Personal Consumption
Expenditure in Ethopia.The Icfai University Press.
Poon, S.H. and Taylor, S.J. 1992. Stock returns and volatility: an empirical study of the UK
stock market, Journal of Banking and Finance, Vol. 16, pp. 37-59.
Shabri, M., Yusoff, 2009. Long-run Relationship between Islamic Stock Returns and
Macroeconomic Variables: An Application of the Autoregressive Distributed Lag Model.,
available at: www.emeraldinsight.com/0828-8666.htm (accessed on 15 March 2013)
Solnik, Bruno 1983. The relation between Stock Prices and Inflationary Expectations: The
International Evidence, The Journal of Finance, Vol. XXXVIII, No 1