Faculty, edlib.asdf.res · The SWOT analysis of PSB, management of credit risk and measures to...
7
Downloaded from edlib.asdf.res.in A Study on the Implications of NPA in PSB Banks with Reference to Home Loans Dr. P. Anbuoli, P. Vijayalakshmi, Dr. A. C. Kannan Faculty, Management Studies, Anna University, Regional Centre, Madurai Research Scholar, Management Studies, PSNA College of Engineering & Technology, Dindigul Professor, Management Studies, KLN College of Engineering & Technology, Madurai Abstract: Non-performing assets are one of the major concerns for banks in India. NPAs reflect the performance of banks. The NPAs growth involves the necessity of provision, which reduces the overall profits and shareholders value. An attempt is made in the paper what is NPA? The SWOT analysis of PSB, management of credit risk and measures to control the memance of NPAs are also discussed. Key words: Gross NPA, Net NPA 1 Introduction of the Study The three letters “NPA” Strike terror in banking sector and business circle today. NPA is short form of “Non-Performing Asset”. The dreaded NPA rule says simply this: when interest or other due to a bank remains unpaid for more than 90 days, the entire bank loan automatically turns a non performing asset. The recovery of loan has always been problem for banks and financial institution. Definitions A ‘Non-Performing Asset’ (NPA) was defined as a credit facility in respect of which the interest and/ or instalment of principal has remained ‘past due’ for a specified period of time. Types of NPA A] Gross NPA B] Net NPA Gross NPA: Gross NPAs Ratio= Net NPAs = We have taken home loan and compared its performance and the total outstanding in the shames for the past 5 years and recorded the growth NPA. Need of the Study The many factors affect for the Non-Performing Assets. Non-Performing Asset is main important problem for the Bank so the bank interest to know the analyses the NPA. It is helpful to improve the bank. ASDF Thailand Proceedings of the International Congress 2014 [IC 2014], Bangkok, Thailand 43 Int Congress 2014 ISBN : 978-81-929742-3-1 www.intcongress.com
Transcript of Faculty, edlib.asdf.res · The SWOT analysis of PSB, management of credit risk and measures to...
Downlo
aded
from ed
lib.as
df.res
.in
A Study on the Implications of NPA in PSB Banks with Reference to Home Loans
Dr. P. Anbuoli, P. Vijayalakshmi, Dr. A. C. Kannan
Faculty, Management Studies, Anna University, Regional Centre, Madurai Research Scholar, Management Studies, PSNA College of Engineering & Technology, Dindigul
Professor, Management Studies, KLN College of Engineering & Technology, Madurai
Abstract: Non-performing assets are one of the major concerns for banks in India. NPAs reflect the performance of banks. The NPAs growth involves the necessity of provision, which reduces the overall profits and shareholders value. An attempt is made in the paper what is NPA? The SWOT analysis of PSB, management of credit risk and measures to control the memance of NPAs are also discussed.
Key words: Gross NPA, Net NPA
1 Introduction of the Study
The three letters “NPA” Strike terror in banking sector and business circle today. NPA is short form of “Non-Performing Asset”. The dreaded NPA rule says simply this: when interest or other due to a bank remains unpaid for more than 90 days, the entire bank loan automatically turns a non performing asset. The recovery of loan has always been problem for banks and financial institution.
Definitions
A ‘Non-Performing Asset’ (NPA) was defined as a credit facility in respect of which the interest and/ or instalment of principal has remained ‘past due’ for a specified period of time.
Types of NPA A] Gross NPA B] Net NPA
Gross NPA:
Gross NPAs Ratio=
Net NPAs =
We have taken home loan and compared its performance and the total outstanding in the shames for the past 5 years and recorded the growth NPA.
Need of the Study
The many factors affect for the Non-Performing Assets. Non-Performing Asset is main important problem for the Bank so the bank interest to know the analyses the NPA. It is helpful to improve the bank.
ASDF Thailand Proceedings of the International Congress 2014 [IC 2014], Bangkok, Thailand 43
Int Congress 2014 ISBN : 978-81-929742-3-1 www.intcongress.com

Downlo
aded
from ed
lib.as
df.res
.in
1.5 Statement of the Problem
The State bank will always face the problem of NPA because of poor recovery of advances granted by the bank and several other reasons like adopting a poor recovery strategies so when the loan is not recovered from the bank effectively and efficiently that balance amount will become the NPA to the bank it may create some huge problem to the bank’s net profit.
1.6 Objectives of the Study
Primary Objective
To Analyze the Non-Performing Assets in State Bank of India Paramakudi Branch
Secondary Objectives
To evaluate Non Performing Assets level in different loan schemes. To Know the Impact of Non-Performing Assets. To Know the Reasons for NPA and to learn Preventive Measures.
Limitations of the Study
Since my study is based on the secondary data, the practical operations as related to the NPAs are adopted by the banks are not learned.
The project only projection for average information not for accurate information. Time constraints are one of the limitations of this study.
Sampling
The Sample of five years (2009-2013) Profit & Loss A/C, Balance Sheet was used to study the analysis of Non-Performing Assets in State Bank of India Paramakudi Branch.
Data Collection Method
Nature of Data
The data collected is secondary in nature. This is due to the nature of analysis, which only identify for secondary data.
Sources of Data
The data required of this study has collected from secondary source.
Profit & Loss A/C Balance Sheet Annual Report
Tools to be used
Non-Performing Assets Ratio analysis Trend Analysis Percentage analysis
ASDF Thailand Proceedings of the International Congress 2014 [IC 2014], Bangkok, Thailand 44
Int Congress 2014 ISBN : 978-81-929742-3-1 www.intcongress.com

Downlo
aded
from ed
lib.as
df.res
.in
Data Analysis and Interpretation Gross NPA
Gross NPAs Ratio=
Table showing the gross NPAs Ratio
Year Gross NPA in Crore Gross Advances Ratio
2008 – 2009 40599430 31422506 1.29
2009 – 2010 34210399 27189942 1.25
2010 – 2011 59786433 45602864 1.31
2011 – 2012 49000899 38055752 1.28
2012 – 2013 34124609 40621750 8.40
Source: Bank annual reports 2009-2013
This table shows that gross non-performing assets ratios. The gross NPA was high in the year 2012-2013(8.40), gross NPA very low in the year 2011-2012(1.28).
Table showing the gross NPA ratio
Net NPAs
Net NPAs =
Showing the net NPAs Ratio
Year Gross NPA Gross Advances provision Ratio
2008 – 2009 40599430 31422506 3734.57 1.29
2009 – 2010 34210399 27189942 4394.83 1.25
ASDF Thailand Proceedings of the International Congress 2014 [IC 2014], Bangkok, Thailand 45
Int Congress 2014 ISBN : 978-81-929742-3-1 www.intcongress.com
Downlo
aded
from ed
lib.as
df.res
.in
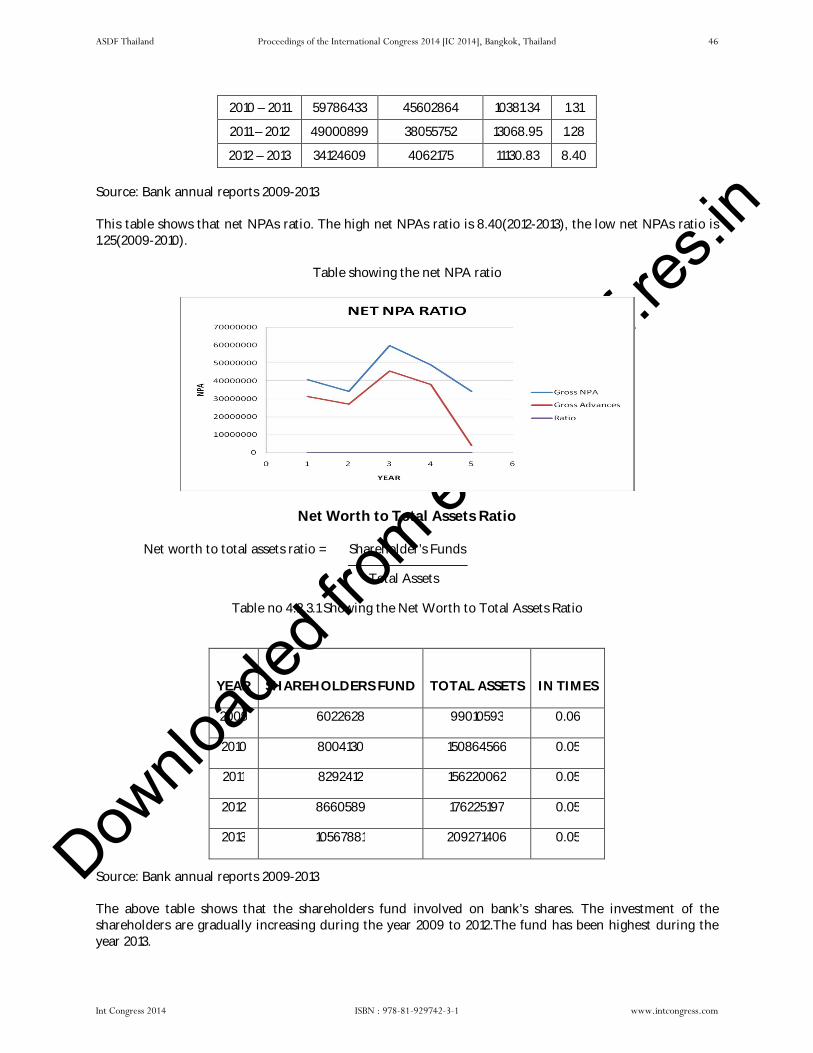
2010 – 2011 59786433 45602864 10381.34 1.31
2011 – 2012 49000899 38055752 13068.95 1.28
2012 – 2013 34124609 4062175 11130.83 8.40
Source: Bank annual reports 2009-2013
This table shows that net NPAs ratio. The high net NPAs ratio is 8.40(2012-2013), the low net NPAs ratio is 1.25(2009-2010).
Table showing the net NPA ratio
Net Worth to Total Assets Ratio
Net worth to total assets ratio = Shareholder’s Funds
Total Assets
Table no 4.2.3.1 Showing the Net Worth to Total Assets Ratio
Source: Bank annual reports 2009-2013
The above table shows that the shareholders fund involved on bank’s shares. The investment of the shareholders are gradually increasing during the year 2009 to 2012.The fund has been highest during the year 2013.
YEAR
SHAREHOLDERS FUND
TOTAL ASSETS
IN TIMES
2009 6022628 99010593 0.06
2010 8004130 150864566 0.05
2011 8292412 156220062 0.05
2012 8660589 176225197 0.05
2013 10567881 209271406 0.05
ASDF Thailand Proceedings of the International Congress 2014 [IC 2014], Bangkok, Thailand 46
Int Congress 2014 ISBN : 978-81-929742-3-1 www.intcongress.com
Downlo
aded
from ed
lib.as
df.res
.in
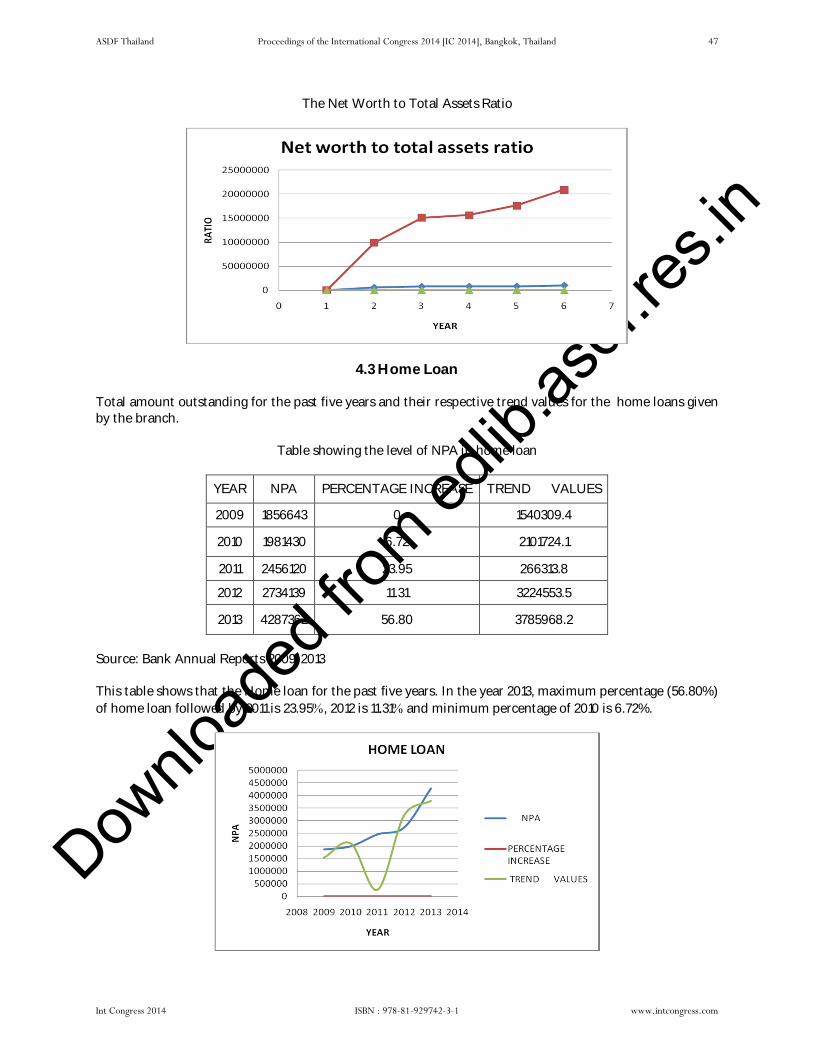
The Net Worth to Total Assets Ratio
4.3 Home Loan
Total amount outstanding for the past five years and their respective trend values for the home loans given by the branch.
Table showing the level of NPA in home loan
YEAR NPA PERCENTAGE INCREASE TREND VALUES
2009 1856643 0 1540309.4
2010 1981430 6.72 2101724.1
2011 2456120 23.95 266313.8
2012 2734139 11.31 3224553.5
2013 4287362 56.80 3785968.2
Source: Bank Annual Reports 2009-2013
This table shows that the Home loan for the past five years. In the year 2013, maximum percentage (56.80%) of home loan followed by 2011 is 23.95, 2012 is 11.31 and minimum percentage of 2010 is 6.72%.
ASDF Thailand Proceedings of the International Congress 2014 [IC 2014], Bangkok, Thailand 47
Int Congress 2014 ISBN : 978-81-929742-3-1 www.intcongress.com
Downlo
aded
from ed
lib.as
df.res
.in
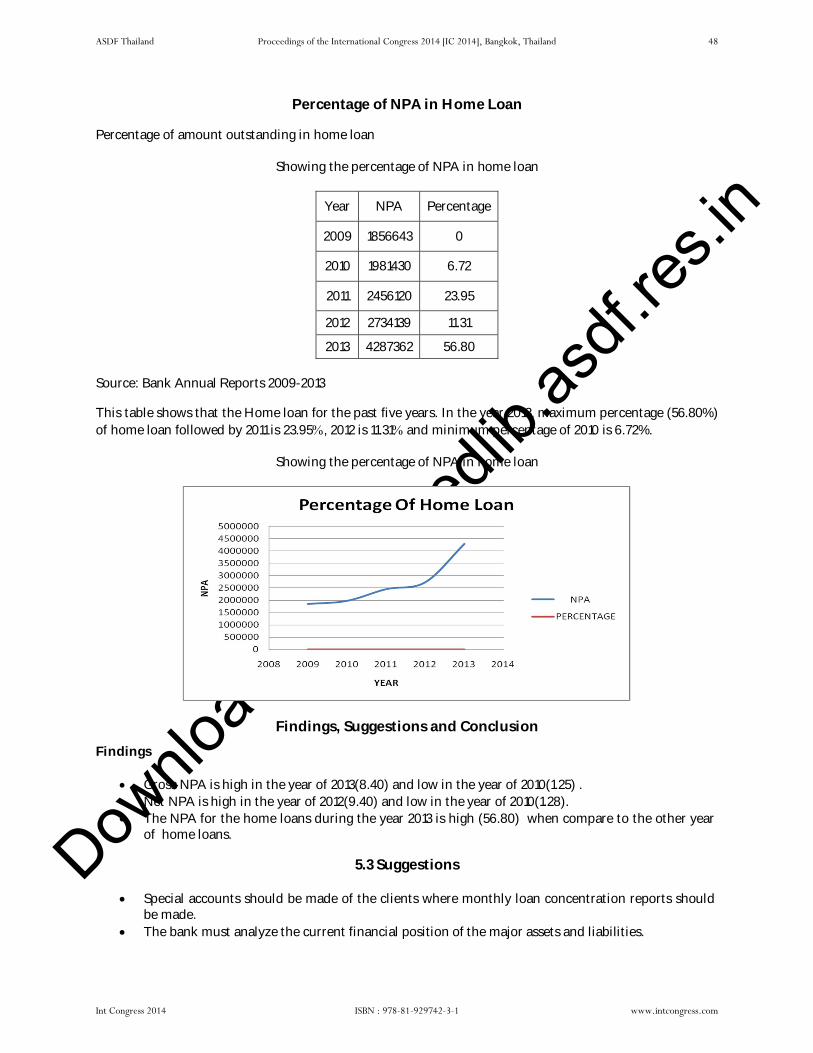
Percentage of NPA in Home Loan
Percentage of amount outstanding in home loan
Showing the percentage of NPA in home loan
Year NPA Percentage
2009 1856643 0
2010 1981430 6.72
2011 2456120 23.95
2012 2734139 11.31
2013 4287362 56.80
Source: Bank Annual Reports 2009-2013
This table shows that the Home loan for the past five years. In the year 2013, maximum percentage (56.80%) of home loan followed by 2011 is 23.95, 2012 is 11.31 and minimum percentage of 2010 is 6.72%.
Showing the percentage of NPA in home loan
Findings, Suggestions and Conclusion
Findings
Gross NPA is high in the year of 2013(8.40) and low in the year of 2010(1.25) . Net NPA is high in the year of 2012(9.40) and low in the year of 2010(1.28). The NPA for the home loans during the year 2013 is high (56.80) when compare to the other year
of home loans.
5.3 Suggestions
Special accounts should be made of the clients where monthly loan concentration reports should be made.
The bank must analyze the current financial position of the major assets and liabilities.
ASDF Thailand Proceedings of the International Congress 2014 [IC 2014], Bangkok, Thailand 48
Int Congress 2014 ISBN : 978-81-929742-3-1 www.intcongress.com
Downlo
aded
from ed
lib.as
df.res
.in
Proper monitoring of the restructured accounts because there is every possibility of the loans slipping into NPAs category again.
Proper training is important to the staff of the bank at the appropriate level with ongoing process. That how they should deal the problem of NPAs, and what continues steps they should take to reduce the NPAs.
Bank should also form a special team to inspect the site of customer to ensure the source of deployment of funds while giving a home loan.
Bank should ensure that the loan given more than 5 lakhs has been insured. While giving loan bank must insist the borrower to keep his salary account in the branch itself
which can help the bank to recover the loan through standing instructions. Complete audit must be carried out to ensure that the documents submitted by the borrower are
original and it should ensure whether the borrower and the owner of the property are same.
Conclusion
It is not possible to eliminate totally the NPAs in the banking business but can only be minimized. It is always wise to follow the proper policy appraisal, supervision and follow-up of advances to avoid NPAs. The banks should not only take steps for reducing present NPAs, but necessary precaution should also be taken to avoid future NPAs. But in the case of SBI is one of the good sign that the campaign conducted by the regional office help in bringing down the NPA level.
References
1. Bardhan, P (1989). The Economic Theory of Agrarian Institutions. Oxford, NY: Claredon Press. 2. Bell, C and T N Srinivasan (1989). Some Aspects of Linked Products and Credit Market Contracts
among Risk Neutral Agents. In Pranab K Bardhan (ed), The Economic Theory of Agrarian Institutions. Oxford: Oxford University Press.
3. Battese, GE and T J Coelli (1995). A Model for Technical Inefficiency Effects in a Stochastic Frontier Production Function for Panel Data. Empirical Economics, 20 (2): 325-32.
4. Bonin J P and Yiping H (2001). Dealing with Bad Loans of the Chinese Banks. Working paper No. 357.
5. Chaitanya V Krishna (2004). Causes of Non-performing Assets in Public Sector Banks. Economic Research, 17 (1): 16-30.
6. Chakravarty, S (1985). Report of the Committee to Review the Working of the Monetary System. Mumbai: Reserve Bank of India.
7. Das Abhiman (2002). Risk and Productivity Change of Public Sector Banks. Economic and Political Weekly, 37 (5): 437-48.
8. Gang, I N (1995). Small Firms in India: A Discussion of Some Issues. In Mookherjee, D (eds), Indian Industry: Policies and Performance. New Delhi: Oxford University Press.
9. Ghosh, S (2005). Does Leverage Influence Bank’s Non-Performing Loan?: Evidences from India. Applied Economic Letters, 12 (15): 913-18.
10. Goldsmith, Raymond W (1969). Financial Structure and Development. Yale University Press.
ASDF Thailand Proceedings of the International Congress 2014 [IC 2014], Bangkok, Thailand 49
Int Congress 2014 ISBN : 978-81-929742-3-1 www.intcongress.com