Factsheet - July 2016 -...
40
Transcript of Factsheet - July 2016 -...

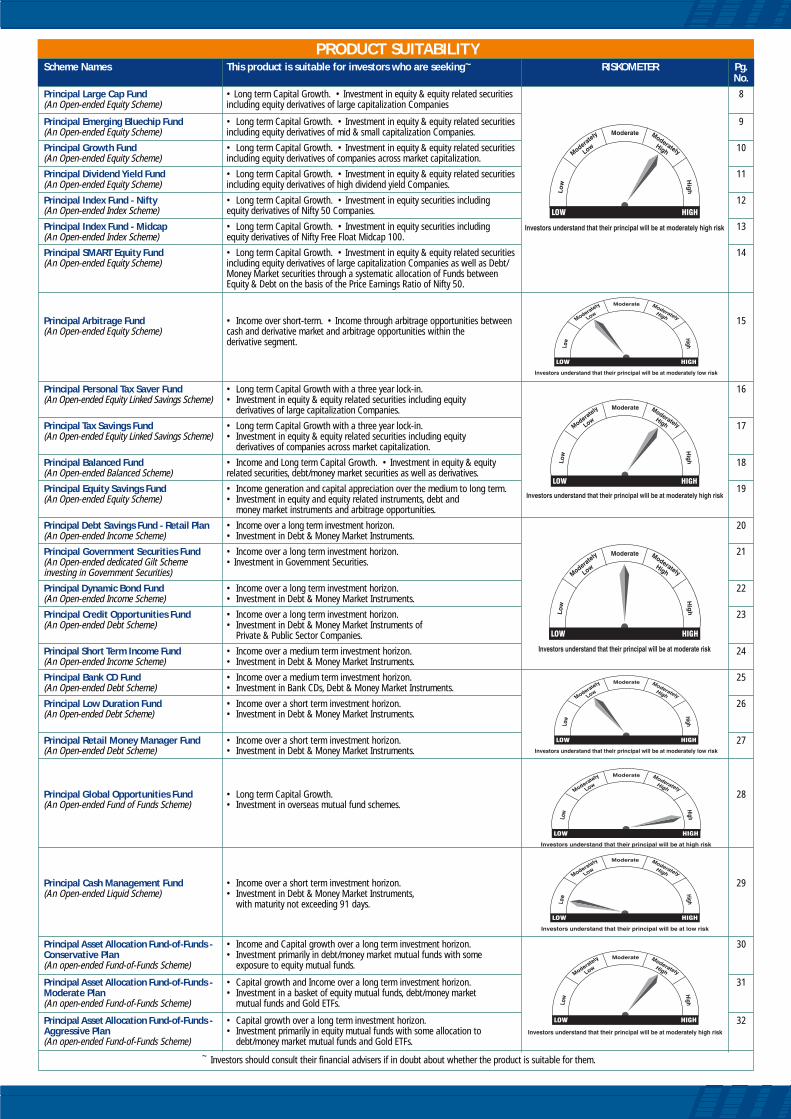
PRODUCT SUITABILITYScheme Names This product is suitable for investors who are seeking~ RISKOMETER Pg.
No.Principal Large Cap Fund • Long term Capital Growth. • Investment in equity & equity related securities 8(An Open-ended Equity Scheme) including equity derivatives of large capitalization Companies
Principal Emerging Bluechip Fund • Long term Capital Growth. • Investment in equity & equity related securities 9(An Open-ended Equity Scheme) including equity derivatives of mid & small capitalization Companies.
Principal Growth Fund • Long term Capital Growth. • Investment in equity & equity related securities 10(An Open-ended Equity Scheme) including equity derivatives of companies across market capitalization.
Principal Dividend Yield Fund • Long term Capital Growth. • Investment in equity & equity related securities 11(An Open-ended Equity Scheme) including equity derivatives of high dividend yield Companies.
Principal Index Fund - Nifty • Long term Capital Growth. • Investment in equity securities including 12(An Open-ended Index Scheme) equity derivatives of Nifty 50 Companies.
Principal Index Fund - Midcap • Long term Capital Growth. • Investment in equity securities including 13(An Open-ended Index Scheme) equity derivatives of Nifty Free Float Midcap 100.
Principal SMART Equity Fund • Long term Capital Growth. • Investment in equity & equity related securities 14(An Open-ended Equity Scheme) including equity derivatives of large capitalization Companies as well as Debt/
Money Market securities through a systematic allocation of Funds betweenEquity & Debt on the basis of the Price Earnings Ratio of Nifty 50.
Principal Arbitrage Fund • Income over short-term. • Income through arbitrage opportunities between 15(An Open-ended Equity Scheme) cash and derivative market and arbitrage opportunities within the
derivative segment.
Principal Personal Tax Saver Fund • Long term Capital Growth with a three year lock-in. 16(An Open-ended Equity Linked Savings Scheme) • Investment in equity & equity related securities including equity
derivatives of large capitalization Companies.
Principal Tax Savings Fund • Long term Capital Growth with a three year lock-in. 17(An Open-ended Equity Linked Savings Scheme) • Investment in equity & equity related securities including equity
derivatives of companies across market capitalization.
Principal Balanced Fund • Income and Long term Capital Growth. • Investment in equity & equity 18(An Open-ended Balanced Scheme) related securities, debt/money market securities as well as derivatives.
Principal Equity Savings Fund • Income generation and capital appreciation over the medium to long term. 19(An Open-ended Equity Scheme) • Investment in equity and equity related instruments, debt and
money market instruments and arbitrage opportunities.
Principal Debt Savings Fund - Retail Plan • Income over a long term investment horizon. 20(An Open-ended Income Scheme) • Investment in Debt & Money Market Instruments.
Principal Government Securities Fund • Income over a long term investment horizon. 21(An Open-ended dedicated Gilt Scheme • Investment in Government Securities.investing in Government Securities)
Principal Dynamic Bond Fund • Income over a long term investment horizon. 22(An Open-ended Income Scheme) • Investment in Debt & Money Market Instruments.
Principal Credit Opportunities Fund • Income over a long term investment horizon. 23(An Open-ended Debt Scheme) • Investment in Debt & Money Market Instruments of
Private & Public Sector Companies.
Principal Short Term Income Fund • Income over a medium term investment horizon. 24(An Open-ended Income Scheme) • Investment in Debt & Money Market Instruments.
Principal Bank CD Fund • Income over a medium term investment horizon. 25(An Open-ended Debt Scheme) • Investment in Bank CDs, Debt & Money Market Instruments.
Principal Low Duration Fund • Income over a short term investment horizon. 26(An Open-ended Debt Scheme) • Investment in Debt & Money Market Instruments.
Principal Retail Money Manager Fund • Income over a short term investment horizon. 27(An Open-ended Debt Scheme) • Investment in Debt & Money Market Instruments.
Principal Global Opportunities Fund • Long term Capital Growth. 28(An Open-ended Fund of Funds Scheme) • Investment in overseas mutual fund schemes.
Principal Cash Management Fund • Income over a short term investment horizon. 29(An Open-ended Liquid Scheme) • Investment in Debt & Money Market Instruments,
with maturity not exceeding 91 days.
Principal Asset Allocation Fund-of-Funds - • Income and Capital growth over a long term investment horizon. 30Conservative Plan • Investment primarily in debt/money market mutual funds with some(An open-ended Fund-of-Funds Scheme) exposure to equity mutual funds.
Principal Asset Allocation Fund-of-Funds - • Capital growth and Income over a long term investment horizon. 31Moderate Plan • Investment in a basket of equity mutual funds, debt/money market(An open-ended Fund-of-Funds Scheme) mutual funds and Gold ETFs.
Principal Asset Allocation Fund-of-Funds - • Capital growth over a long term investment horizon. 32Aggressive Plan • Investment primarily in equity mutual funds with some allocation to(An open-ended Fund-of-Funds Scheme) debt/money market mutual funds and Gold ETFs.
~ Investors should consult their financial advisers if in doubt about whether the product is suitable for them.
INVEST KNOWHOW July 20163
Debt Markets
Fund Manager Commentary
July 2016
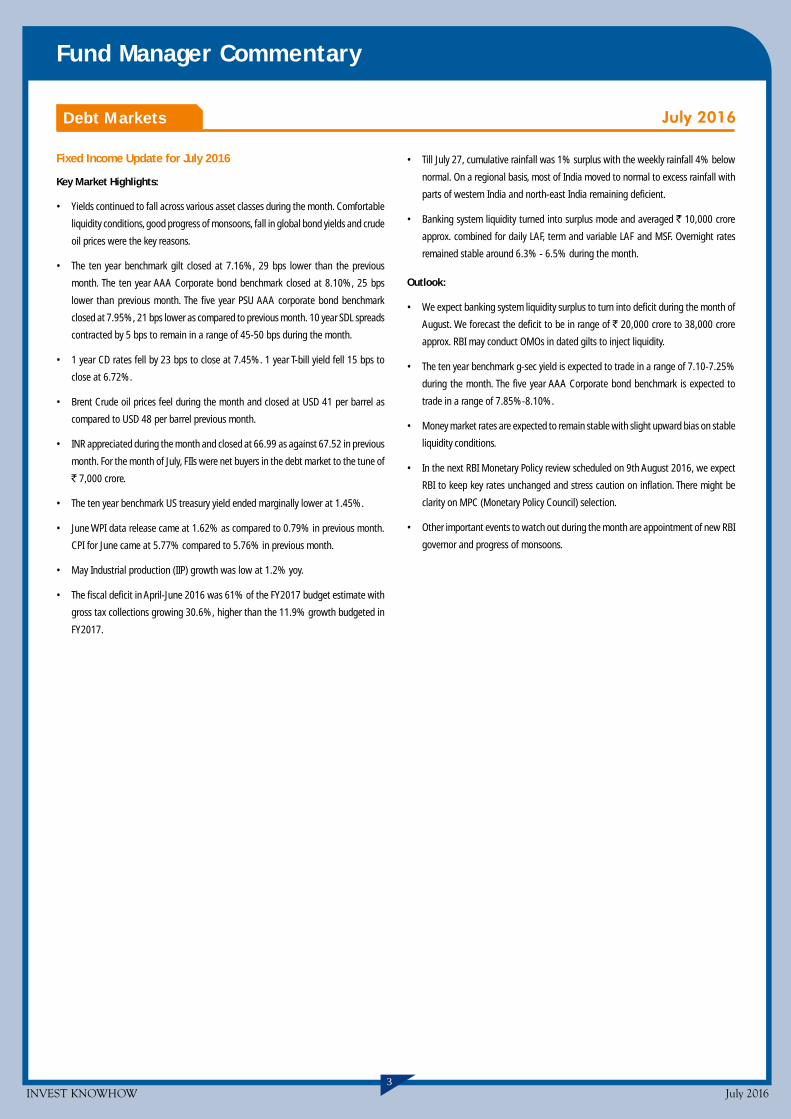
Fixed Income Update for July 2016
Key Market Highlights:
• Yields continued to fall across various asset classes during the month. Comfortable
liquidity conditions, good progress of monsoons, fall in global bond yields and crude
oil prices were the key reasons.
• The ten year benchmark gilt closed at 7.16%, 29 bps lower than the previous
month. The ten year AAA Corporate bond benchmark closed at 8.10%, 25 bps
lower than previous month. The five year PSU AAA corporate bond benchmark
closed at 7.95%, 21 bps lower as compared to previous month. 10 year SDL spreads
contracted by 5 bps to remain in a range of 45-50 bps during the month.
• 1 year CD rates fell by 23 bps to close at 7.45%. 1 year T-bill yield fell 15 bps to
close at 6.72%.
• Brent Crude oil prices feel during the month and closed at USD 41 per barrel as
compared to USD 48 per barrel previous month.
• INR appreciated during the month and closed at 66.99 as against 67.52 in previous
month. For the month of July, FIIs were net buyers in the debt market to the tune of
` 7,000 crore.
• The ten year benchmark US treasury yield ended marginally lower at 1.45%.
• June WPI data release came at 1.62% as compared to 0.79% in previous month.
CPI for June came at 5.77% compared to 5.76% in previous month.
• May Industrial production (IIP) growth was low at 1.2% yoy.
• The fiscal deficit in April-June 2016 was 61% of the FY2017 budget estimate with
gross tax collections growing 30.6%, higher than the 11.9% growth budgeted in
FY2017.
• Till July 27, cumulative rainfall was 1% surplus with the weekly rainfall 4% below
normal. On a regional basis, most of India moved to normal to excess rainfall with
parts of western India and north-east India remaining deficient.
• Banking system liquidity turned into surplus mode and averaged ` 10,000 crore
approx. combined for daily LAF, term and variable LAF and MSF. Overnight rates
remained stable around 6.3% - 6.5% during the month.
Outlook:
• We expect banking system liquidity surplus to turn into deficit during the month of
August. We forecast the deficit to be in range of ` 20,000 crore to 38,000 crore
approx. RBI may conduct OMOs in dated gilts to inject liquidity.
• The ten year benchmark g-sec yield is expected to trade in a range of 7.10-7.25%
during the month. The five year AAA Corporate bond benchmark is expected to
trade in a range of 7.85%-8.10%.
• Money market rates are expected to remain stable with slight upward bias on stable
liquidity conditions.
• In the next RBI Monetary Policy review scheduled on 9th August 2016, we expect
RBI to keep key rates unchanged and stress caution on inflation. There might be
clarity on MPC (Monetary Policy Council) selection.
• Other important events to watch out during the month are appointment of new RBI
governor and progress of monsoons.

INVEST KNOWHOW July 20164
Fund Manager Commentary
Equity Markets
Review of Equity Market for the Month of July 2016
The Emerging Markets as a category rode past concerns the Brexit vote had raised, and
did well in the month of July, outperforming the Developed markets. The MSCI EM
Index (USD) was up 4.7% during the month while MSCI World (USD) index was up
4.1%. The rally was driven by strong inflows in EMs, both in fixed income and equity
markets. The search for yield drove strong flows in to EM debt, which saw inflows of
USD 13.6 Billion, the highest ever figure for a single month. CYTD, EM debt has seen
inflows of USD 23.3 Billion. Likewise, EM equity saw inflows of USD 10.1 Billion,
the highest inflow number for the past two years. CYTD, EM equity has however seen
outflows of USD 2.1 Billion. The Indian markets too continued the uptrend of June,
with the Nifty up 4.2% during the month. FII flows were strong, with net inflows of
USD 1.7 Billion, taking the net inflows for calendar YTD to USD 4.6 Billion. Locally, both
insurance companies (- 862 Million) and Mutual funds (-41 Million) were sellers.
The Rupee was up about 0.8% during the month, broadly in line with the move in the
Dollar index, which was down about 0.6%. In global news, the FOMC statement
(July 27) observed that labor markets have “strengthened,” labor utilization has
increased, and, notably, “near-term risks to the economic outlook have diminished.”
These could begin to lay the groundwork for a hike going forward, provided the data
continues to be strong. On July 29, the Bank of Japan kept the pace of government
bond purchases and the overnight call rate (-0.1%) unchanged, which somewhat
disappointed the global markets.
In terms of sector performance, metals and oil and gas sectors stood out. The metals
were led by recovery in global metal prices with aluminium and zinc particularly
showing strong momentum. Iron ore prices were up nearly 7% during the month.
Among energy companies, the Oil marketing companies had a good run as GRMs were
expected to hold steady. Also, the government has permitted oil companies to raise
prices of Kerosene by ` 0.25/ litre per month. This had a strong signaling effect to the
markets. The consumer goods companies did not do very well as their results showed
that demand growth remained weak. IT stocks did poorly in backdrop of weak earnings
and heightened global uncertainty post Brexit led to investors being cautious.
In macroeconomic news, the IIP for May came in at 1.2%, after a contraction of 1.3%
in April. While capital goods showed a negative growth, consumer durables were up
6%. The CPI for June was virtually flat at 5.8%, while the WPI was positive for the
third month in a row at 1.6%. The CPI inflation was driven primarily by food items
(pulses, sugar and vegetables) though the core inflation was lower at 4.5%. The rising
WPI however could going forward impact the companies’ profit margins unless they
take price hikes. The gold prices (USD) were up slightly at 2% during the month.
In trade data, exports growth turned positive after being negative for 18 consecutive
months. Exports for June were at USD 22.5 Billon (+1.8%). The monsoons remained
good and the sense is that rural demand should be positively impacted after the kharif
harvesting season.
In the earnings season so far, volume numbers have not shown any meaningful
improvement. However, EBITDA margins for non-financials have improved as result of
lower input prices. From the results declared so far, the earnings have been marginally
downgraded.
July 2016
PERFORMANCE AS ON JULY 29, 2016*
Index 1 Month 3 Months 6 Months 1 Year(%) (%) (%) (%)
Broad Markets
Nifty 50 8639 4.23 10.05 14.21 1.24
S&P BSE Sensex 28052 3.90 9.55 12.79 -0.22
S&P BSE 100 8856 5.05 11.06 15.74 2.34
S&P BSE 200 3692 5.07 11.15 15.70 2.87
S&P BSE 500 11586 5.05 11.34 15.70 3.14
S&P BSE MID CAP 12661 8.06 14.65 21.54 12.31
S&P BSE SMALL CAP 12310 4.31 11.70 13.25 4.05
Sectoral Performance
S&P BSE Auto 21091 8.31 14.19 23.73 10.38
S&P BSE Bankex 21679 7.13 13.41 23.15 0.83
S&P BSE CG 15478 5.31 17.23 25.14 -14.40
S&P BSE CD 12405 5.09 5.24 1.82 11.89
S&P BSE FMCG 8725 4.15 13.36 17.30 7.28
S&P BSE Metal 9406 12.33 18.18 36.44 8.51
S&P BSE Oil & Gas 10595 9.75 13.24 14.44 7.00
S&P BSE PSU 7186 8.05 14.64 15.26 -6.90
S&P BSE Teck 5951 -1.20 -2.79 0.39 -4.31
S&P BSE HC 16299 5.80 4.60 -0.04 -4.39
*Performance for less than one year period are absolute returns.
Source - MFI Explorer

INVEST KNOWHOW July 20165
Funds at a Glance
EQUITY SCHEMESParticulars Principal Principal Emerging Principal Principal Principal Principal
Large Cap Fund Bluechip Fund Growth Fund Dividend Yield Fund Index Fund - Nifty Index Fund - Midcap
Nature of the An Open-ended An Open-ended An Open-ended An Open-ended An Open-ended An Open-endedScheme Equity Scheme Equity Scheme Equity Scheme Equity Scheme Index Scheme Index Scheme
Allotment Date- Regular Plan November 11, 2005 November 12, 2008 October 25, 2000 October 15, 2004 July 27, 1999 May 12, 2014
- Direct Plan January 2, 2013 January 2, 2013 January 2, 2013 January 2, 2013 January 2, 2013 May 12, 2014
Investment Plans / Regular Plan & Direct Plan. Both the Plans offer Growth & Half Yearly Dividend Option. Regular Plan & Direct Plan. Both the Plans offerOptions Half Yearly Dividend Option under both the Plans offers facility of Payout, Reinvestment and Sweep. Growth & Dividend Option. Dividend Option under
both the Plans offers facility of Payout,Reinvestment and Sweep.
Fund Manager & Anupam Tiwari Dhimant Shah P.V.K. Mohan Dhimant Shah Rajat Jain Rajat JainManaging the July 2011 June 2011 September 2010 December 2011 August 2015 August 2015Current Fund from
Total Investment 11 years 24 years 23 years 24 years 27 years 27 yearsExperience
Benchmark S&P BSE 100 Index Nifty Free Float S&P BSE 200 Index Nifty Dividend Nifty 50 Index Nifty Free FloatMidcap 100 Index Opportunities 50 Index Midcap 100 Index
Minimum New Investor: ` 5,000 New Investor: ` 5,000 New Investor: ` 5,000 New Investor: ` 5,000 New Investor: ` 5,000 New Investor: ` 5,000Application Amount Existing Investor: ` 1,000 Existing Investor: ` 1,000 Existing Investor: ` 1,000 Existing Investor: ` 1,000 Existing Investor: ` 1,000 Existing Investor: ` 1,000
Cut Off Time# 3.00 pm 3.00 pm 3.00 pm 3.00 pm 3.00 pm 3.00 pm
Exit Load If redeemed on or before 1 Year from the 1% - If redeemed within If redeemed on or before 1% - if redeemed on or before 90 days(including SIP /STP / date of allotment - 1% 365 days from the 1 Year from the from the date of allotment;SWP, if available) date of allotment. date of allotment - 1% Nil - if redeemed after 90 days from the
Nil - If redeemed after date of allotment.365 days from thedate of allotment.
SIP / SWP / STP Available
Minimum No. & 6 installments of SIP - ` 2,000/- each, STP - ` 1,000/- each & SWP - ` 500/- each.Amt. of SIP/SWP/STP(if available)
Particulars Principal Principal Principal Personal Principal Principal PrincipalSMART Equity Fund Arbitrage Fund Tax Saver Fund Tax Savings Fund Balanced Fund Equity Savings Fund
Nature of the An Open-ended An Open-ended An Open-ended Equity An Open-ended Equity An Open-ended An Open-endedScheme Equity Scheme Equity Scheme Linked Savings Scheme Linked Savings Scheme Balanced Scheme Equity Scheme
Allotment Date- Regular Plan December 16, 2010 April 21, 2016 March 31, 1996 March 31, 1996 January 14, 2000 May 23, 2002
- Direct Plan January 2, 2013 April 21, 2016 January 2, 2013 January 2, 2013 January 2, 2013 January 2, 2013
Investment Plans / Regular Plan & Direct Plan. Regular Plan & Direct Plan. Regular Plan & Direct Plan. Regular Plan & Direct Plan. Regular Plan & Direct Plan. Regular Plan & Direct Plan.Options Both the Plans offer Growth & Both the Plans offer Both the Plan do not have Both the Plan do not have Both the Plans offer Growth & Both the Plans offer
Half Yearly Dividend Option. Growth & Dividend Option. any options at present. any options at present. Half Yearly Dividend Option. Dividend & Growth Option.Half Yearly Dividend Option Dividend Option under both Half Yearly Dividend Optionunder both the Plans offers the Plans offers facility of under both the Plan offersfacility of Payout, Payout, Reinvestment and facility of Payout,Reinvestment and Sweep. Sweep. Reinvestment and Sweep.
Fund Manager & Anupam Tiwari Rajat Jain Anupam Tiwari P.V.K. Mohan P.V.K. Mohan - May 2010 / P.V.K. MohanManaging the July 2011 April 2016 July 2011 September 2010 Bekxy Kuriakose - Mar 2016 June 2016Current Fund from
Total Investment 11 years 27 years 11 years 23 years 23 years / 23 yearsExperience 15 years
Benchmark Crisil Balanced Fund - CRISIL Liquid Fund Index S&P BSE 100 Index S&P BSE 200 Index Crisil Balanced Fund - 30% Nifty 50 Index +Aggressive Index Aggressive Index 70% CRISIL Liquid Fund Index
Minimum New Investor: ` 5,000 New Investor: ` 5,000 New Investor: ` 500 New Investor: ` 500 New Investor: ` 5,000 New Investor: ` 5,000Application Amount Existing Investor: ` 1,000 Existing Investor: ` 1,000 Existing Investor: ` 500 Existing Investor: ` 500 Existing Investor: ` 1,000 Existing Investor: ` 1,000
Cut Off Time# 3.00 pm 3.00 pm 3.00 pm 3.00 pm 3.00 pm 3.00 pm
Exit Load 1% if redeemed If redeemed on or before Nil Nil If redeemed on or before If redeemed /switched on(including SIP /STP / within 1 year from the 90 days from the date of 1 Year from the date of or before 365 days fromSWP, if available) date of allotment. allotment - 0.25%. allotment - 1%. the date of allotment - 1%.
If redeemed after 90 days After 365 days - NIL.from the date ofallotment - NIL.
SIP Available
SWP / STP Available Available after lock-in period Available Available
Minimum No. & 6 installment of SIP - ` 2,000/- each, 6 installments of ` 500/- each. 6 installment of SIP - ` 2,000/- each, STP - ` 1,000/- eachAmt. of SIP/SWP/STP STP - ` 1,000/- each & SWP - ` 500/- each. & SWP - ` 500/- each.(if available)
EQUITY SCHEME EQUITY LINKED SAVINGS SCHEME (ELSS)^ TARGET RISK FUNDS
# In respect of purchase/switch-in of units in any of the Schemes (other than Liquid Schemes) for an amount equal to or more than ` 2 Lakhs, the closing NAV (Net Asset Value) of the day shall be applicable subject to realisationof the funds upto 3.00 p.m. and receipt of application (duly time stamped). ^ Lock-in of 3 years.
INVEST KNOWHOW July 20166
Funds at a Glance (Contd.)
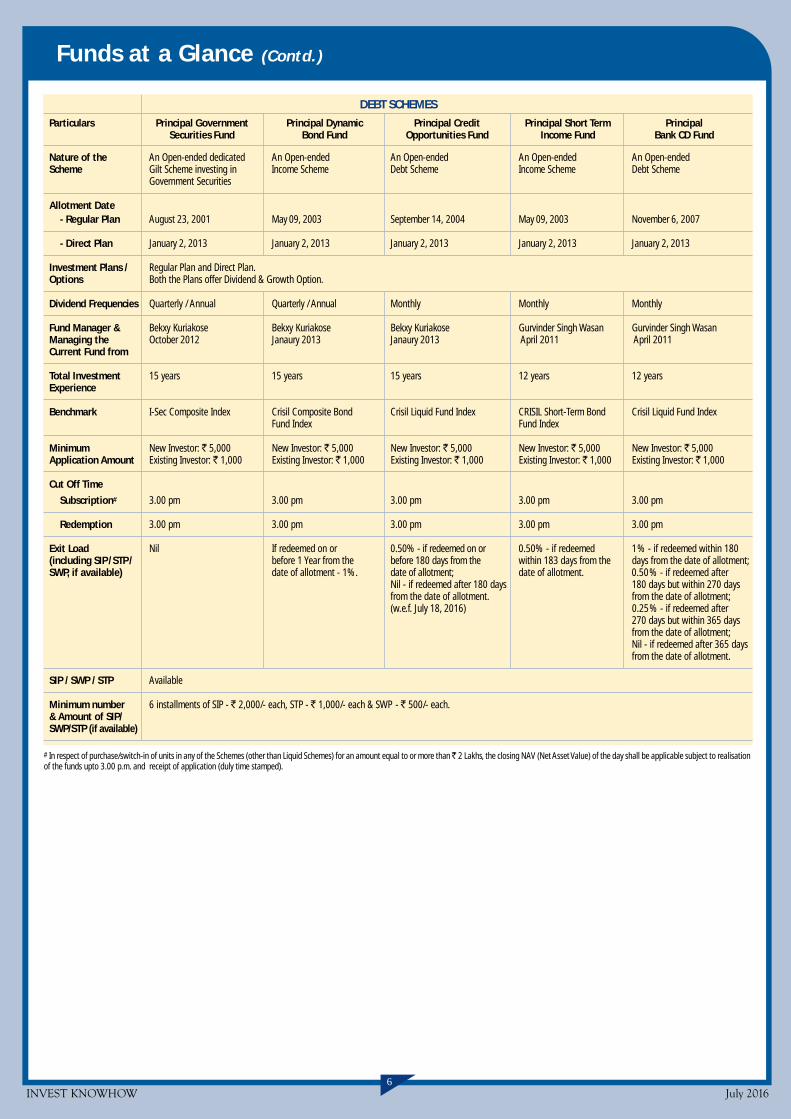
Particulars Principal Government Principal Dynamic Principal Credit Principal Short Term PrincipalSecurities Fund Bond Fund Opportunities Fund Income Fund Bank CD Fund
Nature of the An Open-ended dedicated An Open-ended An Open-ended An Open-ended An Open-endedScheme Gilt Scheme investing in Income Scheme Debt Scheme Income Scheme Debt Scheme
Government Securities
Allotment Date- Regular Plan August 23, 2001 May 09, 2003 September 14, 2004 May 09, 2003 November 6, 2007
- Direct Plan January 2, 2013 January 2, 2013 January 2, 2013 January 2, 2013 January 2, 2013
Investment Plans / Regular Plan and Direct Plan.Options Both the Plans offer Dividend & Growth Option.
Dividend Frequencies Quarterly / Annual Quarterly / Annual Monthly Monthly Monthly
Fund Manager & Bekxy Kuriakose Bekxy Kuriakose Bekxy Kuriakose Gurvinder Singh Wasan Gurvinder Singh WasanManaging the October 2012 Janaury 2013 Janaury 2013 April 2011 April 2011Current Fund from
Total Investment 15 years 15 years 15 years 12 years 12 yearsExperience
Benchmark I-Sec Composite Index Crisil Composite Bond Crisil Liquid Fund Index CRISIL Short-Term Bond Crisil Liquid Fund IndexFund Index Fund Index
Minimum New Investor: ` 5,000 New Investor: ` 5,000 New Investor: ` 5,000 New Investor: ` 5,000 New Investor: ` 5,000Application Amount Existing Investor: ` 1,000 Existing Investor: ` 1,000 Existing Investor: ` 1,000 Existing Investor: ` 1,000 Existing Investor: ` 1,000
Cut Off Time
Subscription# 3.00 pm 3.00 pm 3.00 pm 3.00 pm 3.00 pm
Redemption 3.00 pm 3.00 pm 3.00 pm 3.00 pm 3.00 pm
Exit Load Nil If redeemed on or 0.50% - if redeemed on or 0.50% - if redeemed 1% - if redeemed within 180(including SIP /STP / before 1 Year from the before 180 days from the within 183 days from the days from the date of allotment;SWP, if available) date of allotment - 1%. date of allotment; date of allotment. 0.50% - if redeemed after
Nil - if redeemed after 180 days 180 days but within 270 daysfrom the date of allotment. from the date of allotment;(w.e.f. July 18, 2016) 0.25% - if redeemed after
270 days but within 365 daysfrom the date of allotment;Nil - if redeemed after 365 daysfrom the date of allotment.
SIP / SWP / STP Available
Minimum number 6 installments of SIP - ` 2,000/- each, STP - ` 1,000/- each & SWP - ` 500/- each.& Amount of SIP/SWP/STP (if available)
DEBT SCHEMES
# In respect of purchase/switch-in of units in any of the Schemes (other than Liquid Schemes) for an amount equal to or more than ̀ 2 Lakhs, the closing NAV (Net Asset Value) of the day shall be applicable subject to realisationof the funds upto 3.00 p.m. and receipt of application (duly time stamped).
INVEST KNOWHOW July 20167
Funds at a Glance (Contd.)
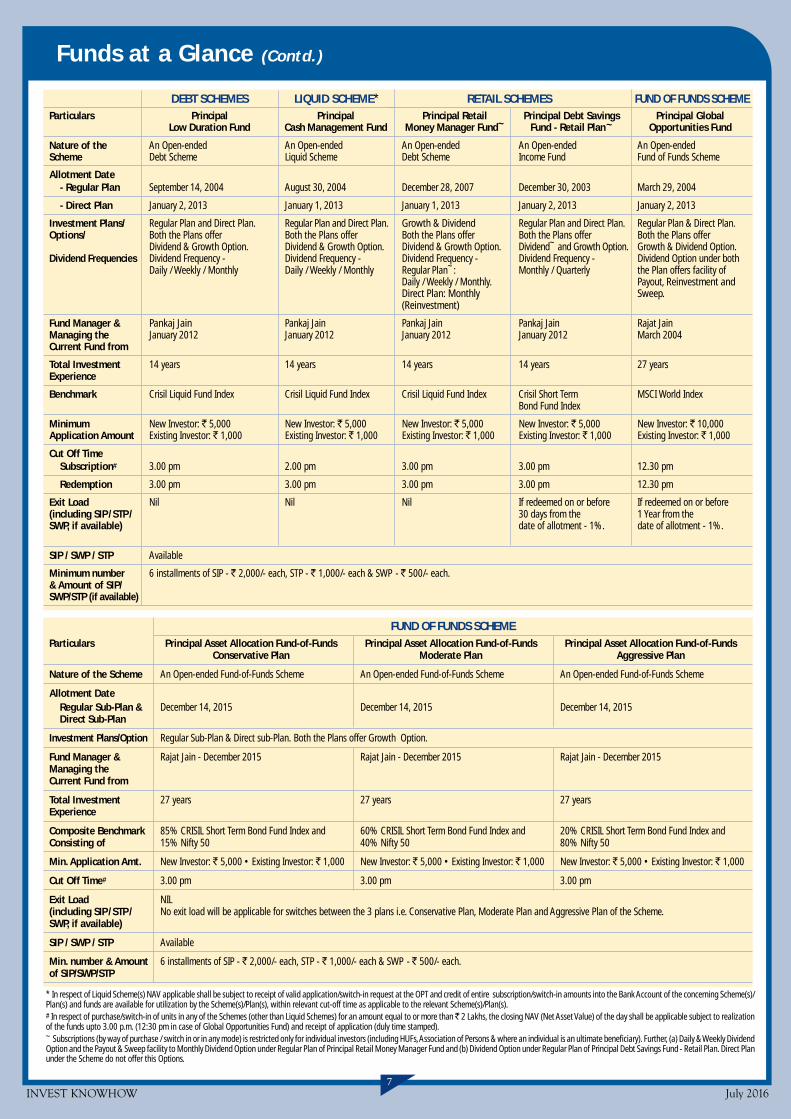
Particulars Principal Principal Principal Retail Principal Debt Savings Principal GlobalLow Duration Fund Cash Management Fund Money Manager Fund~ Fund - Retail Plan~ Opportunities Fund
Nature of the An Open-ended An Open-ended An Open-ended An Open-ended An Open-endedScheme Debt Scheme Liquid Scheme Debt Scheme Income Fund Fund of Funds Scheme
Allotment Date- Regular Plan September 14, 2004 August 30, 2004 December 28, 2007 December 30, 2003 March 29, 2004
- Direct Plan January 2, 2013 January 1, 2013 January 1, 2013 January 2, 2013 January 2, 2013
Investment Plans/ Regular Plan and Direct Plan. Regular Plan and Direct Plan. Growth & Dividend Regular Plan and Direct Plan. Regular Plan & Direct Plan.Options/ Both the Plans offer Both the Plans offer Both the Plans offer Both the Plans offer Both the Plans offer
Dividend & Growth Option. Dividend & Growth Option. Dividend & Growth Option. Dividend~ and Growth Option. Growth & Dividend Option.Dividend Frequencies Dividend Frequency - Dividend Frequency - Dividend Frequency - Dividend Frequency - Dividend Option under both
Daily / Weekly / Monthly Daily / Weekly / Monthly Regular Plan~: Monthly / Quarterly the Plan offers facility ofDaily / Weekly / Monthly. Payout, Reinvestment andDirect Plan: Monthly Sweep.(Reinvestment)
Fund Manager & Pankaj Jain Pankaj Jain Pankaj Jain Pankaj Jain Rajat JainManaging the January 2012 January 2012 January 2012 January 2012 March 2004Current Fund from
Total Investment 14 years 14 years 14 years 14 years 27 yearsExperience
Benchmark Crisil Liquid Fund Index Crisil Liquid Fund Index Crisil Liquid Fund Index Crisil Short Term MSCI World IndexBond Fund Index
Minimum New Investor: ` 5,000 New Investor: ` 5,000 New Investor: ` 5,000 New Investor: ` 5,000 New Investor: ` 10,000Application Amount Existing Investor: ` 1,000 Existing Investor: ` 1,000 Existing Investor: ` 1,000 Existing Investor: ` 1,000 Existing Investor: ` 1,000
Cut Off TimeSubscription# 3.00 pm 2.00 pm 3.00 pm 3.00 pm 12.30 pm
Redemption 3.00 pm 3.00 pm 3.00 pm 3.00 pm 12.30 pm
Exit Load Nil Nil Nil If redeemed on or before If redeemed on or before(including SIP /STP / 30 days from the 1 Year from theSWP, if available) date of allotment - 1%. date of allotment - 1%.
SIP / SWP / STP Available
Minimum number 6 installments of SIP - ` 2,000/- each, STP - ` 1,000/- each & SWP - ` 500/- each.& Amount of SIP/SWP/STP (if available)
DEBT SCHEMES RETAIL SCHEMESLIQUID SCHEME* FUND OF FUNDS SCHEME
* In respect of Liquid Scheme(s) NAV applicable shall be subject to receipt of valid application/switch-in request at the OPT and credit of entire subscription/switch-in amounts into the Bank Account of the concerning Scheme(s)/Plan(s) and funds are available for utilization by the Scheme(s)/Plan(s), within relevant cut-off time as applicable to the relevant Scheme(s)/Plan(s).# In respect of purchase/switch-in of units in any of the Schemes (other than Liquid Schemes) for an amount equal to or more than ` 2 Lakhs, the closing NAV (Net Asset Value) of the day shall be applicable subject to realizationof the funds upto 3.00 p.m. (12:30 pm in case of Global Opportunities Fund) and receipt of application (duly time stamped).~ Subscriptions (by way of purchase / switch in or in any mode) is restricted only for individual investors (including HUFs, Association of Persons & where an individual is an ultimate beneficiary). Further, (a) Daily & Weekly DividendOption and the Payout & Sweep facility to Monthly Dividend Option under Regular Plan of Principal Retail Money Manager Fund and (b) Dividend Option under Regular Plan of Principal Debt Savings Fund - Retail Plan. Direct Planunder the Scheme do not offer this Options.
Particulars Principal Asset Allocation Fund-of-Funds Principal Asset Allocation Fund-of-Funds Principal Asset Allocation Fund-of-FundsConservative Plan Moderate Plan Aggressive Plan
Nature of the Scheme An Open-ended Fund-of-Funds Scheme An Open-ended Fund-of-Funds Scheme An Open-ended Fund-of-Funds Scheme
Allotment DateRegular Sub-Plan & December 14, 2015 December 14, 2015 December 14, 2015Direct Sub-Plan
Investment Plans/Option Regular Sub-Plan & Direct sub-Plan. Both the Plans offer Growth Option.
Fund Manager & Rajat Jain - December 2015 Rajat Jain - December 2015 Rajat Jain - December 2015Managing theCurrent Fund from
Total Investment 27 years 27 years 27 yearsExperience
Composite Benchmark 85% CRISIL Short Term Bond Fund Index and 60% CRISIL Short Term Bond Fund Index and 20% CRISIL Short Term Bond Fund Index andConsisting of 15% Nifty 50 40% Nifty 50 80% Nifty 50
Min. Application Amt. New Investor: ` 5,000 • Existing Investor: ` 1,000 New Investor: ` 5,000 • Existing Investor: ` 1,000 New Investor: ` 5,000 • Existing Investor: ` 1,000
Cut Off Time# 3.00 pm 3.00 pm 3.00 pm
Exit Load NIL(including SIP /STP / No exit load will be applicable for switches between the 3 plans i.e. Conservative Plan, Moderate Plan and Aggressive Plan of the Scheme.SWP, if available)
SIP / SWP / STP Available
Min. number & Amount 6 installments of SIP - ` 2,000/- each, STP - ` 1,000/- each & SWP - ` 500/- each.of SIP/SWP/STP
FUND OF FUNDS SCHEME
INVEST KNOWHOW July 20168
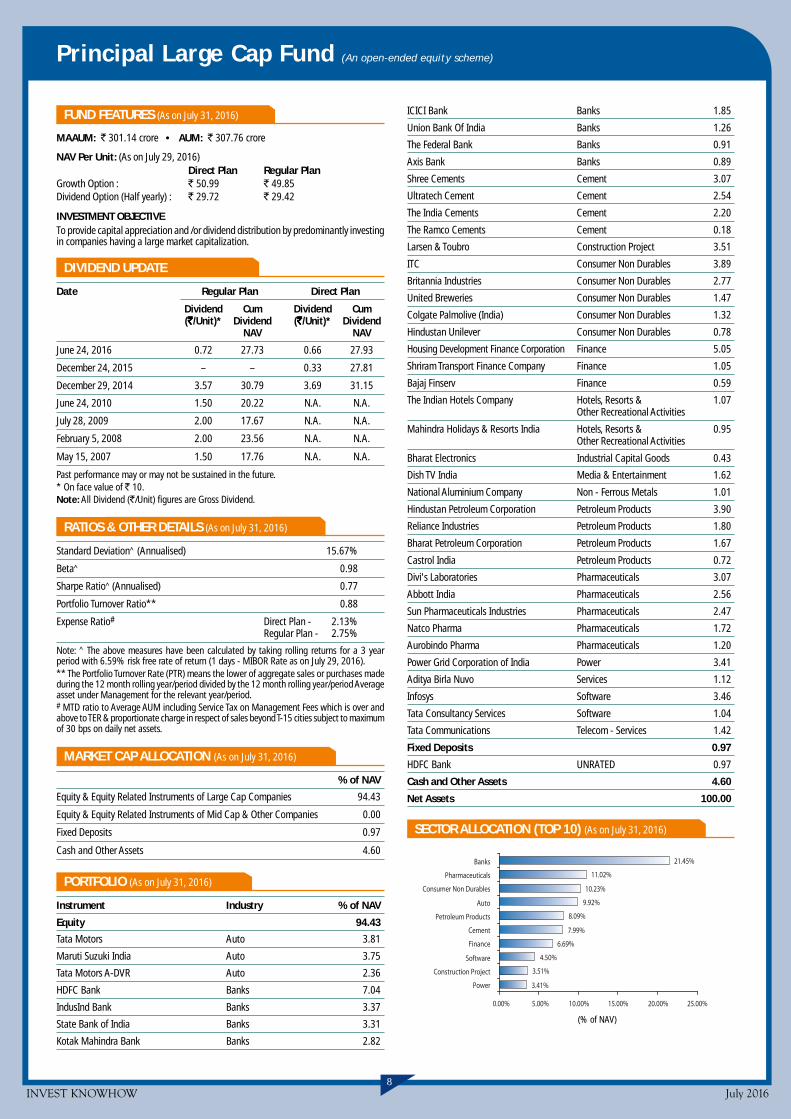
21.45%
11.02%
10.23%
9.92%
8.09%
7.99%
6.69%
4.50%
3.51%
3.41%
0.00% 5.00% 10.00% 15.00% 20.00% 25.00%
Banks
Pharmaceuticals
Consumer Non Durables
Auto
Petroleum Products
Cement
Finance
Software
Construction Project
Power
(% of NAV)
Principal Large Cap Fund (An open-ended equity scheme)
FUND FEATURES (As on July 31, 2016)
MAAUM: ` 301.14 crore • AUM: ` 307.76 crore
NAV Per Unit: (As on July 29, 2016)Direct Plan Regular Plan
Growth Option : ` 50.99 ` 49.85Dividend Option (Half yearly) : ` 29.72 ` 29.42
INVESTMENT OBJECTIVETo provide capital appreciation and /or dividend distribution by predominantly investingin companies having a large market capitalization.
DIVIDEND UPDATE
Date Regular Plan Direct Plan
Dividend Cum Dividend Cum(`̀̀̀̀/Unit)* Dividend (`̀̀̀̀/Unit)* Dividend
NAV NAV
June 24, 2016 0.72 27.73 0.66 27.93
December 24, 2015 – – 0.33 27.81
December 29, 2014 3.57 30.79 3.69 31.15
June 24, 2010 1.50 20.22 N.A. N.A.
July 28, 2009 2.00 17.67 N.A. N.A.
February 5, 2008 2.00 23.56 N.A. N.A.
May 15, 2007 1.50 17.76 N.A. N.A.
Past performance may or may not be sustained in the future.* On face value of ` 10.Note: All Dividend (`/Unit) figures are Gross Dividend.
RATIOS & OTHER DETAILS (As on July 31, 2016)
Standard Deviation^ (Annualised) 15.67%
Beta^ 0.98
Sharpe Ratio^ (Annualised) 0.77
Portfolio Turnover Ratio** 0.88
Expense Ratio# Direct Plan - 2.13%Regular Plan - 2.75%
Note: ^ The above measures have been calculated by taking rolling returns for a 3 yearperiod with 6.59% risk free rate of return (1 days - MIBOR Rate as on July 29, 2016).** The Portfolio Turnover Rate (PTR) means the lower of aggregate sales or purchases madeduring the 12 month rolling year/period divided by the 12 month rolling year/period Averageasset under Management for the relevant year/period.# MTD ratio to Average AUM including Service Tax on Management Fees which is over andabove to TER & proportionate charge in respect of sales beyond T-15 cities subject to maximumof 30 bps on daily net assets.
MARKET CAP ALLOCATION (As on July 31, 2016)
% of NAV
Equity & Equity Related Instruments of Large Cap Companies 94.43
Equity & Equity Related Instruments of Mid Cap & Other Companies 0.00
Fixed Deposits 0.97
Cash and Other Assets 4.60
PORTFOLIO (As on July 31, 2016)
Instrument Industry % of NAV
Equity 94.43
Tata Motors Auto 3.81
Maruti Suzuki India Auto 3.75
Tata Motors A-DVR Auto 2.36
HDFC Bank Banks 7.04
IndusInd Bank Banks 3.37
State Bank of India Banks 3.31
Kotak Mahindra Bank Banks 2.82
ICICI Bank Banks 1.85
Union Bank Of India Banks 1.26
The Federal Bank Banks 0.91
Axis Bank Banks 0.89
Shree Cements Cement 3.07
Ultratech Cement Cement 2.54
The India Cements Cement 2.20
The Ramco Cements Cement 0.18
Larsen & Toubro Construction Project 3.51
ITC Consumer Non Durables 3.89
Britannia Industries Consumer Non Durables 2.77
United Breweries Consumer Non Durables 1.47
Colgate Palmolive (India) Consumer Non Durables 1.32
Hindustan Unilever Consumer Non Durables 0.78
Housing Development Finance Corporation Finance 5.05
Shriram Transport Finance Company Finance 1.05
Bajaj Finserv Finance 0.59
The Indian Hotels Company Hotels, Resorts & 1.07Other Recreational Activities
Mahindra Holidays & Resorts India Hotels, Resorts & 0.95Other Recreational Activities
Bharat Electronics Industrial Capital Goods 0.43
Dish TV India Media & Entertainment 1.62
National Aluminium Company Non - Ferrous Metals 1.01
Hindustan Petroleum Corporation Petroleum Products 3.90
Reliance Industries Petroleum Products 1.80
Bharat Petroleum Corporation Petroleum Products 1.67
Castrol India Petroleum Products 0.72
Divi's Laboratories Pharmaceuticals 3.07
Abbott India Pharmaceuticals 2.56
Sun Pharmaceuticals Industries Pharmaceuticals 2.47
Natco Pharma Pharmaceuticals 1.72
Aurobindo Pharma Pharmaceuticals 1.20
Power Grid Corporation of India Power 3.41
Aditya Birla Nuvo Services 1.12
Infosys Software 3.46
Tata Consultancy Services Software 1.04
Tata Communications Telecom - Services 1.42
Fixed Deposits 0.97
HDFC Bank UNRATED 0.97
Cash and Other Assets 4.60
Net Assets 100.00
SECTOR ALLOCATION (TOP 10) (As on July 31, 2016)
INVEST KNOWHOW July 20169
Principal Emerging Bluechip Fund (An open-ended equity scheme)
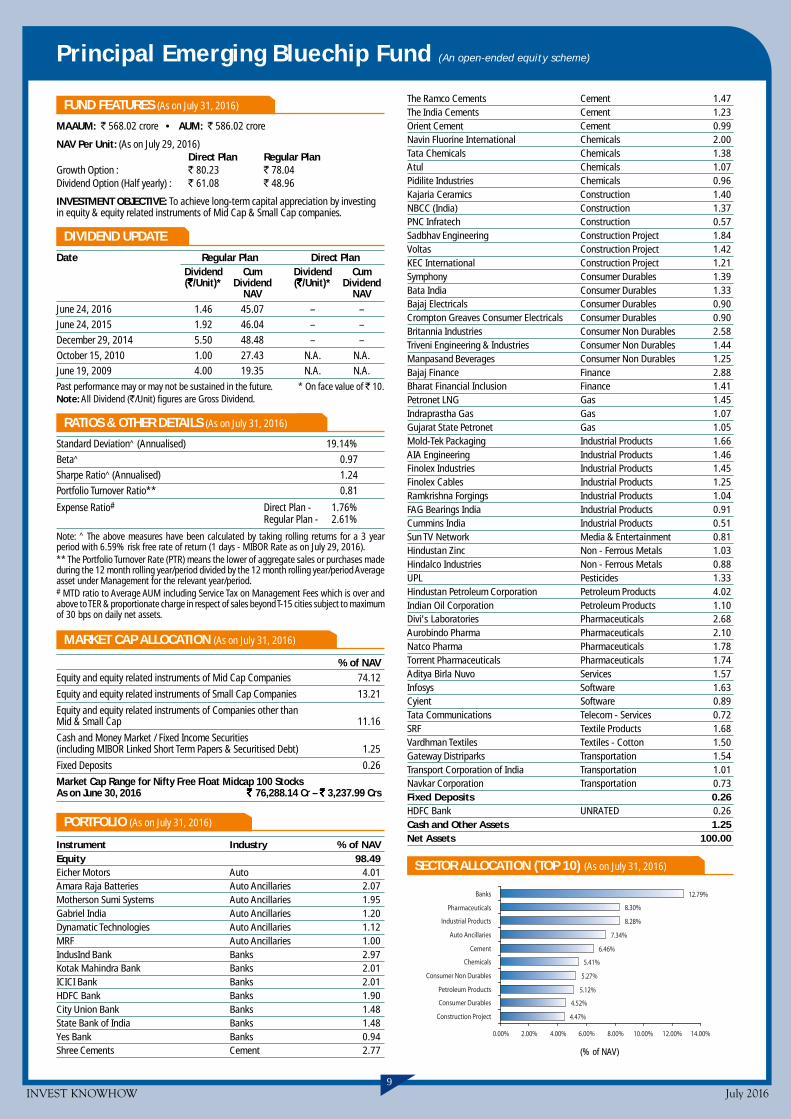
12.79%
8.30%
8.28%
7.34%
6.46%
5.41%
5.27%
5.12%
4.52%
4.47%
0.00% 2.00% 4.00% 6.00% 8.00% 10.00% 12.00% 14.00%
Banks
Pharmaceuticals
Industrial Products
Auto Ancillaries
Cement
Chemicals
Consumer Non Durables
Petroleum Products
Consumer Durables
Construction Project
FUND FEATURES (As on July 31, 2016)
MAAUM: ` 568.02 crore • AUM: ` 586.02 crore
NAV Per Unit: (As on July 29, 2016)Direct Plan Regular Plan
Growth Option : ` 80.23 ` 78.04Dividend Option (Half yearly) : ` 61.08 ` 48.96
INVESTMENT OBJECTIVE: To achieve long-term capital appreciation by investingin equity & equity related instruments of Mid Cap & Small Cap companies.
DIVIDEND UPDATE
Date Regular Plan Direct PlanDividend Cum Dividend Cum(`̀̀̀̀/Unit)* Dividend (`̀̀̀̀/Unit)* Dividend
NAV NAVJune 24, 2016 1.46 45.07 – –June 24, 2015 1.92 46.04 – –
December 29, 2014 5.50 48.48 – –
October 15, 2010 1.00 27.43 N.A. N.A.June 19, 2009 4.00 19.35 N.A. N.A.
Past performance may or may not be sustained in the future. * On face value of ` 10.Note: All Dividend (`/Unit) figures are Gross Dividend.
RATIOS & OTHER DETAILS (As on July 31, 2016)
Standard Deviation^ (Annualised) 19.14%
Beta^ 0.97
Sharpe Ratio^ (Annualised) 1.24
Portfolio Turnover Ratio** 0.81
Expense Ratio# Direct Plan - 1.76%Regular Plan - 2.61%
Note: ^ The above measures have been calculated by taking rolling returns for a 3 yearperiod with 6.59% risk free rate of return (1 days - MIBOR Rate as on July 29, 2016).** The Portfolio Turnover Rate (PTR) means the lower of aggregate sales or purchases madeduring the 12 month rolling year/period divided by the 12 month rolling year/period Averageasset under Management for the relevant year/period.# MTD ratio to Average AUM including Service Tax on Management Fees which is over andabove to TER & proportionate charge in respect of sales beyond T-15 cities subject to maximumof 30 bps on daily net assets.
MARKET CAP ALLOCATION (As on July 31, 2016)
% of NAVEquity and equity related instruments of Mid Cap Companies 74.12
Equity and equity related instruments of Small Cap Companies 13.21
Equity and equity related instruments of Companies other thanMid & Small Cap 11.16
Cash and Money Market / Fixed Income Securities(including MIBOR Linked Short Term Papers & Securitised Debt) 1.25
Fixed Deposits 0.26
Market Cap Range for Nifty Free Float Midcap 100 StocksAs on June 30, 2016 ` ` ` ` ` 76,288.14 Cr – `̀̀̀̀ 3,237.99 Crs
PORTFOLIO (As on July 31, 2016)
Instrument Industry % of NAVEquity 98.49Eicher Motors Auto 4.01Amara Raja Batteries Auto Ancillaries 2.07Motherson Sumi Systems Auto Ancillaries 1.95Gabriel India Auto Ancillaries 1.20Dynamatic Technologies Auto Ancillaries 1.12MRF Auto Ancillaries 1.00IndusInd Bank Banks 2.97Kotak Mahindra Bank Banks 2.01ICICI Bank Banks 2.01HDFC Bank Banks 1.90City Union Bank Banks 1.48State Bank of India Banks 1.48Yes Bank Banks 0.94Shree Cements Cement 2.77 (% of NAV)
The Ramco Cements Cement 1.47The India Cements Cement 1.23Orient Cement Cement 0.99Navin Fluorine International Chemicals 2.00Tata Chemicals Chemicals 1.38Atul Chemicals 1.07Pidilite Industries Chemicals 0.96Kajaria Ceramics Construction 1.40NBCC (India) Construction 1.37PNC Infratech Construction 0.57Sadbhav Engineering Construction Project 1.84Voltas Construction Project 1.42KEC International Construction Project 1.21Symphony Consumer Durables 1.39Bata India Consumer Durables 1.33Bajaj Electricals Consumer Durables 0.90Crompton Greaves Consumer Electricals Consumer Durables 0.90Britannia Industries Consumer Non Durables 2.58Triveni Engineering & Industries Consumer Non Durables 1.44Manpasand Beverages Consumer Non Durables 1.25Bajaj Finance Finance 2.88Bharat Financial Inclusion Finance 1.41Petronet LNG Gas 1.45Indraprastha Gas Gas 1.07Gujarat State Petronet Gas 1.05Mold-Tek Packaging Industrial Products 1.66AIA Engineering Industrial Products 1.46Finolex Industries Industrial Products 1.45Finolex Cables Industrial Products 1.25Ramkrishna Forgings Industrial Products 1.04FAG Bearings India Industrial Products 0.91Cummins India Industrial Products 0.51Sun TV Network Media & Entertainment 0.81Hindustan Zinc Non - Ferrous Metals 1.03Hindalco Industries Non - Ferrous Metals 0.88UPL Pesticides 1.33Hindustan Petroleum Corporation Petroleum Products 4.02Indian Oil Corporation Petroleum Products 1.10Divi's Laboratories Pharmaceuticals 2.68Aurobindo Pharma Pharmaceuticals 2.10Natco Pharma Pharmaceuticals 1.78Torrent Pharmaceuticals Pharmaceuticals 1.74Aditya Birla Nuvo Services 1.57Infosys Software 1.63Cyient Software 0.89Tata Communications Telecom - Services 0.72SRF Textile Products 1.68Vardhman Textiles Textiles - Cotton 1.50Gateway Distriparks Transportation 1.54Transport Corporation of India Transportation 1.01Navkar Corporation Transportation 0.73Fixed Deposits 0.26HDFC Bank UNRATED 0.26Cash and Other Assets 1.25Net Assets 100.00
SECTOR ALLOCATION (TOP 10) (As on July 31, 2016)
INVEST KNOWHOW July 201610
Principal Growth Fund (An open-ended equity scheme)
FUND FEATURES (As on July 31, 2016)
MAAUM: ` 386.83 crore • AUM: ` 393.17 crore
NAV Per Unit: (As on July 29, 2016)Direct Plan Regular Plan
Growth Option : ` 105.50 ` 103.16Dividend Option (Half yearly) : ` 43.03 ` 40.39
INVESTMENT OBJECTIVE: To achieve long-term capital appreciation.
DIVIDEND UPDATE
Date Regular Plan Direct PlanDividend Cum Dividend Cum(`̀̀̀̀/Unit)* Dividend (`̀̀̀̀/Unit)* Dividend
NAV NAV
June 24, 2016 – – 0.52 40.06
December 24, 2015 0.85 38.04 1.18 41.16
December 29, 2014 4.88 41.86 2.62 42.36
December 31, 2007 2.50 37.14 N.A. N.A.
March 20, 2006 2.50 24.64 N.A. N.A.
Past performance may or may not be sustained in the future.* On face value of ` 10.Note: All Dividend (`/Unit) figures are Gross Dividend.
RATIOS & OTHER DETAILS (As on July 31, 2016)
Standard Deviation^ (Annualised) 18.49%
Beta^ 1.14
Sharpe Ratio^ (Annualised) 0.85
Portfolio Turnover Ratio** 0.66
Expense Ratio# Direct Plan - 2.13%Regular Plan - 2.78%
Note: ^ The above measures have been calculated by taking rolling returns for a 3 yearperiod with 6.59% risk free rate of return (1 days - MIBOR Rate as on July 29, 2016).** The Portfolio Turnover Rate (PTR) means the lower of aggregate sales or purchases madeduring the 12 month rolling year/period divided by the 12 month rolling year/period Averageasset under Management for the relevant year/period.# MTD ratio to Average AUM including Service Tax on Management Fees which is over andabove to TER & proportionate charge in respect of sales beyond T-15 cities subject to maximumof 30 bps on daily net assets.
PORTFOLIO (As on July 31, 2016)
Instrument Industry % of NAV
Equity 92.85Tata Motors Auto 2.89
Escorts Auto 2.32
Maruti Suzuki India Auto 1.94
Hero MotoCorp Auto 1.18
Bajaj Auto Auto 1.06
Asahi India Glass Auto Ancillaries 1.13
HDFC Bank Banks 5.64
ICICI Bank Banks 4.16
State Bank of India Banks 3.17
Bank of Baroda Banks 1.19
The Federal Bank Banks 1.15
Axis Bank Banks 1.07
Yes Bank Banks 1.04
City Union Bank Banks 0.97
Kotak Mahindra Bank Banks 0.97
Canara Bank Banks 0.95
Union Bank Of India Banks 0.93
The India Cements Cement 2.53
Century Textiles & Industries Cement 1.63
Ultratech Cement Cement 1.46
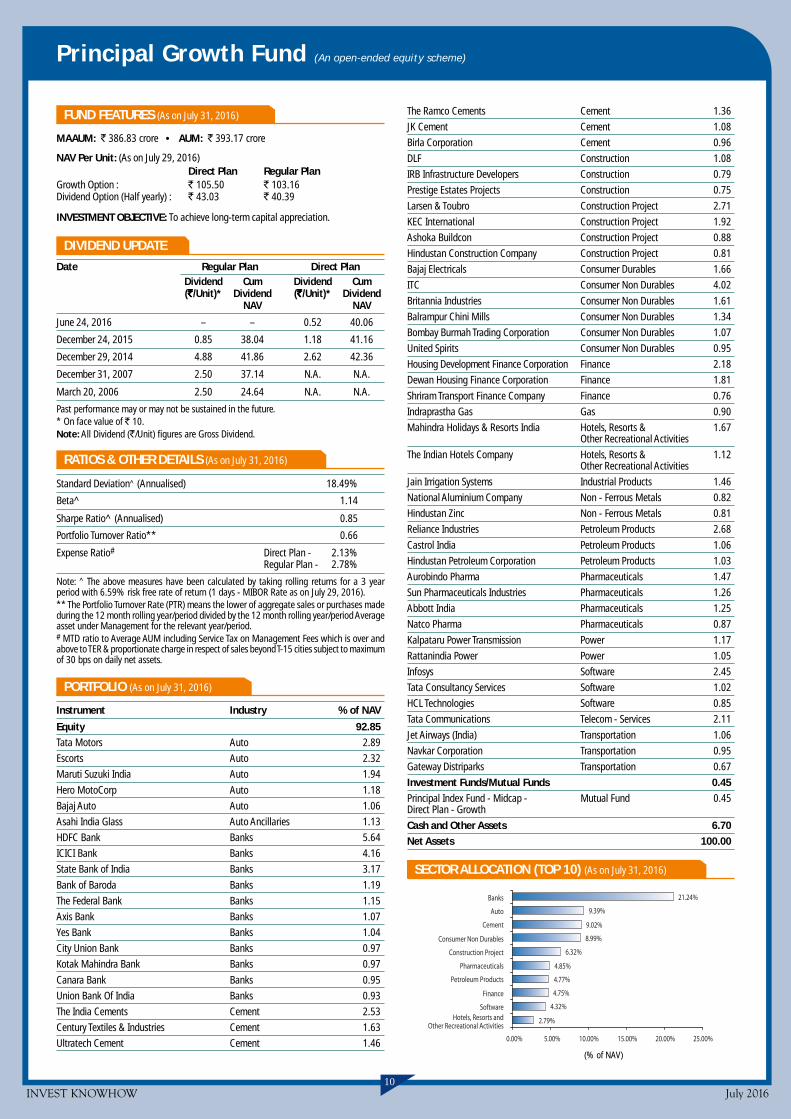
21.24%
9.39%
9.02%
8.99%
6.32%
4.85%
4.77%
4.75%
4.32%
2.79%
0.00% 5.00% 10.00% 15.00% 20.00% 25.00%
Banks
Auto
Cement
Consumer Non Durables
Construction Project
Pharmaceuticals
Petroleum Products
Finance
SoftwareHotels, Resorts and
Other Recreational Activities
(% of NAV)
The Ramco Cements Cement 1.36
JK Cement Cement 1.08
Birla Corporation Cement 0.96
DLF Construction 1.08
IRB Infrastructure Developers Construction 0.79
Prestige Estates Projects Construction 0.75
Larsen & Toubro Construction Project 2.71
KEC International Construction Project 1.92
Ashoka Buildcon Construction Project 0.88
Hindustan Construction Company Construction Project 0.81
Bajaj Electricals Consumer Durables 1.66
ITC Consumer Non Durables 4.02
Britannia Industries Consumer Non Durables 1.61
Balrampur Chini Mills Consumer Non Durables 1.34
Bombay Burmah Trading Corporation Consumer Non Durables 1.07
United Spirits Consumer Non Durables 0.95
Housing Development Finance Corporation Finance 2.18
Dewan Housing Finance Corporation Finance 1.81
Shriram Transport Finance Company Finance 0.76
Indraprastha Gas Gas 0.90
Mahindra Holidays & Resorts India Hotels, Resorts & 1.67Other Recreational Activities
The Indian Hotels Company Hotels, Resorts & 1.12Other Recreational Activities
Jain Irrigation Systems Industrial Products 1.46
National Aluminium Company Non - Ferrous Metals 0.82
Hindustan Zinc Non - Ferrous Metals 0.81
Reliance Industries Petroleum Products 2.68
Castrol India Petroleum Products 1.06
Hindustan Petroleum Corporation Petroleum Products 1.03
Aurobindo Pharma Pharmaceuticals 1.47
Sun Pharmaceuticals Industries Pharmaceuticals 1.26
Abbott India Pharmaceuticals 1.25
Natco Pharma Pharmaceuticals 0.87
Kalpataru Power Transmission Power 1.17
Rattanindia Power Power 1.05
Infosys Software 2.45
Tata Consultancy Services Software 1.02
HCL Technologies Software 0.85
Tata Communications Telecom - Services 2.11
Jet Airways (India) Transportation 1.06
Navkar Corporation Transportation 0.95
Gateway Distriparks Transportation 0.67
Investment Funds/Mutual Funds 0.45Principal Index Fund - Midcap - Mutual Fund 0.45Direct Plan - Growth
Cash and Other Assets 6.70Net Assets 100.00
SECTOR ALLOCATION (TOP 10) (As on July 31, 2016)
INVEST KNOWHOW July 201611
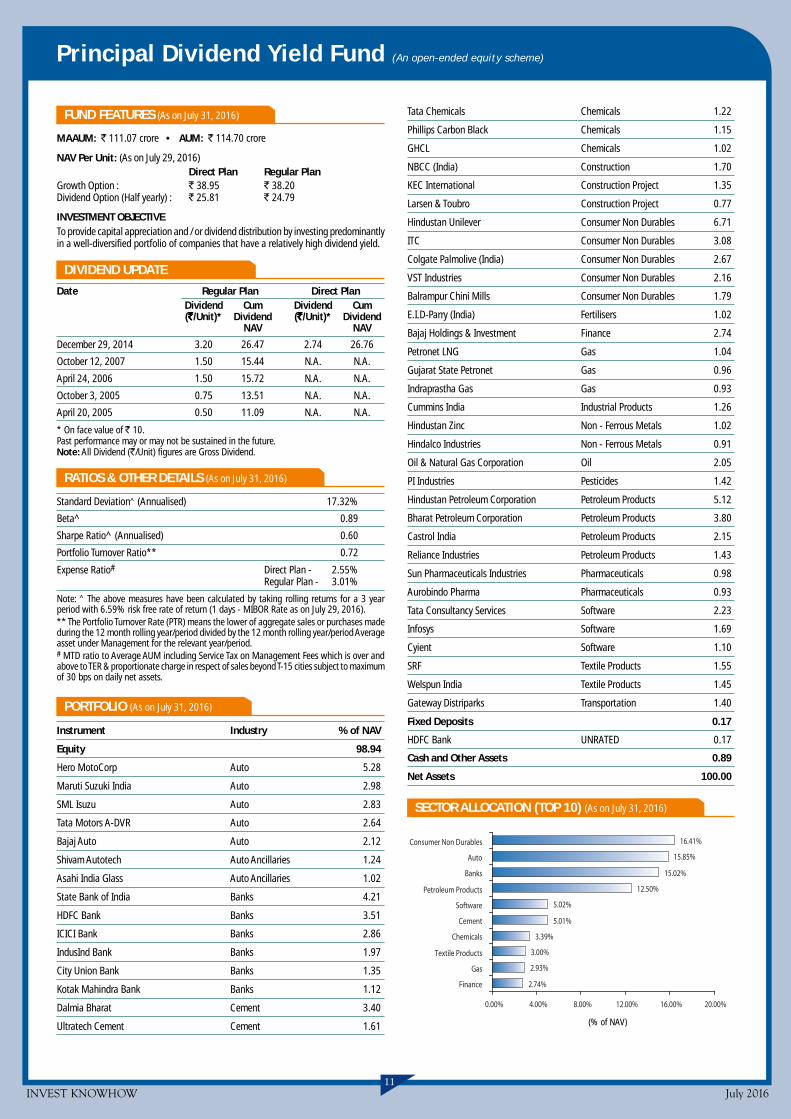
16.41%
15.85%
15.02%
12.50%
5.02%
5.01%
3.39%
3.00%
2.93%
2.74%
0.00% 4.00% 8.00% 12.00% 16.00% 20.00%
Consumer Non Durables
Auto
Banks
Petroleum Products
Software
Cement
Chemicals
Textile Products
Gas
Finance
(% of NAV)
Principal Dividend Yield Fund (An open-ended equity scheme)
Tata Chemicals Chemicals 1.22
Phillips Carbon Black Chemicals 1.15
GHCL Chemicals 1.02
NBCC (India) Construction 1.70
KEC International Construction Project 1.35
Larsen & Toubro Construction Project 0.77
Hindustan Unilever Consumer Non Durables 6.71
ITC Consumer Non Durables 3.08
Colgate Palmolive (India) Consumer Non Durables 2.67
VST Industries Consumer Non Durables 2.16
Balrampur Chini Mills Consumer Non Durables 1.79
E.I.D-Parry (India) Fertilisers 1.02
Bajaj Holdings & Investment Finance 2.74
Petronet LNG Gas 1.04
Gujarat State Petronet Gas 0.96
Indraprastha Gas Gas 0.93
Cummins India Industrial Products 1.26
Hindustan Zinc Non - Ferrous Metals 1.02
Hindalco Industries Non - Ferrous Metals 0.91
Oil & Natural Gas Corporation Oil 2.05
PI Industries Pesticides 1.42
Hindustan Petroleum Corporation Petroleum Products 5.12
Bharat Petroleum Corporation Petroleum Products 3.80
Castrol India Petroleum Products 2.15
Reliance Industries Petroleum Products 1.43
Sun Pharmaceuticals Industries Pharmaceuticals 0.98
Aurobindo Pharma Pharmaceuticals 0.93
Tata Consultancy Services Software 2.23
Infosys Software 1.69
Cyient Software 1.10
SRF Textile Products 1.55
Welspun India Textile Products 1.45
Gateway Distriparks Transportation 1.40
Fixed Deposits 0.17
HDFC Bank UNRATED 0.17
Cash and Other Assets 0.89
Net Assets 100.00
SECTOR ALLOCATION (TOP 10) (As on July 31, 2016)
FUND FEATURES (As on July 31, 2016)
MAAUM: ` 111.07 crore • AUM: ` 114.70 crore
NAV Per Unit: (As on July 29, 2016)Direct Plan Regular Plan
Growth Option : ` 38.95 ` 38.20Dividend Option (Half yearly) : ` 25.81 ` 24.79
INVESTMENT OBJECTIVETo provide capital appreciation and / or dividend distribution by investing predominantlyin a well-diversified portfolio of companies that have a relatively high dividend yield.
DIVIDEND UPDATE
Date Regular Plan Direct PlanDividend Cum Dividend Cum(`̀̀̀̀/Unit)* Dividend (`̀̀̀̀/Unit)* Dividend
NAV NAV
December 29, 2014 3.20 26.47 2.74 26.76
October 12, 2007 1.50 15.44 N.A. N.A.
April 24, 2006 1.50 15.72 N.A. N.A.
October 3, 2005 0.75 13.51 N.A. N.A.
April 20, 2005 0.50 11.09 N.A. N.A.
* On face value of ` 10.Past performance may or may not be sustained in the future.Note: All Dividend (`/Unit) figures are Gross Dividend.
RATIOS & OTHER DETAILS (As on July 31, 2016)
Standard Deviation^ (Annualised) 17.32%
Beta^ 0.89
Sharpe Ratio^ (Annualised) 0.60
Portfolio Turnover Ratio** 0.72
Expense Ratio# Direct Plan - 2.55%Regular Plan - 3.01%
Note: ^ The above measures have been calculated by taking rolling returns for a 3 yearperiod with 6.59% risk free rate of return (1 days - MIBOR Rate as on July 29, 2016).** The Portfolio Turnover Rate (PTR) means the lower of aggregate sales or purchases madeduring the 12 month rolling year/period divided by the 12 month rolling year/period Averageasset under Management for the relevant year/period.# MTD ratio to Average AUM including Service Tax on Management Fees which is over andabove to TER & proportionate charge in respect of sales beyond T-15 cities subject to maximumof 30 bps on daily net assets.
PORTFOLIO (As on July 31, 2016)
Instrument Industry % of NAV
Equity 98.94
Hero MotoCorp Auto 5.28
Maruti Suzuki India Auto 2.98
SML Isuzu Auto 2.83
Tata Motors A-DVR Auto 2.64
Bajaj Auto Auto 2.12
Shivam Autotech Auto Ancillaries 1.24
Asahi India Glass Auto Ancillaries 1.02
State Bank of India Banks 4.21
HDFC Bank Banks 3.51
ICICI Bank Banks 2.86
IndusInd Bank Banks 1.97
City Union Bank Banks 1.35
Kotak Mahindra Bank Banks 1.12
Dalmia Bharat Cement 3.40
Ultratech Cement Cement 1.61
INVEST KNOWHOW July 201612
Principal Index Fund - Nifty (An open-ended index scheme)
FUND FEATURES (As on July 31, 2016)
MAAUM: ` 24.43 crore • AUM: ` 24.86 crore
NAV Per Unit: (As on July 29, 2016)Direct Plan Regular Plan
Growth Option : ` 60.7908 ` 59.7796Dividend Option : ` 35.7261 ` 35.1338
INVESTMENT OBJECTIVETo invest principally in securities that comprise Nifty 50 and subject to tracking errorsendeavour to attain results commensurate with the Nifty 50.
DIVIDEND UPDATE (REGULAR PLAN)
Date Dividend (`̀̀̀̀/Unit)* Cum Dividend NAVDecember 24, 2008 3.7500 15.7934
* On face value of ` 10.Past performance may or may not be sustained in the future.Note: All Dividend (`/Unit) figures are Gross Dividend.
RATIOS & OTHER DETAILS (As on July 31, 2016)
Standard Deviation^ (Annualised) 15.24%
Beta^ 1.00
Sharpe Ratio^ (Annualised) 0.41
Portfolio Turnover Ratio** 0.23
Expense Ratio Direct Plan - 0.50%Regular Plan - 1.00%
Note: ^ The above measures have been calculated by taking rolling returns for a 3 yearperiod with 6.59% risk free rate of return (1 days - MIBOR Rate as on July 29, 2016).** The Portfolio Turnover Rate (PTR) means the lower of aggregate sales or purchases madeduring the 12 month rolling year/period divided by the 12 month rolling year/period Averageasset under Management for the relevant year/period.
TRACKING DEVIATION
0.12%*
* Trailing 12 months ended July 29, 2016 (Annualized).
PORTFOLIO (As on July 31, 2016)
Instrument Industry % of NAV
Equity 99.76
Tata Motors Auto 3.08
Mahindra & Mahindra Auto 2.16
Maruti Suzuki India Auto 2.00
Hero MotoCorp Auto 1.27
Bajaj Auto Auto 1.15
Eicher Motors Auto 0.86
Tata Motors A-DVR Auto 0.51
Bosch Auto Ancillaries 0.71
HDFC Bank Banks 7.88
ICICI Bank Banks 4.84
Axis Bank Banks 2.88
Kotak Mahindra Bank Banks 2.57
State Bank of India Banks 2.25
IndusInd Bank Banks 1.81
Yes Bank Banks 1.25
Bank of Baroda Banks 0.45
Ultratech Cement Cement 1.22(% of NAV)
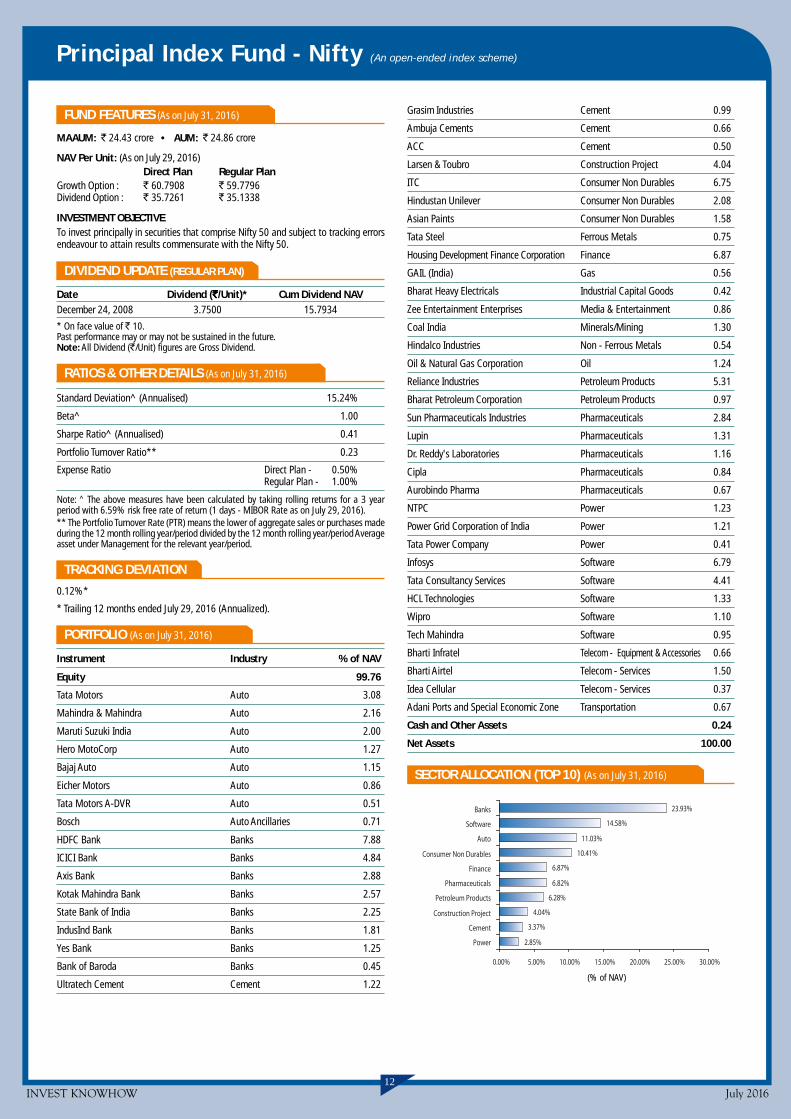
23.93%
14.58%
11.03%
10.41%
6.87%
6.82%
6.28%
4.04%
3.37%
2.85%
0.00% 5.00% 10.00% 15.00% 20.00% 25.00% 30.00%
Banks
Software
Auto
Consumer Non Durables
Finance
Pharmaceuticals
Petroleum Products
Construction Project
Cement
Power
Grasim Industries Cement 0.99
Ambuja Cements Cement 0.66
ACC Cement 0.50
Larsen & Toubro Construction Project 4.04
ITC Consumer Non Durables 6.75
Hindustan Unilever Consumer Non Durables 2.08
Asian Paints Consumer Non Durables 1.58
Tata Steel Ferrous Metals 0.75
Housing Development Finance Corporation Finance 6.87
GAIL (India) Gas 0.56
Bharat Heavy Electricals Industrial Capital Goods 0.42
Zee Entertainment Enterprises Media & Entertainment 0.86
Coal India Minerals/Mining 1.30
Hindalco Industries Non - Ferrous Metals 0.54
Oil & Natural Gas Corporation Oil 1.24
Reliance Industries Petroleum Products 5.31
Bharat Petroleum Corporation Petroleum Products 0.97
Sun Pharmaceuticals Industries Pharmaceuticals 2.84
Lupin Pharmaceuticals 1.31
Dr. Reddy's Laboratories Pharmaceuticals 1.16
Cipla Pharmaceuticals 0.84
Aurobindo Pharma Pharmaceuticals 0.67
NTPC Power 1.23
Power Grid Corporation of India Power 1.21
Tata Power Company Power 0.41
Infosys Software 6.79
Tata Consultancy Services Software 4.41
HCL Technologies Software 1.33
Wipro Software 1.10
Tech Mahindra Software 0.95
Bharti Infratel Telecom - Equipment & Accessories 0.66
Bharti Airtel Telecom - Services 1.50
Idea Cellular Telecom - Services 0.37
Adani Ports and Special Economic Zone Transportation 0.67
Cash and Other Assets 0.24
Net Assets 100.00
SECTOR ALLOCATION (TOP 10) (As on July 31, 2016)

INVEST KNOWHOW July 201613
Principal Index Fund - Midcap (An open-ended index scheme)
FUND FEATURES (As on July 31, 2016)
MAAUM: ` 5.94 crore • AUM: ` 5.42 crore
NAV Per Unit: (As on July 29, 2016)Direct Plan Regular Plan
Growth Option : ` 16.4174 ` 16.2329Dividend Option : ` 16.4174 ` 16.2329
INVESTMENT OBJECTIVETo invest principally in securities that comprise Nifty Free Float Midcap 100 Index andsubject to tracking errors endevour to attain results commensurate with the Nifty FreeFloat Midcap 100 Index.
RATIOS & OTHER DETAILS (As on July 31, 2016)
Portfolio Turnover Ratio** 0.88
Expense Ratio Direct Plan - 0.50%Regular Plan - 1.00%
** The Portfolio Turnover Rate (PTR) means the lower of aggregate sales or purchases madeduring the 12 month rolling year/period divided by the 12 month rolling year/period Averageasset under Management for the relevant year/period.
PORTFOLIO (As on July 31, 2016)
Instrument Industry % of NAV
Equity 99.16TVS Motor Company Auto 0.97MRF Auto Ancillaries 1.37Exide Industries Auto Ancillaries 1.34Amara Raja Batteries Auto Ancillaries 1.25Apollo Tyres # Auto Ancillaries 0.76CEAT Auto Ancillaries 0.28The Karur Vysya Bank Banks 0.93Canara Bank Banks 0.58Union Bank Of India Banks 0.53The South Indian Bank Banks 0.47DCB Bank Banks 0.43Bank of India Banks 0.42IDBI Bank Banks 0.42Shree Cements Cement 2.29The Ramco Cements Cement 1.15Century Textiles & Industries Cement 0.62Pidilite Industries Chemicals 1.83Tata Chemicals Chemicals 1.36DLF Construction 1.17IRB Infrastructure Developers Construction 0.52Voltas Construction Project 1.32GMR Infrastructure Construction Project 0.53NCC Construction Project 0.44Havells India Consumer Durables 1.51Rajesh Exports Consumer Durables 0.97Bata India Consumer Durables 0.60Marico Consumer Non Durables 2.39GlaxoSmithKline Consumer Healthcare Consumer Non Durables 1.21Emami Consumer Non Durables 1.14Procter & Gamble Hygiene and Health Care Consumer Non Durables 1.01Tata Global Beverages Consumer Non Durables 0.96United Breweries Consumer Non Durables 0.91Kansai Nerolac Paints Consumer Non Durables 0.81Godrej Industries Consumer Non Durables 0.59Jubilant Foodworks Consumer Non Durables 0.54JSW Steel Ferrous Metals 2.90Steel Authority of India Ferrous Metals 0.79Jindal Steel & Power Ferrous Metals 0.47Bajaj Finance Finance 3.56Bajaj Finserv Finance 2.68Bharat Financial Inclusion Finance 1.66Power Finance Corporation Finance 1.50Mahindra & Mahindra Financial Services Finance 1.47Reliance Capital Finance 0.89CRISIL Finance 0.78L & T Finance Holdings Finance 0.74Dewan Housing Finance Corporation Finance 0.57
(% of NAV)
13.85%
11.29%
9.56%
5.67%
5.32%
5.12%
5.00%
4.16%
4.06%
3.78%
0.00% 2.00% 4.00% 6.00% 8.00% 10.00% 12.00% 14.00% 16.00%
Finance
Pharmaceuticals
Consumer Non Durables
Industrial Capital Goods
Software
Power
Auto Ancillaries
Ferrous Metals
Cement
Banks
Petronet LNG Gas 1.46Indraprastha Gas Gas 0.74Gujarat State Petronet Gas 0.62Apollo Hospitals Enterprise Healthcare Services 1.70The Indian Hotels Company Hotels, Resorts & 1.32
Other Recreational ActivitiesSiemens Industrial Capital Goods 1.91Bharat Electronics Industrial Capital Goods 1.21ABB India Industrial Capital Goods 1.09Suzlon Energy Industrial Capital Goods 0.84Thermax Industrial Capital Goods 0.62Sintex Industries Industrial Products 0.38Sun TV Network Media & Entertainment 0.72Dish TV India Media & Entertainment 0.64NMDC Minerals/Mining 1.29Hindustan Zinc Non - Ferrous Metals 0.84Cairn India Oil 1.75Oil India Oil 0.83Piramal Enterprises Pharmaceuticals 2.12Cadila Healthcare Pharmaceuticals 1.53Torrent Pharmaceuticals Pharmaceuticals 1.15Strides Shasun Pharmaceuticals 1.13Biocon Pharmaceuticals 0.89Natco Pharma Pharmaceuticals 0.81Sanofi India Pharmaceuticals 0.68Ajanta Pharma Pharmaceuticals 0.66IPCA Laboratories Pharmaceuticals 0.57Alembic Pharmaceuticals Pharmaceuticals 0.50Wockhardt Pharmaceuticals 0.47Sun Pharma Advanced Research Company Pharmaceuticals 0.40Jubilant Life Sciences Pharmaceuticals 0.38Reliance Infrastructure Power 1.35NHPC Power 1.14CESC Power 0.66Reliance Power Power 0.62Torrent Power Power 0.46JSW Energy Power 0.46Adani Power Power 0.43Oracle Financial Services Software Software 1.33MindTree Software 1.04Vakrangee Software 0.93Mphasis Software 0.74Persistent Systems Software 0.51Tata Elxsi Software 0.46Just Dial Software 0.31Reliance Communications Telecom - Services 0.87Tata Communications Telecom - Services 0.51Page Industries Textile Products 1.32Arvind Textile Products 0.72SRF Textile Products 0.66Adani Enterprises Trading 0.36Container Corporation of India Transportation 2.05Gujarat Pipavav Port Transportation 0.77The Great Eastern Shipping Company Transportation 0.58Cash and Other Assets 0.84
Net Assets 100.00
SECTOR ALLOCATION (TOP 10) (As on July 31, 2016)

INVEST KNOWHOW July 201614
Principal SMART Equity Fund (An open-ended equity scheme)
Mahindra Holidays & Resorts India Hotels, Resorts & 0.36Other Recreational Activities
Bharat Electronics Industrial Capital Goods 0.16Dish TV India Media & Entertainment 0.61National Aluminium Company Non - Ferrous Metals 0.38Hindustan Petroleum Corporation Petroleum Products 1.48Reliance Industries Petroleum Products 0.68Bharat Petroleum Corporation Petroleum Products 0.63Castrol India Petroleum Products 0.27Divi's Laboratories Pharmaceuticals 1.16Abbott India Pharmaceuticals 0.97Sun Pharmaceuticals Industries Pharmaceuticals 0.93Natco Pharma Pharmaceuticals 0.65Aurobindo Pharma Pharmaceuticals 0.45Power Grid Corporation of India Power 1.29Aditya Birla Nuvo Services 0.42Infosys Software 1.31Tata Consultancy Services Software 0.40Tata Communications Telecom - Services 0.54Cash Future Arbitrage 31.00 -31.17Reliance Industries Petroleum Products 5.19Reliance Industries Stock Future -5.22Hindustan Unilever Consumer Non Durables 5.09Hindustan Unilever Stock Future -5.12HDFC Bank Banks 6.46HDFC Bank Stock Future -6.50Infosys Software 4.55Infosys Stock Future -4.58Aurobindo Pharma Pharmaceuticals 3.20Aurobindo Pharma Stock Future -3.22Coal India Minerals/Mining 2.04Coal India Stock Future -2.05Tata Motors A-DVR Auto 2.13Tata Motors A-DVR Stock Future -2.15Axis Bank Banks 0.96Axis Bank Stock Future -0.96Sun Pharmaceuticals Industries Pharmaceuticals 0.55Sun Pharmaceuticals Industries Stock Future -0.55Indiabulls Housing Finance Finance 0.45Indiabulls Housing Finance Stock Future -0.44HCL Technologies Software 0.38HCL Technologies Stock Future -0.38Sovereign 1.608.60% Government of India Security Sovereign 0.808.83% Government of India Security Sovereign 0.80Commercial Paper 27.02Piramal Enterprises A1+ 5.83Phillips Carbon Black A1+ 5.06Aadhar Housing Finance A1+ 3.64Kotak Commodity Services Private A1+ 3.62Kribhco Shyam Fertilizers A1+ 3.62Power Finance Corporation A1+ 2.62Small Industries Development Bank of India A1+ 1.35Steel Authority of India A1+ 1.28Treasury Bill 0.07TBILL 91 DAY 2016 Sovereign 0.07Fixed Deposits 5.48HDFC Bank UNRATED 5.48Cash and Other Assets -0.88Net Assets 100.00
SECTOR ALLOCATION OF EQUITY INSTRUMENTS (TOP 10) (As on July 31, 2016)
FUND FEATURES (As on July 31, 2016)
MAAUM: ` 135.99 crore • AUM: ` 136.99 crore
NAV Per Unit: (As on July 29, 2016)Direct Plan Regular Plan
Growth Option : ` 18.21 ` 17.67Dividend Option (Half yearly) : ` 16.72 ` 15.54
INVESTMENT OBJECTIVE: The primary objective of the scheme is to seek to generatelong term capital appreciation with relatively lower volatility through systematic allocationof funds into equity; and in debt /money market instruments for defensive purposes.The Scheme will decide on allocation of funds into equity assets based on equity marketPrice Earning Ratio (PE Ratio) levels. When the markets become expensive in terms of'Price to Earnings' Ratio'; the Scheme will reduce its allocation to equities and moveassets into debt and/or money market instruments and vice versa.
DIVIDEND UPDATE
Date Regular Plan Direct PlanDividend Cum Dividend Cum(`̀̀̀̀/Unit)* Dividend NAV (`̀̀̀̀/Unit)* Dividend NAV
June 24, 2016 0.43 15.39 0.64 16.72
June 24, 2015 0.25 15.25 0.32 16.37
December 29, 2014 1.29 16.13 0.51 16.38
Past performance may or may not be sustained in the future. * On face value of ` 10.Note: All Dividend (`/Unit) figures are Gross Dividend.
RATIOS & OTHER DETAILS (As on July 31, 2016)
Standard Deviation^ (Annualised) 10.67%
Beta^ 0.91
Sharpe Ratio^ (Annualised) 0.91
Portfolio Turnover Ratio** 6.97
Expense Ratio# Direct Plan - 1.92%Regular Plan - 3.04%
Note: ^ The above measures have been calculated by taking rolling returns for a 3 yearperiod with 6.59% risk free rate of return (1 days - MIBOR Rate as on July 29, 2016).** The Portfolio Turnover Rate (PTR) means the lower of aggregate sales or purchases madeduring the 12 month rolling year/period divided by the 12 month rolling year/period Averageasset under Management for the relevant year/period.# MTD ratio to Average AUM including Service Tax on Management Fees which is over andabove to TER & proportionate charge in respect of sales beyond T-15 cities subject to maximumof 30 bps on daily net assets.
PORTFOLIO (As on July 31, 2016)
Instrument Industry/ % of % ofRating NAV NAV
Deriv-atives
Equity 35.71Tata Motors Auto 1.44Maruti Suzuki India Auto 1.42Tata Motors A-DVR Auto 0.89HDFC Bank Banks 2.66IndusInd Bank Banks 1.27State Bank of India Banks 1.25Kotak Mahindra Bank Banks 1.07ICICI Bank Banks 0.70Union Bank Of India Banks 0.48The Federal Bank Banks 0.34Axis Bank Banks 0.34Shree Cements Cement 1.16Ultratech Cement Cement 0.96The India Cements Cement 0.83The Ramco Cements Cement 0.07Larsen & Toubro Construction Project 1.33ITC Consumer Non Durables 1.47Britannia Industries Consumer Non Durables 1.05United Breweries Consumer Non Durables 0.56Colgate Palmolive (India) Consumer Non Durables 0.50Hindustan Unilever Consumer Non Durables 0.30Housing Development Finance Corpn. Finance 1.91Shriram Transport Finance Company Finance 0.40Bajaj Finserv Finance 0.22The Indian Hotels Company Hotels, Resorts & 0.40
Other Recreational Activities
8.11%
4.16%
3.88%
3.75%
3.06%
3.02%
2.53%
1.71%
1.33%
1.29%
0.00% 2.00% 4.00% 6.00% 8.00% 10.00%
Banks
Pharmaceuticals
Consumer Non Durables
Auto
Petroleum Products
Cement
Finance
Software
Construction Project
Power
(% of NAV)
The chart represents the unhedged equitys positions only.

INVEST KNOWHOW July 201615
16.69%
9.56%
8.53%
8.33%
5.87%
3.92%
3.79%
2.69%
2.37%
1.60%
0.00% 5.00% 10.00% 15.00% 20.00%
Finance
Banks
Pharmaceuticals
Petroleum Products
Construction
Cement
Auto
Ferrous Metals
Software
Consumer Non Durables
(% of NAV)
Principal Arbitrage Fund (An open-ended equity scheme)
FUND FEATURES (As on July 31, 2016)
MAAUM: ` 75.14 crore • AUM: ` 79.18 crore
NAV Per Unit: (As on July 29, 2016)
Direct Plan Regular PlanGrowth Option : ` 10.21 ` 10.19
Dividend Option : ` 10.21 ` 10.19
INVESTMENT OBJECTIVEThe investment objective of the scheme is to generate capital appreciation and incomeby predominantly investing in arbitrage opportunities in the cash and derivative segmentsof the equity markets and the arbitrage opportunities available within the derivativesegment and by investing the balance in debt and money market instruments. There isno assurance or guarantee that the investment objective of the scheme will be realized.
TOTAL EXPENSE RATIO (As on July 31, 2016)
Direct Plan- 0.35% • Regular Plan - 1.05%
PORTFOLIO (As on July 31, 2016)
Instrument Industry/ % of % ofRating NAV NAV
Deriv-atives
Cash Future Arbitrage 66.68 -67.04
HDFC Bank Banks 9.36
HDFC Bank Stock Future -9.42
Reliance Industries Petroleum Products 8.33
Reliance Industries Stock Future -8.39
Sun Pharmaceuticals Industries Pharmaceuticals 6.29
Sun Pharmaceuticals Industries Stock Future -6.32
IRB Infrastructure Developers Construction 5.87
IRB Infrastructure Developers Stock Future -5.92
LIC Housing Finance Finance 4.62
LIC Housing Finance Stock Future -4.60
Maruti Suzuki India Auto 3.79
Maruti Suzuki India Stock Future -3.80
Bharat Financial Inclusion Finance 3.44
Bharat Financial Inclusion Stock Future -3.46
Rural Electrification Corporation Finance 3.14
Rural Electrification Corporation Stock Future -3.15
Tata Steel Ferrous Metals 2.69
Tata Steel Stock Future -2.71
Infosys Software 2.37
Infosys Stock Future -2.39
The India Cements Cement 1.98
The India Cements Stock Future -1.98
Century Textiles & Industries Cement 1.94
Century Textiles & Industries Stock Future -1.95
Dewan Housing Finance Corporation Finance 1.61
Dewan Housing Finance Corporation Stock Future -1.62
Bajaj Finance Finance 1.47
Bajaj Finance Stock Future -1.48
IDFC Finance 1.46
IDFC Stock Future -1.47
Cairn India Oil 1.44
Cairn India Stock Future -1.45
Biocon Pharmaceuticals 1.38
Biocon Stock Future -1.39
Dish TV India Media & Entertainment 1.27
Dish TV India Stock Future -1.28
Kaveri Seed Company Consumer Non Durables 1.26
Kaveri Seed Company Stock Future -1.27
Housing Development Finance Corpn. Finance 0.95
Housing Development Finance Corpn. Stock Future -0.96
Tata Communications Telecom - Services 0.62
Tata Communications Stock Future -0.63
Aurobindo Pharma Pharmaceuticals 0.56
Aurobindo Pharma Stock Future -0.56
Asian Paints Consumer Non Durables 0.34
Asian Paints Stock Future -0.34
Dr. Reddy's Laboratories Pharmaceuticals 0.30
Dr. Reddy's Laboratories Stock Future -0.30
Bank of Baroda Banks 0.20
Bank of Baroda Stock Future -0.20
Commercial Paper 6.92
Magma ITL Finance A1+ 6.29
KEC International A1+ 0.63
Fixed Deposits 3.15
HDFC Bank UNRATED 3.15
Investment Funds/Mutual Funds 19.30
Principal Cash Management Fund - Mutual Fund 13.62Growth Option
Principal Cash Management Fund - Mutual Fund 5.68Direct Plan - Growth Option
Cash and Other Assets 3.95
Net Assets 100.00
SECTOR ALLOCATION (TOP 10) (As on July 31, 2016)
The chart represents the gross equitys positions.
INVEST KNOWHOW July 201616
Principal Personal Tax Saver Fund (An open-ended equity linked savings scheme)
FUND FEATURES (As on July 31, 2016)
MAAUM: ` 321.28 crore • AUM: ` 328.41 crore
NAV Per Unit: (As on July 29, 2016)Direct Plan : ` 167.84Regular Plan : ` 164.30
INVESTMENT OBJECTIVETo provide long term growth of capital. The Investment Manager will aim to achieve areturn on assets in excess of the performance of S&P BSE 100 Index.
DIVIDEND UPDATE (REGULAR PLAN)
Date Dividend (`̀̀̀̀/Unit)* Cum Dividend NAVMarch 25, 2008 40.00 124.66
February 26, 2008 20.00 172.57
December 31, 2007 11.00 221.26
October 30, 2007 11.00 190.53
March 13, 2006 10.00 118.96
November 2, 2005 40.00 124.43
* On face value of ` 10.Past performance may or may not be sustained in the future.Note: All Dividend (`/Unit) figures are Gross Dividend.
RATIOS & OTHER DETAILS (As on July 31, 2016)
Standard Deviation^ (Annualised) 15.76%
Beta^ 0.98
Sharpe Ratio^ (Annualised) 0.77
Portfolio Turnover Ratio** 0.79
Expense Ratio# Direct Plan - 2.11%Regular Plan - 2.76%
Note: ^ The above measures have been calculated by taking rolling returns for a 3 yearperiod with 6.59% risk free rate of return (1 days - MIBOR Rate as on July 29, 2016).** The Portfolio Turnover Rate (PTR) means the lower of aggregate sales or purchases madeduring the 12 month rolling year/period divided by the 12 month rolling year/period Averageasset under Management for the relevant year/period.# MTD ratio to Average AUM including Service Tax on Management Fees which is over andabove to TER & proportionate charge in respect of sales beyond T-15 cities subject to maximumof 30 bps on daily net assets.
PORTFOLIO (As on July 31, 2016)
Instrument Industry % of NAV
Equity 94.55
Tata Motors Auto 3.80
Maruti Suzuki India Auto 3.78
Tata Motors A-DVR Auto 2.38
HDFC Bank Banks 6.82
IndusInd Bank Banks 3.40
State Bank of India Banks 3.31
Kotak Mahindra Bank Banks 2.85
ICICI Bank Banks 1.85
Union Bank of India Banks 1.26
The Federal Bank Banks 0.91
Axis Bank Banks 0.89
Shree Cements Cement 3.09
Ultratech Cement Cement 2.58
The India Cements Cement 2.22
The Ramco Cements Cement 0.18
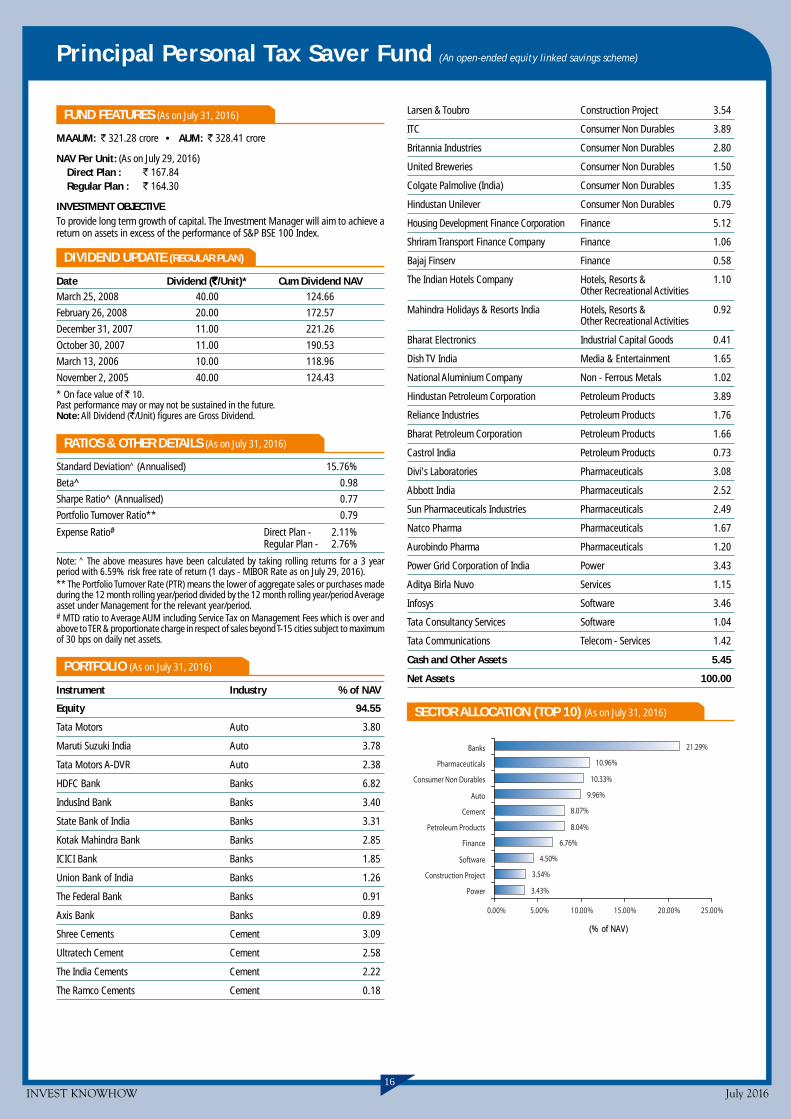
21.29%
10.96%
10.33%
9.96%
8.07%
8.04%
6.76%
4.50%
3.54%
3.43%
0.00% 5.00% 10.00% 15.00% 20.00% 25.00%
Banks
Pharmaceuticals
Consumer Non Durables
Auto
Cement
Petroleum Products
Finance
Software
Construction Project
Power
(% of NAV)
Larsen & Toubro Construction Project 3.54
ITC Consumer Non Durables 3.89
Britannia Industries Consumer Non Durables 2.80
United Breweries Consumer Non Durables 1.50
Colgate Palmolive (India) Consumer Non Durables 1.35
Hindustan Unilever Consumer Non Durables 0.79
Housing Development Finance Corporation Finance 5.12
Shriram Transport Finance Company Finance 1.06
Bajaj Finserv Finance 0.58
The Indian Hotels Company Hotels, Resorts & 1.10Other Recreational Activities
Mahindra Holidays & Resorts India Hotels, Resorts & 0.92Other Recreational Activities
Bharat Electronics Industrial Capital Goods 0.41
Dish TV India Media & Entertainment 1.65
National Aluminium Company Non - Ferrous Metals 1.02
Hindustan Petroleum Corporation Petroleum Products 3.89
Reliance Industries Petroleum Products 1.76
Bharat Petroleum Corporation Petroleum Products 1.66
Castrol India Petroleum Products 0.73
Divi's Laboratories Pharmaceuticals 3.08
Abbott India Pharmaceuticals 2.52
Sun Pharmaceuticals Industries Pharmaceuticals 2.49
Natco Pharma Pharmaceuticals 1.67
Aurobindo Pharma Pharmaceuticals 1.20
Power Grid Corporation of India Power 3.43
Aditya Birla Nuvo Services 1.15
Infosys Software 3.46
Tata Consultancy Services Software 1.04
Tata Communications Telecom - Services 1.42
Cash and Other Assets 5.45
Net Assets 100.00
SECTOR ALLOCATION (TOP 10) (As on July 31, 2016)

INVEST KNOWHOW July 201617
Principal Tax Savings Fund (An open-ended equity linked savings scheme)
FUND FEATURES (As on July 31, 2016)
MAAUM: ` 270.28 crore • AUM: ` 275.03 crore
NAV Per Unit: (As on July 29, 2016)Direct Plan : ` 155.00Regular Plan : ` 152.17
INVESTMENT OBJECTIVETo build a high quality growth-oriented portfolio to provide long-term capital gains tothe investors. The scheme aims at providing returns through capital appreciation.
DIVIDEND UPDATE (REGULAR PLAN)
Date Dividend (`̀̀̀̀/Unit)* Cum Dividend NAV
March 31, 2008 8.00 90.12
January 15, 2007 5.00 83.66
* On face value of ` 10.Past performance may or may not be sustained in the future.Note: All Dividend (`/Unit) figures are Gross Dividend.
RATIOS & OTHER DETAILS (As on July 31, 2016)
Standard Deviation^ (Annualised) 18.56%
Beta^ 1.15
Sharpe Ratio^ (Annualised) 0.85
Portfolio Turnover Ratio** 0.66
Expense Ratio# Direct Plan - 2.38%Regular Plan - 2.85%
Note: ^ The above measures have been calculated by taking rolling returns for a 3 yearperiod with 6.59% risk free rate of return (1 days - MIBOR Rate as on July 29, 2016).** The Portfolio Turnover Rate (PTR) means the lower of aggregate sales or purchases madeduring the 12 month rolling year/period divided by the 12 month rolling year/period Averageasset under Management for the relevant year/period.# MTD ratio to Average AUM including Service Tax on Management Fees which is over andabove to TER & proportionate charge in respect of sales beyond T-15 cities subject to maximumof 30 bps on daily net assets.
PORTFOLIO (As on July 31, 2016)
Instrument Industry % of NAV
Equity 93.41
Tata Motors Auto 2.89
Escorts Auto 2.31
Maruti Suzuki India Auto 1.95
Hero MotoCorp Auto 1.18
Bajaj Auto Auto 1.06
Asahi India Glass Auto Ancillaries 1.13
HDFC Bank Banks 5.71
ICICI Bank Banks 4.16
State Bank of India Banks 3.17
Bank of Baroda Banks 1.19
The Federal Bank Banks 1.17
Axis Bank Banks 1.07
Yes Bank Banks 1.04
Kotak Mahindra Bank Banks 0.98
City Union Bank Banks 0.97
Canara Bank Banks 0.95
Union Bank Of India Banks 0.93
The India Cements Cement 2.53
Century Textiles & Industries Cement 1.63
Ultratech Cement Cement 1.48
The Ramco Cements Cement 1.36
JK Cement Cement 1.07
Birla Corporation Cement 0.95
DLF Construction 1.08
IRB Infrastructure Developers Construction 0.83
Prestige Estates Projects Construction 0.78
Larsen & Toubro Construction Project 2.71
KEC International Construction Project 1.93
Ashoka Buildcon Construction Project 0.89
Hindustan Construction Company Construction Project 0.84
Bajaj Electricals Consumer Durables 1.66
ITC Consumer Non Durables 4.01
Britannia Industries Consumer Non Durables 1.64
Balrampur Chini Mills Consumer Non Durables 1.34
Bombay Burmah Trading Corporation Consumer Non Durables 1.09
United Spirits Consumer Non Durables 0.95
Housing Development Finance Corporation Finance 2.20
Dewan Housing Finance Corporation Finance 1.85
Shriram Transport Finance Company Finance 0.76
Indraprastha Gas Gas 0.91
Mahindra Holidays & Resorts India Hotels, Resorts & 1.70Other Recreational Activities
The Indian Hotels Company Hotels, Resorts & 1.11Other Recreational Activities
Jain Irrigation Systems Industrial Products 1.53
Hindustan Zinc Non - Ferrous Metals 0.86
National Aluminium Company Non - Ferrous Metals 0.83
Reliance Industries Petroleum Products 2.68
Castrol India Petroleum Products 1.05
Hindustan Petroleum Corporation Petroleum Products 1.04
Aurobindo Pharma Pharmaceuticals 1.46
Sun Pharmaceuticals Industries Pharmaceuticals 1.28
Abbott India Pharmaceuticals 1.26
Natco Pharma Pharmaceuticals 0.88
Kalpataru Power Transmission Power 1.21
Rattanindia Power Power 1.05
Infosys Software 2.49
Tata Consultancy Services Software 1.03
HCL Technologies Software 0.85
Tata Communications Telecom - Services 2.05
Jet Airways (India) Transportation 1.07
Navkar Corporation Transportation 0.96
Gateway Distriparks Transportation 0.67
Cash and Other Assets 6.59
Net Assets 100.00
SECTOR ALLOCATION (TOP 10) (As on July 31, 2016)
(% of NAV)
21.34%
9.39%
9.03%
9.02%
6.37%
4.88%
4.81%
4.77%
4.37%
2.81%
0.00% 5.00% 10.00% 15.00% 20.00% 25.00%
Banks
Auto
Consumer Non Durables
Cement
Construction Project
Pharmaceuticals
Finance
Petroleum Products
Software
Hotels, Resorts &Other Recreational Activities
INVEST KNOWHOW July 201618
Principal Balanced Fund (An open-ended balanced scheme)
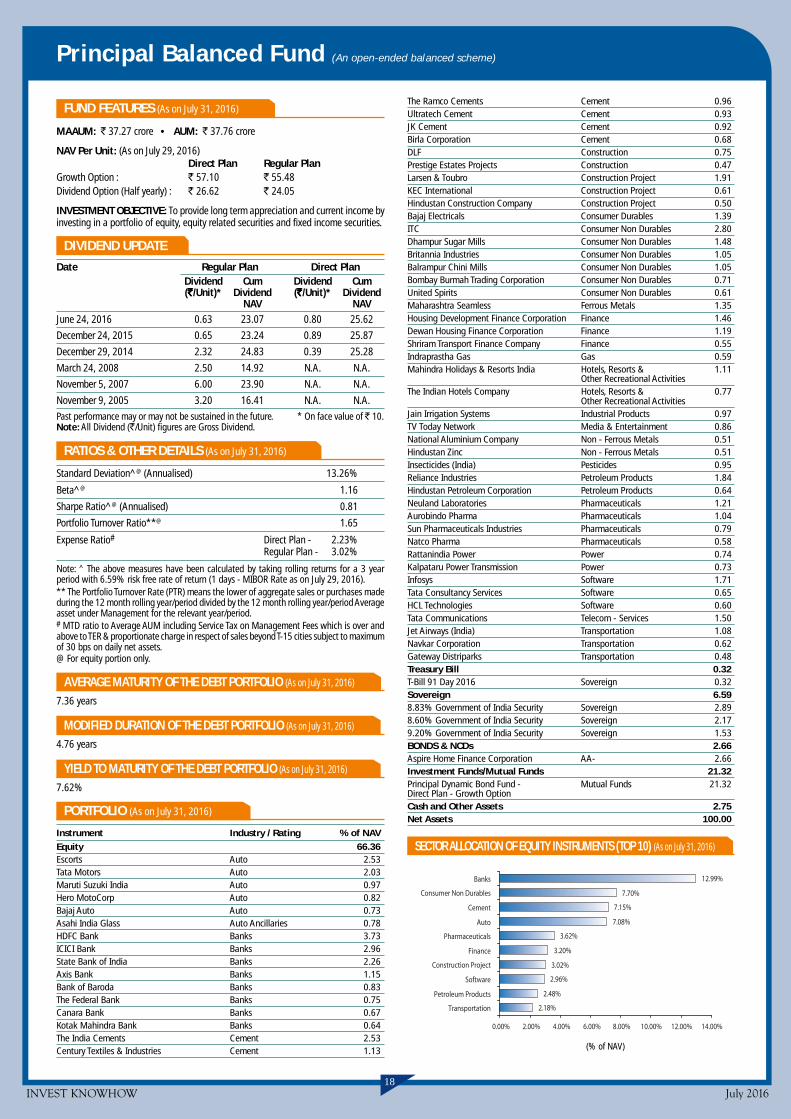
12.99%
7.70%
7.15%
7.08%
3.62%
3.20%
3.02%
2.96%
2.48%
2.18%
0.00% 2.00% 4.00% 6.00% 8.00% 10.00% 12.00% 14.00%
Banks
Consumer Non Durables
Cement
Auto
Pharmaceuticals
Finance
Construction Project
Software
Petroleum Products
Transportation
(% of NAV)
The Ramco Cements Cement 0.96Ultratech Cement Cement 0.93JK Cement Cement 0.92Birla Corporation Cement 0.68DLF Construction 0.75Prestige Estates Projects Construction 0.47Larsen & Toubro Construction Project 1.91KEC International Construction Project 0.61Hindustan Construction Company Construction Project 0.50Bajaj Electricals Consumer Durables 1.39ITC Consumer Non Durables 2.80Dhampur Sugar Mills Consumer Non Durables 1.48Britannia Industries Consumer Non Durables 1.05Balrampur Chini Mills Consumer Non Durables 1.05Bombay Burmah Trading Corporation Consumer Non Durables 0.71United Spirits Consumer Non Durables 0.61Maharashtra Seamless Ferrous Metals 1.35Housing Development Finance Corporation Finance 1.46Dewan Housing Finance Corporation Finance 1.19Shriram Transport Finance Company Finance 0.55Indraprastha Gas Gas 0.59Mahindra Holidays & Resorts India Hotels, Resorts & 1.11
Other Recreational ActivitiesThe Indian Hotels Company Hotels, Resorts & 0.77
Other Recreational ActivitiesJain Irrigation Systems Industrial Products 0.97TV Today Network Media & Entertainment 0.86National Aluminium Company Non - Ferrous Metals 0.51Hindustan Zinc Non - Ferrous Metals 0.51Insecticides (India) Pesticides 0.95Reliance Industries Petroleum Products 1.84Hindustan Petroleum Corporation Petroleum Products 0.64Neuland Laboratories Pharmaceuticals 1.21Aurobindo Pharma Pharmaceuticals 1.04Sun Pharmaceuticals Industries Pharmaceuticals 0.79Natco Pharma Pharmaceuticals 0.58Rattanindia Power Power 0.74Kalpataru Power Transmission Power 0.73Infosys Software 1.71Tata Consultancy Services Software 0.65HCL Technologies Software 0.60Tata Communications Telecom - Services 1.50Jet Airways (India) Transportation 1.08Navkar Corporation Transportation 0.62Gateway Distriparks Transportation 0.48Treasury Bill 0.32T-Bill 91 Day 2016 Sovereign 0.32Sovereign 6.598.83% Government of India Security Sovereign 2.898.60% Government of India Security Sovereign 2.179.20% Government of India Security Sovereign 1.53BONDS & NCDs 2.66Aspire Home Finance Corporation AA- 2.66Investment Funds/Mutual Funds 21.32Principal Dynamic Bond Fund - Mutual Funds 21.32Direct Plan - Growth OptionCash and Other Assets 2.75Net Assets 100.00
SECTOR ALLOCATION OF EQUITY INSTRUMENTS (TOP 10) (As on July 31, 2016)
FUND FEATURES (As on July 31, 2016)
MAAUM: ` 37.27 crore • AUM: ` 37.76 crore
NAV Per Unit: (As on July 29, 2016)Direct Plan Regular Plan
Growth Option : ` 57.10 ` 55.48Dividend Option (Half yearly) : ` 26.62 ` 24.05
INVESTMENT OBJECTIVE: To provide long term appreciation and current income byinvesting in a portfolio of equity, equity related securities and fixed income securities.
DIVIDEND UPDATE
Date Regular Plan Direct PlanDividend Cum Dividend Cum(`̀̀̀̀/Unit)* Dividend (`̀̀̀̀/Unit)* Dividend
NAV NAVJune 24, 2016 0.63 23.07 0.80 25.62
December 24, 2015 0.65 23.24 0.89 25.87
December 29, 2014 2.32 24.83 0.39 25.28
March 24, 2008 2.50 14.92 N.A. N.A.
November 5, 2007 6.00 23.90 N.A. N.A.
November 9, 2005 3.20 16.41 N.A. N.A.
Past performance may or may not be sustained in the future. * On face value of ` 10.Note: All Dividend (`/Unit) figures are Gross Dividend.
RATIOS & OTHER DETAILS (As on July 31, 2016)
Standard Deviation^@ (Annualised) 13.26%
Beta^@ 1.16
Sharpe Ratio^@ (Annualised) 0.81
Portfolio Turnover Ratio**@ 1.65
Expense Ratio# Direct Plan - 2.23%Regular Plan - 3.02%
Note: ^ The above measures have been calculated by taking rolling returns for a 3 yearperiod with 6.59% risk free rate of return (1 days - MIBOR Rate as on July 29, 2016).** The Portfolio Turnover Rate (PTR) means the lower of aggregate sales or purchases madeduring the 12 month rolling year/period divided by the 12 month rolling year/period Averageasset under Management for the relevant year/period.# MTD ratio to Average AUM including Service Tax on Management Fees which is over andabove to TER & proportionate charge in respect of sales beyond T-15 cities subject to maximumof 30 bps on daily net assets.@ For equity portion only.
AVERAGE MATURITY OF THE DEBT PORTFOLIO (As on July 31, 2016)
7.36 years
MODIFIED DURATION OF THE DEBT PORTFOLIO (As on July 31, 2016)
4.76 years
YIELD TO MATURITY OF THE DEBT PORTFOLIO (As on July 31, 2016)
7.62%
PORTFOLIO (As on July 31, 2016)
Instrument Industry / Rating % of NAVEquity 66.36Escorts Auto 2.53Tata Motors Auto 2.03Maruti Suzuki India Auto 0.97Hero MotoCorp Auto 0.82Bajaj Auto Auto 0.73Asahi India Glass Auto Ancillaries 0.78HDFC Bank Banks 3.73ICICI Bank Banks 2.96State Bank of India Banks 2.26Axis Bank Banks 1.15Bank of Baroda Banks 0.83The Federal Bank Banks 0.75Canara Bank Banks 0.67Kotak Mahindra Bank Banks 0.64The India Cements Cement 2.53Century Textiles & Industries Cement 1.13
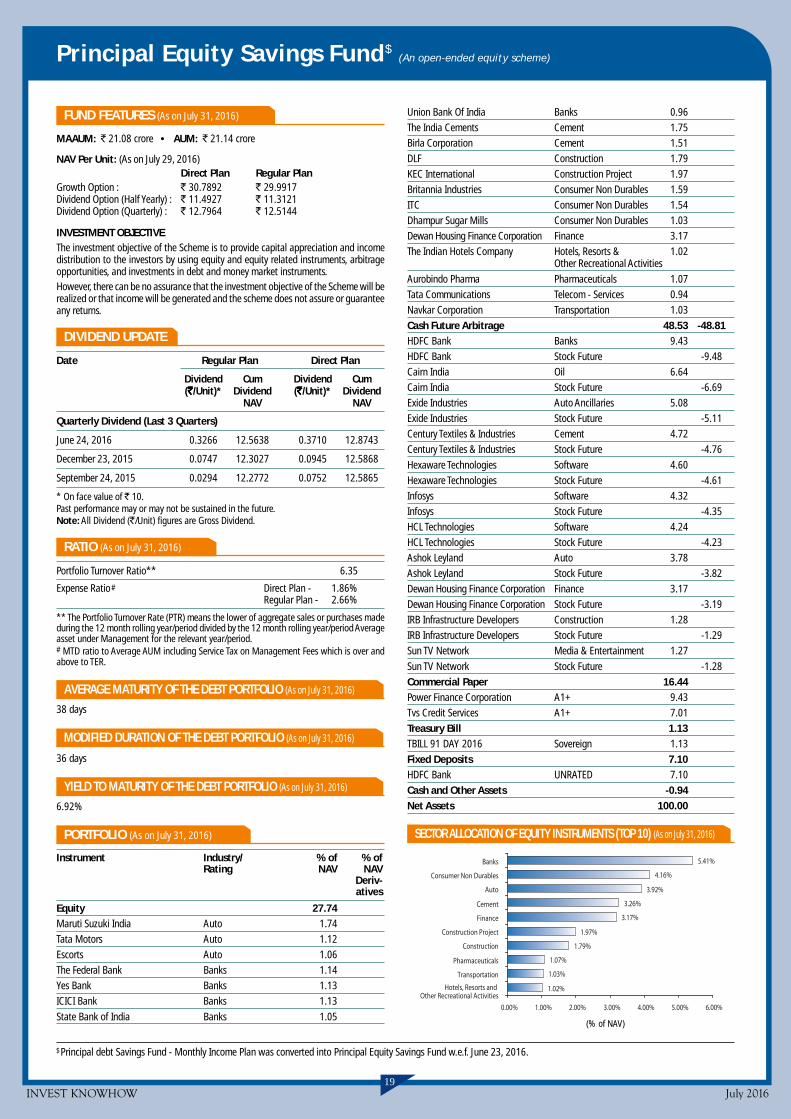
INVEST KNOWHOW July 201619
Union Bank Of India Banks 0.96
The India Cements Cement 1.75
Birla Corporation Cement 1.51
DLF Construction 1.79
KEC International Construction Project 1.97
Britannia Industries Consumer Non Durables 1.59
ITC Consumer Non Durables 1.54
Dhampur Sugar Mills Consumer Non Durables 1.03
Dewan Housing Finance Corporation Finance 3.17
The Indian Hotels Company Hotels, Resorts & 1.02Other Recreational Activities
Aurobindo Pharma Pharmaceuticals 1.07
Tata Communications Telecom - Services 0.94
Navkar Corporation Transportation 1.03
Cash Future Arbitrage 48.53 -48.81HDFC Bank Banks 9.43
HDFC Bank Stock Future -9.48
Cairn India Oil 6.64
Cairn India Stock Future -6.69
Exide Industries Auto Ancillaries 5.08
Exide Industries Stock Future -5.11
Century Textiles & Industries Cement 4.72
Century Textiles & Industries Stock Future -4.76
Hexaware Technologies Software 4.60
Hexaware Technologies Stock Future -4.61
Infosys Software 4.32
Infosys Stock Future -4.35
HCL Technologies Software 4.24
HCL Technologies Stock Future -4.23
Ashok Leyland Auto 3.78
Ashok Leyland Stock Future -3.82
Dewan Housing Finance Corporation Finance 3.17
Dewan Housing Finance Corporation Stock Future -3.19
IRB Infrastructure Developers Construction 1.28
IRB Infrastructure Developers Stock Future -1.29
Sun TV Network Media & Entertainment 1.27
Sun TV Network Stock Future -1.28
Commercial Paper 16.44Power Finance Corporation A1+ 9.43
Tvs Credit Services A1+ 7.01
Treasury Bill 1.13TBILL 91 DAY 2016 Sovereign 1.13
Fixed Deposits 7.10HDFC Bank UNRATED 7.10
Cash and Other Assets -0.94Net Assets 100.00
SECTOR ALLOCATION OF EQUITY INSTRUMENTS (TOP 10) (As on July 31, 2016)
FUND FEATURES (As on July 31, 2016)
MAAUM: ` 21.08 crore • AUM: ` 21.14 crore
NAV Per Unit: (As on July 29, 2016)Direct Plan Regular Plan
Growth Option : ` 30.7892 ` 29.9917Dividend Option (Half Yearly) : ` 11.4927 ` 11.3121Dividend Option (Quarterly) : ` 12.7964 ` 12.5144
INVESTMENT OBJECTIVEThe investment objective of the Scheme is to provide capital appreciation and incomedistribution to the investors by using equity and equity related instruments, arbitrageopportunities, and investments in debt and money market instruments.However, there can be no assurance that the investment objective of the Scheme will berealized or that income will be generated and the scheme does not assure or guaranteeany returns.
DIVIDEND UPDATE
Date Regular Plan Direct Plan
Dividend Cum Dividend Cum(`̀̀̀̀/Unit)* Dividend (`̀̀̀̀/Unit)* Dividend
NAV NAV
Quarterly Dividend (Last 3 Quarters)
June 24, 2016 0.3266 12.5638 0.3710 12.8743
December 23, 2015 0.0747 12.3027 0.0945 12.5868
September 24, 2015 0.0294 12.2772 0.0752 12.5865
* On face value of ` 10.Past performance may or may not be sustained in the future.Note: All Dividend (`/Unit) figures are Gross Dividend.
RATIO (As on July 31, 2016)
Portfolio Turnover Ratio** 6.35
Expense Ratio# Direct Plan - 1.86%Regular Plan - 2.66%
** The Portfolio Turnover Rate (PTR) means the lower of aggregate sales or purchases madeduring the 12 month rolling year/period divided by the 12 month rolling year/period Averageasset under Management for the relevant year/period.# MTD ratio to Average AUM including Service Tax on Management Fees which is over andabove to TER.
AVERAGE MATURITY OF THE DEBT PORTFOLIO (As on July 31, 2016)
38 days
MODIFIED DURATION OF THE DEBT PORTFOLIO (As on July 31, 2016)
36 days
YIELD TO MATURITY OF THE DEBT PORTFOLIO (As on July 31, 2016)
6.92%
PORTFOLIO (As on July 31, 2016)
Instrument Industry/ % of % ofRating NAV NAV
Deriv-atives
Equity 27.74Maruti Suzuki India Auto 1.74
Tata Motors Auto 1.12
Escorts Auto 1.06
The Federal Bank Banks 1.14
Yes Bank Banks 1.13
ICICI Bank Banks 1.13
State Bank of India Banks 1.05
Principal Equity Savings Fund$ (An open-ended equity scheme)
$Principal debt Savings Fund - Monthly Income Plan was converted into Principal Equity Savings Fund w.e.f. June 23, 2016.
5.41%
4.16%
3.92%
3.26%
3.17%
1.97%
1.79%
1.07%
1.03%
1.02%
0.00% 1.00% 2.00% 3.00% 4.00% 5.00% 6.00%
Banks
Consumer Non Durables
Auto
Cement
Finance
Construction Project
Construction
Pharmaceuticals
Transportation
Hotels, Resorts and Other Recreational Activities
(% of NAV)
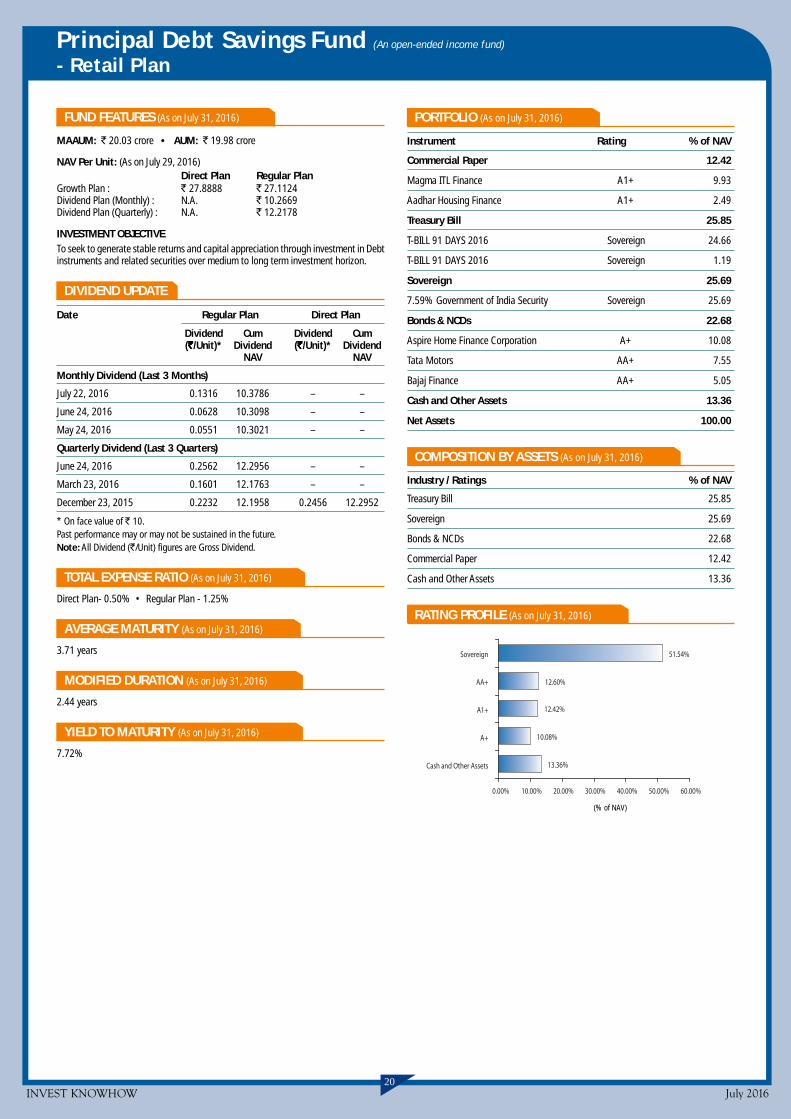
INVEST KNOWHOW July 201620
Principal Debt Savings Fund (An open-ended income fund)
- Retail Plan
FUND FEATURES (As on July 31, 2016)
MAAUM: ` 20.03 crore • AUM: ` 19.98 crore
NAV Per Unit: (As on July 29, 2016)Direct Plan Regular Plan
Growth Plan : ` 27.8888 ` 27.1124Dividend Plan (Monthly) : N.A. ` 10.2669Dividend Plan (Quarterly) : N.A. ` 12.2178
INVESTMENT OBJECTIVETo seek to generate stable returns and capital appreciation through investment in Debtinstruments and related securities over medium to long term investment horizon.
DIVIDEND UPDATE
Date Regular Plan Direct Plan
Dividend Cum Dividend Cum(`̀̀̀̀/Unit)* Dividend (`̀̀̀̀/Unit)* Dividend
NAV NAV
Monthly Dividend (Last 3 Months)
July 22, 2016 0.1316 10.3786 – –
June 24, 2016 0.0628 10.3098 – –
May 24, 2016 0.0551 10.3021 – –
Quarterly Dividend (Last 3 Quarters)
June 24, 2016 0.2562 12.2956 – –
March 23, 2016 0.1601 12.1763 – –
December 23, 2015 0.2232 12.1958 0.2456 12.2952
* On face value of ` 10.Past performance may or may not be sustained in the future.Note: All Dividend (`/Unit) figures are Gross Dividend.
TOTAL EXPENSE RATIO (As on July 31, 2016)
Direct Plan- 0.50% • Regular Plan - 1.25%
AVERAGE MATURITY (As on July 31, 2016)
3.71 years
MODIFIED DURATION (As on July 31, 2016)
2.44 years
YIELD TO MATURITY (As on July 31, 2016)
7.72%
PORTFOLIO (As on July 31, 2016)
Instrument Rating % of NAV
Commercial Paper 12.42
Magma ITL Finance A1+ 9.93
Aadhar Housing Finance A1+ 2.49
Treasury Bill 25.85
T-BILL 91 DAYS 2016 Sovereign 24.66
T-BILL 91 DAYS 2016 Sovereign 1.19
Sovereign 25.69
7.59% Government of India Security Sovereign 25.69
Bonds & NCDs 22.68
Aspire Home Finance Corporation A+ 10.08
Tata Motors AA+ 7.55
Bajaj Finance AA+ 5.05
Cash and Other Assets 13.36
Net Assets 100.00
COMPOSITION BY ASSETS (As on July 31, 2016)
Industry / Ratings % of NAV
Treasury Bill 25.85
Sovereign 25.69
Bonds & NCDs 22.68
Commercial Paper 12.42
Cash and Other Assets 13.36
RATING PROFILE (As on July 31, 2016)
(% of NAV)
51.54%
12.60%
12.42%
13.36%
10.08%
0.00% 10.00% 20.00% 30.00% 40.00% 50.00% 60.00%
Sovereign
AA+
A1+
A+
Cash and Other Assets
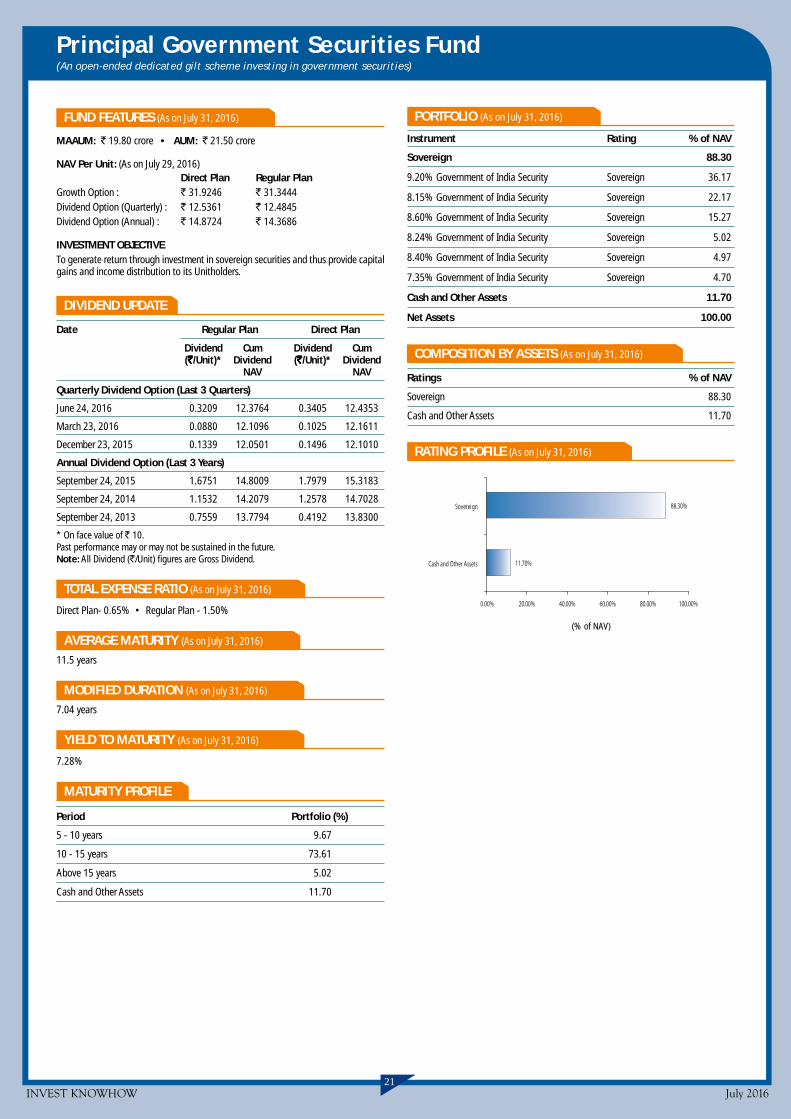
INVEST KNOWHOW July 201621
Principal Government Securities Fund(An open-ended dedicated gilt scheme investing in government securities)
PORTFOLIO (As on July 31, 2016)
Instrument Rating % of NAV
Sovereign 88.30
9.20% Government of India Security Sovereign 36.17
8.15% Government of India Security Sovereign 22.17
8.60% Government of India Security Sovereign 15.27
8.24% Government of India Security Sovereign 5.02
8.40% Government of India Security Sovereign 4.97
7.35% Government of India Security Sovereign 4.70
Cash and Other Assets 11.70
Net Assets 100.00
COMPOSITION BY ASSETS (As on July 31, 2016)
Ratings % of NAV
Sovereign 88.30
Cash and Other Assets 11.70
RATING PROFILE (As on July 31, 2016)
FUND FEATURES (As on July 31, 2016)
MAAUM: ` 19.80 crore • AUM: ` 21.50 crore
NAV Per Unit: (As on July 29, 2016)Direct Plan Regular Plan
Growth Option : ` 31.9246 ` 31.3444Dividend Option (Quarterly) : ` 12.5361 ` 12.4845Dividend Option (Annual) : ` 14.8724 ` 14.3686
INVESTMENT OBJECTIVETo generate return through investment in sovereign securities and thus provide capitalgains and income distribution to its Unitholders.
DIVIDEND UPDATE
Date Regular Plan Direct Plan
Dividend Cum Dividend Cum(`̀̀̀̀/Unit)* Dividend (`̀̀̀̀/Unit)* Dividend
NAV NAV
Quarterly Dividend Option (Last 3 Quarters)
June 24, 2016 0.3209 12.3764 0.3405 12.4353
March 23, 2016 0.0880 12.1096 0.1025 12.1611
December 23, 2015 0.1339 12.0501 0.1496 12.1010
Annual Dividend Option (Last 3 Years)
September 24, 2015 1.6751 14.8009 1.7979 15.3183
September 24, 2014 1.1532 14.2079 1.2578 14.7028
September 24, 2013 0.7559 13.7794 0.4192 13.8300
* On face value of ` 10.Past performance may or may not be sustained in the future.Note: All Dividend (`/Unit) figures are Gross Dividend.
TOTAL EXPENSE RATIO (As on July 31, 2016)
Direct Plan- 0.65% • Regular Plan - 1.50%
AVERAGE MATURITY (As on July 31, 2016)
11.5 years
MODIFIED DURATION (As on July 31, 2016)
7.04 years
YIELD TO MATURITY (As on July 31, 2016)
7.28%
MATURITY PROFILE
Period Portfolio (%)
5 - 10 years 9.67
10 - 15 years 73.61
Above 15 years 5.02
Cash and Other Assets 11.70
88.30%
11.70%
0.00% 20.00% 40.00% 60.00% 80.00% 100.00%
Sovereign
Cash and Other Assets
(% of NAV)

INVEST KNOWHOW July 201622
Principal Dynamic Bond Fund (An open-ended income scheme)
PORTFOLIO (As on July 31, 2016)
Instrument Rating % of NAV
Commercial Paper 6.81
JM Financial Products A1+ 4.21
Aadhar Housing Finance A1+ 2.60
Sovereign 60.44
9.20% Government of India Security Sovereign 17.75
8.60% Government of India Security Sovereign 14.49
8.15% Government of India Security Sovereign 9.66
8.83% Government of India Security Sovereign 7.57
8.24% Government of India Security Sovereign 3.75
8.40% Government of India Security Sovereign 3.71
7.35% Government of India Security Sovereign 3.51
Bonds & NCDs 19.83
Power Finance Corporation AAA 4.51
Housing Development Finance Corporation AAA 4.39
LIC Housing Finance AAA 4.37
Indostar Capital Finance AA- 4.36
Aspire Home Finance Corporation A+ 1.75
National Bank for Agriculture and AAA 0.45Rural Development
Cash and Other Assets 12.92
Net Assets 100.00
COMPOSITION BY ASSETS (As on July 31, 2016)
Ratings % of NAV
Sovereign 60.44
Bonds & NCDs 19.83
Commercial Paper 6.81
Cash and Other Assets 12.92
RATING PROFILE (As on July 31, 2016)
FUND FEATURES (As on July 31, 2016)
MAAUM: ` 112.30 crore • AUM: ` 115.16 crore
NAV Per Unit: (As on July 29, 2016)Direct Plan Regular Plan
Growth Option : ` 27.4074 ` 26.6870Dividend Option (Quarterly) : ` 13.6261 ` 13.5516Dividend Option (Annual) : ` 12.5908 ` 12.1703
INVESTMENT OBJECTIVETo generate regular income and capital appreciation/accretion through investment indebt instruments and related securities besides preservation of capital.
DIVIDEND UPDATE
Date Regular Plan Direct Plan
Dividend Cum Dividend Cum(`̀̀̀̀/Unit)* Dividend (`̀̀̀̀/Unit)* Dividend
NAV NAV
Quarterly Dividend Option (Last 3 Quarters)
June 24, 2016 0.3022 13.4822 0.3270 13.5702
March 23, 2016 0.1320 13.2857 0.1549 13.3697
December 23, 2015 0.1651 13.2338 0.0448 13.1723
Annual Dividend Option (Last 3 Years)
September 24, 2015 1.3206 12.552 1.4457 12.9921
September 24, 2014 0.9630 12.1429 1.0896 12.5807
September 24, 2013 0.7029 11.8468 0.4597 11.9117
* On face value of ` 10.Past performance may or may not be sustained in the future.Note: All Dividend (`/Unit) figures are Gross Dividend.
TOTAL EXPENSE RATIO (As on July 31, 2016)
Direct Plan- 0.92% • Regular Plan - 1.65%
AVERAGE MATURITY (As on July 31, 2016)
8.08 years
MODIFIED DURATION (As on July 31, 2016)
5.17 years
YIELD TO MATURITY (As on July 31, 2016)
7.57%
MATURITY PROFILE
Period Portfolio (%)
Less than 1 year 6.81
1 - 3 years 10.48
3 - 5 years 4.84
5 - 10 years 19.30
10 - 15 years 41.90
Above 15 years 3.75
Cash and Others Assets 12.92
60.44%
13.72%
6.81%
1.75%
4.36%
12.92%
0.00% 20.00% 40.00% 60.00% 80.00%
Sovereign
AAA
A1+
AA-
A+
Cash and Other Assets
(% of NAV)

INVEST KNOWHOW July 201623
Principal Credit Opportunities Fund$
(An open-ended debt scheme)
PORTFOLIO (As on July 31, 2016)
Instrument Rating % of NAV
Commercial Paper 73.34
Steel Authority of India A1+ 11.02
Small Industries Development Bank of India A1+ 10.89
Piramal Enterprises A1+ 8.39
CESC A1+ 6.67
Magma ITL Finance A1+ 5.97
Power Finance Corporation A1+ 5.86
KEC International A1+ 4.66
Cox & Kings A1+ 3.98
Kribhco Shyam Fertilizers A1+ 3.98
Phillips Carbon Black A1+ 3.97
Religare Housing Development Finance Corpn. A1+ 2.66
Magma Fincorp A1+ 2.65
Tvs Credit Services A1+ 1.98
Aadhar Housing Finance A1+ 0.66
Treasury Bill 0.11
T-Bill 91 Day 2016 Sovereign 0.11
Bonds & NCDs 8.04
Manappuram Finance AA- 6.69
Rural Electrification Corporation AAA 1.35
Cash and Other Assets 18.51
Net Assets 100.00
COMPOSITION BY ASSETS (As on July 31, 2016)
Industry / Ratings % of NAV
Commercial Paper 73.34
Bonds & NCDs 8.04
Treasury Bill 0.11
Cash and Other Assets 18.51
RATING PROFILE (As on July 31, 2016)
FUND FEATURES (As on July 31, 2016)
MAAUM: ` 44.99 crore • AUM: ` 74.81 crore
NAV Per Unit: (As on July 29, 2016)Direct Plan Regular Plan
Growth Option : ` 2436.2746 ` 2404.7742Dividend Option (Monthly) : ` 1240.5425 ` 1237.5314
INVESTMENT OBJECTIVEThe primary objective is to generate income and capital gains through investments in aportfolio of securities issued by Private and Public Sector Companies.
DIVIDEND UPDATE
Date Regular Plan Direct Plan
Dividend Cum Dividend Cum(`̀̀̀̀/Unit)* Dividend (`̀̀̀̀/Unit)* Dividend
NAV NAV
Monthly Dividend (Last 3 Months)
July 22, 2016 7.3383 1242.8568 7.5620 1246.0259
June 24, 2016 8.3591 1243.8776 8.5913 1247.0552
May 24, 2016 8.1549 1243.6734 8.3934 1246.8573
* On face value of ` 1,000/-.Past performance may or may not be sustained in the future.All Dividend (`/Unit) figures are Gross Dividend.
TOTAL EXPENSE RATIO (As on July 31, 2016)
Direct Plan- 0.22% • Regular Plan - 0.44%
AVERAGE MATURITY (As on July 31, 2016)
87 days
MODIFIED DURATION (As on July 31, 2016)
77 days
YIELD TO MATURITY (As on July 31, 2016)
7.60%
(% of NAV)
73.34%
6.69%
1.35%
18.51%
0.11%
0.00% 20.00% 40.00% 60.00% 80.00%
A1+
AA-
AAA
Soverign
Cash and Other Assets
$Name change w.e.f May 23, 2016, the scheme was earlier known as Principal Debt Opportunities Fund - Corporate Bond Plan.
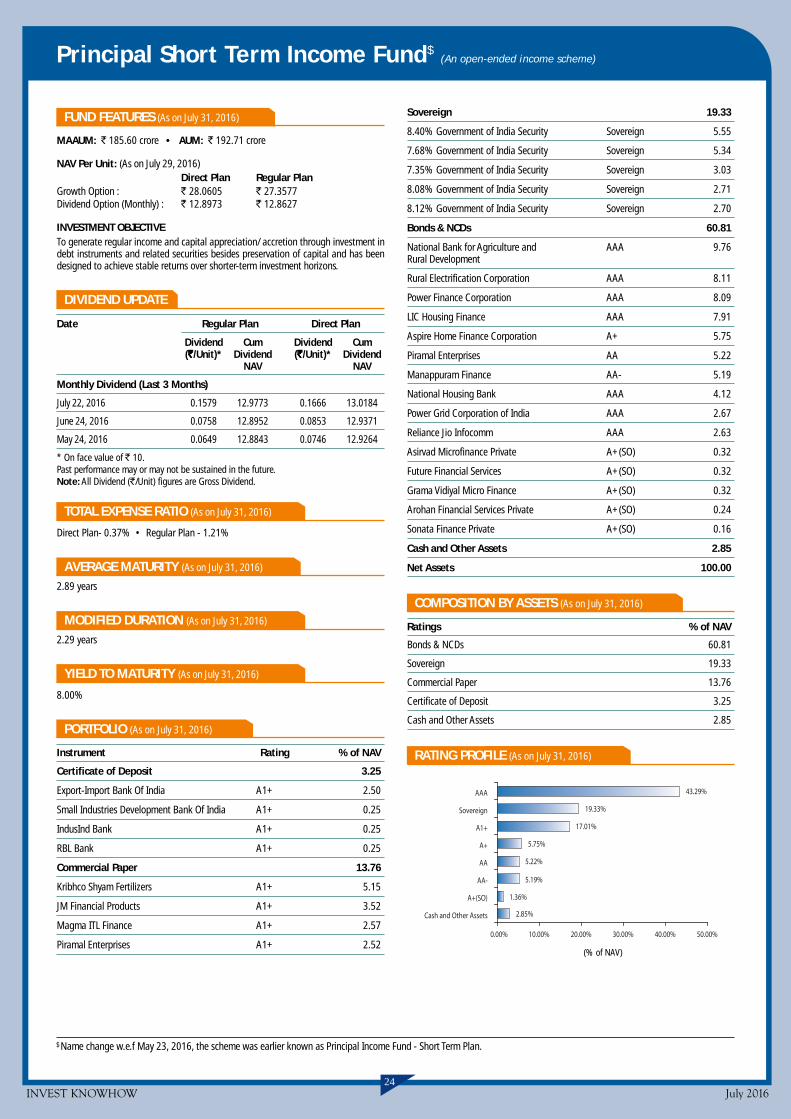
INVEST KNOWHOW July 201624
Principal Short Term Income Fund$ (An open-ended income scheme)
FUND FEATURES (As on July 31, 2016)
MAAUM: ` 185.60 crore • AUM: ` 192.71 crore
NAV Per Unit: (As on July 29, 2016)Direct Plan Regular Plan
Growth Option : ` 28.0605 ` 27.3577Dividend Option (Monthly) : ` 12.8973 ` 12.8627
INVESTMENT OBJECTIVETo generate regular income and capital appreciation/ accretion through investment indebt instruments and related securities besides preservation of capital and has beendesigned to achieve stable returns over shorter-term investment horizons.
DIVIDEND UPDATE
Date Regular Plan Direct Plan
Dividend Cum Dividend Cum(`̀̀̀̀/Unit)* Dividend (`̀̀̀̀/Unit)* Dividend
NAV NAV
Monthly Dividend (Last 3 Months)
July 22, 2016 0.1579 12.9773 0.1666 13.0184
June 24, 2016 0.0758 12.8952 0.0853 12.9371
May 24, 2016 0.0649 12.8843 0.0746 12.9264
* On face value of ` 10.Past performance may or may not be sustained in the future.Note: All Dividend (`/Unit) figures are Gross Dividend.
TOTAL EXPENSE RATIO (As on July 31, 2016)
Direct Plan- 0.37% • Regular Plan - 1.21%
AVERAGE MATURITY (As on July 31, 2016)
2.89 years
MODIFIED DURATION (As on July 31, 2016)
2.29 years
YIELD TO MATURITY (As on July 31, 2016)
8.00%
PORTFOLIO (As on July 31, 2016)
Instrument Rating % of NAV
Certificate of Deposit 3.25
Export-Import Bank Of India A1+ 2.50
Small Industries Development Bank Of India A1+ 0.25
IndusInd Bank A1+ 0.25
RBL Bank A1+ 0.25
Commercial Paper 13.76
Kribhco Shyam Fertilizers A1+ 5.15
JM Financial Products A1+ 3.52
Magma ITL Finance A1+ 2.57
Piramal Enterprises A1+ 2.52
43.29%
19.33%
17.01%
5.22%
5.75%
5.19%
1.36%
2.85%
0.00% 10.00% 20.00% 30.00% 40.00% 50.00%
AAA
Sovereign
A1+
A+
AA
AA-
A+(SO)
Cash and Other Assets
(% of NAV)
Sovereign 19.33
8.40% Government of India Security Sovereign 5.55
7.68% Government of India Security Sovereign 5.34
7.35% Government of India Security Sovereign 3.03
8.08% Government of India Security Sovereign 2.71
8.12% Government of India Security Sovereign 2.70
Bonds & NCDs 60.81
National Bank for Agriculture and AAA 9.76Rural Development
Rural Electrification Corporation AAA 8.11
Power Finance Corporation AAA 8.09
LIC Housing Finance AAA 7.91
Aspire Home Finance Corporation A+ 5.75
Piramal Enterprises AA 5.22
Manappuram Finance AA- 5.19
National Housing Bank AAA 4.12
Power Grid Corporation of India AAA 2.67
Reliance Jio Infocomm AAA 2.63
Asirvad Microfinance Private A+(SO) 0.32
Future Financial Services A+(SO) 0.32
Grama Vidiyal Micro Finance A+(SO) 0.32
Arohan Financial Services Private A+(SO) 0.24
Sonata Finance Private A+(SO) 0.16
Cash and Other Assets 2.85
Net Assets 100.00
COMPOSITION BY ASSETS (As on July 31, 2016)
Ratings % of NAV
Bonds & NCDs 60.81
Sovereign 19.33
Commercial Paper 13.76
Certificate of Deposit 3.25
Cash and Other Assets 2.85
RATING PROFILE (As on July 31, 2016)
$Name change w.e.f May 23, 2016, the scheme was earlier known as Principal Income Fund - Short Term Plan.
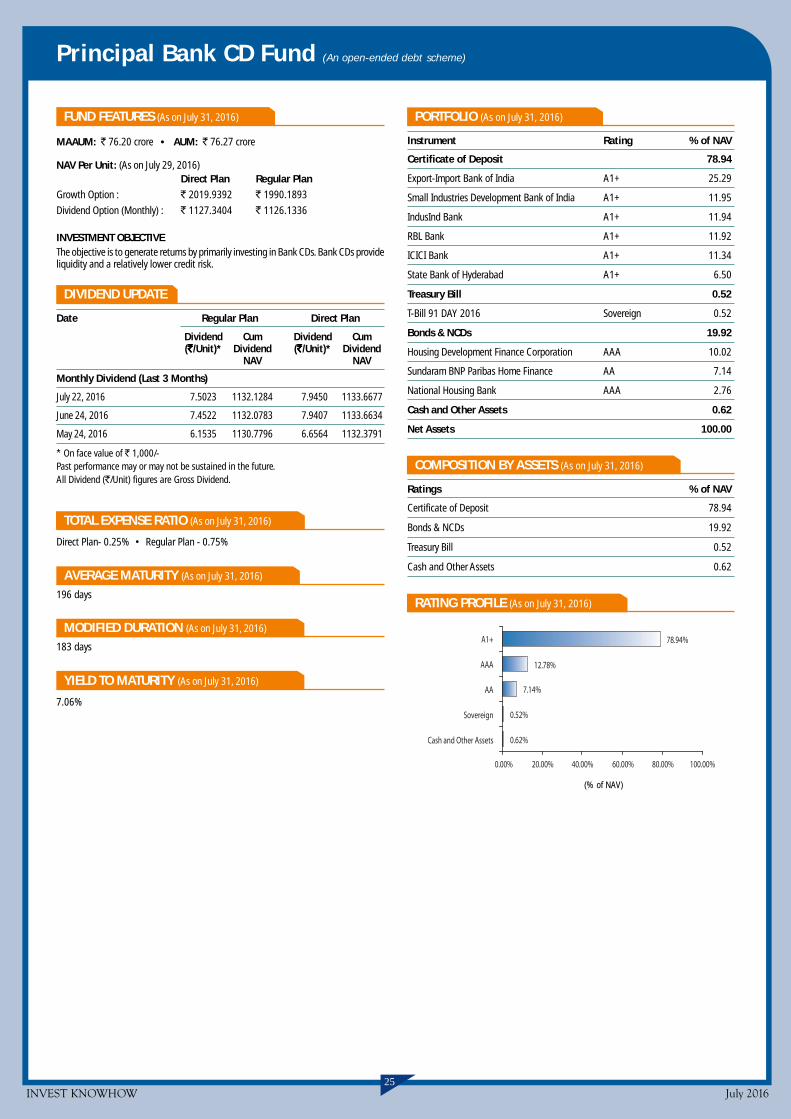
INVEST KNOWHOW July 201625
Principal Bank CD Fund (An open-ended debt scheme)
PORTFOLIO (As on July 31, 2016)
Instrument Rating % of NAV
Certificate of Deposit 78.94
Export-Import Bank of India A1+ 25.29
Small Industries Development Bank of India A1+ 11.95
IndusInd Bank A1+ 11.94
RBL Bank A1+ 11.92
ICICI Bank A1+ 11.34
State Bank of Hyderabad A1+ 6.50
Treasury Bill 0.52
T-Bill 91 DAY 2016 Sovereign 0.52
Bonds & NCDs 19.92
Housing Development Finance Corporation AAA 10.02
Sundaram BNP Paribas Home Finance AA 7.14
National Housing Bank AAA 2.76
Cash and Other Assets 0.62
Net Assets 100.00
COMPOSITION BY ASSETS (As on July 31, 2016)
Ratings % of NAV
Certificate of Deposit 78.94
Bonds & NCDs 19.92
Treasury Bill 0.52
Cash and Other Assets 0.62
RATING PROFILE (As on July 31, 2016)
FUND FEATURES (As on July 31, 2016)
MAAUM: ` 76.20 crore • AUM: ` 76.27 crore
NAV Per Unit: (As on July 29, 2016)Direct Plan Regular Plan
Growth Option : ` 2019.9392 ` 1990.1893
Dividend Option (Monthly) : ` 1127.3404 ` 1126.1336
INVESTMENT OBJECTIVEThe objective is to generate returns by primarily investing in Bank CDs. Bank CDs provideliquidity and a relatively lower credit risk.
DIVIDEND UPDATE
Date Regular Plan Direct Plan
Dividend Cum Dividend Cum(`̀̀̀̀/Unit)* Dividend (`̀̀̀̀/Unit)* Dividend
NAV NAV
Monthly Dividend (Last 3 Months)
July 22, 2016 7.5023 1132.1284 7.9450 1133.6677
June 24, 2016 7.4522 1132.0783 7.9407 1133.6634
May 24, 2016 6.1535 1130.7796 6.6564 1132.3791
* On face value of ` 1,000/-Past performance may or may not be sustained in the future.All Dividend (`/Unit) figures are Gross Dividend.
TOTAL EXPENSE RATIO (As on July 31, 2016)
Direct Plan- 0.25% • Regular Plan - 0.75%
AVERAGE MATURITY (As on July 31, 2016)
196 days
MODIFIED DURATION (As on July 31, 2016)
183 days
YIELD TO MATURITY (As on July 31, 2016)
7.06%
78.94%
12.78%
7.14%
0.62%
0.52%
0.00% 20.00% 40.00% 60.00% 80.00% 100.00%
A1+
AAA
AA
Sovereign
Cash and Other Assets
(% of NAV)
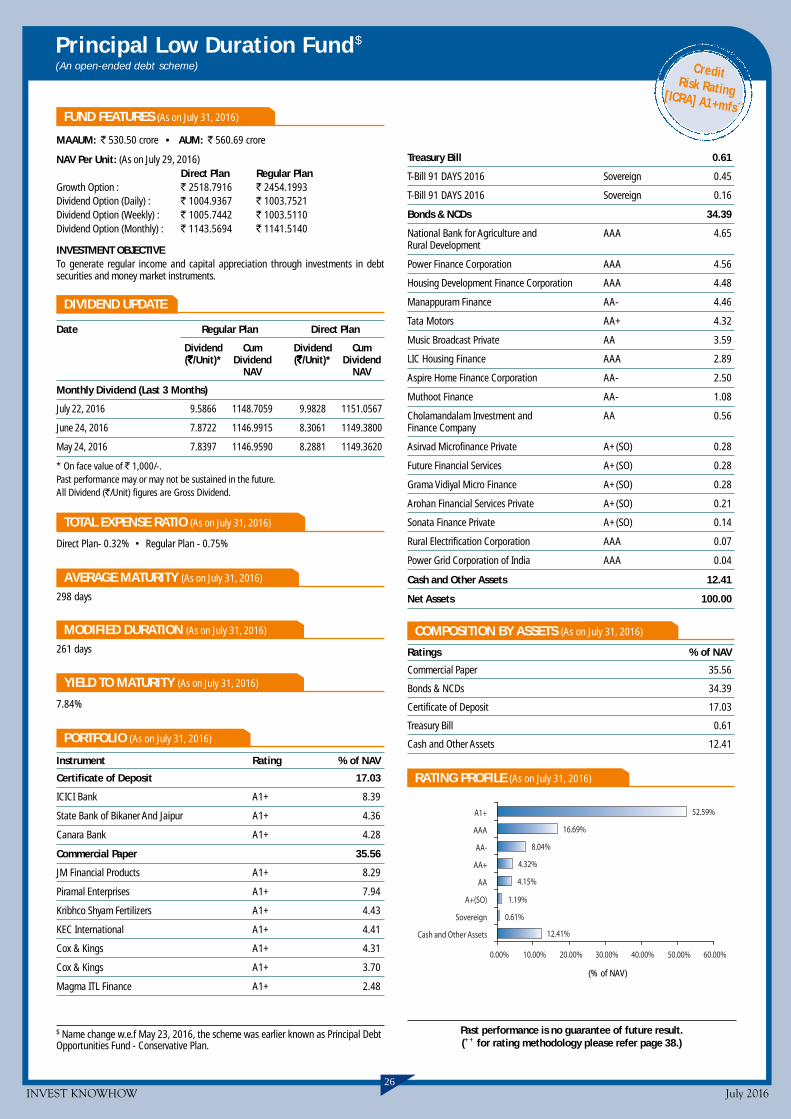
INVEST KNOWHOW July 201626
52.59%
16.69%
8.04%
4.15%
4.32%
1.19%
0.61%
12.41%
0.00% 10.00% 20.00% 30.00% 40.00% 50.00% 60.00%
A1+
AAA
AA-
AA+
AA
A+(SO)
Sovereign
Cash and Other Assets
Principal Low Duration Fund$
(An open-ended debt scheme)
FUND FEATURES (As on July 31, 2016)
MAAUM: ` 530.50 crore • AUM: ` 560.69 crore
NAV Per Unit: (As on July 29, 2016)Direct Plan Regular Plan
Growth Option : ` 2518.7916 ` 2454.1993Dividend Option (Daily) : ` 1004.9367 ` 1003.7521Dividend Option (Weekly) : ` 1005.7442 ` 1003.5110Dividend Option (Monthly) : ` 1143.5694 ` 1141.5140
INVESTMENT OBJECTIVETo generate regular income and capital appreciation through investments in debtsecurities and money market instruments.
DIVIDEND UPDATE
Date Regular Plan Direct Plan
Dividend Cum Dividend Cum(`̀̀̀̀/Unit)* Dividend (`̀̀̀̀/Unit)* Dividend
NAV NAV
Monthly Dividend (Last 3 Months)
July 22, 2016 9.5866 1148.7059 9.9828 1151.0567
June 24, 2016 7.8722 1146.9915 8.3061 1149.3800
May 24, 2016 7.8397 1146.9590 8.2881 1149.3620
* On face value of ` 1,000/-.Past performance may or may not be sustained in the future.All Dividend (`/Unit) figures are Gross Dividend.
TOTAL EXPENSE RATIO (As on July 31, 2016)
Direct Plan- 0.32% • Regular Plan - 0.75%
AVERAGE MATURITY (As on July 31, 2016)
298 days
MODIFIED DURATION (As on July 31, 2016)
261 days
YIELD TO MATURITY (As on July 31, 2016)
7.84%
PORTFOLIO (As on July 31, 2016)
Instrument Rating % of NAV
Certificate of Deposit 17.03
ICICI Bank A1+ 8.39
State Bank of Bikaner And Jaipur A1+ 4.36
Canara Bank A1+ 4.28
Commercial Paper 35.56
JM Financial Products A1+ 8.29
Piramal Enterprises A1+ 7.94
Kribhco Shyam Fertilizers A1+ 4.43
KEC International A1+ 4.41
Cox & Kings A1+ 4.31
Cox & Kings A1+ 3.70
Magma ITL Finance A1+ 2.48
Treasury Bill 0.61
T-Bill 91 DAYS 2016 Sovereign 0.45
T-Bill 91 DAYS 2016 Sovereign 0.16
Bonds & NCDs 34.39
National Bank for Agriculture and AAA 4.65Rural Development
Power Finance Corporation AAA 4.56
Housing Development Finance Corporation AAA 4.48
Manappuram Finance AA- 4.46
Tata Motors AA+ 4.32
Music Broadcast Private AA 3.59
LIC Housing Finance AAA 2.89
Aspire Home Finance Corporation AA- 2.50
Muthoot Finance AA- 1.08
Cholamandalam Investment and AA 0.56Finance Company
Asirvad Microfinance Private A+(SO) 0.28
Future Financial Services A+(SO) 0.28
Grama Vidiyal Micro Finance A+(SO) 0.28
Arohan Financial Services Private A+(SO) 0.21
Sonata Finance Private A+(SO) 0.14
Rural Electrification Corporation AAA 0.07
Power Grid Corporation of India AAA 0.04
Cash and Other Assets 12.41
Net Assets 100.00
COMPOSITION BY ASSETS (As on July 31, 2016)
Ratings % of NAV
Commercial Paper 35.56
Bonds & NCDs 34.39
Certificate of Deposit 17.03
Treasury Bill 0.61
Cash and Other Assets 12.41
RATING PROFILE (As on July 31, 2016)
(% of NAV)
Past performance is no guarantee of future result.(++ for rating methodology please refer page 38.)
CreditRisk Rating[ICRA] A1+mfs ++
$ Name change w.e.f May 23, 2016, the scheme was earlier known as Principal DebtOpportunities Fund - Conservative Plan.

Principal Global Opportunities Fund (An open-ended Fund of Funds scheme)
PORTFOLIO (As on July 31, 2016)
Instrument % of NAV
Foreign Securities
I. Units of Mutual Fund / Unit Trust 100.27Principal Global Investors Funds -Emerging Markets Equity Fund
II. Cash and Other Current Assets -0.27
Net Assets 100.00
Principal Retail Money Manager Fund (An open-ended debt scheme)
84.76%
6.26%
8.98%
0.00% 20.00% 40.00% 60.00% 80.00% 100.00%
A1+
Sovereign
Cash and Other Assets
(% of NAV)
PORTFOLIO (As on July 31, 2016)
Instrument Rating % of NAVCertificate of Deposit 19.22
HDFC Bank A1+ 9.61
IDFC Bank A1+ 9.61
Commercial Paper 65.54
Piramal Enterprises A1+ 10.24
Aadhar Housing Finance A1+ 9.66
Cox & Kings A1+ 9.66
Religare Housing Development Finance Corporation A1+ 9.65
Kribhco Shyam Fertilizers A1+ 8.26
KEC International A1+ 7.60
Magma Fincorp A1+ 5.50
Magma ITL Finance A1+ 4.97
Treasury Bill 6.26
T-Bill 91 DAYS 2016 Sovereign 5.49
T-Bill 91 DAYS 2016 Sovereign 0.77
Cash and Other Assets 8.98
Net Assets 100.00
COMPOSITION BY ASSETS (As on July 31, 2016)
Ratings % of NAV
Commercial Paper 65.54
Certificate of Deposit 19.22
Treasury Bill 6.26
Cash and Other Assets 8.98
RATING PROFILE (As on July 31, 2016)
INVEST KNOWHOW July 201627
FUND FEATURES (As on July 31, 2016)
MAAUM: ` 15.79 crore • AUM: ` 15.97 crore
NAV Per Unit: (As on July 29, 2016)Direct Plan Regular Plan
Growth Option: ` 22.2526 ` 21.9339Dividend Option: ` 22.2526 ` 21.9339
INVESTMENT OBJECTIVETo provide long term capital appreciation by predominantly investing in overseas mutualfund schemes, and a certain portion of its corpus in Money Market Securities and/orunits of Money Market / Liquid Schemes of Principal Mutual Fund.
TOTAL EXPENSE RATIO# (As on July 31, 2016)
Direct Plan- 0.36% • Regular Plan - 0.81%# MTD ratio to Average AUM including Service Tax on Management Fees which is over and aboveto TER & after deducting rebate. Expenses charged by the underlying funds are not included inthe Expense Ratios given above.
FUND FEATURES (As on July 31, 2016)
MAAUM: ` 36.65 crore • AUM: ` 36.07 crore
NAV Per Unit: (As on July 29, 2016)Direct Plan Regular Plan
Growth Option : ` 1767.7082 ` 1762.2709Dividend Option (Daily) : N.A. ` 1005.4300Dividend Option (Weekly) : N.A. ` 1018.2925Dividend Option (Monthly) : ` 1060.4697 ` 1060.4160
INVESTMENT OBJECTIVETo generate regular income & capital appreciation through investments in debt securitiesand money market instruments.
DIVIDEND UPDATE
Date Regular Plan Direct Plan
Dividend Cum Dividend Cum(`̀̀̀̀/Unit)* Dividend (`̀̀̀̀/Unit)* Dividend
NAV NAV
Monthly Dividend (Last 3 Months)
July 22, 2016 6.8381 1065.6673 6.8956 1065.7642
June 24, 2016 7.3208 1066.15 7.3841 1066.2527
May 24, 2016 7.5698 1066.3990 7.6358 1066.5044
* On face value of ` 1,000/-.Past performance may or may not be sustained in the future.Note: All Dividend (`/Unit) figures are Gross Dividend.
TOTAL EXPENSE RATIO (As on July 31, 2016)
Direct Plan- 0.27% • Regular Plan - 0.34%
AVERAGE MATURITY (As on July 31, 2016)
38 days
MODIFIED DURATION (As on July 31, 2016)
35 days
YIELD TO MATURITY (As on July 31, 2016)
7.85%
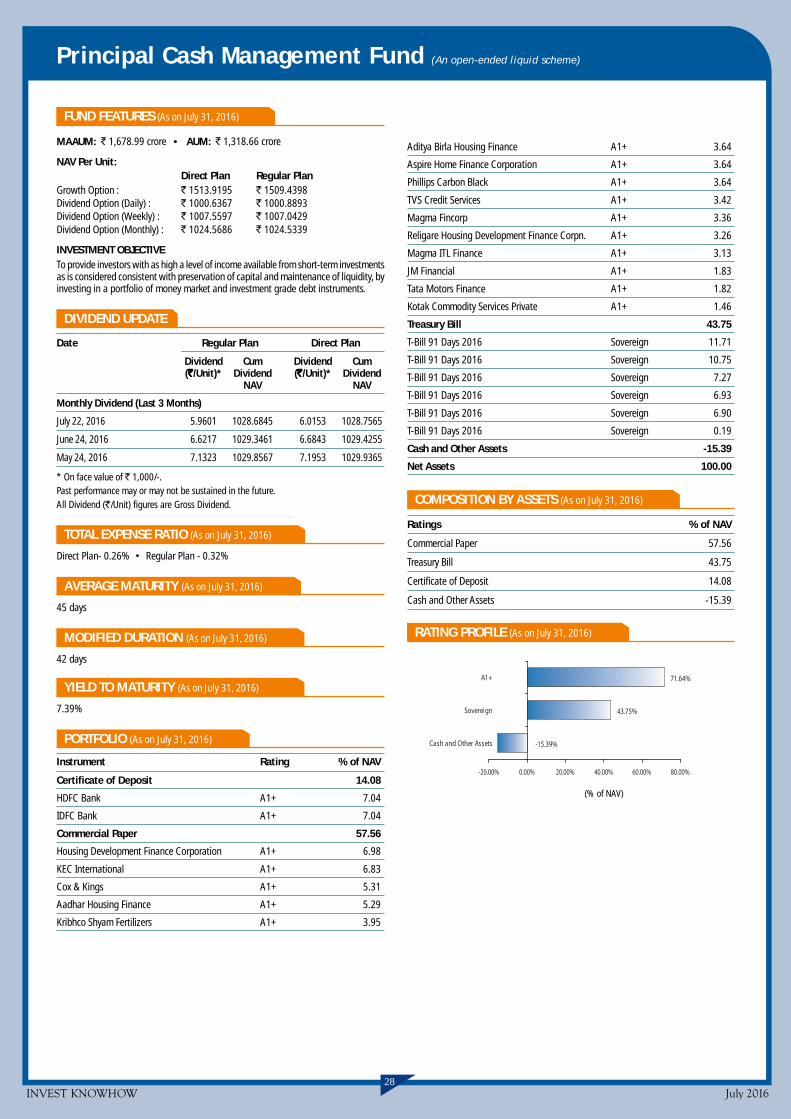
INVEST KNOWHOW July 201628
Principal Cash Management Fund (An open-ended liquid scheme)
71.64%
43.75%
-15.39%
-20.00% 0.00% 20.00% 40.00% 60.00% 80.00%
A1+
Sovereign
Cash and Other Assets
(% of NAV)
Aditya Birla Housing Finance A1+ 3.64
Aspire Home Finance Corporation A1+ 3.64
Phillips Carbon Black A1+ 3.64
TVS Credit Services A1+ 3.42
Magma Fincorp A1+ 3.36
Religare Housing Development Finance Corpn. A1+ 3.26
Magma ITL Finance A1+ 3.13
JM Financial A1+ 1.83
Tata Motors Finance A1+ 1.82
Kotak Commodity Services Private A1+ 1.46
Treasury Bill 43.75
T-Bill 91 Days 2016 Sovereign 11.71
T-Bill 91 Days 2016 Sovereign 10.75
T-Bill 91 Days 2016 Sovereign 7.27
T-Bill 91 Days 2016 Sovereign 6.93
T-Bill 91 Days 2016 Sovereign 6.90
T-Bill 91 Days 2016 Sovereign 0.19
Cash and Other Assets -15.39
Net Assets 100.00
COMPOSITION BY ASSETS (As on July 31, 2016)
Ratings % of NAV
Commercial Paper 57.56
Treasury Bill 43.75
Certificate of Deposit 14.08
Cash and Other Assets -15.39
RATING PROFILE (As on July 31, 2016)
FUND FEATURES (As on July 31, 2016)
MAAUM: ` 1,678.99 crore • AUM: ` 1,318.66 crore
NAV Per Unit:Direct Plan Regular Plan
Growth Option : ` 1513.9195 ` 1509.4398Dividend Option (Daily) : ` 1000.6367 ` 1000.8893Dividend Option (Weekly) : ` 1007.5597 ` 1007.0429Dividend Option (Monthly) : ` 1024.5686 ` 1024.5339
INVESTMENT OBJECTIVETo provide investors with as high a level of income available from short-term investmentsas is considered consistent with preservation of capital and maintenance of liquidity, byinvesting in a portfolio of money market and investment grade debt instruments.
DIVIDEND UPDATE
Date Regular Plan Direct Plan
Dividend Cum Dividend Cum(`̀̀̀̀/Unit)* Dividend (`̀̀̀̀/Unit)* Dividend
NAV NAV
Monthly Dividend (Last 3 Months)
July 22, 2016 5.9601 1028.6845 6.0153 1028.7565
June 24, 2016 6.6217 1029.3461 6.6843 1029.4255
May 24, 2016 7.1323 1029.8567 7.1953 1029.9365
* On face value of ` 1,000/-.Past performance may or may not be sustained in the future.All Dividend (`/Unit) figures are Gross Dividend.
TOTAL EXPENSE RATIO (As on July 31, 2016)
Direct Plan- 0.26% • Regular Plan - 0.32%
AVERAGE MATURITY (As on July 31, 2016)
45 days
MODIFIED DURATION (As on July 31, 2016)
42 days
YIELD TO MATURITY (As on July 31, 2016)
7.39%
PORTFOLIO (As on July 31, 2016)
Instrument Rating % of NAV
Certificate of Deposit 14.08
HDFC Bank A1+ 7.04
IDFC Bank A1+ 7.04
Commercial Paper 57.56
Housing Development Finance Corporation A1+ 6.98
KEC International A1+ 6.83
Cox & Kings A1+ 5.31
Aadhar Housing Finance A1+ 5.29
Kribhco Shyam Fertilizers A1+ 3.95
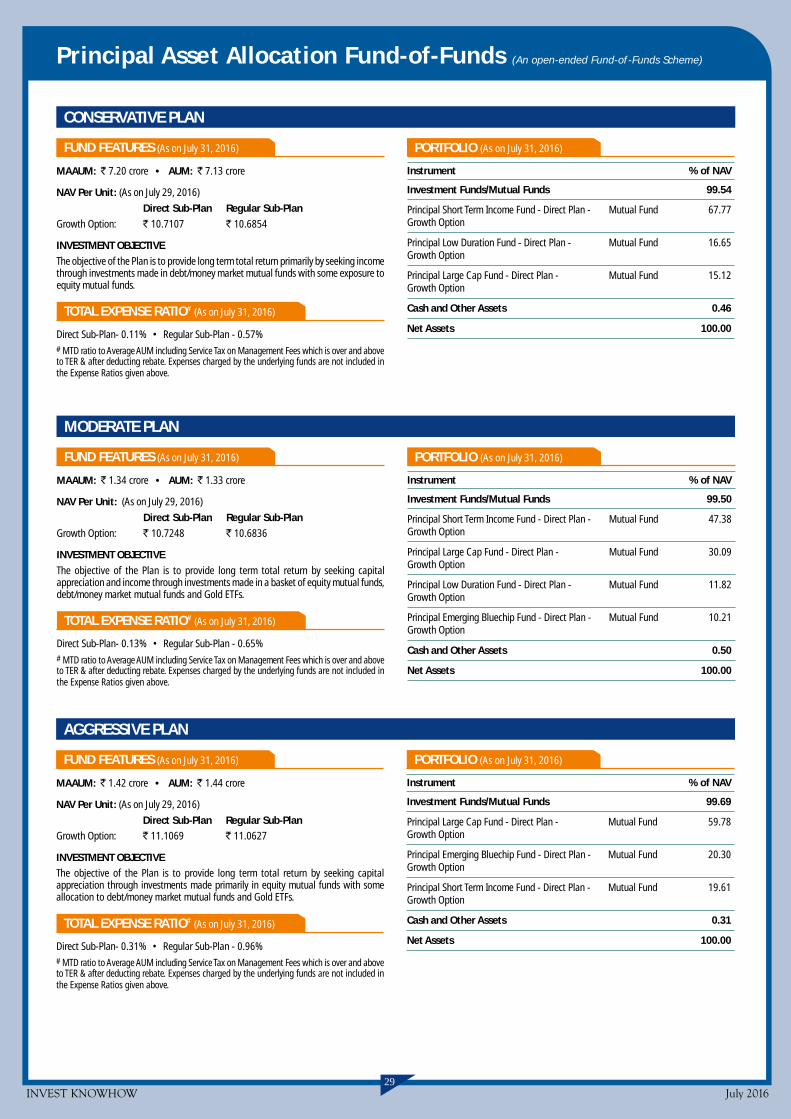
INVEST KNOWHOW July 201629
Principal Asset Allocation Fund-of-Funds (An open-ended Fund-of-Funds Scheme)
PORTFOLIO (As on July 31, 2016)
Instrument % of NAV
Investment Funds/Mutual Funds 99.54
Principal Short Term Income Fund - Direct Plan - Mutual Fund 67.77Growth Option
Principal Low Duration Fund - Direct Plan - Mutual Fund 16.65Growth Option
Principal Large Cap Fund - Direct Plan - Mutual Fund 15.12Growth Option
Cash and Other Assets 0.46
Net Assets 100.00
FUND FEATURES (As on July 31, 2016)
MAAUM: ` 7.20 crore • AUM: ` 7.13 crore
NAV Per Unit: (As on July 29, 2016)
Direct Sub-Plan Regular Sub-PlanGrowth Option: ` 10.7107 ` 10.6854
INVESTMENT OBJECTIVEThe objective of the Plan is to provide long term total return primarily by seeking incomethrough investments made in debt/money market mutual funds with some exposure toequity mutual funds.
TOTAL EXPENSE RATIO# (As on July 31, 2016)
Direct Sub-Plan- 0.11% • Regular Sub-Plan - 0.57%# MTD ratio to Average AUM including Service Tax on Management Fees which is over and aboveto TER & after deducting rebate. Expenses charged by the underlying funds are not included inthe Expense Ratios given above.
CONSERVATIVE PLAN
PORTFOLIO (As on July 31, 2016)
Instrument % of NAV
Investment Funds/Mutual Funds 99.50
Principal Short Term Income Fund - Direct Plan - Mutual Fund 47.38Growth Option
Principal Large Cap Fund - Direct Plan - Mutual Fund 30.09Growth Option
Principal Low Duration Fund - Direct Plan - Mutual Fund 11.82Growth Option
Principal Emerging Bluechip Fund - Direct Plan - Mutual Fund 10.21Growth Option
Cash and Other Assets 0.50
Net Assets 100.00
FUND FEATURES (As on July 31, 2016)
MAAUM: ` 1.34 crore • AUM: ` 1.33 crore
NAV Per Unit: (As on July 29, 2016)
Direct Sub-Plan Regular Sub-PlanGrowth Option: ` 10.7248 ` 10.6836
INVESTMENT OBJECTIVEThe objective of the Plan is to provide long term total return by seeking capitalappreciation and income through investments made in a basket of equity mutual funds,debt/money market mutual funds and Gold ETFs.
TOTAL EXPENSE RATIO# (As on July 31, 2016)
Direct Sub-Plan- 0.13% • Regular Sub-Plan - 0.65%# MTD ratio to Average AUM including Service Tax on Management Fees which is over and aboveto TER & after deducting rebate. Expenses charged by the underlying funds are not included inthe Expense Ratios given above.
MODERATE PLAN
PORTFOLIO (As on July 31, 2016)
Instrument % of NAV
Investment Funds/Mutual Funds 99.69
Principal Large Cap Fund - Direct Plan - Mutual Fund 59.78Growth Option
Principal Emerging Bluechip Fund - Direct Plan - Mutual Fund 20.30Growth Option
Principal Short Term Income Fund - Direct Plan - Mutual Fund 19.61Growth Option
Cash and Other Assets 0.31
Net Assets 100.00
FUND FEATURES (As on July 31, 2016)
MAAUM: ` 1.42 crore • AUM: ` 1.44 crore
NAV Per Unit: (As on July 29, 2016)
Direct Sub-Plan Regular Sub-PlanGrowth Option: ` 11.1069 ` 11.0627
INVESTMENT OBJECTIVEThe objective of the Plan is to provide long term total return by seeking capitalappreciation through investments made primarily in equity mutual funds with someallocation to debt/money market mutual funds and Gold ETFs.
TOTAL EXPENSE RATIO# (As on July 31, 2016)
Direct Sub-Plan- 0.31% • Regular Sub-Plan - 0.96%# MTD ratio to Average AUM including Service Tax on Management Fees which is over and aboveto TER & after deducting rebate. Expenses charged by the underlying funds are not included inthe Expense Ratios given above.
AGGRESSIVE PLAN
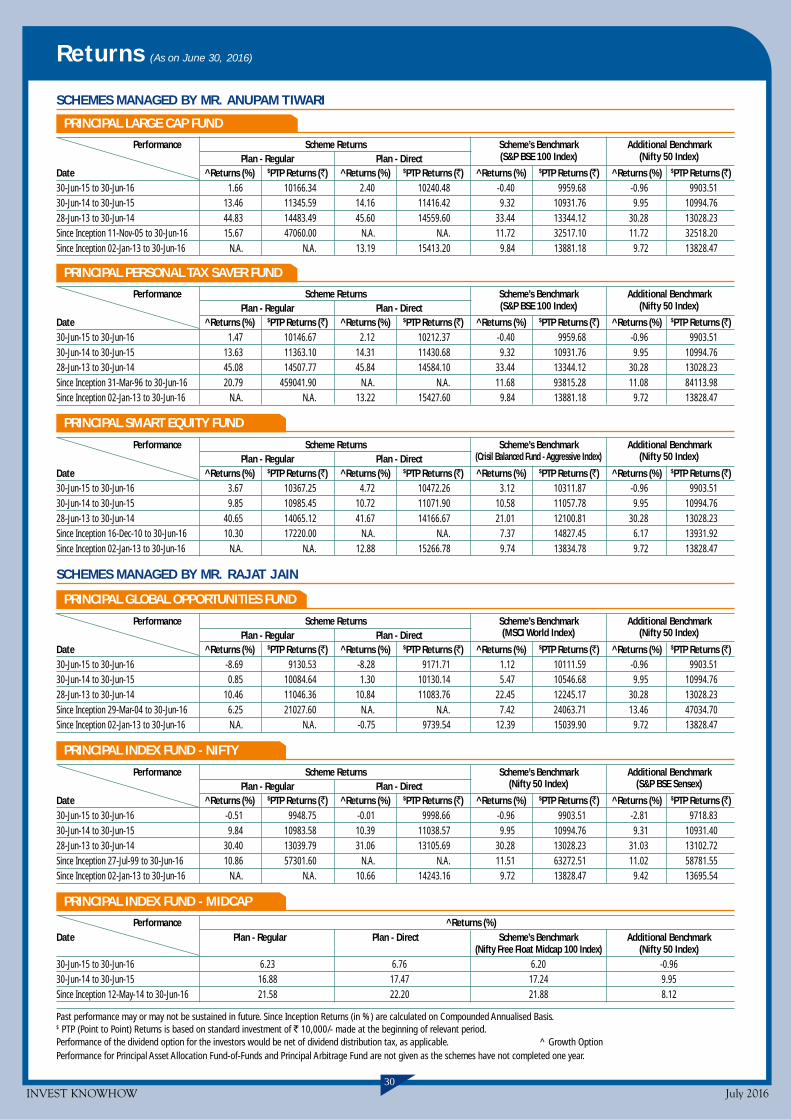
INVEST KNOWHOW July 201630
SCHEMES MANAGED BY MR. ANUPAM TIWARI
Returns (As on June 30, 2016)
SCHEMES MANAGED BY MR. RAJAT JAIN
PRINCIPAL LARGE CAP FUND
Performance Scheme Returns Scheme’s Benchmark Additional BenchmarkPlan - Regular Plan - Direct (S&P BSE 100 Index) (Nifty 50 Index)
Date ^Returns (%) $PTP Returns (`) ^Returns (%) $PTP Returns (`) ^Returns (%) $PTP Returns (`) ^Returns (%) $PTP Returns (`)30-Jun-15 to 30-Jun-16 1.66 10166.34 2.40 10240.48 -0.40 9959.68 -0.96 9903.5130-Jun-14 to 30-Jun-15 13.46 11345.59 14.16 11416.42 9.32 10931.76 9.95 10994.7628-Jun-13 to 30-Jun-14 44.83 14483.49 45.60 14559.60 33.44 13344.12 30.28 13028.23Since Inception 11-Nov-05 to 30-Jun-16 15.67 47060.00 N.A. N.A. 11.72 32517.10 11.72 32518.20Since Inception 02-Jan-13 to 30-Jun-16 N.A. N.A. 13.19 15413.20 9.84 13881.18 9.72 13828.47
PRINCIPAL SMART EQUITY FUND
Performance Scheme Returns Scheme’s Benchmark Additional BenchmarkPlan - Regular Plan - Direct (Crisil Balanced Fund - Aggressive Index) (Nifty 50 Index)
Date ^Returns (%) $PTP Returns (`) ^Returns (%) $PTP Returns (`) ^Returns (%) $PTP Returns (`) ^Returns (%) $PTP Returns (`)30-Jun-15 to 30-Jun-16 3.67 10367.25 4.72 10472.26 3.12 10311.87 -0.96 9903.5130-Jun-14 to 30-Jun-15 9.85 10985.45 10.72 11071.90 10.58 11057.78 9.95 10994.7628-Jun-13 to 30-Jun-14 40.65 14065.12 41.67 14166.67 21.01 12100.81 30.28 13028.23Since Inception 16-Dec-10 to 30-Jun-16 10.30 17220.00 N.A. N.A. 7.37 14827.45 6.17 13931.92Since Inception 02-Jan-13 to 30-Jun-16 N.A. N.A. 12.88 15266.78 9.74 13834.78 9.72 13828.47
PRINCIPAL GLOBAL OPPORTUNITIES FUND
Performance Scheme Returns Scheme’s Benchmark Additional BenchmarkPlan - Regular Plan - Direct (MSCI World Index) (Nifty 50 Index)
Date ^Returns (%) $PTP Returns (`) ^Returns (%) $PTP Returns (`) ^Returns (%) $PTP Returns (`) ^Returns (%) $PTP Returns (`)30-Jun-15 to 30-Jun-16 -8.69 9130.53 -8.28 9171.71 1.12 10111.59 -0.96 9903.5130-Jun-14 to 30-Jun-15 0.85 10084.64 1.30 10130.14 5.47 10546.68 9.95 10994.7628-Jun-13 to 30-Jun-14 10.46 11046.36 10.84 11083.76 22.45 12245.17 30.28 13028.23Since Inception 29-Mar-04 to 30-Jun-16 6.25 21027.60 N.A. N.A. 7.42 24063.71 13.46 47034.70Since Inception 02-Jan-13 to 30-Jun-16 N.A. N.A. -0.75 9739.54 12.39 15039.90 9.72 13828.47
Past performance may or may not be sustained in future. Since Inception Returns (in %) are calculated on Compounded Annualised Basis.$ PTP (Point to Point) Returns is based on standard investment of ` 10,000/- made at the beginning of relevant period.Performance of the dividend option for the investors would be net of dividend distribution tax, as applicable. ^ Growth OptionPerformance for Principal Asset Allocation Fund-of-Funds and Principal Arbitrage Fund are not given as the schemes have not completed one year.
PRINCIPAL INDEX FUND - NIFTY
Performance Scheme Returns Scheme’s Benchmark Additional BenchmarkPlan - Regular Plan - Direct (Nifty 50 Index) (S&P BSE Sensex)
Date ^Returns (%) $PTP Returns (`) ^Returns (%) $PTP Returns (`) ^Returns (%) $PTP Returns (`) ^Returns (%) $PTP Returns (`)30-Jun-15 to 30-Jun-16 -0.51 9948.75 -0.01 9998.66 -0.96 9903.51 -2.81 9718.8330-Jun-14 to 30-Jun-15 9.84 10983.58 10.39 11038.57 9.95 10994.76 9.31 10931.4028-Jun-13 to 30-Jun-14 30.40 13039.79 31.06 13105.69 30.28 13028.23 31.03 13102.72Since Inception 27-Jul-99 to 30-Jun-16 10.86 57301.60 N.A. N.A. 11.51 63272.51 11.02 58781.55Since Inception 02-Jan-13 to 30-Jun-16 N.A. N.A. 10.66 14243.16 9.72 13828.47 9.42 13695.54
PRINCIPAL PERSONAL TAX SAVER FUND
Performance Scheme Returns Scheme’s Benchmark Additional BenchmarkPlan - Regular Plan - Direct (S&P BSE 100 Index) (Nifty 50 Index)
Date ^Returns (%) $PTP Returns (`) ^Returns (%) $PTP Returns (`) ^Returns (%) $PTP Returns (`) ^Returns (%) $PTP Returns (`)30-Jun-15 to 30-Jun-16 1.47 10146.67 2.12 10212.37 -0.40 9959.68 -0.96 9903.5130-Jun-14 to 30-Jun-15 13.63 11363.10 14.31 11430.68 9.32 10931.76 9.95 10994.7628-Jun-13 to 30-Jun-14 45.08 14507.77 45.84 14584.10 33.44 13344.12 30.28 13028.23Since Inception 31-Mar-96 to 30-Jun-16 20.79 459041.90 N.A. N.A. 11.68 93815.28 11.08 84113.98Since Inception 02-Jan-13 to 30-Jun-16 N.A. N.A. 13.22 15427.60 9.84 13881.18 9.72 13828.47
PRINCIPAL INDEX FUND - MIDCAP
Performance ^Returns (%)Date Plan - Regular Plan - Direct Scheme’s Benchmark Additional Benchmark
(Nifty Free Float Midcap 100 Index) (Nifty 50 Index)30-Jun-15 to 30-Jun-16 6.23 6.76 6.20 -0.9630-Jun-14 to 30-Jun-15 16.88 17.47 17.24 9.95Since Inception 12-May-14 to 30-Jun-16 21.58 22.20 21.88 8.12

INVEST KNOWHOW July 201631
SCHEMES MANAGED BY BEKXY KURIAKOSE
PRINCIPAL GOVERNMENT SECURITIES FUND
Performance Scheme Returns Scheme’s Benchmark Additional BenchmarkPlan - Regular Plan - Direct (I-Sec Composite Index) (CRISIL 10 Year Gilt Index)
Date ^Returns (%) $PTP Returns (`) ^Returns (%) $PTP Returns (`) ^Returns (%) $PTP Returns (`) ^Returns (%) $PTP Returns (`)
30-Jun-15 to 30-Jun-16 9.84 10983.87 10.43 11042.86 10.81 11081.38 10.03 11003.40
30-Jun-14 to 30-Jun-15 12.39 11238.86 12.94 11293.51 11.70 11169.76 11.76 11176.42
28-Jun-13 to 30-Jun-14 -0.29 9971.46 0.22 10021.64 4.43 10442.70 -2.47 9753.08
Since Inception 23-Aug-01 to 30-Jun-16 7.77 30411.60 N.A. N.A. Not Available Not Available N.A. N.A.
Since Inception 02-Jan-13 to 30-Jun-16 N.A. N.A. 8.80 13425.21 9.31 13647.18 7.22 12755.68
PRINCIPAL CREDIT OPPORTUNITIES FUND
Performance Scheme Returns Scheme’s Benchmark Additional BenchmarkPlan - Regular Plan - Direct (Crisil Liquid Fund Index) (CRISIL 1 Year T-Bill Index)
Date ^Returns (%) $PTP Returns (`) ^Returns (%) $PTP Returns (`) ^Returns (%) $PTP Returns (`) ^Returns (%) $PTP Returns (`)
30-Jun-15 to 30-Jun-16 8.73 10873.17 8.91 10891.43 7.90 10789.98 7.67 10767.10
30-Jun-14 to 30-Jun-15 9.55 10955.00 9.88 10988.03 8.77 10876.94 8.54 10854.46
28-Jun-13 to 30-Jun-14 7.53 10753.42 8.14 10814.25 9.68 10968.20 5.93 10592.80
Since Inception 14-Sep-04 to 30-Jun-16 7.66 23897.36 N.A. N.A. 7.19 22681.59 6.05 20004.41
Since Inception 02-Jan-13 to 30-Jun-16 N.A. N.A. 8.96 13493.38 8.71 13385.31 7.48 12864.03
PRINCIPAL DYNAMIC BOND FUND
Performance Scheme Returns Scheme’s Benchmark Additional BenchmarkPlan - Regular Plan - Direct (Crisil Composite Bond Fund Index) (CRISIL 10 Year Gilt Index)
Date ^Returns (%) $PTP Returns (`) ^Returns (%) $PTP Returns (`) ^Returns (%) $PTP Returns (`) ^Returns (%) $PTP Returns (`)
30-Jun-15 to 30-Jun-16 8.98 10897.66 9.78 10977.54 10.19 11019.15 10.03 11003.40
30-Jun-14 to 30-Jun-15 11.12 11111.59 11.85 11185.43 11.10 11109.70 11.76 11176.42
28-Jun-13 to 30-Jun-14 2.48 10248.27 3.35 10335.49 4.60 10460.00 -2.47 9753.08
Since Inception 09-May-03 to 30-Jun-16 7.55 26041.80 N.A. N.A. 6.51 22934.49 5.76 20896.61
Since Inception 02-Jan-13 to 30-Jun-16 N.A. N.A. 8.91 13473.94 8.94 13487.46 7.22 12755.68
Returns (As on June 30, 2016)
Past performance may or may not be sustained in future. Since Inception Returns (in %) are calculated on Compounded Annualised Basis.$ PTP (Point to Point) Returns is based on standard investment of ` 10,000/- made at the beginning of relevant period.Performance of the dividend option for the investors would be net of dividend distribution tax, as applicable.^ Growth Option
SCHEMES MANAGED BY MR. DHIMANT SHAH
PRINCIPAL EMERGING BLUECHIP FUND
Performance Scheme Returns Scheme’s Benchmark Additional BenchmarkPlan - Regular Plan - Direct (Nifty Free Float Midcap 100 Index) (Nifty 50 Index)
Date ^Returns (%) $PTP Returns (`) ^Returns (%) $PTP Returns (`) ^Returns (%) $PTP Returns (`) ^Returns (%) $PTP Returns (`)
30-Jun-15 to 30-Jun-16 6.03 10602.83 7.06 10705.78 6.20 10620.16 -0.96 9903.51
30-Jun-14 to 30-Jun-15 34.33 13433.33 35.39 13538.55 17.24 11723.68 9.95 10994.76
28-Jun-13 to 30-Jun-14 63.08 16351.39 63.95 16439.97 50.79 15113.45 30.28 13028.23
Since Inception 12-Nov-08 to 30-Jun-16 29.65 72640.00 N.A. N.A. 19.00 37735.43 15.01 29095.65
Since Inception 02-Jan-13 to 30-Jun-16 N.A. N.A. 24.76 21656.99 14.41 16003.21 9.72 13828.47
PRINCIPAL DIVIDEND YIELD FUND
Performance Scheme Returns Scheme’s Benchmark Additional BenchmarkPlan - Regular Plan - Direct (Nifty Dividend Opportunities 50 Index) (Nifty 50 Index)
Date ^Returns (%) $PTP Returns (`) ^Returns (%) $PTP Returns (`) ^Returns (%) $PTP Returns (`) ^Returns (%) $PTP Returns (`)
30-Jun-15 to 30-Jun-16 1.27 10127.30 1.81 10181.31 -2.78 9721.94 -0.96 9903.51
30-Jun-14 to 30-Jun-15 8.57 10856.88 9.20 10919.89 -3.41 9658.60 9.95 10994.76
28-Jun-13 to 30-Jun-14 42.43 14243.22 43.11 14311.25 29.49 12948.66 30.28 13028.23
Since Inception 15-Oct-04 to 30-Jun-16 11.50 35800.00 N.A. N.A. Not Available Not Available 13.95 46171.31
Since Inception 02-Jan-13 to 30-Jun-16 N.A. N.A. 9.37 13675.53 2.95 11069.25 9.72 13828.47
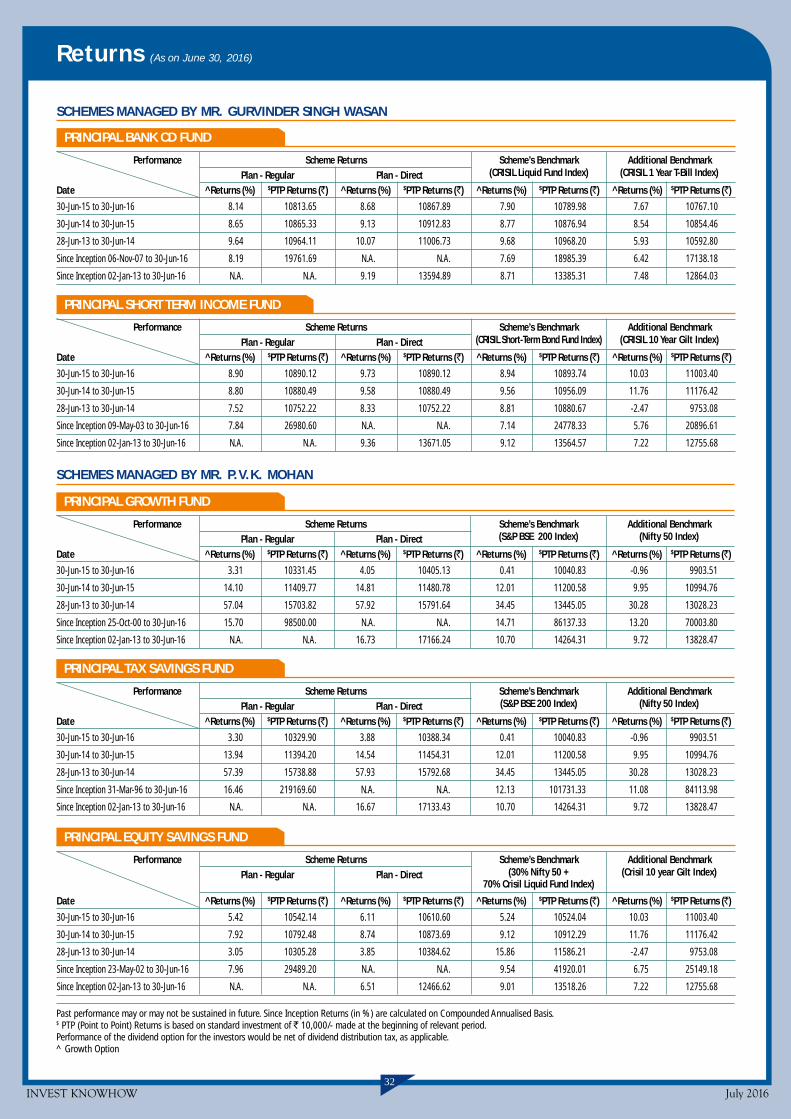
INVEST KNOWHOW July 201632
Returns (As on June 30, 2016)
SCHEMES MANAGED BY MR. P.V.K. MOHAN
PRINCIPAL GROWTH FUND
Performance Scheme Returns Scheme’s Benchmark Additional BenchmarkPlan - Regular Plan - Direct (S&P BSE 200 Index) (Nifty 50 Index)
Date ^Returns (%) $PTP Returns (`) ^Returns (%) $PTP Returns (`) ^Returns (%) $PTP Returns (`) ^Returns (%) $PTP Returns (`)
30-Jun-15 to 30-Jun-16 3.31 10331.45 4.05 10405.13 0.41 10040.83 -0.96 9903.51
30-Jun-14 to 30-Jun-15 14.10 11409.77 14.81 11480.78 12.01 11200.58 9.95 10994.76
28-Jun-13 to 30-Jun-14 57.04 15703.82 57.92 15791.64 34.45 13445.05 30.28 13028.23
Since Inception 25-Oct-00 to 30-Jun-16 15.70 98500.00 N.A. N.A. 14.71 86137.33 13.20 70003.80
Since Inception 02-Jan-13 to 30-Jun-16 N.A. N.A. 16.73 17166.24 10.70 14264.31 9.72 13828.47
Past performance may or may not be sustained in future. Since Inception Returns (in %) are calculated on Compounded Annualised Basis.$ PTP (Point to Point) Returns is based on standard investment of ` 10,000/- made at the beginning of relevant period.Performance of the dividend option for the investors would be net of dividend distribution tax, as applicable.^ Growth Option
PRINCIPAL TAX SAVINGS FUND
Performance Scheme Returns Scheme’s Benchmark Additional BenchmarkPlan - Regular Plan - Direct (S&P BSE 200 Index) (Nifty 50 Index)
Date ^Returns (%) $PTP Returns (`) ^Returns (%) $PTP Returns (`) ^Returns (%) $PTP Returns (`) ^Returns (%) $PTP Returns (`)
30-Jun-15 to 30-Jun-16 3.30 10329.90 3.88 10388.34 0.41 10040.83 -0.96 9903.51
30-Jun-14 to 30-Jun-15 13.94 11394.20 14.54 11454.31 12.01 11200.58 9.95 10994.76
28-Jun-13 to 30-Jun-14 57.39 15738.88 57.93 15792.68 34.45 13445.05 30.28 13028.23
Since Inception 31-Mar-96 to 30-Jun-16 16.46 219169.60 N.A. N.A. 12.13 101731.33 11.08 84113.98
Since Inception 02-Jan-13 to 30-Jun-16 N.A. N.A. 16.67 17133.43 10.70 14264.31 9.72 13828.47
SCHEMES MANAGED BY MR. GURVINDER SINGH WASAN
PRINCIPAL BANK CD FUND
Performance Scheme Returns Scheme’s Benchmark Additional BenchmarkPlan - Regular Plan - Direct (CRISIL Liquid Fund Index) (CRISIL 1 Year T-Bill Index)
Date ^Returns (%) $PTP Returns (`) ^Returns (%) $PTP Returns (`) ^Returns (%) $PTP Returns (`) ^Returns (%) $PTP Returns (`)
30-Jun-15 to 30-Jun-16 8.14 10813.65 8.68 10867.89 7.90 10789.98 7.67 10767.10
30-Jun-14 to 30-Jun-15 8.65 10865.33 9.13 10912.83 8.77 10876.94 8.54 10854.46
28-Jun-13 to 30-Jun-14 9.64 10964.11 10.07 11006.73 9.68 10968.20 5.93 10592.80
Since Inception 06-Nov-07 to 30-Jun-16 8.19 19761.69 N.A. N.A. 7.69 18985.39 6.42 17138.18
Since Inception 02-Jan-13 to 30-Jun-16 N.A. N.A. 9.19 13594.89 8.71 13385.31 7.48 12864.03
PRINCIPAL SHORT TERM INCOME FUND
Performance Scheme Returns Scheme’s Benchmark Additional BenchmarkPlan - Regular Plan - Direct (CRISIL Short-Term Bond Fund Index) (CRISIL 10 Year Gilt Index)
Date ^Returns (%) $PTP Returns (`) ^Returns (%) $PTP Returns (`) ^Returns (%) $PTP Returns (`) ^Returns (%) $PTP Returns (`)
30-Jun-15 to 30-Jun-16 8.90 10890.12 9.73 10890.12 8.94 10893.74 10.03 11003.40
30-Jun-14 to 30-Jun-15 8.80 10880.49 9.58 10880.49 9.56 10956.09 11.76 11176.42
28-Jun-13 to 30-Jun-14 7.52 10752.22 8.33 10752.22 8.81 10880.67 -2.47 9753.08
Since Inception 09-May-03 to 30-Jun-16 7.84 26980.60 N.A. N.A. 7.14 24778.33 5.76 20896.61
Since Inception 02-Jan-13 to 30-Jun-16 N.A. N.A. 9.36 13671.05 9.12 13564.57 7.22 12755.68
PRINCIPAL EQUITY SAVINGS FUND
Performance Scheme Returns Scheme’s Benchmark Additional BenchmarkPlan - Regular Plan - Direct (30% Nifty 50 + (Crisil 10 year Gilt Index)
70% Crisil Liquid Fund Index)
Date ^Returns (%) $PTP Returns (`) ^Returns (%) $PTP Returns (`) ^Returns (%) $PTP Returns (`) ^Returns (%) $PTP Returns (`)
30-Jun-15 to 30-Jun-16 5.42 10542.14 6.11 10610.60 5.24 10524.04 10.03 11003.40
30-Jun-14 to 30-Jun-15 7.92 10792.48 8.74 10873.69 9.12 10912.29 11.76 11176.42
28-Jun-13 to 30-Jun-14 3.05 10305.28 3.85 10384.62 15.86 11586.21 -2.47 9753.08
Since Inception 23-May-02 to 30-Jun-16 7.96 29489.20 N.A. N.A. 9.54 41920.01 6.75 25149.18
Since Inception 02-Jan-13 to 30-Jun-16 N.A. N.A. 6.51 12466.62 9.01 13518.26 7.22 12755.68

INVEST KNOWHOW July 201633
Returns (As on June 30, 2016)
PRINCIPAL DEBT SAVINGS FUND - RETAIL PLAN
Performance Scheme Returns Scheme’s Benchmark Additional BenchmarkPlan - Regular Plan - Direct (CRISIL Short-Term Bond Fund Index) (CRISIL 10 Year Gilt Index)
Date ^Returns (%) $PTP Returns (`) ^Returns (%) $PTP Returns (`) ^Returns (%) $PTP Returns (`) ^Returns (%) $PTP Returns (`)
30-Jun-15 to 30-Jun-16 8.60 10860.19 9.42 10941.99 8.94 10893.74 10.03 11003.40
30-Jun-14 to 30-Jun-15 8.16 10815.64 8.97 10897.06 9.56 10956.09 11.76 11176.42
28-Jun-13 to 30-Jun-14 5.24 10523.82 6.04 10603.56 8.81 10880.67 -2.47 9753.08
Since Inception 30-Dec-03 to 30-Jun-16 8.19 26777.00 N.A. N.A. 7.21 23879.95 5.31 19101.36
Since Inception 02-Jan-13 to 30-Jun-16 N.A. N.A. 8.58 13331.06 9.12 13564.57 7.22 12755.68
PRINCIPAL CASH MANAGEMENT FUND
Performance Scheme Returns Scheme’s Benchmark Additional BenchmarkPlan - Regular Plan - Direct (CRISIL Liquid Fund Index) (CRISIL 1 Year T-Bill Index)
Date ^Returns (%) $PTP Returns (`) ^Returns (%) $PTP Returns (`) ^Returns (%) $PTP Returns (`) ^Returns (%) $PTP Returns (`)
30-Jun-15 to 30-Jun-16 8.13 10813.45 8.21 10821.03 7.90 10789.98 7.67 10767.10
30-Jun-14 to 30-Jun-15 8.89 10889.16 8.97 10896.78 8.77 10876.94 8.54 10854.46
28-Jun-13 to 30-Jun-14 9.44 10944.30 9.55 10955.17 9.68 10968.20 5.93 10592.80
Since Inception 30-Aug-04 to 30-Jun-16 7.67 24000.84 N.A. N.A. 7.17 22716.29 6.04 20020.85
Since Inception 01-Jan-13 to 30-Jun-16 N.A. N.A. 8.89 13468.98 8.70 13388.26 7.50 12875.39
PRINCIPAL RETAIL MONEY MANAGER FUND
Performance Scheme Returns Scheme’s Benchmark Additional BenchmarkPlan - Regular Plan - Direct (CRISIL Liquid Fund Index) (CRISIL 1 Year T-Bill Index)
Date ^Returns (%) $PTP Returns (`) ^Returns (%) $PTP Returns (`) ^Returns (%) $PTP Returns (`) ^Returns (%) $PTP Returns (`)
30-Jun-15 to 30-Jun-16 8.46 10846.19 8.54 10853.82 7.90 10789.98 7.67 10767.10
30-Jun-14 to 30-Jun-15 9.24 10924.22 9.33 10933.34 8.77 10876.94 8.54 10854.46
28-Jun-13 to 30-Jun-14 9.96 10996.28 10.07 11007.34 9.68 10968.20 5.93 10592.80
Since Inception 28-Dec-07 to 30-Jun-16 6.80 17507.16 N.A. N.A. 7.70 18804.82 6.47 17058.08
Since Inception 01-Jan-13 to 30-Jun-16 N.A. N.A. 9.32 13655.03 8.70 13388.26 7.50 12875.39
Past performance may or may not be sustained in future. Since Inception Returns (in %) are calculated on Compounded Annualised Basis.$ PTP (Point to Point) Returns is based on standard investment of ` 10,000/- made at the beginning of relevant period.Performance of the dividend option for the investors would be net of dividend distribution tax, as applicable.^ Growth Option
SCHEMES MANAGED BY MR. PANKAJ JAIN
PRINCIPAL LOW DURATION FUND
Performance Scheme Returns Scheme’s Benchmark Additional BenchmarkPlan - Regular Plan - Direct (CRISIL Liquid Fund Index) (CRISIL 1 Year T-Bill Index)
Date ^Returns (%) $PTP Returns (`) ^Returns (%) $PTP Returns (`) ^Returns (%) $PTP Returns (`) ^Returns (%) $PTP Returns (`)
30-Jun-15 to 30-Jun-16 8.41 10840.80 9.22 10922.48 7.90 10789.98 7.67 10767.10
30-Jun-14 to 30-Jun-15 8.35 10834.65 9.38 10937.70 8.77 10876.94 8.54 10854.46
28-Jun-13 to 30-Jun-14 8.78 10877.60 9.54 10953.55 9.68 10968.20 5.93 10592.80
Since Inception 14-Sep-04 to 30-Jun-16 7.82 24319.54 N.A. N.A. 7.19 22681.59 6.05 20004.41
Since Inception 02-Jan-13 to 30-Jun-16 N.A. N.A. 9.36 13670.74 8.71 13385.31 7.48 12864.03
PRINCIPAL BALANCED FUND
Performance Scheme Returns Scheme’s Benchmark Additional BenchmarkPlan - Regular Plan - Direct (Crisil Balanced Fund - Aggressive Index) (Nifty 50 Index)
Date ^Returns (%) $PTP Returns (`) ^Returns (%) $PTP Returns (`) ^Returns (%) $PTP Returns (`) ^Returns (%) $PTP Returns (`)
30-Jun-15 to 30-Jun-16 5.87 10586.60 6.68 10667.96 3.12 10311.87 -0.96 9903.51
30-Jun-14 to 30-Jun-15 11.44 11143.99 12.32 11232.28 10.58 11057.78 9.95 10994.76
28-Jun-13 to 30-Jun-14 37.63 13762.92 38.81 13881.32 21.01 12100.81 30.28 13028.23
Since Inception 14-Jan-00 to 30-Jun-16 10.71 53420.00 N.A. N.A. Not Available Not Available 10.41 51072.25
Since Inception 02-Jan-13 to 30-Jun-16 N.A. N.A. 14.13 15869.44 9.74 13834.78 9.72 13828.47
SCHEME MANAGED BY MR. P.V.K. MOHAN & BEKXY KURIAKOSE

INVEST KNOWHOW July 201634
Systematic Investment Plan (SIP) Returns (As on June 30, 2016)
Returns shown above are for Regular Plan - Growth option. Past performance may or may not be sustained in the future.
PRINCIPAL BALANCED FUND - GROWTH
Particulars Total Scheme’s Returns Scheme’s Benchmark Additional BenchmarkAmount (Crisil Balanced Fund - Aggressive Index) (Nifty 50 Index)Invested Returns Yield MarketValue Returns Yield* MarketValue Returns Yield* MarketValue
(in `̀̀̀̀) (%) (in `̀̀̀̀) (%) (in `̀̀̀̀) (%) (in `̀̀̀̀)1 Year SIP 120,000.00 13.39 128,476.61 9.37 125,964.62 8.84 125,632.34
3 Years SIP 360,000.00 13.51 440,106.07 9.06 412,549.07 8.04 406,398.94
5 Years SIP 600,000.00 14.6 864,391.56 10.18 774,900.02 10.19 775,086.96
7 Years SIP 840,000.00 12.21 1,297,233.93 9.15 1,163,295.15 8.89 1,152,291.47
10 Years SIP 1,200,000.00 11.38 2,167,371.49 9.19 1,930,164.39 9.01 1,912,085.04
Since Inception SIP 1,970,000.00 13.57 6,712,899.67 Not Available Not Available 13.13 6,431,121.61
Inception Date - January 14, 2000
SCHEME MANAGED BY MR. P.V.K. MOHAN & BEKXY KURIAKOSE
PRINCIPAL INDEX FUND - MIDCAP - GROWTH
Particulars Total Amount Scheme’s Returns Scheme’s Benchmark Additional BenchmarkInvested (Nifty Free Float Midcap 100 Index) (Nifty 50 Index)
(in `̀̀̀̀) Returns Yield (%) MarketValue (in `̀̀̀̀) Returns Yield* (%) MarketValue (in `̀̀̀̀) Returns Yield* (%) MarketValue (in `̀̀̀̀)
1 Year SIP 120,000.00 10.86 126,896.82 11.34 127,199.77 8.84 125,632.34
Since Inception SIP 250,000.00 9.29 275,544.68 9.53 276,241.96 2.63 257,148.16
Inception Date - May 12, 2014
PRINCIPAL INDEX FUND - NIFTY - GROWTH
Particulars Total Amount Scheme’s Returns Scheme’s Benchmark (Nifty 50 Index) Additional Benchmark (S&P BSE Sensex)Invested Returns Yield MarketValue Returns Yield* MarketValue Returns Yield* MarketValue
(in `̀̀̀̀) (%) (in `̀̀̀̀) (%) (in `̀̀̀̀) (%) (in `̀̀̀̀)
1 Year SIP 120,000.00 9.54 126,071.84 8.84 125,632.34 6.97 124,455.21
3 Years SIP 360,000.00 8.34 408,203.07 8.04 406,398.94 6.62 397,911.07
5 Years SIP 600,000.00 10.48 780,660.16 10.19 775,086.96 9.45 760,997.91
7 Years SIP 840,000.00 9.13 1,162,298.80 8.89 1,152,291.47 8.3 1,128,429.00
10 Years SIP 1,200,000.00 8.94 1,904,327.97 9.01 1,912,085.04 8.53 1,864,036.37
Since Inception SIP 2,030,000.00 12.23 6,317,593.43 12.96 6,792,461.71 13.09 6,877,101.38
Inception Date - July 27, 1999
SCHEMES MANAGED BY MR. RAJAT JAIN
PRINCIPAL EMERGING BLUECHIP FUND - GROWTH
Particulars Total Scheme’s Returns Scheme’s Benchmark Additional BenchmarkAmount (Nifty Free Float Midcap 100 Index) (Nifty 50 Index)Invested Returns Yield MarketValue Returns Yield* MarketValue Returns Yield* MarketValue
(in `̀̀̀̀) (%) (in `̀̀̀̀) (%) (in `̀̀̀̀) (%) (in `̀̀̀̀)
1 Year SIP 120,000.00 15.88 130,017.48 11.34 127,199.77 8.84 125,632.34
3 Years SIP 360,000.00 26.16 525,107.44 19.08 476,327.64 8.04 406,398.94
5 Years SIP 600,000.00 26.17 1,144,593.38 17.11 919,327.24 10.19 775,086.96
7 Years SIP 840,000.00 20.84 1,764,312.61 13.46 1,356,472.81 8.89 1,152,291.47
Since Inception SIP 910,000.00 22.6 2,190,197.19 14.89 1,621,046.77 9.99 1,339,505.11
Inception Date - November 12, 2008
SCHEMES MANAGED BY MR. DHIMANT SHAH
PRINCIPAL DIVIDEND YIELD FUND - GROWTH
Particulars Total Scheme’s Returns Scheme’s Benchmark Additional BenchmarkAmount (Nifty Dividend Opportunities 50 Index) (Nifty 50 Index)Invested Returns Yield MarketValue Returns Yield* MarketValue Returns Yield* MarketValue
(in `̀̀̀̀) (%) (in `̀̀̀̀) (%) (in `̀̀̀̀) (%) (in `̀̀̀̀)1 Year SIP 120,000.00 10.9 126,920.74 8.35 125,322.23 8.84 125,632.34
3 Years SIP 360,000.00 11.59 428,078.99 4.4 384,893.51 8.04 406,398.94
5 Years SIP 600,000.00 11.86 807,953.02 5.56 690,518.52 10.19 775,086.96
7 Years SIP 840,000.00 10.37 1,214,762.14 6.59 1,061,549.70 8.89 1,152,291.47
10 Years SIP 1,200,000.00 10.43 2,060,610.12 8.5 1,861,070.06 9.01 1,912,085.04
Since Inception SIP 1,400,000.00 10.21 2,613,720.67 Not Available Not Available 10.16 2,605,256.70
Inception Date - October 15, 2004
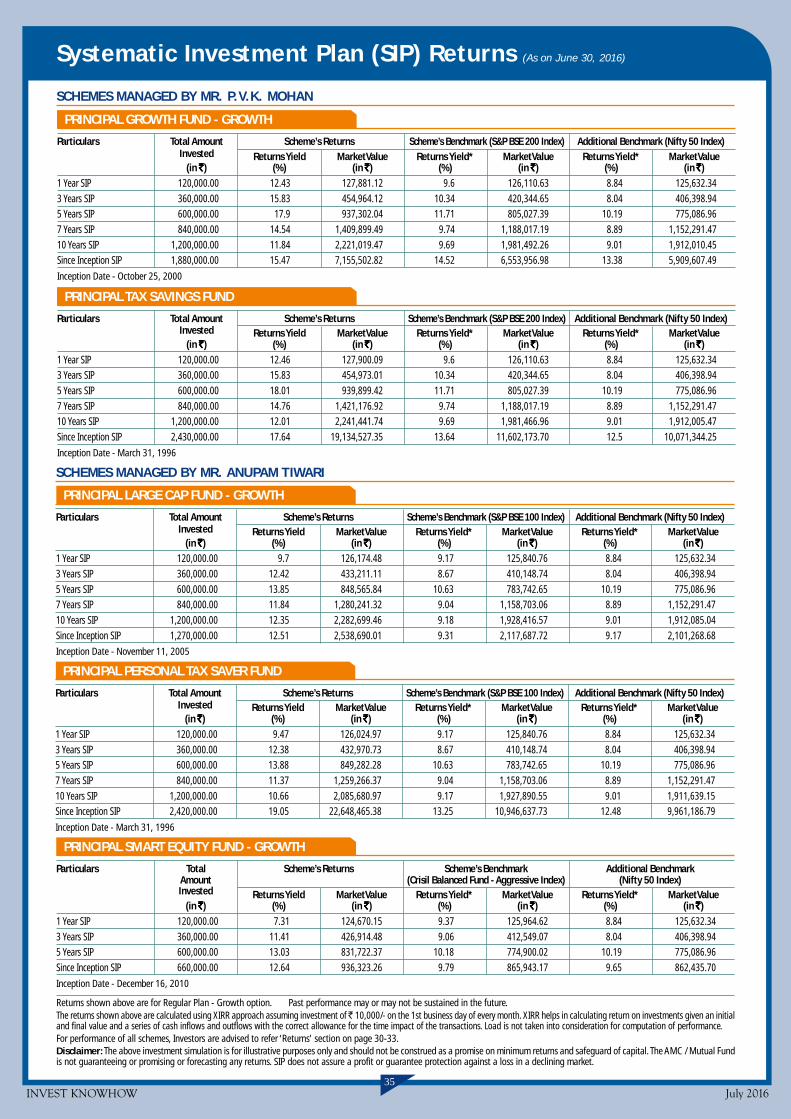
INVEST KNOWHOW July 201635
Systematic Investment Plan (SIP) Returns (As on June 30, 2016)
PRINCIPAL SMART EQUITY FUND - GROWTH
Particulars Total Scheme’s Returns Scheme’s Benchmark Additional BenchmarkAmount (Crisil Balanced Fund - Aggressive Index) (Nifty 50 Index)Invested Returns Yield MarketValue Returns Yield* MarketValue Returns Yield* MarketValue
(in `̀̀̀̀) (%) (in `̀̀̀̀) (%) (in `̀̀̀̀) (%) (in `̀̀̀̀)1 Year SIP 120,000.00 7.31 124,670.15 9.37 125,964.62 8.84 125,632.34
3 Years SIP 360,000.00 11.41 426,914.48 9.06 412,549.07 8.04 406,398.945 Years SIP 600,000.00 13.03 831,722.37 10.18 774,900.02 10.19 775,086.96
Since Inception SIP 660,000.00 12.64 936,323.26 9.79 865,943.17 9.65 862,435.70
Inception Date - December 16, 2010
Returns shown above are for Regular Plan - Growth option. Past performance may or may not be sustained in the future.The returns shown above are calculated using XIRR approach assuming investment of ̀ 10,000/- on the 1st business day of every month. XIRR helps in calculating return on investments given an initialand final value and a series of cash inflows and outflows with the correct allowance for the time impact of the transactions. Load is not taken into consideration for computation of performance.For performance of all schemes, Investors are advised to refer ‘Returns’ section on page 30-33.Disclaimer: The above investment simulation is for illustrative purposes only and should not be construed as a promise on minimum returns and safeguard of capital. The AMC / Mutual Fundis not guaranteeing or promising or forecasting any returns. SIP does not assure a profit or guarantee protection against a loss in a declining market.
PRINCIPAL GROWTH FUND - GROWTH
Particulars Total Amount Scheme’s Returns Scheme’s Benchmark (S&P BSE 200 Index) Additional Benchmark (Nifty 50 Index)Invested Returns Yield MarketValue Returns Yield* MarketValue Returns Yield* MarketValue
(in `̀̀̀̀) (%) (in `̀̀̀̀) (%) (in `̀̀̀̀) (%) (in `̀̀̀̀)1 Year SIP 120,000.00 12.43 127,881.12 9.6 126,110.63 8.84 125,632.34
3 Years SIP 360,000.00 15.83 454,964.12 10.34 420,344.65 8.04 406,398.945 Years SIP 600,000.00 17.9 937,302.04 11.71 805,027.39 10.19 775,086.96
7 Years SIP 840,000.00 14.54 1,409,899.49 9.74 1,188,017.19 8.89 1,152,291.47
10 Years SIP 1,200,000.00 11.84 2,221,019.47 9.69 1,981,492.26 9.01 1,912,010.45Since Inception SIP 1,880,000.00 15.47 7,155,502.82 14.52 6,553,956.98 13.38 5,909,607.49
Inception Date - October 25, 2000
SCHEMES MANAGED BY MR. P.V.K. MOHAN
PRINCIPAL TAX SAVINGS FUND
Particulars Total Amount Scheme’s Returns Scheme’s Benchmark (S&P BSE 200 Index) Additional Benchmark (Nifty 50 Index)Invested Returns Yield MarketValue Returns Yield* MarketValue Returns Yield* MarketValue
(in `̀̀̀̀) (%) (in `̀̀̀̀) (%) (in `̀̀̀̀) (%) (in `̀̀̀̀)1 Year SIP 120,000.00 12.46 127,900.09 9.6 126,110.63 8.84 125,632.343 Years SIP 360,000.00 15.83 454,973.01 10.34 420,344.65 8.04 406,398.94
5 Years SIP 600,000.00 18.01 939,899.42 11.71 805,027.39 10.19 775,086.96
7 Years SIP 840,000.00 14.76 1,421,176.92 9.74 1,188,017.19 8.89 1,152,291.4710 Years SIP 1,200,000.00 12.01 2,241,441.74 9.69 1,981,466.96 9.01 1,912,005.47
Since Inception SIP 2,430,000.00 17.64 19,134,527.35 13.64 11,602,173.70 12.5 10,071,344.25
Inception Date - March 31, 1996
SCHEMES MANAGED BY MR. ANUPAM TIWARI
PRINCIPAL LARGE CAP FUND - GROWTH
Particulars Total Amount Scheme’s Returns Scheme’s Benchmark (S&P BSE 100 Index) Additional Benchmark (Nifty 50 Index)Invested Returns Yield MarketValue Returns Yield* MarketValue Returns Yield* MarketValue
(in `̀̀̀̀) (%) (in `̀̀̀̀) (%) (in `̀̀̀̀) (%) (in `̀̀̀̀)1 Year SIP 120,000.00 9.7 126,174.48 9.17 125,840.76 8.84 125,632.34
3 Years SIP 360,000.00 12.42 433,211.11 8.67 410,148.74 8.04 406,398.94
5 Years SIP 600,000.00 13.85 848,565.84 10.63 783,742.65 10.19 775,086.967 Years SIP 840,000.00 11.84 1,280,241.32 9.04 1,158,703.06 8.89 1,152,291.47
10 Years SIP 1,200,000.00 12.35 2,282,699.46 9.18 1,928,416.57 9.01 1,912,085.04
Since Inception SIP 1,270,000.00 12.51 2,538,690.01 9.31 2,117,687.72 9.17 2,101,268.68
Inception Date - November 11, 2005
PRINCIPAL PERSONAL TAX SAVER FUND
Particulars Total Amount Scheme’s Returns Scheme’s Benchmark (S&P BSE 100 Index) Additional Benchmark (Nifty 50 Index)Invested Returns Yield MarketValue Returns Yield* MarketValue Returns Yield* MarketValue
(in `̀̀̀̀) (%) (in `̀̀̀̀) (%) (in `̀̀̀̀) (%) (in `̀̀̀̀)1 Year SIP 120,000.00 9.47 126,024.97 9.17 125,840.76 8.84 125,632.34
3 Years SIP 360,000.00 12.38 432,970.73 8.67 410,148.74 8.04 406,398.945 Years SIP 600,000.00 13.88 849,282.28 10.63 783,742.65 10.19 775,086.96
7 Years SIP 840,000.00 11.37 1,259,266.37 9.04 1,158,703.06 8.89 1,152,291.47
10 Years SIP 1,200,000.00 10.66 2,085,680.97 9.17 1,927,890.55 9.01 1,911,639.15Since Inception SIP 2,420,000.00 19.05 22,648,465.38 13.25 10,946,637.73 12.48 9,961,186.79
Inception Date - March 31, 1996

INVEST KNOWHOW July 201636
Short Term Capital Long Term Capital Dividend Tax on Distributed TDS onGains Tax (STCG) 2 & 14 Gains Tax (LTCG) 2 & 14 Income Income Capital Gains7
Financial Year 2015-16 2016-17 2015-16 2016-17 2015-16 2016-17 2015-16 2016-17 2015-16 2016-17
Resident Individual / 15% 15% Nil Nil Exempt Exempt Nil Nil Nil NilHUF / AOP / BOI
Resident 15% 15% Nil Nil Exempt Exempt Nil Nil Nil NilPartnership Firms
Domestic 15% 15% Nil Nil Exempt Exempt Nil Nil Nil NilCompanies
NRIs4 15% 15% Nil Nil Exempt Exempt Nil Nil STCG - 15%2 STCG - 15%2
LTCG - Nil LTCG - Nil
FPIs4 & 10 15% 15% Nil Nil Exempt Exempt Nil Nil STCG - Nil 6 STCG - Nil 6
LTCG - Nil 6 LTCG - Nil 6
Short Term Long Term Dividend Tax on Distributed Tax on Distributed TDS onCapital Gains Capital Gains Income Income - Other than Income - Liquid / Capital Gains7
Tax 2 & 13 Tax 2 & 13 Liquid / Money Money MarketMarket Schemes Schemes
2015-16 2016-17 2015-16 2016-17 2015-16 2016-17 2015-1611&12 2016-1711&12 2015-1611&12 2016-1711&12 2015-16 2016-17
Resident As per As per 20% 20% Exempt Exempt 25% 25% 25% 25% Nil NilIndividual / slab rates slab rates (With Indexation) (With Indexation)HUF
AOP/BOI As per As per 20% 20% Exempt Exempt 30% 30% 30% 30% Nil Nilslab rates slab rates (With Indexation) (With Indexation)
Domestic 30% 30% 20% 20% Exempt Exempt 30% 30% 30% 30% Nil NilCompanies / (With Indexation) (With Indexation)Firms
NRIs4 As per As per Listed Units - Listed Units - Exempt Exempt 25% 25% 25% 25% STCG - 30%2 STCG - 30%2
slab rates slab rates 20% 20% LTCG - 20%2 LTCG - 20%2
(with Indexation) (with Indexation) 5% for IDFs 5% for IDFs with indexation with indexationfor listed units. for listed units.
Unlisted Unlisted 10%2 10%2
Units - 10% Units - 10% without indexation without indexation(without Indexation)5 (without Indexation)5 for unlisted units5 for unlisted units5
FPI 4 & 10 30% 30% 10% 10% Exempt Exempt 30% 30% 30% 30% STCG - Nil6 STCG - Nil6without Indexation without Indexation LTCG - Nil6 LTCG - Nil6
5% for IDFs 5% for IDFs
EQUITY ORIENTED FUNDS (SUBJECT TO STT3)
OTHER THAN EQUITY ORIENTED FUNDS (including Infrastructure Debt Funds8)
(Contd. on next page)
Tax Rates for Mutual Fund Investors1
as per the Finance Act, 2016 – SNAPSHOT
1 It is assumed that the mutual fund units are held as capital assets by the investors.
2 Plus applicable surcharge [refer note 9], if any, and Education Cess at the rate of 2% on income-tax and surcharge and Secondary and Higher Education cess at the rate of 1% on income-tax and surcharge.
3 Securities Transaction Tax (‘STT’) is applicable only in respect of sale of units of Equity-Oriented Funds (‘EOFs’) on a recognised stock exchange and redemption of EOUs by the mutual fund. Purchase/ sale/ redemptionof units other than EOUs are not subject to STT.
4 Non-resident investors shall be entitled to be governed by provisions of the applicable Tax Treaty, which India has entered with the country of residence of the non-resident investor, if that is more beneficial than theprovisions of the Income-tax Act, 1961 (‘the Act’), subject to certain conditions. As per section 90(4) of the Act, a non-resident shall not be entitled to claim treaty benefits, unless the non-resident obtains a Tax ResidencyCertificate of being a resident of his home country. Furthermore, as per section 90(5) of the Act, non-resident is also required to provide such other documents and information, as prescribed by CBDT, as applicable.
5 As per section 112 of the Act, long-term capital gains in case of non-residents would be taxable @ 10% on transfer of capital assets, being unlisted securities, computed without giving effect to first & second provisoto section 48 i.e. without taking benefit of foreign currency fluctuation and indexation benefit.
6 Section 196D of the Act provides that no tax is required to be withheld for payment to a FII / FPI in respect of capital gains arising on transfer of units.
7 As per provisions of Section 206AA of the Act, if there is default on the part of a non-resident investor (entitled to receive redemption proceeds from the Mutual Fund on which tax is deductible under Chapter XVII ofthe Act) to provide its Permanent Account Number, the tax shall be deducted at higher of the following rates: i) rates specified in relevant provisions of the Act; or ii) rate or rates in force; or iii) rate of 20%.
8 “Infrastructure debt fund” means an infrastructure debt fund as defined in clause 1 of the regulation 49L of the Securities and Exchange Board of India (Mutual Fund) Regulations, 1996. As per clause 1 of regulation49L , an ‘infrastructure debt fund scheme’ would mean, a scheme which invests primarily (minimum 90% of scheme assets) in debt securities or securitized debt instrument of infrastructure companies or infrastructurecapital companies or infrastructure projects or special purpose vehicles, etc. or other permissible assets in accordance with these regulations or bank loans in respect of completed and revenue generating projects ofinfrastructure companies or projects or special purpose vehicles.
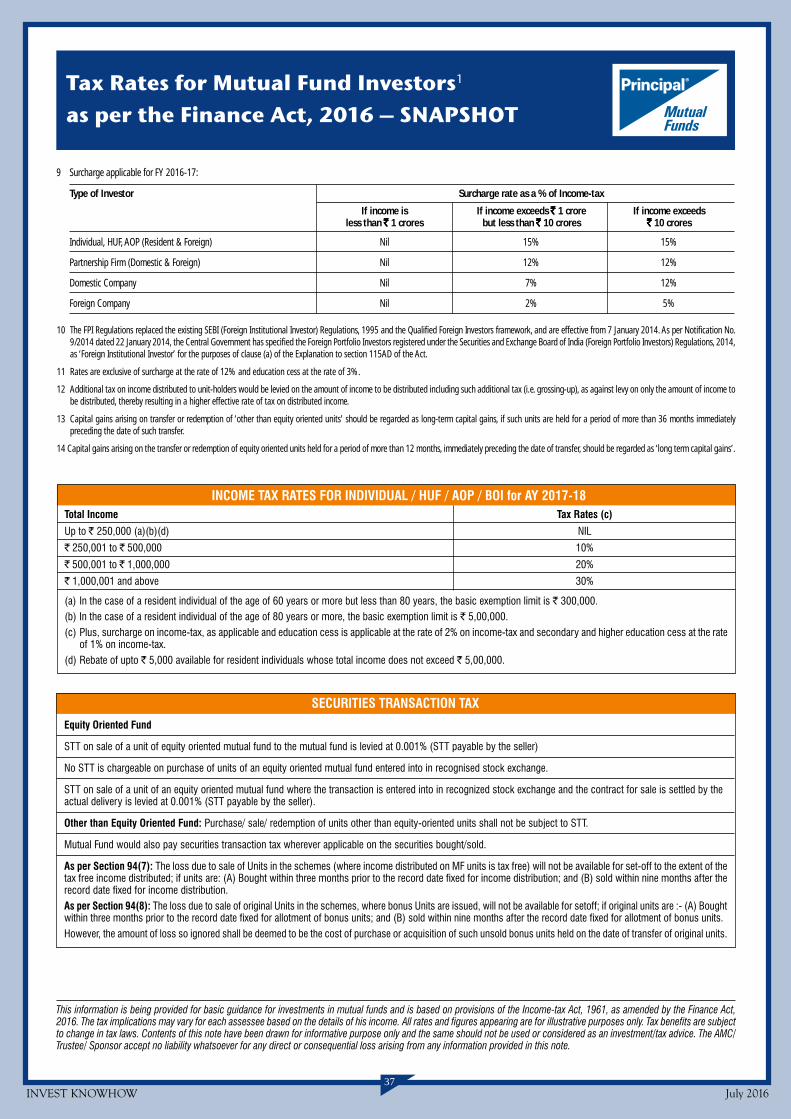
INVEST KNOWHOW July 201637
Tax Rates for Mutual Fund Investors1
as per the Finance Act, 2016 – SNAPSHOT
9 Surcharge applicable for FY 2016-17:
Type of Investor Surcharge rate as a % of Income-tax
If income is If income exceeds `̀̀̀̀ 1 crore If income exceedsless than `̀̀̀̀ 1 crores but less than `̀̀̀̀ 10 crores `̀̀̀̀ 10 crores
Individual, HUF, AOP (Resident & Foreign) Nil 15% 15%
Partnership Firm (Domestic & Foreign) Nil 12% 12%
Domestic Company Nil 7% 12%
Foreign Company Nil 2% 5%
10 The FPI Regulations replaced the existing SEBI (Foreign Institutional Investor) Regulations, 1995 and the Qualified Foreign Investors framework, and are effective from 7 January 2014. As per Notification No.9/2014 dated 22 January 2014, the Central Government has specified the Foreign Portfolio Investors registered under the Securities and Exchange Board of India (Foreign Portfolio Investors) Regulations, 2014,as ‘Foreign Institutional Investor’ for the purposes of clause (a) of the Explanation to section 115AD of the Act.
11 Rates are exclusive of surcharge at the rate of 12% and education cess at the rate of 3%.
12 Additional tax on income distributed to unit-holders would be levied on the amount of income to be distributed including such additional tax (i.e. grossing-up), as against levy on only the amount of income tobe distributed, thereby resulting in a higher effective rate of tax on distributed income.
13 Capital gains arising on transfer or redemption of ‘other than equity oriented units’ should be regarded as long-term capital gains, if such units are held for a period of more than 36 months immediatelypreceding the date of such transfer.
14 Capital gains arising on the transfer or redemption of equity oriented units held for a period of more than 12 months, immediately preceding the date of transfer, should be regarded as ‘long term capital gains’.
INCOME TAX RATES FOR INDIVIDUAL / HUF / AOP / BOI for AY 2017-18Total Income Tax Rates (c)
Up to ` 250,000 (a)(b)(d) NIL
` 250,001 to ` 500,000 10%
` 500,001 to ` 1,000,000 20%
` 1,000,001 and above 30%
(a) In the case of a resident individual of the age of 60 years or more but less than 80 years, the basic exemption limit is ` 300,000.(b) In the case of a resident individual of the age of 80 years or more, the basic exemption limit is ` 5,00,000.(c) Plus, surcharge on income-tax, as applicable and education cess is applicable at the rate of 2% on income-tax and secondary and higher education cess at the rate
of 1% on income-tax.(d) Rebate of upto ` 5,000 available for resident individuals whose total income does not exceed ` 5,00,000.
SECURITIES TRANSACTION TAX
Equity Oriented Fund
STT on sale of a unit of equity oriented mutual fund to the mutual fund is levied at 0.001% (STT payable by the seller)
No STT is chargeable on purchase of units of an equity oriented mutual fund entered into in recognised stock exchange.
STT on sale of a unit of an equity oriented mutual fund where the transaction is entered into in recognized stock exchange and the contract for sale is settled by theactual delivery is levied at 0.001% (STT payable by the seller).
Other than Equity Oriented Fund: Purchase/ sale/ redemption of units other than equity-oriented units shall not be subject to STT.
Mutual Fund would also pay securities transaction tax wherever applicable on the securities bought/sold.
As per Section 94(7): The loss due to sale of Units in the schemes (where income distributed on MF units is tax free) will not be available for set-off to the extent of thetax free income distributed; if units are: (A) Bought within three months prior to the record date fixed for income distribution; and (B) sold within nine months after therecord date fixed for income distribution.As per Section 94(8): The loss due to sale of original Units in the schemes, where bonus Units are issued, will not be available for setoff; if original units are :- (A) Boughtwithin three months prior to the record date fixed for allotment of bonus units; and (B) sold within nine months after the record date fixed for allotment of bonus units.However, the amount of loss so ignored shall be deemed to be the cost of purchase or acquisition of such unsold bonus units held on the date of transfer of original units.
This information is being provided for basic guidance for investments in mutual funds and is based on provisions of the Income-tax Act, 1961, as amended by the Finance Act,2016. The tax implications may vary for each assessee based on the details of his income. All rates and figures appearing are for illustrative purposes only. Tax benefits are subjectto change in tax laws. Contents of this note have been drawn for informative purpose only and the same should not be used or considered as an investment/tax advice. The AMC/Trustee/ Sponsor accept no liability whatsoever for any direct or consequential loss arising from any information provided in this note.

INVEST KNOWHOW July 201638
DISCLAIMER:Mutual Fund investments are subject to market risks, read all scheme related documents carefully.This factsheet is for informative purpose only and under no circumstances is to be used or considered as an investment advice. Terms of issue / load structure/Scheme specific risk factors are set forth in the Scheme Information Document(SID). Copy of the same is available at all our Investor Service Centres.Alternatively, Investor can download the SID from our website - www.principalindia.com or can call us at 1800 425 5600 to get a copy of the same.
++ ICRA has assigned credit risk rating of [ICRA]A1+mfs to Principal Low Duration Fund. The rating is the highest-credit-quality short-term rating assigned by ICRA to debt funds. Ratingmethodology used by ICRA is based on evaluating the inherent credit quality of the mutual funds portfolio. As a measure of the credit quality of a debt fund’s assets, ICRA uses the concept of “creditscores”, based on ICRA’s assessment of credit risk associated with each exposure of the portfolio taking into account its maturity. To quantify the credit risk scores, ICRA uses its database of historicaldefault rates for various rating categories for various maturity buckets. The credit risk ratings incorporate ICRA’s assessment of a debt fund's published investment objectives and policies, itsmanagement characteristics, and the creditworthiness of its investment portfolio. ICRA reviews relevant fund information on an ongoing basis to support its published rating opinions. If the portfoliocredit score meets the benchmark of the assigned rating during the review, the rating is retained. In an event that the benchmark credit score is breached, ICRA gives a month's time to the debt fundmanager to bring the portfolio credit score within the benchmark credit score. If the debt fund manager is able to reduce the portfolio credit score within the benchmark credit score, the rating isretained. If the portfolio still continues to breach the benchmark credit score, the rating is revised to reflect the change in credit quality. The ratings should, however, not be construed as an indicationof the prospective performance of the Mutual fund scheme or of volatility in its returns. ICRA ratings should not be treated as recommendation to buy, sell or hold the rated debt instruments.ICRA ratings are subject to a process of surveillance which may lead to a revision in ratings. Source: ICRA Ltd.
How to Read Factsheet
FUND MANAGER - An employee of the asset management company such as a mutual fund or life insurer, who manages investments ofthe scheme. He is usually part of a larger team of fund managers and research analysts.
APPLICATION AMOUNT FOR FRESH SUBSCRIPTION - This is the minimum investment amount for a new investor in a mutual fund scheme.
MINIMUM ADDITIONAL AMOUNT - This is the minimum investment amount for an existing investor in a mutual fund scheme.
YIELD TO MATURITY - The Yield to Maturity or the YTM is the rate of return anticipated on a bond if held until maturity. YTM isexpressed as an annual rate. The YTM factors in the bond's current market price, par value, coupon interest rate and time to maturity.
SIP - SIP or systematic investment plan works on the principle of making periodic investments of a fixed sum. It works similar to arecurring bank deposit. For instance, an investor may opt for an SlP that invests ` 500 every 15th of the month in an equity fund for aperiod of three years.
NAV - The NAV or the net asset value is the total asset value per unit of the mutual fund after deducting all related and permissibleexpenses. The NAV is calculated at the end of every business day. It is the value at which the investor enters or exits the mutual fund.
BENCHMARK - A group of securities, usually a market index, whose performance is used as a standard or benchmark to measureinvestment performance of mutual funds, among other investments. Some typical benchmarks include the Nifty, Sensex, BSE200,BSE500, 10-Year G-sec.
ENTRY LOAD - A mutual fund may have a sales charge or load at the time of entry and/or exit to compensate the distributor/agent.Entry load is charged at the time an investor purchases the units of a mutual fund. The entry load is added to the prevailing NAV at thetime of investment. For instance, if the NAV is ` 100 and the entry load is 1%, the investor will enter the fund at ` 101.
Note: SEBI, vide circular dated June 30, 2009 has abolished entry load and mandated that the upfront commission to distributors will be paid by theinvestor directly to the distributor, based on his assessment of various factors including the service rendered by the distributor.
EXIT LOAD - Exit load is charged at the time an investor redeems the units of a mutual fund. The exit load is deducted from the prevailingNAV at the time of redemption. For instance, if the NAV is ` 100 and the exit load is 1%, the redemption price would be ` 99 per unit.
MODIFIED DURATION - Modified duration is the price sensitivity and the percentage change in price for a unit change in yield.
STANDARD DEVIATION - Standard deviation is a statistical measure of the range of an investment’s performance. When a mutual fundhas a high standard deviation, its means its range of performance is wide, implying greater volatility.
SHARPE RATIO - The Sharpe Ratio, named after its founder, the Nobel Laureate William Sharpe, is a measure of risk-adjusted returns.It is calculated using standard deviation and excess return to determine reward per unit of risk.
BETA - Beta is a measure of an investment’s volatility vis-a-vis the market. Beta of less than 1 means that the security will be lessvolatile than the market. A beta of greater than 1 implies that the security's price will be more volatile than the market.
AUM - AUM or assets under management refers to the recent / updated cumulative market value of investments managed by a mutualfund or any investment firm.
HOLDINGS - The holdings or the portfolio is a mutual fund’s latest or updated reported statement of investments/securities. These areusually displayed in terms of percentage to net assets or the rupee value or both. The objective is to give investors an idea of wheretheir money is being invested by the fund manager.
NATURE OF SCHEME - The investment objective and underlying investments determine the nature of the mutual fund scheme. Forinstance, a mutual fund that aims at generating capital appreciation by investing in stock markets is an equity fund or growth fund.Likewise, a mutual fund that aims at capital preservation by investing in debt markets is a debt fund or income fund. Each of thesecategories may have sub-categories.
RATING PROFILE - Mutual funds invest in securities after evaluating their creditworthiness as disclosed by the ratings. A depiction of themutual fund in various investments based on their ratings becomes the rating profile of the fund. Typically, this is a feature of debt funds.
MAAUM - Monthly Average Asset Under Management

Centres of Karvy Computershare Private Limited (R&T to Principal Mutual Fund) which have been identified as Official Point of Acceptance:Agra: 1st Floor, Deepak Wasan Plaza, Behind Holiday Inn, Opp. Megdoot Furnitures, Sanjay Place, Agra-282 002 • Ahmedabad: 201/202 Shail, Opp. MadhusudanHouse, Navrangpura, Ahmedabad-380 006 • Ajmer: 302, 3rd Floor, Ajmer Auto Building, Opp. City Power House, Jaipur Road, Ajmer - 305 001 • Aligarh: 1stFloor, Kumar Plaza, Aligarh-202 001 • Allahabad: RSA Towers, 2nd Floor, Above Sony TV Showroom, 57, S.P. Marg, Civil Lines, Allahabad-211 001• Amritsar: 72-A, Taylor's Road, Opp. Aga Heritage Club, Amritsar-143 001 • Anand: B-42 Vaibhav Commercial Center, Nr TVS Down Town Show Room, GridChar Rasta, Anand-380 001 • Asansol: 114/71, G.T. Road, Near Sony Centre, Bhanga Pachil, Asansol-713 303 • Aurangabad: Ramkunj Niwas, Railway StationRoad, Near Osmanpura Circle, Aurangabad-431 005 • Bangalore: 59, Skanda Puttanna Road, Basavanagudi, Bangalore-560 004 • Bankura: Ambika MarketComplex, Gr. Floor, Nutanganj, Post & Dist Bankura, Bankura-722 101 • Bareilly: 1st Floor, 165, Civil Lines, Opp. Hotel Bareilly Palace, Near Railway Station,Bareilly-243 001 • Belgaum: CTS No. 3939/ A2 A1, Above Raymonds Show Room, Beside Harsha Appliances, Club Road, Belgaum-590 001 • Bharuch: ShopNo. 147-148, Aditya Complex, Near Kasak Circle, Bharuch-392 001 • Bhatinda: #2047-A 2nd Floor, The Mall Road, Above Max New York Life Insurance, NewDelhi-151 001 • Bhavnagar: Krushna Darshan Complex, Parimal Chowk, Office No. 306-307, 3rd Floor, Above Jed Blue Show Room, Bhavnagar 364 002• Bhilai: Shop No. 1, First Floor, Plot No.1, Commercial Complex, Nehru Nagar (East), Bhilai-490 020 • Bhopal: Kay Kay Business Centre, 133, Zone I, M.P.Nagar, Above City Bank, Bhopal-462 011 • Bhubaneshwar: A/181 , Back Side of Shivam Honda Show Room, Saheed Nagar, Bhubaneswar-751 007 • Bikaner:70-71, 2nd Floor, Dr. Chahar Building, Panchsati Circle, Sadul Ganj, Bikaner-334 001 • Bokaro: B-1, 1st Floor, City Centre, Sector-4, Near Sona Chandi Jwellars,Bokaro-827 004 • Burdwan: 63 G.T. Road, Halder Complex 1st Floor, Burdwan-713 101 • Calicut: 2nd Floor, Soubhagya Shopping Complex, Arayidathpalam,Mavoor Road, Calicut-673 004 • Chandigarh: SCO 2423-2424, Sector 22-C, Chandigarh-160 022 • Chennai: F-11, Akshaya Plaza, 1st Floor, 108, AdhithanarSalai, Egmore, Opp. Chief Metropolitan Court, Chennai-600 002 • Cochin: Ali Arcade, 1st Floor, Kizhavana Road, Panampilly Nagar, Near Atlantis Junction,Ernakualm-682 036 • Coimbatore: 3rd Floor, Jaya Enclave, 1056/1057 Avinashi Road, Coimbatore-641 018 • Cuttack: P.O. - Buxi Bazar, Cuttack, Opp. DarghaBazar, Dargha Bazar, Cuttack-753 001 • Dehradun: Kaulagarh Road, Near Sirmaur Margabove, Reliance Webworld, Dehradun-248 001 • Dhanbad: 208 NewMarket, 2nd Floor, Bank More, Dhanbad-826 001 • Durgapur: Mwav-16 Bengal Ambuja, 2nd Floor, City Centre, 16 Dt Burdwan, Durgapur-713 216• Erode: No. 4, Veerappan Traders Complex, KMY Salai, Sathy Road, Opp. Erode Bus Stand, Erode-638 003 • Faridabad: A-2B, 1st Floor, Nehru Groundnit,Faridabad-121 001 • Ghaziabad: 1st Floor, C-7, Lohia Nagar, Ghaziabad-201 001 • Goa: Flat No. 1-A, H. No. 13/70, Timotio Bldg. Heliodoro Salgado Road,Next to Navhind Bhavan (Market Area), Panaji, Goa - 403 001 • Gorakhpur: Above V.I.P. Houseajdacent, A.D. Girls College, Bank Road, Gorakpur-273 001• Gurgaon: Shop No.18, Gr. Floor, Sector-14, Opp. AKD Tower, Near Huda Office, Gurgaon-122 001 • Guwahati: 1st Floor, Bajrangbali Building, Near BoraService Station, G.S. Road, Guwahati - 781 007 • Gwalior: 2nd Floor, Rajeev Plaza, Jayendra Ganj, Lashkar, Gwalior. M.P.-474 009 • Hubli: CTC No. 483 / A1-A2,Gr. Floor, Shri Ram Plaza, Behind Kotak Mahindra Bank, Club Road, Hubli - 580 029. • Hyderabad: KARVY CENTRE, 8-2-609/K, Avenue 4, Street No. 1, BanjaraHills, Hyderabad - 500 034. • KARVY SELENIUM, Plot No. 31 & 32, Tower B, Survey No. 115 /22, 115/24 &115/25, Financial District, Gachibowli, Nanakramguda,Serlingampally Mandal, Ranga Reddy District, Hyderabad - 500 032 • Indore: 2nd Floor, 203-205, Balaji Corporates, Above ICICI Bank, 19/1 New Palasia,Indore-452 001 • Jabalpur: Grover Chamber, 43 Naya Bazar Malviya Chowk, Opp. Shyam Market, Jabalpur-482 002 • Jaipur: S-16/A 3rd Floor, Land MarkBuilding, Opp. Jai Club, Mahaver Marg C-Scheme, Jaipur-302 001 • Jalandhar: 1st Floor, Shanti Towers, SCO No. 37, PUDA Complex, Opp. Tehsil Complex,Jalandhar-144 001 • Jalgaon: 269 Jaee Vishwa, 1st Floor, Above United Bank of India, Baliram Peth, Near Kishor Agencies, Jalgaon - 425 001• Jammu: 5 A/D Extension 2, Near Panama Chowk Petrol Pump, Panama Chowk, Jammu-180 012 • Jamnagar: 136-138, Madhav Palaza, Opp. SBI Bank, NearLal Bunglow, Jamnagar-361 001 • Jamshedpur: 2nd Floor, R.R. Square, SB Shop Area, Near Reliance Foot Print & Hotel, BS Park Plaza, Main Road, Bistupur,Jamshedpur-831 001 • Jodhpur: 203, Modi Arcade, Chopasni Road, Jodhpur-342 001 • Junagadh: 124-125 Punit Shopping Center, M.G. Road, RanavavChowk, Junagadh-362 001 • Kanpur: 15/46, B, Gr. Floor, Opp. Muir Mills, Civil Lines, Kanpur-208 001 • Karnal: 18/369, Char Chaman, Kunjpura Road, BehindMiglani Hospital, Karnal-132 001 • Kolhapur: 605/1/4, E Ward, Shahupuri 2nd Lane, Laxmi Niwas, Near Sultane Chambers, Kolhapur-416 001 • Kolkata: 166A, Rashbihari Avenue, 2nd Floor, Opp. Fortish Hospital, Kolkata-700 029 • Kota: 29, 1st Floor, Near Lala Lajpat Rai Circle, Shopping Centre, Kota-324 007• Kottayam: 1st Floor Csiascension Square, Railway Station Road, Collectorate P. O., Kottayam-686 002 • Lucknow: 1st Floor, A. A. Complex, Thaper House, 5Park Road, Hazratganj, Lucknow - 226 001 • Ludhiana: SCO-136, 1st Floor, Above Air tel Showroom, Feroze Gandhi Market, Ludhiana-141 001• Madurai: Rakesh Towers, 30-C, 1st Floor, Bye Pass Road, Opp. Nagappa Motors, Madurai-625 010 • Malda: Sahis Tuli, Under Ward No.6, No.1 Govt Colony,English Bazar Municipality, Malda-732 101 • Mangalore: Mahendra Arcade, Opp. Court Road, Karangal Padi, Mangalore-575 003 • Meerut: 1st Floor, MediCentre, Opp. ICICI Bank, Hapur Road, Near Bachha Park, Meerut-250 002 • Mehsana: Ul-47, Apollo Enclave, Opp. Simandhar Temple, Modhera Cross Road,Mehsana-384 002 • Moradabad: Om Arcade, Parker Road, Above Syndicate Bank, Chowk Tari Khana, Moradabad-244 001 • Mumbai: 24/B, Raja BahadurCompound, Ambalal Doshi Marg, Behind BSE Bldg., Fort, Mumbai-400 001 • Mumbai - Borivali: Gr. Floor, Himanshu Bldg., Sodawala Lane, Lina ChandawarkarRoad, Borivali, Mumbai-400 091 • Mumbai - Thane: 101, Yashwant Building, Ram Ganesh, Godkari Path, Ram Maruti Road, Naupada, Thane-400 602• Mumbai - Vashi: Shop No. 43-A, Ground Floor, Vashi Plaza Sector-17, Near Apna Bazar, Vashi-400 705 • Muzaffarpur: 1st Floor, Uma Market, ThanaGumtimoti Jheel, Muzaffarpur-842 001 • Mysore: L-350, Silver Tower, Ashoka Road, Opp. Clock Tower, Mysore-570 001 • Nadiad: 104/105, Near ParasCinema, City Point Nadiad, Nadiad-387 001 • Nagpur: Plot No. 2/1, House No 102/1, Mangaldeep Appartment, Mata Mandir Road, Opp. Khandelwal Jewelers,Dharampeth, Nagpur-440 010 • Nasik: S-12,Suyojit Sankul, Sharanpur Road, Near Rajiv Gandhi Bhavan, Nasik-422 002 • Navsari: 1/1 Chinmay Aracade, Opp.Sattapir Road, Tower Road, Navsari-396 445 • New Delhi: 305, New Delhi House, 27, Barakhamba Road, New Delhi -110 001 • Noida: 405, 4th Floor, VishalChamber, Plot No. 1, Sector-18, Noida - 201 301 • Panipat: 1st Floor, Java Complex, Above Vijaya Bank, G.T. Road, Panipat-132103 • Patiala: SCO-27 D, ChottiBaradari, Near Car Bazaar, Patiala-147 001 • Patna: 3-A, 3rd Floor, Anand Tower, Exhibition Road, Opp. ICICI Bank, Patna-800 001 • Pondicherry: No. 7,Thiayagaraja Street, Pondicherry-605 001 • Pune: Mozaic Bldg, CTS No.1216/1, Final Plot No. 576/1 TP, Scheme No.1, F. C. Road, Bhamburda, Shivaji Nagar,Pune - 411 004 • Raipur: Shop No. 31 Third Floor, Millenium Plaza Above Indian House, Behind Indian Coffee House, Raipur 492 001 • Rajkot: 104, SiddhiVinyak Complex, Opp. Ramkrishna Ashram, Dr. Yagnik Road, Rajkot, Rajkot-360 001 • Ranchi: Room No. 307, 3rd Floor, Commerce Tower, Beside MahabirTower, Ranchi-834 001 • Rourkela: 1st Floor, Sandhu Complex, Kachery Road, Uditnagar, Rourekla-769 012 • Salem: No. 40, 2nd Floor, Brindavan Road,Fairlands, Near Perumal Koil, Salem-636 016 • Shillong: Annex Mani Bhawan, Lower Thana Road, Near R K M Lp School, Shillong-793 001 • Shimla: TriveniBuilding, By Pas Chowkkhallini, Shimla-171 002 • Siliguri: Nanak Complex, Sevoke Road, Siliguri-734 001 • Surat: G-5, Empire State Buliding, Near UdhnaDarwaja, Ring Road, Surat-395 002 • Tirunelveli: 55/18, Jeney Building, S.N. Road, Near Aravind Eye Hospital, Tirunelveli-627 001 • Trichur: 2nd Floor,Brothers Complex, Naikkanal Junction, Shornur Road Near Dhanalakshmi Bank H O, Thrissur-680 001 • Trichy: 60, Sri Krishna Arcade, Thennur High Road,Trichy-620 017 • Trivandrum: 2nd Floor, Akshaya Tower, Sasthamangalam, Trivandrum-695 010 • Udaipur: 201-202, Madhav Chambers, Opp. GPO, ChetakCircle, Udaipur-313 001 • Vadodara: 203, Corner point, Jetalpur Road, Vadodara - 390 007 • Valsad: Shop No. 2 , Phiroza Corner, Opp. Next Show Room, TithalRoad, Valsad-396 001 • Vapi: Shop No. 12, Ground Floor, Sheetal Appatment, Near K.P. Tower, Vapi-396 195 • Varanasi: D-64/132, 1st Floor, Anant Complex,Sigra, Varanashi-221 010 • Vellore: No. 1, M. N. R. Arcade, Officers Line, Krishna Nagar, Vellore-632 001 • Vijayawada: 39-10-7, Opp. Municipal Water Tank,Labbipet, Vijayawada-520 010 • Visakhapatnam: Door No: 48-8-7, Dwaraka Dimond, Gr. Floor, Srinagar, Visakhapatnam - 530 016 • Warangal: 5-6-95,1st Floor, Opp. B.Ed Collage, Lashkar Bazar, Chandra Complex, Hanmakonda, Warangal-506 001.

Name, Address and Website of Registrar:Karvy Computershare Pvt. Ltd. (Unit: Principal Mutual Fund),
Karvy Registry House, #8-2-596, Avenue 4, Street No. 1, Banjara hills, Hyderabad-500 034. Website: www.karvycomputershare.com
For any enquiries and / or queries, investors are advised to address a suitable communication to AMC at:
Points of Service (“POS”) of MF UTILITIES INDIA PRIVATE LIMITED (“MFUI”) as Official Point of Acceptance:
The Online Transaction Portal of MF Utility is www.mfuonline.com and the list of POS of MFUI is published on the website of MFUI at www.mfuindia.com,as updated from time to time.
Offices of AMC Identified as Official Point of Acceptance (OPA) / Investor Service Centres (ISC)
Principal Pnb Asset Management Company Private Limited - OPA & ISC:
• Mumbai: Exchange Plaza, ‘B’ wing, Ground Floor, NSE Building, Bandra Kurla Complex, Bandra (East), Mumbai-400 051
Principal Pnb Asset Management Company Private Limited - ISC:
• Ahmedabad: 101-104, GCP Business Centre, Opp. Memnagar Fire Station, Vijay Cross Road, Ahmedabad-380 014
• Bengaluru: Level 1, Tower B, The Millenia, 1 & 2 Murphy Road, Ulsoor, Bengaluru-560 008
• Chandigarh: Office No. 435, Level 4, Tower-A, Godrej Eternia, Plot No. 70, Industrial Area 1, Chandigarh-160 002
• Chennai: “Amara Sri”, Old No. 313, New No. 455, Block No. 75, 7th Floor, Anna Salai, Teynampet, Chennai-600 018
• Hyderabad: Office No. 314, 3rd Floor, Belvedere, Raj Bhavan Road, Somajiguda, Hyderabad-500 082
• Jaipur: Office No. 445, 4th Floor, Ganpati Plaza, M. I. Road, Jaipur-302 005
• Kolkata: The Legacy, 1st Floor, 25-A, Shakespeare Sarani, Kolkata-700 016
• Lucknow: 4th Floor, Halwasiya Court, Mahatma Gandhi Marg, Hazratganj, Lucknow-226 001
• New Delhi: A-121, 12th Floor, Himalaya House, 23 K. G. Marg, New Delhi-110 001.
• Pune: The Senate Business Center, 100ft Riverside, D.P. Road, Vartak Baug, Erandwane, Pune-411 052.