Factsheet 13 2 environmental product declaration epd for pu pur pir in situ foam and energy saving p
7
1 PU EUROPE excellence in insulation - Factsheet n° 13/2 (June 2014) Factsheet n° 13/2 Environmental product declaraon (EPD) for PU (PUR/PIR) in-situ foam (spray foam) and energy saving potenal 1. Executive Summary EPDs for construction products are a widely recognised and increasingly used tool to assess the environmental performance of buildings. The PU industry fully embraces the concept of EPD-based life cycle assessments of buildings and is committed to providing transparent and accurate data. This factsheet summarises third-party verified data for different types of PU (PUR/PIR) in-situ foam (spray foam) for thermal insulation from cradle-to-gate and, alternatively, from cradle-to-gate with energy recovery as end-of-life scenario. The data now include the updated ecoprofile for MDI, the most important PU precursor. This leads to a significantly improved environmental performance compared to the 2010 version. LCA studies will show that the most important life cycle stage of insulation products is by far the use phase. Over its useful life, PU spray foam for thermal insulation can save over 100 times more energy than was used to make it. Table of contents: 1. Executive summary ......................................................................................................... 1 2. What is an Environmental Product Declaration? ................................................................... 2 3. PU Europe calculation tool ................................................................................................ 2 4. Updated EPDs for PU spray foam for thermal insulation ........................................................ 3 5. Average European cradle-to-gate EPDs for PU spray foam for thermal insulation ...................... 4 6. The importance of the functional or reference units .............................................................. 5 7. Use-phase modelling: calculating energy savings ................................................................. 6 8. Disclaimer ...................................................................................................................... 7 9. References ..................................................................................................................... 7 ***
-
Upload
excellence-in-insulation -
Category
Documents
-
view
234 -
download
0
description
http://www.excellence-in-insulation.eu/site/fileadmin/user_upload/PDF/library/facts/Factsheet_13-2_Environmental_product_declaration__EPD__for_PU__PUR_PIR__in-situ_foam_and_energy_saving_potential__Dec14_.pdf
Transcript of Factsheet 13 2 environmental product declaration epd for pu pur pir in situ foam and energy saving p
1 PU EUROPE excellence in insulation - Factsheet n° 13/2 (June 2014)
Factsheet n° 13/2
Environmental product declaration (EPD) for PU (PUR/PIR) in-situ foam (spray foam) and energy saving potential
1. Executive Summary
EPDs for construction products are a widely recognised and increasingly used tool to assess the environmental performance of buildings. The PU industry fully embraces the concept of EPD-based life cycle assessments of buildings and is committed to providing transparent and accurate data.
This factsheet summarises third-party verified data for different types of PU (PUR/PIR) in-situ foam (spray foam) for thermal insulation from cradle-to-gate and, alternatively, from cradle-to-gate with energy recovery as end-of-life scenario.
The data now include the updated ecoprofile for MDI, the most important PU precursor. This leads to a significantly improved environmental performance compared to the 2010 version.
LCA studies will show that the most important life cycle stage of insulation products is by far the use phase. Over its useful life, PU spray foam for thermal insulation can save over 100 times more energy than was used to make it.
Table of contents:
1. Executive summary .........................................................................................................1
2. What is an Environmental Product Declaration? ...................................................................2
3. PU Europe calculation tool ................................................................................................2
4. Updated EPDs for PU spray foam for thermal insulation ........................................................3
5. Average European cradle-to-gate EPDs for PU spray foam for thermal insulation ......................4
6. The importance of the functional or reference units ..............................................................5
7. Use-phase modelling: calculating energy savings .................................................................6
8. Disclaimer ......................................................................................................................7
9. References .....................................................................................................................7
***

PU EUROPE excellence in insulation - Factsheet n° 13/2 2
Factsheet n° 13/2
What is PU?
PU insulation stands for a group of insulation materials based on PUR (polyurethane) or PIR (polyisocyanurate). PU in-situ foam (spray foam) has a high cross-linking density resulting in good heat stability, high compressive strength and excellent insulation properties.
Closed-cell in-situ foam has a very low thermal conductivity of 0.026-0.028 W/mK. The thermal conductivity of open-cell foam ranges from 0.035-0.042 W/mK. [1]
2. What is an Environmental Product Declaration?
An environmental product declaration (EPD) is a communication tool that provides quantified environmental information for a product, process or service on a harmonised and scientific basis covering the entire lifetime or parts of it. EPDs are not providing an evaluation of the environmental performance but are a comprehensive and transparent set of environmental information for a predefined set of life cycle stages. An important advantage of using EPDs is the possibility to add LCA-based information in the supply chain. This feature makes EPDs particularly valuable for the building sector where the final building is based on a large number of materials, construction products, semi-manufactured products and processes.
It must be made clear throughout the communication chain that EPDs cannot be compared with each other and only an assessment at the building (element) level, in a given end-use application, is relevant. Furthermore, LCA practitioners acknowledge as a rule of thumb that the error margins for primary energy use and global warming potential can be estimated at
around 10 %, whereas a 20 % error margin usually applies to all other impact categories. This means that any differences within these margins should be considered as insignificant.
3. PU Europe calculation tool
PU Europe [2] asked PE International to develop an updated, third-party verified EPD calculation programme based on EN 15804. This tool is able to produce generic cradle-to-gate EPDs for different types of PU thermal insulation products including PU in-situ foam. It is linked to the Gabi software tool and database. Details on the background information and model can be obtained from the PU Europe office.
A sensitivity analysis demonstrated that, apart from the blowing agent, modifications in the composition of the foam and the energy consumption of the foaming process have no significant impact on the EPD results and therefore industry average data can be recommended for use in building assessments.
It is unfortunate that the mutual recognition of EPDs between countries is far from achieved in the EU. This adds costs to industry, affects the credibility of the system and provides a justification for third parties to develop alternative schemes.
***
***
PU EUROPE excellence in insulation - Factsheet n° 13/2 3
Factsheet n° 13/2
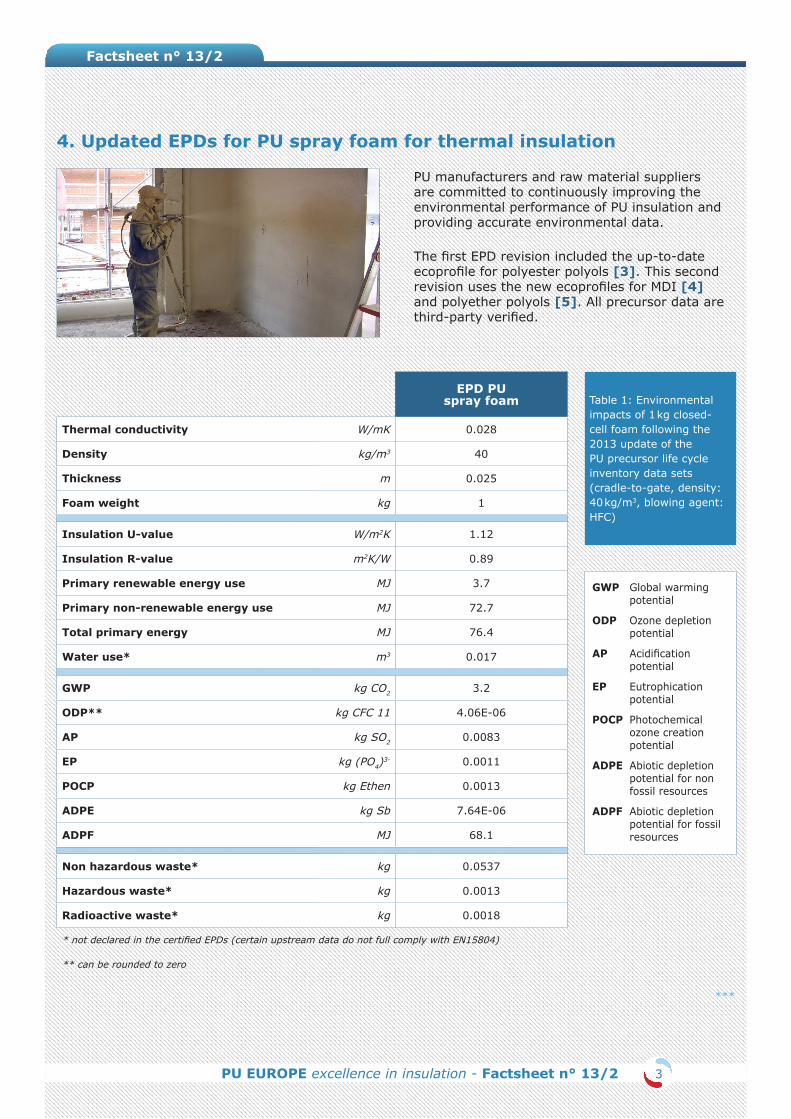
Table 1: Environmental impacts of 1 kg closed-cell foam following the 2013 update of the PU precursor life cycle inventory data sets (cradle-to-gate, density: 40 kg/m3, blowing agent: HFC)
EPD PU spray foam
Thermal conductivity W/mK 0.028
Density kg/m3 40
Thickness m 0.025
Foam weight kg 1
Insulation U-value W/m2K 1.12
Insulation R-value m2K/W 0.89
Primary renewable energy use MJ 3.7
Primary non-renewable energy use MJ 72.7
Total primary energy MJ 76.4
Water use* m3 0.017
GWP kg CO2 3.2
ODP** kg CFC 11 4.06E-06
AP kg SO2 0.0083
EP kg (PO4)3- 0.0011
POCP kg Ethen 0.0013
ADPE kg Sb 7.64E-06
ADPF MJ 68.1
Non hazardous waste* kg 0.0537
Hazardous waste* kg 0.0013
Radioactive waste* kg 0.0018
* not declared in the certified EPDs (certain upstream data do not full comply with EN15804)
** can be rounded to zero
GWP Global warming potential
ODP Ozone depletion potential
AP Acidification potential
EP Eutrophication potential
POCP Photochemical ozone creation potential
ADPE Abiotic depletion potential for non fossil resources
ADPF Abiotic depletion potential for fossil resources
4. Updated EPDs for PU spray foam for thermal insulation
PU manufacturers and raw material suppliers are committed to continuously improving the environmental performance of PU insulation and providing accurate environmental data.
The first EPD revision included the up-to-date ecoprofile for polyester polyols [3]. This second revision uses the new ecoprofiles for MDI [4] and polyether polyols [5]. All precursor data are third-party verified.
***

PU EUROPE excellence in insulation - Factsheet n° 13/2 4
Factsheet n° 13/2
Table 2: Environmental impacts following two scenarios:
1. Cradle-to-gate: “Without”
2. Cradle-to-gate and end-of-life (energy recovery): “With”
Reference units: 1 kg/1 m2
and thermal resistance R = 1 m2K/W (density: 40 kg/m3, blowing agent HFC, closed-cell)
Spray foam 1 kg Spray foam R=1
Thermal conductivity W/mK 0.028 0.028
Density kg/m3 40 40
Thickness m 0.025 0.028
Foam weight kg 1 1.12
Insulation U-value W/m2K 1.12 1.00
Insulation R-value m2K/W 0.89 1.00
End-of-life energy recovery without with without with
Primary renewable energy use MJ 3.7 2.4 4.2 2.6
Primary non-renewable energy use MJ 72.7 52.0 81.4 58.1
Total primary energy MJ 76.4 54.4 85.6 60.7
Water use* m3 0.0170 1.3716 0.0191 1.5343
GWP kg CO2 3.2 4.7 3.6 5.2
ODP** kg CFC 11 4.06E-06 4.00E-06 4.55E-06 4.50E-06
AP kg SO2 0.0083 0.0071 0.0093 0.0080
EP kg (PO4)3- 0.0011 0.0012 0.0012 0.0020
POCP kg Ethen 0.0013 0.0011 0.0014 0.0012
ADPE kg Sb 7.64E-06 8.90E-06 8.56E-06 9.90E-06
ADPF MJ 68.1 50.4 76.3 56.4
Non hazardous waste* kg 0.0537 0.0967 0.0601 0.1082
Hazardous waste* kg 0.0013 0.0012 0.0014 0.0013
Radioactive waste* kg 0.0018 0.0006 0.0020 0.0006
* not declared in the certified EPDs (certain upstream data do not full comply with EN15804)
** can be rounded to zero
5. Average European cradle-to-gate EPDs for PU spray foam for thermal insulation
The choice of the blowing agent has tangible repercussions on several environmental impact indicators. Another important parameter to consider is the foam density which may vary significantly depending on the end-use application [6].
Hence, this factsheet provides several sets of EPDs: a set for the PU spray foam for two basic reference units: 1 kg foam and 1 m2 with a thermal resistance value of R=1 (density 40 kg/m3, blowing agent: HFC). In addition, a set of four EPDs for PU spray foam with a thermal resistance of R=5 and with different densities and blowing agents.
With a view to further increasing the value of our EPDs, this factsheet distinguishes between a cradle-to-gate scenario and a scenario covering cradle-to-gate and end-of-life (energy recovery). The inclusion of energy recovery in the EPD leads to a significantly lower total primary energy use (54.4 MJ instead of 76.4 MJ per kg of an HFC-blown foam with a density of 40 kg/m3, but increases the global warming potential from 3.2 kg CO2 to 4.7 kg CO2.

PU EUROPE excellence in insulation - Factsheet n° 13/2 5
Factsheet n° 13/2
HFCDensity 40
HFCDensity 50
HFCDensity 60
WaterDensity 12
R=5 R=5 R=5 R=5
Thermal conductivity W/mK 0.026 0.026 0.026 0.036
Density kg/m3 40 50 60 12
Thickness m 0.130 0.130 0.130 0.180
Foam weight kg 5.20 6.50 7.80 2.16
Insulation U-value W/m2K 0.20 0.20 0.20 0.20
Insulation R-value m2K/W 5 5 5 5
End-of-life energy recovery without with without with without with without with
Primary renewable energy use MJ 19.4 12.2 24.3 15.3 29.2 18.4 6.6 3.6
Primary non-renewable energy use MJ 378.0 269.9 473.0 338.5 567.0 405.2 146.0 101.2
Total primary energy MJ 397.4 282.1 497.3 353.8 596.2 423.6 152.6 104.8
Water use* m3 0.0885 7.2125 0.1110 8.9410 0.1330 10.7690 0.0478 3.0078
GWP kg CO216.6 24.4 20.7 30.5 24.9 36.7 6.48 9.7
ODP** kg CFC 11 2.11E-05 2.11E-05 2.64E-05 2.64E-05 3.17E-05 3.17E-05 8.74E-05 8.70E-05
AP kg SO20.0432 0.0369 0.0539 0.0461 0.0647 0.0554 0.0151 0.0125
EP kg (PO4)3- 0.0055 0.0064 0.0069 0.0080 0.0082 0.0096 0.0020 0.0024
POCP kg Ethen 0.0067 0.0055 0.0084 0.0069 0.0100 0.0082 0.0020 0.0015
ADPE kg Sb 3.97E-05 4.65E-05 4.97E-05 5.82E-05 5.96E-05 6.99E-05 1.80E-05 2.08E-05
ADPF MJ 354.0 261.2 443.0 327.7 531.0 392.3 138.0 99.6
Non hazardous waste* kg 0.2790 0.5023 0.3490 0.6288 0.4190 0.7543 0.1140 0.2068
Hazardous waste* kg 0.0065 0.0061 0.0082 0.0076 0.0098 0.0091 0.0035 0.0033
Radioactive waste* kg 0.0092 0.0029 0.0115 0.0036 0.0138 0.0043 0.0034 0.0007
* not declared in the certified EPDs (certain upstream data do not full comply with EN15804)
** can be rounded to zero
Table 3: Environmental impacts following two scenarios:
1. Cradle-to-gate: “Without”
2. Cradle-to-gate and end-of-life (energy recovery): “With”
Reference units: 1 m2 of PU spray foam with a thermal resistance of R=5 m2K/W, closed-cell
***
6. The importance of the functional or reference units
It is important to take into account the density and thickness of any insulation material used in a particular end-use application. These two parameters will determine the overall weight and quantity of a specific insulant required for that application as well as its related environmental impacts. Comparative assertion at the building or component levels must also consider the knock-on effects of material choices on the thickness and structural strength of building elements and the possible need to add ancillary materials to achieve comparable building (element) performance. For insulation products, there are two useful types of functional or reference units:
PU EUROPE excellence in insulation - Factsheet n° 13/2 6
Factsheet n° 13/2
For additional support as to how to use EPD data please contact PU Europe.
• Those based on the thermal resistance performance, e.g. 1 m2 of a wall element at a fixed R-value (or U-value). In this case, the use phase impacts related to energy consumption could be considered equivalent for the different solutions studied.
• Those based on the thickness of the insulant, e.g., 1 m2 of a wall element with 5 cm of insulation. This reference unit is especially relevant in renovation projects, where the difference in thermal resistance may result in different thermal performance levels of the building element and therefore different use phase energy consumption and related environmental impacts.
***
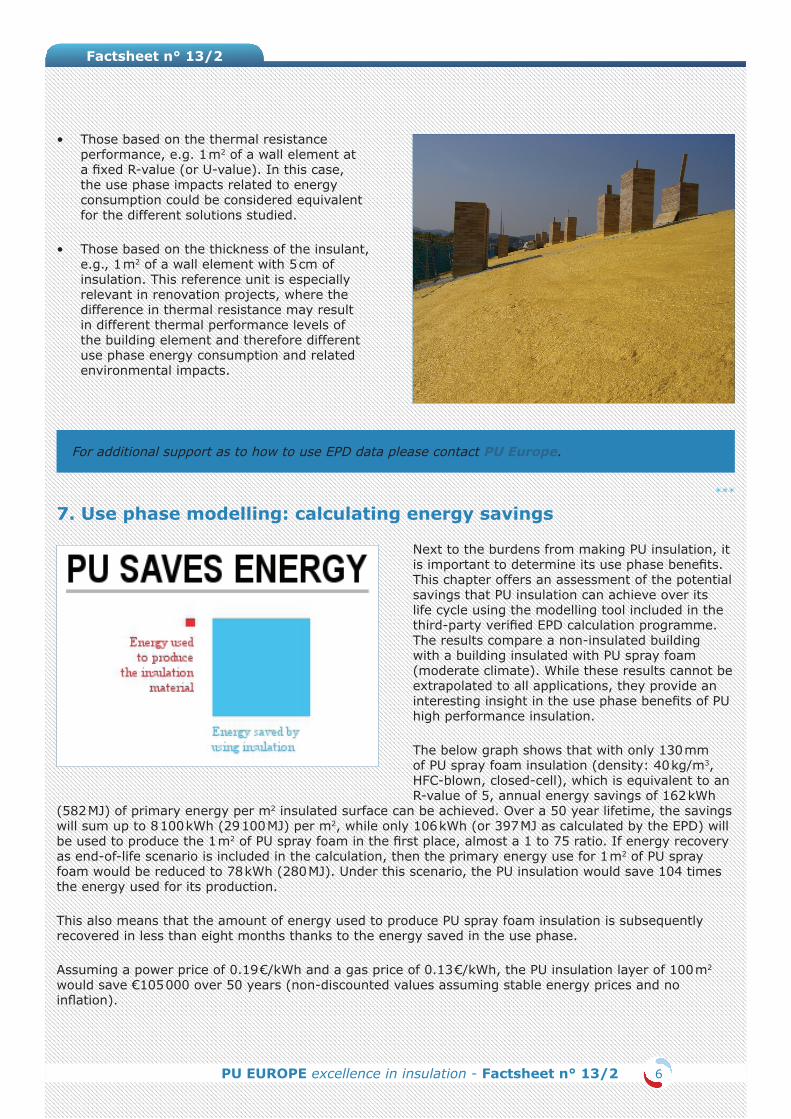
7. Use phase modelling: calculating energy savings
Next to the burdens from making PU insulation, it is important to determine its use phase benefits. This chapter offers an assessment of the potential savings that PU insulation can achieve over its life cycle using the modelling tool included in the third-party verified EPD calculation programme. The results compare a non-insulated building with a building insulated with PU spray foam (moderate climate). While these results cannot be extrapolated to all applications, they provide an interesting insight in the use phase benefits of PU high performance insulation.
The below graph shows that with only 130 mm of PU spray foam insulation (density: 40 kg/m3, HFC-blown, closed-cell), which is equivalent to an R-value of 5, annual energy savings of 162 kWh
(582 MJ) of primary energy per m2 insulated surface can be achieved. Over a 50 year lifetime, the savings will sum up to 8 100 kWh (29 100 MJ) per m2, while only 106 kWh (or 397 MJ as calculated by the EPD) will be used to produce the 1 m2 of PU spray foam in the first place, almost a 1 to 75 ratio. If energy recovery as end-of-life scenario is included in the calculation, then the primary energy use for 1 m2 of PU spray foam would be reduced to 78 kWh (280 MJ). Under this scenario, the PU insulation would save 104 times the energy used for its production.
This also means that the amount of energy used to produce PU spray foam insulation is subsequently recovered in less than eight months thanks to the energy saved in the use phase.
Assuming a power price of 0.19 €/kWh and a gas price of 0.13 €/kWh, the PU insulation layer of 100 m2 would save €105 000 over 50 years (non-discounted values assuming stable energy prices and no inflation).

PU EUROPE excellence in insulation - Factsheet n° 13/2 7
Factsheet n° 13/2
8. Disclaimer
While all the information and recommendations in this publication are to the best of our knowledge, information and belief accurate at the date of publication, nothing herein is to be construed as a warranty, express or otherwise.
***
9. References
[1] More about the differences between open- and closed-cell spray foam in the PU Europe factsheet 22: Closed- and Open-Cell Spray Polyurethane (PU) Foam (Differences between closed-cell and open-cell spray polyurethane (PU) foam)
[2] PU Europe is the European association of PU insulation manufacturers (www.pu-europe.eu)
[3] See PU Europe project: Eco-Profile of Aromatic Polyester Polyols (APP)
[4] See ISOPA Eco-profile MDI-TDI 2012-04
[5] See ISOPA Eco-profile Polyether Polyols 2012-04
[6] For more details see website www.excellence-in-insulation.eu
Assumptions
Degree days 3 700
Insulation thickness 130 mm
Insulation R-value 5 m2K/W
Insulation U-value 0.2 W/m2K
Boiler efficiency 0.88
Space heating source gas
Primary energy conversion efficiency 1.1
Primary heating energy demandQ (kWh) = (U x surface x degree hours) * primary energy conversion / boiler efficiency
***