FACTS ABOUT WOMEN AND MEN IN SLOVENIA - Stat · FACTS ABOUT WOMEN AND MEN IN SLOVENIA 1 ... of more...
53
Transcript of FACTS ABOUT WOMEN AND MEN IN SLOVENIA - Stat · FACTS ABOUT WOMEN AND MEN IN SLOVENIA 1 ... of more...


1FACTS ABOUT WOMEN AND MEN IN SLOVENIA
Mag. Irena Kri‘manDirector-General
Foreword
In this brochure we want to draw your attention to some noticeable differences andsimilarities between the data relating to women and the data relating to men.
Equality of women and men is a foundation of human dignity and democracy; it is thebasic principle of the European Community legislation, of constitutions and regulationsof EU Member States, and of international and European conventions.
We are encouraged to establish the actual state of equality of women and men from theresults of various surveys and analyses, especially in the last decade, which often indicatethat there (still) exists (concealed or even explicit) gender-based discrimination, primarilyto the detriment of women, which of course is not in accordance with the efforts of EU Mem-ber States and other European countries. Serious efforts to abolish gender-based discrimi-nation in all areas of work and life have been taking place for almost three decades.
It is important that all people have equal opportunities, regardless of their differences.The principle of non-discrimination is the basis for providing gender equality: equal rec-ognition and evaluation, roles, power, positions and the active involvement of both gen-ders in all areas of public and private life. This means that men and women need to haveequal opportunities not only when they contribute to social development, but also whenthey are to benefit from the results they achieve. These benefits should be divided asequally as possible.
Although the Constitution of the Republic of Slovenia and appropriate acts provide therights which ensure the equality of women and men, women and men in the Sloveniansociety today frequently have different roles and opportunities. So certain measures, al-though they are at first glance completely neutral, have different effect on genders and, inthe actual exercise of rights in practice, can put a woman or a man in an unequal or worseposition. Slovenia has the Office for Equal Opportunities, which makes efforts to reducethe gaps between legal discrimination and the actual equality of women and men in allareas of public and private life.
This brochure presents the position of one gender relative to the other gender in prac-tice on the basis of statistical data.
Indicators are the first step towards developing better policies for women and men; thenext step is to understand why certain changes have occurred (what has led to the changes),and only then can we ask ourselves what we can do in that area.
Integrating equal opportunities of women and men into a whole requires the equalparticipation of women and men at all social levels and their equal representation in theeconomy, in decision-making, in social and cultural life and, finally, in their everyday life.
Regardless of the society or culture, in today’s world the work of women and men is stillnot equally evaluated. Policy planning still does not take into account the specific needsof more than a half of the population (of course, women must not be treated as a specialpriority group), and that affects the private and public sphere and the service sector, aswell as employment, training and business. Growth, competitiveness and employment,security and the best possible health prevention and care are only some of the objectivesof the efforts for equal opportunities of women and men, which can be achieved only withthe cooperation of all citizens, both male and female.

2 FACTS ABOUT WOMEN AND MEN IN SLOVENIA
Published by the Statistical Office of the Republic of Slovenia, Ljubljana, Vo`arski pot 12 – Use and publica-tion of data is allowed provided the source is acknowledged – Responsible person: Director-General IrenaKri`man – Edited by Petronela Vertot - Revised by Marina Urbas – English language editing by Boris Pani~– Designed by Du{an Weiss and Ada Pokla~ – Translated by PSD
CIP - Katalo`ni zapis o publikacijiNarodna in univerzitetna knji`nica, Ljubljana
314(497.4)311:316.346.2(497.4)
FACTS about women and men in Slovenia / [edited by PetronelaVertot ; translated by PSD]. - Ljubljana : Statisti~ni uradRepublike Slovenije = Statistical Office of the Republic ofSlovenia, 2007
ISBN 978-961-239-148-51. Vertot, Nelka236463872

3FACTS ABOUT WOMEN AND MEN IN SLOVENIA
TABLE OF CONTENTS
Facts about Women and Men
FOREWORD ............................................................................................................................... . 1
TABLE OF CONTENTS ............................................................................................................... 3
ACTS AND REGULATIONS........................................................................................................ 4
DEMOGRAPHIC DEVELOPMENT............................................................................................. 6
Age structure of the population ............................................................................................ 9
Ethnic and cultural features of Slovenia’s population ................................................... 11
WORK ......................................................................................................................................... 14
RECONCILIATION OF WORKING AND PRIVATE LIFE ........................................................ 22
KNOWLEDGE-BASED SOCIETY ............................................................................................ 24
SOCIAL WELL-BEING OF WOMEN AND MEN ..................................................................... 29
Health ..................................................................................................................................... 29
Injuries at work ...................................................................................................................... 37
Absence from work: because of alcohol ........................................................................... 38
Social inclusion ..................................................................................................................... 39
Courts and persons convicted of criminal acts ............................................................... 40
Retired persons ................................................................................................................... .41
GENDER RELATIONS ............................................................................................................... 43
Family life and partnership ................................................................................................. 43
Violence against women in the domestic environment and partnership relations ... 47
POLITICAL INVOLVEMENT ..................................................................................................... 48
DEFINITIONS AND EXPLANATIONS OF SOME BASIC CONCEPTS USED .................... 49
LIST OF COUNTRIES: NAMES AND THEIR ISO CODES (ISO 3166) ................................ 50

4 FACTS ABOUT WOMEN AND MEN IN SLOVENIA
• ACTS AND REGULATIONS1 •
In Slovenia, the principle of equality is provided under Article 14 of the Constitution ofthe Republic of Slovenia. It defines the Republic of Slovenia as a democratic and wel-fare state governed by the rule of law, which ensures the enjoyment and implementa-tion of human rights and fundamental freedoms to all, regardless of their nationalorigin, race, gender, religion, political or other conviction, material standing, birth,education, social status or any other personal circumstance.
Slovenia is among the countries which regulate the principle of equality with a specialact. The Equal Opportunities for Women and Men Act (2002) determines commonguidelines and foundations for the creation of equal opportunities and the promotionof the equality of genders in different areas of life which are important from the as-pect of gender equality (for example political, economic and social areas andeducation).The Implementation of the Principle of Equal Treatment Act (2004) up-graded the legal basis for providing the equal treatment of persons in all areas ofsocial life regardless of personal circumstances, including gender.
The Convention on the Elimination of All Forms of Discrimination against Women,adopted in 1979 by the UN General Assembly, is an legally binding umbrella instru-ment for the protection of women’s rights, which reaches into all areas of public andprivate life and obliges Slovenia to adopt all necessary measures, including positiveaction, for the elimination of discrimination and to provide full equality of genders inall areas, especially political, social, economic and cultural.
Other important universal instruments for the protection of women’s rights are theInternational Covenant on Civil and Political Rights, adopted in 1966, and the Inter-national Covenant on Economic, Social and Cultural Rights, adopted in the same year,which bind the contracting states to provide women and men with the equal exerciseof all rights and freedoms ensured by both covenants, and the convention of the Inter-national Labour Organisation which relates to equal pay for equal work, on the elimi-nation of discrimination in employment and occupation, and equal treatment of work-ers with family responsibilities, and safeguards.
Equal treatment and equal opportunities for both genders are also fundamental legalprinciples of the European Union, defined both in the Amsterdam Treaty, which is thefundamental EU treaty, and in many directives established in national legislations ofthe EU Member States. With the Amsterdam Treaty, the European Community pledgedthat in all its policies and activities it will promote the equality of women and men andwill make efforts to eliminate all inequalities resulting from gender (Articles 2 and 3).
Within the Council of Europe, the most important documents on the protection ofwomen’s rights are the European Convention for the Protection of Human Rights andFundamental Freedoms, adopted in 1950, and the European Social Charter, adopted
1 http://www.uem.gov.si/si/zakonodaja_in_dokumenti/

5FACTS ABOUT WOMEN AND MEN IN SLOVENIA
in 1996, which ensure the non-discriminatory exercise of rights and freedoms en-sured by the convention and the charter, regardless of gender, race, skin colour, lan-guage, religion, political or other opinion, national or social origin, minority status,property, birth or other status.
More on this can be found on the website of the Office for Equal Opportunities, a gov-ernment organisation which in Slovenia makes efforts to implement the principle ofthe equality of women and men in practice (http://www.uem.gov.si).

6 FACTS ABOUT WOMEN AND MEN IN SLOVENIA
• DEMOGRAPHIC DEVELOPMENT •
Number of men and women, Slovenia, 1857-2002 Censuses
Source: Statistical Office of the Republic of Slovenia, Population censuses
From the mid-19th century, when over a million people lived in the territory of thepresent-day Slovenia, to the mid-20th century, the number of citizens increased by half amillion, and in the last hundred years by over 48%. Under the definition of population usedfor the 2002 Census, and recalculation of data from the 1991 Census, there were 2.6% or50,681 more people in Slovenia at the 2002 Census than at the 1991 Census, and thepopulation stood at 1,964,036. The described growth of population was primarily a conse-quence of immigration, as 28,000 people immigrated to Slovenia in that period. Naturalincrease in Slovenia in the period between the last two censuses was negative (-3,500persons). The gender structure of the population changed only slightly in the period: theshare of men increased by 0.3 of a percentage point (from 48.5% to 48.8%) in comparisonto the data from the 1991 Census.
There are more women than men in Slovenia. At the end of 2006, there were 1,023,395women and girls living in Slovenia, or 51% of 2,010,377 inhabitants. The sex ratio (thenumber of women per 1,000 men) has been decreasing in Slovenia since 1969.

7FACTS ABOUT WOMEN AND MEN IN SLOVENIA
Population, some indicators by gender, Slovenia, 1857-2002 Censuses
Population projections by major age groups by gender, Slovenia, 31 December 2020
Age group (years) Women % Men %
under 15 132 570 13 140 481 1415-64 647 398 64 685 526 6965+ 236 271 23 174 444 17
TOTAL 1 016 239 100 1 000 451 100
80+ 69 558 7 33 226 3
Source: Statistical Office of the Republic of Slovenia, Population projections
Year Share of women Growth rate: Coefficient Coefficientof census % 1857=100 of femininity of masculinity
women men
1857 51.4 100 100 1 055.9 947.11869 51.7 103 102 1 068.8 935.61880 51.2 107 108 1 049.0 953.31890 51.3 112 112 1 053.2 949.51900 51.3 115 115 1 051.7 950.91910 51.3 120 120 1 051.7 950.81921 52.3 121 116 1 097.2 911.41931 51.8 128 126 1 076.0 929.41948 53.1 135 126 1 131.9 883.51953 52.7 140 133 1 112.9 898.61961 52.2 147 142 1 092.0 915.81971 51.6 157 156 1 066.0 938.11981 51.4 172 171 1 059.1 944.21991 51.5 179 178 1 063.8 940.02002 51.2 178 179 1 048.9 953.4
Source: Statistical Office of the Republic of Slovenia

8 FACTS ABOUT WOMEN AND MEN IN SLOVENIA
Surplus of women over men in Slovenia, 1985-2005 and population projections 2006-2050 (basic variant)
Sources: Statistical Office of the Republic of Slovenia, Number of population of the Republic of Slovenia andEurostat – New Cronos
The surplus of women over men in Slovenia has been decreasing since the mid-1990sand according to the medium variant of population projections will continue to decreaseuntil the mid-2020s, whereupon it is expected to increase again.
Population projections by major age groups by gender, Slovenia, 31 December 2050
Age group (years) Women % Men %
under 15 118 116 12 125 747 1315-64 528 738 55 536 201 5765+ 320 879 33 271 168 29
TOTAL 967 733 100 933 116 100
80+ 118 891 12 81 681 9
Source: Statistical Office of the Republic of Slovenia, Population projections

9FACTS ABOUT WOMEN AND MEN IN SLOVENIA
Age structure of the population
Shares of the population by age groups and gender, Slovenia, 30 June 2006
Source: Statistical Office of the Republic of Slovenia, Number of population of the Republic of Slovenia
The age structure of the population illustrates how Slovenia’s population has beendeveloping in the past in terms of numbers, and partially also indicates its probabledevelopment in the future. Improved health care has considerably increased averagelife expectancy in Slovenia, and because the birth rate is decreasing, the number andshare of the elderly have increased rapidly.
The number of men in Slovenia up to 60 years of age exceeds the number of womenin all age groups. Thereafter, the share of women in all age groups is greater than thatof men, because women on average die older than men.
A simple indicator of population ageing is the mean age of the population. In 1931,the mean age of the population in the territory of present-day Slovenia was 23.3 years(24.1 years for women and 22.3 years for men). Therefore, women were on average 1.8years older than men. Three decades later, the mean age of the population was 32.1years (33.4 years for women and 30.6 years for men), which made women on average 2.8years older than men. At the last census, in 2002, the mean age of Slovenia’s populationwas 39.5 years (41.1 for women and 37.7 years for men), so that women were on average3.4 years older than men.
10 FACTS ABOUT WOMEN AND MEN IN SLOVENIA
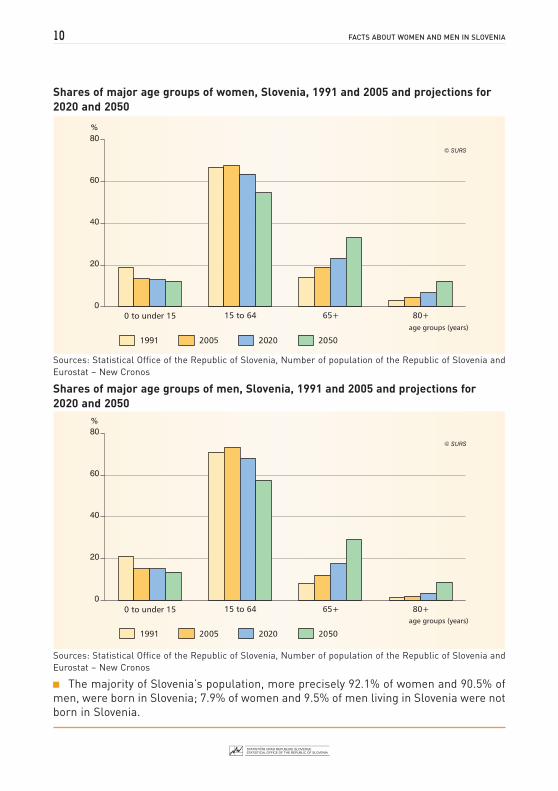
Shares of major age groups of women, Slovenia, 1991 and 2005 and projections for2020 and 2050
Sources: Statistical Office of the Republic of Slovenia, Number of population of the Republic of Slovenia andEurostat – New Cronos
Shares of major age groups of men, Slovenia, 1991 and 2005 and projections for2020 and 2050
Sources: Statistical Office of the Republic of Slovenia, Number of population of the Republic of Slovenia andEurostat – New Cronos
The majority of Slovenia’s population, more precisely 92.1% of women and 90.5% ofmen, were born in Slovenia; 7.9% of women and 9.5% of men living in Slovenia were notborn in Slovenia.
11FACTS ABOUT WOMEN AND MEN IN SLOVENIA
Ethnic and cultural features of Slovenia’s population
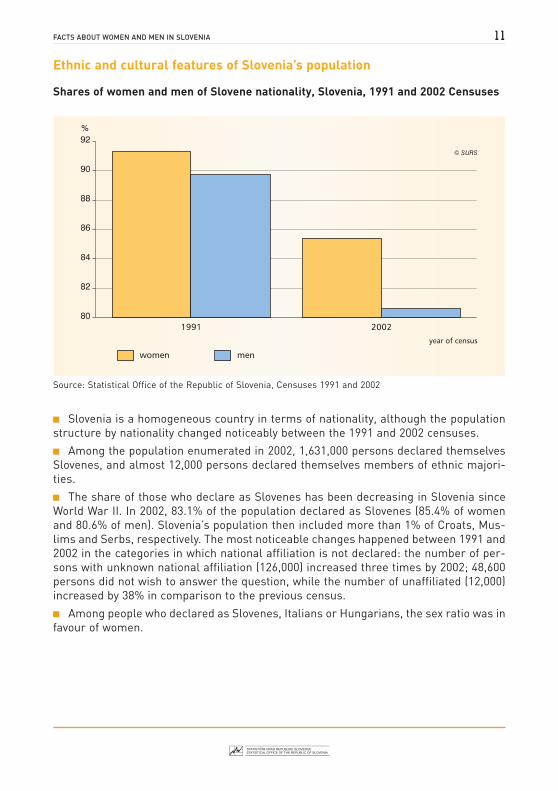
Shares of women and men of Slovene nationality, Slovenia, 1991 and 2002 Censuses
Source: Statistical Office of the Republic of Slovenia, Censuses 1991 and 2002
Slovenia is a homogeneous country in terms of nationality, although the populationstructure by nationality changed noticeably between the 1991 and 2002 censuses.
Among the population enumerated in 2002, 1,631,000 persons declared themselvesSlovenes, and almost 12,000 persons declared themselves members of ethnic majori-ties.
The share of those who declare as Slovenes has been decreasing in Slovenia sinceWorld War II. In 2002, 83.1% of the population declared as Slovenes (85.4% of womenand 80.6% of men). Slovenia’s population then included more than 1% of Croats, Mus-lims and Serbs, respectively. The most noticeable changes happened between 1991 and2002 in the categories in which national affiliation is not declared: the number of per-sons with unknown national affiliation (126,000) increased three times by 2002; 48,600persons did not wish to answer the question, while the number of unaffiliated (12,000)increased by 38% in comparison to the previous census.
Among people who declared as Slovenes, Italians or Hungarians, the sex ratio was infavour of women.
12 FACTS ABOUT WOMEN AND MEN IN SLOVENIA
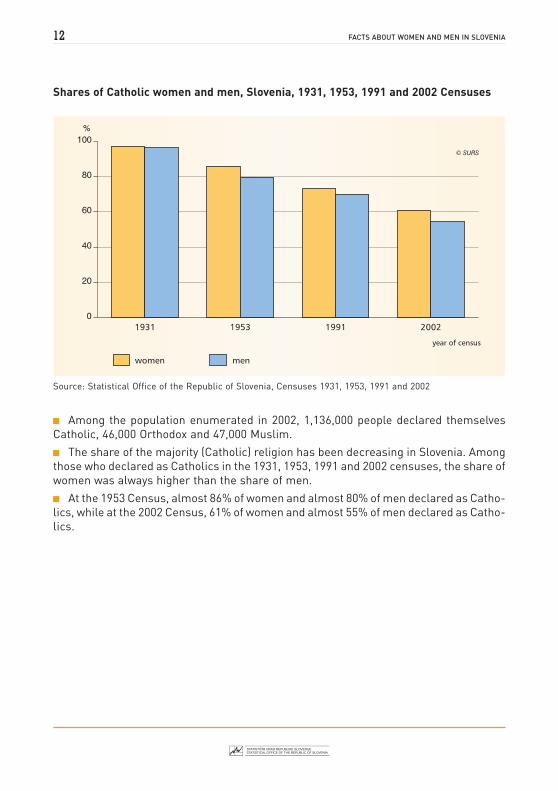
Shares of Catholic women and men, Slovenia, 1931, 1953, 1991 and 2002 Censuses
Source: Statistical Office of the Republic of Slovenia, Censuses 1931, 1953, 1991 and 2002
Among the population enumerated in 2002, 1,136,000 people declared themselvesCatholic, 46,000 Orthodox and 47,000 Muslim.
The share of the majority (Catholic) religion has been decreasing in Slovenia. Amongthose who declared as Catholics in the 1931, 1953, 1991 and 2002 censuses, the share ofwomen was always higher than the share of men.
At the 1953 Census, almost 86% of women and almost 80% of men declared as Catho-lics, while at the 2002 Census, 61% of women and almost 55% of men declared as Catho-lics.

13FACTS ABOUT WOMEN AND MEN IN SLOVENIA
Coefficient of masculinity by mother tongue, Slovenia, 1981, 1991 and 2002 Censuses
Source: Statistical Office of the Republic of Slovenia, Censuses 1981, 1991 and 2002
Among the people of Slovenia enumerated in 2002, 1,723,000 declared Slovene astheir mother tongue. Serbo-Croatian language was the mother tongue of 80,000 people,while 51,000 named Croatian as their mother tongue. Slovenia’s population is very ho-mogeneous in terms of mother tongue, as Slovene is the mother tongue of 87.7% of thepopulation (89% of women and 86.5% of men). It is followed by Croatian (2.8%), Serbo-Croatian (1.8%), and Serbian and Bosnian (1.6% each). The share of the population whosemother tongue was not mentioned here stood at 1.8%.
Individual language groups of people living in Slovenia do not differ one from theother only in terms of their numbers and changes in those numbers, but also in theirage and gender structure. In terms of gender, they can be divided into a group in whichwomen predominate (these are persons who speak Slovene, Italian, Hungarian, Ger-man and Romany as their mother tongues), and into a group which is dominated by menwho speak all other languages as their mother tongues. The majority of the first groupconstitutes the autochthonous population, while the second group comprises immigrants.

14 FACTS ABOUT WOMEN AND MEN IN SLOVENIA
• WORK •
Difference between the employment rates for men and women, EU-25 MemberStates, Norway and Switzerland, 2006
Sources: Eurostat – New Cronos and Statistical Office of the Republic of Slovenia, Labour Force Survey
In accordance with the expected increase in employment already projected in theLisbon Strategy, the employment rate for the EU population in 2006 increased to 64.4%(it stood at 62.2% in 2000 and 63.4% in 2005), and 214 million people aged 15 or morewere employed. In 2006 the employment rate for women stood at 57.2% (53.7% in 2000and 56.0% in 2005). The largest difference between the shares of women in paid em-ployment and men in paid employment in the EU Member States was recorded in Malta,Greece and Italy, and the smallest in Finland, Sweden and Latvia.

15FACTS ABOUT WOMEN AND MEN IN SLOVENIA
The employment rates for women and men, Slovenia, 2000-2006
Source: Statistical Office of the Republic of Slovenia, Labour Force Survey
Among all people aged between 15 and 64, 49.4% of women and 62.5% of men werein employment in Slovenia in 2006.
According to data from the 2002 Census, then the labour force in Slovenia stood at818,304 people (367,064 women in employment and 451,524 men in employment).
The largest share of persons in employment in 2006 was, as expected, that of per-sons in paid employment: 741,586 or 89.9% of all persons in employment. There were361,514 women in paid employment, or 93.7% of all women in employment, and 402,782men in paid employment, or 86.9% of all men in employment.
Almost half of not only women in employment but also of both women and men inpaid employment in 2005 usually had full-time jobs.
The share of women in paid employment on fixed-time contracts in Slovenia in 2005increased in comparison to men.
Distinctive differences between women and men in Slovenia in 2005 were noticeablein absenteeism. On average, men are more frequently absent from work because ofvarious work-related injuries, while women were absent from work primarily to care forfamily members.

16 FACTS ABOUT WOMEN AND MEN IN SLOVENIA
The unemployment rates for women and men, Slovenia, 2000-2006
Source: Statistical Office of the Republic of Slovenia, Labour Force Survey
Unemployment is one of the main indicators measuring coordination between supplyand demand in the labour market. It is the most synthetic indicator of the scope of socialproblems caused by structural disproportions in that market. In 2006, the unemploy-ment rate in Slovenia was 6% (4.9% for men and 7.2% for women).
Unemployment in 2006 was, as usual, highest among young people (aged between 15and 24), and stood at 13.9%. It was 11.6% among young men and 17% among youngwomen. In line with expectations, unemployment was lowest among older people, i.e. inthe group of people aged between 55 and 64, standing at 2.6%.
17FACTS ABOUT WOMEN AND MEN IN SLOVENIA
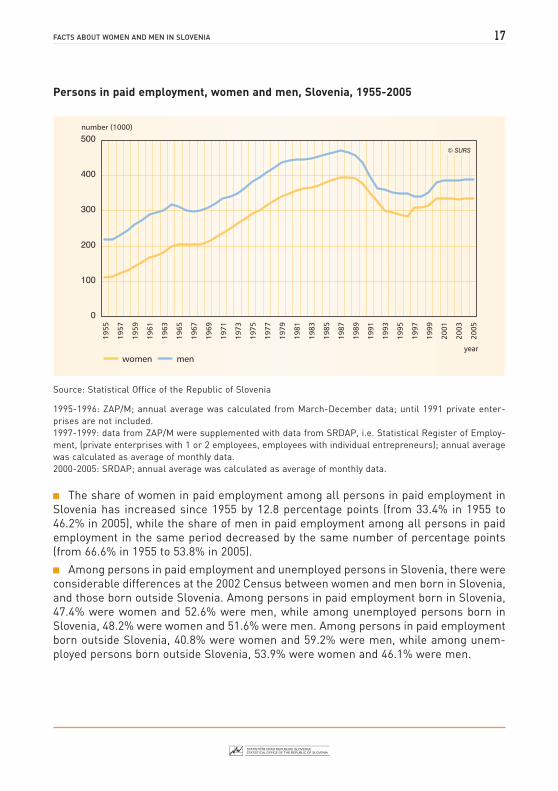
Persons in paid employment, women and men, Slovenia, 1955-2005
Source: Statistical Office of the Republic of Slovenia
1995-1996: ZAP/M; annual average was calculated from March-December data; until 1991 private enter-prises are not included.1997-1999: data from ZAP/M were supplemented with data from SRDAP, i.e. Statistical Register of Employ-ment, (private enterprises with 1 or 2 employees, employees with individual entrepreneurs); annual averagewas calculated as average of monthly data.2000-2005: SRDAP; annual average was calculated as average of monthly data.
The share of women in paid employment among all persons in paid employment inSlovenia has increased since 1955 by 12.8 percentage points (from 33.4% in 1955 to46.2% in 2005), while the share of men in paid employment among all persons in paidemployment in the same period decreased by the same number of percentage points(from 66.6% in 1955 to 53.8% in 2005).
Among persons in paid employment and unemployed persons in Slovenia, there wereconsiderable differences at the 2002 Census between women and men born in Slovenia,and those born outside Slovenia. Among persons in paid employment born in Slovenia,47.4% were women and 52.6% were men, while among unemployed persons born inSlovenia, 48.2% were women and 51.6% were men. Among persons in paid employmentborn outside Slovenia, 40.8% were women and 59.2% were men, while among unem-ployed persons born outside Slovenia, 53.9% were women and 46.1% were men.

18 FACTS ABOUT WOMEN AND MEN IN SLOVENIA
Comparison of shares of women in employment and men in employment in twentymost frequent occupations, Slovenia, 2005
Source: Statistical Office of the Republic of Slovenia, Statistical Register of Employment (SRDAP)

19FACTS ABOUT WOMEN AND MEN IN SLOVENIA
Difference (%) between average gross earnings per hour received by man and thosereceived by woman, EU-25 Member States, 2005
Source: Eurostat – New Cronos
Note: Greece, Ireland, Spain, Slovenia and United Kingdom: provisional data
Although girls in Europe achieve better results in school than boys, and althougheach year more women graduates enter the labour market than men graduates, in 2005women’s earnings were still 15% lower than those of men.
In Slovenia in 2005, there were 9.1% more men in paid employment than women inpaid employment (the rate stood at 15% in EU-25), while the difference in the averageearnings for the same work in Slovenia stood at about 8% to the benefit of men (the ratestood at 15% in EU-25).
Statistics show that the difference in earnings in Slovenia increases according to age(women in Slovenia still retire earlier than men), education and years of service (thedifference in earnings stands at 30% in the group aged between 50 and 59, and 7% forpersons under 30 years of age; for persons with tertiary education the difference standsat more than 30%, and 13% for those with secondary education; for workers with morethan 30 years of service in an enterprise the difference is 32%, and is lower by 10% forthose working in an enterprise between one and five years).

20 FACTS ABOUT WOMEN AND MEN IN SLOVENIA
Average monthly gross earnings of women and men in paid employment by agegroups, Slovenia, 2004
Source: Statistical Office of the Republic of Slovenia, Structure of earnings statistics
In Slovenia in 2004, women received on average almost 93% of the average monthlygross earnings for men. Women were paid better than men only in the age group be-tween 55 and 64, as women with higher education more frequently enter the labourmarket later, and their younger, less educated colleagues are already retired at thatage.
The difference in earnings for women and men was highest among plant and ma-chine operators and assemblers (major group 8), as the earnings for women in thoseoccupations reached only 75% of the earnings for men. In case of clerks (major group 4)the difference was the smallest, as earnings for women stood at 94% of earnings formen.
Women in Slovenia were better paid than men in construction and transport, storageand communication. The average monthly gross earnings for women in paid employ-ment in construction were almost 18% higher than those for men. This is because womenrepresented only 10% of all persons in paid employment in construction and had betterpaid management, supervision and office posts, which as a rule require higher educa-tion than for lower paid manual labour posts, which are considered as men’s field.

21FACTS ABOUT WOMEN AND MEN IN SLOVENIA
Average monthly gross earnings for women in paid employment and men in paidemployment by major groups of occupation, Slovenia, 2004
Source: Statistical Office of the Republic of Slovenia, Structure of earnings statistics
Ratio between the average monthly gross earnings for women in paid employmentand men in paid employment by major groups of occupation, Slovenia, 2004
Source: Statistical Office of the Republic of Slovenia, Structure of earnings statistics
22 FACTS ABOUT WOMEN AND MEN IN SLOVENIA
• RECONCILIATION OF WORKING AND PRIVATE LIFE •
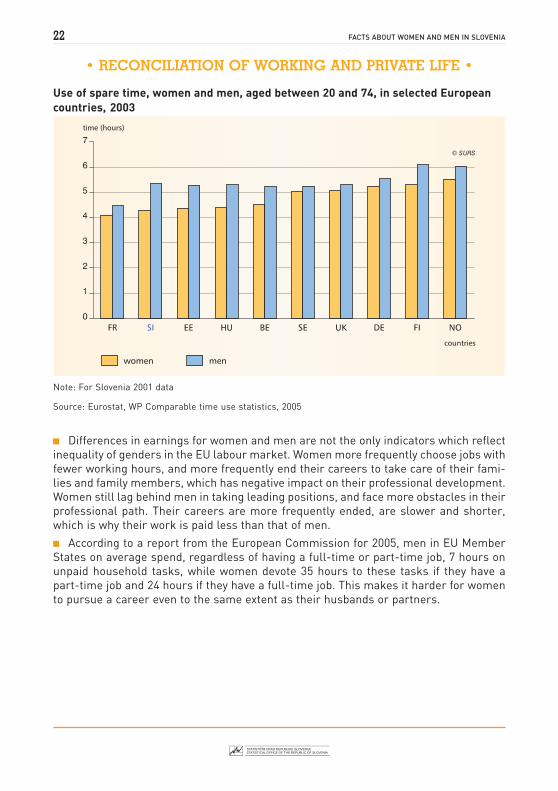
Use of spare time, women and men, aged between 20 and 74, in selected Europeancountries, 2003
Note: For Slovenia 2001 data
Source: Eurostat, WP Comparable time use statistics, 2005
Differences in earnings for women and men are not the only indicators which reflectinequality of genders in the EU labour market. Women more frequently choose jobs withfewer working hours, and more frequently end their careers to take care of their fami-lies and family members, which has negative impact on their professional development.Women still lag behind men in taking leading positions, and face more obstacles in theirprofessional path. Their careers are more frequently ended, are slower and shorter,which is why their work is paid less than that of men.
According to a report from the European Commission for 2005, men in EU MemberStates on average spend, regardless of having a full-time or part-time job, 7 hours onunpaid household tasks, while women devote 35 hours to these tasks if they have apart-time job and 24 hours if they have a full-time job. This makes it harder for womento pursue a career even to the same extent as their husbands or partners.

23FACTS ABOUT WOMEN AND MEN IN SLOVENIA
Time use, women and men, aged between 20 and 74, Slovenia, 2001
Source: Statistical Office of the Republic of Slovenia, Time Use Survey, 2001
According to the data on time use for 15 European countries, a woman in Sloveniaspends on average almost 8 hours for paid and household work. Among these 15 coun-tries, only a Lithuanian woman spends more time to perform such work.
On eating and personal care, a Slovene woman spends as much time as an Estonianand a Finnish woman, 2 hours and 8 minutes, which is the least time among all 15countries, while French and Italian women spend the most time. With four hours ofavailable leisure time, a Slovene woman ranks 10th among the fifteen countries. A Nor-wegian woman has the most available spare time, almost 6 hours. Considering that aNorwegian woman spends the same amount of time at work or studying as a Slovenewoman, a Norwegian woman has more time for spare time activities, because she spendsone hour and 10 minutes less on housework and her family than a Slovene woman. ASlovene woman has 65 minutes less spare time than a Slovene man. This is also thelargest difference between the amount of spare time for women and men among allcountries which provided data (Belgium, Germany, Estonia, Spain, France, Italy, Lithuania,Latvia, Hungary, Poland, Slovenia, Finland, Sweden, the United Kingdom and Norway).
Women in Slovenia dedicate to housework and care for their families twice as muchtime as men. Care for a child or children remains primarily a woman’s duty, which isindicated by data which show that women most frequently take absence from work totake care of their children, that women most frequently “decide” to work fewer hoursuntil their child is three years old, and take leave of absence from work to take care of afamily member. More promising is the data showing that the majority of today’s fathersexercise their right to paternity leave.

24 FACTS ABOUT WOMEN AND MEN IN SLOVENIA
• KNOWLEDGE-BASED SOCIETY •
Shares of women, aged between 20 and 24, with secondary education, EU-25Member States, 2005
Source: Eurostat – New Cronos
Shares of men, aged between 20 and 24, with secondary education, EU-25 MemberStates, 2005
Source: Eurostat – New Cronos
25FACTS ABOUT WOMEN AND MEN IN SLOVENIA
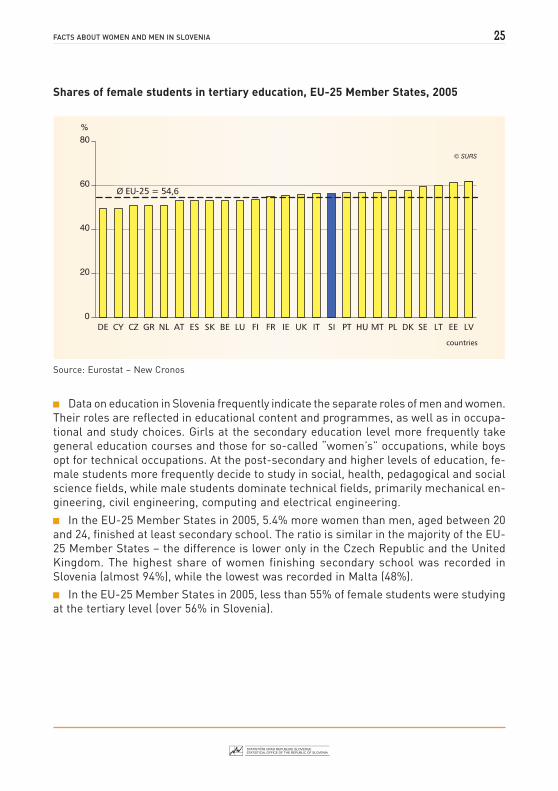
Shares of female students in tertiary education, EU-25 Member States, 2005
Source: Eurostat – New Cronos
Data on education in Slovenia frequently indicate the separate roles of men and women.Their roles are reflected in educational content and programmes, as well as in occupa-tional and study choices. Girls at the secondary education level more frequently takegeneral education courses and those for so-called “women’s” occupations, while boysopt for technical occupations. At the post-secondary and higher levels of education, fe-male students more frequently decide to study in social, health, pedagogical and socialscience fields, while male students dominate technical fields, primarily mechanical en-gineering, civil engineering, computing and electrical engineering.
In the EU-25 Member States in 2005, 5.4% more women than men, aged between 20and 24, finished at least secondary school. The ratio is similar in the majority of the EU-25 Member States – the difference is lower only in the Czech Republic and the UnitedKingdom. The highest share of women finishing secondary school was recorded inSlovenia (almost 94%), while the lowest was recorded in Malta (48%).
In the EU-25 Member States in 2005, less than 55% of female students were studyingat the tertiary level (over 56% in Slovenia).

26 FACTS ABOUT WOMEN AND MEN IN SLOVENIA
Shares of women, aged 15 and over, by education, Slovenia, 1961, 1971, 1981, 1991and 2002 Censuses
Source: Statistical Office of the Republic of Slovenia, Censuses 1961, 1971, 1981, 1991 and 2002
Census results also indicate that an increasing number of women in Slovenia areentering the educational process. At the 1991 Census, almost a half of women (48.2%)had post-secondary or higher education, while in 2002, women with the same level ofeducation represented 53% of Slovenia’s population with this level of education; in 1961,the share of women with post-secondary or higher education in Slovenia barely exceededa quarter (26.8%) of the population with this level.
At the 2002 Census, the majority of people with secondary, post-secondary and highereducation, similarly to the 1991 Census, were aged between 25 and 44. The share ofwomen who finish their education by the age of 30 at post-graduate level was almost10% higher than the share of men of the same age.

27FACTS ABOUT WOMEN AND MEN IN SLOVENIA
Shares of men, aged 15 and over, by education, Slovenia, 1961, 1971, 1981, 1991and 2002 Censuses
Source: Statistical Office of the Republic of Slovenia, Censuses 1961, 1971, 1981, 1991 and 2002
According to the 1991 Census, 43.1% of people in Slovenia finished secondary school(almost a half of them graduating from a craft or vocational school), and by the 2002Census over half of the total population (54.1%). The share of persons with higher edu-cation in Slovenia at the 1991 Census was still low (4.6% with post-secondary educationand 4.3% with higher education), but it has increased 2.5 times since the 1971 Census.By the 2002 Census, 13% of the population had educational qualifications higher thansecondary level, which is over 4 percentage points up on 1991.
Between the last two censuses in Slovenia, the educational structure of the popula-tion shifted more in favour of women. At the 2002 Census, men had some ‘advantage’ ineducation, being ahead of women only in terms of secondary education (60.6% to 47.9%);in terms of post-secondary or higher education, women overtook men in the decadebetween the last two censuses (13.3% to 12.6%).
In the 2004/2005 academic year, there were more than 300,000 students in Sloveniaenrolled in the forms of continuing education. Young people, aged between 15 and 29,comprised the majority, and there were more men (39.5%) than women (33.3%) amongthem.

28 FACTS ABOUT WOMEN AND MEN IN SLOVENIA
Shares of women and men completing higher education undergraduate and post-graduate studies, by age groups, Slovenia, 2002 Census
Source: Statistical Office of the Republic of Slovenia, 2002 census
The position of women in science in Slovenia does not differ considerably from theposition of women in other European countries.
Although women and men with degrees are approximately equal in terms of number(sometimes the share of women even exceeds that of men), the number of women en-joying promotion in their careers (for example, from master’s degree to the status of fullprofessor) usually drops to about 10% (it varies by subject area, of course), both in Eu-rope and in Slovenia. In education and research, there are more women (59%) than mengraduates, but in terms of professional promotion, the number of women decreases;out of 43% women with Ph.D. degree only 15% have the status of full professor.
Although the share of women increases in post-graduate studies, it is lower at thePh.D. level than the share of men, and it is also partly the reason that the share of womenemployed in science and research is lower than that of men.
Also, in terms of scientific field, women dominate in medical and social sciences, andmen dominate in natural and technical sciences. In science and research, the share ofwomen in the highest positions is still low.
The majority of students in undergraduate and post-graduate studies in Slovenia (bothwomen and men) opt for social sciences, business sciences and law.
In 2005, there were 8,994 persons (3,345 or 37% women) working full-time in scienceand research. There were 5,253 researchers (58.4%) among whom 3,476 or 66.2% weremen, and 1,777 or 33.8% were women.
29FACTS ABOUT WOMEN AND MEN IN SLOVENIA
• SOCAL WELL-BEING OF WOMEN AND MEN •
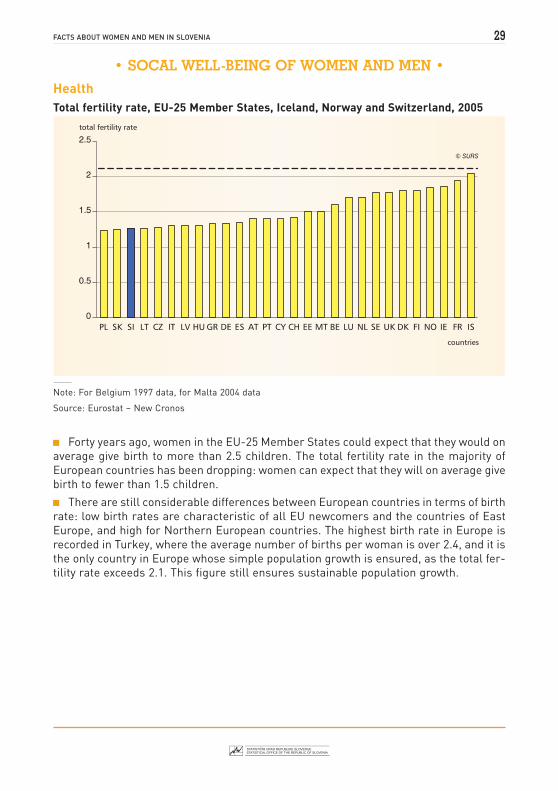
HealthTotal fertility rate, EU-25 Member States, Iceland, Norway and Switzerland, 2005
Note: For Belgium 1997 data, for Malta 2004 data
Source: Eurostat – New Cronos
Forty years ago, women in the EU-25 Member States could expect that they would onaverage give birth to more than 2.5 children. The total fertility rate in the majority ofEuropean countries has been dropping: women can expect that they will on average givebirth to fewer than 1.5 children.
There are still considerable differences between European countries in terms of birthrate: low birth rates are characteristic of all EU newcomers and the countries of EastEurope, and high for Northern European countries. The highest birth rate in Europe isrecorded in Turkey, where the average number of births per woman is over 2.4, and it isthe only country in Europe whose simple population growth is ensured, as the total fer-tility rate exceeds 2.1. This figure still ensures sustainable population growth.
30 FACTS ABOUT WOMEN AND MEN IN SLOVENIA
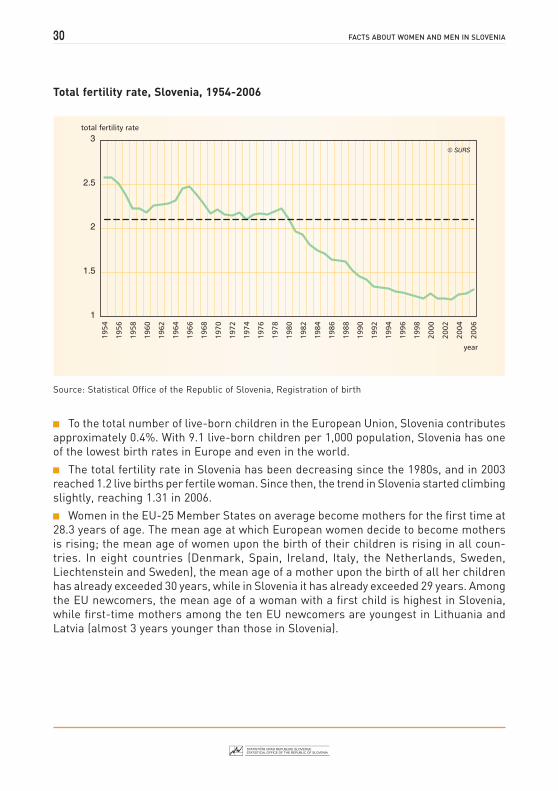
Total fertility rate, Slovenia, 1954-2006
Source: Statistical Office of the Republic of Slovenia, Registration of birth
To the total number of live-born children in the European Union, Slovenia contributesapproximately 0.4%. With 9.1 live-born children per 1,000 population, Slovenia has oneof the lowest birth rates in Europe and even in the world.
The total fertility rate in Slovenia has been decreasing since the 1980s, and in 2003reached 1.2 live births per fertile woman. Since then, the trend in Slovenia started climbingslightly, reaching 1.31 in 2006.
Women in the EU-25 Member States on average become mothers for the first time at28.3 years of age. The mean age at which European women decide to become mothersis rising; the mean age of women upon the birth of their children is rising in all coun-tries. In eight countries (Denmark, Spain, Ireland, Italy, the Netherlands, Sweden,Liechtenstein and Sweden), the mean age of a mother upon the birth of all her childrenhas already exceeded 30 years, while in Slovenia it has already exceeded 29 years. Amongthe EU newcomers, the mean age of a woman with a first child is highest in Slovenia,while first-time mothers among the ten EU newcomers are youngest in Lithuania andLatvia (almost 3 years younger than those in Slovenia).

31FACTS ABOUT WOMEN AND MEN IN SLOVENIA
The number of men per 1,000 women by age, Slovenia, 31 December 2006
Source: Statistical Office of the Republic of Slovenia, Number of population of the Republic of Slovenia
Each year the number of newborn boys in Slovenia is somewhat higher than the num-ber of newborn girls, on average 105 boys per 100 girls. Due to the higher infant mortal-ity rate of boys, the value of indicators which show the ratio between the number of menand women in the population levels with the time. At the age of approximately 60 years,the number of men is almost equal to the number of women, and then the difference inthe number of people by gender increases in favour of women, and at the age of 80, thenumber of women is almost double that of men.
In EU Member States, about 4.5 million people die each year. In the majority of Euro-pean countries, the number of deaths per 1,000 population has been decreasing. Theopposite trend, an increase in mortality rates in the last four decades, was recorded inthe three Baltic States and in Hungary. Mortality rates in EU Member States are lowestin Ireland and in both island countries in the Mediterranean, Cyprus and Malta.
A comparable indicator of mortality rates between countries is life expectancy for anewborn child; in Europe life expectancy at birth is as a rule higher in Northern, West-ern and Southern countries. For example, people in Iceland can expect that, consideringthat life expectancy remains unchanged, they will reach the highest age (men slightlyover 80 years and women slightly over 83).
A considerably shorter life expectancy is recorded in the countries of East Europe,where it stands at 63.8 years for men and 72.4 for women1.
1 http://www.cqpress.com/cs/europe/PDFs/TBL-9.pdf

32 FACTS ABOUT WOMEN AND MEN IN SLOVENIA
Life expectancy for women at birth, EU-25 Member States, Iceland, Norway andSwitzerland, 2005
Note: For Italy 2003 data, for France 2004 dataSource: Eurostat / U.S. Bureau of the Census
Life expectancy for men at birth, EU-25 Member States, Iceland, Norway andSwitzerland, 2005
Note: For Italy 2003 data, for France 2004 dataSource: Eurostat / U.S. Bureau of the Census

33FACTS ABOUT WOMEN AND MEN IN SLOVENIA
Life expectancy at birth by gender, Slovenia, 1960/1961 and 1993/19994 to 2004/2005
Source: Statistical Office of the Republic of Slovenia, Registration of death
The average mortality rate per 1,000 population in Slovenia in the last decade was9.5. The average age in Europe is increasing. Women born in 1960 can expect that theywill live up to almost 72 years of age, and men born in the same year can expect to liveuntil they are 67. For children born in 2005, the life expectancy is considerably longer;boys born in the 2005-2006 period can expect to live up to 74.8 years of age, and girlsborn in the same period 81.9 years.
The life expectancy for a newborn child in Slovenia is shorter than in the EU-15 coun-tries, but is among the longest among the EU newcomers.
The average death age in Slovenia is increasing, and the life expectancy for newbornchildren is extending. A lower mortality rate among women means that women on aver-age live approximately 7 years longer than men. A girl born in Slovenia in 2005 canexpect that she will live for 81 years, while a boy born in Slovenia in the same year canexpect to live 74 years.

34 FACTS ABOUT WOMEN AND MEN IN SLOVENIA
Shares of female and male daily smokers, EU Member States, Iceland, Norway andSwitzerland, 2004
Source: Eurostat – Health Interview Surveys (HIS round 2004)
Analysts of health in Europe find that women on average live 6 years longer thanmen, but they live more years with impaired health. Certain diseases, such as osteoporo-sis, are more frequent and more widespread among women. Other diseases, such ascardiovascular diseases, cancer or mental health difficulties, affect both men and women,but to different degrees.
For example, mental illnesses have a considerable influence on the quality of life,and therefore can influence disease and mortality rates. By 2020, depression is expectedto be the main cause of women’s illnesses in some EU Member States.
Special health difficulties have occurred in the last few decades: eating disorders(they primarily affect teenage girls and young women), HIV and AIDS, sexual and repro-ductive health difficulties, while violence against women affects physical and mentalhealth.
The higher percentage of female smokers in certain EU Member States considerablyincreases the risks of lung cancer and cardiovascular diseases among women.

35FACTS ABOUT WOMEN AND MEN IN SLOVENIA
Shares of people (aged 15 and older) with overweight and obesity, certain Europeancountries (2000-2004)
Source: World Health Organisation database (http://www.who.int)
Unhealthy lifestyle (including overweight and obesity) has a strong influence on theoccurrence of numerous diseases.
Due to biological factors, women and men at a certain age vary in their sensitivity todifferent diseases. In the whole of Europe, including Slovenia, the cancer mortality rateis higher for men than for women. In 2005, 2,307 men (235 per 100,000 men) and 1,777women (174 per 100,000 women) died of cancer in Slovenia. The most common forms ofcancer among women were breast cancer (38.1 per 100,000 women), colon and analcancer (36.2 per 100,000 women) and lung cancer (26.9 per 100,000 women). The mostcommon forms of cancer among men were lung cancer (82 per 100,000 men), colon andanal cancer (36.2 per 100,000 men) and prostate cancer (31.2 per 100,000 men).

36 FACTS ABOUT WOMEN AND MEN IN SLOVENIA
Mean age at death for women and men, Slovenia, 1980, 1990, 1995, 2004, 2005
Source: Statistical Office of the Republic of Slovenia, Registration of death
Men live considerably shorter lives than women. Slovenia is characterised by greatdifferences between the mean age at death for men and women. Men are usually ex-posed to higher risks, perform more difficult manual labour, and live less healthy livesthan women. They also die younger because of these factors. The mean age at death formen in Slovenia (69 years) is almost 9 years lower than that for women (78 years). In thelast three decades, this average rose by almost 6 years, while the average for womenincreased by more than 7 years.
The mean age at death for men is also lower than that for women because of variousinjuries.

37FACTS ABOUT WOMEN AND MEN IN SLOVENIA
Injuries at work
Injuries at work per 1,000 persons in paid employment relative to activity – bygender, Slovenia, 2005
Source: Institute of Public Health of the Republic of Slovenia, Injuries at work
There are between 24,000 and 26,000 reported cases of injury at work in Slovenia,including 50 fatalities1. The most common causes of injury at work are walking, beingstruck, collisions with objects, and falls; the most frequently injured body parts are hands,fingers, the neck, wrist, arms and eyes (foreign bodies in the cornea). Most injuries atwork and most fatal injuries usually occur in construction, mining (men suffer the ma-jority of injuries) and manufacturing.
1 http://www.cilizadelo.si
38 FACTS ABOUT WOMEN AND MEN IN SLOVENIA
Absence from work: due to alcohol
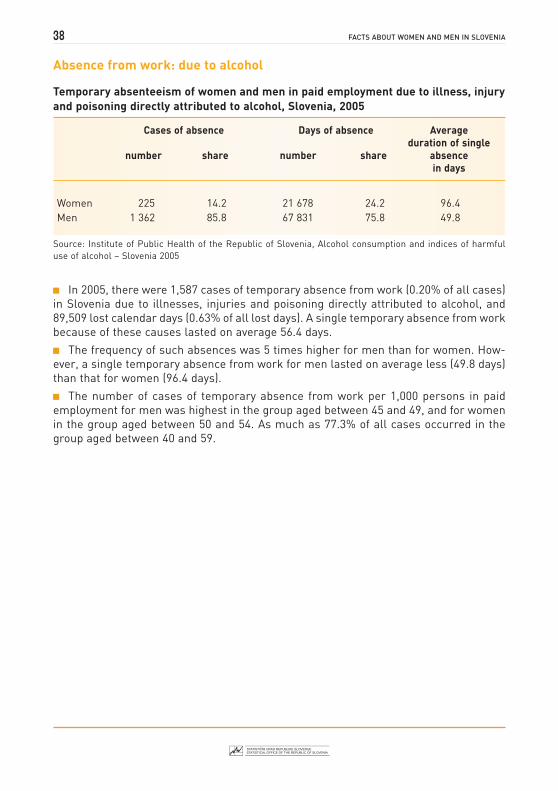
Temporary absenteeism of women and men in paid employment due to illness, injuryand poisoning directly attributed to alcohol, Slovenia, 2005
Cases of absence Days of absence Averageduration of single
number share number share absencein days
Women 225 14.2 21 678 24.2 96.4Men 1 362 85.8 67 831 75.8 49.8
Source: Institute of Public Health of the Republic of Slovenia, Alcohol consumption and indices of harmfuluse of alcohol – Slovenia 2005
In 2005, there were 1,587 cases of temporary absence from work (0.20% of all cases)in Slovenia due to illnesses, injuries and poisoning directly attributed to alcohol, and89,509 lost calendar days (0.63% of all lost days). A single temporary absence from workbecause of these causes lasted on average 56.4 days.
The frequency of such absences was 5 times higher for men than for women. How-ever, a single temporary absence from work for men lasted on average less (49.8 days)than that for women (96.4 days).
The number of cases of temporary absence from work per 1,000 persons in paidemployment for men was highest in the group aged between 45 and 49, and for womenin the group aged between 50 and 54. As much as 77.3% of all cases occurred in thegroup aged between 40 and 59.

39FACTS ABOUT WOMEN AND MEN IN SLOVENIA
Social inclusion
At-risk-of-poverty rate for the population aged at least 16, with regard to the mostfrequent activity status by gender, Slovenia, 2004
Source: Statistical Office of the Republic of Slovenia, Survey on Living Conditions (EU-SILC)
The at-risk-of-poverty rate and magnitude of social exclusion of vulnerable socialgroups is not equal for both genders. It is higher for women than for men, primarily forolder women, and the most among retired women who live alone.
A special group of women who are the most frequently in the position of social exclu-sion are rural women, as their opportunities to exercise certain social rights are limitedand they have less access to certain services.
At-risk-of-poverty rate in Slovenia in 2004 was the highest among women over 65(36%).
Among the inactive population in 2004, the most at risk were unemployed persons(25%), with women being slightly more at risk than men. High at-risk-of-poverty rates(20%) were also recorded for retired women and other inactive persons. With regard tothe most frequent status of activity, persons in paid employment were in the best posi-tion regardless of gender.
40 FACTS ABOUT WOMEN AND MEN IN SLOVENIA
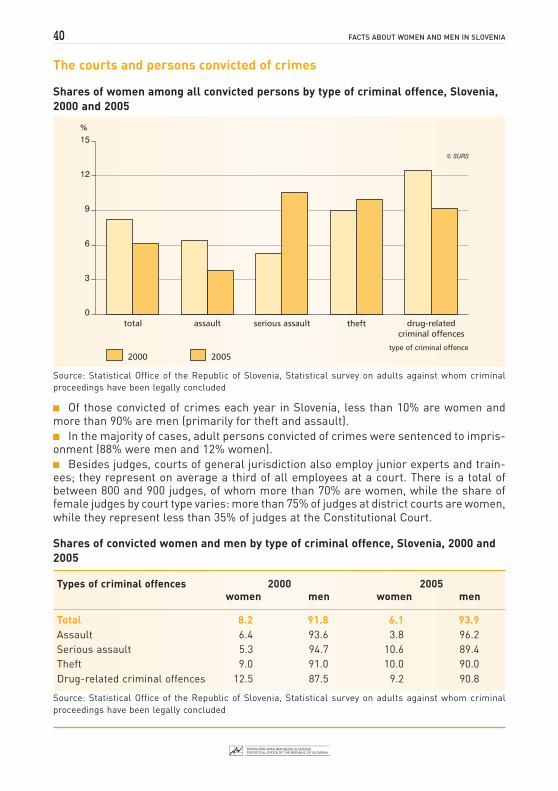
The courts and persons convicted of crimes
Shares of women among all convicted persons by type of criminal offence, Slovenia,2000 and 2005
Source: Statistical Office of the Republic of Slovenia, Statistical survey on adults against whom criminalproceedings have been legally concluded
Of those convicted of crimes each year in Slovenia, less than 10% are women andmore than 90% are men (primarily for theft and assault).
In the majority of cases, adult persons convicted of crimes were sentenced to impris-onment (88% were men and 12% women).
Besides judges, courts of general jurisdiction also employ junior experts and train-ees; they represent on average a third of all employees at a court. There is a total ofbetween 800 and 900 judges, of whom more than 70% are women, while the share offemale judges by court type varies: more than 75% of judges at district courts are women,while they represent less than 35% of judges at the Constitutional Court.
Shares of convicted women and men by type of criminal offence, Slovenia, 2000 and2005
Types of criminal offences 2000 2005women men women men
Total 8.2 91.8 6.1 93.9Assault 6.4 93.6 3.8 96.2Serious assault 5.3 94.7 10.6 89.4Theft 9.0 91.0 10.0 90.0Drug-related criminal offences 12.5 87.5 9.2 90.8
Source: Statistical Office of the Republic of Slovenia, Statistical survey on adults against whom criminalproceedings have been legally concluded

41FACTS ABOUT WOMEN AND MEN IN SLOVENIA
Retired persons
Shares of women receiving pensions by type of pension, Slovenia, 2000 and 2006
Source: Pension and Disability Insurance Institute of the Republic of Slovenia, 2006 Report
Among women who received pensions in Slovenia between 2000 and 2006, the shareof those who received widow and national pensions increased, while the shares of thosewho received old-age, disability and survivor’s pensions decreased. During this period,the share of men who received old-age pensions and, to some extent, the share of thosemen who received widow and national pensions increased, while the shares of thosemen who received disability and survivor’s pensions decreased.
The legal requirements for acquiring the right to a pension, in particular to an old-age pension, have been changing and becoming stricter since the 2000 pension reform.The actual age of men and women upon retirement has also been rising, from 56 yearsand 1 month to 57 years and 4 months for women (by 1 year and 3 months), and from 61years to 61 years and 8 months (by 8 months) for men. In the last two years, the age ofmen upon retirement has not risen and even fell (due to the right to a reduced age limitfor children, as it can be exercised by the father instead of the mother). In comparisonwith 2005, the actual retirement age for women in 2006 increased by 1 month, and re-mained level for men.

42 FACTS ABOUT WOMEN AND MEN IN SLOVENIA
Shares of men receiving pensions by type of pension, Slovenia, 2000 and 2006
Source: Pension and Disability Insurance Institute of the Republic of Slovenia, 2006 Report
There was a total of 511,000 recipients of all types of pension (old-age, disability,survivor’s and widow pensions) in Slovenia in 2006.
In 2006, retired persons represented 26.7% of Slovenia’s population, which was 0.2 ofa percentage point more than in 2005.
Recipients of old-age pensions comprised the highest share (60.1%), followed by re-cipients of disability pensions (17.9%), recipients of survivor’s and widow pensions (17.2%), which was 95.2% of all recipients; recipients of other types of pension (military pen-sions, recipients of pension advance, recipients of farmers’ pensions) totalled 1.5%, whilerecipients of national pensions constituted 3.3% of all recipients of pensions.
The average age upon old-age retirement under the general rules for compulsoryinsurance in 2006 was 57 years and 4 months for women, and 61 years and 8 months formen.
The average disability retirement age under the general rules was 50 years and 4months for women, and 53 years and 5 months for men.

43FACTS ABOUT WOMEN AND MEN IN SLOVENIA
• GENDER RELATIONS •
Family life and partnershipMarital status of people in Slovenia, 2002 Census
Source: Statistical Office of the Republic of Slovenia, 2002 census
At the 2002 Census, there were 150 thousand people living alone in Slovenia (as singlehouseholds), of which 93 thousand or 62% were women, and 57 thousand or 38% weremen. The figure is 2.2 times larger than for 1948 and is the highest share of singlehouseholds in Slovenia since World War II. The majority of men living in single house-holds were young or middle-aged, while the majority of women living in single house-holds were aged 60 or more.
The majority (1.7 million, or 78%) of the two million Slovenes at the 2002 Census livedin families. 84% of all women and 89% of all men lived in families, which comprised 41%children and 59% of adults, of whom 31.8% were wives, mothers or female cohabitingpartners, and 27.4% were husbands, fathers or male cohabiting partners.
In comparison with 1991 Census data, the number of families in Slovenia increasedby 2002 by 12 thousand, and in comparison to the 1981 census by 33 thousand; mean-while, the number of family members decreased. The average family in Slovenia in 2002had 3.1 members, while the average family with children had 3.4 members, and therewere 428 thousand such families. In terms of the number of members, families of mar-ried couples with children (3.7 members) ranked first, and were followed by families ofcohabiting partners with children (3.5 members), while the average single-parent fam-ily had 2.3 members.

44 FACTS ABOUT WOMEN AND MEN IN SLOVENIA
Shares of single women and single men aged 15 and over, by age groups, Slovenia,2002 Census
Source: Statistical Office of the Republic of Slovenia, 2002 census
Shares of married women and married men aged 15 and over, by age groups,Slovenia, 2002 Census
Source: Statistical Office of the Republic of Slovenia, 2002 census

45FACTS ABOUT WOMEN AND MEN IN SLOVENIA
Shares of widows and widowers aged 15 and over by age groups, Slovenia, 2002Census
Source: Statistical Office of the Republic of Slovenia, 2002 census
Shares of divorced women and divorced men aged 15 and over by age groups, Slovenia,2002 Census
Source: Statistical Office of the Republic of Slovenia, 2002 census

46 FACTS ABOUT WOMEN AND MEN IN SLOVENIA
The number of women living in families by their age and by family types, Slovenia,2002 Census
Source: Statistical Office of the Republic of Slovenia, 2002 census
Although the number of marriages in Slovenia has been declining since 1972 (whenthe highest number of marriages since World War II were recorded – almost 16 thou-sand), to less than 6 thousand in 2005, married couples (73.7%) were still the mostcommon form of family in Slovenia at the 2002 Census. Although the number of familieshas been constantly increasing (by 34 thousand or 6.5% between 1981 and 2002), theshare of families with ‘married couples with children’ has been decreasing (by 10.3% inthe same period).
47FACTS ABOUT WOMEN AND MEN IN SLOVENIA
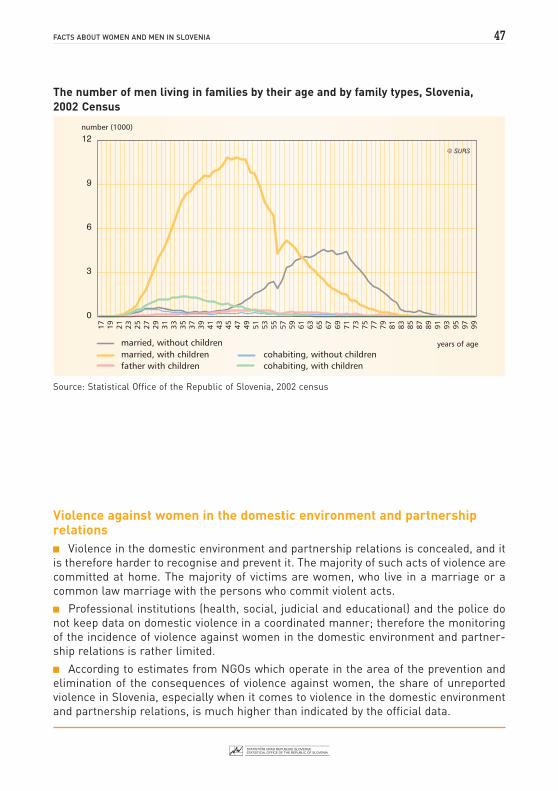
The number of men living in families by their age and by family types, Slovenia,2002 Census
Source: Statistical Office of the Republic of Slovenia, 2002 census
Violence against women in the domestic environment and partnershiprelations
Violence in the domestic environment and partnership relations is concealed, and itis therefore harder to recognise and prevent it. The majority of such acts of violence arecommitted at home. The majority of victims are women, who live in a marriage or acommon law marriage with the persons who commit violent acts.
Professional institutions (health, social, judicial and educational) and the police donot keep data on domestic violence in a coordinated manner; therefore the monitoringof the incidence of violence against women in the domestic environment and partner-ship relations is rather limited.
According to estimates from NGOs which operate in the area of the prevention andelimination of the consequences of violence against women, the share of unreportedviolence in Slovenia, especially when it comes to violence in the domestic environmentand partnership relations, is much higher than indicated by the official data.

48 FACTS ABOUT WOMEN AND MEN IN SLOVENIA
• POLITICAL INVOLVEMENT •
Representation of female and male candidates for the National Assembly, by agegroups, Slovenia, 2004
Source: National Electoral Commission
The representation of women in political decision-making in Slovenia is far below theEuropean average. Women in Slovenia are relatively rare in representative institutions(e.g. the National Assembly, the National Council) and this is perhaps even more thecase in leading business positions. The number of male assistant professors and fullprofessors at faculties is far higher than that of female assistant professors and fullprofessors, although the student population is predominantly female.
In the 2006 local elections in Slovenia, women constituted 21.5% of municipal coun-cillors (13.1% in 2002, 12.0% in 1998, and 10.8% in 1994).
In the 2004 general election, 1,395 candidates from 20 parties ran for 90 seats inParliament.
Among all candidates, 24.9% were women (23.4% in 2000), and they were representedin all parties.
The share of women among deputies elected to Parliament was at its highest in 1990(18.7%), and lowest in 1996 (7.8%); it reached 12.2% in 2004.
49FACTS ABOUT WOMEN AND MEN IN SLOVENIA
• DEFINITIONS AND EXPLANATIONSOF SOME BASIC CONCEPTS •
COEFFICIENT OF MASCULINITY for men in a certain calendar year is the ratio be-tween the number of men and the number of women multiplied by 1,000.
COEFFICIENT OF FEMININITY for women in a certain calendar year is the ratio be-tween the number of women and the number of men multiplied by 1,000.
TOTAL FERTILITY RATE is the average number of live born children per one woman inreproductive age (15–49 years) in the calendar year.
NEW CRONOS is a database of the Statistical Office of the European Communities(Eurostat).
DATABASE is a multi-user, formally defined and centrally controlled data collection.It provides a multitude of linked data which are stored in a computer system. Access iscentralised and enabled with a database management system.
2002 census – Census of Population, Households and Housing, Slovenia, 2002
SRDAP – Statistical Register of Employment, which contains all persons in employ-ment, irrespective of whether they are permanently or temporarily employed andwhether they work full time or part time.
ZAP/M – Monthly Report on Earnings and Persons in Paid Employment in Enterprises,Companies and Organisations.

50 FACTS ABOUT WOMEN AND MEN IN SLOVENIA
Name of country ISO code
TOTAL EU-15 EU-15TOTAL EU-25 EU-25Austria ATBelgium BECyprus CYCzech Republic CZDenmark DKEstonia EEFinland FIFrance FRGreece GRIreland IEIceland ISItaly ITLatvia LVLithuania LTLuxembourg LUHungary HUMalta MTGermany DENetherlands NLNorway NOPoland PLPortugal PTSlovakia SKSlovenia SISpain ESSweden SESwitzerland CHUnited Kingdom UK
LIST OF COUNTRIES: NAMES AND THEIR ISO CODES (ISO 3166)
51FACTS ABOUT WOMEN AND MEN IN SLOVENIA
HOW TO OBTAIN STATISTICAL DATA AND INFORMATION?
• on Statistical Office’s website
www.stat.si
• via mail, phone, fax or e-mail
address: Statistical Office of the Republic of SloveniaVo`arski pot 12, 1000 Ljubljana, Slovenia
phone: +386 1 241 51 04
fax: +386 1 241 53 44
answering machine: +386 1 475 65 55
e-mail: [email protected]
• by ordering statistical publications
address: Statistical Office of the Republic of SloveniaVo`arski pot 12, 1000 Ljubljana, Slovenia
phone: +386 1 241 52 84
fax: +386 1 241 53 44
e-mail: [email protected]
• by visiting the Information Centre
office hours: Monday to Thursday from 9.00 to 15.30
Friday from 9.00 to 14.30

52 FACTS ABOUT WOMEN AND MEN IN SLOVENIA