Factors That Influence the Selection of Electric Motor ...
58
, • • .' •• 'o" • ' \; Factors That Influence the Selection of Electric Motor Drives For Natural Gas Compressors .. F:"9906:· Prepared for The INGAA Foundation, Inc., by: Robert J. McKee RayD. Durke ChIistopher A. Kuhl Southwest Research Institute 6220 Culebra Road San Antonio, 'IX 78228-5166 . .. . . . ..• , .. Copyright © 1999 by The INGAA Foundation, Inc.
Transcript of Factors That Influence the Selection of Electric Motor ...
, • • .' •• 'o" • ' ~.. \;
Factors That Influence the Selection of Electric Motor
Drives For Natural Gas Compressors
.. F:"9906:·
Prepared for The INGAA Foundation, Inc., by: Robert J. McKee RayD. Durke ChIistopher A. Kuhl Southwest Research Institute 6220 Culebra Road San Antonio, 'IX 78228-5166
. .. . . . ..• , .. Copyright © 1999 by The INGAA Foundation, Inc.


EXECUTIVE SUMMARY
This report provides a summary and analysis of the strategic, engineering, and economic factors
that currently influence the selection of electric motor drives (EMD) for natural gas compressors,
and provides an industry-based consensus on the future use of EMD. The industry consensus
was derived from a survey of INGAA Foundation members and other industry representatives
who are recognized authorities on gas compression and drive systems.
The survey shows that while EMD have certain very desirable features (emission compliance,
low capital and maintenance costs, controllability, etc.), the cost of electric power normally
precludes their use in all but specific cases (e.g., when environmental issues are sufficiently
critical to justify their added energy expense, or where electric power rates are unusually low).
Industry respondents indicated that fueVpower costs often constitute a large percentage (over 50
percent) of the unit's life cycle costs, and that electric power rates on the order of 2 to 3.5
centslkW hour would be required to make EMD cost competitive with present day gas turbine or
engine drives.
Nevertheless, industry projections show that the use of EMD will maintain recent rates in the
foreseeable future and will constitute some 17 to 25 percent of the six to seven million
horsepower that must be added by the year 2010 to meet projected domestic gas demands. Gas
turbine drives are projected to provide some 75 percent of this horsepower, with recipunits
playing a smaller role.
Virtually all of the negative evaluation factors for EMD were associated with "fuel" costs (i.e.,
the base cost of electric power, high demand charges, the cost of the transmission infrastructure
required to get electric power to the compressor site, and the inability to negotiate effective long
term "customer-service" oriented power contracts). So long as natural gas is valued primarily as
a fuel, it seems unlikely that electric rates can compete - even with deregulation of the electric
power industry.
Factors that Influence the Selection of Electric Motor Drivesjor Natural Gas Compressors SwRI Project 18-2090 .
Page ii April 1999


TABLE OF CONTENTS
INTR 0 D U CTI 0 N .......................................................................................................................... 1
OBJECTIVES OF STUDy ...............•...........•...•............•.••............•.............•.........••.•....•..............•.••... .1 APPROACH ...........................................•........................................................................................ 1 BACKGROUND ................................................•.....••...•.................................................................. 2 OVERVlEW OF RESULTS ................................................................................................................ 4
EMD SELECTION FA CTO RS .........................•.......................................................................... 6
MAJOR FACTORS ....... ; ...............................................•....................•............................................. 6 OPERATIONAL FACTORS ...................•........................................................................... , .......•....... 7 RELIAB1LITY FACTORS ..............................................•......................................................•.•.•........ 8 ENVIRONMENTAL FACTORS .......................................................................................................... 9 ECONOMIC FACTORS ................................................................................................................... 10
SURVEY RESULTS ................................................................................................................... 12
. QUESTION 1 ................................................................................................ ,. .............................. 12 QUESTION 2 ................................................................................................................................. 13 QUESTION 3 ................................................................................................................................ 19 QUESTION 4 ................................................................................................................................ 21 QUESTION 5 ................................................................................................................................ 24 QUESTION 6 ................................................................................................................................ 25 QUESTION 7 ................................................................................................................................. 25 QUESTION 8 .....................................•.......................................................................................... 28 QUESTION 9 .............................................................................................•.................................. 29 QUESTION 10 .............................................................................................................................. 29 QUESTION 11 .............................................................................................................................. 32 QUESTIONS 12 AND 13 ................................................................................................................ 32
ANALYSIS OF RESUL TS ................. ~ ...................................................................................... 35
DECISION FOR DRIVER TypE ....................................................................................................... 35 EFFECTS OF INDUSTRY GROWI1:I ...................................................................................•............. 36
CONCLUSIONS ......................................................................................................................... 38
APPENDIX A ............................................................................................................................. A-I APPEND IX B ............................................................................................................................. B-l
. Factors that Influence the Selection of Electric Motor Drivesfor Natural Gas Compressors SwRI Project 18-2090 .
Page iii April 1999
FIGURE 1. FIGURE 2. FIGURE 3.
FIGURE 4.
FIGURES.
FIGURE 6.
. FIGURE 7.
FIGURE 8.
LIST OF FIGURES
PERCENT OF COMPANIES TI:lAT CONSIDER EMD FOR COMPRESSOR SERVICE ............ 14 PROBABILITY FOR SELECTING EMD FOR A PARTICULAR ApPLICATION .................... 15 PROBABILITY OF SELECTING EMD FOR VARIOUS COMPRESSOR STATION
SCENARIOS ................................................................................................................ 19 COMPANY ADDED HORSEPOWER BY DRIVE TYPE FOR PAST, CURRENT, AND
FuTuRE yEARS ......................................................................................................... 22 STRENGTI:I OF FACTORS IN FAVORING GAS OR ELECTRIC COMPRESSOR
DRIVES ...........................................•........•.•................................................................ 23 THE OVERRIDING STRENGTI:I OF FACTORS FOR OR AGAINST TIlE SELECTION
OFEMD .................................................................... ~ ................................................. 27 RELATIVE COST DIFFERENCE FOR FuEL AND POWER, OPERATION AND
MAINTENANCE, AND INSTALLATION COSTS BETWEEN EMD AS POSrTIVE
AND GAS AS NEGATIVE FOR LOWER COST ......... ~ ...................................................... 31 RANKING OF OBSTACLES TO TIlE USE OF EMD FOR GAS INDUSTRY
COMPRESSOR DRIVES ............................................................................................... 33
Factors that Influence the Setictiim of Electric Motor Drives!or Natural Gas Compressors Page iv AprilJ999 Sw!U Project J 8-2090 .. . .. .

TABLE 1.
TABLE 2. TABLE 3. TABLE 4. TABLE 5.
TABLE 6.
TABLE 7.
LIST OF TABLES
THE FACTORS THAT INFLUENCE THE USE OF ELECTRIC MOTOR DRIVE
COMPRESSORS ............................................................................................................. 6 PROBABll..ITY OF SELECTING EMD BY APPUCATION ............................................... ;.13 PROBABll..ITY OF SELECTING EMD BY SITUATIONS .. : ................................................ 17 A VERAGE ANNUAL HORSEPOWER INSTALLATION BY CATEGORY .............................. 19 THE OVERRIDING INFLUENCE RATING OF FACTORS FOR OR AGAlNST EMD;
POSmvE FOR EMD, NEGATIVE FOR GAS ................................................................... 26 COST FACTOR DIFFERENCES FROM SURVEY REsULTS (NEGATIVE
DIFFERENCES FAVOR GAS DRIVES) ............................................................................ 30 RATING OF OBSTACLES TO THE USE OF EMD ............•..........•................................... .32
Factors that InjZuencerhe Selection of Electric Motor DrivesjorNaturalGas.Compressors SwRI Project 18-2090
Page v April 1999


INTRODUCTION
Objectives of Study
The objectives of this study are to define and quantify the factors that influence the selection of
Electric Motor Drives (EMD) for compressors in the natural gas industry and to identify the
advantageous characteristics of electric drives for various applications. This INGAA
Foundation-supported investigation identifies relevant selection factors, collects data from the
industry, and analyzes the decision process for selecting EMD over more traditional (IIe) engine
orgas turbine units. Both qualitative and quantitative selection factors are presented, together
with a projection of future EMD installations as the industry grows during Jhe next 5 to 10 years.
Approach
Most of the significant factors involved in selecting a compressor drive are identified in recent
industry publications, symposia, and workshops conducted specifically for the exchange of
information related to the choice and use of electric and other types of compressor drives. One of
the active symposia in this area is an annual GaslElectric Partnership event sponsored by EPRI
and others. The major factors described in this report were derived from these sources, from
discussions with industry representatives, and from an industry survey that asked respondents to
confirm, expand, and comme~t on EMD selection criteria. The salient factors are discussed later
in this report.
An important part of the study was an industry survey designed to collect and compare
quantitative and opinion data from industry personnel who have been, are, or will be involved in
the selection of natural gas compressor drive systems. The survey was sent to all INGAA
member companies with the intent that companies involved in the selection of compressor drives
would respond. In addition, the survey was sent to members of the GaslElectric Partnership
referred to above, and to members of the PRe! Compressor Research Supervisory Committee.
FactOrs that influence ihe Selection of Electric MotOr Drives forNatural Gas Compressors SwRI Project 18-2090 .
Page 1 April 1999

These groups include the majority of identifiable industry experts on the selection, application,
and design of electrical drives and compressor systems.
A significant response representing the position of the natural gas industry is provided by the
Survey results. In addition, the survey explored the decision process used for selection of
compressor drives. The prevailing decision processes are identified and explained in this report,
and the major factors are used as a basis for analyzing and estimating future use of EMD
systems.
Background
The projected growth in the demand for natural gas is expected to reach some 30 TCF by the year
2010 or shortly thereafter, and the supporting increase in gas supplies, dictate a substantial
corresponding increase in natural gas compression in the next 5 to 10 years, involving most of
the major operating companies. In addition, the deregulated business environment and customer
demands will require that planning for this increase in capacity be innovative, flexible,
environmentally sensitive, and economically justifiable. In view of this situation, the INGAA
Foundation requested a study of the factors that influence the use of EMD. It is expected that the
collection of information and perspective in this report will provide at least a checklist for
industry's use in selecting equipment best suited for projected expansion needs.
Both DOE and GRI concur in the projected demand of 30 TCF by the year 2010 or a few years
thereafter, and that the major increase in demand will occur in the Northeast and Midwestern
United States. Increases in the ,supply of natural gas will come largely from Canada and the Gulf
of Mexico, and substantial increased pipeline capacity will be required to get this gas to market. ,
The customers who make up this growing demand are largely open market customers, such as
electric power producers, niche market manufacturers, and local distribution companies (LDC's)
who also experience competitive pressures and need flexible, responsive fuel supplies and
suppliers. To meet these market demands in the current competitive business environment, gas
companies will need not only increased compression capacity but additional pipeline flexibility,
" . Factors thtltlnjluerice the Selection a/Electric Motor DrivesjorNaturalGas Compressors SwRI ~roject 18"2090 ' , .
Page 2 April,1999. _,

increased storage capacity, and spur pipelines that are responsive to rapid swings in demand.
These requirements add up to an increase in compressor horsepower needed along the pipelines
and at specific market locations.
Environmental concerns at compressor stations and gas storage facilities (including nOIse,
appearance, and emission compliance) are major factors when installing a new compressor drive.
For many compressor locations, both the environmental regulations and the neighborhood are
changing, requiring more detailed control technology at new and existing pipeline facilities. In
non-attainment areas where permits for new or additional emissions are difficult and time
consuming to obtain, the use of EMD can substantially eliminate the concern for environmental
emissions from the station. Usually, EMD also produce lower noise levels and have less adverse
visual impact on a station's surroundings.
The decisions on what types of compressors and drivers to install, including the potential use of
Electric Motor Drives (EMD) , are controlled by economic, environmental, and operational
requirements and take advantage of the latest technology changes. Operational requirements
include load and type of duty, operating schedule, reliability, availability, staffing and control
issues. EMD can, of course, be applied to gas transmission lines, gas storage facilities, or other
gas delivery situations, and can be used for either new or replacement horsepower. The schedule
on which a compressor installation must be completed is another major factor in the selection of
compressor and drive units, together with capital, maintenance, operating, and fuel costs. These
and other factors are described and discussed as a result of the survey.
In comparison to the traditional gas fired reciprocating engines and gas turbine drives, electric
motors can have lower installation costs and certainly lower site-specific emissions. Operating
range and flexibility can be addressed with electric motors using variable speed drive technology,
which has improved significantly in the past ten years. The reliability and O&M costs for
electric motors are favorable aspects. The availability and cost of electric power for large
motors, however, are potential negative factors for the use of electric motors-at least at some
sites.
<Pat:tQrstJlatlnjZaence iheSi(eetiori of Electric "M()tor Drives!orNatural Gas c;ompressors 00 "
SwRI ProjeCt 18-2090 L ; , 00
0
~. ,
Page 3 0"
April 1999

A significant number of successful EMD installations for natural gas compression exist in the
industry today. There are an estimated 130 EMD units currently in use. Many of these
installations have been selected because of environmental restrictions or noise considerations at
the station involved. At one compressor station, only electric drives were able to satisfy the
concern of the neighbors relative to fugitive emissions, noise, and appearance. At another
compressor station, an older unreliable unit was replaced with an EMD, with a resulting
improvement in reliability and emissions. Some have been installed because of low capital cost,
relative short lead times, or operational flexibility of the unit. At a gas storage facility that
supplies a large power plant, the flexibility of series/parallel EMD compressors using off-peak
electric power provides an economic means to ensure gas supply for the power station. There
have also been a number of cases where cost factors and other factors (such as no available,
nearby high voltage power lines, or the inability to obtain long term, reliable, low-cost power
contracts) have prevented the use of EMD. This study is intended to evaluate the influence of
each of the major factors and the effect on the future trends for selecting electric motor
compressor drives.
Overview of Results
In summary, the major observations from the study are as follows:
• EMD are considered for most compressor drive applications, but normally they are installed·
only where environmental considerations are overriding, and in a few others cases where
operational and cost factors are favorable.
• The capital and maintenance costs of EMD are lower than for conventional drives, but for
. most situations, the cost for electric power is significantly higher than that for fuel gas.
• EMD will generally not be used where:
electric power service is not readily available,
where demand charges are restrictive, or
where the electric power costs are relatively high.
. . '. Facrorstlzat liif/uend'the Selection 'ojElectric Motpr1)rives!orNatural Gas Compressors . ,SwR(ProjectJ 8~2090 .' ", '.:.. ...
.: ! ! .
Page 4 April 1999
: .. I.·; .: ,.

• The primary use for EMD is presently in locations and situations where the environmental
requirements are the dominant concern. In such cases, EMD are used even when the power
cost factors are not favorable.
• . Based on projections of the gas industry growth to the year 2010, electric motor drives will
account for some 17 to 25 percent of approximately 6 million more horsepower to be
installed.
• The cost of electrical power and high demand charges are the most significant obstacles for
the use of EMD. A large number of the surveyed companies would use more EMD if
electrical power costs were 3.0 cents/kW hour or less.
'. FaCtOrs thdilnjluence the Selectiiinyj!ElectricMoror DrivesjorNatural GasCompressots:, SwRI Project 18-2090' . .' . .
,,<:Page~5 April 1999

.. : .
EMD SELECTION FACTORS
Major Factors
The factors that influence the selection of EMD are listed in Table 1, under four major headings:
Operational, Reliability, Environmental, and Economical. While other names can be put on most
of these factors, the list includes (by one name or another) essentially all of the factors identified
in this study that were cited by industry as influencing the selection of compressor drive types for
various transmission and storage applications. The importance of individual factors can change
for different installations or configurations. However, from a broad point of view, the important
factors remain fairly constant.
Table 1. The Factors that Influence the Use of Electric Motor Drive Compressors
Operational Factors Required Flow Rate and Flow Rate Range Total Required Horsepower
Type of Compressor Control and Automation Requirements Compatibility and Company Experience
Reliability Factors Reliability of Drive Power or Fuel Availability Duty Cycle, Availability, and Operating Hours
Environmental Factors Emissions Compliance
Noise and Neighborhood hnpact
Economic Factors Fuel1Power Costs
Efficiency Maintenance Costs
Capital Costs (including installation and instrumentation) Operational Costs (other than fuel and maintenance) Delivery/Construction/Startup Time
'.Pacidrsihatlnjluencethe SelectionojElectric Motor DiiVes jdrNatural GaiCqtrlpressorS .. ... . SwR(Project 18-2090" .' . . . .
"Pa"e6' . ...... . g ... . April 1999
'",;'- .. :
Operational Factors
The operational factors are often related to compressor types and design or engineering issues.
At pipeline compressor installations, system demands such as maximum flow rate, flow rate
range, suction and discharge pressures (compression ratio) have a major influence on the type of
compressor selected. In tum, the type of compressor (reciprocating, centrifugal, or rotary) has a
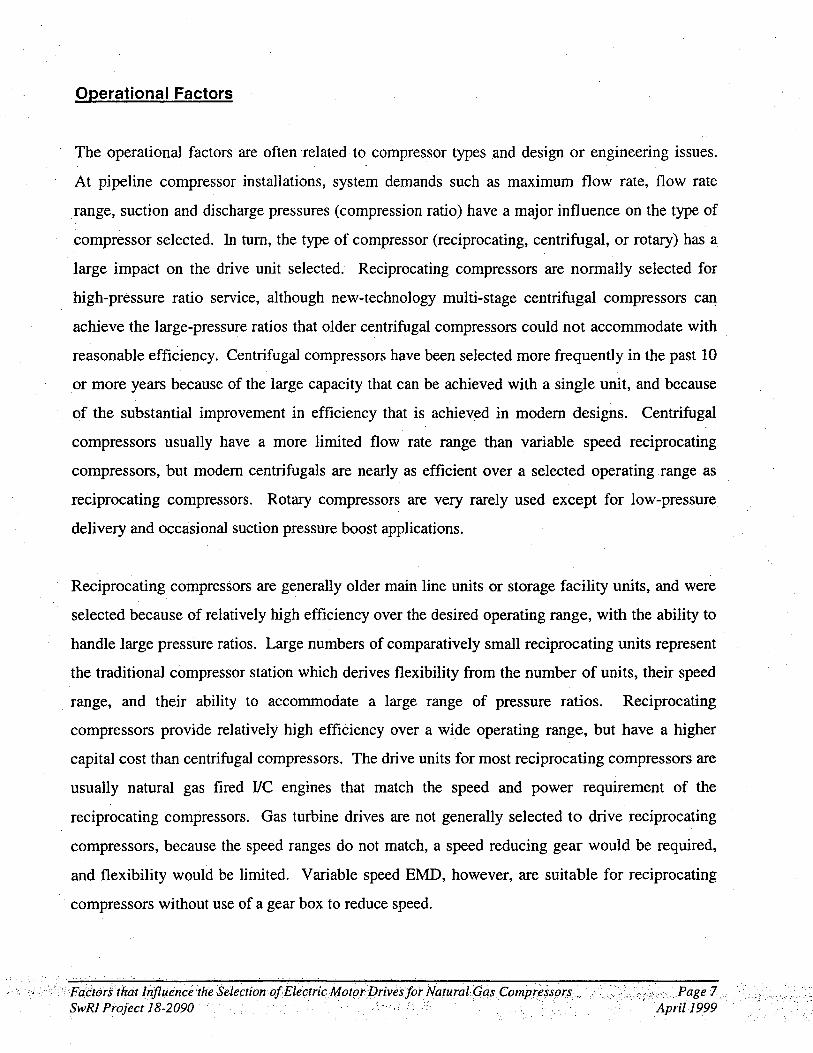
large impact on the drive unit selected. Reciprocating compressors are normally selected for
high-pressure ratio service, although new-technology multi-stage centrifugal compressors can
achieve the large-pressure ratios that older centrifugal compressors could not accommodate with
reasonable efficiency. Centrifugal compressors have been selected more frequently in the past 10
or more years because of the large capacity that can be achieved with a single unit, and because
of the substantial improvement in efficiency that is achieved in modem designs. Centrifugal
compressors usually have a more limited flow rate range than variable speed reciprocating
compressors, but modem centrifugals are nearly as efficient over a selected operating range as
reciprocating compressors. Rotary compressors are very rarely used except for low-pressure
delivery and occasional suction pressure boost applications.
Reciprocating compressors are generally older main line units or storage facility units, and were
selected because of relatively high efficiency over the desired operating range, with the ability to
handle large pressure ratios. Large numbers of comparatively small reciprocating units represent
the traditional compressor station which derives flexibility from the number of units, their speed
range, and their ability to accommodate a large range of pressure ratios. Reciprocating
compressors provide relatively high efficiency over a wide operating range, but have a higher
capital cost than centrifugal compressors. The drive units for most reciprocating compressors are
usually natural gas fired IIC engines that match the speed and power requirement of the
reciprocating compressors. Gas turbine drives are not generally selected to drive reciprocating
compressors, because the speed ranges do not match, a speed reducing gear would be required,
and flexibility would be limited. Variable speed EMD, however, are suitable for reciprocating
compressors without use of a gear box to reduce speed.
" ....• ' ··"Failors thtit lnJluenc~,theSelection ofElef:tricMot()r·Drives!or NaturalQasComPressors .. ·· .... Page l. SwR/ Profeet /8-2090 .' , ':: April /999

Centrifugal compressors are usually selected when a large capacity and low (fairly stable)
pressure ratio is required. Under such conditions, centrifugal compressors usually represent a
lower installed cost than reciprocating compressors for the same conditions. These types of low
head, high flow conditions usually occur at main line stations operating with fairly stabilized
conditions. The operating range of a centrifugal compressor is limited by aerodynamic design
factors, operating speed limits, and surge. Surge is a flow instability that limits the turndown or
minimum flow of a unit to 25 or 30 percent below the design flow rate. One means of
overcoming surge is to recycle flow from the discharge back to the suction to maintain a
minimum flow through the machine; however, this is very costly in terms of wasted horsepower.
Gas turbine engines are usually used to drive centrifugal compressors because·of the continuous
high-speed operation. EMD are suitable for centrifugal compressor drives, but may need a gear
type speed increaser for higher speed compressors.
In some cases, the type of compressor selected is influenced by the total amount of horsepower
per unit. Reciprocating units are generally in the 400 to 12,000 horsepower range. (Because
operating speed is relatively low, their physical size becomes unmanageably large for higher
horsepower levels.) Centrifugal compressors tend to come in larger sizes of 1,500 to 40,000
horsepower or more. There are exceptions to these general rules; however, one large centrifugal
can usually provide the compression horsepower of several "large" recip compressors. Other
operational factors that influence the details of compressor selection and installation are how they
will be controlled, the degree of automation required,. and the compatibility with other
compression equipment and experience within the operating company.
Reliability Factors
Reliability of a compressor unit and its driver are major concerns to pipeline operating
companies. The. economic loss from compressor down time can be significant. Reliability of the
fuel supply (whether it is natural gas or electrical power) can be a significant part of that overall
compressor reliability. Both scheduled maintenance and unscheduled operational failures are
important in this regard,but the adverse effect of scheduled maintenance can usually be
. "., ., ·':·,'FaCtotsthatlnjluerice;heSelectioti"ojElectric Motor: Driv,es!Or Natu ral Gas Compressprs .. SwRI Projed 18-2090 ' r, '. '. .
. 'J,' ,.,,: PageS April 1999

minimized by proper scheduling; Operational reliability is therefore very important, and can be
affected by start-stop operation, cool down sequences, and other operational and maintenance
factors. If a machine runs for long continuous periods or for many short cycles, and whether
these changes are regular or random, have a potentially large impact on the reliability of a drive
unit. EMD can be technically advantageous when frequent start/stop operations are required, but
electrical demand charges may become prohibitive under such conditions.
Environmental Factors
Environmental regulations (such as provisions of the Clean Air Act and other state and local
regulations) can provide restrictions on the amounts of specific pollutants that are released at
certain sites. Title IV of the Clear Air Act limits the amounts of nitrogen oxides (NOx) and
sulfur dioxide (S02) that can be released from selected sites. These are particularly important
considerations in the Northeast and Midwest U.S., but can affect other areas as well. Under Title
I, the ambient air quality including ozone, CO2, and particulate matter are limited in such a way
that certain geographical areas (non-attainment zones) have significant restrictions on new
sources, while other areas are not noticeably affected. Federal regulations also require that each
state develop, and implement a program for issuing site permits for air emissions. Even where
the permit process is not restrictive, it can be time consuming and costly. Each compressor drive
project has its own magnitude of influences from environmental factors.
The neighbors that are near a potential compressor site can also have a significant influence on
the requirements for a compressor drive. The urbanization of rural communities has substantially
increased the emphasis on controlling emissions and noise and for assuming visual compatibility
of compressor installation with the surrounding neighborhood. Air pollution, noise pollution,
and general appearance have become more of a sensitive and restrictive factor.EMD can
sometimes be used to successfully address these types of issues.
,. Fa:ctorSthdtltiflitence'ihe SeleCiion'ojElectdc Moror Drivlfs for NaturalGas Compress'Ors ">::, ".,.,:;.' ,Page 9, SwRIProject 18-2090. ' ., ". ,.' , , April 1 999,
.... :,. ,i v '.

Economic Factors
Cost elements always have a major influence on any compressor and drive selection. In most
cases, the total combined lifetime cost of each option is compared to determine which option is
most economical. The factors considered in determining the life cycle cost of a compressor
drive, as defined for this study, are capital (installed) costs, maintenance costs, operational costs
(other than maintenance and fuel), and fuel or power (energy) costs. The efficiency of a unit in
producing flow for the expenditure of fuel is considered in the fuel costs to meet the project
requirements. Capital costs include the purchase cost of equipment, project installation cost,
project engineering costs (in some cases), and other costs that will be financed over a period of
time (e.g., electrical substations and transmission lines). The source, financing, and amortization
of capital costs for a particular project can influence the significance of capital costs.
Maintenance costs for different types of compressor drives vary substantially and affect the
relative life cycle cost of the drive. Reciprocating engines generally experience regular (annual)
maintenance costs that adds up to a large cost over the life of the engine. Gas turbines
experience once-per-overhaul costs (every few years) that are larger amounts than for other types
of drives. EMD consistently have noticeably lower maintenance costs than other types of drives.
In several recent studies by operating companies, the cost of large electric motors with their
electrical switch gear and high voltage transmission equipment was higher than equivalent gas
turbines until the maintenance costs were included. The significant maintenance costs can cause
a gas turbine unit to be more costly in the long term.
Operational costs (other than maintenance and fuel) include staffing costs and perhaps
specialized personnel that must be on station or available. Reciprocating engines generally
require a higher level of routine manning than other drivers, and gas turbines can require skilled
staff - particularly if frequent start and stop operations are involved. Electric motors can be
operated with very low staffing requirements; however, many of the skills required are not
generally available to traditional natural gas companies. Additional economic elements result
. Filctars'iliat1'njluenee:theSeLeCt'ibii 'ofEleetTic Motorbri~e.sf(/r Natural Gas Compressors . SwRIProjed 18"2090 ~ .:::'
.,ptigil(J '. Aprili999
'\'" f :

from time restraints on project delivery, construction, and start-up schedules. All of these cost
elements must be evaluated and compared for each individual compressor drive selection project.
Fuel cost is usually the deciding influence on the cost comparisons for compressor drive projects.
Fuel cost differences accumulated over tens of thousands of operating hours in a compressor's
life is usually the dominant cost element in a project. A small difference in the expected or
assumed cost of fuel or power has a large effect on the analyzed cost of a project. Most
published comparisons of fuel and power costs obtained during this study agree that where
natural gas fuel costs are just over $2 per decathem ($2.35 DT), the equivalent cost of electrical
power is' approximately 3 to 3.5 centslkW hour. To be equal, these costs need to include any
demand charges or similar service fees. This survey of the industry and recent contacts with
industry representatives indicate that for most compressor drive selections at this time, electrical
power is at a cost disadvantage compared to natural gas, and costs approximately 4 to 5 centslkW
hour. This situation may change in the future if electrical power costs decrease as a result of
deregulation .
.. ', , .... ;F(iciors~tlwtinfluenc{the Selection 'of ElectriC Motor Dr.ives}or NaturafGas Cornpres,s~rf' SwRI Projeci 18-2090 ~j' ......) . ". .. • '~I .. ' .' ..
. Page:11 Aprii1999

',"'·r"':
SURVEY RESULTS
A strong response was received from INOAA Foundation members, including 13 companies or
roughly 72 percent of the INOAA pipeline operating members. In addition, 9 responses were
received from technical committee members with a few from the same companies, and most
from additional operating companies. The surveys to INOAA Foundation company
representative were sent by the INOAA office. Other survey forms were mailed to OaslElectric
Partnership members and PRC] Compressor Research Supervisory Committee representatives.
A total of 22 survey responses were received and evaluated, which represents a significant share
of the total natural gas pipeline operating companies in the U.S. The total pipeline mileage
represented by the respondents includes 82 percent of the gas transmission piping in the U.S. A
copy of the survey form is included in Appendix A.
Question 1
Survey responses for the first question indicate that Electric Motor Drives (EMD) are considered
as potentially viable options for compressor drives by 92 percent of the INOAA member
companies who responded, and by over 90 percent of all respondents. Variable speed electric
drives receive more consideration than fixed speed drives according to the survey. Of the 22
responses, 18 consider variable speed drives for projects, and 11 consider fixed speed drives. In
other words, variable speed drives are considered for approximately 80 percent of the projects,
while the less expensive but less flexible fixed speed electric drives are considered by only 50
percent of the respondents. The selecti~n1evaluation process generally requires about 3 to 4
months, although some companies indicated less than 3 months and a few more than 4 months.
Details from the survey show that 3.9 months is the average for INOAA members and 3.3
months for the other responses. One important indication from the survey comments is that
although 90 percent of companies are, or have evaluated, EMD for natural gas compressors, 6 of
the 22 respondents indicated they will not be considering EM in the near future. Detailed reasons
for not considering EMD in the future were not given; however, this response tends to indicate
'Pag¢12 , . ,'April1999 ....
! .,', ·;FactdrS tharlt1jluenceihiSelectioi/.ojELectnc Motor Drivesfor'N~tur(ll (;(lsCompressors SwRI Project 18-2090 . '. " . '.. ",
• . ~r ~./ .

that EMD are economically unjustifiable in their current circumstances. Figure 1 shows the
percent of INGAA representatives, other representatives, and total respondents who consider
EMD for compressor service. . It can be concluded from this data that electric motors are
receiving consideration as compressor drives.
Question 2
In the second question, first part, the survey respondents were asked to indicate the probability of
selecting EMD in the four different applications: gas transmission, spur' lines or interconnects,
storage/withdrawal, and gathering/distribution. For each company, this should indicate the type
of application for which EMD are most compatible. The responses are shown in Table 2 and \
Figure 2. Gas transmission applications received the highest probability rating l by both INGAA
members and other respondents. The overall probability for transmission service is 56 percent or
realistically a medium probability. Gas storage/withdrawal applications received the second
highest overall probability at 38 percent as an average from all of the responses.
Table 2. Probability of Selecting EMD by Application
Application Probability from INGAA Other Total
Gas Pipeline Transmission 51% 63% 56%
Spur line or Interconnects 26% 48% 35%
Storage / Withdrawal 26% 56% 38%
Gathering / Distribution 8% 30% 17%
However, the INGAA members indicated a probability of 26 percent, while the other responses
indicated a 56 percent probability of using EMD in storage/withdrawal applications. The non-
The manner in which probability is determined is to add 3 points for a high probability vote, 2 points for a medium probability vote, I point for a low probability vote, and 0 for not applicable or not likely. The total number is divided by the total possible points, such that all high probability votes would result in 100 percent. All medium probability votes would equal 67 percent, all low probability votes would equal a 33 percent, and not applicable votes would result in 0 percent.
. -, ',' '; PaCio:tlihiit /njluen.cithe' Seleciion'ofEleCtiic M otorDrives;jot Natural Gas Compressors SwRI Project 18-2090" ; >
, "'::Pqg~13 April 1999

:~:. : " ,
100~~--------~--~----~--------------~------__
90 +I-----~____i
80 I
C :E w '- 70 I Q)
" .-U) C 060 1
o -ca .c - 50 -+1----1 U)
.~ c ca
e- 40 o o '030 -+I--t -C Q) o ; 20 -+---1
C.
10+1---.,
o --'---' INGAA non-INGAA Totd
m Fixed 5 peed
• VaicDIe 5 peed I:i Overdl
Figure 1. Percent of Companies that ConsiderEMD for Compressor Service
Factors that Influence the Selection of Electric Motor Drivesfor Natural Gas Compressors SwRI Project 18-2090
Page 14 April 1999

c 0
:0:: (,)
.!! CI)
CJ) -0 'tJ 0 0 :§ ~ :::i
70%~------·-"'-'
60%+-----
50%
40%
30%
20%
10%
0% Gas Pipeline Transmission Spur line or interconnect Storage/withdrawl
Application
~ INGAA Members
• Non-Members
II Total
Gathering/distribution
Figure 2. Probability for Selecting EMD for a Particular Application
Factors that Influence the Selection of Electric Motor Drives/or Natural Gas Compressors SwRIProject 18-2090
Page 15 April 1999

INOAA respondents may represent senior engineering personnel with particular technology
knowledge or may reflect companies with more storage applications than the INOAA Foundation
members who responded. For whatever reasons, there is a significant difference in the indicated
probability of use for storage/withdrawal application between low for INOAA respondents and
medium for other respondents. The spur line or interconnect application received an overall
probability of 35 percent, a low probability, with a similar but not as wide a diversity of option
between INOAA and non-INOAA responses. Table 2 and Figure 2 indicate that there is a
medium probability that EMD will be used in gas pipeline transmission applications and that the
other applications have, on average, a low probability.
Some of the comments that accompanied these responses were informative. Six of the
respondent's comments pointed out the necessity for near-by-electrical power to make EMD
feasible. Four comments indicated that EMD would only be used where the economic cost of
power was favorable. Four comments indicated that EMD would be used where environmental
restrictions justified the cost and application. Two of the comments indicated EMD are most
suitable for base or constant flow loads. In contrast, two responses indicated that EMD are most
applicable for peak or variable load service. Experience has shown that EMD can be used for
either steady or variable load service, if other factors are favorable.
In the second part of question 2, the survey respondents were asked to indicate the probability of
selecting EMD for certain compressor installations, or for projects where major factors were
identified. Respondents were asked to indicate the probability of selecting EMD for:
• Environmentally sensitive areas,
• Centrifugal compressors,
• Low HP reciprocating compressors,
• High HP reciprocating compressors,
• Peak load services,
• Continuous operations,
• Fixed speed units,
Factorstliat Injluencethe SeleCtiohojElectric Motor Drives /o'r Natu ral Gas Compressors SwRl Project 18-2090 - .' :,.
Page 16 April 1999

• Variable speed units, and
• High reliability (no curtailment) situations.
The results are shown in Table 3 and Figure 3. The situation which received the highest
probability was the environmentally sensitive area, where the average probability was 83 percent
and the INGAA members indicated 92 percent. Accurately, 83 percent is mid way between all
high probability and all medium probability but, in fact, it represents more than half of the
respondents indicating a high probability for use of EMD in the situation where the installation is
an environmentally sensitive area. All other situations received probability ratings between
medium and low. These are (in approximate order) for continuous operations at 58 percent, for
centrifugal compressors and high reliability situations both at 57 percent, for high horsepower
reciprocating compressors at 54 percent, for fixed speed and variable speed units both at 51
percent, and for peak load service and low horsepower reciprocating compressors both at 48
percent. A close examination of Table 3 or Figure 3 will show that in these medium to low
probability cases, the INGAA and non-INGAA respondents did not always agree on the order
(most probable to least probable) but generally did agree on the magnitude of the likelihood of
using EMD for a given situation. The use of EMD is considered only moderately likely for most
situations with the typical types of compressors, services, reliability requirements, and speed
variations. The most significant result from the second part of question 2 is that the industry
considers EMD as a highly probable compressor drive for .installations in environmentally
sensitive areas.
Table 3. Probability of Selecting EMD by Situations
Situation INGAA Non-INGAA Total Environmental Sensitive 92% 70% 83% Centrifugal Compressor 61% 52% 57% Low HP ReciP!ocatinK 39% 59% 48% High HP Reciprocating 47% 63% 54% Peak Load Service 47% 48% 48% Continuous Service 56% 63% 59% Fixed Speed Unit 50% 52% 51% Variable Speed Unit 56% 44% 51% High Reliability Required 58% 56% 57%
Fac'tiirithllt Influence the Selecti6nvfElectricMotorDr;'~esifofNatural Gas Compressors,. ,,' . 'SwRi Project 18-2090 ',., ' '
, fage17 April 1999

.-,,'
c 0
+= u .! ~ c :!!: w -0 "C 0 0 .c Q) ~ ;::j
100% -----_.
'I "!
-~~-.. --.---.---... -
90% ~ INGAA Member
II Non Member 80% ---I ------_ ... _---_ .
.. Total
70%
60%
50%
40%
30%
20%
10%
0%
rlrC:J C:J ei o~ ~C:J C:J ~ ~ ~ & .~ ~ .,,0 <0 0'" 4' If' ;§' ./IIi> ."", ;:\ • ~. , ~ ~ & , , • 0'C:J
'!!'~ "cP i' / ,,,,I> 0~0 ",J> ",I> , o~
$\ ,,~ »,,<;, .~<;, it 0"'" I> "'~ ",<f os:-< #' ,!,'S r'f ~ 4li .~" ,§J .>f> -<:-~ '" " " <J < '" '<' . i§ < Ii' 0
0 .Q< • <" ,<" 0" <' ,<0
. 0" 0" ¢~ " " -l.'" ~~ ~~ ,flJ «0 ~<::' ~~ . ~
'yO ~~ Compressor Installation
Figure 3. Probability of Selecting EMD for Various Compressor Station Scenarios
Factors that Influence the Selection of Electric Motor Drives for Natural Gas Compressors SwRI Project 18-2090
Page 18 April 1999

Question 3
Question 3 deals with the total horsepower that companies have installed recently or plan to
install in the near future. The period of time for which infonnation is requested is the past five
years (1992-1996), the current 3 years (1997-1999), and the next four years (2000-2003). The
yearly average horsepower (installed or planned) for the past, current, and future periods are
shown in Table 4. The total horsepower installed by the surveyed portion of the industry is 583
thousand HP/year for the past 5 years, 613 thousand HP/year for the current 3 years, and a
predicted 154.5 thousand HP/year for the next four years. The lower estimated horsepow~rto be
installed in coming years undoubtedly reflects the uncertainty in long term planning and the . .
uncertainty of the business environment. As discussed later, the amount of horsepower to be
. installed in the future is most likely at least twice what is shown in Table 4, and may be similar to
the past and current years. In any case, a substantial amount of new horsepower will be installed
by the natural gas industry in the next 4 to 12 years.
Table 4. Average Annual Horsepower Installation by Category
Category Past Past Current Current Future HP % HP % HP
Total 582800 612800 154500
Reciprocating 66475 11.4 47975 7.8 17050
Centrifugal 516150 88.6 563000 91.9 119975
Rotary 200 0.03 400 0.07 . 0
Undefined 30900 5.3 28575 4.7 70750
Recip Engine 40150 6.9 14150 2.3 5175
Gas Turbine 465725 79.9 457750 74.7 71050
Electric
Fixed Speed 12250 2.1 27300 4.4 3500
Variable Speed 33800 5.8 85000 13.9 4050
* Reflects uncertain future plans.
FaCtors that ftijlueTzd the SeLectioliojElectric Motor Drives/or Natural Gas Compressors SwRIProject 18-2090 ' .• ' , .. '
Future %
11.0 * 77.6 *
45.8 * 3.3
46.0.
2.3
2.6
Page 19 April 1999
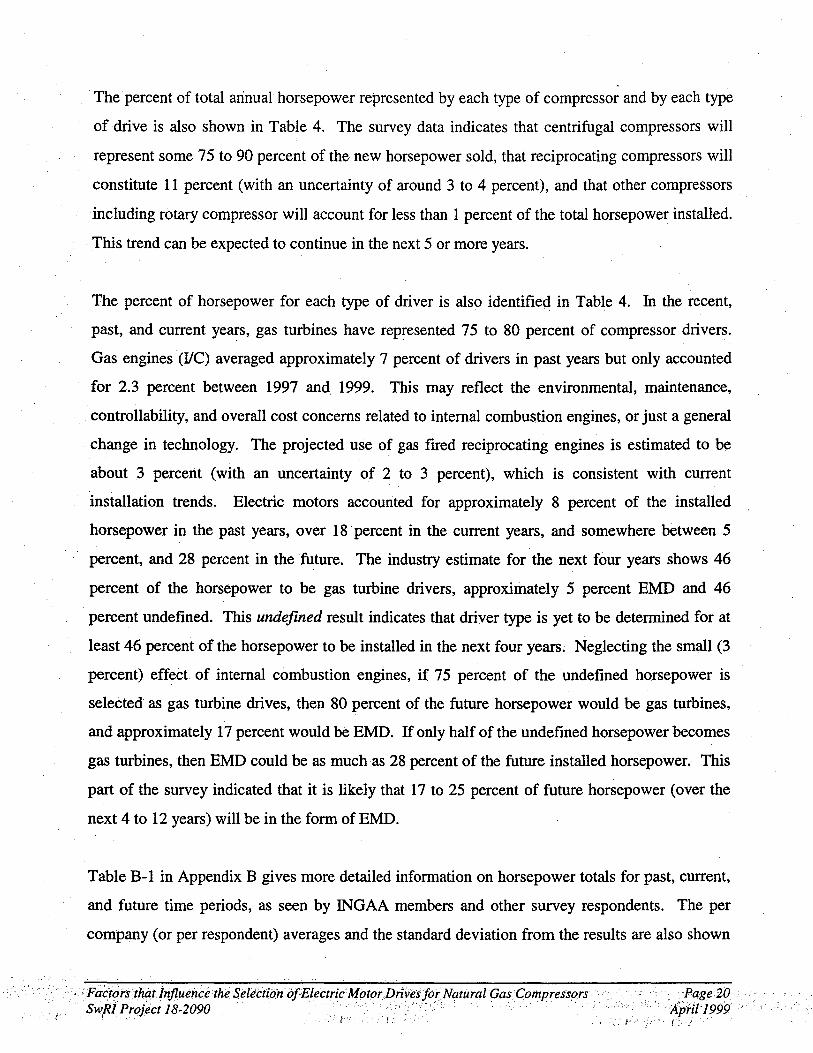
The percent of total annual horsepower represented by each type of compressor and by each type
of drive is also shown in Table 4. The survey data indicates that centrifugal compressors will
represent some 75 to 90 percent of the new horsepower sold, that reciprocating compressors will
constitute 11 percent (with an uncertainty of around 3 to 4 percent), and that other compressors
including rotary compressor will account for less than 1 percent of the total horsepower installed.
This trend can be expected to continue in the next 5 or more years.
The percent of horsepower for each type of driver is also identified in Table 4. fu the recent,
past, and current years, gas turbines have represented 75 to 80 percent of compressor drivers.
Gas engines (IIe) averaged approximately 7 percent of drivers in past years but only accounted
for 2.3 percent between 1997 and 1999. This may reflect the environmental, maintenance,
. controllability, and overall cost concerns related to internal combustion engines, or just a general
change in technology. The projected use of gas fired reciprocating engines is estimated to be
about 3 percent (with an uncertainty of 2 to 3 percent), which is consistent with current
installation trends. Electric motors accounted for approximately 8 percent of the installed
horsepower in the past years, over 18' percent in the current years, and somewhere between 5
percent, and 28 percent in the future. The industry estimate for the next four years shows 46
percent of the horsepower to be gas turbine drivers, approximately 5 percent EMD and 46
percent undefined. This undefined result indicates that driver type is yet to be determined for at
least 46 percent of the horsepower to be installed in the next four years. Neglecting the small (3
percent) effect of internal combustion engines, if 75 percent of the undefined horsepower is
selected as gas turbine drives, then 80 percent of the future horsepower would be gas turbines,
and approximately 17 percent would be EMD. If only half of the undefined horsepower becomes
gas turbines, then EMD could be as much as 28 percent of the future installed horsepower. This
part of the survey indicated that it is likely that 17 to 25 percent of future horsepower (over the
next 4 to 12 years) will be in the form ofEMD.
Table B-1 in Appendix B gives more detailed information on horsepower totals for past, current,
and future time periods, as seen by INGAA members and other survey respondents. The per
comp3.I1Y (or per respondent) averages and the standard deviation from the results are also shown
': : F aciors tliatInjlueitce the Selection of Electric Motor DrIves jor Natural Gas Compressors· SwRIProject 18-2090' " ". '</'.:< " .. ', .'
I . ". /"" !,,,.' .
. page20 "ApiiU 999 ."
, ; t, .,' ,', . 'f: ..

... in Table R .. l. Although the per company averages seem fairly consistent with the totals and the
annual averages in Table 4, it is noted that the standard deviation is fairly high, and corresponds
to a one company level in many cases. The results shown should be considered with an
uncertainty of approximately 10 percent. Despite this uncertainty, responses provided by the
industry show that EMD would have a significant but not dominate use in natural gas compressor
drive systems.
Figure 4 shows the company average horsepower for each type of compressor, for lNGAA
respondents, non-lNGAA respondents and the total for the past, current, and future time periods.
Again, the total horsepower per respondent for the future years may be underestimated because
of the uncertainty related to future projects. The results in Figure 4 show that approximately 75
to 80 percent of horsepower is and will be from gas turbine engines, and that the horsepower for
EMD has grown from 8 to 18 percent and may continue to be some 17 to 28 percent in the next
ten years. The future percentage is obtained by allocating 75 to 80 percent of the undefined
future horsepower to gas turbines and the remainder to EMD. This method neglects the small
effect of internal combustion engines, but clearly indicates that EMD units will have a place in
future compressor drive applications.
Question 4
Question 4 asked survey respondents to numerically rate various factors as favoring gas fired or
electric drives. The scale for answers shows "0 to 5" on the electric side and "0 to 5" on the gas
side, with 5 indicating a· very strong favorable effect for. that factor on the selected side, and 0
representing a neutral influence for that particular factor. The factors in the list for question 4 are
those listed in Table 1 in the discussion of factors. The results are determined as the numerical
average from all respondents with the electric side as negative numbers and the gas side as
positive numbers. Obviously, the sign of the number only distinguishes which type of driver that
answer favors, and allows results from one respondent on the gas side to be balanced by other
results on the electric side. The numerical averages for lNGAA members, non-lNGAA surveys,
and all of the responses are shown as bars on the chart in Figure 5. Since 1 is only slightly
, Factot-Sthat In/fuencithe Selection oj Electric Motor DrivesjorNatuialGas COf1.l.pressoT$ SwRI Project 18 .. 2090 .. . .
Page 21 April 1999

250000 "1-- --_.-'--- ---~---
~
200000 +I-------------t------------t----i Q)
~ o Co Q) C/) o 150000 ::I:
- .---.-~----.---------- --
• Electric Motor
o Gas Turbine
• VC Engine
• Undefined
.' Q)
.'
C) CO ... Q)
> « 100000 >-c: CO Co E o o
50000
o INGAA Non-INGAA
1992-1996
Total INGAA Non-INGAA Tot~1 INGAA Non-INGAA Total
1997-1999 2000-2003
Figure 4. Company Added Horsepower by Drive Type for Past, Current, and Future Years
Factors that Influence the Selection of Electric Motor Drives for Natural Gas Compressors < SwRI Proiect18-2090 .
Page 22 Anri/l000

Others: ._. _________ .... -.-?--.--.---.. ----r---.-----. -.--. -.--.- ---.. -.-~-. --~_~.=~~.~.= .. -.... -.'-- ........... _.._c .................. .
I--------~------ • Non Members With -40% duty cycle
100% duty cycle
Variable speed drives
Fixed speed drives
--·----I---I·iiiiiiiiiiiij~~=---l-·------·--· -.. ---.. -. '-'- 0 INGAA Members
-----=l=~~~~-r--~"E ~=E~==-_:.-.-=~-~ -L--.,_~=:--.:-.. --~~._. __ --~~.~~:~.:-J Equipment delivery time
Maintenance cost
Efficiency
No high voltage power available
, available at station
For peak load
For base load
Fuel I power cost
e-==: .~ .. ..I
No C"Mnmem con~cl. \ ~! ! \ ~,o.'ool awlla~lI~ : 5 ~ i Drive availability .
Em;"lonc~p~.: I I I! i ! .. I I I I I co~~r:IP:~: ::~::~:~ ::::~~II~~I t ====f====f==~~I~~~J~~~~~~~~~::f:~=jr===~
Centrifugal ~ ~ Reciprocating
Type of Compressor I Total compressor HP I ~
Required flow rate -' ~--~---+-------~--------+------===~----+------~--------~------~
-4.000 -3.000 -2.000 -1.000 0.000 1.000 «< Favors Electric ::: Favors Gas »>
2.000 3.000
Figure 5. Strength of Factors in Favoring Gas or Electric Compressor Drives
Factors that Influence the Selection of Electric Motor Drives for Natural Gas Compressors
SwRl Project 18-2090
4.000
Page 23 April /999

favorable and zero is completely neutral,any average results between -1.0 and + 1.0 is
considered to be insignificant (not favoring either type of drive).
Values between 1 and 2 are moderately favorable and the distribution of data indicates that
average results above 2, on either side, are significant factors favoring one type of drive over the
other. The most favorable factors for gas fired engines are no high voltage power near the
compressor station with a rating of 3.4, reliability of fuel availability at 2.4, and company
experience at 2.23. The most favorable factors for EMD are maintenance costs at -2.41 and
emission compliance at -2.18. Thus if no high voltage power is available near a station, an
electric drive is highly unlikely. If emission compliance is essential, EMD will probably be used.
If fuel reliability is a critical requirement, gas fire drivers are likely to be used. If maintenance
. costs are a swing economic factor EMD will be selected. If a company values compatibility with
their traditional equipment and the experience of their staff, they will select gas-fired engines. In
any given decision these factors must be summed on a job-by-job basis, and the results will
depend on the overall situation and the issues that are critical for a given selection.
Figure 5 shows the INGAA respondent and the other respondent average favoring score for the
24 factors that the survey identified. The factors that favor the use of gas engines are: 1) no
high voltage power near the station, 2) fuel reliability, 3) company experience, 4) peak load
service,5) fuel/power cost, and 6) base load use. The factors that significantly favor EMD are:
1) maintenance costs, 2) emission compliance, 3) noise reduction, and 4) fixed speed
compressors. Two other factors that are nearly at the significant level that favor EMD are
efficiency and control and automation capability. The other half of the 24 factors do not have a
significant effect either way on the selection of gas or electric drives.
Question 5
In question 5, the survey participants are asked if deregulation of the electric utility industry has
significantly enhanced the comparative position of EMD. The majority, 11 out of 19 responses,
indicated that it has not. Only 8 of the responses indicated that electric power deregulation
. ,Factors that bijluenceihe SelectionojELectric Motor Drives jor NaturaL Gas Compressors Swi?I Project 18-2090 '
Page 24 April 1999
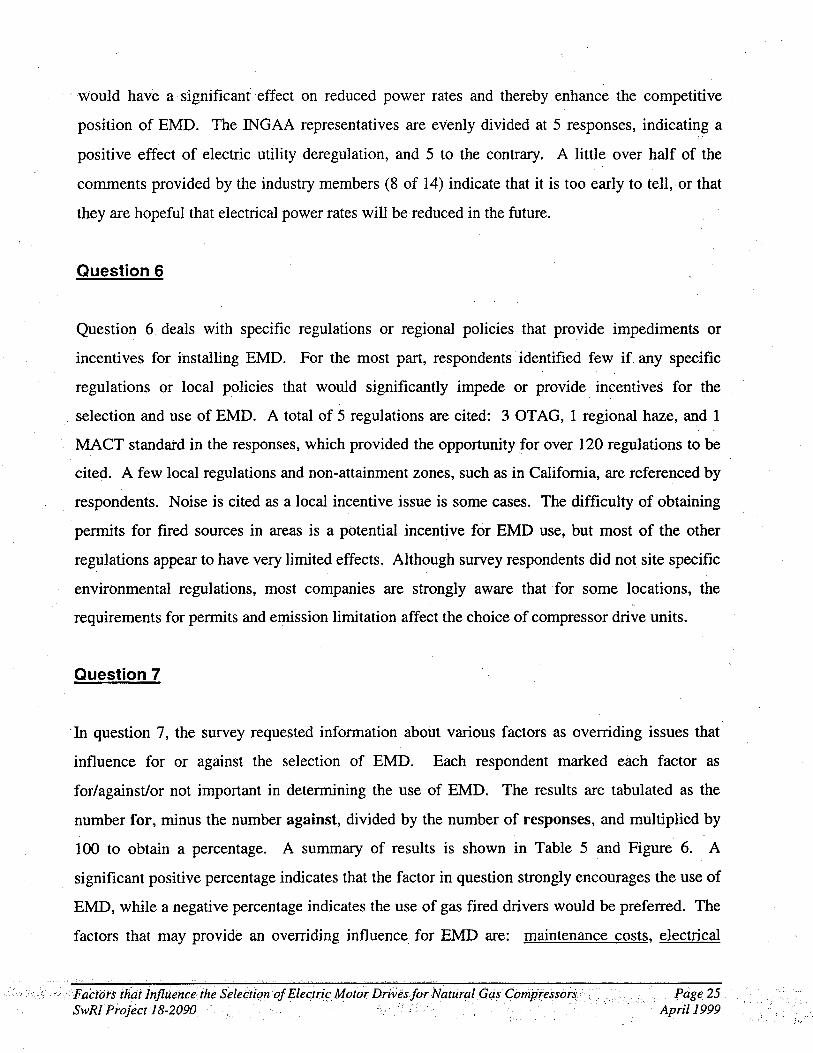
would have a significant effect on reduced power rates and thereby enhance the competitive
position of EMD. The INGAA representatives are evenly divided at 5 responses, indicating a
positive effect of electric utility deregulation, and 5 to the contrary. A little over half of the
comments provided by the industry members (8 of 14) indicate that it is too early to tell, or that
they are hopeful that electrical power rates will be reduced in the future.
Question 6
Question 6. deals with specific regulations or regional policies that provide impediments or
incentives for installing EMD. For the most part, respondents identified few if any specific
regulations or local policies that would significantly impede or provide incentives for the
. selection and use of EMD. A total of 5 regulations are cited: 3 OT AG, 1 regional haze, and 1
MACT standard in the responses, which provided the opportunity for over 120 regulations to be
cited. A few local regulations and non-attainment zones, such as in California, are referenced by
respondents. Noise is cited as a local incentive issue is some cases. The difficulty of obtaining
permits for fired sources in areas is a potential incentive for EMD use, but most of the other
regulations appear to have very limited effects. Although survey respondents did not site specific
environmental regulations, most companies are strongly aware that for some locations, the
requirements for permits and emission limitation affect the choice of compressor drive units.
Question 7
In question 7, the survey requested information about various factors as overriding issues that
influence for or against the selection of EMD. Each respondent marked each factor as
for/against/or not important in determining the use of EMD. The results are tabulated as the
number for, minus the number against, divided by the number of responses, and multiplied by
100 to obtain a percentage. A summary of results is shown in Table 5 and Figure 6. A
significant positive percentage indicates that the factor in question strongly encourages the use of
EMD, while a negative percentage indicates the use of gas fired drivers would be preferred. The
factors that may provide an overriding influence for EMD are: maintenance costs, electrical
FactorStIUiUnjlJencethe S'electionoJ ELectric Motor Drives for Natural Gas Compressors; SwRI Project 18-2090 .. ,,'
Page. 25 April 1999
; ".'

power availability, emission compliance, fixed' speed units, noise reduction, and controllability.
The factors that may provide an overriding influence against EMD are: no high voltage power
available near the station, the cost of electric power versus gas, the availability (reliability and
non-curtailment) of electric power, and the spare parts and familiarity of company personnel
issues. All of the results are shown in Figure 6, where it can be seen that the other factors have
overriding influence magnitudes of 25 percent or less, and are not overriding factors in most
decisions.
Table 5. The Overriding Influence Rating of Factors for or Against EMD; Positive for EMD, Negative for Gas
Factors INGAA Non-INGAA
Emission Compliance 42% 50%
Noise 33% 44%
Community Relations 25% 22%
FuellPower Availability -25% -56%
Customer Requirements 10% 14%
No Curtailment Penalty 0% 13%
Cost of Power versus Gas -67% -78%
Maintenance Cost 75% 78%
Fixed Speed Drive 22% 67%
Variable Speed Drive 18% 11%
Power Available 58% 56%
Power Not Available -83% -75%
Controllability 18% 56%
Compressor Ratio 0% 11%
Spare PartslFarniliarity -27% 0%
Delivery Schedule 20% -22%
Efficiency 30% 0%
. . ,;' FactorS thatlnjluencethe Selection (JfErectric Motor DrivesforNaturalGas c;omptesse{Ts . s~~rProject ! 8-209() , ,", .... :.:. '~". "'"
Total
45%
38%
24%
-38%
12%
5%
-71%
76%
44%
15%
57%
-80%
35%
5%
-15%
0%
16%
.. ' ',"" Page 26 . . 'Ap;;[·1999 .

; ..
Efficiency
Delivery schedule
Spare parts/familIarity of equipment
Compressor ratio needed
Infinite control of variable speed EMD I····
.• - • - - ··1 _._.
··-1······ .-.--.---~ ...... - ......... -- ..
-... -......... -.-. -+_ ...... - ... -.. --.' "-1-' --.. -.--... -
--""--"--'-
I·· ... lIml!· ,,1,,1 .... - -.. -... +- .. -.. --.. -... --.-~--..... -
... -. . ... -.,. ·--····1-·- 1·--·····_· .. --- ... - ..
r-L--.-_ . .L-..... ---.
• Non Members
ElINGAA Members
1 1---'-"'-
When power not available ..• ".. •. , . "" ,,, "" .". ."",, . -------
Power already available at station .''''''iWM~~''' ,"·"u·v.·~" "·~.~·,>w .. ;"""·,.v,,,,.,,·,·.,.,·
Variable speed drive ~."""., I t-==~~-:~ Fixed speed drive =." ... ".,~... ______ .. Maintenance rost I I 1 ~ ! 1~·-~l"'~·~"'E"'E~'·i =~=-= .. Cost of power vs. gas iW""'&'*'W$"$@ "');f"Ww!!,.M"!lmV'#''''iWl',WW''W>rg'W
-------.. -- -
No curtailment/penalty contracts
C~:t::;.:~~::::: 11---II--......;II--.-II--i.-~I,"'t-WW~"~fuwm-.-'-.-"M~ti" .. i,,,,.iiI-tI---tI-. --tl-- {--=~= Community Relations~" ,,"'" .",.".
Noise !11:~'~ "" .";"';;~}:1r~)" ~,,~O>!(·.,f,::·
Emission compliance _~ ,.>" ..... ,.,."
-100% -80% -60% -40% -20% 0% 20% 40% 60%
<<< AGAINST ::: FOR »»
Figure 6. The Overriding Strength of Factors for or Against the Selection of EMD
Factors that Influence the Selection 0/ Electric Motor Drives/or Natural Gas Compressors
SwRI Project 18-2090
.--
80%
PaRe 27 April 1999
100%

From the results of question 7, it appears that if high voltage power is not available within a
reasonable distance, or if the cost of electric power is high, or if there are power reliability or
curtailment issues, or if the operating company cannot overcome the unfamiliarity with electric
equipment, then electric motor drives will most likely not be used. On the other hand, if
maintenance costs are a significant concern, high voltage power is available, emission
compliance is a requirement, the unit is fixed speed, noise reduction is required, or controllability
is an issue, then electric motor drives become a more viable option, and may be required in some
cases. One of the largest differences between responses of the INGAA representatives and the
other industry representatives is in the area of fixed speed drives. INGAA representatives see
that the ability to use a fixed speed unit does not significantly enhance the EMD option (a 22
percent ranking), while the other representatives see fixed speed operation substantially improves
EMD potential (67 percent rating). The advantage of fixed speed operation is, of course, that no
variable speed power supply is needed, and the overall driver cost is substantially reduced.
Similar differences between the INGAA member responses and the other company representative
responses occur in the areas of fuel availability (reliability or non-curtailment), controllability,
spare parts and familiarity, delivery schedules, and efficiency.
Question 8
Question 8 of the survey requested information about the decision process used by the companies .
to select drive units. The responding companies overwhelmingly agree that the selection process
can be characterized as considering a few overriding issues, followed by a detailed cost analysis
of particular issues to compare the drives. Responses showed that two strongly agree, eighteen
agree, one is neutral, and only one disagreed. The comments received included indications that
cost is usually the major factor, that life cycle cost is what is considered, and fuel cost is often 80
percent of the total life cycle cost. The comments also indicated that location of the compressor
installation is an important consideration in terms of availability of power and emission
requirements, and that unless location issues such as emission, noise, or power availability are
significant, cost is the deciding factor. Some of the other factors that are mentioned as part of the
. " . Factors ihatlnfluencethe&lectionofElectric Motor DrivesJorNaturalGasCompressors SwRI Project 18-2090 .
Page 28, April 1999

, decision process are riskfbenefit analysis, and reduced space requirements for EMD over gas
fired drivers;
Question 9
Information about cost differences for fuel/power, operation and maintenance, and installation
for EMD versus gas fired units was requested in question 9. Only about half of the respondents
were able to provide data of this type; however, information from 11 companies about the
relative costs provides a reasonable estimate of the magnitude of cost factors. The information
was requested as a positive percent difference if the EMD unit is less costly, and a negative
percent difference if a gas unit is less expensive. A summary of the total cost differences, as
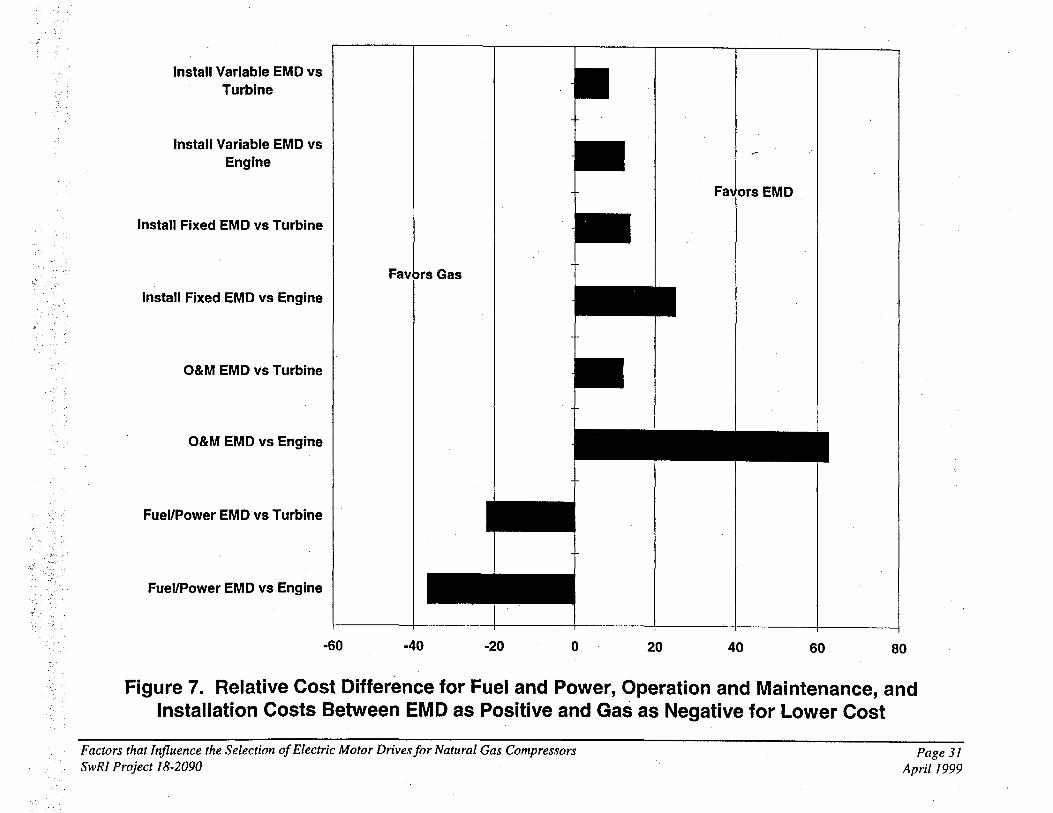
positive and negative percentages, is shown in Table 6. Figure 7 shows the percent relative cost
for each cost category. A more detailed analysis of the cost by each INGAA respondent and non
INGAA respondent, including the number of responses in each category and the standard
deviation of the results, is shown in Table B-2 in Appendix B. The uncertainty in cost estimates
is large and generally of the order of the cost percentage; however, the trends shown by the mean
values are considered representative of industry-wide cost factors. Data indicates that EMD are
less costly to install by approximately 8 to 25 percent, and are less costly to operate and maintain
by 12 to 63 percent. However, electrical power is more costly than fuel gas by approximately 22
to 36 percent. Given that power costs are between 50 and 80 percent of typical life cycle costs
(according to several of the large operating companies), the total cost of EMD over the life of the
unit, as estimated by the survey respondents, is roughly ,17 percent higher than for gas fired units.
Question 10
The survey asked for a rating of the major obstacles for the selection of EMD. Table 7 and
Figure 8 show the results rated on a scale of 0 to 10, with 0 as no obstacle, and lOa complete
obstacle. The potential obstacles for which ratings are requested are high demand charges,
duration of demand charges, cost of supplying electrical infrastructure, cost of power versus gas,
FactOrsthatJhjluence theS'electioizo! Electric Motor Drii.iesfor Natura/Gas Compressors SwRIProject 18-2090 ',' " ' '
page 29 ' ,April 1999 " .... " ' _ t: .'.".

and others~ The industry did fill in two other obstacles of reliability of electrical power and
availability of long tenn power contracts. Table 7 shows the numerical values and Figure 8
provides a bar chart display of the important obstacles in the selection of EMD. The reliability of
electrical power is considered as a significant obstacle, 5.8 out of 10 by INGAA members but not
(lout of 10) by other respondents. The most significant obstacles in the use of EMD (in order)
are the cost of electric power versus gas, high demand charges, duration of demand charges, and
the cost of electrical infrastructure.
Table 6. Cost Factor Differences from Survey Results (Negative Differences Favor Gas Drives)
Cost Factor No. of Responses A verage Difference
Operating Cost (fuel/power only)
EMD vs. Engine 9 -36.6%
EMD vs. Turbine 10 -21.8%
Operation and Maintenance
EMD vs. Engine 9 62.8%
EMD vs. Turbine 10 12.0%
Installation Costs
Fixed Speed EMD vs. Engine 11 25.0%
Fixed Speed EMD vs. Turbine 11 13.6%
Variable Speed EMD vs. Engine 9 12.2%
Variable Speed EMD vs. Turbine 12 8.3%
In the comments associated with this question, industry representatives provided electrical power
costs data from their own studies and analysis. The range of electrical power cost required for a
neutral cost influence is between 2.0 to 3.5 cents/kW hour. The responses show that at least 10
of the 22 surveyed companies would use more EMD if the cost of electrical power was 3
centlkW hour or less.
'"Pactdrs'tltatInjluenchhe Selection of Electric MotorDr{vesfor~Natural Gas Compressors SwR!PtojeCt18,2090 c: ~" ;
, 'fag¢ 3.0.". ,April{~99 ;
-:..."
.~ .-
Install Variable EMD vs Turbine
Install Variable EMD vs Engine
Install Fixed EMD vs Turbine
Install Fixed EMD vs Engine
O&M EMD vs Turbine
O&M EMD vs Engine
Fuel/Power EMD vs Turbine
Fuel/Power EMD vs Engine
-60 -40 -20 o 20 40 60 80
Figure 7. Relative Cost Difference for Fuel and Power, Operation and Maintenance, and Installation Costs Between EMD as Positive and Gas as Negative for Lower Cost
Factors that Influence the Selection of Electric Motor Drives for Natural Gas Compressors SwRI Project 18-2090
Page 31 April 1999

Table 7. Rating of Obstacles to the Use of EMD
Obstacle INGAA Non-INGAA Total
High Demand Charges 7.77 7.00 7.45
Duration of Demand Charges 7.92 5.88 7.14
Electrical Infrastructure Cost 7.31 5.67 6.64
Cost of Power versus Fuel 8.54 8.00 8.33
. Reliability of Electric Power 5.78 1.00 4.58
Long Term Contract Available 5.78 4.33 5.42
Numbers are obstacles rating from 0 to 10; 0 - no obstacle; 10 - maximum obstacle.
Question 11
The survey respondents were asked to identify any additional factors or situations that would lead
to the advantageous use of EMD, and several comments are summarized here:
1. The overall efficiency of electric motor drive systems is good, and they should be
considered for that reason.
2. Advantageous situations include when the electric power company is willing to enter into
a flexible customer service arrangement, where there is a local power generation facility,
and when the compressor unit must come on-line quickly.
3. Installation at noise sensitive locations or with total automation requirements are
candidates for which EMD have advantages. If space requirements are significant or
frequent unit starts and stops are required, EMD should be considered.
Questions 12 and 13
The final questions III the survey requested information about knowledgeable people in the
industry, reference reports or publications, and the company's experience with the use of EMD
.. Factors that Influence theSel~ction of Electric Motor Drlvesfor Natural Gas Compressqrs SwRI Project 18-2090 .
. Page 32 April 1999

0 ,... I
0 tn c 32 c ItS a:
Rating of Major Obstacles for Sel~ction of EMDs
10.00 --.-.-.... ...---.--.--... --------.. ----.--._-------------_._------------------_. __ .. _--_._ .. _----._--_ ... _ ... __ . __ ._. . ................... __ ..... _ ...... _.,
9.00
8.00
7.00
6.00
5.00
4.00
3.00
2.00
1.00
0.00 High demand
charges Duration of demand Cost of supplying
charge electrical infrastructure
III INGAA Members
. ___________ .. _ .. _ .. c _________ .. ,- Non Members
mTotal
Cost of power vs. Reliability of Electric Availability of Long gas power Term Power
Contracts
Figure 8. Ranking of Obstacles to the Use of EMD for Gas Industry Compressor Drives
Factors that Influence the Selection of Electric Motor Drives for Natural Gas Compressors SwRI Project 18-2090
Page 33 April /999

units. A number of industry people with expertise and experience were identified, together with
a number of reports and papers presented through EPRI and the GaslElectric Partnership. No
paper or reports where identified from gas industry conferences such as the A.G.A. Operating
Section Conference: Some of the surveyed companies have fairly extensive experience with
EMD, including dozens of units, while other companies have no actual operational experience .
. FadofslhatIfzjluence the Selection oJElectric Motor DrivesJorNatural Gas Compressors SwRl Project 18-2090 ..
Page 34 April 1999

ANALYSIS OF RESULTS
Decision for Driver Type
When operating companies determine that new, additional, or replacement compression capacity
is required to meet forecast needs in specific services or locations, an engineering team is
assigned the duty of selecting and presenting the best options for that requirement. The major
system decisions prior to a cost comparison are:
1. What types of compressors are best for the service requirement, and what are the
strengths and weaknesses of each option?
2. What are the options to meet the environmental requirements and satisfy the neighbors?
3, What types of compressor drives can be used, and what are the advantages and
disadvantages of each?
Other factors such as project schedule, reliability, flexibility, maintenance, and operations must
be considered, but these are usually outcomes of the major decisions rather than separately
selected features. The compressor type and specifications must be specifically selected, and the
environmental concerns and permitting must be specifically addressed. The compressor driver
that accommodates the first two major decisions must also be specified. Design details, auxiliary
equipment, and drawings are developed and specifics of schedules, flexibility, maintenance, and
operational requirements are addressed once the major options are identified. If specific
concerns or requirements for schedule, reliability, and operating restrictions are identified as a
result of the options, then these may favor or eliminate one or more of the options. The final
major decision for most companies is the economically best option from the remaining choices.
The life cycle cost elements of each of the selected options are considered and summarized, and
the most economical option that satisfies the preceding major decisions are generally selected as
best for the project in question.
Factors that Influence the Seleciionoj Electric Motor Drivesfor Natural GasCompressprs SwRI Project 18-2090
Page 35 April 1999

The overriding issues or factors that most strongly influences a selection one way or another
seem to be (from the survey results) power availability, environmental restrictions, concerns of
the neighbors, reliability of power, and cost considerations. The dominant cost consideration is
cost of power compared to fuel gas, with maintenance and installation costs as lesser additional
elements.
As an example of a selection situation, assume that a reciprocating compressor with a wide
power range is needed for application in an area that is (or may become) environmentally
sensitive. In such a case, the only practical choice for a drive unit to accommodate a wide range
of power variation for a low speed compressor might well be an electric motor .. There are several
documented cases for which EMD were the only potential drive selection due toa zero or
negligible environmental emissions allowance. In other cases where EMD were a potentially
beneficial option, the nearest high voltage transmission line was a large distance away (tens to
hundreds of miles) from the compressor site and, therefore, not available at a reasonable cost.
Effects of Industry Growth
It has been predicted that the natural gas industry in the U.S. will grow to a capacity of 30 trillion
cubic feet of gas per year (TCF) by approximately 2010. The current U.S. gas delivery is nearly
22 TCF, and the projected growth is, therefore, around 40 percent in the next 10 to 12 years. The
natural gas industry currently has a total· compression capacity of around 17.5 million horsepower·
according to A.G.A. A 40 percent increase in this horsepower to accommodate the 40 percent
increase in capacity would be a total increase of 7 million horsepower by the year 2010 or shortly
thereafter. The average growth rate of compressor horsepower during the past 8 years has been
over 550 thousand horsepower per year (see Table 4) which would equal at least 6 million added
horsepower by the year 2010. Even if the industry is able to achieve a slight improvement in
efficiency in terms of millions of cubic feet delivered per horsepower, it is reasonable to assume
that at least 5 million new horsepower, plus some replacement horsepower, will be installed in
the next 10 to 12 years. A nominal growth of 6 million added horsepower can be used with
reasonable confidence .
... Factors:thaf Influence theSeleetioil of Electric Motor Drives/or Natural Gas Compressors . SwRIFrojectl8-2090 . , , .. '.
.. ,. Page 3.6 April 1999.

The effect of the growth of the gas industry on the requirement for compressor drives is,
therefore, significant. If the growth projections from question 4 are correct, then 75 to 80 percent
of this new horsepower (or approximately 4.5 million horsepower), will be gas turbine units.
Most of the remainder, 17 to 25 percent (± 3 percent), or up to 1.5 million horsepower, will be in
the form of Electric Motor Drives (EMD) .
.. . .. Flidors thaf Influence the Selectioliof Electric MotiJr DriVesfor Natural Gas Compressors . SwRIProject 18-2090: i ,
Page 37 April 1999

CONCLUSIONS
Major conclusions from the study are summarized as follows:
1. Industry projections indicate that EMD will account for some 17 to 25 percent of the six
million compression horsepower that will be required to meet expanding domestic gas
demands by the year 2010.
2. Gas turbines are expected to provide some 75 to 80 percent of this added horsepower,
with recip drivers playing a much smaller role.
3. Major factors favoring the use of EMD are:
• Reduced site-specific emission levels and noise;
• Low O&M costs; and
• Low capital costs.
4. Major factors against EMD are:
• Cost of electric power versus natural gas;
• High demand charges;
• . Cost of the electric infrastructure to support EMD;
• Availability of long-term customer-service oriented electric power contracts; and
• Reliability of electric power versus gas supply.
5. The feasibility of EMD is substantially increased when electric power is available at the
site and when fixed speed operation is adequate. In the final analysis, however, electric
power rates of 2 to 3.5 centslkW hour will be required to make EMD economically
competitive.
6. By far the overriding factor favoring EMD is in environmental compliance. Although
capital and maintenance costs are favorable, the total life cycle costs for EMD (adding
. 'FaCfors thaiInjluence the Selection oj Electric Motor Drivesjor Natural Gas Compressors .
. SwRI Projectl8-2090 ;, ... . .. ' . Page 38
April 1999
power to the capital and O&M costs, averaged of the life expectancy of the unit) are
substantially higher than those for gas turbine drives in most cases. Energy costs often
constitute a large percentage (over 50 percent) of the life cycle costs for EMD. Therefore,
EMD are normally justifiable only for those instances where environmental concerns are
sufficient to warrant the higher energy costs.
7. Deregulation of the electric power industry is not expected to significantly enhance the
competitive position of EMD by reduced electric rates. The effect of gas/electric mergers
is unknown, but EMD would seem to add some flexibility in scheduling and peak
shaving, particularly if gas storage is available.
. Factors that Influence the Selection of Electric Motor Drives/or Natural Gas Compressors SwRI ProjeCt 18c:?090 .
~,' :: Page 39 April 1999


Appendix A Survey Questionnaire
. Factors that Influence the Selection of Electric Motor Drivesfor Natural Gas Compressors SwRI Project 18-2090
PageA-I April 1999

Survey of Factors that Affect Decisions to Use Electric Motor Drive Compressors
The Interstate National Gas Association of America (INGAA) is sponsoring a study at SwRIto identify and quantify the factors that affect the selection of electric motor drives (EMD) for gas compression. The objectives of this survey are to define and to compare the factors that influence decisions to install EMD compressors compared to other drivers. Due to your knowledge and experience, we solicit your help to answer the following questions and to provide any additional information that you feel is relevant. Your time and ideas will be greatly appreciated.
1. a) Has your company recently assessed the use of electric motor drives? YES NO
Fixed Speed 0 0 Variable Speed 0 0
b) Do you have plans to do so in the near future? YES 0 NO 0 Comments:. _____________ --'-_________________ _
c) How many months does/will the selection process take? __ _
2. a) What do you consider the probability for selecting electric motor drives in your system in the following applications:
High Medium Low N/A Gas pipeline transmission 0 0 0 0 Spur line or interconnect 0 0 0 0 Storage / withdrawal 0 0 0 0 Gathering / distribution 0 0 0 0
Comments: (When does one type of service favor EM drives over another?)
b) For the following compressor installation considerations, rate the probability or desirability of selecting an electric motor drive:
Environmentally sensitive areas Centrifugal compressors Low HP reciprocating compressors High HP reciprocating compressors For peak load service for continuous operation Fixed speed units Variable speed units For high reliability (i.e., no curtailment)
Others: (describe)
High
o o o o o o o o o
Medium
o o o o o o o o o
Low
o o o o o o o o o
Factors that Influence the Selection-oj:ElectricMotor DrivesforN(ltural Gas Compressors . SwRIProject 1~-2090 . . .
N/A
o o o o o o o o o
. Page A-2 April 1999

3) Please estimate the amount and type of compressor horsepower your company has added/replaced (or plans to add/replace) in the following periods:
a) How much HP: b) Of this:
Reciprocating HP Centrifugal HP Rotary HP Other HP (please specify)
c) Probable driver type: Undefined Integral reciprocating Separable reciprocating Gas turbine Electric Motor
Fixed speed Variable speed Undefined
HP per unit Number of units
1992 - 1997 1997 - 1999 2000 - 2003
4. How would you rate the influence of various strategic and operational issues on the selection of compressor drivers. (Rate the influence, from 1 to 5, as favoring either electric or gas drivers or 0 for no influence. A '5' rating is a very strong incentive, and tends to exclude the other type of drive. A '0' rating is neutral, favoring neither drive type.)
Influence Rating Issue Electric Gas
Operations: Required flow rate 5 4 3 2 1 0 1 2 3 4 5 Total compressor HP 54321 0 12345 Type of Compressor
Reciprocating 54321 0 12345 Centrifugal 54321 0 1 2 3 4 5
Control and automation capability 54321 0 12345 Company experience / tradition 54321 0 1 2 3 4 5
LegallConununity Issues: Emission compliance 54321 0 1 2 3 4 5 Noise 54321 0 1 234 5
Reliability: Power or fuel availability 54321 0 1 2 3 4 5 Drive availability 54321 0 1 2 3 4 5 No curtailment contracts 54321 0 1 2 3 4 5
Economic: Fuel/power cost 54321 0 1 2 3 4 5
For base load 54321 0 12345 For peak load 54321 0 12345
Electric power available at station 54321 0 12345 No high voltage power available 54321 0 1 2 3 4 5 Efficiency 54321 0 1 2 3 4 5 Maintenance cost 5 4 3 2 1 0 1 2 3 4 5 Equipment delivery time 54321 0 12345
. Factors thiitInfluence theS~tectlon of Electric Motor DrivesforNatural Gas Compressors SwRI ProjeciI8-2090' ,
. PageA-3 April 1999

Issue (cont.) Capital Cost:
Fixed speed drives Variable speed drives 100% duty cycle With -40% duty cycle
Others:
Influence Rating Electric Gas
54321 0 54321 0 54321 0 54321 0
54321 0 54321 0 54321 0
12345 1 2 3 4 5 1 2 345 1 2 3 4 5
1 2 3 4 5 1 2 3 4 5 1 2 3 4 5
5. Does deregulation of the Electric Utility industry significantly enhance the comparative positions of EM drive systems in your case? 0 YES 0 NO How:~ ________________________________________________________________ _
6. a) Concerning emissions compliance issues, can you cite current or anticipated regulations or local policies (name the state) that provide significant impediments or incentives for installing EMD?
7.
o OTC o Regional Haze o OTAG o PM2.5 o Global Climate o MACT Standards
b) Excluding emissions compliance issues, can you cite current or anticipated regulations or local policies (name the state) that provide significant impediments or incentives for installing EMD?
In your system, do any the following issues provide an overriding influence (i.e., mandate) for or against compressor EMD?
Issue For I Against! Not Important % of Cases
Legal I Communitx Issues: Emission compliance F A N % Noise F A N % Community Relations F A N % Other: (specify)
F A N % F A N %
Reliabilitx: F A N % Fuel I power availability F A N % Customer requirement F A N %
Provide an example: No curtailment I penalty contracts F A N % Other: (specify)
F A N % F A N %
Faciors that Influenc:e the Selection of Electric Motor Drives for Natural Gas Compressors SwRl Projt;r:t 18-2Q90
PageA-{ Aprill~~9

Issue (cont.) For/Against/Not Important % of Cases
Economic: Cost of power vs. gas F A N % Maintenance cost F A N % Capital cost:
Fixed speed drive F A N % Variable speed drive F A N % Power already available at station F A N % (substation cost only)
When power is not available F A N % Other Factors:
Infinite control of variable speed EMD F A N % Compression ratio needed F A N % Spare parts I familiarity of equipment F A N % Delivery schedule F A N % Efficiency F A N %
F A N % F A N %
8. a) Could your company's compressor driver selection process be characterized by consideration of a few overriding issues (such as in question 7 above), then followed by a detailed cost analysis of particular issues to compare drivers?
Strongly Agree Agree Neutral Disagree Strongly Disagree
Conunents: ______________________________________________________________ _
b) Have any significant factors been overlooked in items 4 or 7 above? (please describe)
9. Please estimate the percent cost differential of Electric Motor Drives for the following comparisons. (Express the percentage as favorable to EM drives [+] or unfavorable [-], i.e., gas is approximately 20 percent less than electric power, therefore -20% difference.)
Comparisons Operating Cost (fuel I power only):
EMD vs. engine EMD vs. turbine
Operation and Maintenance Combined: EMD vs. engine EMD vs. turbine EMD vs. engine
Installation Cost: Fixed speed EMD vs. engine Fixed speed EMD vs. turbine Variable speed EMD vs. engine Variable speed EMD vs. turbine
Other Significant Costs:
% Difference
% %
% % %
% % % %
% %
- FaCtotstharinjluence the Selection 0/ Electric Motor Drives/or Natural Gas Compressors SwRI Project 18-2090 _. -
Page A-5 -, April 1999

1O. Please rate, on a scale of 0 to 10, which factors are major obstacles for selection of EMD.
Issue High demand charges Duration of demand charge Cost of supplying electrical infrastructure Cost of power vs. gas Other:
Ranking 012345678910 012345678910 012345678910 012345678910
012345678910 012345678910
Please identify any remedies or targets which could neutralize the disincentives (i.e., with power cost at -0.04IkW-hr, there is no incentive for gas over electric.)
. 11. Please describe any additional factors or situations that might help identify when and why EM drivers are needed or advantageous:
12. Please recommend anyone else (in your company or elsewhere) who is particularly knowledgeable or has evaluation experience on the subject of EMD:
13. Do you have (or know of) any reports or papers on the subject? Please identify:
We will greatly appreciate your participation in this study. If you have comments you would like to share verbally, please feel free to call either Ray G. Durke at (210) 522-3001, e-mail: [email protected] or Robert 1. McKee at (210) 522-3000, e-mail: [email protected]
Thank you.
Robert 1. McKee, Principal Engineer
Factors thai Influence the selection of Electric Motor v'rivesfor Natural Qas Compressors. SwRIProject18-2090 . .
.PageA~6 April 1999

Appendix B Compilation of Horsepower,
Compressor Type and Driver TypePast, Present, and Future
(Covering those 21 operating companies that responded to the survey.)
• INGAA Foundation Members • Non-Foundation Members • Totals
'Factors thai Influence the Seledion of Electric Motor DrfvesJor Natural.Gas Compressors SwRI Project 18-2090 ,
Page B-1 April 1999

Table 8-1. Total and Company Average HP Log Compressor Types and Drive Type; from INGAA and Non-INGAA Respondents for Past, Current, and Future Years
Q uestlon;:s t'lease estimate me amount ana tYpe OT compressor norsepower your company nas aaaeafreplacea In me TOIIOWlng penoa: 1992-1996 INGAA 1997-1999 INGAA 2000-2003 INGAA R Sum Avg Std R Sum Avg Std R Sum Avg Std
How much HP 12 2362863 196905 380855 12 1494478 124540 359187 12 308100 25675 27232 Of This:
Reciprocating HP 12 258930 21578 30566 12 39918 3326.5 5353.8 12 28200 2350 5318.6 Centrifugal HP 12 2103933 175328 380283 12 1450260 120855 354862 12 209900 17492 27169 Rotary HP 12 0 0 0 12 0 0 0 12 0 0 0
Probable Driver Type: Undefined 12 71018 5918.2 12706 12 0 0 0 12 118000 9833.3 21483 Integral reciprocating 12 76970 6414.2 20269 12 17968 1497.3 2846.1 12 0 0 0 Separable reciprocating 12 97200 8100 15993 12 11250 937.5 1487.4 12 20700 1725 5269.3 Gas turbine 12 1959675 163306 364615 12 1205260 100438 298081 12 153150 12763 26986 Electric Motor 158000 13167 26321 260000 21667 59143 16250 1354.2 4491.3
Fixed Speed 12 46000 3833.3 8446.2 12 15000 1250 4145.8 12 0 0 0 Variable Speed 12 112000 9333.3 17875 12 245000 20417 54997 12 16250 1354.2 4491.3
1997-1999 NONINGAA 2000-2003 NONINGAA 1992-1996 TOTAL R Sum Ava Std R Sum Ava Std R Sum Avg Std
How much HP 9 343930 38214 23115 9 310000 34444 28968 21 3E+06 138767 293652 Of This:
Reciprocating HP 9 104020 11558 17907 9 40000 4444.4 6358.6 21 332370 15827 24647 Centrifugal HP 9 238710 26523 24842 9 270000 30000 27951 21 3E+06 122892 293117 Rotary HP 9 1200 133.33 377.12 9 0 0 0 21 1000 47.619 212.96
Probable Driver Type: Undefined 9 85700 9522.2 18089 9 165000 18333 29756 21 154618 7362.8 13575 Integral reciprocating 9 8900 988.89 2797 9 0 0 0 21 83323 3967.8 15566 Separable reciprocating 9 4390 487.78 1379.6 9 0 0 0 21 117368 5589 12788 Gas turbine 9 167990 18666 25116 9 131000 14556 25698 21 2E+06 110888 280986 Electric Motor 76950 8550 22602 14000 1555.6 3108.1 230150 10960 23118
Fixed Speed 9 66950 7438.9 19460 9 14000 1555.6 3108.1 21 61150 2911.9 6714.1 Variable Speed 9 10000 1111.1 3142.7 9 0 0 0 21 169000 8047.6 16403
Factors that Influence the Selection of Electric Motor Drives for Natural Gas Compressors SwRI Project 18-2090
1992-1996 NON INGAA R Sum Avg Std 9 551240 61249 65605
9 73440 8160 7786.8 9 476800 52978 66106 9 1000 111.11 314.27
9 83600 9288.9 15210 9 6353 705.89 1240.3 9 20168 2240.9 5284.4 9 368969 40997 59650
72150 8016.7 17710 9 15150 1683.3 2846.5 9 57000 6333.3 14863
1997-1999 TOTAL R Sum Avg Std 21 2E+06 87543 269351
21 143938 6854.2 12822 21 2E+06 80427 268830 21 1200 57.143 255.55
21 85700 4081 12900 21 26868 1279.4 2767.6 21 15640 744.76 1431.6 21 1E+06 65393 226087
336950 16045 55973 21 81950 3902.4 13240 21 255000 12143 42733
" -'.'
-:.,~,: ;'
··:n"
2000-2003 TOTAL R Sum Avg Std 21 618100 29433 27371
21 68200 3247.6 5735.8 21 479900 22852 27542 21 0 0 0
21 283000 13476 25109 21 0 0 0 21 20700 985.71 4074.5 21 284150 13531 25808
21 21
30250 1440.5 5676.7 14000 666.67 .2216.1 16250 773.81 3460.6
Page B-2 April 1999
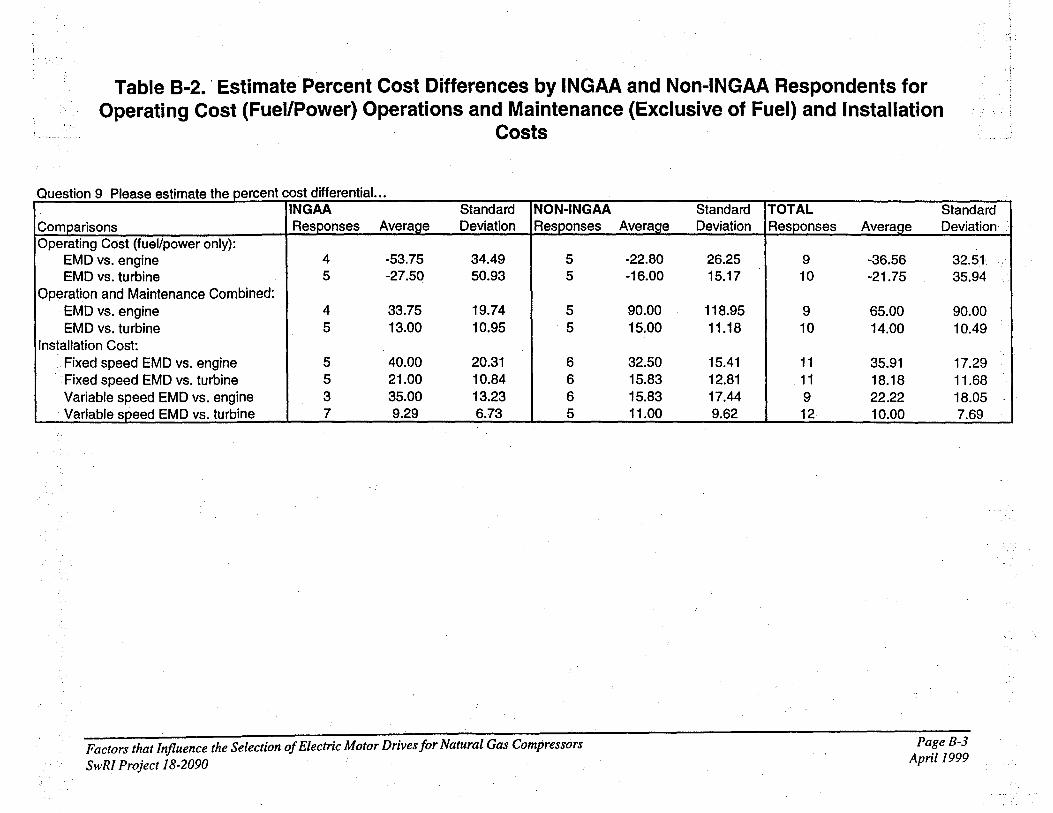
Table 8-2 .. Estimate Percent Cost Differences by INGAA and Non-INGAA Respondents for Operating Cost (Fuel/Power) Operations and Maintenance (Exclusive of Fuel) and Installation
Costs
Q 9 PI h t cost differential .. . .. _ .. -. - ._. -- .
INGAA Standard NON-INGAA Comparisons ResQ,onses AveraQe Deviation ResQ.onses Operating Cost (fuel/power only):
EMD vs. engine 4 -53.75 34.49 5 EMD vs. turbine 5 -27.50 50.93 5
Operation and Maintenance Combined: EMD vs. engine 4 33.75 19.74 5 EMD vs. turbine 5 13.00 10.95 5
Installation Cost: Fixed speed EMD vs. engine 5 40.00 20.31 6 Fixed speed EMD vs. turbine 5 21.00 10.84 6 Variable speed EMD vs. engine 3 35.00 13.23 6 Variable speed EMD vs. turbin~ 7 9.29 6.73 5
Factors that Influence the Selection of Electric Motor Drives for Natural Gas Compressors SwRI Project 18-2090
Standard AveraQe Deviation
-22.80 26.25 -16.00 15.17
90.00 118.95 15.00 11.18
32.50 15.41 15.83 12.81 15.83 17.44 11.00 9.62 - --_ ... _- -
TOTAL Responses
9 10
9 10
11 11 9 12
Standard Average Deviation-
-36.56 -21.75
65.00 14.00
35.91 18.18 22.22 10.00
32.51 35.94
90.00 10.49
17.29 11.68 18.05 7.69
Page 8-3 April 1999