FACTORS THAT HINDER DELIVERY OF HEALTHCARE SERVICES …
86
FACTORS INFLUENCING UTILIZATION OF HEALTH SERVICES OF PRIVATE HEALTH FACILITIES IN THIKA SUB-COUNTY: INSIGHTS FOR STRATEGIC HEALTHCARE MANAGEMENT BY MURAYA AGNES MWONJORIA UNITED STATES INTERNATIONAL UNIVERSITY SPRING 2014
Transcript of FACTORS THAT HINDER DELIVERY OF HEALTHCARE SERVICES …

FACTORS INFLUENCING UTILIZATION OF HEALTH SERVICES
OF PRIVATE HEALTH FACILITIES IN THIKA SUB-COUNTY:
INSIGHTS FOR STRATEGIC HEALTHCARE MANAGEMENT
BY
MURAYA AGNES MWONJORIA
UNITED STATES INTERNATIONAL UNIVERSITY
SPRING 2014

FACTORS INFLUENCING UTILIZATION OF HEALTH SERVICES
OF PRIVATE HEALTH FACILITIES IN THIKA SUB-COUNTY:
INSIGHTS FOR STRATEGIC HEALTHCARE MANAGEMENT
BY
MURAYA AGNES MWONJORIA
A Project Report Submitted to the Chandaria School of Business in
Partial Fulfillment of the Requirement for the Degree of Masters of
Science in Business Administration
UNITED STATES INTERNATIONAL UNIVERSITY
SPRING 2014

ii
DECLARATION
I, the undersigned, declare that this is my original work and has not been submitted to
any other college, institution or university other than the United States International
University in Nairobi for academic credit
Signed: ____________________________________ Date: __________________
Muraya Agnes Mwonjoria (ID: 632943)
This project has been presented for examination with my approval as the appointed
supervisor.
Signed: ____________________________________ Date: __________________
Dr. Zachary M. Mosoti
Signed: ____________________________________ Date: __________________
Dean, Chandaria School of Business

iii
COPYRIGHT
All rights reserved; no part of this work may be reproduced, stored in a retrieval system
or transmitted in any form or by any means, electronic, mechanical, photocopying,
recording or otherwise without the express written authorization from the writer.

iv
ABSTRACT
The purpose of the study was to explore the factors influencing the utilization of
healthcare services in private health facilities from a strategic healthcare management
perspective. The research questions were: What are the product quality factors that
influence utilization of healthcare services in private health facilities in Thika Sub
County? What are the customer service factors that influence utilization of healthcare
services in private health facilities in Thika Sub County? What are the price-related
factors that influence utilization of healthcare services in private health facilities in
Thika Sub County?
The study adopted a descriptive research design. The population comprised 311,035
people that made up Thika Sub-County. A stratified sampling technique was used.
Stratification was based on the first three of the four tiered health system described in
Kenya Health Policy (2012-2030). These were: community care, primary care and
primary referral. Data was collected from a total sample of 96 respondents using a
structured questionnaire. Descriptive statistical techniques including mean and
percentages were used to analyze data. Inferences were drawn using Spearman‘s Rank
Correlation Coefficient technique. This was aided by the use of the Statistical Package
for the Social Sciences.
The findings showed that in terms of product quality factors, speed, simplicity of
payment process, simplicity of administration requirements, consistency and correctness
significantly influenced utilization of private healthcare facilities in Thika Sub-County.
Regarding customer care factors, approachability of staff, caring, listening, friendliness,
efficiency, knowledgeable staff, flexibility, staff initiative, empathy, attention, language
used for communication, explanation of procedures and prompt passage of new
information had a significant influence on the utilization of private healthcare facilities
in Thika Sub-County.
Concerning price related factors, equipment costs, cost of prescription drugs, laboratory
test fees and doctor‘s fees significantly influenced the utilization of private healthcare
facilities in Thika Sub-County.

v
The study concluded that product quality, demonstrated through correct diagnosis and
prescription was the most important factor potentially influencing utilization of private
healthcare facility. Other product-related factors included simplicity both in the payment
process and administrative requirements. All aspects of customer care ranked highly
among the factors that potentially influenced utilization of private health facilities in
Thika Sub-County. These factors included approachability of staff; caring, listening and
friendliness; knowledgeable staff and flexibility. In terms of price related factors, with
the exception of laboratory test fees, all the other fees charged in the process of
administering healthcare to patients potentially negatively influenced the utilization of
private healthcare facilities in Thika Sub-County.
The study recommended that for strategic healthcare management purposes, private
healthcare facilities should focus resources on always getting it right the first time.
Private healthcare care facilities, especially those that offer primary care and primary
referral, need to invest in a customer service strategy that integrates a customer
relationship approach to the management of healthcare. They should also rethink their
price-mix in order to give better value for money to their clients. Another research
adopting a mixed-method approach could draw new insights that could be used to
corroborate the findings of this study.

vi
ACKNOWLEDGEMENT
The successful completion of this work is as a result of the input of many people. I wish
to first acknowledge God for enabling me to have the resources and support I needed to
undertake this research. I appreciate the support and understanding I received from my
husband and children. I also thank USIU for offering me the opportunity to undertake
the program. I further wish to acknowledge with thanks, Dr. Zachary M. Mosoti for his
guidance and support which made this work possible. I am equally grateful to my
colleagues with whom we undertook this program and whose encouragement kept
energizing me.

vii
DEDICATION
To my dear parents, the late James Mutahi and Beatrice Njoki for ensuring that I got an
education, my husband Dr. Nelson Muraya for his unwavering support and
understanding, my children Valentine, Philip and Beatie for standing with me throughout
the course of this project.

viii
TABLE OF CONTENTS
DECLARATION ............................................................................................................... ii
COPYRIGHT ................................................................................................................... iii
ABSTRACT ...................................................................................................................... iv
ACKNOWLEDGEMENT ............................................................................................... vi
DEDICATION ................................................................................................................. vii
TABLE OF CONTENTS ............................................................................................... viii
LIST OF TABLES ............................................................................................................. x
LIST OF ABBREVIATIONS AND ACRONYMS ........................................................ xi
CHAPTER ONE ................................................................................................................ 1
1.0 INTRODUCTION ................................................................................................. 1
1.1 Background of the Problem ...................................................................................... 1
1.2 Statement of the Problem .......................................................................................... 6
1.3 Purpose of the Study ................................................................................................. 7
1.4 Research Questions ................................................................................................... 7
1.5 Importance of the Study ............................................................................................ 8
1.6 Scope and Limitations of the Study .......................................................................... 9
1.7 Definition of Terms................................................................................................... 9
1.8 Chapter Summary .................................................................................................. 10
CHAPTER TWO ............................................................................................................. 11
2.0 LITERATURE REVIEW ................................................................................... 11
2.1 Introduction ........................................................................................................... 11
2.2 Product Quality Factors that Influence Utilization of Healthcare Services .......... 11
2.3 Customer Service Factors That Influence Utilization of Healthcare Services ...... 15
2.4 Price-related Factors That Influence Utilization of Health Care Services ............ 23
2.5 Chapter Summary .................................................................................................. 27
CHAPTER THREE ........................................................................................................ 28
3.0 RESEARCH METHODOLOGY ....................................................................... 28

ix
3.1 Introduction ............................................................................................................. 28
3.2 Research Design...................................................................................................... 28
3.3 Population and Sampling Design ............................................................................ 28
3.4 Data Collection Method ........................................................................................ 31
3.5 Research Procedure ............................................................................................... 32
3.6 Data Analysis Method ........................................................................................... 32
3.7 Chapter Summary .................................................................................................. 33
CHAPTER FOUR ........................................................................................................... 34
4.0 RESULTS AND FINDINGS ............................................................................... 34
4.1 Introduction ........................................................................................................... 34
4.2 General Information .............................................................................................. 34
4.3 Product Quality Factors that Influence Utilization of Healthcare Services .......... 39
4.4 Customer Service Factors that Influence Utilization of Healthcare Services ....... 42
4.5 Price Related Factors that Influence Utilization of Healthcare Services .............. 48
4.6 Chapter Summary .................................................................................................. 50
CHAPTER FIVE ............................................................................................................. 51
5.0 SUMMARY, DISCUSSION, CONCLUSION AND RECOMMENDATIONS ... 51
5.1 Introduction ........................................................................................................... 51
5.2 Summary ............................................................................................................... 51
5.3 Discussions ............................................................................................................ 53
5.4 Conclusions ........................................................................................................... 60
5.5 Recommendations ................................................................................................. 61
REFERENCES ................................................................................................................ 64
APPENDICES ................................................................................................................. 70
Appendix 1: Cover Letter .................................................................................................. 70
Appendix 2: Questionnaire ................................................................................................ 71

x
LIST OF TABLES
Table 3.1: Sampling Size Distribution .............................................................................. 31
Table 4.1: Response Rate .................................................................................................. 34
Table 4.2: Distribution of Respondents by Gender ........................................................... 35
Table 4.3: Distribution of Respondents by Age ................................................................ 35
Table 4.4: Disability Status ............................................................................................... 36
Table 4.5: Special Medical Condition ............................................................................... 36
Table 4.6: Distribution of Respondents by Level of Income ............................................ 37
Table 4.7: Frequency of Healthcare Visits ........................................................................ 37
Table 4.8: Average Spend per Visit .................................................................................. 38
Table 4.9: Respondents‘ Views on Efficiency of Health Facility ..................................... 39
Table 4.10: Respondents‘ Views on Reliability of Health Facility ................................... 40
Table 4.11: Respondents‘ Views on Physical Attributes of Health Facility ..................... 41
Table 4.12: Correlation of Utilization of Healthcare Facility and Product Quality .......... 42
Table 4.13: Respondents‘ Views on the Attitudes of Staff in Health Facility .................. 43
Table 4.14: Respondents‘ Views on the Professionalism of Staff of Health Facility ....... 44
Table 4.15: Respondents‘ Views on the Compassion of Staff of Health Facility ............. 45
Table 4.16: Respondents‘ Views on the Respect of Staff of Health Facility .................... 45
Table 4.17: Respondents‘ Views on the Communication of Staff of Health Facility ....... 46
Table 4.18: Perception of Quality: Distribution by Type of Healthcare Facility .............. 47
Table 4.19: Correlation of Utilization of Healthcare Facilities and Customer Care ......... 48
Table 4.20: Respondents‘ Views on the Price Charged at the Health Facility ................. 49
Table 4.21: Correlation of Price and Utilization of Healthcare Facility ........................... 50

xi
LIST OF ABBREVIATIONS AND ACRONYMS
CBO: Community Based Organization
TDHRIO: Thika District Health Records Information Office
FBO: Faith Based Organization
KNBS: Kenya National Bureau of Statistics
MoH: Ministry of Health
NGO: Non-Government Organization
SERVEQUAL: Service Quality
UHC: Universal Health Coverage
WHO: World Health Organization

1
CHAPTER ONE
1.0 INTRODUCTION
1.1 Background of the Problem
Strategic healthcare management which simply implies the adoption of a strategic
approach to the management of a healthcare facility is gaining increasing currency in
modern healthcare practices (Goodman, 2009). Ginter (2013) makes the observation that
healthcare leaders have found that strategic thinking, planning and managing strategic
momentum are essential for coping with the dynamics of the healthcare industry and
strategic management has become the single clearest manifestation of effective
leadership in healthcare organizations. Moseley (2009) considers strategic thinking as the
ability to constantly view an organization‘s operations, issues and problems in a very
broad situational and environmental context and with a very long term perspective.
Strategic healthcare management requires an appreciation of the entire healthcare system
within which an organization operates (Cook, 2010). Kotler et al. (2011) defined a health
care system as one that encompasses all the activities whose primary purpose is to
promote, restore, or maintain health which includes patients and their families, healthcare
workers and caregivers within organizations and in the community, and the health policy
environment in which all health related activities occur. Organizations and individuals
within the healthcare environment develop and employ new technologies, deal with
changing social and demographic issues, address legislative and political change,
compete with other healthcare organizations and participate in the healthcare economy
(Ginter, 2013).
According to Moseley (2009), every organization in existence is engaged in some current
activities designed to create products or services for sale, delivery, or distribution to its
customers, clients, patients, or beneficiaries. Goodman (2009) contends that successful
companies adopt strategic approaches to make these happen. They invest in aligning all
functions to support their brand promise and then reap substantial rewards, including:
happy customers who willingly pay premium prices or go out of their way to patronize

2
the company, intense emotional bonds with customers that block competitors and boost
brand loyalty, lower employee turnover as a result of a sense of mission, belonging,
excellence, teamwork and job satisfaction. Ginter (2013) emphasize that everyone in the
organization should be working for the strategy and understand how their work
contributes to the accomplishment of the strategic goals.
Literature suggests that the alignment of all functions to support the brand promise makes
service delivery a central aspect of success in the delivery of healthcare services. For
instance, Cook (2010) noticed that successful service organizations constantly strive for
higher levels of customer service. This is because today‘s consumers are increasingly
sophisticated, educated, confident and informed. They have high expectations of the
service they want to receive. They want greater choice and will not be sold to or
manipulated. In healthcare, patients now have more access to information regarding
disease and treatment options through the internet. Today, the success of a brand is a co-
creation between the consumers and the company. Kotler et al. (2011) observed that with
respect to healthcare products and services, consumers are actively sending messages
about their experiences, creating new uses, providing new findings from the internet and
other resources to their physicians and lobbying for more and better benefits.
According to Goodman (2009), starting strategically means that organizations must,
among others, organize service employees, the resources that support them, and the
functions that affect service for maximum speed and flexibility, with few specific rules
beyond doing what is best for the customer. A company‘s ability to attract and retain new
customers therefore, is a function not only of its product or product offering but also the
way it services its existing customers and the reputation it creates within and across
marketplace. With outpatient services making up an increasingly significant portion of
the healthcare industry, providing quality, customer-oriented service is a paramount
concern (Wolper, 2004). Goodman (2009) offers that service interactions are also the
prime generator of the single most powerful marketing mechanism: positive word of
mouth and ―word of mouse‖. Companies with great word of mouth incur almost no
marketing expense because they let their customers do their selling for them. The author
further avers that more than 50% of all new customers for investment, retail and health-
care products come from word of mouth referrals.

3
Strategic healthcare management as a concept is gaining global relevance. Resonant to
this paradigm shift in healthcare service delivery, World Health Organization (WHO,
2013) recognizes good health as being essential to sustained economic and social
development and poverty reduction and access to needed health services is crucial for
maintaining and improving health. By defining universal health coverage (UHC) as
ensuring that all people have access to needed promotive, preventive, curative and
rehabilitative health services, of sufficient quality to be effective, while also ensuring that
people do not suffer financial hardship when paying for these services, WHO stresses the
universality of health. Universal health coverage (UHC) has therefore become a major
goal for health reform in many countries and a priority objective of the World Health
Organization.
WHO (2013) further indicate that this definition points to the equity in access to health
services, that is, those who need the services should get them, not only those who can pay
for them; that the quality of health services is good enough to improve the health of those
receiving services; and financial-risk protection, that is, ensuring that the cost of using
care does not put people at risk of financial hardship. Hence the universal coverage
brings the hope of better health and protection from poverty for hundreds of millions of
people especially those in the most vulnerable situations. Achieving the Health
Millennium Development Goals and the next wave of targets looking beyond 2015 will
depend largely on how countries succeed in moving towards universal coverage.
Depicting the strategic perspective of approaching healthcare management, Ahmad
(2013) highlighted that good health and the socio-economic empowerment of a person
are correlated as health strongly impacts the productivity of individuals. Health care
access is important because it influences health status and quality of life. Thus in human
development perspective, health is viewed as intrinsic to capability enhancement. For this
reason, in any democratic culture, provision of health services is considered an asset of
one‘s ―citizenship‖. Having access to healthcare is a matter of rights, as lack of access
puts an individuals‘ health at a greater risk of functional decline and therefore, work-
limiting disabilities tend to increase. This situation occurs when an individual needs care
but cannot utilize the available healthcare services.

4
In their review of the dynamics of the healthcare sector, Rivers and Patino (2006)
concluded that health does not exist in isolation from socioeconomic factors.
Socioeconomic status profoundly influences status both positively and negatively.
Several socioeconomic characteristics of the population have harmful effects on both its
general health care behaviours and its general health status. In reference to Mexican
communities living in USA, the authors identified low income, substandard housing,
inadequate or unsanitary living facilities, limited formal education, ethnic segregation
and discrimination, poor nutrition, and stress as having effect on the health of this group
in a number of ways. Other barriers to health care access that they noted among the poor
included but are not limited to rising cost of medicine compared to the declining family
income and wages; cultural differences; customer care and even under representation of
groups within the health sector. Anthamatten and Hazen (2012) argue that the barriers
have implications for strategic healthcare management as they increase the probability
that an individual will choose alternative forms of healthcare, which may be ineffective
or even harmful.Companies that spare no expense to build their brands, improve their
operations, and leverage their technologies often skimp on investments that preserve and
strengthen this final, vital link in their revenue chain (Goodman, 2009).
Maina and Kibua (2005) also noted that the case of sub Saharan countries has been that
of the inadequacy to provide adequate quality and coverage of health care services
because of poor economic performance and dwindling resources which has prompted
many countries to advocate for the implementation of health sector reforms with a view
to maximizing the use of available resources in improving access, efficiency and quality
of health care services provided.
According to Turin (2010), access to health care in Kenya varies widely throughout the
country and is determined on numerous factors, though in particular, major divides exist
between rural and urban communities, and between the moneyed elite and the poorer
masses. In Kenya, the poorer masses – those living below the national poverty line –
constitute approximately 52% of the population. Kenya in an attempt to improve
efficiency and effectiveness in the delivery of health care services and against the
limitations of a centralized heath care system, the Ministry of Health (MoH) adopted
decentralization as the key strategy, with the district being the focal point with regard to

5
health care delivery. Various Policy documents, including the Kenya Health Policy
Framework Paper of 1994 and the National Health Sector Strategic Plan of 1999-2004;
have highlighted the Ministry of Health‘s commitment to the implementation of the
decentralization strategy.
Turin (2010), in consideration of the challenging health landscape, posited that utilization
of health services is a key factor in improving health outcomes for Kenyans, in both the
short- and long-term. The level of and access to care varies by region, with the most
facilities per person located in Central Kenya, and the least located in the border counties
of Western, Rift Valley and Nyanza. Turin established that the health care utilization rate
in Kenya is approximately 77% for those who are sick, meaning that a large percentage
of the population does not seek care despite being ill. Turin opined that in order to bring
about broad improvements in health in Kenya, it is essential to understand who is
currently using the facilities that are available, and what factors are preventing those who
do not seek care from doing so. Vandermerwe (2003) argued in his discourse on
healthcare uptake that it would take customer minded enterprise owners to try proactively
to capture the 23% who do not seek health care services when sick. This requires growth
of new markets through concept innovation for more value added services, which
generate revenues and opportunities to maximise customer value over time. It means
accepting that the old service models may not work and relentless pursue opportunities to
find new ways of doing things for customers.
This research was undertaken in Thika Sub-County. Thika town is an industrial town in
Kiambu County, Kenya. It lies approximately 40 kilometers north east of Nairobi, near
the confluence of the Thika and Chania Rivers covering 220 square kilometers (Thika
District Health Records Information Office [TDHRIO], 2013). Thika Sub-county has a
population of approximately 311,035 which is highly diverse and is growing rapidly, as
is the entire greater Nairobi area (Kenya National Bureau of Statistics, 2009).
Thika Sub-county has a well maintained road network with an eight lane super highway
from Nairobi. The main economic activities include, agricultural processing, particularly
in horticulture and pineapple (exported mainly to Europe), coffee (exported mainly to the
United States and Europe), cooking oils (to the rest of Kenya and eastern Africa) and

6
animal feed processing. Other industries include textile (cotton), macadamia nuts, wheat,
tannery, motor vehicle assemblies, cigarette manufacturing, bakeries, packaging and
industrial chemicals. About 100 small-scale industries and about 20 major factories exist
in and around the town. The service sector is well represented with the establishment and
growth of a number of educational and financial institutions. The growth of the greater
Nairobi region and improved infrastructure and services has led to new expanding middle
class in the town (TDHRIO, 2013). The TDHRIO (2013) puts the absolute poverty level
in the town at 48.4%, income from Agriculture at 17.4%, self-employment at 20.3%, and
wage employment at 42.7% and the number of unemployed at 19.6%.
In the year 2012, Thika Sub County had over 121 health facilities spread across the sub
county. The doctor/population ratio was about 1:6618.The average distance to a health
facility is less than 1 kilometre in town but this could go as much as 10 kilometres in the
rural parts of the sub-county. The most prevalent diseases are upper respiratory tract
infections, malaria, skin conditions, gastro intestinal conditions, injuries, eye conditions,
hypertensions, diabetes, pneumonia, rheumatism, urinary tract infections and HIV/AIDS.
(TDHRIO, 2013)
The major provider of health services is the private sector. The major public health
centres in Thika Sub County are under MoH. The numbers of registered health facilities
in Thika Sub County are 19 and 102 owned by the MoH, and Private/NGO/FBO
respectively. The informal settlements of the town have a host of informal private clinics
[TDHRIO], 2013). This study explored the factors that influence the utilization of
healthcare services in Thika Sub County from a strategic healthcare management
perspective.
1.2 Statement of the Problem
The principle challenge for any government is to achieve a sustainable health for its
citizens for meaningful economic development (Subhashini, 2012). Therefore poor
access to health services limits quality of life and productivity of citizens. The
perceptions of the clients on healthcare services received from the health care facilities
form part of the strategic factors that contribute to the level of health care delivery among

7
communities (Subhashini, 2012). Despite this importance, no comprehensive studies
have been published that analyze the relationship between these perceptions of healthcare
services received and healthcare utilization/delivery in Kenya (Turin, 2010).
Dissatisfaction with the health system affects health seeking behavior, and this is
associated with poor customer care services besides shortage of healthcare facilities
(Subhashini, 2012).
If an individual makes what is likely to be an arduous trip to a health facility only to
experience an unpleasant customer service, the likelihood that the same individual will
make the trip again in the future is lessened. When this scenario becomes commonplace,
an entire community might become less likely to seek health services, even when they
are needed. Likewise if the prices charged do not meet the perceived benefits achieved
then return visits would likely be lessened. These may tend to hinder the level of
healthcare delivery intended by the governments due to non-responsiveness of the
citizens. According to Dodds (2003), the right combination of product quality, customer
service and fair prices is key to success in today‘s marketplace. This study therefore
sought to fill the knowledge gap by exploring the relationship between citizen‘s
perception of health care services and health care utilization/delivery in private health
facilities in Thika Sub County based on these three variables.
1.3 Purpose of the Study
The purpose of this study was to explore the factors influencing the utilization of
healthcare services in private health facilities from a strategic healthcare management
perspective.
1.4 Research Questions
1.4.1 What are the product quality factors that influence utilization of healthcare services
in private health facilities in Thika Sub County?
1.4.2 What are the customer service factors that influence utilization of healthcare
services in private health facilities in Thika Sub County?
1.4.3 What are the price-related factors that influence utilization of healthcare services in
private health facilities in Thika Sub County?

8
1.5 Importance of the Study
A strategic review of the specific issues related to healthcare service utilization is
essential for the establishment of the appropriate principals and effective policies.
Specifically, the study provides an in-depth understanding of the various factors that
influence utilization of healthcare service in private health facilities. This study is
therefore of importance to the following stakeholders;
1.5.1 Kenyan Government
Based on the findings of this study, the Government can then formulate strategies to
stimulate healthcare delivery. This will enhance health of citizens and in turn improve
economic growth. Factors pertaining to the government can also be addressed and
progress made.
1.5.2 Management of Health Institutions
The study will help the managers of health facilities to gain awareness of the factors that
affect utilization of healthcare services. By being aware of these factors, it will
significantly help them put in appropriate measures to counter these challenges.
1.5.3 The Community
Based on the findings of this research, the community can be enlightened so that they can
participate towards enhancing healthcare delivery. Taking a participatory approach is
critical in ensuring support for the healthcare systems.
1.5.4 Researchers and Academicians
The research may also open up new areas for future research by interested scholars,
researchers and academicians.

9
1.6 Scope and Limitations of the Study
The study targeted those who seek healthcare services in the 102 private health care
facilities in Thika Sub County. At 43%, private businesses account for the largest share
of the healthcare market, followed by government at 41% and NGOs at 15% (Wamai,
2009). The data was collected in the months of October and November 2013 by use of
structured and standardized questionnaire. The study was confined to the responses
within Thika Sub County and the findings were subject to the values, ethics and
competencies of the respondents. Language barrier was a challenge with some
respondents. In order to mitigate this, the researcher paraphrased and explained the
questions in Kiswahili to the respondents who did not understand English quite well.
1.7 Definition of Terms
1.7.1 Healthcare
Services provided to people or communities by agents of the health services or
professions for the purpose of promoting, maintaining, monitoring, or restoring health
(Farlex, 2012).
1.7.2 Products
This refers to anything that can be offered to a market for attention, acquisition, use or
consumption. It includes physical objects, services, persons, places, organizations and
ideas (Kotler and Keller, 2006).
1.7.3 Services
World Health Organization identifies health services to include all services dealing with
the diagnosis and treatment of disease, or the promotion, maintenance and restoration of
health which include both personal and non-personal health services (WHO, 2013).
1.7.3 Strategy
This is a set of choices made by top managers using organization‘s resources and
opportunities from the environment to improve effectiveness of the organization‘s
activities (Obloj, 2013).

10
1.8 Chapter Summary
This chapter has presented the background on the strategic significance of healthcare
management and the place of healthcare service delivery in enhancing utility of
healthcare facilities. A background of Thika Sub County as well as health care status in
the town has been clearly illustrated. The chapter has stated the problem and raised the
research questions. The chapter also points out the significance and the scope of the
study. Finally, the chapter has provided the definitions of the terminologies and concepts
in the context of this study.
Chapter two dwells on the literature review of the theories related to the subject being
studied. This encompasses product quality, customer care and price related literature.
Chapter three gives the research methodology used. This entails the research design, the
population and sampling design, data collection methods, research procedures and data
analysis techniques. Chapter four presents the results and findings and chapter five
provides the summary, discussion, conclusion and recommendations.

11
CHAPTER TWO
2.0 LITERATURE REVIEW
2.1 Introduction
This chapter presents a review of the literature on strategic healthcare management as it
relates to the three research questions. These are: What are the product quality factors
that influence the utilization of healthcare services in private health facilities in Thika
Sub County? What are the customer service factors that influence utilization of
healthcare services in private health facilities in Thika Sub County? What are the price-
related factors that influence utilization of healthcare services in private health
facilities in Thika Sub County? The chapter explores theoretical and empirical literature
that underpins the utilization of healthcare services in private health facilities from a
strategic healthcare management viewpoint.
2.2 Product Quality Factors Influencing the Utilization of Healthcare Services in
Private Health Facilities
On a broader perspective, Kotler and Keller (2006) defined a product as anything that can
be offered to a market for attention, acquisition, use or consumption and included
everything from physical objects to services to persons to places to organizations and
ideas. Within the healthcare sector, World Health Organization (2013) construed a
product to include all services dealing with the diagnosis and treatment of disease, or the
promotion, maintenance and restoration of health which include both personal and non-
personal health services. Discussing the genesis of the quality movement, Stephen (2005)
noted that product quality has two intrinsic dimensions. These are: freedom from
deficiencies and the other is the addition of product features that meet the needs of
customers in a wider way. In respect to the service sector, Kandampully (2011) prefers
the use of the term ―technical quality‖, which he define as the outcome of the service
experience including promptness, accurateness and the extent to which the customer is
offered several alternatives and individualized solutions. Similarly, Rama and Rao (2011)
identify two dimensions of quality which relate to product quality and service quality.

12
Product quality, which they call technical quality, is what is offered to the customer from
the organization; that is, what customers receive in their interactions with service firm is
called the technical product. On the other hand, the service quality which they prefer to
call ―functional quality‖, refer to how customers receive the service and how they
experience the service process in which they played a part. These factors are explored in
greater details as follows.
2.2.1 Freedom from Deficiency
The World Health Report 2000 called attention to the importance of efficiency rather
than deficiency in all functions of a health system and in ultimately achieving the goals
of health improvement (Hsu, 2010). According to Hsu (2010), technical efficiency refers
to the extent that resources are being wasted. It measures the degree of producing the
maximum amount of outputs from a given amount of inputs or, conversely, using the
minimum amount of inputs to produce a given output. The inefficiencies in the eyes of
the patient can be manifested in the form of excessive hospital length of stay, whereas
from the management‘s point of view as over-prescribing, over-staffing, use of branded
over generic drugs, and wastage of stock. Measurement of efficiency is therefore relevant
in settings constrained by scarce resources and given the recent economic downturn and
escalating healthcare costs. Wolper (2004) noted that many healthcare organizations are
applying continuous quality improvement principles to outpatient service areas with the
goal of improving customer satisfaction and service quality. As a result, he observed that
some organizations have seen dramatic results in improving key process variables such as
patient registration time, reducing the overall patient waiting and registration time from
25 or more minutes to less than 10 minutes.
Hsu (2010) in acknowledging the significance of private sector in contributing to the
population health also highlighted the importance of efficiency in health care delivery.
He posits that, it is no longer a question of private versus public but rather what is the
best and most efficient mix for the local context towards maximising the systems‘
contribution to population health. Efficiency levels therefore will determine the level of
penetration and actual outputs thus directly affecting health care service delivery e.g.

13
slow systems will curtail the number of patients attended to in a given day within a
facility.
2.2.2 Reliability
Reliability may be defined as the ability to perform the promised service dependably and
accurately (Markovic and Raspor, 2010). Peppers and Rogers (2010) hold the view that
reliability affects credibility of a product, which in turn affects the long-term orientation
of a customer regarding their trust on the product. Shore (2006) argues that trust is a
critical factor for anyone who wants to build successful business in the healthcare
industry. The healthcare industry has tremendous competing pressure to provide best-in-
class quality patient experiences (Faltin et al., 2012). In such an environment, it is the
trusted hospital that attracts not only the best clinicians but also the most patients and the
most donors (Shore, 2006).
According to Ramez (2012), reliability in health care can be viewed in two ways; One as
a customer satisfaction index. A substantial literature has been devoted to the assessment
of service quality by the use of SERVQUAL tool and one such study was a study of 235
Bahraini patients which rated the reliability dimension as the most important service
satisfaction element. Secondly reliability can be used as a measure of the quality of the
technical service provided by health facilities.
DeVita et al. (2006) noted that reliability is often presented as a defect rate in units of 10
and generally represents the number of defects per opportunity for that defect. They posit
that in health care, an opportunity for a defect usually translates to a population of
patients at risk for the medical error or adverse event. For example, within a health care
institution, failure to use evidence-based interventions may occur in five of 10 patients,
or a catheter-related blood stream infection in four of 1,000 catheter days. Thus a
fundamental principle in measuring reliability is focusing on defects that can be validly
measured as rates with clearly defined numerator (defect) and denominator (population at
risk) and must be devoid of reporting biases.

14
2.2.3 Physical Attributes
Barber and Scarcelli (2010), in their review of literature, noted that physical attributes
which is composed of ambient conditions, design, physical and social factors, all of
which are important predictors of service quality as having possible influences in
decision making. This highly complex physical environment has been recognized in
many service organizations such as hospitals, hotels, airlines, banks, and restaurants and
consequently addressed by requiring elaborate designs, layouts, and, interior decorations
to achieve a variety of marketing and organizational objectives. The cleanliness of a
health facility, whether it is the lobby, building exterior or the treatment rooms, can
influence the customer‘s perceptions of quality of the health care service offered owing
to dirty facilities that may lead to re-infections negating the benefits.
Lockyer (2003) argues that a customer‘s satisfaction is realized not only through the
delivery of exceptional service but additionally through the physical environment which
plays a key role in the delivery process. Availability of ambulances, qualified staff is a
physical demonstration of institutional preparedness to handling medical emergencies
and procedures.
A defect in the quality of tangibles would also be manifested through organizational
barriers (Kronfol, 2012). Organizational arrangements can influence access to and use of
services. Organizational barriers include waits and delays as well as long queues in
accessing services at various care outlets; inadequate opening hours and lack of an
appointment system. These give a negative picture of the facility thus discourages would
be clients. Organizational barriers also encourage inpatient utilization and favoured it
over ambulatory care in order to bypass such restrictions and discomfort (Kronfol, 2012).
In a study to identify the access and barriers to healthcare in Arabic countries, Kronfol
(2012) outlined three aspects of geographical barriers to access to health care services.
These are: transport, regional variations and rural–urban inequalities. These barriers
negate health care delivery by increasing cost, increasing travel hurdles or limiting
proximity to health facilities.

15
As pointed out in chapter one, demographics of the patients seeking healthcare services
within Thika Sub-county are highly unique and widely varied. There are both urban
dwellers within the town as well as the rural population in the town‘s environs. A
significant population also resides in informal settlements within the town with some
health facilities being situated in private common buildings and in areas with poor road
networks (TDHRIO, 2013).
Kronfol (2012) posit that transportation is an important issue when people are dependent
on public transport to access health care. This is particularly the case in rural areas. He
goes ahead to say that there is a particular concern about the safety, cost of transportation
and ease of boarding public buses. Older people are particularly disadvantaged in this
respect.
Distance has been shown to limit access to health care. In rural parts of Thika Sub-county
health facilities are far as 10 kilometres apart (TDHRIO, 2013). The impact of distance
on utilization of preventive services such as screening appears to be greater than on
curative treatments, especially where follow-up treatments are required. Disabled persons
have very specific needs in terms of accessibility of health care facilities and access to
information (Kronfol, 2012). For instance, in some cases not only for the disabled, it is
necessary to guarantee that physical health facilities are easily accessible for wheelchair
users; that there is provision for lifts where a health facility is situated in tall building and
provision of sufficient parking space.
2.3 Customer Service Factors Influencing the Utilization of Healthcare Services
in Private Health Facilities
There is a general consensus in literature that customer service means different things to
different people (Gibson, 2011; Tyson and Schell, 2011). Gibson (2011) thus construe
customer service to mean the process of satisfying the customer, relative to a product or
service, in whatever way the customer defines his or her need, and having that service
delivered with efficiency, compassion and sensitivity. This has strategic implications for
the management of healthcare facilities. Research provides ample evidence that the
economic success of companies fluctuates with the quality of service that is offered,

16
establishing that quality service leads to financial and strategic success (Milbourn and
Haight, 2001). Goodman (2009) asserts that superior service is the chief differentiator
and this applies especially to the healthcare sector. Before using a service, a customer has
certain expectations about it and it is these expectations that become a basis against
which to compare actual performance (Hernon and Altman, 2010). Quality means the
degree of excellence in service performance (Rama and Rao, 2011).
According to Rama and Rao (2011), consumers perceive the quality of a service by
experiencing the consumption process and comparing the experience with their
expectations. As service quality is antecedent to consumer satisfaction and consumer
satisfaction is antecedent to purchase intentions, there is a strong link between quality
and customer retention in the services sector. Service quality is the degree and direction
of discrepancy between consumer‘s perceptions and expectations in terms of different but
relatively important dimensions of the service quality, which can affect their future
purchasing behaviour.
It should be noted that customer integration in the service production process is a central
characteristic of services (Buttgen and Ates, 2009). Therefore, the production of any
service requires the participation of the customer (Bettencourt et al., 2002). Due to this
participation in the production processes, there is an influence of customers on service
delivery because the participation of the patient is required for their production.
Accordingly, the productivity of health care services seems to be dependent on the
behaviour of the patient. The behaviour of which is highly influenced by the customer
care services offered by the health facilities. In this way, an excellent customer care
service is the route to success of every organization‘s health. It creates a professional yet
friendly atmosphere that attracts and retains customers and patients. When businesses
prioritize customer satisfaction and maintain long-term relationships with their
customers, customers keep coming back otherwise they keep off. In health care industry,
the customer perception on the quality of customer care services received play a vital role
in enhancing delivery of the health related services.
According to Goodman (2009), the payoff from a strategic approach to customer service
is simple: more revenue, higher margins, lower costs, and positive word of mouth

17
producing more customers at a lower marketing cost. Schulz and Johnson (2003) argue
that the purpose of a health service is to apply appropriate technologies and provide for
the delivery of care services to meet the health needs of the populations served. However,
a study by Family Care International in the then Homa Bay and Migori Districts, Kenya
in 2003 revealed major concerns about the attitudes of health workers towards
community members. While some study participants described positive interactions with
facility-based health staff, many characterised facility-based providers as negligent at
best, and as emotionally and physically abusive at worst. Others complained of outright
neglect, describing health staff as inattentive and unconcerned about women‘s progress
with labour or their discomfort. Community members also perceived facility-based staff
as judgmental and discriminatory, commenting that women who are well-dressed receive
good care, whereas those who appear less affluent are shamed and criticised. The study
pointed out that poor treatment by the health care providers at worst made some pregnant
women resort to home delivery with assistance of traditional birth attendants (Family
Care International, 2003). Here are some of the customer care practices that enhance
health care service delivery:
2.3.1 Responsiveness
Landrum et al. (2009) defines responsiveness as the ability to provide prompt service;
that is, willing and ready to provide service(s) when needed. This dimension of service
quality has consistently ranked highly together with reliability (Ramez, 2012). The
strategic implications for healthcare management, according to Ramez (2012), for
instance, is that the health facility staff should provide adequate time to patients during
their visits to understand the nature of the medical procedures being carried out as well as
other areas such as counseling. Another important item is that hospital staff should be
competitive and more helpful in their provision of services. The social interchange
between the customer and the service provider and the way this process is managed is
pivotal to achieving excellent customer service (Cook, 2010).
2.3.2 Positive Attitudes
An attitude is a combination of beliefs and feelings that predispose a person to act in a
certain way (Schermerhorn et al., 2003). According to Rollinson and Broadfiled (2002),

18
it may also be defined as a mental and neutral readiness, organized through experiences,
exerted a directive or dynamic influence upon the individual‘s response to all objects and
situations with which it is related. This means that, they are evaluative statements which
are, either favourable or unfavourable about objects, people or events and reflect how we
feel about something (Robins and Judge, 2009). Our actions towards objects or people
are strongly influenced by how positively or negatively we feel about them. Hence
attitudes affect our behaviours, (Rollinson and Broadfield, 2002). The skills and attitude
of staff engaged in customer service have a critical impact not only on the levels of
satisfaction that the customer gets from the market offering but also on referrals (Sahaf,
2008).
From these definitions, several key elements of an attitude can be pointed out. Attitudes
are held towards something specific that is part of the world of the attitude holder such as
people, job or organization. Attitude reflects the attitude holders experience, feelings and
evaluation of the aspects of his/her world. Attitudes are to a large extent learnt from
experience and are enduring and have a bearing on how an individual reacts to the object
or people. They involve mental process and are not tangible hence their existence can
only be inferred. To try and establish the significance of attitudes to the attitude holders,
research over time has established the functional approach theories with a basic
assumption that attitudes are held because they serve a useful purpose for the holder
(Rollinson and Broadfield, 2002).
Managers should be interested in their employees‘ attitudes because attitudes give
warnings of potential problems and because they influence behaviour (Robbins and
Judge, 2009). Attitudes may influence work outcomes such as work quality, absenteeism,
turnover, accidents and sabotage. Work related attitudes tap positive or negative
evaluations that employees hold about aspects of their work environment. Having a
positive attitude is the foundation of excellent customer service. It provides the necessary
perspective that allows one to listen, care about and solve customers‘ concerns. It helps
one cultivate the ability to enjoy doing something special for others and obtain nothing
but a thank you or a smiling face in return. It entails wearing a smile, and conducting
one‘s self with an upbeat demeanour, while demonstrating flexibility and approachability
towards customers and patients (Aldag and Kuzuhara, 2002).

19
2.3.3 Professionalism
According to Delattre and Ocler (2013), professionalism characterizes the deployment of
actor‘s action (individual or collective) under collective constraints and subjected to
judgment of third parties. Professionalism includes a reference to the actor, to
cooperation and to the sense-making of collective action, in other words to pursued
objectives. The reference to the actor deals with his capacity to realize decisive acts. The
reference to cooperation refers to the actor‘s capacity to insert his activity into situations
or levels of performance compared to the activity of the other actors.
According to Delattre and Ocler (2013), within the hospital set up, medical personnel‘s
professionalism in reference to the notion of relevant, coherent and congruent act is
portrayed through three key elements. Firstly, jobs- technical or methodological
expertise, variety of personal experience, lack of common tools but development of
personal ones. Secondly, shared values- strong awareness of the quality of service to be
supplied to the patient, deep motivation for the public sector despite difficulties linked to
institutional trammel, high social concern to reconcile well-being at work with the
requirements of the rendered service in a context of hyper-protection of the agents and
thirdly, added value/distinctive competences – strong capacity of adaptation, capacity to
take initiatives without expecting institutional response, flexibility to mitigate the
conflicting synergies between the teams and administrative complexities, will to develop
new methods of work, and permanent concern to deliver despite the lack of direction and
recognition of their actions. In Summary professionalism in health care system involves
presenting one‘s self in a way that is refined, polished, courteous, controlled, warm and
helpful.
2.3.4 Compassion
Compassion is the sympathy for others, with a desire to help (Opdebeeck and Habisch,
2011). It emerges from a belief in minimising self-interest and maximising mutually
beneficial transactions. It is about understanding one‘s responsibility for promoting
public morality and behaviour and in putting people first by being caring and empathetic
to the feelings, thoughts and experiences of team members, customers and patients
indiscriminately without judgement.

20
Phan (2004) highlights that the problem for many managers today lies in the fact that by
only adhering to the letter of the law, they believe they are ethical to the spirit or core of
their business or organisation but ethics is more than compliance to the law. This applies
to compassion for everyone, every stakeholder, every customer, and every employee. To
enact compassionate management in a corporation, compassionate management must be
grounded in ethics, not just in compliance. It is crucial to educate everyone in the culture
of compassion before any short-term perceived gain. Great companies also identify the
systemic points of pain that their customers experience in transactions and then do
something to relieve that pain (Goodman, 2009).
Crowford et al. (2011) point out that compassion is not a peripheral topic in relation to
health care delivery or health and wellbeing. They posit that there are physical,
psychological and social benefits of being compassionate to ourselves and others.
Referring specifically to practices and receipt of compassion as a key factor in affecting
our mental states, Crowford et al. (2011) point out that we can take on a different mind
state and mentalities that organize our motivation, attention, thinking, and behaving in
particular ways according to different types of relationship and relating goals. For
example when interacting with a potential sex partner, a friend, a hostile stranger, or our
loved child, what we are motivated to do, what we attend to do, how we think and reason
and what we actually do then and subsequently will be quite different. Importantly when
our minds are primed for compassion, we tend to be helpful, friendly, sensitive to
distress, and show insightful empathy and similar behaviours. In contrast, when our
minds are threat or competitive focused, our motivations are to avoid punishment, and
our attentional sensitivity is to threats in the environment (such as bureaucratic
requirements) and behaviours are primarily defensive to avoid trouble or falling behind.
Crowford et al. (2011) further aver that different mentalities which prime complex
psychological processes emerge in different social context and this is why we know that
the social context can bring out the best or the worst in us. In the increasing target driven,
busy, bureaucratic culture of health care, where individual practitioners are intensively
audited, and monitored, or told that their jobs hang in the balance, the very thing that
health care traditionally aspires to caring for people in various context of physical and
psychological distress may be severely compromised. Hence it is worth noting that,

21
people must always come before numbers. Individual patients and their treatment are
what really matters. Statistics, benchmarks and action plans are tools not ends in
themselves. They should not come before patients and their experiences. This is what
must be remembered by all those who design and implement policy for the health care
systems.
Gianforte (2008) holds that another way of expressing compassion is through initiatives
and problem solving. In business, as in life, it‘s often wise to seize the initiative. Reacting
to problems after they occur is usually more expensive than addressing them proactively.
It also usually means that the problem gets bigger than it would have been if it got nipped
in the bud. Being proactive involves anticipating and solving problems before they arise
and taking ownership when they arise thus, turning a problem into an opportunity to
exceed the patient‘s or client‘s expectations. A proactive approach to customer service
delivers many benefits. First, it significantly improves the quality of customer service.
Second, proactive customer service reduces costs, and thirdly, proactive communications
allows organizations to support more customers and more products within existing
staffing levels. The proactive customer services can be achieved through, proactive
messaging, proactive processes and proactive quality assurance.
Similarly, compassion can also be expressed through being customer oriented.
VanVactor (2013) acknowledges that patient centered care recognizes the client as the
most important member of a care team designed around holistic (preventive and
reactive), evidence-based care. These thoughts are in line with Matzer et al. (2007) who
pointed out that success in today‘s competitive environment requires a sustained
customer focus. Organizations cannot achieve an integrated customer orientation simply
by marshalling policies which extol the virtues of service to customers but rather, they
must develop an effective organizational support.
The Institute of Medicine cited in Jayadevappa and Chhatre (2011) listed patient-centered
care as one of the six aims for improvement in its 2001 report ‗Crossing the Quality
Chasm‘ and defines patient-centered care as care that respects and responds to the
individual patient‘s preferences, needs and values and ensures that clinical decision
incorporates patients‘ values. Patient-centered care may have important benefits for

22
patients through improved communication, appropriate intervention, enhanced
satisfaction and patient reported outcomes, and finally biomedical outcomes.
Jayadevappa and Chhatre (2011) noted that the term patient-centered care is used in
many contexts and relations to characteristics of patients and providers. It has been
suggested that one of the barriers to the effective implementation of patient-centered care
is the ambiguity of its definition and key components. Patient-centered care implies
individualized patient care based on patient specific information rather than focusing
exclusively on the disease. This creates a comprehensive healthcare approach, where the
physician tries to see the illness through the patient‘s perspective, and is responsive to the
patient‘s needs and preferences.
Jayadevappa and Chhatre (2011) continue to say that implementation of patient-centered
care has also led to a decrease in the average length of stay, improved patient satisfaction,
and efficient and effective treatments, leading to lower costs of care. From the
perspective of a provider, via high quality patient-centered care, institutions are able to
create a brand name that keeps its old consumers and draws in new ones. Thus, patient-
centered care model is being increasingly recognized as important for the delivery of
high quality care.
Matzer et al. (2007) argued that the foregoing means that a strategic customer orientation
management presents a new opportunity for organizations and should be regarded as a
positive and competitive tool. In this way there is need for managers to pay serious
attention to the internal dynamics of the organization‘s systems and structure which are
supportive of, and well attuned to, an overall culture of customer orientation. Implicitly,
it can be deduced that each organization‘s customer orientation profile will vary
according to variations in management beliefs and behaviour. Management behaviour
creates, and in turn, is reinforced by, organizational characteristics. Consequently, a
change in organizational behaviour in pursuit of customer-driven goals requires, first and
foremost, a customer-oriented attitude on the part of the organization‘s top leaders and
customer-driven organizational systems.

23
2.3.5 Respect
According to Opdebeeck and Habisch (2011), respect is demonstrating to people that
they have value and are important to you. It is a demonstration of genuine care about
them, their feelings and existence. Likewise it is a demonstration that you enjoy their
company and conversations. Thus, in business it is a display of gratitude, consideration
and importance. Establishing respect with new customers is extremely important. Respect
is the result of true selflessness; that is, doing things with the knowledge that they are the
right things to do not because you expect something in return. Respectful people nurture
positive relationships with their customers and co-workers.
In enhancing health care service delivery, Saha et al. (2008) underscore the significance
of patient respect. It is not just a mere call but mandatory for medical service providers to
respect patients as individuals, respect their values, preferences and expressed needs.
Respect for patients health beliefs, cultural diversity and recognizing their role in
effective health care delivery. Saha et al. emphasize the need for the patients‘ values as a
guide of all clinical decisions for enhanced service delivery.
2.4 Price-related Factors Influencing the Utilization of Health Care Services
According to Morgan and Rego (2009), customer price perceptions are widely believed
to be fundamental determinants of the customer‘s choice and post-purchase attitudes and
behavior. Thus, extent to which customers perceive the products in the healthcare
facility‘s portfolio as being lower in price, should result in greater customer satisfaction
and loyalty and thus lead to enhanced sales and market share, which in turn may lead to
economies of scale and superior financial performance. In contrast, Donoghue and de
Klerk (2009) draws attention to the general consensus in consumer complaint behavior
theory that highly priced, complex products (high in perceived risk) with a relatively long
life expectancy generate a higher incidence of public complaints.
Discussing the concept of value for money, Evans (2002) argued that satisfaction is not
only based on perceived quality but, is influenced by other factors such as charges. Evans
defines value as the ratio of perceived benefit to perceived costs. McDougall and

24
Levesque (2000) elaborate the concept of value by viewing perceived value as benefits
received relative to costs. They argue that perceived value suggests that customers are
looking for the right level of quality in relation to the price they have to pay, and
therefore, it can be said that quality and value are more indicative of the soundness of
private healthcare management. Broadly defined, perceived value is the results or
benefits customers receive in relation to total costs, which include the price paid plus
other costs associated with the purchase. In simple terms, they refer value as the
difference between perceived benefits and costs. They contend that customers are
mindful of the costs of obtaining a service and costs matter in relation to satisfaction and
loyalty. Therefore, in making repurchase decisions, customers are likely to consider
whether or not they received ―value for money‖. The authors emphasize the importance
of recognizing that there may be situations where customers may be ―satisfied‖ with
―what‖ was delivered (the product) and ―how‖ it was delivered (the customer service) but
may not have felt they got their ―money‘s worth.‖
Kastanioti et al. (2011) identified strategic issues in healthcare management and noted
that rising health care costs and access to affordable coverage are prominent issues for
health care providers and lives of millions of people. Analysis on costs of various
interventions become essential not only for medical practitioners and hospital
administrators, but also for governments and health-care policymakers since cost can be a
huge hindrance to the national health care service delivery objectives. The driving forces
behind rising health care costs, however, are often misunderstood. There are several key
cost drivers that combine together to drive up the cost of health care. Understanding why
health care coverage costs are increasing is crucial for both public and private sectors so
as to work effectively together to address these issues. The cost drivers explored in this
study are;
2.4.1 Technology
Health care technology and scientific discoveries have revolutionized the health care
industry. Innovations have resulted in vaccines, antibiotics, sophisticated heart disease
care, surgical advances and procedures, medical devices (such as CT scanners and
implantable defibrillators), and cancer treatment (The Congress of the United States,

25
Congressional Budget Office [CBO] (2008). Few areas of medicine have remained
unaffected by some degree of new medical technology. Unfortunately, over utilization
and misuse of new technology has led to excessive spending and even higher costs for
patients. According to Callahan (2008), new and increased use of technology accounts
for between forty and fifty percent of annual health care cost increases. Some types of
technology are a wasted cost because it costs more for the new equipment and training of
caregivers than it would to use previous protocols.
There are three primary cost drivers when it comes to the increase in technological costs.
First, when patients who do not pay directly for their health care received services, they
place unrealistic demands on their physician to run unnecessary diagnostics and
treatment. Second, new technology might be adopted because of its "clinical superiority"
to existing technology, but it does not necessarily offer the highest value for a patient.
Finally, no market mechanism is in place to determine the value of medical technology,
so cost-effectiveness is out the window (Beever et al., 2004).
2.4.2 Prescription Drugs
Over the past decade, there has been an escalating burden of high cost of prescription
drugs. Three main driving factors of this dramatic increase in prescription drug costs
have been linked to more prescriptions being written, price inflation, and a shift towards
use of higher-cost drugs. On the positive side, the increased use of generic drugs provides
an opportunity for slowing the growth in costs, while preserving health care quality. With
the global escalating healthcare cost, governments of many countries have adopted on-
going series of cost-containment attempts in an effort to spend their limited financial
resources efficiently so that equitable access to healthcare can be provided. One of the
many ways to control healthcare expenditure is to promote the use of cheaper generic
drugs instead of the more expensive branded equivalents. Savings made by using generic
medicines allows more patients to be treated with the same amount of money and
mobilizes funds to finance other treatment modalities (El-Dahiyat and Kayyali, 2010).

26
2.4.3 Laboratory Test Fees
An effective laboratory service is an essential part of a functioning health service. It
provides confirmatory diagnosis and improved management of diseases, essential public
health information and disease surveillance. This makes laboratory an important aspect of
diseases. It stands as a pillar in measurement of the true effectiveness of interventions
and conducting disease surveillance since without an effective laboratory service,
diagnoses are missed and expensive drug treatments go into wastes and the resulting
public health is inaccurate (Dacombe et al., 2006).
In Kenya while cost of the provision of laboratory services in private facilities is borne
by the patients, in public sector it is on a co-pay basis i.e. the service is subsidized. This
poses a challenge especially to the low income members of the population. The challenge
is manifested in two perspectives. The actual cost of laboratory diagnosis in some cases
is too high for the low income patients. Secondly, due to under development of the
laboratory services across the country, it means that not all health facilities have
sufficient machines and equipment for the laboratory tests. This calls for referrals to other
facilities of which may not be easily accessed by the patients due to distance and
infrastructural challenges thus increasing the actual cost of seeking laboratory services
for the already burdened population. Understanding of the role and true cost of laboratory
services has a critical role in supporting the delivery of essential health package
(Dacombe et al., 2006). A too high cost may be a real hindrance to effective delivery of
health care services across the country.
2.4.4 Doctor’s Consultation Fee
In a managed health care situation (where the patient is insured), the fee charged by the
doctor ranked eight out of the ten most significant important factors that influence the
choice of a family physician. This situation ranking may not stand for the fee for service
arrangements where patients pay directly from their pockets. Despite this, the study
strongly points out to the significance of the doctor‘s fee to patients (Hanna et al., 2004).

27
2.5 Chapter Summary
The chapter focused on the views of other scholars on the factors that affect health care
service utilization. The chapter started by looking at the product quality factors that
influence utilization of healthcare services, the customer service factors that influence
utilization of healthcare services and finally, the price-related factors that influence
utilization of healthcare services. The chapter has highlighted the various variables for
each of these three factors. The next chapter focuses on the methodology adopted for this
study.

28
CHAPTER THREE
3.0 RESEARCH METHODOLOGY
3.1 Introduction
The purpose of the study was to explore the factors that influence utilization of healthcare
services in private health facilities from a strategic healthcare management perspective.
This chapter looks at the research methodology that was used in this study. The chapter
discusses the research design, population and sampling design, data collection methods,
research procedures and data analysis methods.
3.2 Research Design
This study adopted a descriptive research design. Salaria (2012) describe this research
design as one which concerns itself with the present phenomena in terms of conditions,
practices beliefs, processes, relationships or trends. According to Aggarwal (2008),
descriptive research is devoted to the gathering of information about prevailing
conditions or situations for the purpose of description and interpretation. This type of
research method is not simply amassing and tabulating facts but includes proper analyses,
interpretation, comparisons, identification of trends and relationships. This research
design was appropriate for this study since the study sought to establish whether the said
variables and health care service utilization were correlated in one way or another. The
dependent variable for this study was the health care utilization while the independent
variables were: product quality factors, customer care factors and price related factors.
3.3 Population and Sampling Design
3.3.1 Population
Cooper and Schindler (2006) define a population as a group of people or elements about
which inferences is generalized. Nafula (2011) indicates that the private sector in Kenya
owns 58% of all healthcare institutions and is generally better equipped and resourced,

29
thus they provide services such as laboratory and imaging, which are not usually
available in public health facilities. However, about 60 percent of care is delivered in the
public sector with the the private health facilities accounting for the remaining 40 per
cent. It is also worth noting that the health care utilization rate in Kenya is approximately
77% for those who are sick, meaning that a large percentage of the population does not
seek care in the registered formal institutions when ill (Turin, 2010). Thika Sub County
has a population of approximately 311,035 (KNBS, 2009). According to KNBS (2013),
the estimated annual country population growth rate in 2012 was 2.44%.
3.3.2 Sampling Design
3.3.2.1 Sampling Frame
A sampling frame is a list of elements that are present in the population from which the
sample will be drawn from (Cooper and Schindler, 2006). It is a list or other device used
to define a researcher's population of interest and defines a set of elements from which a
researcher can select a sample of the target population. It can be represented by the entire
target population or a section of it (Garson, 2012). According to Ministry of Medical
Services and Ministry of Health and Sanitation (2012) the government seeks to maximize
health outcomes by organizing health service delivery around a four tiered health system
namely: Community, Primary care, Primary referral and county referral services.
The Ministry of Medical Services and Ministry of Health and Sanitation (2012) explain
that the community services will comprise of all community based demand creation
activities organized around the Comprehensive Community Strategy defined by the
Health Sector; the primary care services will comprise all dispensaries, health centers and
maternity homes of both public and private providers; The county referral services will
include hospitals operating in, and managed by a given county, made up of all the former
level 4 and district hospitals in the county – government, and private, and the national
referral services will include the service units providing tertiary / highly specialized
services including high level specialist medical care, laboratory support, blood product
services, and research. Since Thika Sub-county is at the district level, the sampling frame
comprised one representative healthcare facility from each of the first three tiered
30
systems namely, community, primary care and primary referral services. The population
unit was the patients who visited these health facilities daily.
3.3.2.2 Sampling Technique
A stratified sampling technique was adopted for this study. This method of sampling
ensures that each stratum is properly represented so that the sample drawn from it is
proportionate to the stratum‘s share of the population (Fricker, 2007). The stratification
followed the three tiered system which classified the health facilities into community,
primary health care and county health care. Equal stratification of the sample size was
carried out in order to compare results from each tier. Kothari (2004) recommend that
equal sample selection from each stratum is more efficient even if the strata differ in
sizes.
3.3.2.3 Sample Size
A sample size represents a subset (any combination of sampling units that does not
include the entire set of sampling units that has been defined as the population) of a
sampling units from a population (Garson, 2012). This gives the entire number of
population elements from which data is to be actually collected. The sample size was
determined using the following formula provided by Gill and Johnson (2010):
n = P% (100%-P%)Z2
E2
Where:
n = the sample size required
P = the percentage occurrence of a state or condition
E = the percentage maximum error required. In this study, a 10% margin of error
was accepted. This is suggested by Rea and Parker (2012) as a practical rule of
thumb for the maximum error level accepted in most social research.
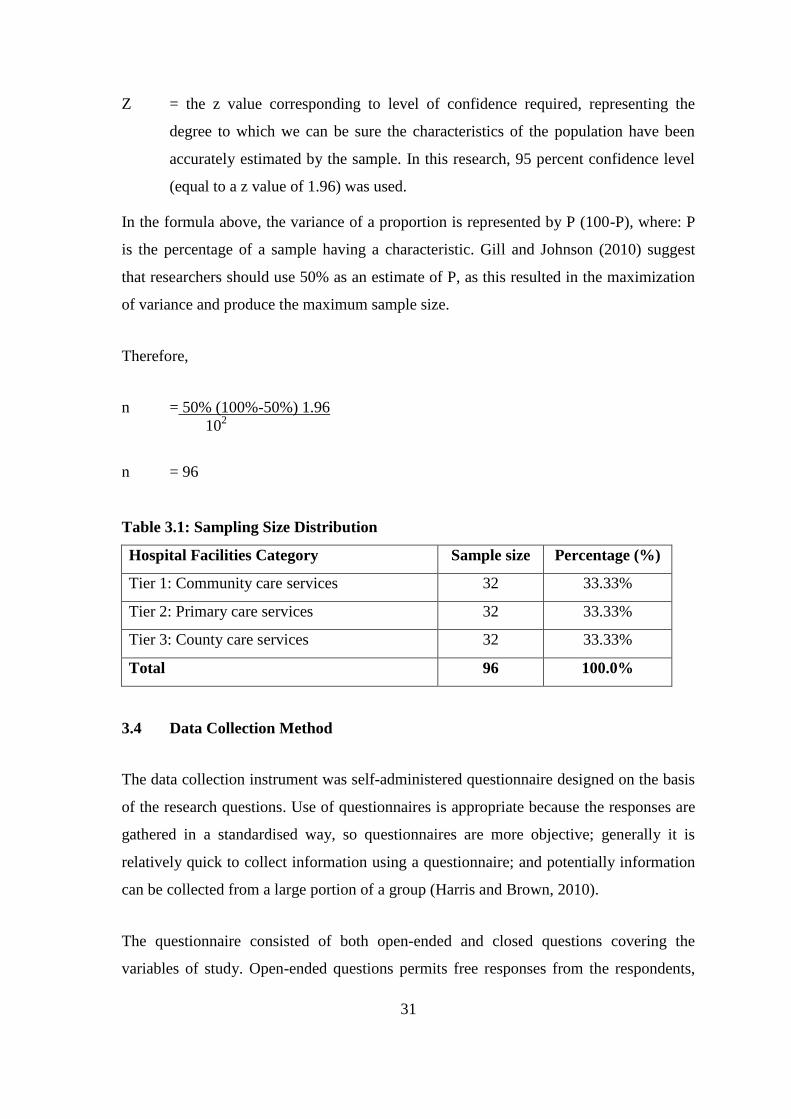
31
Z = the z value corresponding to level of confidence required, representing the
degree to which we can be sure the characteristics of the population have been
accurately estimated by the sample. In this research, 95 percent confidence level
(equal to a z value of 1.96) was used.
In the formula above, the variance of a proportion is represented by P (100-P), where: P
is the percentage of a sample having a characteristic. Gill and Johnson (2010) suggest
that researchers should use 50% as an estimate of P, as this resulted in the maximization
of variance and produce the maximum sample size.
Therefore,
n = 50% (100%-50%) 1.96
102
n = 96
Table 3.1: Sampling Size Distribution
Hospital Facilities Category Sample size Percentage (%)
Tier 1: Community care services 32 33.33%
Tier 2: Primary care services 32 33.33%
Tier 3: County care services 32 33.33%
Total 96 100.0%
3.4 Data Collection Method
The data collection instrument was self-administered questionnaire designed on the basis
of the research questions. Use of questionnaires is appropriate because the responses are
gathered in a standardised way, so questionnaires are more objective; generally it is
relatively quick to collect information using a questionnaire; and potentially information
can be collected from a large portion of a group (Harris and Brown, 2010).
The questionnaire consisted of both open-ended and closed questions covering the
variables of study. Open-ended questions permits free responses from the respondents,
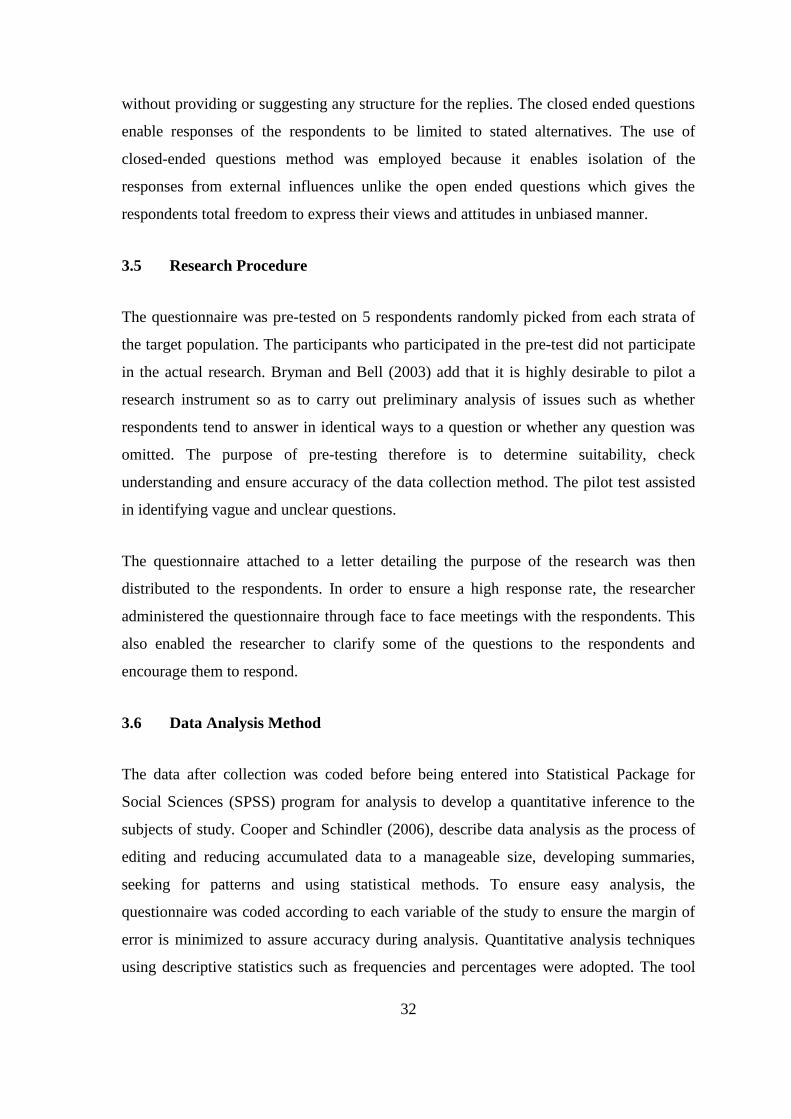
32
without providing or suggesting any structure for the replies. The closed ended questions
enable responses of the respondents to be limited to stated alternatives. The use of
closed-ended questions method was employed because it enables isolation of the
responses from external influences unlike the open ended questions which gives the
respondents total freedom to express their views and attitudes in unbiased manner.
3.5 Research Procedure
The questionnaire was pre-tested on 5 respondents randomly picked from each strata of
the target population. The participants who participated in the pre-test did not participate
in the actual research. Bryman and Bell (2003) add that it is highly desirable to pilot a
research instrument so as to carry out preliminary analysis of issues such as whether
respondents tend to answer in identical ways to a question or whether any question was
omitted. The purpose of pre-testing therefore is to determine suitability, check
understanding and ensure accuracy of the data collection method. The pilot test assisted
in identifying vague and unclear questions.
The questionnaire attached to a letter detailing the purpose of the research was then
distributed to the respondents. In order to ensure a high response rate, the researcher
administered the questionnaire through face to face meetings with the respondents. This
also enabled the researcher to clarify some of the questions to the respondents and
encourage them to respond.
3.6 Data Analysis Method
The data after collection was coded before being entered into Statistical Package for
Social Sciences (SPSS) program for analysis to develop a quantitative inference to the
subjects of study. Cooper and Schindler (2006), describe data analysis as the process of
editing and reducing accumulated data to a manageable size, developing summaries,
seeking for patterns and using statistical methods. To ensure easy analysis, the
questionnaire was coded according to each variable of the study to ensure the margin of
error is minimized to assure accuracy during analysis. Quantitative analysis techniques
using descriptive statistics such as frequencies and percentages were adopted. The tool

33
that was used is the Statistical Package for Social Scientists program. Measures of central
tendency such as mean were computed. Spearman‘s Rank Correlation Coefficient was
used to determine the relationship between the study variables.
3.7 Chapter Summary
The chapter has explained the type of research design used, population, sampling design
including sampling technique, sample frame and sample size. It has also detailed the data
collection methods, research procedures and data analysis techniques adopted. The next
chapter presents the results and findings of the study.

34
CHAPTER FOUR
4.0 RESULTS AND FINDINGS
4.1 Introduction
This chapter presents the analysis of the study findings. The chapter begins with the
descriptive statistics of respondents‘ general information. The rest of the chapter is
thematically organized based on the research questions. These were: What are the
product quality factors that influence utilization of healthcare services in private health
facilities in Thika Sub County? What are the customer service factors that influence
utilization of healthcare services in private health facilities in Thika Sub County? What
are the price-related factors that influence utilization of healthcare services in private
health facilities in Thika Sub County? Out of the 96 questionnaires that were
administered, 94 were successfully filled and returned. This is equivalent to a response
rate of 98% as shown in table 4.1.
Table 4.1: Response Rate
Strata Percentage Distribution
Responded Did not respond
Community Care Services 32 1
Primary Care Services 32 1
County Health Care Services 33 0
Total 98 2
4.2 General Information
The general information sought in the study included respondents‘ demographics such as
gender, age, medical condition and disability, level of income, frequency of healthcare
visits, average spend per visit and determinant of health facility choice. The findings are
analyzed as follows.

35
4.2.1 Gender of Respondents
The distribution of respondents by gender is shown in table 4.2. The table shows that
females accounted for 71.3% of the respondents whereas males were only 28.7%.
Therefore, majority of the respondents were female. These results suggest that healthcare
services at Thika Sub-County were mainly visited by female clients.
Table 4.2: Distribution of Respondents by Gender
Gender
Distribution
Frequency Percent
Male 27 28.7
Female 67 71.3
Total 94 100.0
4.2.2 Age of Respondents
Respondents were asked to indicate their age brackets. Table 4.3 shows that 73.4% of the
respondents were in the age bracket of 35-51 years. This was followed by 13.8% of the
respondents aged between 19-35 years and 8.5% of the respondents aged more than 69
years. Some 2.1% of the respondents were aged less than 18 years whereas another 2.1%
were aged between 52 to 68 years. Therefore, majority of the respondents were in the age
bracket of 35 to 51 years.
Table 4.3: Distribution of Respondents by Age
Age group
Distribution
Frequency Percent
Less than 18 years 2 2.1
19-35 years 13 13.8
35-51 years 69 73.4
52-68 years 2 2.1
More than 69 years 8 8.5
Total 94 100.0
36
4.2.3 Disability Status
The question sought to establish whether respondents had any form of disability. As table
4.4 shows, 98.9% of the respondents did not have any form of disability. However, 1.1%
of the respondents said yes. Therefore, nearly all of the respondents did not have
disability.
Table 4.4: Disability Status
Responses
Distribution
Frequency Percent
Yes 1 1.1
No 93 98.9
Total 94 100.0
4.2.4 Medical Condition
Respondents were also asked whether they had any special medical condition. Table 4.5
shows that 89.4% of the respondents said no while 10.6% of the respondents said yes.
Therefore, majority of the respondents did not have any special medical condition.
Table 4.5: Special Medical Condition
Responses
Distribution
Frequency Percent
Yes 10 10.6
No 84 89.4
Total 94 100.0
4.2.5 Level of Income
The study sought to determine the level of income of respondents. Table 4.6 shows that
46.8% of the respondents earned less than Ksh.20,000. This was followed by 26.6% of
the respondents who earned from Ksh.20,001-50,000 and 22.3% with an income range
between Ksh.50,001 and Ksh.100,000. The table shows that only 4.3% earned more than
Ksh.100,000. On aggregate, it can be said that nearly three-quarters of the respondents
did not earn more than Ksh 50,000.

37
Table 4.6: Distribution of Respondents by Level of Income
Level of income
Distribution
Frequency Percent
Less than Ksh 20,000 44 46.8
Ksh 20,001-50,000 25 26.6
Ksh50,001-100,000 21 22.3
More than Ksh100,000 4 4.3
Total 94 100.0
4.2.6 Healthcare Utilization
Respondents were asked to indicate how often they sought services from the health
facility. Table 4.7 shows that majority (64.9%) of the respondents sought services from
the health facility occasionally. However, 17% of the respondents said they did so often,
and 18.1% of the respondents sought healthcare services in the facilities quite often.
Table 4.7: Frequency of Healthcare Visits
Frequency
Distribution
Frequency Percent
Occasionally 61 64.9
Often 16 17.0
Quite often 17 18.1
Total 94 100.0
4.2.7 Average Spend per Visit
The study sought to establish on average how much respondents did spend on health
services per visit. According to Table 4.8, more than 50% of the respondents spent an
amount not exceeding Ksh.2,000 with 39.4% spending an average of Ksh.1001-2000.
The table however shows that 20.2% of the respondents spent on average Ksh.2001-
3000; 10.6% of the respondents spent between Ksh.3001-4000 while 16.0% of the
respondents spent an average of more than Ksh.4000 per visit.

38
Table 4.8: Average Spend per Visit
Amount spent
Distribution
Frequency Percent
Less than KSh. 1,000 13 13.8
Ksh. 1001-2000 37 39.4
Ksh. 2001-KSh. 3000 19 20.2
Ksh. 3001-4000 10 10.6
More than Ksh.4000 15 16.0
Total 94 100.0
4.2.8 Determinant of Choice of Health Facility
Respondents were asked to indicate the most important factor that influenced their choice
of the health facility/hospital to visit. The results have been summarized and represented
in figure 1. The figure shows that the competence of healthcare staff in terms of making
correct diagnosis and prescription was the top most factor considered by majority
(58.3%) followed by quick service (19.8%) and the courtesy and friendliness of staff
(17.7%). The figure shows that ambience of cleanliness and state of the art of the facility
also influenced 12.5% of the respondents in terms of their choice and 10.4% considered
convenience and accessibility of the health facility as the top most factor. Some 7.3% of
the respondents also mentioned affordability as a factor.
58.3
19.8 17.712.5 10.4
7.3
0.0
10.0
20.0
30.0
40.0
50.0
60.0
70.0
Competence of
staff/correct
diagnosis and
prescription
Quick service Courtesy and
friendliness
Ambience of
cleanliness and
state of the art
facility
Convenience
and accessibility
Affordability
% f
req
uen
cy
Figure 1: Most Important Factor in Choosing Health Facility

39
4.3 Product Quality Factors that Influence Utilization of Healthcare Services
Dimensions of product quality analyzed in this section includes: product‘s efficiency as
measured by speed of service, simplicity of process and administration; reliability which
is represented by consistency and accuracy; and physical attributes which includes
cleanliness and access. These are analyzed as follows:
4.3.1 Efficiency
The measures of efficiency included waiting time, simplicity of process and
administration requirements. The opinion of respondents was sought as to whether they
only waited a short time to see a doctor. Table 4.9 shows that 51.6% of the respondents
agreed and a further 15.1% of the respondents strongly agreed. However, 11.8% of the
respondents were neutral while 19.4% and 2.2% of the respondents disagreed and
strongly disagreed. Therefore, majority of the respondents agreed that their waiting time
to see a doctor was short. On a scale of 1 to 5, a mean score of 3.58 was established,
implying that the efficiency in terms of speed was just above average.
Respondents were asked to indicate whether the payment process was simple. 54.3% and
21.3% of the respondents agreed and strongly agreed, respectively. The table however
shows that 9.6% of the respondents were neutral whereas 12.8% disagreed and 2.1%
strongly disagreed. A mean score of 3.8% was established, suggesting that majority of
the respondents were generally in agreement with this view. Similarly, 56.4% and 21.3%
of the respondents agreed and strongly agreed respectively, that there were few
administrative requirements, yielding a mean score of 3.86. Even so, 12.8% of the
respondents were neutral, 6.4% of the respondents disagreed and 3.2% strongly
disagreed.
Table 4.9: Respondents’ Views on Efficiency of Health Facility
Efficiency
Mean Strongly
Agree Agree Neutral Disagree
Strongly
Disagree
I only wait a short time to
see a doctor
3.58 15.1% 51.6% 11.8% 19.4% 2.2%
The payment process is
very simple
3.80 21.3% 54.3% 9.6% 12.8% 2.1%
There are few
administrative
requirements
3.86 21.3% 56.4% 12.8% 6.4% 3.2%

40
4.3.2 Reliability
As a measure of reliability, the variables looked at included consistency and correctness.
Table 4.10 shows that 43.6% of the respondents agreed and another 25.5% strongly
agreed that the services were of high quality. However, 25.5% of the respondents were
neutral while 5.3% of the respondents disagreed. A mean score of 3.89 was established
on a scale of 1 to 5, suggesting that on average, the service quality was perceived as high.
In terms of correctness, 42.6% and 16.0% of the respondents agreed and strongly agreed,
respectively, that staff rarely made mistakes. However, 27.7% of the respondents were
neutral, 10.6% of the respondents disagreed and 3.2% strongly disagreed. This yielded a
mean score of 3.57 which implies that reliability as measured by correctness of service
by staff of the health facility was above average.
Table 4.10: Respondents’ Views on Reliability of Health Facility
Reliability
Mean Strongly
Agree Agree Neutral Disagree
Strongly
Disagree
The services are of high
quality
3.89 25.5% 43.6% 25.5% 5.3% 0.0%
The quality of the services
I receive are
consistent
3.88
23.7% 49.5% 19.4% 6.5% 1.1%
Staff rarely make
mistakes
3.57 16.0% 42.6% 27.7% 10.6% 3.2%
4.3.3 Physical Attributes
Aspects of physical attributes assessed in the study included cleanliness of the facilities,
distance, road network, parking space and consideration for the physically challenged.
Table 4.11 shows that 57.4% of the respondents agreed and 30.9% strongly agreed that
the facilities were generally clean and well arranged. However, 6.4% of the respondents
were neutral, 4.3% disagreed and 1.1% strongly disagreed. A high mean score of 4.13
was computed from a scale of 1 to 5, implying that high level of cleanliness was
maintained at the facilities.

41
The table also shows that 41.5% and 29.8% of the respondents agreed and strongly
agreed respectively, that the facilities were near enough. However, 13.8% of the
respondents were neutral and another 13.8% and 1.1% disagreed and strongly disagreed,
respectively. The variable yielded a mean score of 3.85, implying that the facilities were
in close proximity to the respondents. The table further shows that 52.1% of the
respondents and 24.5% agreed and strongly agreed, respectively, that there were clear
roads leading to the facilities. The results showed a mean score of 3.91 which indicated
that the road network leading to the facility was clear. Nevertheless, 13.8% of the
respondents were neutral whereas 9.6% of the respondents disagreed.
Regarding parking space, 38.3% and 14.9% of the respondents agreed and strongly
agreed that there was ample parking space at the facility. However, 28.7% of the
respondents were neutral while 17.0% and 1.1% disagreed and strongly disagreed,
respectively. On a scale of 1 to 5, the mean score for this variable was 3.49; this implies
that on average, respondents were non-committal about whether there was ample parking
space or not.
However, asked about provisions for the physically challenged, 34.0% of the respondents
disagreed and a further 7.4% strongly disagreed. The table shows that 25.5% of the
respondents were neutral whereas only 21.3% and 11.7% of the respondents agreed and
strongly agreed, respectively, that there was provision to cater for the physically
challenged.
Table 4.11: Respondents’ Views on Physical Attributes of Health Facility
Physical attributes
Mean Strongly
Agree Agree Neutral Disagree
Strongly
Disagree
koThe facilities are
generally clean and
well arranged
4.13 30.9% 57.4% 6.4% 4.3% 1.1%
The facilities are near
enough
3.85 29.8% 41.5% 13.8% 13.8% 1.1%
There are clear roads
leading to the facilities
3.91 24.5% 52.1% 13.8% 9.6% 0.0%
There is ample parking
space at the facility
3.49 14.9% 38.3% 28.7% 17.0% 1.1%
There are provision to
cater for the physically
challenged in form of
ramps and lifts
2.96 11.7% 21.3% 25.5% 34.0% 7.4%

42
The correlation between utilization of healthcare facilities and the product quality factors
was further tested as shown in table 4.12. The table shows that utilization of healthcare
facility was positively correlated to: efficiency (r=.753, p<.05); communication language
(r=.343, p<.05), product reliability (r=.519, p<.01) and cleanliness of the facility (r=.521,
p<.01). The findings imply that utilization of healthcare facility increases with
improvements in product quality dimensions.
Table 4.12: Correlation of Utilization of Healthcare Facility and Product Quality
Spearman's rho 1
1 Utilization of healthcare facility Correlation Coefficient 1.000
Sig. (2-tailed) .
N 94
2 Efficiency Correlation Coefficient .753(*)
Sig. (2-tailed) .033
N 94
3 Communication Correlation Coefficient .343(**)
Sig. (2-tailed) .001
N 94
4 Reliability Correlation Coefficient .519(**)
Sig. (2-tailed) .000
N 94
5 Cleanliness Correlation Coefficient .521(**)
Sig. (2-tailed) .000
N 94
** Correlation is significant at the 0.05 level (2-tailed).
** Correlation is significant at the 0.01 level (2-tailed).
4.4 Customer Service Factors that Influence Utilization of Healthcare Services
In this section, the main variables were: staff attitudes, professionalism, compassion,
respect and professionalism. The findings are analyzed as follows:
4.4.1 Staff Attitudes
The views of the respondents were sought as to whether they could easily approach the
staff at the health facilities, 61.7% and 30.9% of the respondents agreed and strongly
agreed, respectively. Some 5.3% of the respondents were neutral whereas 2.1%

43
disagreed. A high mean score of 4.21 was established, suggesting that staff of the
facilities were generally approachable.
The table also shows that 58.5% of the respondents agreed and a further 27.7% strongly
agreed that the staff at these facilities took time to listen to listen to them. However, 9.6%
of the respondents were neutral while 4.3% of the respondents disagreed. This measure
also yielded a high mean score of 4.10 on a scale of 1 to 5, implying that staffs at the
facilities were caring. Likewise, 51.1% and 37.2% of the respondents agreed and strongly
agreed, respectively, that staff of the facilities were friendly; with the variably returning a
high mean score of 4.20. Nevertheless, 7.4% of the respondents were neutral, 3.2%
disagreed and 1.1% strongly disagreed.
Table 4.13: Respondents’ Views on the Attitudes of Staff in Health Facility
Staff attitudes
Mean Strongly
Agree Agree Neutral Disagree
Strongly
Disagree
I can easily approach
the staff at these
facilities
4.21 30.9% 61.7% 5.3% 2.1% 0.0%
Staff at these facilities
care for my needs
4.10 27.7% 58.5% 9.6% 4.3% 0.0%
The staff at these
facilities takes time
to listen to me
4.11 31.9% 55.3% 6.4% 4.3% 2.1%
The staff are friendly
4.20 37.2% 51.1% 7.4% 3.2% 1.1%
4.4.2 Professionalism
The measures of professionalism used included efficient service, knowledgeable staff and
alternative measures. Table 4.14 shows that 53.2% and 37.2% of the respondents agreed
and strongly agreed, respectively, that they got served efficiently whenever they visited
the health facility. However, 8.5% of the respondents were neutral whereas 1.1% of the
respondents disagreed. The variable returned a high mean score of 4.27 on a scale of 1 to
5, which means that the services of the health facilities were efficient.

44
The views of the respondents were also sought as to whether respondents were
knowledgeable of their work. The table shows that 58.5% of the respondents agreed and
a further 28.7% strongly agreed. However, 10.6% of the respondents were neutral and
2.1% disagreed. Therefore, majority of the respondents agreed that staff were
knowledgeable. Regarding initiative, 45.7% and 26.6% of the respondents agreed and
strongly agreed, respectively, that the medical personnel didn‘t hesitate to change way of
offering service when one fails. However, 21.3% of the respondents were neutral and
6.4% of the respondents disagreed. The mean score for this variable was 3.93. This
suggests that on average, medical personnel at the hospital took alternative measures to
resolve patients‘ problems.
Table 4.14: Respondents’ Views on the Professionalism of Staff of Health Facility
Professionalism
Mean Strongly
Agree Agree Neutral Disagree
Strongly
Disagree
I get served efficiently
whenever I attend
4.27 37.2% 53.2% 8.5% 1.1% 0.0%
The staff are quite
knowledgeable of their
work
4.14 28.7% 58.5% 10.6% 2.1% 0.0%
Medical personnel don‘t
hesitate to change way
of offering service
when one fails
3.93 26.6% 45.7% 21.3% 6.4% 0.0%
4.4.3 Compassion
The perceptions of respondents were sought as to whether staff took the first initiative to
solve their problems. Table 4.15 shows that 54.3% of the respondents agreed and 27.7%
strongly agreed. However, 9.6% of the respondents were neutral while 8.5% disagreed.
On a scale of 1 to 5, the mean score was 4.01. This implies that the staff took initiative to
address clients‘ problems. Similarly, 45.7% and 30.9% of the respondents agreed and
strongly agreed, respectively, that the staff at the health facilities were sympathetic.
Seventeen percent (17.0%) of the respondents were neutral; 4.3% of the respondents
disagreed and 2.1% strongly disagreed. The mean score was 3.99, which implies that on
the whole, the staffs were sympathetic. Further, respondents were asked to indicate
whether they were recognized whenever they visited the health facility. Table 4.15 shows

45
that 46.8% and 25.5% of the respondents agreed and strongly agreed, respectively.
However,14.9% of the respondents where neutral whereas 12.8% of the respondents
disagreed. A mean score of 3.85 was determined, implying that clients felt recognized
when they visited the health facility.
Table 4.15: Respondents’ Views on the Compassion of Staff of Health Facility
Compassion
Mean Strongly
Agree Agree Neutral Disagree
Strongly
Disagree
The staff take the first
initiative to solve my
problems
4.01 27.7% 54.3% 9.6% 8.5% 0.0%
The staff are sympathetic 3.99 30.9% 45.7% 17.0% 4.3% 2.1%
I am recognized whenever
I visit
3.85 25.5% 46.8% 14.9% 12.8% 0.0%
4.4.4 Respect
In terms of respect, respondents were asked whether they were offered gratitude with
every visit. Table 4.16 shows that 55.3% of the respondents agreed and another 29.8%
strongly agreed. Some 7.4% of the respondents were neutral whereas 6.4% of the
respondents disagreed and 1.1% strongly disagreed. This yielded a high mean score of
4.06, implying that staff generally felt received with gratitude. Similarly, 46.8% and
36.2% of the respondents agreed and strongly agreed, respectively, that the staff were
considerate. However, 9.6% of the respondents disagreed and 6.4% and 1.1% of the
respondents disagreed and strongly disagreed, respectively. Lastly, respondents were
asked whether the personnel make them feel important. Table 4.16 shows that 47.9% of
the respondents agreed and 33% strongly agreed. Even so, 10.6% of the respondents were
neutral, 6.4% disagreed and 1.1% strongly disagreed.
Table 4.16: Respondents’ Views on the Respect of Staff of Health Facility
Respect
Mean Strongly
Agree Agree Neutral Disagree
Strongly
Disagree
I am offered gratitude
with every visit
4.06 29.8% 55.3% 7.4% 6.4% 1.1%
The staff are considerate
4.11 36.2% 46.8% 9.6% 6.4% 1.1%
The personnel make me
feel important
4.03 33.0% 47.9% 10.6% 6.4% 2.1%

46
4.4.5 Communication
In terms of communication, the opinion of respondents were sought as to whether staff
used the language they clearly understood. Table 4.17 shows hat 55.1% and 39.4% of the
respondents agreed and strongly agreed, respectively. Some 1.1% of the respondents
were neutral whereas 3.2% disagreed and 1.1% strongly disagreed. This yielded the
highest mean score of 4.29 on a scale of 1 to 5, which implies that respondents were
satisfied with the communication language used.
The study also sought to establish whether all procedures were fully explained to the
clients. Table 4.17 indicates that 45.7% of the respondents agreed and 29.8% strongly
agreed. Sixteen percent (16%) of the respondents were neutral whereas 5.3% of the
respondents disagreed and a further 3.2% strongly disagreed. The mean score was 3.94;
implying that the procedures were fully explained to respondents whenever they visited
the health facilities. The table also shows that 45.7% and 21.3% of the respondents
agreed and strongly agreed, respectively, that they were informed promptly in case of
new information. Sixteen percent (16%) of the respondents were neutral; 14.9% of the
respondents disagreed and 2.1% strongly disagreed. Therefore, majority of the
respondents agreed that they were informed promptly about any new information.
Table 4.17: Respondents’ Views on the Communication of Staff of Health Facility
Communication
Mean Strongly
Agree Agree Neutral Disagree
Strongly
Disagree
Staff use the language I
clearly understand
4.29 39.4% 55.3% 1.1% 3.2% 1.1%
All procedures are fully
explained to me
3.94 29.8% 45.7% 16.0% 5.3% 3.2%
I am informed promptly in
case of new
information
3.69 21.3% 45.7% 16.0% 14.9% 2.1%
4.4.6 Comparison of Service Quality between Types of Healthcare Facilities
The study sought to compare the respondents‘ views on service quality of healthcare
services of each type of facility. Table 4.18 shows that on aggregate, 87.3% of the

47
respondents who visited community healthcare facilities agreed that the services were of
high quality. This is higher than the distribution of respondents who sought healthcare
services from primary care facilities where the aggregate was 67.8%. County health care
facilities are trailing in respondents‘ perception of quality with only 53.2% agreeing that
the services were of high quality.
Table 4.18: Perception of Quality: Distribution by Type of Healthcare Facility
The services are of high quality
Distribution of Respondents by Tier
Community
Care
Services
Primary
Care
Services
County Health Care
Services
Disagree
Count 1 1 3
% within
count 3.2% 3.2% 9.4%
Neutral
Count 3 9 12
% within
count 9.7% 29.0% 37.5%
Agree
Count 20 10 11
% within
count 64.5% 32.3% 34.4%
Strongly agree
Count 7 11 6
% within
count 22.6% 35.5% 18.8%
Total Count 31 31 34
% within
count 100.0% 100.0% 100.0%
Respondents‘ views of customer care factors were correlated with their utilization of the
healthcare facilities to determine whether there was any significant influence. The results
in table 4.19 show that there was a statistically significant correlation between utilization
of healthcare facility and all the customer care factors. These are: caring service (r=.332,
p<.05); responsiveness (r=.675, p<.01); friendly staff (r=.660, p<.01); knowledgeable
staff (r=.634, p<.01); empathy (r=.520, p<.01) and respect (r=.607, p<.01). Therefore,
utilization of healthcare facility corresponded to the increase in the quality of customer
care factors.

48
Table 4.19: Correlation of Utilization of Healthcare Facilities and Customer Care
Spearman's rho 1
1 Utilization of healthcare facility Correlation Coefficient 1.000
Sig. (2-tailed) .
N 94
2 Caring service Correlation Coefficient .332
Sig. (2-tailed) . 011(*)
N 94
3 Responsiveness Correlation Coefficient .675(**)
Sig. (2-tailed) .000
N 94
4 Friendly staff Correlation Coefficient .660(**)
Sig. (2-tailed) .000
N 94
5 Knowledgeable staff Correlation Coefficient .634(**)
Sig. (2-tailed) .000
N 94
6 Empathy Correlation Coefficient .520(**)
Sig. (2-tailed) .000
N 94
7 Respect Correlation Coefficient .607(**)
Sig. (2-tailed) .000
N 94
* Correlation is significant at the 0.01 level (2-tailed).
** Correlation is significant at the 0.01 level (2-tailed).
4.5 Price Related Factors that Influence Utilization of Healthcare Services
In this section, the respondents‘ views on the cost of healthcare related services such as
use of equipment, drugs, laboratory tests and consultation fees are analyzed. Table 4.20
shows that 30.9% and 10.6% of the respondents agreed and strongly agreed, respectively,
that they could afford the cost charged for medical scans, x rays, radiations and other
equipment‘s for treatment with ease. On the other hand, 23.4% of the respondents were
neutral whereas 27.7% of the respondents disagreed and 7.4% strongly disagreed. The
mean score of 3.10 implies that respondents were indifferent as to the cost associated
with usage of medical equipment.

49
The table however shows that 45.7% and 10.6% of the respondents agreed and strongly
agreed, respectively, that the prescription drug charges were affordable. Some 22.3% of
the respondents were neutral while 20.2% of the respondents disagreed and a further
1.1% strongly disagreed. On aggregate, majority of the respondents agreed. Similarly,
47.9% of the respondents agreed and 11.7% strongly agreed, respectively, that private
health facilities offer laboratory tests at affordable prices. However, 22.3% of the
respondents were neutral, 20.2% of the respondents disagreed and a further 1.1%
strongly disagreed. Lastly, respondents were asked whether the Doctors fee charged by
these institutions is affordable. Likewise, 41.5% of the respondents agreed and 18.1%
strongly agreed. Seventeen percent (17.0%) of the respondents were neutral whereas
18.1% and 5.3% of the respondents disagreed and strongly disagreed, respectively.
Table 4.20: Respondents’ Views on the Price Charged at the Health Facility
Price
Mean Strongly
Agree Agree Neutral Disagree
Strongly
Disagree
I can afford the cost
charged for medical
scans, x rays,
radiations and other
equipment‘s for
treatment with ease
3.10 10.6% 30.9% 23.4% 27.7% 7.4%
The prescription drugs
charges are
affordable
3.45 10.6% 45.7% 22.3% 20.2% 1.1%
The private health
facilities offer
laboratory tests at
affordable prices
3.50 11.7% 47.9% 21.3% 17.0% 2.1%
The Doctors fee charged
by these institutions
is affordable.
3.49 18.1% 41.5% 17.0% 18.1% 5.3%
The study further sought to determine whether price factors significantly influenced the
utilization of healthcare facilities at the sub-county. As table 4.21 shows, charges on
treatment equipment (r=-.331, p<.05); cost of prescription drugs (r=-.331, p<.05), cost of
laboratory test (r=-.328, p<.05) and doctors fees (r=-.301, p<.05) were inversely related
to utilization of healthcare facilities. This suggests that utilization of healthcare facilities
increased with a decrease in cost of healthcare services.

50
Table 4.21: Correlation of Price and Utilization of Healthcare Facility
Spearman's Rho 1
1 Utilization of healthcare facility Correlation Coefficient 1.000
Sig. (2-tailed) .
N 94
2 Charges on treatment equipment Correlation Coefficient -.331(*)
Sig. (2-tailed) .020
N 94
3 Cost of prescription drugs Correlation Coefficient -.311(*)
Sig. (2-tailed) .017
N 94
4 Cost of laboratory tests Correlation Coefficient -.328(*)
Sig. (2-tailed) .024
N 94
5 Doctors fees Correlation Coefficient -.301(*)
Sig. (2-tailed) .016
N 94
* Correlation is significant at the 0.05 level (2-tailed).
4.6 Chapter Summary
This chapter has presented the results and findings of the study. The chapter began by a
presentation of the descriptive statistics of respondents‘ general information. The chapter
then analyzed the product quality factors that influence utilization of healthcare services
in private health facilities in Thika Sub County. It also analyzed findings concerning the
customer service factors that influence utilization of healthcare services in private health
facilities in Thika Sub County. Lastly, it presented the analysis of price-related factors
that influence utilization of healthcare services in private health facilities in Thika Sub
County. The next chapter discusses the findings, draws conclusions and makes
recommendations.

51
CHAPTER FIVE
5.0 SUMMARY, DISCUSSION, CONCLUSION AND RECOMMENDATIONS
5.1 Introduction
This chapter discusses the findings, draws conclusions and makes recommendations of
the study. The chapter begins with a summary of the research. Subsequently, the chapter
makes a detailed discussion of the study findings in keeping with the research objectives.
Conclusions are then drawn in view of the discussion to answer the research questions.
Lastly, the chapter makes recommendations for improvement and reflects on the
implications of the results for future research.
5.2 Summary
The purpose of the study was to explore the factors influencing the utilization of
healthcare services in private health facilities from a strategic healthcare management
perspective. The research questions were: What are the product quality factors that
influence utilization of healthcare services in private health facilities in Thika Sub
County? What are the customer service factors that influence utilization of healthcare
services in private health facilities in Thika Sub County? What are the price-related
factors that influence utilization of healthcare services in private health facilities in Thika
Sub County?
The study adopted a descriptive research design. The population comprised 311,035
people that made up Thika Sub-County. A stratified sampling technique was used.
Stratification was based on the first three of the four tiered health system described in
Kenya Health Policy (2012-2030). These were: community care, primary care and
primary referral. Data was collected from a total sample of 96 respondents using a
structured questionnaire. Descriptive statistical techniques including mean and
percentages were used to analyze data. Inferences were drawn using Spearman‘s Rank
Correlation Coefficient technique. This was aided by the use of the Statistical Package
for the Social Sciences.
52
The results showed that on aggregate, majority (69.1%) of the respondents agreed that
the healthcare services were of high quality. Comparatively, community care services
recorded the highest quality rating, with 87.3% of the respondents who visited
community healthcare facilities agreeing that the services were of high quality. This was
followed by healthcare services from primary care facilities where the aggregate was
67.8%. County health care facilities trailed in respondents‘ perception of quality with
only 53.2% agreeing that the services were of high quality. Competence of staff/correct
diagnosis and prescription ranked highest among the most important factor in choosing a
health facility with 58.3% of the respondents, followed by quick service (19.8%) and
courtesy and friendliness (17.7%).
In terms of product quality, the study showed a mean score of 3.58 on a scale of 1 to 5 for
speed, 3.80 for simplicity of payment process and 3.86 for simplicity of administrative
requirements. As a measure of reliability, a mean score of 3.89 and 3.57 was returned for
consistency and correctness, respectively. Cleanliness of the health facilities, distance,
road network, parking space and consideration for the physically challenged yielded a
mean score of 4.13, 3.85, 3.91, 3.49 and 2.96, respectively. Correlation results showed
that utilization of healthcare facility was positively correlated to: efficiency (r=.753,
p<.05); communication language (r=.343, p<.05), product reliability (r=.519, p<.01) and
cleanliness of the facility (r=.521, p<.01).
Regarding customer care factors, approachability of staff scored a mean of 4.21, caring –
4.10, listening – 4.11 and friendliness – 4.20. The results showed that efficiency scored a
mean of 4.27, knowledgeable staff – 4.14, and flexibility – 3.93. Further, staff initiative
recorded a mean score of 4.01, empathy – 3.99, and attention – 3.85. In addition, service
with gratitude had a mean score of 4.06, considerate attitude – 4.11 and patient‘s sense of
importance – 4.03. The mean score for respondents‘ perception of language used for
communication was 4.29, explanation of procedures was 3.94 and prompt passage of new
information was 3.69. Utilization of healthcare facility was positively correlated to caring
service (r=.332, p<.05); responsiveness (r=.675, p<.01); friendly staff (r=.660, p<.01);
knowledgeable staff (r=.634, p<.01); empathy (r=.520, p<.01) and respect (r=.607,
p<.01).

53
Concerning price related factors, equipment costs scored a mean of 3.10, cost of
prescription drugs – 3.45, laboratory test fees – 3.50 and doctor‘s fees – 3.49. An inverse
relationship was established between utilization of healthcare services and charges on
treatment equipment (r=-.331, p<.05); cost of prescription drugs (r=-.331, p<.05), cost of
laboratory test (r=-.328, p<.05) and doctors fees (r=-.301, p<.05).
5.3 Discussions
5.3.1 Product Quality Factors that Influence Utilization of Healthcare Services of
Private Healthcare Facilities
The study established that competence of healthcare staff in terms of making correct
diagnosis and prescription was the top most factor considered by majority (58.3%) of the
respondents as the most important factor influencing their choice of healthcare facility.
This was followed by quick service (19.8%) and the courtesy and friendliness of staff
(17.7%). These findings are consistent with what Jayadevappa and Chhatre (2011)
described as a patient-centered approach to healthcare which underscores the
administration of efficient and effective treatments within a short duration of time. That
majority (66.7%) of the respondents agreed that they only waited a short time to see a
doctor at the health facility implies that services offered were fairly fast. What these
findings imply to healthcare strategy is that staff need to get it right the first time, do so
humanely and attend to patients without keeping them waiting for a long time.
The implications of the foregoing findings concur with Hsu (2010) who posited that
efficiency levels will determine the level of penetration and actual outputs thus directly
affecting health care service delivery. For example, slow systems will curtail the number
of patients attended to in a given day within a facility. Waits and delays as well as long
queues in accessing services at various healthcare outlets have been previously identified
by (Kronfol, 2012) as organizational barriers that give a negative picture of the facility
thus discourages would be clients. That majority (75.6%) of the respondents in this study
agreed that the payment process was simple and 77.7% agreed that there were few
administrative requirements suggests that the healthcare facilities in Thika Sub-County
were cognizant of World Health Organization‘s call for attention to the importance of
efficiency in all functions of a health system and in ultimately achieving the goals of
health improvement.
54
The findings showed that the next three factors that respondents identified as influencing
their utilization of a healthcare facility are ambience of cleanliness and state of the art of
the facility (12.5%) convenience and accessibility of the health facility (10.4%) and
affordability (7.3%). These results agree with the findings of a previous study by
Kastanioti et al. (2011) which identified strategic issues in healthcare management,
noting that rising health care costs and access to affordable coverage are prominent issues
for health care providers and lives of healthcare seekers. The results aligns with the
argument that the analysis on costs of various interventions become essential not only for
medical practitioners and hospital administrators, but also for governments and health-
care policymakers since cost can be a huge hindrance to the national health care service
delivery objectives. Collectively, the results of the study point to the fact identified by
McDoughal and Levesque (2000) that customers are looking for the right level of quality
in relation to the price they have to pay, which makes quality and value more indicative
of the soundness of private healthcare management.
As an indicator of reliability, the study established that majority (69.1%) of the
respondents agreed that the services were of high quality. However, 58.6% of the
respondents agreed that staff rarely made mistakes. These findings imply that
respondents perceived the reliability of the healthcare facilities as just above average. For
a healthcare facility, notwithstanding the overall perceived high quality, this suggests that
there is a potentially significant health risk exposure to patients and this can influence the
utilization of healthcare services in the private health facilities in Thika Sub-County. This
agrees with the argument of Pronovost et al. (2006) who held that an opportunity for a
defect usually translates to a population of patients at risk for the medical error or adverse
event. That there were 41.4% of the respondents in this study who potentially held a
contrary opinion to the statement that staff rarely made mistake suggest that there was the
likelihood that two out of five patients may have experienced occurrence of mistakes
during the administration of healthcare services.
Such probabilities have also been highlighted in earlier studies that suggest that within a
health care institution, failure to use evidence-based interventions may occur in five of 10
patients (Pronovost et al., 2006). These quality gaps in the products and services of
healthcare facilities in the Sub-County affect the credibility of the healthcare facilities

55
which, as rightly argued by Erdem et al. (2002), in turn, affects the long-term orientation
of a customer regarding their trust on the facility and its services. This has strategic
implications for the management of healthcare as literature has shown that trust is a
critical factor for anyone who wants to build successful business in the healthcare
industry (Shore, 2006).
In terms of the ambience of the healthcare facilities, the study established that majority
(88.3%) of the respondents the facilities were generally clean and well arranged. This
potentially influences the utilization of healthcare services as it projects the image of
what patients should be expecting. This is consistent with previous studies that identified
such physical attributes as important predictors of service quality (Barber and Scarcelli,
2010). As these authors rightly argued, the cleanliness of a health facility, whether it is
the lobby, building exterior or the treatment rooms, can influence the customer‘s
perceptions of quality of the health care service offered owing to dirty facilities that may
lead to re-infections negating the benefits.
In terms of accessibility, the study established that majority (71.4%) of the respondents
agreed that the facilities were near enough, implying that the facilities were in close
proximity to the respondents. Further, majority (76.6%) of the respondents agreed that
there were clear roads leading to the facilities. These results seem to contradict a report
by TDHRIO (2013) which showed that a significant population resides in informal
settlements within the town where some health facilities were situated in areas with poor
road networks. These disparities in the findings may be attributable to methodological
differences, implying that majority of respondents in the current study potentially resided
in the more formal settlement parts of Thika Sub-County.
The study however revealed that just over 50 percent of the respondents agreed that there
was ample parking space at the facilities and 41.4% agreed that the health facilities made
provision to cater for the physically challenged. In view of the findings which showed
that majority (73.4%) of the respondents earned less than Ksh.50,000 and 98.9% of the
respondents did not have any form of physical disability, it can be deduced that the need
for ample parking space and provision for the physically challenged do not have
immediate strategic implications on the provision of healthcare services by the private

56
health facilities in Thika Sub-County. However, this does not downplay the necessity for
health facilities to guarantee that physical health facilities are easily accessible for
wheelchair users; that there is provision for lifts where a health facility is situated in tall
building and provision of sufficient parking space as rightly pointed out by Kronfol
(2012).
5.3.2 Customer Service Factors that Influence Utilization of Private Healthcare
Facilities
The findings showed that majority (92.6%) of the respondents agreed that they could
easily approach the staff at the health facilities. Similarly, majority of the respondents
(86.3%) agreed that the staff at these facilities took time to listen to them, implying that
staffs at the facilities were caring. Likewise, majority (88.3%) of the respondents agreed
that staff of the facilities were friendly. From these results, it can be inferred that staff of
the healthcare facilities were responsive, which potentially positively influenced the
utilization of healthcare services. These findings reflects the definition of responsiveness
provided by Landrum et al. (2009) who associated responsiveness with the willingness
and readiness to provide service(s) when needed. The findings agree with recent studies
by Ramez (2012) which consistently ranked these dimensions highly together with
reliability. The results underscore the point noted by Aldag and Kuzuhara (2002) that
having a positive attitude is the foundation of excellent customer service as it provides
the necessary perspective that allows one to listen, care about and solve customers‘
concerns.
The measures of professionalism used included efficient service, knowledgeable staff and
alternative measures. The study established that majority (90.4%) of the respondents
agreed that they got served efficiently whenever they visited the health facility. Similarly,
87.2% of the respondents agreed that staff were knowledgeable at their work; and 72.3%
of the respondents agreed that the medical personnel didn‘t hesitate to change way of
offering service when one fails. These results suggest that utilization of healthcare
services by respondents were potentially influenced by professionalism. The findings
agree with Kandampully (2011) description of technical quality which manifest through
the service experience including promptness, accurateness and the extent to which the
customer is offered several alternatives and individualized solutions. The findings are

57
consistent with Sahaf‘s (2010) theorization of customer service as a strategic tool which
locates the professionalism of staff as a central pillar to the customer service strategy. As
correctly argued by Gianforte (2008), this potentially accrue strategic benefits to
healthcare facilities as it significantly improves the quality of customer service, reduces
costs and allows organizations to support more customers and more products within
existing staffing levels.
The foregoing argument is reinforced by further findings which showed that majority
(82%) of the respondents agreed that staff took the first initiative to solve their problems
and majority (76.6%) of the respondents agreed that the staff at the health facilities were
empathetic. Similarly, majority (72.3%) of the respondents agreed that they were
recognized whenever they visited the health facility. These results imply that utilization
of healthcare services in Thika sub-county was potentially influenced by the service
quality that epitomize Crowford et al.‘s (2011) perspective of customer service which
emphasize that people must always come first before numbers; that individual patients
and their treatment are what really matters. The implications of these revelations to
strategic healthcare management, as implied in literature by Sahaf (2010), is that the
service strategy needs a well integrated synergy of systems and staff. Particularly, the
skills and attitude of staff engaged in customer service have a critical impact not only on
the levels of satisfaction that the customer gets from the market offering but also on
referrals, thereby affecting the utilization of healthcare facilities.
In terms of respect, the findings showed that majority (85.1%) of the respondents agreed
that they were offered gratitude with every visit; majority (83%) of the respondents
agreed that the staff were considerate; and majority (80.9%) of the respondents agreed
that the personnel made them feel important. The findings agree with what Cook (2010)
summed up as the social interchange between the customer and the service provider,
noting that the way this process is managed is pivotal to achieving excellent customer
service. That this social exchange between the patient and staff of the healthcare facility
is pivotal is equally depicted in further findings which showed that majority (94.5%) of
the respondents agreed that staff used the language that was clearly understood. These
findings contradict the results of a previous study reported by Family Care International
(2003) which expressed major concerns about the attitudes of health workers towards

58
community members, characterizing facility-based healthcare providers as negligent at
best, and as emotionally and physically abusive at worst. Perhaps a reason for this
disparity in customer care is because this current study focused on private health
facilities, which as compared to public health facilities, offer better patient care because
their survival totally depend on customer traffic..
The findings showed that on aggregate, majority (87.3%) of the respondents who visited
community healthcare facilities agreed that the services were of high quality. In
comparison, this was higher than the distribution of respondents who sought healthcare
services from primary care facilities where the aggregate was (67.8%). Interestingly,
county healthcare facilities trailed in respondents‘ perception of quality with only 53.2%
of the respondents agreeing that the services were of high quality. These results seemed
to underscore the views of Rama and Rao (2011) who posited that consumers perceive
the quality of a service by experiencing the consumption process and comparing the
experience with their expectations. In this case, it could be said that the respondents who
patronized community healthcare had their expectations met more than those respondents
who patronized primary or county healthcare facilities.
It also appears from the findings that the level of agreement with the service quality
decreased as the health facilities along with the services got more complex. It must be
noted that the Kenya Health Policy (2012-2030) document indicated that in contrast to
the community healthcare facilities which is the first tier, the county referral services
included the service units providing tertiary / highly specialized services including high
level specialist medical care, laboratory support, blood product services, and research.
The above finding essentially means that the health facility is more complex and diverse
in its services and organization, and by extension, means that the facilities are few, but
demand the attention of the entire county. Thus a more personalized attention that fosters
long-term relationship with customers may be more present in the community care
facilities than in county referral service centers. For example, in a community care
facility, the community served may be so small that the staff could know each patient by
their name. This was likely the case in this study as majority (71.3%) of the respondents
were of the female gender who perhaps routinely visited these healthcare facilities to

59
seek medical or clinical attention to their infant babies. The findings agree with Gibson‘s
(2011) perspective of what customer service means, that is; the process of satisfying the
customer, relative to a product or service, in whatever way the customer defines his or
her need, and having that service delivered with efficiency, compassion and sensitivity.
5.3.3 Price Related Factors that Influence Utilization of Healthcare Services in
Private Health Facilities
This study established that less than half (41.5%) of the respondents in the study agreed
that they could afford the cost charged for medical scans, x rays, radiations and other
equipment for treatment with ease. This implies that the impact of the fees charged on the
finances of patients potentially influenced the utilization of healthcare services in private
health facilities in Thika Sub-County. As this study also showed, nearly half (46.8%) of
the respondents earned less than Ksh.20,000 yet more than half (50%) of the respondents
spent on average, up to Kshs.2,000 per visit. With more than a third (35.1%) of the
respondents either often utilizing healthcare facilities or doing so quite often; it means
that healthcare cost accounted for at least 10% of their monthly income.
The statistics seem to highlight the results of an earlier study by Callahan (2008) which
found that new and increased use of technology accounts for between forty and fifty
percent of annual health care cost increases. This author stressed that some types of
technology are a wasted cost because it costs more for the new equipment and training of
caregivers than it would to use previous protocols. In a private healthcare facility, this
cost is likely often transferred to the final consumer. From a strategic healthcare
management perspective, it means healthcare facilities should offer efficient services
without necessarily compromising on offering quality healthcare.
The study showed that just over half (56.3%) of the respondents agreed that the
prescription drug charges were affordable. While this may mean that respondents
generally found the cost of prescription drugs affordable, this majority is marginal,
especially taking into account the fact that the income levels of majority of the
respondents in this study were relatively low. This, combined with the fact that just over
half (59.6%) of the respondents agreed that private health facilities offer laboratory tests
at affordable prices, further amplify the potential influence of cost of healthcare on the

60
utilization of private healthcare facilities in the county. In respect to strategic healthcare
management, this inference underscores the viewpoints of Dacombe et al. (2006) who
stressed that understanding the role and true cost of laboratory services has a critical role
in supporting the delivery of essential health package as too high cost may be a real
hindrance to effective delivery of healthcare services.
Similarly, the study indicated that a small majority (59.5%) of the respondents agreed
that the doctors‘ fee charged by these institutions was affordable. Thus, while the
doctors‘ fees, along with the laboratory fees, were comparatively more affordable than
prescription drugs or healthcare equipment, these costs were potentially a hindrance too
to full utilization of private healthcare services in Thika sub-County. Notwithstanding the
implied fact that the statistics compare favorably with a previous study by Hanna et al.
(2004) in which the fees charged by the doctor ranked eight out of the ten most important
factors that influence the utility of healthcare services, that respondents in this study
potentially paid directly from their pockets strongly resonated the significance of the
doctor‘s fees to the patients. In a nutshell, the findings agree with the literature which
suggested that the right combination of product quality, customer service and fair prices
is key to success in today‘s marketplace (Dodds, 2003) and more significantly, in the
healthcare sector.
5.4 Conclusions
5.4.1 Product Quality Factors that Influence Healthcare Utilization in Private
Healthcare Facilities in Thika Sub-County
Staff competence, demonstrated through correct diagnosis and prescription was the most
important factor potentially influencing utilization of private healthcare facility. Other
product-related factors included simplicity both in the payment process and
administrative requirements. Likewise, reliability in terms of consistency and correctness,
in addition to the cleanliness of the health facilities, distance and road network were all
significant factors that potentially influenced the utilization of private healthcare facilities
in the sub-county. However, the role of product features such as parking space and
consideration for the physically challenged in influencing the utilization of private
healthcare facilities was not potentially significant.

61
5.4.2 Customer Care Factors that Influence Healthcare Utilization in Private
Healthcare Facilities in Thika Sub-County
All aspects of customer care ranked highly among the factors that potentially influenced
utilization of private health facilities in Thika Sub-County. These factors included
approachability of staff; caring, listening and friendliness; knowledgeable staff and
flexibility. Other factors were staff initiative, empathy and attention. In addition, service
with gratitude, considerate attitude and patient‘s sense of importance all potentially
played a role in the customer‘s choice of healthcare facility to patronize. The customers
also appreciated the language used for communication and the fact that explanation of
procedures given and information communication was prompt.
5.4.3 Price-Related Factors that Influence Healthcare Utilization in Private
Healthcare Facilities in Thika Sub-County
With the exception of laboratory test fees, all the other fees charged in the process of
administering healthcare to patients potentially influenced the utilization of private
healthcare facilities in Thika Sub-County negatively. The cost of medical scans, x rays,
radiations and other equipment for treatment were considered out of reach to many
customers whose income levels were low. The same case seemingly applied to the cost of
prescription drugs as well as laboratory tests and the doctors‘ fees.
5.5 Recommendations
5.5.1 Recommendations for Improvement
5.5.1.1 Product Quality Factors that Influence Healthcare Utilization in Private
Healthcare Facilities in Thika Sub-County
For strategic healthcare management purposes, private healthcare facilities should focus
resources on always getting it right the first time. Safe-guarding the basic promise to
customers, which manifest in error-free diagnosis of patient‘s problems and prescribing
the right medicine, would go a long way in remaining relevant in today‘s increasingly
competitive healthcare sector. Doing so with consistency and speed enhances the
reliability of the health facility which secures customer trust. It means that private
healthcare facilities should maintain simplicity in their administrative requirements such
as payment processes.

62
5.5.1.2 Customer Care Factors that Influence Healthcare Utilization in Private
Healthcare Facilities in Thika Sub-County
Customer service is the strategic differentiator of service. Thus, private healthcare care
facilities, especially those that offer primary care and primary referral, need to invest in a
customer service strategy that integrates a customer relationship approach to the
management of healthcare. In simple terms, both the systems and the staff should be
characterized by responsiveness, friendliness, initiative, empathy and attention to patients
rather than a detachment, aloofness and disinterest.
5.5.1.3 Price-Related Factors that Influence Healthcare Utilization in Private
Healthcare Facilities in Thika Sub-County
Private health-care facilities in Thika Sub-County should rethink their price-mix in order
to give better value for money to their clients. If necessary, they should explore
collaboration across tiers in order to reduce certain costs such as those associated with
medical scans and other expensive equipments. In addition, they should explore strategic
partnerships with the government and world health organizations to install state of the art
equipment and allied healthcare technologies without having to transfer the cost from
customers.
5.5.2 Recommendations for Further Research
This study was constrained by a few limitations that make further research necessary.
Firstly, each tier was represented by a few randomly selected healthcare facilities. This
number could be expanded in a future study in order to increase the reliability of
statistical estimates.
Secondly, county care facilities were not represented in the study; yet the dynamics of
healthcare services are potentially context specific. Thus, another study that compares the
factors influencing the utilization of private healthcare facilities among each tier would
provide an illumination of the specific strategies that each tier could adopt to enhance
utilization of their healthcare facilities.

63
Thirdly, the findings of this study are based on a single instrument which generated
quantitative data only. Therefore, another research adopting a mixed-method approach
could draw new insights that could be used to corroborate the findings of this study.
Finally, the focus of this study was on private healthcare facilities. A future study could
also be undertaken on public healthcare facilities to compare and contrast the factors
influencing utilization of health services in Thika Sub-County

64
REFERENCES
Aggarwal, Y. P. (2008). The Science of Educational Research. A Source Book. New
Delhi, IN: Nirmal Book Agency.
Ahmad, M. (2013). Health care access in Punjab and barriers for the physically disabled
in rural Pakistan. International Journal of Sociology and Social Policy, 33, (3/4)
246-260.
Aldag, R. J. & Kuzuhara, L. W. (2002). Organizational Behavior and Management. An
integrated Skills Approach. Cincinnati, OH: South-Western, Thomson Learning
Anthamatten, P. & Hazen, H. (2012). An Introduction to Health Geography. London,
UK: Routledge.
Barber, N. & Scarcelli, J. M. (2010). Enhancing the assessment of tangible service
quality through the creation of a cleanliness measurement scale. Managing
Service Quality, 20 (1), 70-88.
Beever, C., Bums, H. & Karbe, M. (2004).U.S. Health Care's Technology Cost Crisis.
Retrieved on 9th
June 2013 from http://www.strategybusiness.com.
Bettencourt, L. A., Ostrom, A. L., Brown, S. W. & Roundtree, R. I. (2002). Client Co-
Production in Knowledge-Intensive Business Services. California Management,
44(1), 100-128.
Buttgen, M. & Ates, Z. (2009). Customer participation and its effects on service
organisations: An institutional economics perspective. Retrieved on 13th
March
2014 from http://www.naplesforumonservice.it
Bryman, A. & Bell, E. (2003). Business Research Methods. New York, NY: Oxford
University Press.
Callahan, D. (2008). Health Care Costs and Medical Technology. Stamford, NY:
Hastings Centre.
Cook, S. (2010). Customer Care Excellence: How to Create an Effective Customer
Focus. London, UK: Kogan Page Publishers.
Crowford, P., Gilbert, P. Gilbert, J. & Gale, C. (2011).The Language of Compassion.
Taiwan International ESP Journal, 3 (1), 1-16.
Dacombe, R. J., Squire, S. B., Ramsay, A. R. C., Banda, H.T. & Bate, I. (2006).
Essential Medical Laboratory Services: Their Role in Developing Equitable
Heath Care in Malawi. Malawi Medical Journal, 18(2), 77-79.
Delattre, M. & Ocler, R. (2013). Professionalism and Organization: Polysemy of
concepts and narratives of actors. Society and Business Review, 8(1), 18-31.

65
DeVita, M. A., Hillman, K. & Bellomo, R. (2010). Textbook of Rapid Response
Systems: Concept and Implementation. New York, NY: Springer Publishers.
Dodds, B. (2003). Managing Customer Value: Essentials of Product Quality, Customer
Service, and Price Decisions. Lanham, MA: University Press of America.
Donoghue, S. & de Klerk, H. M. (2009). The right to be heard and to be understood: A
conceptual framework for consumer protection in emerging economies,
International Journal of Consumer Studies, 1(1), 1470-6423.
El-Dahiyat, F. & Kayyali, R. (2013). Evaluating patients‘ perceptions regarding generic
medicines in Jordan. Journal of Pharmaceutical Policy and Practice, 6(3), 32-
52.
Erdem, T., Louviere, J. & Swait, J. (2002). The impact of brand credibility on consumer
price sensitivity. International Journal of Research in Marketing, 19(1), 1-19.
Evans, G. (2002). Measuring and Managing Customer Value. Work Study Journal, 51(3),
43-80.
Faltin, F., Kenett, R. & Ruggeri, F. (2012). Statistical Methods in Healthcare. New York,
NY: John Wiley & Sons.
Family Care International (2003). Kenya Qualitative Report. Retrieved on 18th
March
2014 from http://www.familycareintl.org
Farlex Incorporated (2012). Farlex Partner Medical Dictionary. Huntingdon Valley,
PA: Farlex Inc.
Fricker, R. D. (2007). Sampling Methods for Web and E-mail Surveys.The Sage
handbook of online research methods. Thousand Oaks, CA: Sage Publications.
Garson, D. (2012). Sampling. Raleigh, NC: Statistical Associates Publishing.
Gianforte, G. (2008). Proactive Customer Service: Seizing the Initiative to Exceed
Customer Expectations, Cut Costs, and Out-Service the Competition. Retrieved
on 18th
March 2014 from http://www.csdpcorp.com
Gibson, P. (2011). The World of Customer Service. New York, NY: Cengage Learning.
Gill, J. & Johnson, P. (2010). Research Methods for Managers. London, UK: Sage
Publications.
Ginter, P. M. (2013). The Strategic Management of Health Care Organizations. New
York, NY: John Wiley & Sons.
Goodman, J. A. (2009). Strategic Customer Service: Managing the Customer Experience
to Increase Positive Word of Mouth, Build Loyalty, and Maximize Profits. New
York, NY: AMACOM.
66
Hanna, N., Schoenbachler, D. D. and Gordon, G. L. (2004), ―Physician Choice Criteria:
factors influencing patient selection of generalists versus specialists‖, Health
Marketing Quarterly, 12(2), 29-42.
Harris, L. R. & Brown, G. T. L. (2010).Mixing interview and questionnaire methods:
Practical problems in aligning data. Practical Assessment, Research &
Evaluation, 15(1), 4-10.
Hernon, P. & Altman, E. (2010). Assessing Service Quality: Satisfying the Expectations
of Library Customers. Chicago, CH: American Library Association.
Hsu, J. (2010). The relative efficiency of public and private service delivery. Washington
DC, MA: World Health Organization.
Jayadevappa, R. & Chhatre, S. (2011). Patient Centered Care - A Conceptual Model and
Review of the State of the Art. The Open Health Services and Policy Journal,
4(3), 15-25.
Kandampully, J. (2011). Service Management: The New Paradigm in Retailing. New
York, NY: Springer Publishers.
Kastanioti, C.K., Koutalianos, S., Mavridoglou, G. &Polyzos, N. (2011). Health care
costs and related socio-economic factors of cholecystectomy: an evaluation of
two operative techniques in Greece. Health Journal, 5(1), 48-59.
Kenya National Bureau of Statistics (2009). 2009 Kenya Population and Housing
Census. Nairobi, KE: KNBS.
Kenya National Bureau of Statistics (2013). Population Census. Nairobi, KE: KNBS.
Kothari, C. R. (2004). Research Methodology: Methods and Techniques. New Delhi, IN:
New Age International.
Kotler, P. & Keller, K. L. (2006). Marketing Management (12th ed.). Upper Saddle
River, NJ: Pearson Education
Kotler, P., Shallowitz, J. & Stevens, R. J. (2011). Strategic Marketing for Health Care
Organizations: Building A Customer-Driven Health System. New York, NY: John
Wiley & Sons.
Kronfol, N. M. (2012). Access and barriers to health care delivery in Arab countries: A
review. EMHJ, 18(12), 1239-1246.
Landrum, H., Prybutok, V., Zhang, X. & Peak, D. (2009). Measuring IS System Service
Quality with SERVQUAL: Users‘ Perceptions of Relative Importance of the Five
SERVPERF Dimensions. Informing Science: The International Journal of an
Emerging Trans discipline, 12(5), 17-37.
Lockyer, T. (2003). Hotel cleanliness: How do guests view it? Let us get specific: A New
Zealand study. Hospitality Management, 22(2), 297-305.

67
Maina, T. M. & Kibua, T. N. (2005). An Assessment of the Service Delivery Capacity of
the District Health Systems in Kenya. Nairobi, KE: Institute of Policy Analysis
and Research.
Markovic, S. & Raspor, S. (2010). Measuring Perceived Service Quality Using servqual:
A Case Study of the Croatian Hotel Industry. Management, 5(3), 195–209.
Matzler, K., Bailom, F. & Dieter, T. (2007). Enduring Success: What Top Companies Do
Differently. Basingstoke, UK: Palgrave Macmillan.
McDougall, G. H. G. & Levesque, T. (2000). Customer Satisfaction with Services:
Putting Perceived Value into the Equation. Journal of Services Marketing, 14(8),
27-36.
Milbourn, G. & Haight, G. T. (2001). Quality Service Makes Happy Customers and
Greater Profits. Business Forum, 23(3) 4-10.
Ministry of Medical Services and Ministry of Health and Sanitation (2012). Kenya
Health Policy 2012-2030. Nairobi, KE: MMS/MHS.
Morgan, N. A. & Rego, L. L. (2009). Brand Portfolio Strategy and Firm Performance.
Journal of Marketing, 1(2), 73, 59–74.
Moseley, G. B. (2009). Managing Health Care Business Strategy. Sudbury, CA: Jones &
Bartlett Learning.
Nafula, M. (2011). Health Market Highlights: Kenya. Public private partnerships,
technology for health: Centre for Health Market Innovation [CHMI]. Retrieved
on 5th
July, 2013 from http://healthmarketinnovations.org
Obloj, K. (2013). The Passion and Discipline of Strategy. New York, NY: Palgrave
Macmillan.
Opdebeeck, H. & Habisch, A. (2011). Compassion: Chinese and western perspectives on
practical wisdom in management. Journal of Management Development, 30(7/8),
778-788.
Peppers, D. & Rogers, M. (2010). Managing Customer Relationships: A Strategic
Framework. New York, NY: John Wiley & Sons.
Phan, S. (2004), ―Dot ZEN, Ethical and compassionate management‖, International
Journal of Knowledge, Culture and Change Management, 4 (13) 59-63.
Pronovost, P. J., McArthur, F. & Jane, B. (2006). Creating High Reliability in Health
Care Organizations. Journal of Health Services Research, 41(42), 1599-1617.
Raajpoot, N. (2002). TANGSERV: A multiple item scale for measuring tangible quality
in foodservice industry. Journal of Foodservice Business Research, 5(2), 109-27.
Rama, K. & Rao, M. (2011). Services Marketing. New Delhi, IN: Pearson Education
India.
Ramez, W. S. (2012). Patients' Perception of Health Care Quality, Satisfaction and
Behavioural Intention: An Empirical Study in Bahrain. International Journal of
Business and Social Science, 3(18), 131-141.

68
Rea, L. M. & Parker, R. A. (2012). Designing and Conducting Survey Research: A
Comprehensive Guide. New York, NY: John Wiley & Sons.
Rivers, P. A. & Patino, F. G. (2006). Barriers to health care access for Latino immigrants
in the USA. International Journal of Social Economics, 33(3), 207-220.
Robbins, S. P. & Judge, T. A. (2009). Organizational Behavior, (13th
ed.). Upper Saddle
River. NJ: Pearson Education.
Rollinson, D. & Broadfield, A. (2002). Organizational Behaviour and Analysis. An
integrated Approach (2nd
ed.). New York, NY: Pearson Education.
Saha, S. Beach, M. C. & Cooper, L. A. (2008). Patient Centeredness, Cultural
Competence and Healthcare Quality. Journal of National Medical Association,
100(11), 1275–1285.
Cooper, DR. & Schindler, P. S. (2006). Marketing Research. Noida, IN: Tata McGraw-
Hill.
Sahaf, M. A. (2008). Strategic Marketing: Making Decisions for Strategic Advantage.
New Delhi, IN: PHI Learning Pvt. Ltd.
Salaria, N. (2012). The meaning of the term- Descriptive Survey Research Methods.
International Journal of Transformations in Business Management, 1(6), 4-10.
Schermerhorn Jr., J. R., Hunter, J. G. & Osborn, R. N. (2003). Organizational Behavior
(8th
ed.) Hoboken. NJ: John Wiley & Sons.
Schulz, R. & Johnson, A. C. (2003). Management of Hospitals and Health Services:
Strategic Issues and Performance. New York, NY: Beard Books.
Shore, D. A. (2006). The Trust Crisis in Healthcare. Oxford, UK: Oxford University
Press.
Stephen, J. M. (2005). Juran, Quality, and a Century of Improvement. Milwawkee, W:
ASQ Quality Press.
Subhashini, R. (2012). National health policy, the need of the hour: An analysis in Indian
perspective. Leadership in Health Services, 25(3), 232-248.
The Congress of the United States, Congressional Budget Office (2008). Technological
Change and the Growth of Health care Spending. Washington DC, MA: US-
CBO.
Thika District Health Records Information Office (2007). Thika District Strategic Plan
2004-2010. Thika, KE: DHRIO.
Thika District Health Records Information Office [DHRIO], (2013). Health Statistics.
Thika, KE: DHRIO.
Turin, D. R. (2010). Health Care Utilization in the Kenyan Health System: Challenges
and Opportunities. Retrieved on 18th
March 2014 from
http://www.studentpulse.com/articles/284/
Tyson, E. & Schell, J. (2011). Small Business for Dummies. New York, NY: John Wiley
& Sons.

69
Van Vactor, J. D. (2013). Leveraging the Patient-Centered Medical Home (PCMH)
model as a health care logistics support strategy. Leadership in Health Services,
26 (2), 95-106.
Vandermerwe, S. (2003). Customer-Minded growth through services. Managing Service
Quality, 13(4), 262-266.
Wamai, R. G. (2009). The Kenya Health System—Analysis of the situation and enduring
challenges. JMAJ, 52(2), 134–140.
Wolper, L. F. (2004). Health Care Administration: Planning, Implementing, and
Managing Organized Delivery Systems. Sudbury, CA: Jones & Bartlett Learning.
World Health Organization (2013). Universal Health Coverage. Retrieved on 18th
March
2014 from http://www.who.int/healthsystems/universal health_coverage/en

70
APPENDICES
Appendix 1: Cover Letter
P.O. BOX 14634, 00800.
NAIROBI.
DATE:
Dear Respondent,
I am pleased to inform you that am a graduate student at United States International
University pursuing a Master‘s degree in Business Administration. As partial fulfillment
of the course, I am conducting a research assessment of the factors that influence
utilization of health care services in private health care facilities in Thika Sub-County.
You have been selected as one of the lucky respondents. The result of this study will
provide the management with the necessary information for the adoption and
implementation of appropriate policies for effective service delivery.
This is an academic research and confidentiality is strictly emphasized, your name will
not appear anywhere in the report. Kindly spare a few minutes to complete the
questionnaire attached.
Thank you in advance,
Yours faithfully,
Agnes Muraya

71
Appendix 2: Questionnaire
This study is a requirement for the partial fulfillment of the Master of Science in
Business Administration program at the United States International University Africa
(USIU-A). The purpose of this study is to investigate the factors influencing the
utilization of health care service in private health care facilities in Thika Sub County.
This is an academic exercise and all information collected from respondents will be
treated with strict confidentiality.
SECTION A: GENERAL INFORMATION
Kindly answer all the questions either by ticking in the boxes or writing in the
spaces provided. Note that the evaluation will be considered incomplete if you do
not answer all the questions
1. Gender:-
Male ☐ Female ☐
2. Age:
Less than 18 years ☐19-35 years ☐35-51 years ☐
52-68 years ☐ More than 69 years ☐
3. Do you have any form of disability?
Yes ☐ No ☐
4. Do you have any special medical condition?
5. Yes ☐ No ☐
5. What is your level of monthly income?
Less than Ksh 20,000 ☐ Ksh 20,001-Ksh 50,000 ☐ Ksh. 50,000-Ksh 100,000 ☐
More than Ksh 100,000 ☐
6. How often do you seek health services from health facilities within Thika?
Never ☐ Occasionally ☐ Often ☐ Quite often ☐
7. On average how much do you spend per visit?
Less than Ksh 1,000 ☐ Ksh 1,001-Ksh 2,000 ☐ Ksh 2,001-Ksh3,000
Ksh 3,001-Ksh4,000 ☐ More than Ksh.4,000 ☐
8. What is the most important factor that influences your choice of the health facility to
attend? _________________________________________________________
____________________________________________________________________
____________________________________________________________________
________________________________________________________

72
SECTION B: PRODUCT QUALITY FACTORS INFLUENCING THE
UTILIZATION OF HEALTHCARE SERVICES IN PRIVATE HEALTHCARE
FACILITIES.
Please tick in the corresponding boxes your level of agreement to the following
statements with the regard to the private hospital you attend.
Efficiency
Strongly
Agree Agree Neutral Disagree
Strongly
Disagree
1. I only wait a short time to see a
doctor ☐ ☐ ☐ ☐ ☐
2. The payment process is very
simple ☐ ☐ ☐ ☐ ☐
3. There are few administrative
requirements ☐ ☐ ☐ ☐ ☐
Communication
4. Staff use the language I clearly
understand ☐ ☐ ☐ ☐ ☐
5. All procedures are fully
explained to me ☐ ☐ ☐ ☐ ☐
6. I am informed promptly in case
of new information ☐ ☐ ☐ ☐ ☐
Reliability ☐ ☐ ☐ ☐ ☐
7. The services are of high quality ☐ ☐ ☐ ☐ ☐
8. The quality of the services I
receive are consistent ☐ ☐ ☐ ☐ ☐
9. Staff rarely make mistakes ☐ ☐ ☐ ☐ ☐
Physical attributes ☐ ☐ ☐ ☐ ☐
10. The facilities are generally
clean and well arranged ☐ ☐ ☐ ☐ ☐
11. The facilities are near enough ☐ ☐ ☐ ☐ ☐
12. There are clear roads leading to
the facilities ☐ ☐ ☐ ☐ ☐
13. There is ample parking space at
the facility ☐ ☐ ☐ ☐ ☐
14. There are provision to cater for
the physically challenged in
form of ramps and lifts
☐ ☐ ☐ ☐ ☐
In your opinion, what other measures not mentioned above hinder service delivery?
_______________________________________________________________________
_______________________________________________________________________

73
SECTION B: CUSTOMER CARE RELATED FACTORS INFLUENCING THE
UTILIZATION OF HEALTHCARE SERVICES IN PRIVATE HEALTHCARE
FACILITIES
Please tick in the corresponding boxes your level of agreement to the following
statements with the regard to the private hospital you attend.
Positive attitudes
Strongly
Agree Agree Neutral Disagree
Strongly
Disagree
1. I can easily approach the staff
at these facilities ☐ ☐ ☐ ☐ ☐
2. Staff at these facilities care for
my needs ☐ ☐ ☐ ☐ ☐
3. The staff at these facilities takes
time to listen to me ☐ ☐ ☐ ☐ ☐
4. The staff are friendly ☐ ☐ ☐ ☐ ☐
Professionalism
5. I get served efficiently
whenever I attend ☐ ☐ ☐ ☐ ☐
6. The staff are quite
knowledgeable of their work ☐ ☐ ☐ ☐ ☐
7. Medical personnel don‘t
hesitate to change way of
offering service when one fails
☐ ☐ ☐ ☐ ☐
Compassion ☐ ☐ ☐ ☐ ☐
8. The staff take the first initiative
to solve my problems ☐ ☐ ☐ ☐ ☐
9. The staff are sympathetic ☐ ☐ ☐ ☐ ☐
10. I am recognized whenever I
visit ☐ ☐ ☐ ☐ ☐
Respect ☐ ☐ ☐ ☐ ☐
11. I am offered gratitude with
every visit ☐ ☐ ☐ ☐ ☐
12. The staff are considerate ☐ ☐ ☐ ☐ ☐
13. The personnel make me feel
important ☐ ☐ ☐ ☐ ☐
Please indicate any other factor you feel hinder quality customer care you receive at the
facilities
_______________________________________________________________________
_______________________________________________________________________

74
SECTION D: PRICE RELATED FACTORS INFLUENCING THE
UTILIZATION OF HEALTHCARE SERVICES IN PRIVATE HEALTH CARE
FACILITIES.
Please tick in the corresponding boxes your level of agreement to the following
statements with the regard to the private hospital you attend.
Strongly
Agree Agree Neutral Disagree
Strongly
Disagree
1. I can afford the cost charged
for medical scans, x rays,
radiations and other
equipment‘s for treatment with
ease
☐ ☐ ☐ ☐ ☐
2. The prescription drugs charges
are affordable ☐ ☐ ☐ ☐ ☐
3. The private health facilities
offer laboratory tests at
affordable prices
☐ ☐ ☐ ☐ ☐
4. The Doctors fee charged by
these institutions is affordable. ☐ ☐ ☐ ☐ ☐
In your opinion, what other charges stop you from receiving effective health care services
from the private health care facilities that you attend?
_______________________________________________________________________
What recommendations would you give for the improvement of the health care service
delivery at the private health care facilities that you attend?
_______________________________________________________________________
_______________________________________________________________________
THANK YOU FOR YOUR COOPERATION