factors influencing effectiveness of interorganizational networks
221
FACTORS INFLUENCING EFFECTIVENESS OF INTERORGANIZATIONAL NETWORKS AMONG CRISIS MANAGEMENT ORGANIZATIONS: A COMPARATIVE PERSPECTIVE by BAHADIR SAHIN B.S. Ankara Police Academy, 2000 M.A. John Jay College of Criminal Justice, 2007 A dissertation submitted in partial fulfillment of the requirements for the degree of Doctor of Philosophy in the Department of Public Affairs in the College of Health and Public Affairs at the University of Central Florida Orlando, Florida Summer Term 2009 Major Professor: Thomas T.H. Wan
Transcript of factors influencing effectiveness of interorganizational networks
FACTORS INFLUENCING EFFECTIVENESS OF INTERORGANIZATIONAL NETWORKS
AMONG CRISIS MANAGEMENT ORGANIZATIONS: A COMPARATIVE PERSPECTIVE
by
BAHADIR SAHIN
B.S. Ankara Police Academy, 2000
M.A. John Jay College of Criminal Justice, 2007
A dissertation submitted in partial fulfillment of the requirements
for the degree of Doctor of Philosophy
in the Department of Public Affairs
in the College of Health and Public Affairs
at the University of Central Florida
Orlando, Florida
Summer Term
2009
Major Professor: Thomas T.H. Wan

ii
2009 © Bahadir Sahin
iii
ABSTRACT
Crisis management has become one of the most important public policy areas in recent
decades with greater numbers of manmade and natural disasters. History showed that well-
implemented crisis management policies can save lives and reduce costs in a disaster. Literature
offered various suggestions for more effective crisis management policies with different
techniques utilizing different theoretical frameworks. Informal relationships among crisis
management employees were suggested to have a positive impact on crisis management
effectiveness. Yet it was not demonstrated with advanced statistical tools if there is such a
relationship.
This study considers crisis management effort as a network effort and employs complex
adaptive systems theory in order to understand factors influencing effectiveness of crisis
management networks. Complex adaptive systems theory presents that more open
communication lines in a given network or an organization would increase effectiveness of it
since inner processes of the network or organization would obtain more information from the
chaotic environment. Quality of informal relationships (casual relationships, social capital etc.)
was hypothesized as a tool to open more communication lines within an agency which would
eventually increase effectiveness of the network constructed by the organization. Based on the
theoretical framework, adaptiveness capacity of the agencies was also tested in order to
understand a correlation between adaptation and effectiveness of crisis management networks.
Multiple case-study method was employed to identify incidents that can represent crisis
management in full perspective. Terrorist attacks carried upon by the same terrorist network hit
iv
New York in 2001, Istanbul in 2003, Madrid in 2004, and London in 2005 were selected. First
response phase of crisis management and policy changes after and before the attacks were
discussed. Public administration processes and other social-economical conditions of countries
were examined in terms of crisis management structure.
Names of key agencies of selected crisis management systems were suggested by a social
network analysis tool-UCINET. Six key agencies per incident were targeted for surveys. Surveys
included a nine-item-quality of informal relationships, four-item-adaptiveness capability, and
ten-item-perceived effectiveness of crisis management networks-scales. Respondents were asked
to fill in online surveys where they could refer to their colleagues in the same incidents. 230
respondents were aimed and 246 survey responses were obtained as a result. Surveys formed a
structural equation model representing 23 observed factors and 2 latent constructs. Confirmatory
factor analysis was utilized to validate hypothesis-driven conceptual models.
Quality of informal relationships was found to have a significant positive impact on
perceived crisis management network effectiveness (Standardized regression coefficient = .39).
Two of the adaptiveness variables, openness to change and intra-organizational training were
also positively correlated with the dependent variable of the study (Standardized regression
coefficient = .40 and .26 respectively). Turkish and American groups‘ differences suggested a
social-economical difference in societies. Majority of the respondents were some type of
managers which made it possible to generalize the results for all phases of crisis management.
Discussions suggested improved informal relationships among crisis management
employees to provide a better crisis management during an extreme event. Collaborative social
events were offered to improve crisis management effectiveness. An agency‘s openness to
change proposed that a crisis management organization should be flexible in rules and structure
v
to gain more efficacy. The other adaptiveness variable, intra-organizational training efforts were
proposed to have certain influence on effectiveness of crisis management network. Factors built
latent construct of perceived crisis management effectiveness were also found out to be
important on crisis management, which of some are ability to carry out generic crisis
management functions, mobilize personnel and resources efficiently, process information
adequately, blend emergent and established entities, provide appropriate reports for news media
etc.
Study contributed to the complex adaptive system theory since the fundamentals of the
theory were tested with an advanced quantitative method. Non-linear relationships within a
system were tested in order to reveal a correlation as the theory suggested, where the results were
convincingly positive. Crisis management networks‘ effectiveness was demonstrated to be
validated by a ten-item-scale successfully. Future research might utilize more disaster cases both
natural and manmade, search for impact of different communication tools within a system, and
look at the relationships among members of crisis management networks instead looking within
an organization.
vi
ACKNOWLEDGMENTS
I would like to express the deepest appreciation to my committee chair, Professor
Thomas Wan, who has the attitude of a dedicated professor: he continually conveyed a spirit of
adventure in regard to research and scholarship, and an excitement in regard to teaching. Without
his guidance this dissertation would not have been possible.
I would like to thank my committee members, Professor Naim Kapucu, whose work
provided selected network member organizations of this study, Professor Ning Zhang, who re-
thought the basics of statistical software utilized in the research, and Professor Thomas A. Bryer
who demonstrated to me the importance of inner organizational processes of modern public
administration structures.
In addition, a thank you to John Feal and Glen Klein of Feal Foundation, who introduced
me to their hero members and contributed to the surveys of the study. I thank Kemal Coban,
Kursat Durmus, and Recep Kilic of CSI Unit of Istanbul Police Department for sharing first-
hand information about the Istanbul Bombings which constructed an important part of my
dissertation. I also thank all respondents of surveys which made this study possible.
I would also acknowledge Cristina Berrios and her mom, Ismail Sahin, and Hernando
Correa for their support in translation of the surveys. I was extraordinarily fortunate in having
many others who willingly supported this research and contacted respondents on behalf of
myself.
Where would I be without my family? My parents deserve special mention for their
inseparable support and prayers. My wife; thanks for being supportive and caring our recent
visitor, Mahir Furkan.
vii
I have to thank the my government and Turkish National Police for sending me to the
US for graduate study, supporting all my works and efforts for years, and giving a brighter future
to me.
Financial support of this dissertation was provided by the Public Entity Risk Institute in
Dissertation Fellowships in Hazards, Risk, and Disasters. IRB approval was granted with number
SBE-08-05954 from UCF.
Finally, I would like to thank everybody who was important to the successful realization
of thesis, as well as expressing my apology that I could not mention personally one by one.
viii
TABLE OF CONTENTS
LIST OF FIGURES IN THE STUDY ........................................................................................... xi
LIST OF TABLES IN THE STUDY............................................................................................ xii
1. INTRODUCTION .................................................................................................................. 1
1.1 Statement of the Study Problem ....................................................................................... 1
1.2 Definition of the Terms .................................................................................................... 3
1.3 Purpose of the Study ........................................................................................................ 7
1.4 Significance of the Study ................................................................................................. 8
2 THEORETICAL FRAMEWORK AND LITERATURE REVIEW ...................................... 9
2.1 Complex Adaptive Systems Theory ................................................................................. 9
2.2 Validity Discussions of Variables in the Study .............................................................. 17
2.2.1 Perceived Effectiveness of Crisis Management Networks ..................................... 17
2.2.2 Quality of Informal Relationships .......................................................................... 26
2.2.3 Organizational Adaptation in Crisis Management Networks ................................. 29
2.3 Research Hypotheses...................................................................................................... 32
3 METHODOLOGY ............................................................................................................... 34
3.1 Analytical Model ............................................................................................................ 34
3.2 Methods .......................................................................................................................... 35
3.2.1 Multiple Case Study Analysis ................................................................................. 36
3.2.2 Social Network Analysis......................................................................................... 43
3.2.3 Surveys and Structural Equation Modeling ............................................................ 45
ix
3.3 Increasing Reliability and Item Response Theory ......................................................... 58
3.3.1 Human Subjects ...................................................................................................... 60
4 RESULTS AND DISCUSSIONS ......................................................................................... 61
4.1 Qualitative Analyses ...................................................................................................... 61
4.1.1 U.S.A....................................................................................................................... 63
4.1.2 Turkey ..................................................................................................................... 70
4.1.3 Spain ....................................................................................................................... 79
4.1.4 U.K. ......................................................................................................................... 85
4.1.5 Conclusions ............................................................................................................. 90
4.2 SEM Results ................................................................................................................... 93
4.2.1 Descriptive Statistics of Respondents ..................................................................... 94
4.2.2 Descriptive Statistics of Survey Results ............................................................... 107
4.2.3 Confirmatory Factor Analysis (CFA) ................................................................... 111
4.2.4 The Main Model ................................................................................................... 118
4.2.5 Latent Constructs .................................................................................................. 122
4.2.6 Hypothesis Testing................................................................................................ 125
4.2.7 Group Comparisons .............................................................................................. 128
5 IMPLICATIONS, CONCLUSIONS, LIMITATIONS, AND FUTURE RESEARCH ..... 137
5.1 Implications .................................................................................................................. 137
5.1.1 Policy Implications ............................................................................................... 137
5.1.2 Theoretical Implications ....................................................................................... 142
x
5.2 Conclusions .................................................................................................................. 144
5.3 Limitations ................................................................................................................... 145
5.4 Future Research ............................................................................................................ 150
APPENDIX A: SURVEYS......................................................................................................... 151
5.4.1 Survey for Emergency Management Organizations (US) .................................... 152
5.4.2 Survey for Emergency Management Organizations (Turkey) .............................. 159
5.4.3 Survey for Emergency Management Organizations (Spain) ................................ 166
5.4.4 Survey for Emergency Management Organizations (UK) .................................... 173
APPENDIX B: RESPONDENTS‘ LOCATIONS ...................................................................... 180
APPENDIX C: EXTRA TABLES AND FIGURES .................................................................. 183
APPENDIX D: IRB APPROVAL .............................................................................................. 194
REFERENCE .............................................................................................................................. 196
xi
LIST OF FIGURES IN THE STUDY
Figure 1. Proposed Theoretical Model.......................................................................................... 15
Figure 2. Proposed SEM Model for Comparative CM Analysis .................................................. 56
Figure 3. US Respondent Organizations Descriptive Statistics .................................................... 96
Figure 4. U.S. Respondent Employee Positions Descriptive Statistics ........................................ 97
Figure 5. Turkey Respondent Organization Descriptive Statistics ............................................. 100
Figure 6. Turkey Respondent Employee Positions Descriptive Statistics .................................. 101
Figure 7. Total Respondent Organization Descriptive Statistics ................................................ 105
Figure 8. Total Respondent Employee Positions Descriptive Statistics ..................................... 106
Figure 9. Final CFA Model for Quality of Informal Relationships ............................................ 114
Figure 10. Final CFA Model for Perceived CM Network Effectiveness ................................... 117
Figure 11. Developed Structural Model...................................................................................... 120
Figure 12. Developed Structural Model for American Group .................................................... 129
Figure 13. Developed Structural Model for Turkish Group ....................................................... 130
Figure 14. American Respondents Geographical Locations ....................................................... 181
Figure 15. Turkish Respondents Geographical Locations .......................................................... 182
Figure 16. US Respondent Gender Descriptive Statistics .......................................................... 184
Figure 17. Turkey Respondent Gender Descriptive Statistics .................................................... 185
Figure 18. Total Respondent Gender Descriptive Statistics ....................................................... 186
Figure 19. CFA Model for Quality of Informal Relationships ................................................... 190
Figure 20. CFA Model of Perceived Effectiveness of CM networks ......................................... 191
Figure 21. The Generic Structural Model ................................................................................... 192
Figure 22. IRB Approval ............................................................................................................ 195
xii
LIST OF TABLES IN THE STUDY
Table 1 Operationalization of Study Variables ............................................................................. 49
Table 2. Top Ten CM Organizations with Highest Degree Centrality Score in WTC Attacks .... 94
Table 3. Top Ten CM Organizations with Highest Degree Centrality Score in Istanbul-2003
Attacks .......................................................................................................................................... 98
Table 4. Top Ten CM Organizations with Highest Degree Centrality Score in Madrid-2004
Attacks ........................................................................................................................................ 102
Table 5. Top Ten CM Organizations with Highest Degree Centrality Score in London-2005
Attacks ........................................................................................................................................ 104
Table 6. Descriptive Statistics of Survey Results ....................................................................... 107
Table 7. Descriptive Statistics of Survey Responses .................................................................. 109
Table 8. Goodness of Model Fit of CFA of Quality of Informal Relationships ......................... 112
Table 9. Goodness of Model Fit of CFA of Perceived CM Network Effectiveness .................. 115
Table 10. Goodness of Fit Statistics of Structural Models ......................................................... 119
Table 11. AMOS‘ Assessment of Non-Normality Test .............................................................. 121
Table 12. Individual Effects among Variables in SEM model ................................................... 123
Table 13. Goodness of Fit Statistics of Structural Models of American and Turkish Groups ... 131
Table 14. Individual Effetcs among Variables in SEM model ................................................... 132
Table 15. Correlation Statistics of CFA - Informal Relationships .............................................. 187
Table 16. Correlation Statistics of CFA - Perceived CM Network Effectiveness ...................... 188
Table 17. Correlation Statistics of CFA - Perceived CM Network Effectiveness ...................... 189
Table 18. Summary Information about Selected Countries ........................................................ 193
1
1. INTRODUCTION
1.1 Statement of the Study Problem
Crisis management (CM) has received increasing attention in public policy research due
to an increase in the number of natural and manmade disasters and casualties, as well as the
damage caused by those events (IRIN, 2005). Different suggestions have been made to improve
CM policy and administration (Quarantelli, 1987; Stern & Sundelius, 2002; Gillespie, Robards,
& Cho, 2004; Perry & Lindell, 2003; Alexander, 2005; Jaeger, Shneiderman, Fleischmann,
Preece, Qua, & Wu, 2007; Farazmand, 2007). There is no doubt that CM efforts should be
improved in order to handle those events more effectively, as the public has been pushing
governments to improve CM policies (Kapucu & Van Mart, 2006). There is, however, no
consensus on universally applicable best-practice policies among the cited studies.
Research has shown that well-implemented crisis management policies can save human
lives and reduce damage to property (McEntire & Myers, 2004). Inefficient crisis management
efforts result in excessive property damage and an increase in lives lost (Alexander, 2005). The
International Federation of Red Cross and Red Crescent Societies (IFRC) reported that in
underdeveloped or developing countries, citizens were more vulnerable to disasters because of
inadequate preparedness and mitigation efforts (IFRC, 2002).
Birkland defines disasters and crises as ―focusing events,‖ which are ―rare, harmful,
sudden event(s) that become known to the mass public and policy elites virtually
simultaneously‖ (1997, p. 3). Disasters and crises are focusing events; however, the term crisis
has a broader meaning that includes change and learning processes in policies (Birkland, 2006, p.
2
5; Boin & Hart, 2006, p. 52). Although crises after disasters create devastating outcomes, they
can still be neutralized and even routinized with mitigation and preparedness studies (Birkland,
2006; Alexander, 2005). Crisis management consists of hazard mitigation, disaster preparedness,
response, and recovery operations (Petak, 1985; Waugh & Streib, 2006; Perry & Lindell, 2003).
The term crisis management (CM) will be used in this paper instead of the terms emergency
management and disaster management, which are also used in the literature to explain the same
four-phase process, because this study also looked for the policy-changing aspects of CM
(Birkland, 2006).
Research shows that boundary spanners among or within organizations can have an
impact on the effectiveness of collective action (Kapucu, 2006; Rusaw & Rusaw, 2008);
however, this perspective was not fully utilized specifically for crisis management organizations
using different cases as examples. This study researched the relationship between the quality of
informal relationships within CM organizations and the interorganizational effectiveness of CM
networks. The adaptation of organizational rules and structures was also examined in terms of
CM network effectiveness.
In order to understand the conditions affecting the effectiveness of interorganizational
response efforts, various real-life crisis management operations worldwide were examined. The
9/11 WTC Attacks in 2001, the Istanbul Bombings in 2003, the Madrid Train Bombings in 2004,
and the London Metro Bombings in 2005 were employed as case studies. The most interacting
agencies in those incidents were obtained by UCINET Analysis (Borgatti, Everett, & Freeman,
2002). The employees of selected CM organizations were surveyed. The survey results formed a
dataset that was used to construct a Structural Equation Model (SEM). The SEM results enable
researchers to identify how the perceived effectiveness of interorganizational networks relates to
3
the quality of informal relationships and adaptation, using the measurement scale for CM
organizations derived from Quarantelli (1997).
If this study verifies that an increase in the quality of informal relationships within CM
organizations can increase interorganizational effectiveness during different emergencies, it can
be used as a best-policy suggestion that will allow CM efforts to benefit more people. It will be a
great success even if only one person is saved in a response/recovery effort of CM organizations
backed up by developed informal relationships as a result of this study. Furthermore, the study
will contribute to the network theory and the complex adaptive systems theory, as the theoretical
constructs will be utilized and tested in a multivariate statistical model.
1.2 Definition of the Terms
Crisis management can be defined as the rescue, preparedness, and mitigation efforts
accomplished by governments, volunteer organizations, or other local governments before,
during, and after an ―unexpected, uncontrolled public damage that disrupts or impedes normal
operations, draws public and media attention, threaten public trust‖ (Smith, 2006, p. 7). Public
damage can be anticipated and prepared for (Stallings & Quarantelli, 1985; Alexander, 2005).
Petak (1985) classifies the four CM phases as ―mitigation, preparedness, response, and
recovery.‖ By contrast, CM generally refers to response efforts initiated immediately after a
disaster. However, the response phase is actually just a smaller portion of CM (Waugh, 2000).
Mitigation is considered a ―risk reduction program‖ (Petak, 1985) that targets an area known to
be source of a public danger. Mileti (1999) argues that mitigation is conducted to reduce the
destructive effects of disasters. Land use planning, establishing warning systems, developing
newer engineering codes, and the utilization of advanced technology to predict future hazards are
4
examples of mitigation (Gillespie, Robards, & Cho, 2003). Thousands of public and private
organizations take place in mitigation efforts, which can require several decades or even more.
Mitigation policies are not conducted against a specific hazard; they are applied in an all-hazard
concept (Mileti, 1999; Waugh, 2000).
Preparedness, on the other hand, is a narrower term for a more specific risk area, which
includes planning a disaster management policy, training first responders and volunteers, and
developing essential agreements among public, local, and nonprofit organizations that are
supposed to act together in a crisis situation (Petak, 1985, p. 3). Christoplos et al. (2001) also add
ensuring the readiness of the society to the preparedness phase. Mitigation and preparedness
efforts can seriously reduce the damaging effects of an emergency or disaster (McEntire &
Myers, 2004; Alexander, 2005). Since crisis management is performed by public, private, and
nonprofit organizations, and since these organizations‘ structures are different from one country
to another, the emergency response systems of different countries are also different. There are,
however, some best practices discussed in this study that increase the effectiveness of any CM
organizations dramatically.
The recovery phase begins with the disaster. This phase includes the processes that return
the society to a normal condition (Petak, 1985). Waugh (2000) suggests that the recovery phase
is increasingly becoming a ―long-term reconstruction of the community‖ (p. 12). Temporary
housing, providing emergency food and energy, debris clearance, and even loaning to small
businesses after a disaster are cited under the recovery phase in CM (Waugh, 2000). The
response phase includes the immediate search and rescue operations. Professional and volunteer
first responders provide emergency aid to the victims in this phase. Evacuation, medical
5
operations, and firefighting are frequent procedures used in this phase to minimize damage and
save lives (Waugh, 2000).
The mitigation, recovery, and preparedness phases take more time than the response
phase. A quantitative assessment of CM therefore requires decades of observation and
measurement. Moreover, many public and private organizations take part in those CM phases for
a very long time. On the other hand, the response phase is about ―providing emergency aid and
assistance, reducing the probability of secondary damage, and minimizing problems for recovery
operations‖ (Petak, 1985, p. 3). It is also known that the majority of crisis management
organizations showed their greatest efforts during those incidents, which makes it easier to define
and measure their effectiveness in this phase alone. In order to measure the CM network
effectiveness in a short period of time with the highest efficiency, this study utilized quantitative
evaluations only about the response phase of CM efforts in cities that had been targets of terrorist
attacks.
In order to reveal the first study variable, quality of informal relationships, the study
utilized surveys filled out by CM first responders who were either managers or team members
who actually took part in response efforts in each studied country case. The survey employed a
nine-question scale that Nielsen, Jex, and Adams (2000) and Morrison (2004) created to indicate
the quality of informal relationships within selected organizations. In conducting the surveys, the
employees were selected from the CM organizations that played the most significant roles during
the emergencies.
The perceived effectiveness of the CM Network is the dependent variable of the study,
which indicated how effectively interorganizational CM networks operated according to the
survey respondents selected from CM employees. It was difficult to build a scale to measure CM
6
networks‘ effectiveness since these efforts took a very long time, included numerous participant
organizations, and occurred in a chaotic environment. Various dimensions of network
effectiveness can be considered in the measurement process (Provan & Milward, 1995).
However, Quarantelli (1997) suggests ten criteria to measure and evaluate the crisis management
efforts of interorganizational actions. These criteria include having a crisis coordination center,
the existence of crisis management training centers before major devastating events, and legal
arrangements related to crisis management. This study applied all ten of those evaluation criteria
to an SEM model to grade the effectiveness levels of case countries‘ CM organizations.
Additionally, the adaptation processes of CM networks were used as predicting variables
to estimate effectiveness perception. In other words, interorganizational efforts were also
examined in terms of organizational learning and adaptation processes (Comfort, Sungu,
Johnson, & Dunn, 2001). Organizational changes after drastic events in the environment were
important discussion points for this study. Because these changes may have positive or negative
impacts on effectiveness, organizations should be aware of the ways in which environmental
events have changed their operation in order to keep themselves on the right track. The harm
caused by such drastic changes can be minimized with the help of a successful learning and
adaptation implementation system (Comfort et al., 2001). Four adaptation variables derived from
the complex adaptive systems literature quantified the adaptation capability of agencies. From
that perspective, the predicting variable, adaptation, provided to the study both theoretical and
practical insight.
7
1.3 Purpose of the Study
The variables having the greatest impact on the effectiveness of crisis management were
revealed by quantified results, which led to a clearer understanding of CM research. The
effectiveness of interorganizational networks was examined in terms of informal relationships
and organizational adaptiveness, which was based on the Complex Adaptive Systems (CAS)
theory and network theory literature. Different countries were studied to provide global insight to
the study. Thus, a broader generalization of the results could be applied in the development of
generic strategies for CM.
Studying different CM operations and different public administration systems in terms of
interorganizational effectiveness would provide a comparative perception of crisis management
action. If possible, efficient strategies could be suggested to improve crisis management efforts.
These suggestions could provide more cognitive tools to first responders in crisis situations. As
with mitigation efforts, this study will also reduce the devastating impact of crises and lead to the
improvement of crisis management organizations‘ performance.
Research Questions
1. What constitutes the general difference among the case countries in terms of crisis
management effectiveness? What can be suggested to improve CM actions
universally?
2. Does the quality of informal relationships within crisis management organizations
affect the effectiveness of the crisis management organizations?
a. If there is a relationship between the quality of informal relationships and the
effectiveness of CM, what is its direction?

8
b. If there is a relationship, what is the strength of that relationship?
3. Does the adaptation capability of organizations have any impact on the effectiveness
of crisis management organizations?
a. Does the adaptation capacity of an organization have any impact on informal
networks?
b. If such an impact exists, what is the magnitude of the correlation?
1.4 Significance of the Study
It was discussed above that the literature provides extensive qualitative information about
methods for improving crisis management. The researchers did a great deal to indicate which
method is more effective than the others to improve crisis management. National response plans
or frameworks, professional public crisis management foundations, training facilities for first-
responder agencies, and more collaborative CM policies replaced conventional Cold War civil
defense tactics and methods with the help of studies performed in developed countries
(Quarantelli, Lagadec, & Boin, 2006).
This study, on the other hand, combined different methodologies, which is distinct to the
disaster management research area. SEM modeling was used to quantify the perceived
effectiveness, the quality of informal relationships, and the adaptation capacity of agencies that
took part in interorganizational CM networks formed during four different terrorist bombings
that targeted civilians in the most possible destructive way. Such a multivariate statistical study
represents a great example of empirical research on complex adaptive systems and crisis
management.
9
2 THEORETICAL FRAMEWORK AND LITERATURE REVIEW
2.1 Complex Adaptive Systems Theory
Dooley (1997) argued that a paradigm shift has taken place in organization science over
the last century. The deterministic Newtonian approach was used to understand the future
scheme of an organization by utilizing the current environment and structure of that organization.
The basic assumption of this approach was that the systems would continue to do the things that
they are supposed to do if they were provided with a suitable situation, adequate resources, and
convenient environmental conditions. Managerial theories in the beginning of the 20th
century
depended on this assumption (Dooley, 1997); Taylor, Fayol and other scientific management
theorists built their mechanical metaphor for organizations on this deterministic approach
(Morgan, 2006). Unlike mechanical approaches, complexity theory defends the notion that
stability stands between order and disorder, firmness and chaos—what is called ―edge of chaos‖
(Kauffman, 1993).
Quantum theory‘s uncertainty clause altered the deterministic-Newtonian approach not
only in physics but also in the social sciences (Dooley, 1997). Moffat (2003) argued that
organizations exist in complex environments (p. 42). These complexities are related to the
nonlinear interactions (nonequilibrium order), decentralized control (or self-organization),
adaptation, and collectivist dynamics of the organization (Moffat, 2003). Complex adaptive
systems have some common attributes, such as parallelism, conditional action, modularity, and
adaptation. Parallelism explains the simultaneous relationships existing among the systems.
Conditional action is the responsive strategic ties‘ reporting feedbacks to the system. Modularity
suggests some predetermined batch commands by which a system can overcome a problem.
10
Adaptation and evolution is the final phase for a CAS, because the learned patterns become
involved in the system, which means a change in structures and goals (Holland, 2001, 2006).
Non-hierarchical relationships such as friendships, social contacts, and even accidental
communications can directly affect the effectiveness of complex adaptive systems (Krackhardt &
Stern, 1988). Morel and Ramanujam (1999) defined complex adaptive systems as an
interdisciplinary area from which organizational behavior can benefit. Complexity and
organizations are inevitably and naturally related (Axelrod & Cohen, 1999), but the relationship
between these two concepts is complicated. Large numbers of non-linear elements make the
study of complex adaptive systems difficult (Morel & Ramanujam, 1999).
Anderson (1999) examined the complex adaptive systems theory as a product of open
systems theory because of its inclusion of environmental dependence as a factor. Interactions
with the organizational environment cannot be accomplished through conventional hierarchical
ties. Thus, organizations set up non-linear relations within and outside the system body to
increase communication channels. These ―strategic ties‖ that exist both inside and outside the
system follow a descent path to increase efficiency and decrease dependency on the environment
(Stacey, 1995). Stacey (1995) called the ties ―strategic‖ because they provide both negative and
positive feedback that helps the organization stay in an equilibrium state, which means that the
organization can survive the situation despite detrimental effects.
Scholars interpret the steps of complexity in similar terms. Anderson (1999) defines the
key elements of the complexity theory as ―agents with schemata‖ (1999, p. 221), ―self-
organizing networks sustained by importing energy‖ (1999, p. 221), ―coevolution to the edge of
chaos‖ (1999, p. 223) and finally ―system evolution based on recombination‖ (1999, p. 225).
McKelvey (1999) argues that four fundamental forces replace Scott‘s (2003) organization
11
metaphors, which are ―adaptive tension, self-organization, interdependency effects, and
multilevel coevolution‖ (1999, 302). In complex adaptive systems, the agents interact with each
other regarding their perceptions, actions, and social roles in organizations. The first element of
complexity is that the interactions will influence every single agent‘s thinking and behaviors.
These changes in agent thinking and behavior will alter the process principles of the entire
organization (Rouse, 2000). The second element explains the self-organization of the system.
After affecting and changing each other‘s behaviors in the system, agents‘ interactions create
positive feedbacks; therefore, they do not need to be changed. Stability in interaction and
organizing makes it possible to stay steady for the system without the involvement of a central or
outside impact (Anderson, 1999).
The third element uses the Darwinian ecological evolution metaphor to explain the
evolution process in the complex adaptive systems to adapt the changes in the environment and
in the system itself (Anderson, 1999). Interestingly, small changes can result in great changes,
while carefully implemented significant policy changes can produce insignificant change
(Vogelsang, 2002). This evolution can even change an organization‘s goals (Anderson, 1999),
which form the final element of complex adaptive systems. Agents‘ behaviors, interactions,
organizational culture, inner processes, and goals are subject to change along with changes in the
environment (Anderson, 1999; Vogelsang, 2002). Self-organized, agent-based, environmentally
driven system rules are evaluated on an evolutionary basis; thus the system stands in the
organizational environment with its strategic ties.
Kiel (1997) argued that CM agencies operate within dynamic and disproportionate
systems. These organizations are complex systems by themselves because numerous
organizations take part in the CM action randomly (Axelrod & Cohen, 1999). Irreducibility

12
(―knowing a system is not the same as knowing its elements‖) is an important component of
complex systems (Overman, 1996, p. 78). In any extreme event, local, regional, national,
international, nonprofit, public, and private actors all play a critical role within the same
environment for preparedness, mitigation, rescue, and recovery operations (Comfort, 1994).
Even individuals moderately affected by events take part in those efforts independently. These
emerging groups make CM a complex effort.
The relationships of these organizations with the other elements in the environment make
CM action even more complex. Each CM organization in the crisis scene is connected to a
different organizational entity, which produces a complex relationship web. For example, some
local CM organizations, including first responders such as police and fire brigades connected to
local municipalities, and some international disaster relief organizations, such as the German
Technisches Hilfswerk (THW, Technical Help Service) connected to the German Government
and the European Union, participated in the Hurricane Katrina rescue efforts that occurred in
2005 in the U.S. (Sherraden et al., 2006). Another reason for the complexity is that the exact
timing of disasters is unknown before the incidents. The suddenness of manmade and natural
disasters adds another dimension to the complexity of CM.
Chaos and unpredictability in the crisis environment increase nonlinearity in the systems
(Carley, 2002) operating within it, including CM agencies. Even the best calculations and
estimates in mitigation and preparedness efforts can result in big failures (Kiel, 1997). The
policies formed for linearly operating systems may not work in chaotic times; normal procedures
do not necessarily produce the expected results in nonlinear systems. However, Kiel (1991)
suggested that the fluctuations caused by the chaos within and outside of an agency can be
13
repetitive or rhythmic. As a result, the nonlinearity of those systems does not necessarily form
completely unknowable characteristics (Kiel, 1997).
Chaos is not detrimental to complex systems; it actually serves a useful function in
providing stability. Organizations usually use entrainment to stabilize their processes and goals
for as long as possible. Chaos breaks this rule and forces organizations to change this ―mode
lock-in‖ (1997, 191) since the only way to survive in chaotic times is to look for new process
forms. Chaotic cycles also work as a learning opportunity, because in a chaotic situation the
organization tries every possible method to survive. Successful methods are recorded in positive
feedbacks, which results in organizational learning (1997, 192). Looking at these functions of
chaos, it is clear that chaos offers both danger and opportunity (Overman, 1996).
Based on these assumptions, Kiel (1989) suggests that policy makers should consider
both traditionalistic linear processes and the nonlinear relationship mechanics of complex and
chaotic systems. Chaotic complex systems can be understood and managed properly once the
definable boundaries of chaotic behavior are typified (Kiel, 1997). ―Deterministic chaos‖ (Kiel,
1997, 190) defines the probability of chaotic cycles, which can be prepared for beforehand and
managed in a simple and mechanical way. Rosendhead (1998) argued that the managers of
complex systems should try to keep the agency in bounded instability instead of a perfect
equilibrium mode. Chaos and unpredictability should, in other words, be employed as partners.
Kiel (1997) suggests two methods for controlling chaos. The first method is tightening
the borders of agents‘ actions. The limited freedom of agents will provide stability and reduce
the unpredictability of the system. This conservative management style is a solution provided by
the old deterministic ideology that considers linear hierarchies among and within the agencies.
Limiting self-organization and increasing the central command authority appears to increase the

14
predictability of a system‘s actions. Kiel (1997) argued, however, that unconsidered nonlinear
processes in a complex adaptive system will fail the processes used to regulate linear
relationships.
Rosenhead (1998) and Kiel (1997) suggest another method for organizations that will
employ complexity and chaos as an element. Constant feedback from the members of a system
will make the administrative and executive branches aware of changes in system‘s environment.
Comfort (1994) emphasized the importance of open lines of communication during chaos. More
communication within and among the organizations in a CM system will grant faster and more
reliable feedbacks. Eventually, nonlinearity would have been employed as an organizational
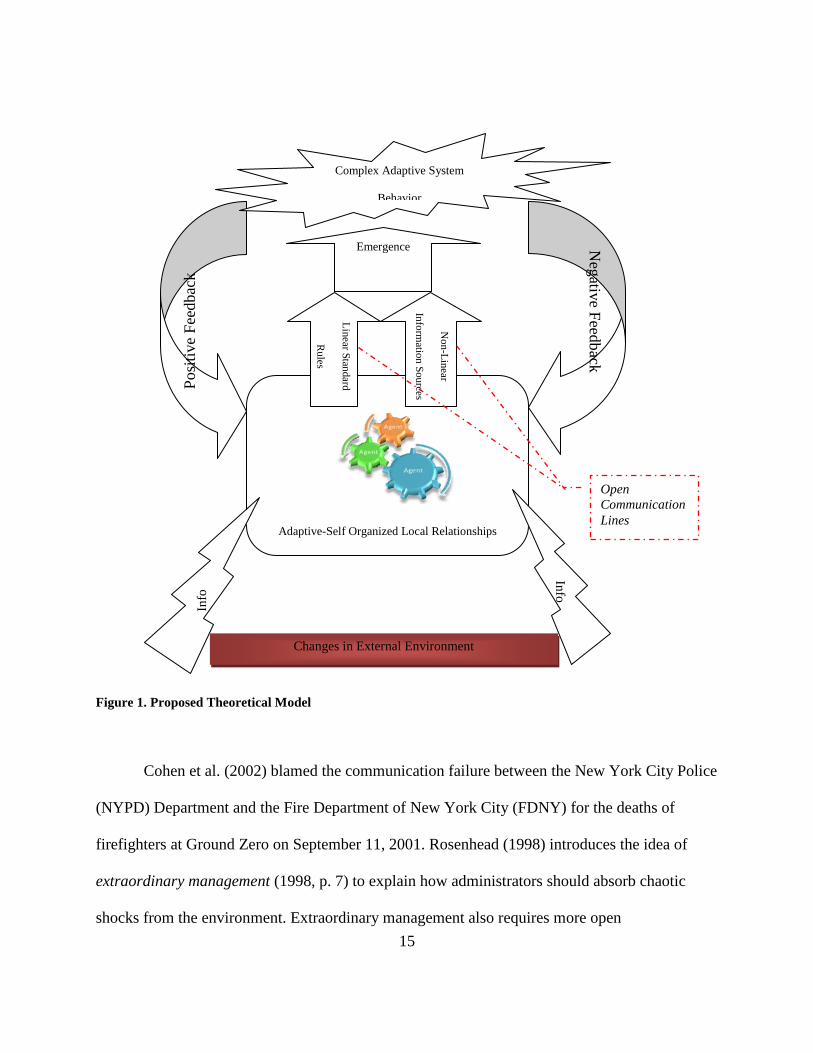
attribute. The suddenness of positive and negative feedbacks can increase the effectiveness of
CM operations (Figure 1).
15
Figure 1. Proposed Theoretical Model
Cohen et al. (2002) blamed the communication failure between the New York City Police
(NYPD) Department and the Fire Department of New York City (FDNY) for the deaths of
firefighters at Ground Zero on September 11, 2001. Rosenhead (1998) introduces the idea of
extraordinary management (1998, p. 7) to explain how administrators should absorb chaotic
shocks from the environment. Extraordinary management also requires more open
Adaptive-Self Organized Local Relationships
Neg
ative F
eedb
ack
Posi
tive
Fee
dbac
k
Emergence
Lin
ear Stan
dard
Rules
No
n-L
inear
Info
rmatio
n S
ou
rces
Info
Info
Changes in External Environment
Complex Adaptive System
Behavior
Open
Communication
Lines
16
communication lines among members. Continuous learning is the only tool for coping with the
maximum-uncertainty situations that CM agencies face (Kiel, 1997).
Human organizations, like CM entities, learn from the outside world with the help of
employees. The employees interact with the environment, which causes organizational learning
(Fiol & Lyles, 1985; Levitt & March, 1988). The learning process makes CM organizations more
prepared for future incidents because the lessons learned affect the structures and processes in an
evolutionary way (Kauffman, 1993). Local and national CM organizations learn not only from
their own experiences but also from other countries‘ practices with the help of developed
communication tools. Successful CM tools and organizational structures in different places are
copied and imitated to increase effectiveness in CM efforts (Comfort & Kapucu, 2006). The
paradigm shift in CM from Cold War‘s notion of civil defense to the present model of resilience
also indicates the adaptation process in CM systems.
Some CM systems are more responsive to negative or positive feedbacks than others,
depending on the limitations of the self-organizing capabilities of agencies in different public
management systems. Centralistic management makes it difficult for organizations to evolve
easily, because strict hierarchy resists change by any means. Carroll and Burton (2000) showed
that centralized structures can be as successful as decentralized ones in terms of the CAS
framework as long as they maintain a state of adequate information exchange. As discussed
below, this study‘s survey utilizes questions about the perception of the adaptation capability of a
general management understanding of CM systems.
17
2.2 Validity Discussions of Variables in the Study
In this part of the study, the measurement for each dependent, independent, and predictor
variables was explained. Two latent constructs were defined and operationalized in the analytical
model of this study. These are the perceived effectiveness of CM networks and the informal
relationships within them, which were discussed in this chapter comprehensively. Primarily,
interviews and the literature review helped formalize the theoretical constructs. Structural
Equation Modeling (SEM) enables the researchers to identify the strength and integrity of the
study variables and their causal relationships (Byrne, 2001).
2.2.1 Perceived Effectiveness of Crisis Management Networks
Network studies have recently formed a new research area in the social sciences. The
organizational effectiveness measurement cannot be used to evaluate network performance;
therefore, the literature offers newer and better techniques (Provan & Milward, 1995). Since CM
is an interorganizational network effort, the quantification process of this latent construct should
include performance measurement methods specifically designed for networks. Before this
process, the study briefly explains the conventional organizational performance measurement
literature in order to provide a better understanding of network effectiveness consept.
A. Organizational Effectiveness
Effectiveness measurement studies for organizations have been conducted since the first
organization was built. Numerous theories based on various assumptions and cultures were used
to verify those effectiveness methods. Generally, different input-output comparisons were
employed to grade effectiveness results. Kirchhoff (1977) summarized the organizational
18
effectiveness literature and suggested an assortment of measurement rubrics for ―organizational
effectiveness, managerial effectiveness, and manager and subordinate behaviors and attitudes‖
(1977, p. 348). He stood against the oversimplification of effectiveness measurement. His study
made it clear that researchers will acquire different effectiveness results for the same
organization if they apply different measurement methods, such as goal-oriented or evaluation-
oriented tests; however, the effectiveness measurement test will fail if only one of those criteria
is applied. Therefore, one should utilize a unique measurement set to understand the
effectiveness of an organization, since the complex organizations pursue complex goals. The
measurement scale should be related to a particular set of derived or prescribed goals for the
organization (Kirchhoff, 1977).
Steers also (1975) defined some problems in effectiveness measurement procedures.
Some of the 17 effectiveness measurements he established as evaluation criteria were
adaptability-flexibility, productivity, and satisfaction. Steers (1975) also stated that the
evaluation criteria for organizational effectiveness evolved in time. The classical way of thinking
favored basic cost-benefit analyses, or sometimes more retrospective cost-effectiveness analyses.
Basically, the inputs and outcomes of an organizational effort were compared to each other in a
cost-benefit analysis. Cost-effectiveness, on the other hand, was based on evaluating different
strategies by comparing them to other alternatives. This is, however, no longer the case in
organizational science literature.
Organizational effectiveness has more often been evaluated with other variables such as
adaptability-flexibility, consumer satisfaction, and employee retention recently. Social values in
societies and organizational norms are the best predictors for those evolving effectiveness
criteria. For that reason, measuring organizational effectiveness needs a contingent approach
19
more than a predetermined one. In other words, there is no single universal way to evaluate the
criteria for an effectiveness measurement model. The criteria should evaluate different
characteristics of organizational effort in terms of the organization and its environment
(Kirchhoff, 1977; Steers, 1975).
Quinn and Rohrbaugh (1983) also dealt with the criteria selection systems for measuring
effectiveness in organizational studies in terms of complex systems. If one suggests too many
various organizational variables by which to measure effectiveness, it is possible that no
evaluation will be performed because of the impossibility of gathering all those variables into a
single test (Quinn & Rohrbaugh, 1983). Social values and norms within an organization are also
a part of those criteria, which toughens the job for researchers. An integrating, multiple-variable,
contingent test seems to be the best alternative for effectiveness measurement, although it will
raise many objectivity problems as well. Effectiveness analysis is simultaneously organizational
analysis. One should know about the processes, policies, structures, and goals of an organization
in order to assess it (Quinn & Rohrbaugh, 1983).
Scott (2003) suggests three different perspectives from which to analyze organizations:
the rational, natural, and open-systems models. These models suggest different attributes for
organizations, and thus different effectiveness criteria. Scott (2003) also discussed combined
approaches. The structures and goals of organizations mainly defined the types besides the
dependency factor to resources.
Rational organizations are defined using a ―machine‖ metaphor (Morgan, 2006, p. 15).
There are specific rules for rational organizations (Goal Specificity, 2003, p. 29). An
organization is constructed to achieve a specific goal. The other important characteristic of
rational organizations is ―formalization‖ (2003, p. 33). There are strict and certain rules by which

20
rational organizations achieve their goals; these rules are followed through the whole structure of
the organization. Scott (2003) gives examples of the successful implementation of rational
organizational rules, such as Scientific Management (Taylor), Administrative Theory (Fayol),
Bureaucratic Theory (Weber), and Rational Decision Making (Simon). ―Scientific management‖
focused on increased efficiency, while the others focused more on the processes of an
organization (2003, p. 49).
Natural organizations, on the other hand, have complex goals. They are like ―living
organisms‖ (Morgan, 2006, p. 33); they try to ―survive‖ in the organizational environment
(Scott, 2003, p. 73). Unlike rational organizations, natural organizations depend on informal
relationships more than formal ones. ―Processes‖ and policy implementation are more important
than decision making. Scott (2003, p. 54) discusses the informal relationships among employees
in formal organizations and its importance. Goal complexity is another issue that natural systems
deal with differently from rational ones. There are real goals and ―professed goals‖ (p. 52). Even
though an organization can have written, rational-type rules, it can, for the sake of surviving,
follow other rules that are not clearly defined. Like a living organism, social evolution can
change the structure of the organization dramatically. New structures can be established to adapt
to the change in the environment, while some structures can be abandoned for the same reason
(pp. 52-73).
The open system is the third and the last structure type that Scott (2003) discusses while
classifying organizations. Basically, organizations and, in a broader sense, systems are formed by
different components that are independent and/or interdependent. Open systems theory has the
greatest complexity among other types in terms of its ―analogy‖ (Morgan, 2006, p. 38). The
theory suggests that present organizations are interdependent with the other organizations in the
21
environment. Organizations are like components in a system, which interact with each other.
Some systems use others‘ products as inputs. This creates ―interdependency on the others‖
(Scott, 2003, p. 25). Systems cannot survive without others‘ existence. The networks theory also
suggests the organizational networks‘ dependence on environmental factors.
B. Network Effectiveness
Provan, Fish, and Sydow (2007) argue that networks cannot be understood unless they
are evaluated as ―whole networks.‖ In order to explain networks, the literature utilized ―common
themes (such as) social interactions, relationships, connectedness, collaboration, collective
action, trust, and cooperation‖ (Provan et al., 2007). Networks theory takes its strength from the
theory‘s suggestions for contingency, imperfect environment information, and interdependency
clauses (Agranoff & McGuire, 2001). However, measuring the effectiveness of networks is more
complex than simply measuring the effectiveness of single organizations. The satisfaction of
stakeholders is a primary criterion for network effectiveness. Public organizational networks‘
common stakeholder is the public; thus, the community‘s satisfaction rate is the most common
measurement tool for public networks (Provan & Milward, 1995). For that reason, any
environment-driven policy tool that will bring customer satisfaction is supposed to achieve a
significant level of network effectiveness.
Some stakeholders may be special; their concerns may be different from the rest of
society. For example, Provan and Milward (1995) argue that special interest groups such as
prison inmates or school children constitute different kinds of stakeholders that can have
concerns that are completely different from—or even contrary to—the public. Thus, political
concerns are also important to address when evaluating network effectiveness. Provan and
22
Milward (1995) summarize this idea as follows: ―Networks must be evaluated as service-
delivery vehicles that provide value to local communities in ways that could not have been
achieved through the uncoordinated provision of services by fragmented and autonomous
agencies‖ (p. 25).
Evaluations based on the services delivered made network effectiveness measurement
scales unique. For example, Siegel, Clayton, and Kavoor (1990) defined a measurement set to
evaluate the institutions educating students in public administration in the U.S that only included
variables related to the processes of those departments (p. 221). Thomson, Perry, and Miller
(2007) also suggested a contingent method for measuring the collaboration among the
organizations in a network. Despite the low response rate (32%) of the surveys and insignificant
statistical results (p for Chi-Square > 0.05) of the SEM structural model, the authors argued that
reciprocity played a significant role in collaboration and governance. They suggested a more
contingent measurement scale for the future research agenda in collaboration (Thomson et al.,
2007).
Networks should be evaluated to understand whether they really work (O‘Toole, 1997).
The evaluation requires a comprehensive study regarding stakeholders, as well as the
environment, structures, and rules of the network. The numerous difficulties discussed above
force this study to have a contingent standpoint in terms of CM networks. The contingent
network variables were assorted in Provan and Milward‘s (2001) study in regard to the
organizational and network level. Using Quarantelli‘s ten criteria (1997), the study utilized the
contingent approach suggested.
23
C. Perceived Effectiveness of Crisis Management Networks
Since the four phases of crisis management (Petak, 1985) include very different and
complex labor and all these efforts are too difficult for a single entity to conduct (even when that
entity is a government), society needs specialized and professionalized organizations for these
operations. This is the basic reason why crisis management effort is a network effort; no single
body can accomplish all the phases of crisis management by itself (Agranoff & McGuire, 2001).
As suggested in the previous chapter, CM effectiveness could be measured first by defining the
stakeholders. In the New York WTC Attacks (2001), the Istanbul Bombings (2003), the Madrid
Train Bombings (2004), and the London Metro Bombings (2005), the CM networks‘
stakeholders were the organizations that took part in the response and recovery efforts and the
victims who suffered from the attacks. Victims are the people directly affected by the attacks,
whether physically or psychologically. In essence, entire nations can be counted as victims, and
thus as stakeholders.
Measuring crisis management organizations‘ effectiveness is challenging because of the
presence of complicated results, chaotic environments, incomparable or non-standardizable
inputs and outputs, and numerous participants and stakeholders. CAS theory suggested that the
complexity in non-linear interactions will increase with a greater number of interorganizational
relationships (Alexander, 2005). Emergencies or extreme events leave a lot of people dead,
injured, or incommunicado; destroy coordination routes such as roads, telecommunication lines,
and the like; and halt the normal flow of life, which shocks the victims badly (Samardjieva &
Badal, 2002; Helbing, Ammoser, & KÄuhnert, 2005; Dynes & Quarantelli, 1976). The
stakeholders have very complex and immediate needs; thus the effectiveness measurement
24
should take as many of those variables as necessary into account to achieve a significant
validation level for the proposed latent construct.
The effectiveness measurement scale should be designed to fit in a way that demonstrates
the characteristics of CM networks. The structures, relationships, basic rules, processes, standard
exercises, attributes, and any other traits of CM systems should be addressed in the scale. Several
studies evaluated crisis management responses quantitatively. Drabek et al. (1981) is the pioneer
of such studies; the study in question utilized a detailed questionnaire administered to both the
emergency management officials and victims of selected fourteen case studies. They selected the
target organizations by using a block modeling technique similar to the UCINET method. Block
modeling is a tool used to reveal the relationships in a network (Drabek et al., 1981). The survey
questions were related to organizational attributes more than to network effectiveness.
Quarantelli (1997) suggests a scale for empirical studies. The study operated on these
―ten criteria‖ (Quarantelli, 1997):
1. Correctly recognizing differences between response and agent-
generated demands
2. Adequately carrying out generic functions
3. Effectively mobilizing personnel and resources
4. Generating an appropriate delegation of tasks and division of labor
5. Adequately processing information
6. Properly exercising decision making
7. Developing overall co-ordination
8. Blending emergent and established organizational behaviors
9. Providing appropriate reports for the news media
10. Having a well-functioning emergency operations centre. (p. 41-54)
The first statement is about the preparedness phase. It controls whether the CM
organization is aware of the reason for the crisis. If the CM employees‘ behaviors are based on a
management crisis resulting from the chaotic environment, then CM will not be successful. If the
25
disaster agent (whether it is a flood, a terrorist attack, or something else) is clearly known and the
CM efforts are based on that specific agent, then the CM operates effectively. The second
criterion more specifically assesses CM capability. Generic functions such as evacuation,
temporary housing, and the like are basic operations that a CM system should be capable of
performing in the most extreme events. The third criterion concerns resource allocation in a
crisis environment. If the CM system is ready to deliver those services and resources to the
victims effectively, then the CM strategy is efficient.
The fourth criterion is more about the management of the CM effort. The organizations
should have the specifics of division of labor and delegation of authority codified in writing
before extreme events occur. The fifth statement tests whether the information transmittal
process during a crisis is successful. Communication has been seen as the main problem in many
disaster recovery actions; however, it was not due to the communication tools, it was about the
things that were communicated. Quarantelli (1997) suggested that the fifth criterion has three
dimensions: processing information within an agency, with other agencies, and with affected
citizens. The surveys included different questions for each dimension, and another variable
combined all these in one factor.
The sixth and seventh criteria concern the CM network process during an extreme event.
Proper decision making and efficient coordination among the CM organizations is crucial, since
the continuity of life depends on them. The eighth criterion may be seen in the same light;
however, it is very different because it includes emergent groups besides CM organizations.
Emergent groups are volunteers and affected citizens. Those groups should take part in CM plans
as first responders for an effective CM. Otherwise, CM networks would not only lose an
26
important resource in the response and recovery phases, but would also face difficulties because
of jurisdictional conflicts, authority problems, and lack of public support.
The last two criteria are the most concrete indicators of CM effectiveness. Appropriate
and routine press meetings during an extreme event will provide accurate information to the
press and eventually to the public. Quarantelli (1997) argues that the media will continue to
disseminate information even if they do not receive accurate information from CM officials,
which will lead to the public receiving inaccurate information. Press meetings can also be
important for informing the public, as governments do not have adequate news channels to
disseminate as much as the media can. The last criterion is a well-established coordination center
for CM organizations. This center is not just the common infrastructure, but also a social system
with which different organizations interact with each other via liaison personnel.
As seen above, the Quarantelli (1997) scale deals with the networks, coordination,
communication, effectiveness, performance, cognitive skills, validity, and operability of CM
efforts. The scale includes conventional organizational efficiency criteria (Kirchhoff, 1977;
Steers, 1975) and advanced network performance criteria (Provan & Milward, 2001). It is also
contingent, as the variables are only related to CM efforts. The ―ten criteria‖ (Quarantelli, 1997)
were used in this study‘s survey with Likert scale questions in five response categories.
2.2.2 Quality of Informal Relationships
The quality of informal relationships within crisis management organizations is easier to
measure with respect to the network‘s effectiveness level. Selected organizations‘ employees
were surveyed to understand the degree of informal relationships among personnel. Friendship
relationships were found out for each participant organization. A high quality in informal
27
relationships was assumed to be a predictor for better network effectiveness perception since
more friendships were assumed as having more open communication lines.
Informal relationships involve friendships, casual encounters, and other social ties among
employees of organizations, which can be made quantifiable with competent scales (Nielsen et
al., 2000; Morrison, 2004). Friendships generally occur in the subunits of an organization. They
can create dysfunctional results if uncontrolled. However, when correctly applied, informal ties
among and within networks can bring efficiency to the related organizations (Krackhardt &
Stern, 1988). Informal ties also provide trust among and within the agencies; they may even
replace formal relationships. Additionally, increasing numbers of organizations employ teams for
efficiency, another factor that reveals the importance of informal relationships (Nielsen et al.,
2000). Informal relationships within an organization can directly affect the performance of the
whole organization (Morrison, 2004). Both Nielsen et al. (2000) and Morrison (2004) built scales
that measure informal relationships in the organizations they examined. This study evaluated
those scales for selected CM organizations‘ personnel.
Informal ―relationships are voluntary, reciprocal, and equal‖ (Morrison, 2004, p. 115).
The more informal collaborative structure an organization has, the better it can withstand a crisis
(Krackhardt & Stern, 1988). Nielsen et al. (2000) also suggested that informal relationships
among employees can enable significantly better work-related outcomes. Thus, it can be
theoretically accepted that friendships in a workplace can increase the effectiveness of an
organization (Morrison, 2004).
The survey utilized the same questions Nielsen et al. (2004) used:
I am able to work with my coworkers to collectively solve problems.
In my organization, I have the chance to talk informally and visit with others.
28
I socialize with coworkers outside of the workplace.
I feel I can trust many coworkers a great deal.
I do not feel that anyone I work with is a true friend.
I have formed strong friendships at work. (2004, p. 635)
Nielsen et al. (2004) found that the internal consistency reliability of the utilized
questionnaire estimated (with Cronbach's alpha) the ―prevalence of friendship‖ at eighty-nine
percent. The survey also used additional related questions from Morrison‘s (2004) questionnaire.
Morrison asked more than 100 questions in his study; however, this study used only the three
most important of them that Morrison (2004) clearly emphasized, which are:
I personally work for this organization because she/he (a special peer) still works
here.
Friendships make it [work] a happier place with friendly environment and 1 enjoy
catching up with them each day.
Friendships help us to work cooperatively with each other and support each other
at times of stress. (2000, p. 121)
Combined with Nielsen et al.‘s (2000) questions, the questionnaire revealed the presence
of informal relationships among crisis management organization employees. Responses to each
of these items were made on a Likert scale that ranged from 1 (strongly disagree) to 5 (strongly
agree). The results were evaluated with the SEM model (Figure 2). The study proposed the
following statement based on literature findings:
H1 – A higher quality of informal relationships within crisis management organizations
will increase the effectiveness of crisis management efforts.
29
2.2.3 Organizational Adaptation in Crisis Management Networks
Organizational learning phases were incorporated as the adaptive responses of
interorganizational efforts. Stacey (1995) suggested that the evolutionary changes in a system
happen within the structural relationships within and outside the organization and/or in changes
in the goals pursued. In the learning phase, the organization ―can restructure itself and acquire
and implement new competences‖ (Rochet, Keramidas, & Bout, 2008, p. 66). The experience is
recorded to the organizational memory, ―which will allow it, among other things, to identify the
warning signs of any future crisis‖ (2008, p. 66).
Researchers measured organizational adaptation in different ways. For instance, Chiva-
Gómez (2003) processed nine organizational learning and adaptation measurement studies and
summarized the evaluation criteria of organizational learning as ―experimenting with new ideas,‖
―continuous improvement,‖ rewarding,‖ ―openness to change,‖ ―interaction with environment,‖
―mistake and/or risk acceptance,‖ ―dialogue,‖ ―communication and social construction,‖
―continuous training‖, ―empowerment, teamwork, and collective spirit,‖ ―workers that want to
learn and improve,‖ the existence of leadership committed to teaching, a non-strict and flexible
organizational environment, and the like (2003, p. 112).
Spector and Davidsen (1998), on the other hand, list ―actions as reflected in terms of
information flow,‖ ―goal formation processes,‖ ―instances of goal cohesion and goal erosion,‖
nonhierarchical exchanges, reflective activities, ―sentiments as reflected in attitudes and
preferences,‖ respect, support, and trust, ―team processes,‖ communication and co-mentoring,
―tolerance for errors,‖ and the like. Their study compared numerous organizational learning
evaluations (Spector & Davidsen, 1998, p. 120). The similarities between these two research
efforts give this study a clear direction for selecting a predicting variable: adaptation. Since
30
adaptation is referred to in CAS theory and was only employed as a predictor variable, it did not
serve as a unique latent construct. Instead, most of the important organizational adaptation
variables that Chiva-Gómez (2003) and Spector and Davidsen (1998) suggested were utilized as
predictor variables for the investigation of the relationship between the perceived effectiveness
and quality of informal relationships.
On the other hand, organizational adaptation is generally thought to be exactly the same
as organizational learning, despite the fact that the two terms refer to completely different
phenomena (Fiol & Lyles, 1985). Organizational learning is an ―insightful‖ experience that is
hard to quantify and measure. Organizational adaptation is formed by basic reactions that the
organization created against the changes in the environment. The study utilized changing
capability and changes in the organization as experimental learning tools. Thus, surveys were
also conducted to generate the measures for adaptation capability. The variables presented in the
SEM model are ―openness to change,‖ ―change in the policies after important events,‖ ―intra-
organizational education efforts,‖ and ―frequency of collaborative events,‖ as suggested in the
two studies aforementioned (Chiva-Gómez, 2003; Spector & Davidsen, 1998).
All four of those variables represent a different aspect of organizational adaptation in
terms of CAS theory. Openness to change is the starting component of adaptation. CM systems
are open systems because they are highly affected by the environment. For example, Corbacioglu
and Kapucu (2006) argued that the Turkish Disaster Management System was highly affected by
major earthquakes that hit different regions of Turkey and left a great number of casualties.
Birkland (2006) also discussed the importance of focusing events in terms of CM policy
changes. The World Trade Center attacks in New York City on September 11, 2001 changed CM
policies in the U.S. and throughout the world. Since then, terrorism events have been discussed
31
as crises that need to be taken care of more efficiently and with more adequately planned policies
(Birkland, 2006). Based on the literature reviewed, the following hypothesis was made:
H2 – The openness of CM organizations to change has a positive effect on the perceived
effectiveness of CM networks.
Policy changes after important events constitute the other adaptation variable in the SEM
model (Figure 2). This variable is different from the first adaptation variable because openness
merely defines the ability to change. However, concrete changes may not take place even if the
CM organizations are capable of doing so. During the Cold War, CM policies were essentially
locally operated civil defense strategies (Waugh & Streib, 2006; Birkland, 1997). CM
organizations were the same first responders that acted with a more comprehensive
understanding of CM right after the Cold War. This means that CM organizations were capable
of change; however, the CM policies did not change, due to government pressure to maintain the
status quo. In time, organizations learn lessons from their ―routine‖ experiences and then codify
the necessary changes in preparation for later crises (Levitt & March, 1988). Changes in policy
indicate an organization‘s willingness to keep an equilibrium state in the environment, which
will eventually improve organizational effectiveness (Anderson, 1999; Kauffman, 1993; Stacey,
1995).Therefore; the next hypothesis is:
H3 – Changes in CM policies due to important events will positively affect CM
effectiveness.
Intra-organizational training efforts are suggested to be helpful and performance-
enhancing for organizations. Chiva-Gómez (2003) argued that continuous training for all
personnel was encouraged by researched private companies. Moreover, in a report criticizing the
poor intervention of Federal Emergency Management Agency (FEMA) in the response and
32
recovery efforts for Hurricane Andrew in 1992, the U.S. Government Accountability Office
(GAO) asserted that more advanced training and professional education were needed for
improved CM. The report made it clear that intra-organizational training for effective CM is not
only needed for the local CM personnel but also for FEMA‘s federal employees (GAO, 1993).
This information led the study to the following hypothesis:
H4 – Intra-organizational training of CM personnel will lead to more effective CM.
Levitt and March (1988) examined the methods for keeping routine experiences in the
organizational memory. They found that sharing exercises with other organizations can help to
improve organizational memory and capacity. In fact, collaborative team processes and real-time
CM efforts are suggested by many scholars to have a positive impact on CM (Alexander, 2005;
Perry & Lindell, 2003; Rodriguez, Quarantelli, & Dynes, 2006). By ―collaboration,‖ the study
refers to CM experiences conducted with other organizations. Real experiences will create an
organizational memory that increases effectiveness in later extreme events.
The study proposed that actual events can increase the effectiveness of CM organizations
because the organizations will gain practical knowledge of real incidents. The more the
organizations deal with crises, the more experience they will obtain. Thus, the hypothesis
evaluating this adaptation variable is:
H5 – Frequent actual CM experiences increase CM effectiveness.
2.3 Research Hypotheses
1. A higher quality of informal relationships within crisis management organizations
will increase the effectiveness of crisis management efforts.
33
2. The openness of CM organizations to change has a positive effect on the perceived
effectiveness of CM networks.
3. Changes in CM policies due to important events will positively affect CM
effectiveness.
4. Intra-organizational training of CM personnel will lead to more effective CM.
5. Frequent actual CM experiences will increase CM effectiveness.
34
3 METHODOLOGY
3.1 Analytical Model
Previous studies have found that informal relationships developed before crises and
emergencies have a significant positive impact on crisis management efforts (Handmer, 2003;
Comfort, 2005; Kapucu, 2006). In those studies, CAS theory was not internationally utilized to
address this problem by scholars because a limited number of cases (for example, 9/11) were
used to explain informal relationships. It was suggested that casual friendships and informal
relationships increase the information about incidents in complex environments. Because
complexity and bounded rationality increase in the environment during emergencies due to the
increased number of participants and damaged communication lines (Dynes & Quarantelli,
1976), it is crucial that emergency management organizations strengthen their social capital
(Kapucu, 2006).
Voorhees (2008) asserted that local emergency workers performed better than authorized
emergency organization employees during the WTC attack because of the informal social
relationships they had before the incident. Voorhees (2008) also suggested that social skills
should be increased among rescue workers to increase the effectiveness of emergency efforts.
The analytical model in this study focused on the basic suggestion of open communication lines
offered by the CAS theory. However, this study is different because it employs four different
emergency cases from around the world and compares them in terms of correlations among
quality of informal relationships, adaptation, and network effectiveness. Finally, the study has
35
gathered evidence to show how informal relationships among crisis management workers can
improve response and recovery efforts during an emergency.
The differences in crisis management systems and organizations among several countries
were addressed in order to explain the effect of the structures and rules of crisis management
organizations. Four countries‘ crisis management organizations were examined for their efforts
during catastrophic terrorist events, including New York in 2001, Istanbul in 2003, Madrid in
2004, and London in 2005. Multi-organizational terrorism response and the coordination
perspective were used to show the comparative effectiveness of CM organizations when
engaging different management skills and efforts.
The organizational learning and adaptation processes of crisis management organizations
in the related countries were examined to discern best practices in effective crisis management
operations. Ten effectiveness, nine informal relationship, and four adaptation variables were
included. An SEM model was formulated and validated (Figure 2).
3.2 Methods
Emergency management is a four-phase occasion that can take decades to occur (Perry &
Lindell, 2003). Many different local, federal, governmental, non-governmental, public, and
private organizations or individuals can take part in any CM stage. Quantifying selected study
variables for such an occasion, which requires decades and involves thousands of organizations
and individuals, is a challenge this study faced. Assessments of emergency management
effectiveness are generally qualitative and descriptive (Paton & Flin, 1999; Buckland & Rahman,
1999; Williams, Batho, & Russell, 2000), or quasi-quantitative (Comfort & Haase, 2006). All of
these studies used case analyses focusing on specific natural or manmade disasters.
36
Selecting and examining the rescue and recovery phase of crisis management makes
sense when the following points are considered. Firstly, as discussed above, other phases of
crisis management can take several decades to complete. Research requiring several decades
would be too costly and time-consuming for the purposes of this project. Secondly, thousands of
organizations and individuals take part in those phases at different times. This is an important
challenge, since a researcher cannot keep records of such a large amount of input in a crisis
management system. Lastly, almost all of the organizations and individuals taking part in other
phases of crisis management have a role in the response and recovery phases. Therefore,
capturing and examining the response and recovery phase enhances the efficiency of this
research.
3.2.1 Multiple Case Study Analysis
―Focusing events‖ (Birkland, 1997, p. 3) are natural or manmade disasters. Terrorist
attacks against civilians are the greatest manmade disasters in terms of social panic and public
outcry. The fear of another attack has a psychological effect on society that is difficult to
overcome. The emergency management systems of most countries in the world have generally
been prepared for natural disasters. However, terrorist attacks create another kind of threat that
these systems have not experienced before (Aguirre, 2004). Terrorist attacks are different
because they are unexpected and unpredictable, the attackers‘ methods and the public‘s reaction
are unknown to public administrators, and the scope of attacks cannot be understood
immediately (Wise & Nader, 2002). This difference led this study to focus on terrorist events
more than on other catastrophes.
37
There were and still are many different terrorist organizations in the world fighting for
various reasons. Many of these terrorist networks carry out deadly attacks on civilians and
government officials in different countries. The ETA in Spain, the IRA in the UK, and the PKK
in Turkey, as well as some others in South American countries (Abrahms, 2008), can be said to
be the most violent up to now. However, none of them operated worldwide as much as Al-Qaeda
did. Al-Qaeda, after its founding during the Afghan-Russian war, operated violently in many
European, Asian, African, and American countries. Using the U.S. occupation of the Middle East
as a base for its attacks, this terrorist network used car bombings and suicide attacks in its
military campaigns. Drugs, blood diamonds, and human trafficking in different countries have
been financial resources for this network (Hoffman, 2007).
The sample for this study is members of agencies that operated in interorganizational
crisis management efforts in response to four different terrorist attack cases. The study used a
multiple-case study guide. Yin (2003) argued that the multiple cases selected in a research
should replicate each other to provide consistency. This replication can occur literally by
―predicting similar results‖ or theoretically by ―contrasting results for predictable results‖ (2003,
p. 5). For that reason, the study utilized the terrorist cases assumed to be organized by the same
terrorist organization. Moreover, the attacks were conducted in the busiest time of the targets to
kill as many people as people possible. Another similarity was the simultaneity of the attacks.
Literature generally cites these four cases together as major Al-Qaeda attacks against
Western civilization (Riedel, 2007; Stevenson, 2006; Hoffman, 2007; Atwan, 2006, p. 10).
However, besides the four attacks that were utilized by the study, the Bali bombings in 2002 and
2005 and the Jakarta Bombings in 2004 are also thought to have been major Al-Qaeda attacks.
Nonetheless, there is no conclusive evidence tying those attacks to Al-Qaeda (International
38
Crisis Group, 2006). On the other hand, the attacks in areas like Indonesia, Saudi Arabia, and
some other African countries took place in cities that did not have proper emergency
management systems in place to respond to such disasters. Some international efforts were cited
in the studies coming from the Australian government and some other western countries,
including the U.S. (International Crisis Group, 2006); therefore, the Bali bombings and others
were not considered a part of this study.
3.2.1.1 The New York WTC Attacks, 2001
Two different airplanes plowed into the North and South Towers of the World Trade
Center on September 11, 2001, at 8.46 AM and 9:03 AM respectively. Within 90 minutes, both
towers collapsed, causing the deaths of thousands of people including employees in the towers,
people working close to the WTC towers, crisis management organization employees, police and
fire department officials, and others. On the same day, another plane hit the Pentagon building in
Washington, D.C. at 9:37 AM, killing dozens in the building and all the passengers on board.
The last plane fell, with the passengers aboard, into a field in Pennsylvania at 10:03 AM (Kean
& Hamilton, 2004). Nearly 3,000 people died, and the damage was calculated in the billions of
dollars.
There were problems in New York with the emergency operations. The 9/11 Commission
Report argues that there were problems especially in the Fire Department and Port Authority
Department, neither of which were prepared for such an attack. Their equipment and
communication tools were inadequate. Many of their employees lost connection and control
during the emergency. The higher-ranked officials could not stay in touch with their teams,
which caused inefficiency in the response efforts (Kean & Hamilton, 2004).

39
A significant amount of legislation was passed in the U.S. in the aftermath of 9/11.
Combining intelligence tools, uniting crisis management organizations, and toughening
protective measures were the primary goals of those new policies. Combining intelligence
sources was intended to integrate centralized government law enforcement agencies in one
database. In this way, the government hoped to make central and local agencies more aware of
imminent threats in the future. However, such a transition could not be accomplished because of
reasons that ―merit examining‖ (Comfort, 2005). The Patriot Act was also questioned heavily by
the public because of specific codes that seemed designed to limit individual freedom.
The most important aspect of this government restructuring, as far this study is
concerned, was the effort to unite all crisis management departments under one centralized
department dubbed ―Homeland Security.‖ A department chief was appointed by the President;
however, the department was officially without either budget or authority. A significant number
of agencies involved with the White House opposed the department‘s creation, because they
thought that such a structure would fail local emergency efforts (Comfort, 2005). It is still
unclear whether centralized or decentralized governmental efforts are more successful in
preventing casualties and damages during disasters. 9/11 was the most horrifying terror incident
ever. It shaped many crisis management policies both in the U.S. and abroad.
3.2.1.2 The Istanbul Bombings, 2003
On November 15, 2003, two trucks full of explosives were detonated by suicide bomber
terrorists in order to attack two synagogues simultaneously in Istanbul at 9.29 AM. It was
Saturday, and the terrorists aimed to kill Jewish people at prayer time. The attack killed 30
people, mostly Muslim Turkish citizens, and injured approximately 300 individuals. The second
40
attack came five days later, on November 20, and targeted both the largest HSBC Bank building
in Turkey and the British Consulate in Istanbul with two trucks at 10.55 AM. The bloody
terrorist attack killed 33 people, including the British Consul, and injured another four hundred
fifty. The attacks created a crime scene dozens of miles square. The Turkish National Police was
assisted by Israeli and British law enforcement agents during the crime scene investigation
(Rodoplu, Arnold, Tokyay, Ersoy, & Cetiner, 2005; Tatil, 2005).
The centralized structure of the law enforcement agency in Turkey helped the police to
define all the suspects immediately after the attacks. All criminals linked to the bombings were
apprehended within weeks (Tatil, 2005). The police force was the first to arrive at the crime
scenes with other first responders—medical operators. These first responders immediately
secured the area, although it was a huge crime scene, and processed the victims in the crime
scene. A few people were sent to the hospitals; many of them were discharged after a small
medical intervention (Rodoplu et al., 2005).
The scale of these attacks was smaller than that of 9/11; however, it was the largest series
of terrorist attacks the Turkish Republic had ever experienced. Communication and power lines
were disrupted in the attack sites, which significantly undermined the rescue efforts. Four
different attacks within five days affected the Turkish people psychologically and economically.
The stock market fell 7.4% immediately after the attack. The chaotic environment remained until
the roads were opened to service after CSI (Rodoplu et al., 2005).
It was clear that Medical Emergency Management Services (MEMS) were not ready for
the attacks. Similarly to 9/11 and other cases that will be discussed later, resources were used
inefficiently. Every MEMS ambulance was sent to the crime scene, which only increased the
chaos. Other parts of Istanbul were left without immediate medical services as a result. The
41
MEMS ambulances were not aware of triage application, which may have led to greater
problems. Public announcements about the incidents were also not conducted by government
officials, which led to disinformation among the public (Rodoplu et al., 2005).
3.2.1.3 The Madrid Train Bombings, 2004
This incident was Europe‘s worst-ever terrorist attack. Fourteen different bombs were
located in different locations on Madrid train lines. Ten of them exploded simultaneously; trains
going to different locations in Madrid were targeted by the terrorists. One hundred ninety-one
people, including the perpetrators, died, and more than 1,500 were injured. Similarly to the
Istanbul, London, and New York bombings, the terrorists aimed to cause the greatest number of
casualties possible and attacked the transportation system at the busiest time of the day: 7:39 AM
(Bolling et al., 2007).
Spain‘s response was unprecedented. National and regional crisis management
organizations worked together to help the people affected by the attack and find the criminals
behind the attacks. The national authorities were involved in the case approximately one hour
after the attack; by this time, the regional commanders had taken the injured to the nearest
hospitals and secured the crime scenes for official investigation. Tent hospitals were established
to mitigate the workload of the regular hospitals, and only 12 people died after being brought to
the emergency health departments (Cornall, 2005). The Spanish Catastrophic Emergency Plan
was well established to handle this kind of emergencies.
Preparedness against terrorist activities in Spain is a result of the existence of the Basque
Separatists and the ETA threat. Regional and national emergency officials were well aware of
the extreme need for manpower in these situations, and for that reason, even though the incident
42
took place at the night-to-day shift change, neither the police nor health officials left for home,
which doubled the emergency response force (Bolling et al., 2007). Medical groups, security
officials, and police organizations worked in coordination with other governmental departments,
according to the Spanish Catastrophic Emergency Plan. Ninety minutes after the first blast, there
were no injured people in the area. After 11 hours, the transportation system was running as
before (Cornall, 2005).
3.2.1.4 The London Metro Bombings, 2005
Because of the Istanbul attacks targeting the British Consulate, the UK government was
aware of the possibility that a terror incident would target British Civilians (HMG, 2006). The
terrorist contingency difference in the Civil Contingencies Act (CCA) had been legislated, and
related resilience efforts were being implemented. On the morning of July 7, 2005, at 8:50 AM,
three different terrorists detonated their hand-made bombs in London Tube trains on their way to
different destinations around London. The explosions in the trains killed 42 people, including the
perpetrators, and injured hundreds of them. Approximately one hour later after the incident,
another terrorist detonated his bomb on a bus, killing 14, including himself, and injuring 110
others (HC, 2006).
The government‘s preparedness can be understood from the timing of the first Cabinet
Office Briefing Rooms (COBR) meeting formed by related Central Governmental agencies and
Metropolitan Police. The COBR meeting started at 9:30 on the same morning, 15 minutes before
the second attack. Even though the attack was not immediately confirmed as a terrorist attack,
COBR remained steady. The Home Secretary and Metropolitan Police Commissioner made their
statements on the incidents by adding that ―everything [wa]s under control and transportation
43
w[ould] be halted for a moment‖ at 11:00 AM. Later, the police investigation uncovered the
identities of the terrorists who took part in the incident by using CCTV records and crime scene
investigation techniques (HC, 2006).
The central governmental approach to such an incident is important because of the need
for public access to accurate, useful information (Rockett, 1994). A completely decentralized,
local reaction to a major terror incident can create the danger of conflict between information
sources, which can lead to greater chaos than the incident itself creates. Thus, COBR‘s early and
accurate statements were useful in handle the public pressure (HC, 2006). The local police‘s and
health officials‘ immediate response to the incident decreased the casualties. More than 350
injured people were sent to the nearest hospitals. The coordination of the Civil Contingencies
Secretariat (CCS) saved lives and helped solve the case (HC, 2006).
3.2.2 Social Network Analysis
In each country, thousands of organizations operated to respond to the selected incidents.
It is not possible to examine and survey all of the organizations participated. Random or
stratified sampling of the organizations could distort the results of the study, since very important
organizations could be left out of the sample if those methods were used. Instead, the study
proposed to find the agencies that played a central part in rescue and recovery operations in
selected cases. Social network analysis can be used to determine the most interacting members of
a network; it was the secondary method of this study. Different software designs have recently
been developed to conduct social network analysis. This study utilized UCINET (Borgatti et al.,
2002) which is widely accepted in the literature.
44
Scott (1988, p. 109) defines social networks as a reflection of a strange and powerful
social reality that is generated by webs, grids, and textiles. These grids (or relationships) can be
revealed with the help of computer software such as UCINET. UCINET (Borgatti et al., 2002)
produces various scores to the relationships among elements in a network after a content analysis
of the network examined. Such scores are generally provided by all social network analysis tools.
Density and centrality scores are the most important outputs of a social network analysis. Degree
centrality was seen as the immediate influence measurer by programmers of UCINET (Borgatti,
2005), which made it the most appropriate scale for this study‘s sampling purposes.
UCINET offers the centrality scores of networks based on the content analysis provided
by researchers. Therefore, unless meticulously picked out, the content analysis and the results of
UCINET can be misleading. The criteria for selecting UCINET content should be clarified. The
objectivity of the selected content material will directly affect the possibility of objective
research results and vice versa. Since the selected cases were generally the most important
manmade disasters in the selected countries, the content was selected from governmental reports,
non-governmental official reports, and news media reports. The UCINET analysis for each case
selected was already conducted by a research team headed by Dr. Naim Kapucu at the University
of Central Florida. The results of the network analysis data were used to identify agencies in
response operations for the case countries.
45
3.2.3 Surveys and Structural Equation Modeling
3.2.3.1 Survey Instruments
The surveys involve personal questions about informal relationships. The questions on
the adaptive capability and perceived effectiveness of organizations also required the privacy and
confidentiality of the respondents. For that reason, surveys did not collect personal information
such as names, email addresses, contact information, and so on. On the other hand, in order to
have a description of the respondents, the administrative position each respondent held
(Supervisor, Assistant Supervisor, Middle Manager, Team Leader, Frontline Manager, and
Frontline Worker) and the type of first-responder organization to which each respondent
belonged (Health, Nonprofit agencies such as the Red Cross, Law Enforcement, Education
Facility, Search and Rescue Team, Fire Department, and Emergency Operation Center) were
asked in surveys.
In order to provide unity in the selected cases, the actual names of organizations were not
asked. Instead, respondents selected the type of agency that was the most relevant to the group
named in the surveys. This provided better results because some large agencies have employees
from different expertise areas. For example, FEMA has more than 6,500 employees, including
administrative bureau personnel, search and rescue teams, medical emergency staff, and training
assistants. Moreover, this agency operated only in the 9/11 WTC Attacks in selected cases.
Therefore, a classification based on agency type is more logical than collecting the actual names
of agencies.
Appendix A-1 presents the survey applied to American CM employees. Appendix A-1
was used as a base for translated versions for other countries. The Turkish version (Appendix A-
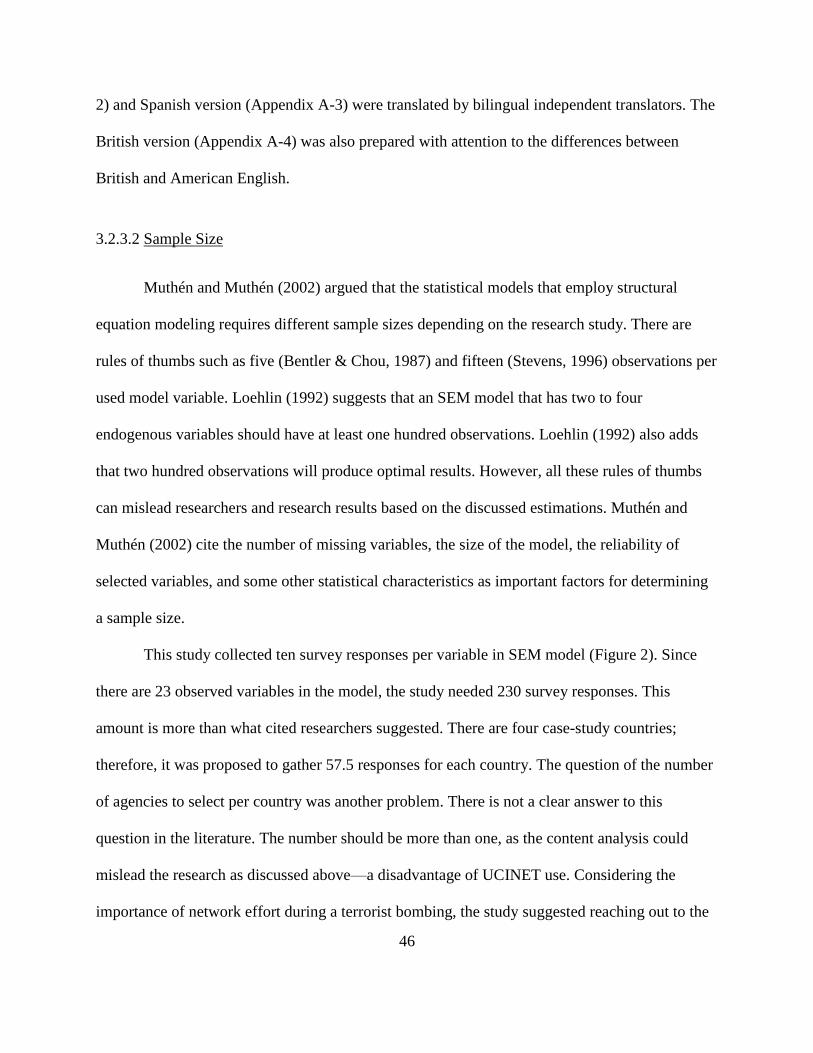
46
2) and Spanish version (Appendix A-3) were translated by bilingual independent translators. The
British version (Appendix A-4) was also prepared with attention to the differences between
British and American English.
3.2.3.2 Sample Size
Muthén and Muthén (2002) argued that the statistical models that employ structural
equation modeling requires different sample sizes depending on the research study. There are
rules of thumbs such as five (Bentler & Chou, 1987) and fifteen (Stevens, 1996) observations per
used model variable. Loehlin (1992) suggests that an SEM model that has two to four
endogenous variables should have at least one hundred observations. Loehlin (1992) also adds
that two hundred observations will produce optimal results. However, all these rules of thumbs
can mislead researchers and research results based on the discussed estimations. Muthén and
Muthén (2002) cite the number of missing variables, the size of the model, the reliability of
selected variables, and some other statistical characteristics as important factors for determining
a sample size.
This study collected ten survey responses per variable in SEM model (Figure 2). Since
there are 23 observed variables in the model, the study needed 230 survey responses. This
amount is more than what cited researchers suggested. There are four case-study countries;
therefore, it was proposed to gather 57.5 responses for each country. The question of the number
of agencies to select per country was another problem. There is not a clear answer to this
question in the literature. The number should be more than one, as the content analysis could
mislead the research as discussed above—a disadvantage of UCINET use. Considering the
importance of network effort during a terrorist bombing, the study suggested reaching out to the
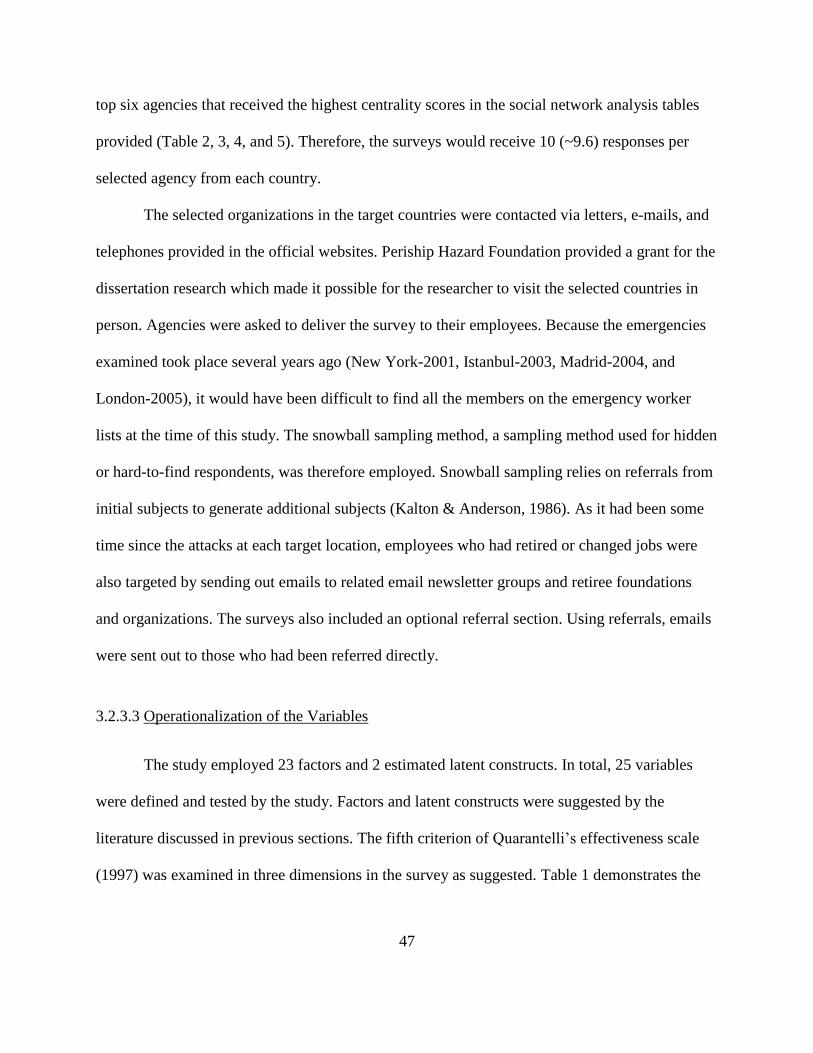
47
top six agencies that received the highest centrality scores in the social network analysis tables
provided (Table 2, 3, 4, and 5). Therefore, the surveys would receive 10 (~9.6) responses per
selected agency from each country.
The selected organizations in the target countries were contacted via letters, e-mails, and
telephones provided in the official websites. Periship Hazard Foundation provided a grant for the
dissertation research which made it possible for the researcher to visit the selected countries in
person. Agencies were asked to deliver the survey to their employees. Because the emergencies
examined took place several years ago (New York-2001, Istanbul-2003, Madrid-2004, and
London-2005), it would have been difficult to find all the members on the emergency worker
lists at the time of this study. The snowball sampling method, a sampling method used for hidden
or hard-to-find respondents, was therefore employed. Snowball sampling relies on referrals from
initial subjects to generate additional subjects (Kalton & Anderson, 1986). As it had been some
time since the attacks at each target location, employees who had retired or changed jobs were
also targeted by sending out emails to related email newsletter groups and retiree foundations
and organizations. The surveys also included an optional referral section. Using referrals, emails
were sent out to those who had been referred directly.
3.2.3.3 Operationalization of the Variables
The study employed 23 factors and 2 estimated latent constructs. In total, 25 variables
were defined and tested by the study. Factors and latent constructs were suggested by the
literature discussed in previous sections. The fifth criterion of Quarantelli‘s effectiveness scale
(1997) was examined in three dimensions in the survey as suggested. Table 1 demonstrates the

48
names and operationalization of 27 variables. Questions 18, 19, and 20 created a combined
variable, which was used as a single factor in the statistical model.
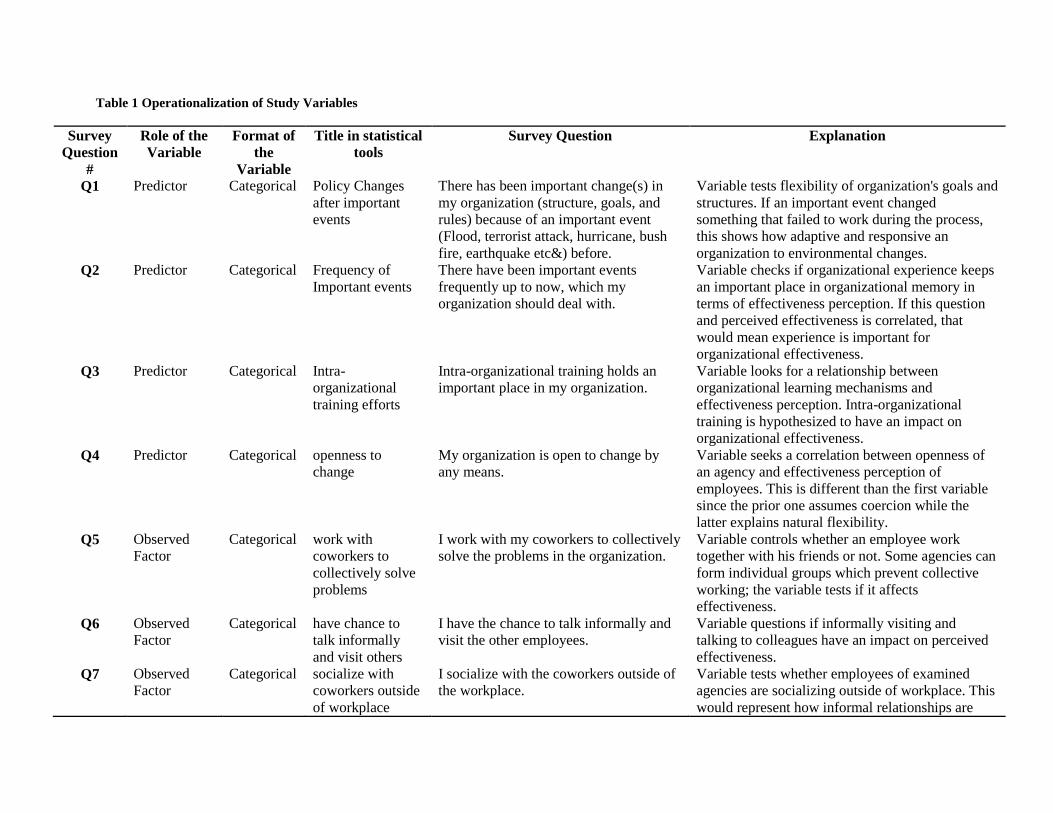
Table 1 Operationalization of Study Variables
Survey
Question
#
Role of the
Variable
Format of
the
Variable
Title in statistical
tools
Survey Question Explanation
Q1 Predictor Categorical Policy Changes
after important
events
There has been important change(s) in
my organization (structure, goals, and
rules) because of an important event
(Flood, terrorist attack, hurricane, bush
fire, earthquake etc&) before.
Variable tests flexibility of organization's goals and
structures. If an important event changed
something that failed to work during the process,
this shows how adaptive and responsive an
organization to environmental changes.
Q2 Predictor Categorical Frequency of
Important events
There have been important events
frequently up to now, which my
organization should deal with.
Variable checks if organizational experience keeps
an important place in organizational memory in
terms of effectiveness perception. If this question
and perceived effectiveness is correlated, that
would mean experience is important for
organizational effectiveness.
Q3 Predictor Categorical Intra-
organizational
training efforts
Intra-organizational training holds an
important place in my organization.
Variable looks for a relationship between
organizational learning mechanisms and
effectiveness perception. Intra-organizational
training is hypothesized to have an impact on
organizational effectiveness.
Q4 Predictor Categorical openness to
change
My organization is open to change by
any means.
Variable seeks a correlation between openness of
an agency and effectiveness perception of
employees. This is different than the first variable
since the prior one assumes coercion while the
latter explains natural flexibility.
Q5 Observed
Factor
Categorical work with
coworkers to
collectively solve
problems
I work with my coworkers to collectively
solve the problems in the organization.
Variable controls whether an employee work
together with his friends or not. Some agencies can
form individual groups which prevent collective
working; the variable tests if it affects
effectiveness.
Q6 Observed
Factor
Categorical have chance to
talk informally
and visit others
I have the chance to talk informally and
visit the other employees.
Variable questions if informally visiting and
talking to colleagues have an impact on perceived
effectiveness.
Q7 Observed
Factor
Categorical socialize with
coworkers outside
of workplace
I socialize with the coworkers outside of
the workplace.
Variable tests whether employees of examined
agencies are socializing outside of workplace. This
would represent how informal relationships are
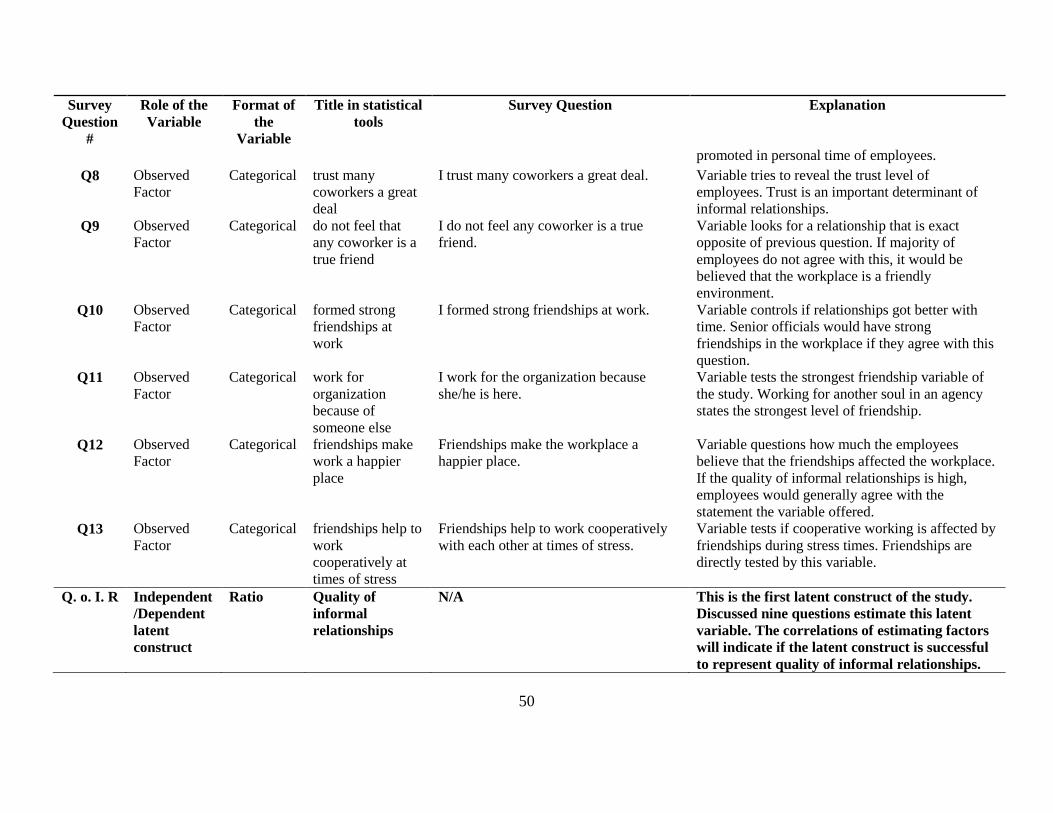
50
Survey
Question
#
Role of the
Variable
Format of
the
Variable
Title in statistical
tools
Survey Question Explanation
promoted in personal time of employees.
Q8 Observed
Factor
Categorical trust many
coworkers a great
deal
I trust many coworkers a great deal. Variable tries to reveal the trust level of
employees. Trust is an important determinant of
informal relationships.
Q9 Observed
Factor
Categorical do not feel that
any coworker is a
true friend
I do not feel any coworker is a true
friend.
Variable looks for a relationship that is exact
opposite of previous question. If majority of
employees do not agree with this, it would be
believed that the workplace is a friendly
environment.
Q10 Observed
Factor
Categorical formed strong
friendships at
work
I formed strong friendships at work. Variable controls if relationships got better with
time. Senior officials would have strong
friendships in the workplace if they agree with this
question.
Q11 Observed
Factor
Categorical work for
organization
because of
someone else
I work for the organization because
she/he is here.
Variable tests the strongest friendship variable of
the study. Working for another soul in an agency
states the strongest level of friendship.
Q12 Observed
Factor
Categorical friendships make
work a happier
place
Friendships make the workplace a
happier place.
Variable questions how much the employees
believe that the friendships affected the workplace.
If the quality of informal relationships is high,
employees would generally agree with the
statement the variable offered.
Q13 Observed
Factor
Categorical friendships help to
work
cooperatively at
times of stress
Friendships help to work cooperatively
with each other at times of stress.
Variable tests if cooperative working is affected by
friendships during stress times. Friendships are
directly tested by this variable.
Q. o. I. R Independent
/Dependent
latent
construct
Ratio Quality of
informal
relationships
N/A This is the first latent construct of the study.
Discussed nine questions estimate this latent
variable. The correlations of estimating factors
will indicate if the latent construct is successful
to represent quality of informal relationships.
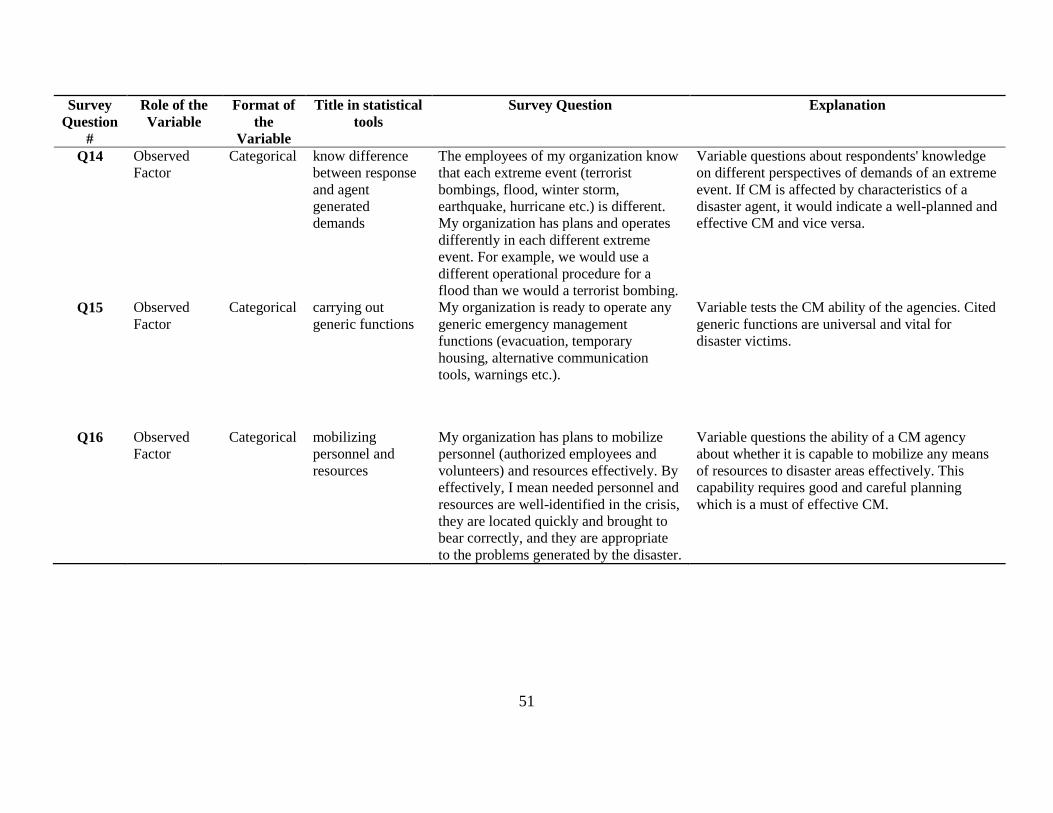
51
Survey
Question
#
Role of the
Variable
Format of
the
Variable
Title in statistical
tools
Survey Question Explanation
Q14 Observed
Factor
Categorical know difference
between response
and agent
generated
demands
The employees of my organization know
that each extreme event (terrorist
bombings, flood, winter storm,
earthquake, hurricane etc.) is different.
My organization has plans and operates
differently in each different extreme
event. For example, we would use a
different operational procedure for a
flood than we would a terrorist bombing.
Variable questions about respondents' knowledge
on different perspectives of demands of an extreme
event. If CM is affected by characteristics of a
disaster agent, it would indicate a well-planned and
effective CM and vice versa.
Q15 Observed
Factor
Categorical carrying out
generic functions
My organization is ready to operate any
generic emergency management
functions (evacuation, temporary
housing, alternative communication
tools, warnings etc.).
Variable tests the CM ability of the agencies. Cited
generic functions are universal and vital for
disaster victims.
Q16 Observed
Factor
Categorical mobilizing
personnel and
resources
My organization has plans to mobilize
personnel (authorized employees and
volunteers) and resources effectively. By
effectively, I mean needed personnel and
resources are well-identified in the crisis,
they are located quickly and brought to
bear correctly, and they are appropriate
to the problems generated by the disaster.
Variable questions the ability of a CM agency
about whether it is capable to mobilize any means
of resources to disaster areas effectively. This
capability requires good and careful planning
which is a must of effective CM.
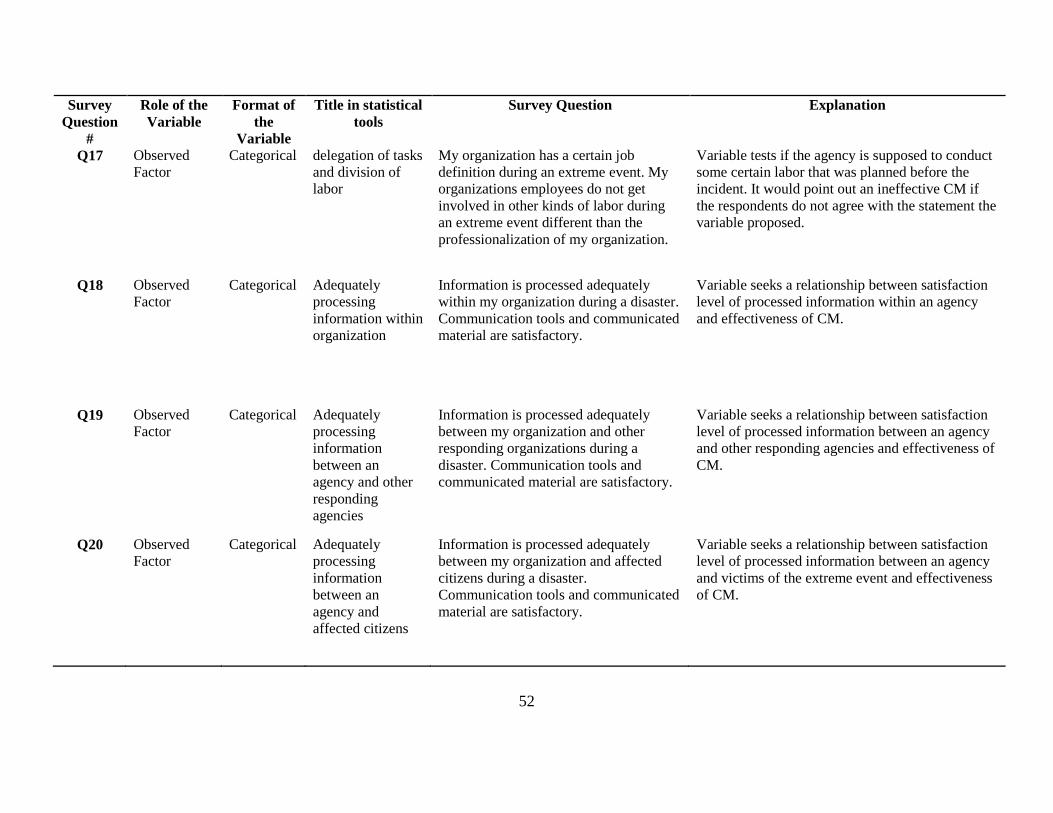
52
Survey
Question
#
Role of the
Variable
Format of
the
Variable
Title in statistical
tools
Survey Question Explanation
Q17 Observed
Factor
Categorical delegation of tasks
and division of
labor
My organization has a certain job
definition during an extreme event. My
organizations employees do not get
involved in other kinds of labor during
an extreme event different than the
professionalization of my organization.
Variable tests if the agency is supposed to conduct
some certain labor that was planned before the
incident. It would point out an ineffective CM if
the respondents do not agree with the statement the
variable proposed.
Q18 Observed
Factor
Categorical Adequately
processing
information within
organization
Information is processed adequately
within my organization during a disaster.
Communication tools and communicated
material are satisfactory.
Variable seeks a relationship between satisfaction
level of processed information within an agency
and effectiveness of CM.
Q19 Observed
Factor
Categorical Adequately
processing
information
between an
agency and other
responding
agencies
Information is processed adequately
between my organization and other
responding organizations during a
disaster. Communication tools and
communicated material are satisfactory.
Variable seeks a relationship between satisfaction
level of processed information between an agency
and other responding agencies and effectiveness of
CM.
Q20 Observed
Factor
Categorical Adequately
processing
information
between an
agency and
affected citizens
Information is processed adequately
between my organization and affected
citizens during a disaster.
Communication tools and communicated
material are satisfactory.
Variable seeks a relationship between satisfaction
level of processed information between an agency
and victims of the extreme event and effectiveness
of CM.
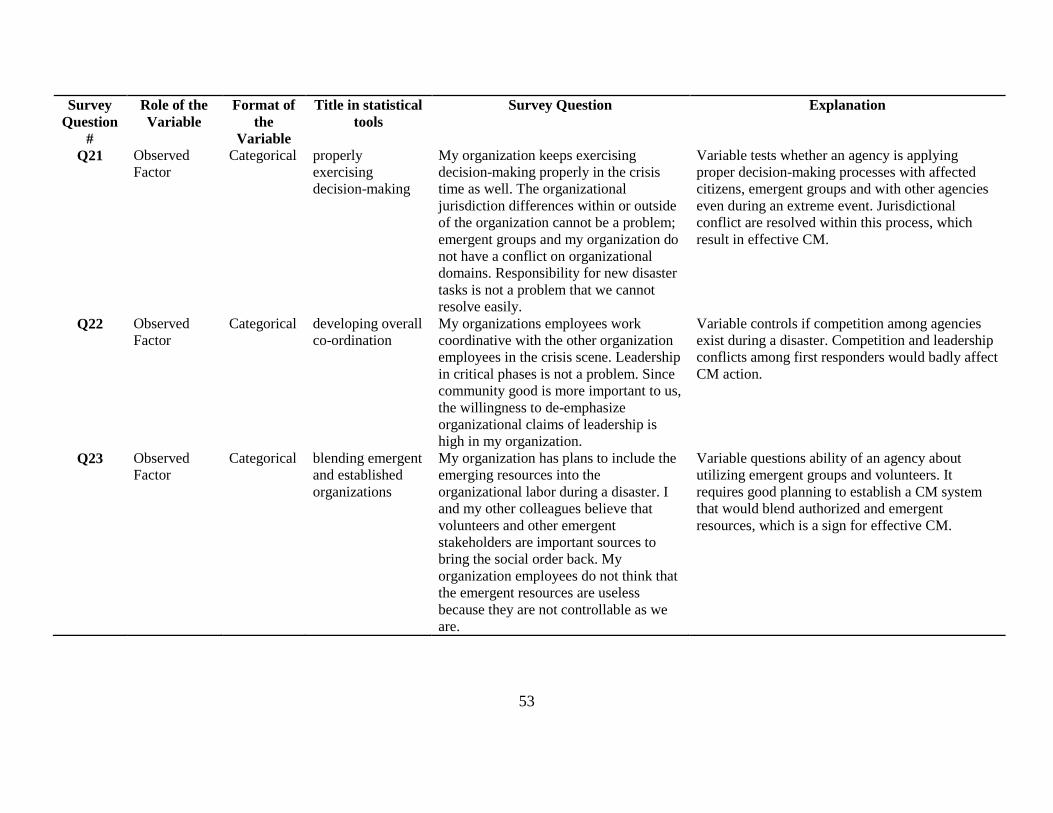
53
Survey
Question
#
Role of the
Variable
Format of
the
Variable
Title in statistical
tools
Survey Question Explanation
Q21 Observed
Factor
Categorical properly
exercising
decision-making
My organization keeps exercising
decision-making properly in the crisis
time as well. The organizational
jurisdiction differences within or outside
of the organization cannot be a problem;
emergent groups and my organization do
not have a conflict on organizational
domains. Responsibility for new disaster
tasks is not a problem that we cannot
resolve easily.
Variable tests whether an agency is applying
proper decision-making processes with affected
citizens, emergent groups and with other agencies
even during an extreme event. Jurisdictional
conflict are resolved within this process, which
result in effective CM.
Q22 Observed
Factor
Categorical developing overall
co-ordination
My organizations employees work
coordinative with the other organization
employees in the crisis scene. Leadership
in critical phases is not a problem. Since
community good is more important to us,
the willingness to de-emphasize
organizational claims of leadership is
high in my organization.
Variable controls if competition among agencies
exist during a disaster. Competition and leadership
conflicts among first responders would badly affect
CM action.
Q23 Observed
Factor
Categorical blending emergent
and established
organizations
My organization has plans to include the
emerging resources into the
organizational labor during a disaster. I
and my other colleagues believe that
volunteers and other emergent
stakeholders are important sources to
bring the social order back. My
organization employees do not think that
the emergent resources are useless
because they are not controllable as we
are.
Variable questions ability of an agency about
utilizing emergent groups and volunteers. It
requires good planning to establish a CM system
that would blend authorized and emergent
resources, which is a sign for effective CM.
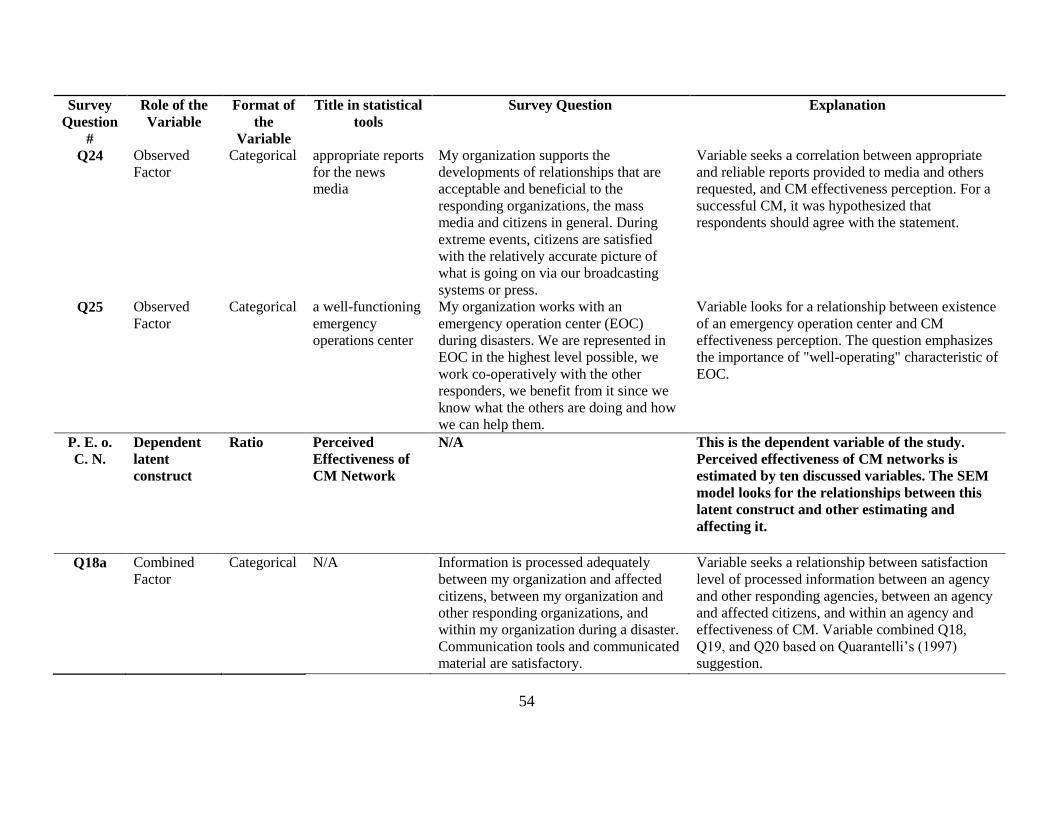
54
Survey
Question
#
Role of the
Variable
Format of
the
Variable
Title in statistical
tools
Survey Question Explanation
Q24 Observed
Factor
Categorical appropriate reports
for the news
media
My organization supports the
developments of relationships that are
acceptable and beneficial to the
responding organizations, the mass
media and citizens in general. During
extreme events, citizens are satisfied
with the relatively accurate picture of
what is going on via our broadcasting
systems or press.
Variable seeks a correlation between appropriate
and reliable reports provided to media and others
requested, and CM effectiveness perception. For a
successful CM, it was hypothesized that
respondents should agree with the statement.
Q25 Observed
Factor
Categorical a well-functioning
emergency
operations center
My organization works with an
emergency operation center (EOC)
during disasters. We are represented in
EOC in the highest level possible, we
work co-operatively with the other
responders, we benefit from it since we
know what the others are doing and how
we can help them.
Variable looks for a relationship between existence
of an emergency operation center and CM
effectiveness perception. The question emphasizes
the importance of "well-operating" characteristic of
EOC.
P. E. o.
C. N.
Dependent
latent
construct
Ratio Perceived
Effectiveness of
CM Network
N/A This is the dependent variable of the study.
Perceived effectiveness of CM networks is
estimated by ten discussed variables. The SEM
model looks for the relationships between this
latent construct and other estimating and
affecting it.
Q18a Combined
Factor
Categorical N/A Information is processed adequately
between my organization and affected
citizens, between my organization and
other responding organizations, and
within my organization during a disaster.
Communication tools and communicated
material are satisfactory.
Variable seeks a relationship between satisfaction
level of processed information between an agency
and other responding agencies, between an agency
and affected citizens, and within an agency and
effectiveness of CM. Variable combined Q18,
Q19, and Q20 based on Quarantelli‘s (1997)
suggestion.
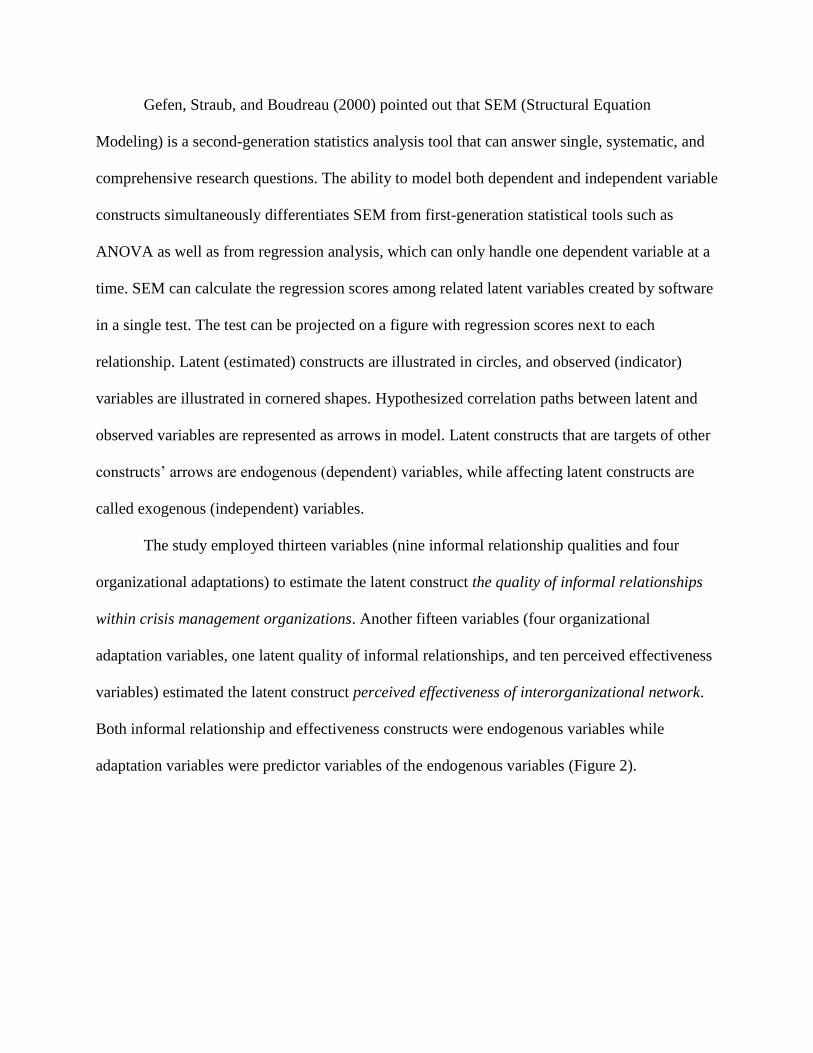
Gefen, Straub, and Boudreau (2000) pointed out that SEM (Structural Equation
Modeling) is a second-generation statistics analysis tool that can answer single, systematic, and
comprehensive research questions. The ability to model both dependent and independent variable
constructs simultaneously differentiates SEM from first-generation statistical tools such as
ANOVA as well as from regression analysis, which can only handle one dependent variable at a
time. SEM can calculate the regression scores among related latent variables created by software
in a single test. The test can be projected on a figure with regression scores next to each
relationship. Latent (estimated) constructs are illustrated in circles, and observed (indicator)
variables are illustrated in cornered shapes. Hypothesized correlation paths between latent and
observed variables are represented as arrows in model. Latent constructs that are targets of other
constructs‘ arrows are endogenous (dependent) variables, while affecting latent constructs are
called exogenous (independent) variables.
The study employed thirteen variables (nine informal relationship qualities and four
organizational adaptations) to estimate the latent construct the quality of informal relationships
within crisis management organizations. Another fifteen variables (four organizational
adaptation variables, one latent quality of informal relationships, and ten perceived effectiveness
variables) estimated the latent construct perceived effectiveness of interorganizational network.
Both informal relationship and effectiveness constructs were endogenous variables while
adaptation variables were predictor variables of the endogenous variables (Figure 2).
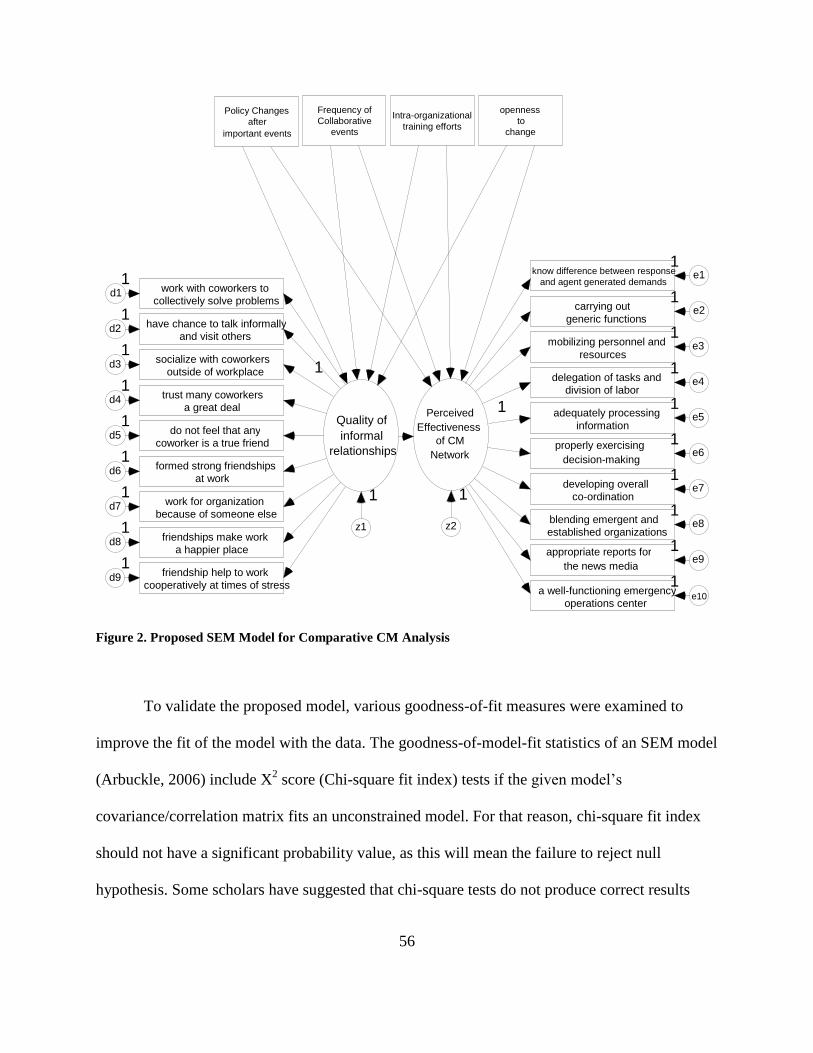
56
Figure 2. Proposed SEM Model for Comparative CM Analysis
To validate the proposed model, various goodness-of-fit measures were examined to
improve the fit of the model with the data. The goodness-of-model-fit statistics of an SEM model
(Arbuckle, 2006) include X2 score (Chi-square fit index) tests if the given model‘s
covariance/correlation matrix fits an unconstrained model. For that reason, chi-square fit index
should not have a significant probability value, as this will mean the failure to reject null
hypothesis. Some scholars have suggested that chi-square tests do not produce correct results
Quality of informal
relationships
friendship help to work cooperatively at times of stress
d9 1
friendships make work a happier place
d8 1
work for organization because of someone else
d7 1
formed strong friendships at work
d6 1
do not feel that any coworker is a true friend
d5 1
trust many coworkers a great deal
d4 1
socialize with coworkers outside of workplace
d3 1 1
have chance to talk informally and visit others
d2 1
work with coworkers to collectively solve problems
d1 1
Perceived Effectiveness
of CM Network
know difference between response and agent generated demands e1
carrying out generic functions
e2
mobilizing personnel and resources
e3
delegation of tasks and division of labor
e4
adequately processing information
e5
properly exercising decision-making e6
developing overall co-ordination
e7
blending emergent and established organizations
e8
appropriate reports for the news media e9
1
1
1
1
1 1
1
1
1
1
a well-functioning emergency operations center
e10 1
Policy Changes after
important events
Frequency of Collaborative
events Intra-organizational
training efforts openness
to change
z1
1
z2
1
57
because sample size directly affects its results. The greater the sample size, the easier it is to
wrongfully reject the null hypothesis (Schumaker & Lomax, 2004). For that reason, other
statistical tests were used to evaluate the goodness-of-fit measures in addition to the chi square
test.
Another test for Chi-square fit index is the likelihood ratio (LR), which is obtained by
following formula;
LR = x²/df
LR is expected to be less than 4.0 for a good model fit. The LR is also called normalized
Chi-square index in the literature. It is better when the LR is closer to one. Bentler‘s comparative
fit index (CFI) is another important test; it compares the given model against the independence
model as a baseline model. The CFI can be between 0 and 1, though it is preferable for a model
to get CFI value closer to one. The next test used in the study is the root mean square error of
approximation (RMSEA). As can be understood from its name, RMSEA adds approximation
errors to a given sample population and then tests whether the optimal sample size will fit when
unknown parameter values are chosen.
Rules of thumb suggest that the RMSEA should be less than .05. However, it is also
suggested that the fit is acceptable if the RMSEA score is less than .08. The GFI and AGFI
(Adjusted Goodness-of-Fit Index) assess the squared residuals from prediction compared to the
sample data. The GFI and AGFI statistics range from 0 to 1; greater than .9 is considered a good
fit. There are also three important values for examining the individual effects of variables on
latent constructs. The first of them is the critical ratio (CR). The CR is obtained by dividing an
observed estimate to its own standard error. A significant CR value should be more than 1.96 if
the effect is positive and vice versa. The other two individual assessment values are
58
unstandardized and standardized regression coefficients. Similarly to all other statistical tests,
regression coefficients indicate the explained percentage of the variance in a tested variable
(Byrne, 2001).
To sum up the quantitative part of the study, the methodology portion contained three
phases. The first method is the case-study analysis (Yin, 2003) method that helped to define four
terrorist attacks from all over the world. Selecting cases, the research utilized social network
analysis tables to discern the top-interacting organizations that took part in response and
recovery operations after those incidents. Besides officially contacting the agencies, the
researcher utilized snowball sampling for individual sampling from those organizations because
it was unlikely to find the list of employees that were on duty that day. Lastly, the sample was
surveyed and the results were interpreted in an SEM model (Byrne, 2001).
The qualitative portion of the research examined the relationships among public
administration systems, organizational attributes, and social-economical conditions of the
countries and their emergency management systems. CM literature, official reports, and
interviews with officials who actually took part in selected incidents were used in this qualitative
portion to offer descriptive ideas, not to make figure-based comments.
3.3 Increasing Reliability and Item Response Theory
The surveys the study utilized directly affected the correlation results of this study. Any
misinterpretation and/or miscalculation would lead to a failure in testing the hypotheses.
Therefore, the survey questions should be designed carefully. Since informal relationship
questions could generate biased answers, the researcher should consider giving enough response
59
space for the interviewee. Item Response Theory (IRT) argues that fewer or more answers than
needed will fail the test (Baker, 2001).
Instead, the researcher should add or subtract unrelated suggestive multiple choices from
the test. For example, assume that an interview conducted within selected organizations will
include a question asking how often somebody sees colleagues within the same organization
during a given time period. This question is different from a question that asks whether the
employee has the cell phone number of any other employee from the same organization. The
second question will be answered by a ―Yes‖ or ―No.‖ The first question, however, will be
answered by a number. Therefore, personal judgments can affect the response of the interviewee.
In order to prevent this situation, the survey should include more than three answers. For
example, answer choices of ―1,‖ ―2,‖ and ―3 and more‖ will not be sufficient to understand the
relationship level of the interviewee.
The multiple choices for this specific interview question can even be different in different
countries. For example, shaped as it is by the religion of Islam, Turkish culture is less
individualistic than the other countries surveyed through this study. For that reason, Turkish
crisis management employees could be more communicative with each other than other
countries‘ employees. The multiple choice answers for the question discussed above should
therefore be structured differently in Turkey. IRT suggests that the numbers used to answer that
question should be greater in Turkey than the other countries because of the social characteristics
of Turkey. If IRT were not utilized, the study would make erroneous conclusions.
60
3.3.1 Human Subjects
Some of the surveys were conducted using the snowball sampling method, while some
other respondents were reached directly. Informed consents from the survey participants were
obtained before they filled out the surveys. In the consent forms, it was documented that the rules
for the protection of human subjects would be strictly adhered to and results would be provided
to the participants after the completion of the study. No personal identifiers were retained in the
research file, so the confidentiality of the respondents was ensured.
61
4 RESULTS AND DISCUSSIONS
4.1 Qualitative Analyses
Disasters were not realized as disasters by human beings for a long time in history. This
public belief changed with modern science and its effect on public administration systems.
Quarantelli (2000) classifies current societies in the world in three categories:
1. Societies that think the disasters are inevitable. These societies generally link extreme
events to supernatural powers. The mitigation and preparedness phases of CM are
largely ignored in those public administration systems.
2. Societies that accept disasters as natural occasions that can be mitigated but cannot be
prevented in any way.
3. Societies that argue that disasters can often be prevented. Mitigation and preparedness
are the most important components of these CM systems.
The historic development of public systems follows this path sequentially through time.
Quarantelli (2000) summarizes these three perspectives and their historical development as ―Act
of God‖ through ―Act of Nature‖ to ―Act of Human Beings‖ (2000, 4). Necessary precautions
against disasters are not taken adequately until the last phase, which has generally worsened the
situation in future disasters (Birkland & Waterman, 2008). Until World War Two, no society on
earth had established an agency specifically dealing with disasters. Police, fire brigades, and
others operated only to do their jobs and acted non-collectively. Quarantelli (2000) argued that
ancient structures built to stop flood-type disasters were generally not successful and did not last
long enough to establish CM systems. The air raids that caused many civilian deaths during
62
World War Two were the main reason for the development of civil defense (civil protection)
strategies. Public alarms or sirens were primitive tools in air attack warnings. Shelters, search
and rescue teams, and air raid wardens were connected to public agencies, which started the first
CM policies (Quarantelli, 2000). Presently, mitigation and preparedness phases are increasingly
receiving government attention.
The public administration systems of selected countries are quite different from one
another (Table 18/Appendix C). Although they can be grouped as European (Spain, U.K.),
American (U.S.), and Middle Eastern (Turkey), this type of distinction is not enough to explain
all of the differences. Roughly speaking, federal government involvement in Turkey is the
strongest of the countries others in terms of local administrative involvement. The U.S. federal
government can be assumed as the weakest at handling crises, since the U.S. local
administrations have more power and authority than those of the European countries selected.
Turkey and the U.S. do not have a royal family, while Spain and the U.K. have had royal
institutions for hundreds of years. Explaining the differences in CM efforts and policies during
selected incidents, as well as the public administration and CM systems of the case countries,
will be presented in detail in this section.
Different reports and interviews related to the incidents in selected countries may
demonstrate how local and federal public, private, and nonprofit agencies acted in the incidents.
Looking at those reports, one can discuss the procedures that CM network followed in crisis
time. Official CM response frameworks were examined to see whether there is a difference
between theoretical and practical crisis procedures. The differences caused by the presence of a
chaotic environment will mark how well a country‘s CM policies worked.
63
4.1.1 U.S.A.
Cold War tactics framed the first CM policies in the U.S. The Cold War-type disaster
understanding is a centralistic-militaristic command-control perspective (Dynes, 1989). There
are two versions of disaster management in command-control: pre-disaster normal term and
disaster term. Chaos during disasters affects any kind of social order badly, so it must be
reordered no matter the cost. During chaos, only central structures can be reliable, because they
are authorized over all other structures and possess the most extensive power and technology.
Ordinary management structures are not reliable because so many of them are trying to survive
without sufficient information and sources. In the pre-disaster term, local authorities can be
coordinated and supervised because it is easier to do so without a chaotic environment. However,
during disasters there is no other possibility for reestablishing social order than command and
control.
4.1.1.1 History
Dynes (1989) argues that the basic assumption of the command-control model, which
supposes that an emergency declaration will reestablish social order, is wrong. He asserts that it
requires a great deal of interorganizational effort even to estimate the actual scope of a disaster.
Collaborative efforts are prevented by command-control systems because the central agency
holding authority can deter others from gaining useful information. Since command-control
management assumes that the disasters are obvious, it generally fails to detect them even after
they began. Late detection of a disaster increases harm caused to affected entities.
Another argument defended in command-control policies is that civilian forces cannot be
adequate to respond to disasters. For that reason, responders should be military personnel or
64
paramilitary personnel such as law enforcement officials. Volunteers or victims of disasters
cannot be of any help since they are outside the command chain. Dynes (1989) suggests that
civilian forces are ignored in command-control systems since they are thought to be self-
centered, weak, panicked, and antisocial. The disorganization of non-military personnel is
another argument in defense of command-control. Loosely coupled connections cannot be
allowed, the better to stop chaos. Delivering resources to persons needed is the job of military, or
at least paramilitary, personnel. Disorganized behaviors are targeted during the pre-disaster era
with tough legislations.
The discussion of command-control systems has taken almost the same route in all of the
countries selected by the study. However, the U.S. example is so clear and so thoroughly
discussed that it is mentioned under the U.S. part of this study. The primitive U.S. crisis handling
system had a militaristic background because the aim of civil protection was to defend the
community against nuclear attacks (Dynes, 1989). The Federal Civil Defense Act of 1950
legislated against enemy attacks and held the Secretary of Defense responsible for crisis
management. The Secretary of Defense then assigned CM duties to the Defense Civil
Preparedness Agency. Because of the Cold War‗s influence on the U.S. CM perspective, the
majority of employees in the agency were ex-military personnel. Over time, international tension
reduced, but the military understanding of national defense did not change for a long time despite
local administrations‘ participation in CM efforts.
A series of natural disasters in the 1960s and 1970s (Hurricane Carla-1962, Alaskan
Earthquake-1964, Hurricane Betsy-1965, Hurricane Camille-1969, San Fernando Earthquake-
1971, and Hurricane Agnes-1972) triggered new legislations specifically addressing natural
disasters. The Disaster Relief Act of 1974 tried to shift the enemy attack perspective of CM to
65
that of disaster assistance by authorizing and holding responsible local and state authorities for
disaster assistance (Birkland & Waterman, 2008). FEMA‘s foundation during the Carter
Administration in 1979 was a response to criticisms reminding the central government of its
responsibility in disaster response. Many different disaster relief agencies were combined into
FEMA, which also involved local and state authorities. These partnerships in time evolved CM
into a loosely coupled system. Local, state and federal partnerships shifted from the command-
control approach to that of coordination-supervision. The debate between the two methods is
ongoing, though scholars by and large support coordination-supervision (Dynes, 1989).
Birkland and Waterman (2008) argued that the Reagan and Bush administrations (1981-
1993) ignored the importance of FEMA, which turned agency into a ―turkey farm‖ (2008, p.
696). Although the National Earthquake Hazards Reduction Act clearly put FEMA in a leading
role in CM, the agency could not do much without presidential support. The Stafford Act of 1988
and the amendments to the Act in 1993 and 2000 did not change the notion of command-control
system. The bills introduced a shared-governance idea; however, local and state governments
remained limited to the role of first responders in any kind of extreme event, with their role in
mitigation efforts ignored. The federal government still assumed primary responsibility, although
the Stanford Act and its amendments tried to change this dynamic.
FEMA‘s unsuccessful disaster assistance efforts were sharply criticized in the early
1990s. Birkland and Waterman (2008, p. 697) quote a U.S. Senator who called FEMA officials
―the sorriest bunch of bureaucratic jackasses‖ in the aftermath of Hurricane Andrew in 1992. The
Federal Response Plan of 1992 included many civilian organizations, such as the American Red
Cross, as first responders in addition to the traditional first responders—police and fire
departments. The Clinton Administration applied the lessons learned after Hurricane Andrew and
66
widened the definition of the term ―disaster‖ to make more disaster relief studies eligible for
federal funding. In 1994 and 1997, hazard mitigation was specifically targeted by Mitigation
Directorate, which started Project Impact.
FEMA turned its attention to natural hazards, but manmade disasters such as terrorist
attacks were not forgotten. The Office of Domestic Preparedness was established in 1998 under
the Department of Justice; it focused on weapons of mass destruction and terrorism. Right after
9/11, the natural-hazard perspective of CM policies was changed once again with the passing of
the Patriot Act in 2001, and funding for Project Impact was cancelled. The Department of
Homeland Security (DHS) was established as a Cabinet office in 2002, and FEMA was
transferred into this newly established federal office. In other words, 9/11 caused the federal
government to change the natural-disaster-and-hazard-mitigation perspective of CM back to civil
defense and command-control once again. Unfortunately, the transfer of FEMA into DHS did
not make some senior FEMA officials happy; eventually many of them left the agency. The
FEMA director‘s direct connection with the President was discontinued in new system, which
left disaster management under the authority of the inexperienced DHS.
Despite U.S. CM developments away from the natural hazard perspective, the four
different hurricane disasters that hit Florida in 2004 were successfully managed by FEMA and
Florida emergency management organizations. Birkland and Waterman (2008) suggest that this
success was misleading because all four of hurricanes were respectively small and the state of
Florida itself was prepared for hurricanes more than any other state in the country. Hurricane
Katrina revealed the fact that FEMA and the federal government were actually ineffective in
coordinating and supervising disasters. Their failure to evacuate victims, underestimation of the
importance of mitigation efforts, and shortcomings in handling the chaotic environment in the
67
recovery phase resulted in heavy criticism of federal and local CM policies in the U.S. FEMA
was criticized for being slow, DHS was criticized for constraining FEMA‘s ability, and the
National Response Plan (NRP) adapted from the Federal Response Plan (FRP) was blamed for
being extremely centralist. The NRP was prepared without FEMA‘s participation, and it was
written in vague language that failed to clearly address the agencies authorized in disaster
management. The focus of the NRP was terrorism or terrorism-related disasters, reminiscent of
the 1950s‘ Cold War strategies.
NRP was revised into the National Response Framework (NRF) after Hurricane Katrina,
but the basic command-control routines remained. Cold War tactics and the terrorism focus are
still dominant, although Katrina cost more in human lives and public damage than 9/11 did.
FEMA is still underrepresented in the NRF. The NRF was also not discussed with local or state
officials or any other professional emergency management organizations before going into
effect. Homeland security still has priority over disaster preparedness in U.S. CM. The Obama
Administration‘s first year did not bring any significant change in disaster management policies,
except that the experienced director of the Florida Emergency Management Office was
appointed to head FEMA. It is expected that FEMA will be taken out of DHS to give priority to
natural hazards and shift the command-control back to that of coordination-supervision;
however, the economic crisis seems to have postponed those changes for now.
Birkland and Waterman (2008) argue that shifting CM attention from natural hazards to
homeland security or vice versa is pure politics. Such moves actually stem from the clash
between different understandings of federalism. Giving authority to state and local governments
is a bad idea according to those who think the federal government should be superior, strong, and
powerful all the time, in times of both peace and war. Although it remains relatively small in
68
size, the U.S. federal government takes critical aspects of its jurisdiction as givens, such as
intelligence gathering and use, the gathering and use of any kind of other information source,
unquestionable authority on any property and right inland, and the cooperation of local and state
governments in these understandings. In terms of CM, local and state administrations are only
first responders; they initiate response and recovery but then ask for federal help. Mitigation
efforts are generally ignored or underrated.
Others think the federal government should not be small, but instead cooperative,
coordinative, and more a partner than a director. Natural hazards and disaster mitigation, in this
perspective, should have federal importance equal to terrorism threats. Therefore, national plans
should clearly define the roles of local, state, and federal agencies. In order to provide the highest
efficiency, local emergency management agencies‘ participation is important to the planning
process. Federal disaster assistance organizations have the highest possible representation in
White House. Terrorist threats are also important and evaluated by other professional federal
organizations. The basic philosophy of disaster management should, in this view, be
coordination-supervision rather than command-control.
4.1.1.2 Discussion
The Federal Response Plan (FRP), which mobilizes Emergency Support Functions (ESF)
during a disaster, was in effect during 9/11. Each first-responder organization has one or more
roles in these ESFs. An agency is held primarily responsible for each ESF. Once a disaster is
called in, the primary agency coordinates others and operates the action that has already been
defined in the FRP. FEMA was supposed to be the main coordinator of all CM; therefore it was
supposed to be the most central agency in 9/11 CM network.
69
The NY Emergency Management Office (NYEMO) was the main local coordination
agency during the attacks. Its efficiency was questioned since NYEMO‘s establishment was in
the World Trade Center 7 building, which also collapsed that day (J. Feal, personal
communication, June 5, 2009). The local CM network was based on NYEMO, FDNY, and
NYPD communication and coordination; however, NYEMO stayed off CM because of the
attack, which badly affected local CM efforts (Asaeda, 2005). FBI and the U.S. Army did the job
that was supposed to have been done by local organizations. Asaeda (2005) also mentions
communication failure between the FDNY and the NYPD, as well as the demoralization of
personnel because of the death of colleagues, as having a negative impact on local CM efforts.
American Red Cross (ARC) established nine public shelters in Manhattan within 24
hours of the attacks. The agency also started blood and money donation campaigns for victims
immediately. The FRP suggested that other local and federal agencies should be in control in a
terrorist attack; however, the ARC holds an important place in recovery studies. The Department
of Design and Construction for the City of New York (DDC) and The Port Authority of New
York and New Jersey (PAPD) were other effective local agencies helped the life coming back to
normal (M. Horn, personal communication, March 23, 2009). The FDNY lost 343 of their
members in collapsed buildings (Asaeda, 2005), which shows that the agency was in a key
position in the CM network. Fallen officials were accepted as a failure in the WTC response, but
Asaeda (2005) argues that the attacks were completely unexpected. It was also mistakenly
believed that the WTC buildings would not collapse because they had not in the 1993 bombings;
as well, the local CM center was demolished and an alternative location had not been defined
beforehand; finally, the first responders‘ communication devices did not work effectively.
70
Against all odds, local Emergency Medical Services (EMS) belonging to local and non-
profit agencies established the first triage units within ten minutes, right across the street from
the North Tower. After the collapse of the buildings the triage units were drawn back from the
incident site, but patients continued to be treated. One hundred four New York regional hospitals
treated 6,538 patients, of which 477 were admitted. Of those who were admitted, only 16
patients died in hospitals within a week (Asaeda, 2005). NY City has a population of 8,000,000,
and Manhattan alone houses over 1,500,000 people. The WTC incident site is located in one of
the busiest places in Manhattan—especially at morning rush hour, the time of the attacks. In
terms of the scope and unexpectedness of such an attack, the response can be said to have been
quite successful.
Nonetheless, FRP and actual CM evaluation indicated that some agencies did not perform
as well as they were supposed to, while others operated well above expectations. J. Feal
(personal communication, June 5, 2009) evaluated federal government involvement inWTC
attacks as weak at best. In the response and recovery phases, local operational agencies should
have done more, as pointed out in the FRP (Now the NRF). Unfortunately, new developments in
CM in the U.S. in 2002 did not apply the lessons learned from 9/11, and in fact worsened the
situation by disregarding the roles of local and state authorities (Wise & Nader, 2002). This
oversight caused the failure of CM in Hurricane Katrina (Birkland & Waterman, 2008).
4.1.2 Turkey
The Ottoman Empire was defeated in World War One, and almost all Anatolia was
occupied by different countries‘ armies. A war of independence began in 1919 and succeeded in
1922. Turkey abolished the monarchy in 1920 and changed her name from Ottoman Empire to
71
Turkish Republic. Since then, elections have been held every four years to elect the government,
but the central government has remained strong in the public administration system. The highest-
level local public administrators in cities are appointed by the central government, and there is no
local police force in Turkey. The heads of municipalities, mayors, are still elected, and
municipalities are supposed to provide basic services such as water, electricity, and sewage.
Local administrations‘ authority has increased steadily in the last decade and seems likely to
increase in the near future.
4.1.2.1 History
Ninety-eight percent of the Turkish population lives in areas with a significant risk of
earthquakes. Sixty-one percent of all the disasters that have happened in Turkey between 1931
and the present have been earthquakes, and another 30% have been landslides and floods.
Turkey tops the life-loss list of disasters of the last 60 years, along with China, Russia, Peru, and
Iran. The latest major earthquakes to hit Turkey took place in Marmara on August 17 and
November 12, 1999, leaving a total of 18,243 dead and 48,901 injured (Akdag, 2002). Terrorism
is another threat to Turkish society; it has claimed 30,000 to 35,000 people in last 30 years
(Rodoplu et al., 2005). The total death toll is not comparable to any other developed country on
the planet. Turkish disaster management changed its course after the Marmara Earthquakes in
1999.
Akdag (2002) sorts the disaster management history of Turkey into four periods. The pre-
1944 period includes CM policies in the Ottoman Empire and early years of the Turkish
Republic. In this period, the disaster-oriented policies were aimed solely at response and
recovery. Although the majority of population lived in earthquake-prone areas, local and central
72
governments failed to address needs for stronger buildings. Victims rebuilt their houses without
the necessary supervision. Akdag (2002) cites a law from 1509 outlawing non-wooden structures
in Istanbul; clearly, these types of regulations were neither updated nor enforced. The greatest
earthquake to hit Turkey was in 1939 in an eastern city, Erzincan; it claimed 32,962 lives. The
quake was so strong that 116,720 buildings collapsed during the disaster and the city was
relocated.
Besides Erzincan, other strong earthquakes took place in Niksar, Adapazari, Tosya, and
Bolu within five years of each other (between 1939 and 1944), resulting in over 43,000 deaths
and 200,000 collapsed buildings. A mitigation law dated 1944 started the new period in CM in
Turkey. Partnerships with universities were established, new regulations were created, and an
earthquake risk map of Turkey was created in the following year. The 1944 legislation did not
change the need for specific legislations for other specific disasters. However, it offered a strong
basis for mitigation and preparedness efforts, especially against earthquakes. Building new
structures was allowed only with control and permits after the 1944 legislation passed.
These regulations were applied mostly by central agencies. However, confusion reigned
among executive agencies because there was no primary agency to administer those efforts. In
1958, The Ministry of Reconstruction and Settlement was established in the Cabinet to pursue
mitigation efforts in Turkey. Later, in 1983, the ministry was merged with The Ministry of
Public Works and turned into The Ministry of Public Works and Settlement. The third period of
CM in Turkey (1958-1999) begins with establishment of this cabinet office. Additional
regulations cancelled the maintenance of individual funds for each disaster; instead, a single
fund, the Disasters Fund, was created for all past and future disasters managed by the above
73
ministry. Furthermore, all natural hazards were defined as disasters, including forest fires, floods,
avalanches, earthquakes, landslides, storms, and the like.
A series of earthquakes and other natural disasters continued to hit different Turkish
regions and claim more lives in the third period. Specific legislations and disaster declarations
for the affected regions were passed by Parliament. Earthquake funds were separated from other
disaster funds. Minor changes in CM policies were made with amendments, but the 1958
legislation remained largely the same until the 1999 Marmara Earthquakes, which started the
most recent period of the Turkish CM system. These earthquakes differed from others because
they affected a large area of land containing the majority of nation‘s population. The affected
area was the most industrialized region of the country, and present-day policies failed because of
the scope of disaster. The Cabinet immediately declared a state of emergency in the affected
region, and a new CM legislation came into effect in ten days privatizing the supervision of
building privately owned structures. All newly built structures were mandated to have valid
insurance.
The Ministry of Public Works and Settlement has been the major player in natural
disasters management from the 1999 earthquakes up to now. The General Directorate of Disaster
Affairs (GDDA), under the Ministry, coordinates CM in Turkey. In extreme events, CM is
supervised by a committee called the Prime Minister Crisis Management Center (PMCMC),
headed by the Prime Minister. The Secretariat in the PMCMC is the GDDA, providing
coordination among central and local committees and subcommittees. Member agencies of
different committees or subcommittees do not change; the only change is in the ranks of the
participating personnel. This type of CM administration is common in Europe (Sahin et al.,
2008).
74
Red Crescent is an important agency in CM; almost any kind of primitive sheltering and
food is provided by this organization. It is a nonprofit agency just like the Red Cross, which also
heavily depends on donations. Red Crescent‘s duties are not limited to disaster relief; they also
include delivering incoming aid material to those who need it, providing immediate medical
assistance to victims, coordinating aid efforts with international disaster relief organizations such
as the Red Cross, and campaigning for blood donations. Local and national Red Crescent
officials take part in official CM committees.
As a result of the 1999 earthquakes, a central CM office under the Prime Minister was
established. The General Directorate of Turkey Emergency Management (GDTEM) is a FEMA-
like agency that is responsible for coordinating CM when natural and manmade disasters
threaten the nation. The GDTEM is assigned to establish CM units in local and central public
agencies, to supervise and provide essential communication among them, to prepare disaster
plans for national threats, and to administer further arrangements in future CM. The International
Money Fund (IMF) funded many other mitigation projects after the 1999 earthquakes, and the
establishment of GDTEM was a condition of receiving the credit. The government would not
have gotten the IMF loan if the GDTEM had been established even one day later (Celik, 2007).
Akdag (2002) argues that the GDTEM has not solved Turkey‘s CM problems. The GTDEM has
a very limited number of personnel and insufficient resources and expertise, posing another
obstacle for successful CM.
Case-study city Istanbul established a local emergency management center, which also
mobilizes disaster relief mechanisms during disasters occurring in the city. Although it has
limited resources and limited authority, the Istanbul Disaster Coordination Center (AKOM) is
coordinating with universities and other NGOs to prepare for future disasters. Besides AKOM
75
(which is controlled by an elected official) there exists another emergency management center
belonging to the Governor of Istanbul (an appointed official). While AKOM lacks a law
enforcement agency in the disaster plan, the Governor‘s CM center lacks a fire brigade service.
As discussed in the beginning, this is a result of the central government‘s attitude toward the
public administration system of Turkey.
Some voluntary CM agencies play critical roles in Turkish CM, although they are
underrated. The Search and Rescue Association (AKUT) and the Search, Rescue, and Research
Association (AKA) are important civilian voluntary search-and-rescue teams in Turkey. These
organizations generally recruit mountaineers. Volunteers belonging to those organizations are
mobilized to disaster areas to search for and rescue survivors in inaccessible areas, such as
building ruins after an earthquake or a high altitude location after a plane accident. Like the Red
Cross, these organizations also operate in Turkey and will assist in any country if requested.
AKA, AKUT, and the Red Cross provided disaster assistance to Taiwan in 1999, India in 2001,
and Iran in the 2003 earthquakes. The Red Crescent donated $1.5 million to the American Red
Cross for disaster assistance during Hurricane Katrina. Akdag (2002) suggests that the further
involvement of voluntary nonprofit agencies in CM is a must for successful disaster response and
recovery.
CM coordinating agencies established after 1999 number so many that they nearly equal
the number of CM participants. Therefore, coordination is not the issue in a possible disaster; the
multiplicity of coordinating agencies is itself a problem. CM authorities do not have skills and
expertise, while CM operatives do not have adequate authority to perform in disaster areas and to
receive essential information. This is somewhat similar to the situation in the U.S. Unfortunately,
76
while both central and local organizations struggle for more authority and power it is the
community who pays for the price of ineffective CM (Celik, 2007).
4.1.2.2 Discussion
It was discussed that it would be ineffective to have too many coordinating agencies
instead of actual CM-performing agencies. Although AKUT and AKA are volunteer-based,
donation-funded, small, and non-profit organizations, they were reported to have dominated the
CM network in Istanbul Bombings in 2003 (K. Coban, personal communication, April 12, 2009).
USAID Report (2005) claimed that AKOM, GTDEM, and GDDA did not perform enough to be
considered in an effective place in the CM.
The Medical Bureau, 112 Emergency Medical Service (EMS), and the Red Crescent
provided immediate health assistance to victims. Although EMS officials failed to set up triage
units in the incident site, Rodoplu et al. (2005) reported that medical intervention was successful.
The Medical Bureau is under the municipality and a local agency. However, 112 EMS belongs to
the Ministry of Health of federal government. All ambulance vehicles in Turkey use capital city
Ankara‘s license plate codes. Kizilay, on the other hand, is a nonprofit agency that falls between
a central and local agency. Fortunately, despite being responsible to different level of
government agencies, all three medical agencies operated together.
There is just one law enforcement agency operating in cities in Turkey. It is Turkish
National Police.The agency is represented by local divisions that are connected to capital city
Ankara. Therefore, Istanbul Police Department (IPD) is the only law enforcement agency that
can fulfill crime scene protection and investigation efforts that started immediately after the
attacks. Religious (Hezbollah, IBDA-C), Marxist (DHKP-C, PKK-KADEK), Ultranationalist
77
(Ergenekon) and many other different terrorist organizations have attacked civilians and
government officials for own purposes for many years. The Turkish National Police (TNP) has
an important role in terrorist-made disasters.
Thanks to good medical services, the coordination agencies‘ ineffectiveness did not do
any harm to CM; however, some other aspects of the response and recovery phase were
eventually neglected. R. Kilic (personal communication, April 12, 2009) argued about
impressive involvement of Istanbul Fire Department and other municipal services. Coordination
and communication among first responders is anessential need which was largely neglected
during the recovery phase in the Istanbul Bombings.
Reports confirm ineffective CM from different aspects (Rodoplu et al., 2005). For
example, medical units and other first responders rushed into bombing sites without considering
the possibility that there might be a second bomb. Additionally, the poisonous gas ammonia that
had been used for the blasts was still in the air when first responders took control of the scene.
Volunteers, bystanders, and the press could not be kept out of crime scenes, endangering their
own security. 112 EMS centers dispatched almost all of the available ambulances to incident
sites, which left the city of Istanbul without emergency medical resources for a long time. The
Istanbul Police could not provide security and clearance on the crisis scene for nearly half an
hour. The heavy load placed on cellular lines prevented communication even among first
responders, which also affected CM badly (wireless communication among first responder
agencies is still not established in Turkey).
Worst of all, there was no coordination agency through which the media could access
essential information about the attacks. Blocked communication lines suddenly increased the
importance of press coverage for the public. However, without a proper and reliable source, both
78
public and private TV networks continued to cover the incidents via the media agents‘ own
experiences and knowledge. Several other bombings in Istanbul were reported which in fact had
not taken place, which only increased the chaos. Hours later, the government banned live news
reports covering the bombings. Turkish CM definitely needs a coordinative agency with both
expertise and authority. To sum up, separated, loosely connected local and central CM forces did
not create a successful CM network.
CSI efforts played a very important role in the investigation of the Istanbul bombings.
The Istanbul Police Department‘s CSI units rushed into the bombing sites within minutes of the
attacks. R. Kilic (personal communication, April 12, 2009) implied that CSI units came in and
secured the areas in a very short time. CSI efforts directly affected the results of the
investigation. Perpetrators and others aiding and abetting the bombings were quickly brought to
justice, thanks to CSI findings. Law enforcement‘s CSI examination is the only way to know
about a terrorist attack. Figuring out the terrorists‘ tactics successfully deters future terrorist
incidents.
K. Durmus (personal communication, April 12, 2009) added that the CSI investigation
may be the most important in a disaster scene, yet it does not get required attention. CSI units do
not have a role in emergency plans; they lack direct communication with other first responders,
and they are generally not the leaders of a crisis scene. R. Kilic (personal communication, April
12, 2009) argues that even hierarchical superiors in law enforcement units may not understand
the importance of CSI. Crisis scene leadership is a problem waiting for necessary regulations.
Quarantelli‘s (1997) seventh criterion (Q22 of the study) deals with this leadership
problem. It is not only significant for effective CSI effort, but also essential for all CM. CSI can
document material damage after a disaster, which is important for insurance issues. Another use
79
of CSI is the identification of victims. K. Coban (personal communication, April 12, 2009)
suggests that natural and manmade disasters can leave many people dead. After great disasters,
identification of all the dead may not be possible by victims‘ relatives. From terrorist bombings
to earthquakes, it is the government‘s responsibility to identify victims. Inefficient CSI would
result in an unevaluated CM, which would create greater inefficiencies in future events.
4.1.3 Spain
Spain‘s transition from Franco‘s dictatorship to a modern democracy in the 1980s
changed its public administration system completely. CM policies were rewritten because of
democratic expectations. The Cold War tactics of dictatorship had remained until the end of
Franco‘s term; civil defense was the only strategy employed, and disaster mitigation was not
considered as a method. After 1980s, elected governments passed many CM laws to regulate CM
efforts. The central government‘s effect on regional governments is very weak, and Spain‘s
autonomous regions are almost like U.S. states. Local or regional emergencies are not handled
by the central government. Regions are responsible for the response, recovery, preparedness, and
mitigation phases of CM. Only a national emergency declaration mobilizes the central
government‘s forces.
4.1.3.1 History
Bremberg and Britz (2007) date Spain‘s CM policies back to the 1940s. Like all other
European countries, Spanish civil protection aimed to stop the killing of civilians in air raids.
After it became a democracy with the creation of the 1978 Constitution, Spain decentralized 17
regions within her borders. All regions and sub-regions have remained loyal to the King and the
80
government. The Law 2/1985, which came into effect in January 21, 1985, assigned the General
Directorate for Civil Protection and Emergency (Direccion General de Proteccion Civil y
Emergencias, DGPCE) to execute National CM policies. All regions also have their own CM
organizations, and coordination among them is operated by DGPCE. DGPCE has an education
facility that trains CM officials in Spain. The National School of Civil Protection (la Escuela
Nacional de Civil, ENPC) serves Spanish and other nationals in emergency management issues
(MDI, 2009).
The Operative Coordination Center (SACOP, Sala de Coordinación Operativa) is the
highest CM council brought together during national emergencies. SACOP includes the Prime
Minister and other delegated ministers. The DGPCE coordinates SACOP‘s meetings. In 2005,
amendments gave authority to SACOP to mobilize the Military Emergency Unit (Unidad Militar
de Emergencias, UME) which was used to evacuate the residents of Canary Islands during the
2007 bushfires. UME mobilization is the last degree of national CM efforts (Bremberg and Britz,
2007). Decentralizing public administration and CM efforts did not make them ineffective; local
and regional administrations prepared for disasters with realistic plans.
The City of Madrid has the Territorial Plan of Civil Protection of Madrid (Plan Territorial
de Protección Civil de la Comunidad de Madrid, PLATERCAM), which was prepared and
legislated in 1992 with Decree 85/1992 of 17 December. PLATERCAM was conducted during
the 11-M bombings. Each first responder and other CM agencies have a role in the plan.
PLATERCAM is directed by the Ministry of the Interior and the Ministry of Justice together
(MDI, 2009). DGPCE is the coordinator agency of the plan. PLATERCAM‘s CM policy is
operated on four levels.
81
Level 0 is for small-scale emergencies. The municipal first-responder agencies, such as
local police and local EMS, are mobilized on this level. This is the normal procedure for any
emergency reported. CM interactions in this level are similar to Level 1, with the difference that
Level 1 procedures are headed by a central commander. In Level 1, even though the emergency
is local, the whole CM action is operated and supervised by a central commander in the
PLATERCAM center. This can happen on the director‘s own initiative or at the local first
responders‘ request. The important thing in both Level 1 and Level 0 is that the CM actions do
not require authority and sources at a level higher than the municipal level.
Level 2 is declared when the emergency incident exceeds one local administration‘s
region and authority. PLATERCAM‘s director takes over the control of CM in Level 2.
Coordination is provided among all participating local first responder agencies by the
PLATERCAM center. PLATERCAM‘s director is responsible for determining and reporting a
higher emergency level if needed. Public information dissemination is also one of the duties of
PLATERCAM‘s director. In this way, the media and citizens can get vital information about the
incidents from the most reliable source.
Level 3 goes into effect when a national emergency is declared. Level 3 is declared by
the Ministry of the Interior. The Ministry of the Interior can declare such an emergency on its
own or at the request of DGPCE‘s or PLATERCAM‘s director. Authority in the disaster region
is given to SACOP, which also takes part in PLATERCAM‘s governing body. PLATERCAM
has two groups of agencies in the CM action plan: the executive group and the action group. The
executive group is formed of SECOP and subcommittees. This is very similar to the Turkish
system discussed above. However, PLATERCAM‘s DGPCE has a history of more than ten
years. The agency has an education facility which has good relationships with local and central
82
CM bodies. DGPCE works under the Ministry of the Interior; nonetheless, it reports to the Prime
Minister, who is head of SECOP in national emergencies. This setup gives authority to director
of DGPCE (Bolling et al., 2007). Because expertise and authority is combined within one
agency, PLATERCAM is a powerful and efficient tool in Spanish CM.
PLATERCAM‘s action groups are classified based on the type of response and recovery
efforts they pursue. These include security, intervention, emergency health, technical support,
and logistics groups. Law enforcement and intelligence agencies form the security group of
PLATERCAM. Whether they are local or national, all law enforcement agencies on a disaster
scene operate in this group. The intervention group is headed by the Chief Fire Officer, and
includes fire departments, the Red Cross, and other local nonprofit agencies. The emergency
health group is formed by agencies serving EMS. SUMMA (Servicio de Urgencias Médicas de
Madrid) and SAMUR (Servicio de Asistencia Municipal de Urgencia y Rescate-Protección
Civil) are the most important health agencies providing emergency medicine on the scene. They
are coordinated by the 112 EMS center of Madrid in the PLATERCAM plan. Technical support
and logistics groups are agencies coordinated by central command (DGPCE) to monitor the
needs of other first-responder organizations.
4.1.3.2 Discussion
According to the CM plans discussed, the Ministry of the Interior is the head of CM
system, because DGPCE serves for this ministry. SUMMA and SAMUR are the EMS
organizations of the response. Bolling et al. (2007) reported that they did not perform triage at
the bombing sites, since individual visual assessment of the victims was enough to adequately
treat all of them. Additionally, there were four different incident sites, which may have made it
83
difficult to establish triage centers. The first ambulance arrived to Atocha Station in seven
minutes. Hospital tents were set up within thirty minutes at all four bombing sites. The fist bomb
went off at 7:39 AM, and more than 1,500 persons were injured in total. By 10:17 AM, there
were no injured persons at the sites; all patients had been transferred to 15 different hospitals by
that time. When the bombing alarm was given by the 112 Call Center at 7:45 AM, the hospitals
in Madrid cancelled all surgical operations for that day and waited for the casualties of the
bombings.
Cancelling surgeries made many beds and medical personnel available, which prevented
congestion in the hospitals. Another source of medical personnel was provided by the change in
shifts. Night-shift personnel were not given permission to go home, which doubled the number
of personnel available to care for bombing victims. The hospitals, 112 Call Center, and
ambulances were connected to each other for a long time before the attacks; as a result, SUMMA
and SAMUR‘s CM action was very coordinated. Madrid‘s train lines carry more than 800,000
passengers daily from 93 stations. Considering the chaotic environment at attacks‘ time, the
success of EMS is even clearer.
The 112 Call Center conducted one of the most important duties of the CM network.
Firstly, this center maintained communication among first responders, executive managers, and
victims. Secondly, the 112 Call Center set up a special telephone service that provided
information to the public about the attacks only one half hour after the attacks were confirmed.
Victims, victims‘ relatives, the media, and other citizens were informed via this center. Public
panic was prevented in this way. The cell phone lines‘ overload created a communication
problem in the city for the first several hours. A new telephone line was set up among the
hospitals after the attacks to eliminate this communication problem.
84
The Spanish law enforcement agencies in PLATERCAM are the Spanish National Police,
the National Intelligence Center, the Madrid Police Department, and the Spanish Civil Guard.
These agencies take part in PLATERCAM‘s action groups‘ security section. The Madrid Police
Department is a local law enforcement agency, while the others operate nationally in Spain.
Their quick deployment is similar to what occurred in the Istanbul case; since Spain has been
experiencing terrorist incidents for more than 50 years. Law enforcement agencies, whether local
or central, are well prepared for such incidents.
The collaboration between law enforcement and intelligence led the prosecution to a
building in Madrid on April 3, almost one month after the attacks. The neighborhood was
evacuated, and the terrorists believed to be the masterminds behind the attacks blew themselves
up inside the building. The police found enough evidence in the blasted building to track other
terrorists linked to the attacks. The investigations continued throughout Europe, and Italian
officials arrested another mastermind of the Madrid attacks in June 2004. Several other terrorist
attacks planned in Spain were stopped before they occurred, thanks to law enforcement
personnels‘ efforts (Bolling et al., 2007).
CM organizations in Spain were ready for such an attack. The CM plans were prepared in
the 1990s after the democratization of the country. Local authorities were empowered to the
highest degree as a result of decentralization came with the democracy. Contrary to the centralist
command-control argument, decentralization did not cause CM policies to fail, even if it did not
make them more successful. The Madrid Bombings indicated that if central and local authorities
are balanced carefully in CM plans, CM will be successful on the national as well as the regional
level. One should note that Madrid CM personnel were experienced in terror attacks, which also
increased the level of disaster response.
85
4.1.4 U.K.
The U.K., like Spain and Turkey, is a unitary state. The country is an island separated
from the Europe mainland. A constitutional monarch governs the country similarly to Spain‘s
royal family. Parliament has two branches, the House of Lords and the House of Commons. The
Prime Minister is the main wielder of executive power. There are four countries in the U.K.:
Wales, Northern Ireland, Scotland, and England. London is the capital city of England. The
public administration system is similar to the U.S. states‘ systems. Local authorities are
autonomous, and the central government‘s effect on them is limited by regulations. The U.K. is
the sixth greatest economy in the world with a population of over sixty million.
4.1.4.1 History
The U.K. was no exception when it came to passing Cold War CM policies in the 1950s.
Heavily bombarded by Nazi Germany in World War Two, the British government passed the
Civil Defense Act in 1948. The law aimed to reduce the number of casualties during air raids.
Local administrations were allowed access to national resources in case of emergency, but CM
planning and recovery operations were left completely to their authority (O´Brien & Read,
2005). The coordination of local CM was not considered a national government responsibility.
Based on Cold War politics, the only disaster that interested the national government was nuclear
war.
A series of mass-casualty disasters changed this perception in the 1980s. The King's
Cross underground fire in 1987, Zeebrugge Ferry Disaster in 1987, Clapham Junction rail crash
in 1988, and Hillsborough Stadium Disaster in 1989 pushed the central government to take a
greater role in disasters. The Civil Defense in Peacetime Act of 1986 was altered with the
86
required amendments to give the central government a more coordinating role in local and
regional emergencies. Local authorities were still responsible for CM mitigation and
preparedness in beginning of the millennium.
The U.K. Fuel Blockade Crisis in September 2000 resulted in a regulation effort by the
Home Office (Ministry of the Interior). In July 2001, the lead role in CM was assigned to the
Civil Contingencies Secretariat (CCA) in the Cabinet Office. September 11, 2001 changed the
scope of CM policies that already were being revised. New CM policies created a framework
containing national, regional, and local perspectives in coordinating and collaborative language.
The system was close to the Spanish CM system discussed above. The HSBC attacks and slaying
of the British Consul in the 2003 Istanbul Bombings made it clear that the U.K. would be a target
of future Al Qaeda attacks (HMG, 2006). As a result of increasing terrorist attacks against
civilians in foreigncountries, the U.K. government applied the notion of resilience to CM
policies and passed the Civil Contingencies Act (CCA) in 2004 (HMSO, 2004).
CCA divided CM personnel into two categories: ―core responders‖ and ―co-operating
responders‖ (CCS, 2009, p. 8). Category 1 is formed by law enforcement personnel, EMS, fire
brigades, search-and-rescue teams, local authorities, and other first-response teams. Electricity,
gas, sewer, and water suppliers, as well as transportation authorities and telecommunication
providers are in Category 2 (Devitt & Borodzicz, 2008). U.K. resilience is a proactive approach
to CM. Resilience is a biological term referring to the idea that environmental changes are
inevitable and organisms should be ready for them, whatever the impacts. Resilience does not
mean that the victims should not prepare for those detrimental impacts from the environment.
Instead, the target population should be ready for any kind of extreme event, and it should aim to
return to normal life as soon as possible.
87
CCA categorizes emergencies into two types: terrorist contingencies and non-terrorist
contingencies. Natural disasters and man-made disasters that are not sourced from a terrorist
attack are considered non-terrorist contingencies. When it is declared a national disaster, a non-
terrorist contingency CM is managed by the related minister or Cabinet member. Terrorist
contingencies, on the other hand, are managed directly by the Cabinet Office Briefing Rooms
(COBR) headed by the Prime Minister. The COBR‘s members can change depending upon the
characteristics of the incident. Representatives of the Home Office, the Ministry of Defense, the
Department of Transportation, the affected region‘s police and fire chiefs, and members of other
relevant offices are likely members of COBR (CCS, 2009).
4.1.4.2 Discussion
The London Ambulance Service (LAS) is the main EMS agency in the CM network
involved in the 2005 London Bombings. The British Red Cross and Saint John‘s ambulance
services also served in the London bombings response; however, these organizations are
volunteer-based. The LAS has vast resources in terms of personnel and equipment. The LAS is
also prepared for such attacks because of the Irish Republican Army‘s (IRA) long lasting
terrorist campaign. Additionally, the LAS is connected to the regional hospitals in the disaster
plan, which make coordination efforts easier during a disaster. Just as in the Madrid bombings,
when the 112 Center in London gave a bombing alarm at around 9:20 AM on July 7, 2005,
hospitals cancelled all operations planned for that day. EMS organizations and hospitals did not
accept blood donations, as it had been learned in the WTC attacks in 2001 and the Madrid
attacks in 2004 that the blood donation process take the EMS‘s precious time where there is no
need for extra blood.
88
It was argued that CM policies were changed and centralized especially for specific types
of disasters with CCA legislation in 2004 in the U.K. The involvement of central government
members shows the output of CCA‘s effect in CM. According to O´Brien and Read (2005), such
central government involvement is the new face of CM in developed countries. Local disasters
will continue to be evaluated and addressed by local authorities with central government‘s
coordination. However, national-level disasters will be handled by strong government
involvement in the future. The public‘s expectation for more efficient CM is increasing,
especially for occasions that exceed local authorities‘ capability, such as Hurricane Katrina. The
U.K. model of resilience for terrorism-related contingencies will continue to involve central
government involvement (CCA, 2009).
Main law enforcement agencies authorized in such an incident in London are the City of
London Police (CLP) and the Metropolitan Police Service (MPS). There is no uniformed
national police force in the U.K. The Ministry of Defense has a national law enforcement agency
called the Ministry of Defense Police (MDP), but this agency is not a uniformed police force;
they only have just over 3,000 officers in the U.K. Because of the decentralized system, borough
police organizations are the most important law enforcement agencies for the public. The MPS is
responsible for the region known as the Greater London Area. The CLP‘s responsibility area is
very small respectively, and the area is called the City of London. The CLP‘s territory is within
MPS‘s territory geographically, but according to the agreement between agencies, MPS enters
the CLP‘s jurisdiction only when requested.
CLP and MPS showed a great coordination effort in London bombings response. The
evacuation of victims and conducting of CSI efforts together was very successful. Panic did not
cause any casualties in the London Underground Metro. Moreover, evidence led to a quick and
89
efficient investigation that revealed all the perpetrators behind the attacks. The
telecommunication-line overload that plagued previous terrorist bombings was not experienced
in London‘s response because of regulations passed by law enforcement officials before the
attacks. According to those regulations, mobile phone companies were provided with a list of
first responders beforehand. When needed, mobile phone companies cut communication for all
customers but the numbers in first responders‘ list. Although the aim of this idea was to provide
more effective CM by creating extra communication lines among first responders, it was
reported that the phone number list of first responders was not updated, which led to
communications failures for the majority of first responders, especially in EMS (Devitt &
Borodzicz, 2008).
Law enforcement agencies in the London response helped the public obtain reliable
information. MPS‘s Chief joined the first COBR meeting, which took place just 15 minutes after
the alarm was given by London Underground authorities. At 11:00 AM, the MPS Chief gave the
first press briefing and confirmed that terrorist attacks had occurred at several sites. He also
added that everything was under the control of the government and there was no reason to panic
(HMG, 2006).
London Fire Brigade (LFB) was another very important local agency in recovery phase
of CM in the London Bombings. The LFB is also in Category 1 in the CCA plan. In coordination
with the MPS, CLP, and LAS, the LFB served in all four bombing sites. A local coordination
agency, Network Control Center (NCC) controls the traffic in the London Underground metro.
Therefore, the NCC worked as a primary coordinator during the attacks. However, the NCC was
criticized for its tardy reception of information about the incidents. Apparently, after the
bombings took place at 8:50 AM, the NCC informed authorities only of a power shortage in
90
several lines, when the trains had in fact stopped because of the explosions. The NCC waited to
call the MPS about a possible attack until 9:17 AM, which slowed the CM process significantly.
4.1.5 Conclusions
The case countries‘ public administration systems seem to affect CM systems deeply.
The U.S., the U.K., and Spain have decentralized systems that left all CM stages to local
administrations. Turkey has the strongest centralist system among the selected countries, and CM
in Turkey developed in a centralist way as a result. Nonetheless, there is no clear correlation
between decentralized CM policies and the effectiveness of CM networks. For example,
centralist Turkish CM was not successful in terms of delivering necessary services to the
neediest victims and offering the public reliable and useful information. On the other hand, the
decentralized U.S. system failed to communicate and coordinate first responders, or to provide
for the sufficient participation of all responders in response and recovery.
Analyzed roughly, Spain and the U.K. CM networks seem to have performed better than
the U.S. and Turkey CM networks. The U.S. and Turkey failed to empower local authorities in
CM efforts. Although serious natural and man-made disasters had resulted in mass casualties
before the analyzed cases in Turkey and the U.S., central and local governments and other
authorities did not apply lessons learned. For example, the 1993 World Trade Center attacks
clearly demonstrated that the first responders of New York City needed more effective
communication devices (Kean & Hamilton, 2004). Similarly, the 1999 Marmara Earthquakes in
Turkey showed that the Turkish CM system needs a coordinating agency with both expertise and
authority.
91
Democratization processes did not seem to have affect CM‘s efficiency, either. The
oldest democracies in the selected cases are the U.K. and the U.S. Both of these countries have
had political parties and national and regional elections for hundreds of years. Spain is the
youngest democracy, having abolished its dictatorship only a few decades ago. However, along
with the U.K., Spain conducted a very successful CM that is actually taken as an example by
other CM organizations throughout the world (Cornall, 2005). Social-economical conditions are
another dimension that explains organizational behaviors; however, they are not enough to
explain the CM failures in the U.S. and Turkey.
Historically, all four selected countries experienced their golden ages as world powers.
Spain (the Spanish and Portuguese Empire) was a world power in the 15th
century. Turkey (the
Ottoman Empire) ruled more than half of the known world in the 16th
century. The U.K. (Great
Britain) was the strongest empire in the world in the 19th
century. The U.S. has been the
superpower of the world since 1950s. Economically, the richest country is the U.S., while the
poorest of the selected countries is Turkey. Nonetheless, Turkey and the U.S. did similarly badly
in evaluated CM efforts. Socio-economical factors are argued to play an important role in
underdeveloped countries (IRIN, 2005), but that was not the case for this study‘s evaluations.
While looking for causes for CM effectiveness or ineffectiveness, different characteristics
of the incidents should be taken into account. The terrorists used four passenger planes as bombs
in the U.S., while they used four bomb-laden trucks in Turkey. In Spain, they used ten bomb-
loaded backpacks. Four bomb-loaded backpacks were used in the U.K. The limited capability of
the terrorists forced them to conduct much smaller attacks. Although all selected incidents were
inspired by the same terrorist organization and greatest civilian casualties were targeted, the
perpetrators‘ methods of operation were different in style and in scale. The terrorists‘ tactics
92
evolved, and the CM systems encountering them were also evolving in response to previous
attacks. Kenney (2007) defines this evolution as ―competitive adaptation‖ (2007, 6). After the
WTC attacks in 2001, plane hijackings were prevented with high-security measures. Law
enforcement agencies learned from the 2003 Istanbul bombings and deterred loaded trucks from
going into crowded parts of cities. When terrorists understood that they would not be able to
attack with car bombs, they used numerous backpack bombs aimed at smaller targets such as
underground trains or passenger buses in Spain and in the U.K. The shift in terrorist tactics
created an element of surprise that had a negative impact on the CM network‘s effectiveness.
From this perspective, it is to be expected that the latest selected incident‘s response will
be managed more effectively than the previous cases. Additionally, the WTC attacks‘ response
should be expected to be the least effective, since such a suicide-attack style had not been
previously experienced or even considered. After the WTC attacks not only the U.S. but almost
all of the countries in the world also changed or revised their CM policies. Larger-scale disaster
exercises were conducted in developed countries. More effective communication lines among
first responders were established. Central coordination centers were strengthened and newer
technologies were developed and adapted. For example, the British CM system learned to shut
down mobile phone lines for people in a particular region except for the first responders from
previous attacks such as the Madrid attacks and the WTC attacks.
Assuming that previous CM actions will be less effective and later ones will be more
effective makes sense from different aspects. However, ineffective CM efforts like the one that
took place after Hurricane Katrina, which occurred years after the WTC attacks, indicate that
applying lessons learned is aspect crucial aspect of successful CM policies. In other words, it is
not enough simply to evaluate and point out mistakes with official or scholarly reports; applying
93
them to developed CM plans is also vital. Policy makers and experts should be contacted and
listened to more fully in order to prevent CM failures in the future.
Terrorist organizations learn just as CM networks learn. They adapt themselves to new
conditions to reach their targets. For that reason, terrorist attacks are not like natural disasters
that will do the same harm each time. CM networks can fail even in natural disasters if basic
rules are disregarded, as they were in Hurricane Katrina, which make it absolutely normal to fail
in terrorist attacks. It would be harsh to decide whether a CM network is ineffective or not,
especially in a large-scale terrorist attack, merely by looking at a statistical tool‘s analyses.
4.2 SEM Results
In order to create the study‘s dataset, six organizations were selected from each case-
study country. The UCINET results in Table 2, Table 3, Table 4, and Table 5 were used to define
the target agencies. Organizations with a significant number of professional CM employees were
chosen, rather than selecting the top six organizations regardless of their attributes. Specific
government agencies, offices, or ministries, such as the President of the U.S., the Prime Minister
of Turkey, or the Home Secretary of the U.K., were either unreachable by the study, or contain
fewer persons than the targeted ten per agency. The eliminated agencies have been discussed in
the text in detail.
Online surveys were uploaded to a survey portal at www.surveygizmo.com. Selecting
agencies from each country, the surveys‘ links were sent to them directly. When it became
apparent that the agencies‘ response rate was lower than expected, scholars, web groups, mail
groups, and other sources were used to find more respondents. Unfortunately, the Spanish and
British CM agencies targeted were not responsive. Consequently, Spain and the U.K. were taken
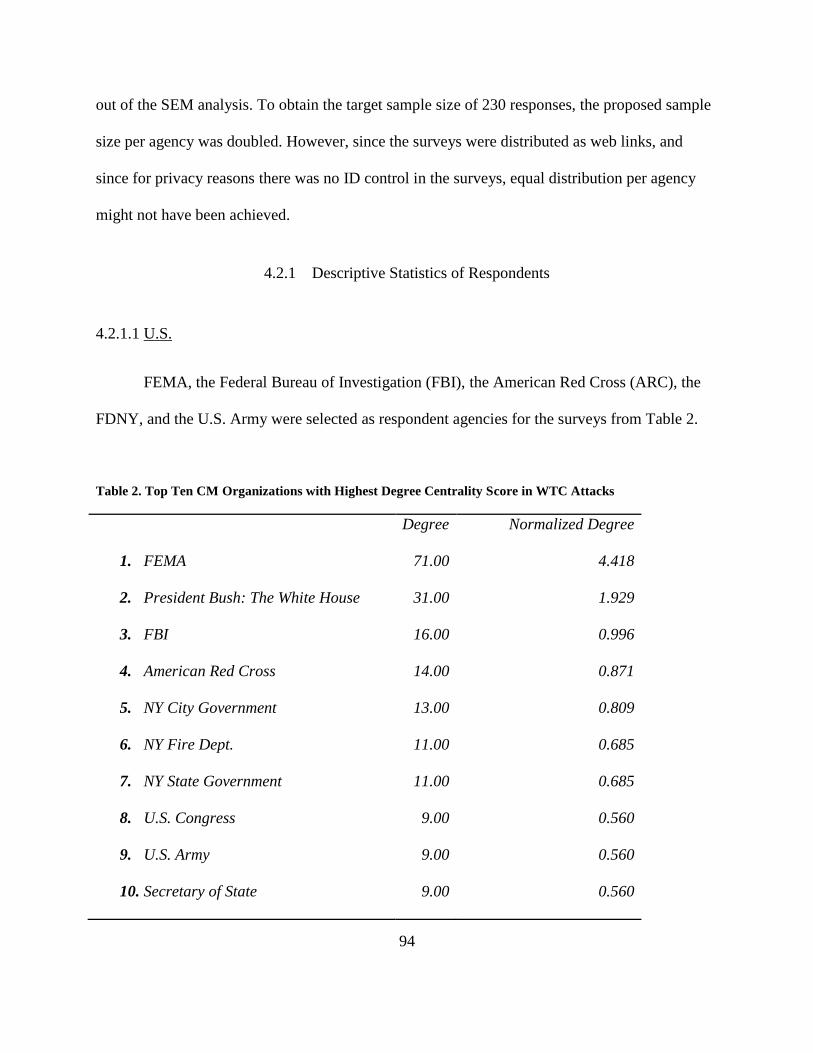
94
out of the SEM analysis. To obtain the target sample size of 230 responses, the proposed sample
size per agency was doubled. However, since the surveys were distributed as web links, and
since for privacy reasons there was no ID control in the surveys, equal distribution per agency
might not have been achieved.
4.2.1 Descriptive Statistics of Respondents
4.2.1.1 U.S.
FEMA, the Federal Bureau of Investigation (FBI), the American Red Cross (ARC), the
FDNY, and the U.S. Army were selected as respondent agencies for the surveys from Table 2.
Table 2. Top Ten CM Organizations with Highest Degree Centrality Score in WTC Attacks
Degree Normalized Degree
1. FEMA 71.00 4.418
2. President Bush: The White House 31.00 1.929
3. FBI 16.00 0.996
4. American Red Cross 14.00 0.871
5. NY City Government 13.00 0.809
6. NY Fire Dept. 11.00 0.685
7. NY State Government 11.00 0.685
8. U.S. Congress 9.00 0.560
9. U.S. Army 9.00 0.560
10. Secretary of State 9.00 0.560
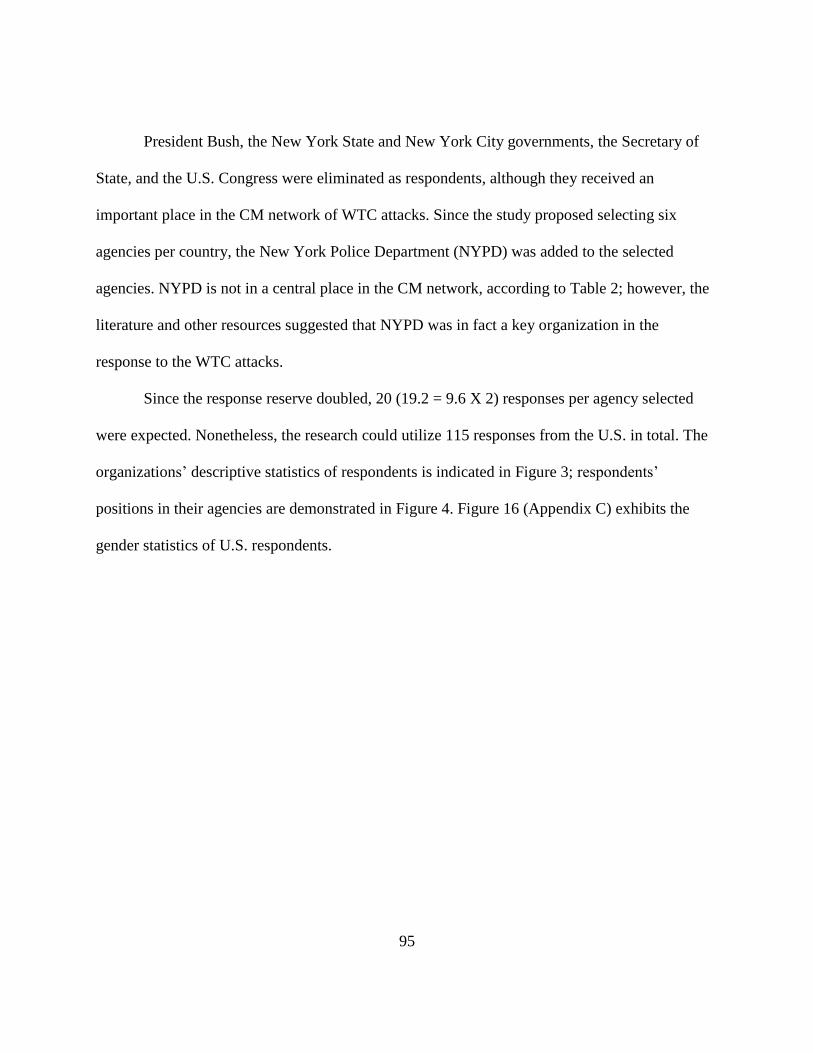
95
President Bush, the New York State and New York City governments, the Secretary of
State, and the U.S. Congress were eliminated as respondents, although they received an
important place in the CM network of WTC attacks. Since the study proposed selecting six
agencies per country, the New York Police Department (NYPD) was added to the selected
agencies. NYPD is not in a central place in the CM network, according to Table 2; however, the
literature and other resources suggested that NYPD was in fact a key organization in the
response to the WTC attacks.
Since the response reserve doubled, 20 (19.2 = 9.6 X 2) responses per agency selected
were expected. Nonetheless, the research could utilize 115 responses from the U.S. in total. The
organizations‘ descriptive statistics of respondents is indicated in Figure 3; respondents‘
positions in their agencies are demonstrated in Figure 4. Figure 16 (Appendix C) exhibits the
gender statistics of U.S. respondents.
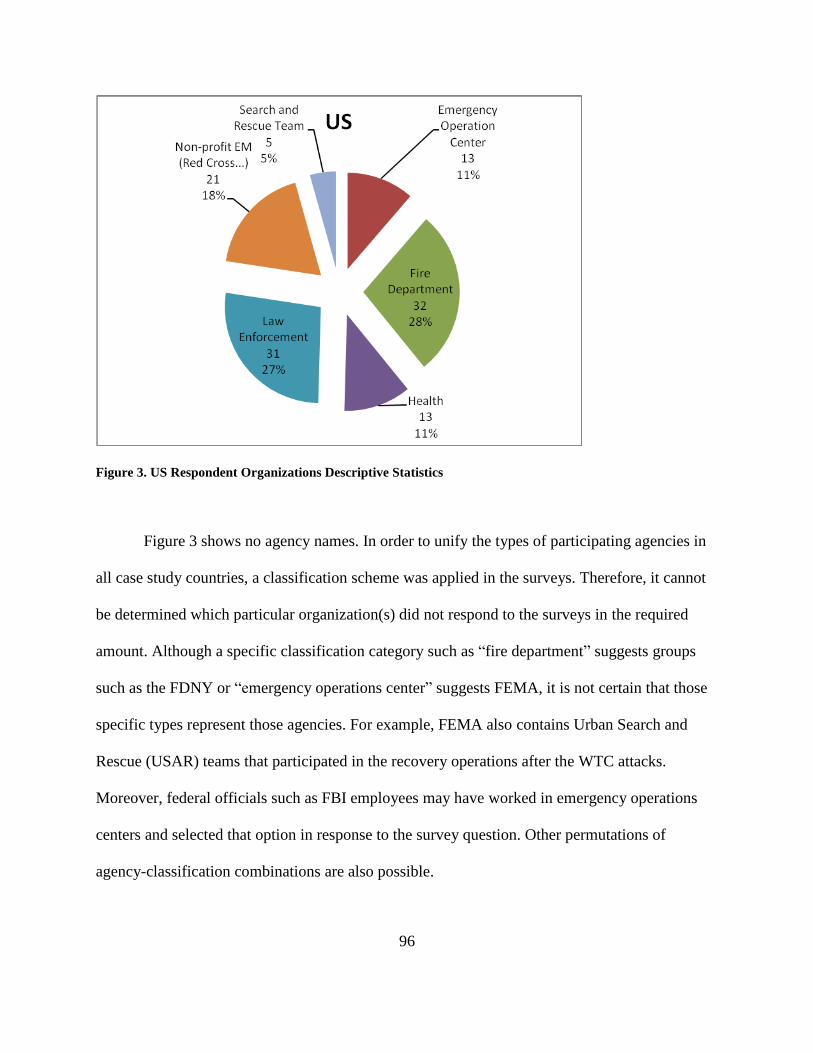
96
Figure 3. US Respondent Organizations Descriptive Statistics
Figure 3 shows no agency names. In order to unify the types of participating agencies in
all case study countries, a classification scheme was applied in the surveys. Therefore, it cannot
be determined which particular organization(s) did not respond to the surveys in the required
amount. Although a specific classification category such as ―fire department‖ suggests groups
such as the FDNY or ―emergency operations center‖ suggests FEMA, it is not certain that those
specific types represent those agencies. For example, FEMA also contains Urban Search and
Rescue (USAR) teams that participated in the recovery operations after the WTC attacks.
Moreover, federal officials such as FBI employees may have worked in emergency operations
centers and selected that option in response to the survey question. Other permutations of
agency-classification combinations are also possible.
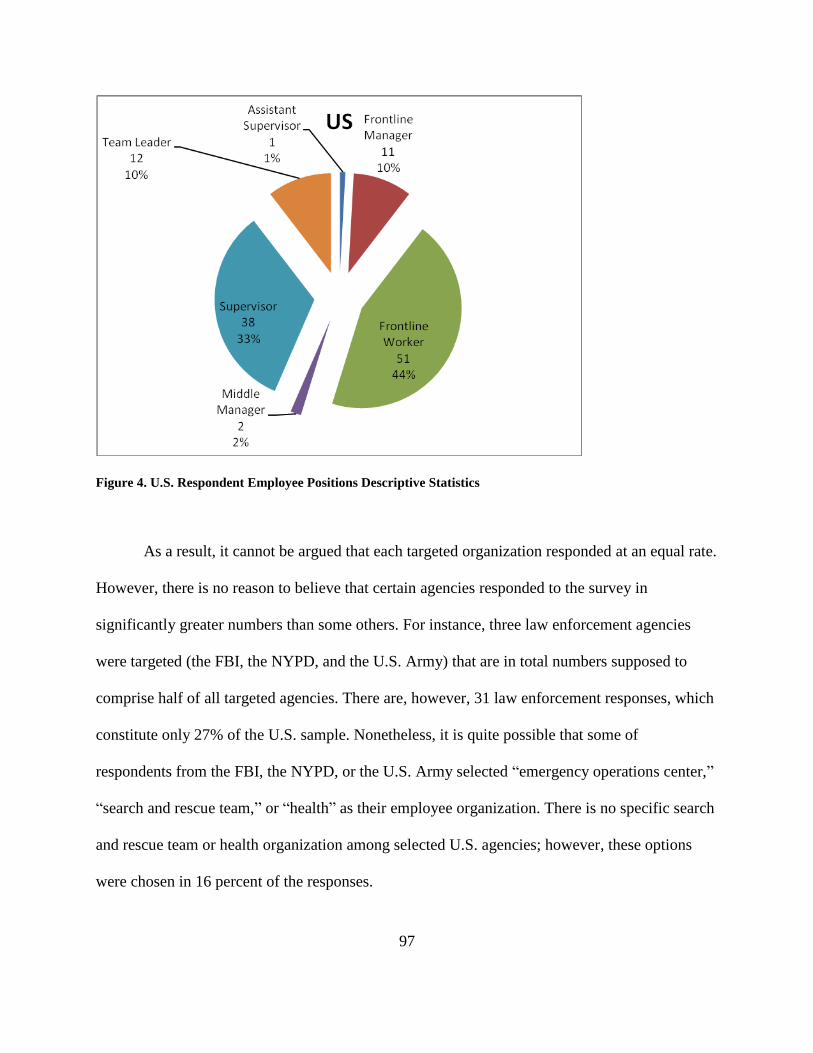
97
Figure 4. U.S. Respondent Employee Positions Descriptive Statistics
As a result, it cannot be argued that each targeted organization responded at an equal rate.
However, there is no reason to believe that certain agencies responded to the survey in
significantly greater numbers than some others. For instance, three law enforcement agencies
were targeted (the FBI, the NYPD, and the U.S. Army) that are in total numbers supposed to
comprise half of all targeted agencies. There are, however, 31 law enforcement responses, which
constitute only 27% of the U.S. sample. Nonetheless, it is quite possible that some of
respondents from the FBI, the NYPD, or the U.S. Army selected ―emergency operations center,‖
―search and rescue team,‖ or ―health‖ as their employee organization. There is no specific search
and rescue team or health organization among selected U.S. agencies; however, these options
were chosen in 16 percent of the responses.
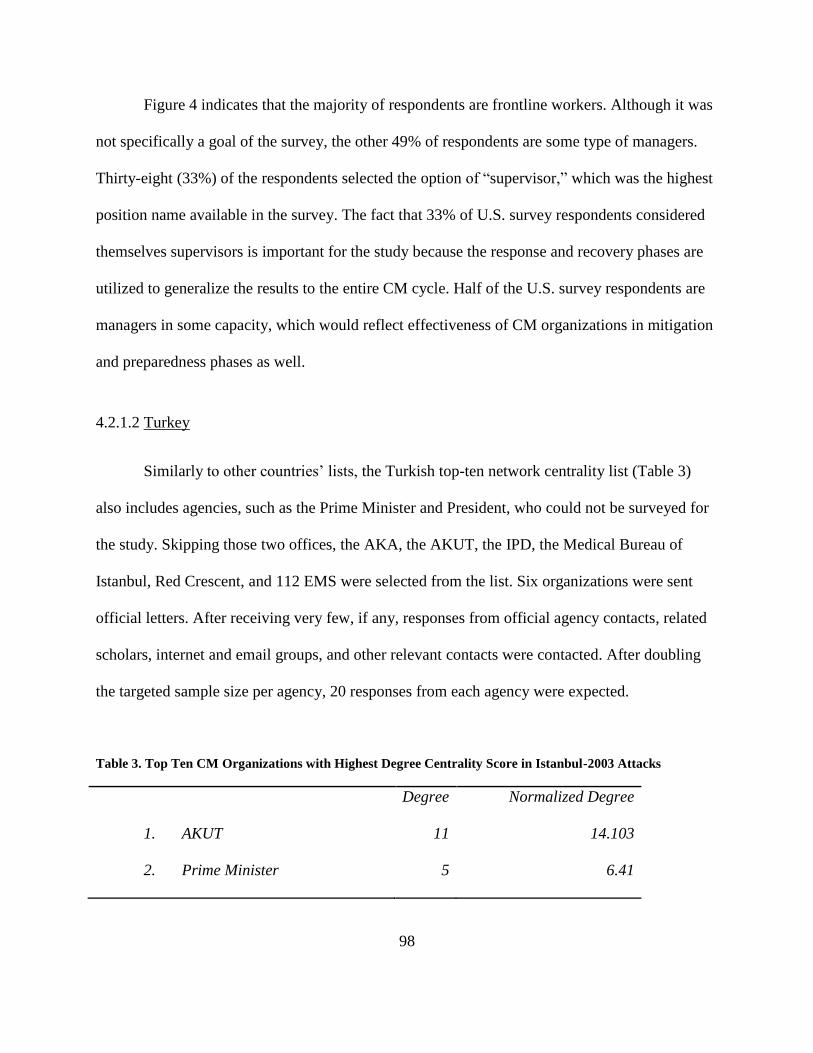
98
Figure 4 indicates that the majority of respondents are frontline workers. Although it was
not specifically a goal of the survey, the other 49% of respondents are some type of managers.
Thirty-eight (33%) of the respondents selected the option of ―supervisor,‖ which was the highest
position name available in the survey. The fact that 33% of U.S. survey respondents considered
themselves supervisors is important for the study because the response and recovery phases are
utilized to generalize the results to the entire CM cycle. Half of the U.S. survey respondents are
managers in some capacity, which would reflect effectiveness of CM organizations in mitigation
and preparedness phases as well.
4.2.1.2 Turkey
Similarly to other countries‘ lists, the Turkish top-ten network centrality list (Table 3)
also includes agencies, such as the Prime Minister and President, who could not be surveyed for
the study. Skipping those two offices, the AKA, the AKUT, the IPD, the Medical Bureau of
Istanbul, Red Crescent, and 112 EMS were selected from the list. Six organizations were sent
official letters. After receiving very few, if any, responses from official agency contacts, related
scholars, internet and email groups, and other relevant contacts were contacted. After doubling
the targeted sample size per agency, 20 responses from each agency were expected.
Table 3. Top Ten CM Organizations with Highest Degree Centrality Score in Istanbul-2003 Attacks
Degree Normalized Degree
1. AKUT 11 14.103
2. Prime Minister 5 6.41
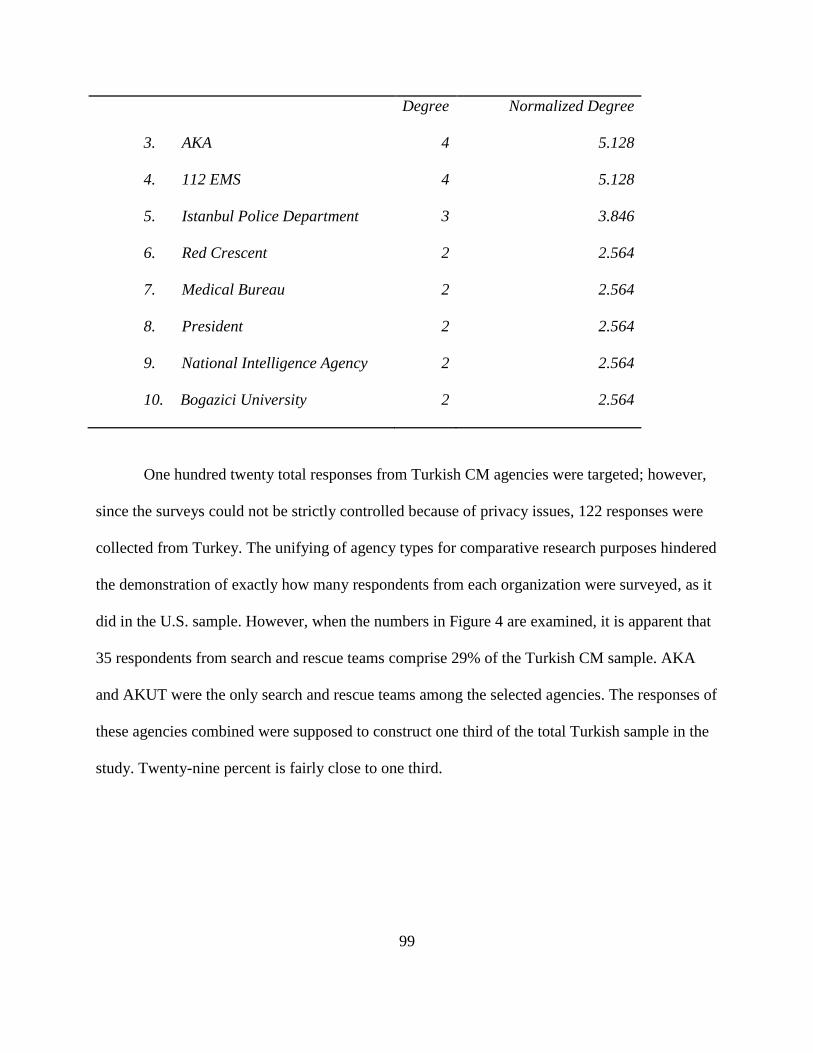
99
Degree Normalized Degree
3. AKA 4 5.128
4. 112 EMS 4 5.128
5. Istanbul Police Department 3 3.846
6. Red Crescent 2 2.564
7. Medical Bureau 2 2.564
8. President 2 2.564
9. National Intelligence Agency 2 2.564
10. Bogazici University 2 2.564
One hundred twenty total responses from Turkish CM agencies were targeted; however,
since the surveys could not be strictly controlled because of privacy issues, 122 responses were
collected from Turkey. The unifying of agency types for comparative research purposes hindered
the demonstration of exactly how many respondents from each organization were surveyed, as it
did in the U.S. sample. However, when the numbers in Figure 4 are examined, it is apparent that
35 respondents from search and rescue teams comprise 29% of the Turkish CM sample. AKA
and AKUT were the only search and rescue teams among the selected agencies. The responses of
these agencies combined were supposed to construct one third of the total Turkish sample in the
study. Twenty-nine percent is fairly close to one third.
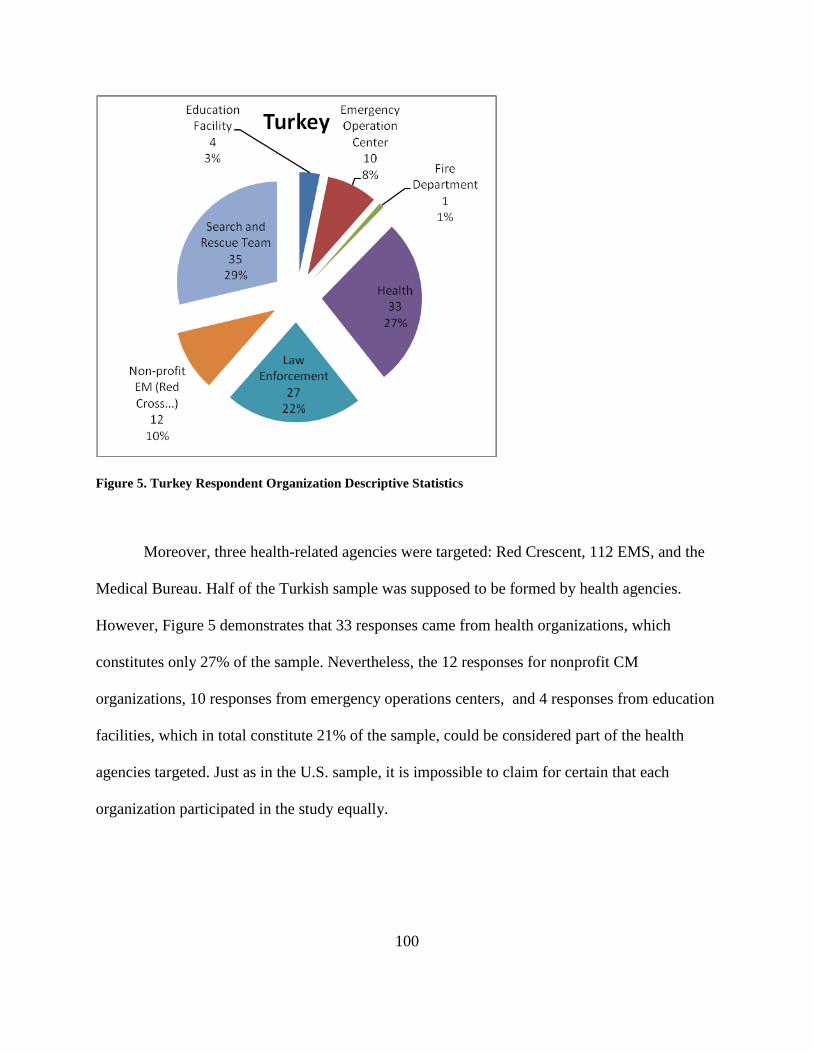
100
Figure 5. Turkey Respondent Organization Descriptive Statistics
Moreover, three health-related agencies were targeted: Red Crescent, 112 EMS, and the
Medical Bureau. Half of the Turkish sample was supposed to be formed by health agencies.
However, Figure 5 demonstrates that 33 responses came from health organizations, which
constitutes only 27% of the sample. Nevertheless, the 12 responses for nonprofit CM
organizations, 10 responses from emergency operations centers, and 4 responses from education
facilities, which in total constitute 21% of the sample, could be considered part of the health
agencies targeted. Just as in the U.S. sample, it is impossible to claim for certain that each
organization participated in the study equally.
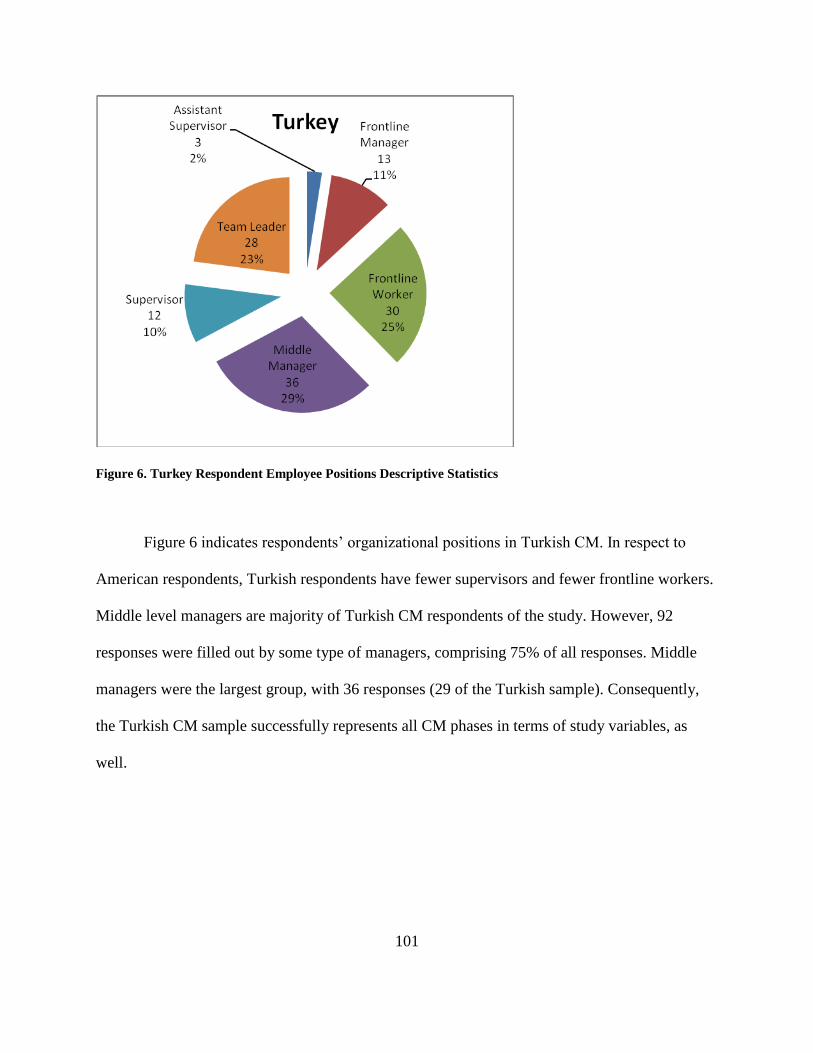
101
Figure 6. Turkey Respondent Employee Positions Descriptive Statistics
Figure 6 indicates respondents‘ organizational positions in Turkish CM. In respect to
American respondents, Turkish respondents have fewer supervisors and fewer frontline workers.
Middle level managers are majority of Turkish CM respondents of the study. However, 92
responses were filled out by some type of managers, comprising 75% of all responses. Middle
managers were the largest group, with 36 responses (29 of the Turkish sample). Consequently,
the Turkish CM sample successfully represents all CM phases in terms of study variables, as
well.
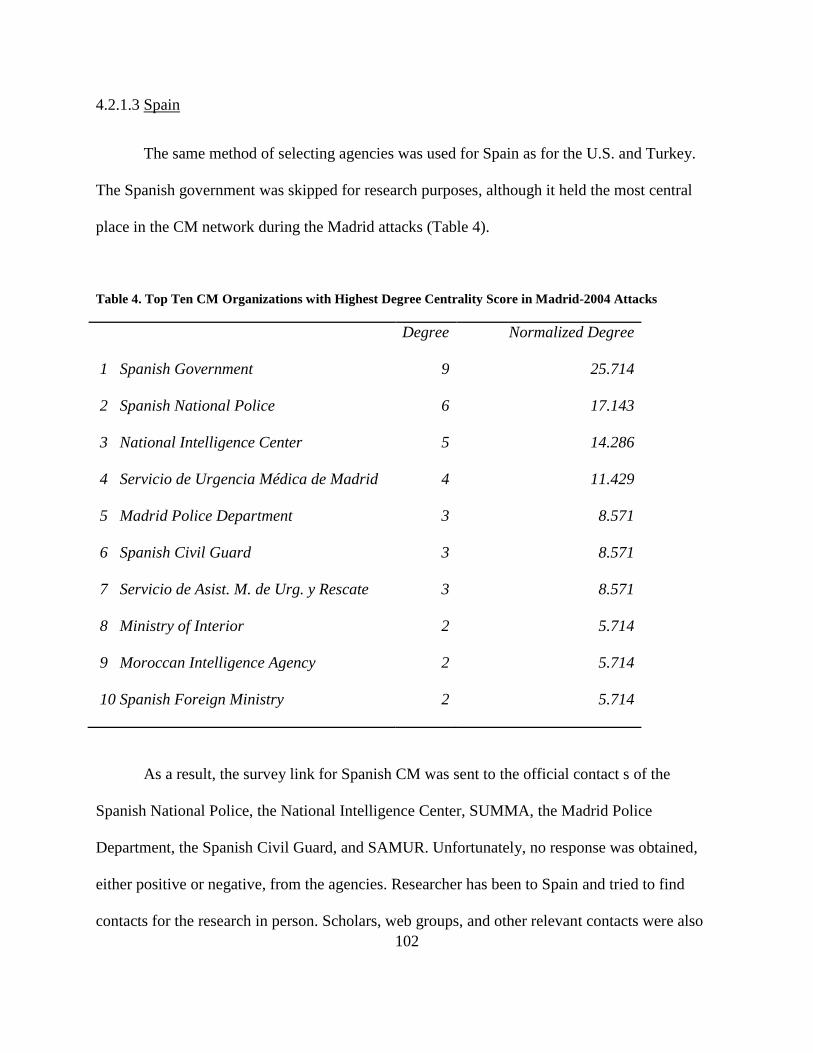
102
4.2.1.3 Spain
The same method of selecting agencies was used for Spain as for the U.S. and Turkey.
The Spanish government was skipped for research purposes, although it held the most central
place in the CM network during the Madrid attacks (Table 4).
Table 4. Top Ten CM Organizations with Highest Degree Centrality Score in Madrid-2004 Attacks
Degree Normalized Degree
1 Spanish Government 9 25.714
2 Spanish National Police 6 17.143
3 National Intelligence Center 5 14.286
4 Servicio de Urgencia Médica de Madrid 4 11.429
5 Madrid Police Department 3 8.571
6 Spanish Civil Guard 3 8.571
7 Servicio de Asist. M. de Urg. y Rescate 3 8.571
8 Ministry of Interior 2 5.714
9 Moroccan Intelligence Agency 2 5.714
10 Spanish Foreign Ministry 2 5.714
As a result, the survey link for Spanish CM was sent to the official contact s of the
Spanish National Police, the National Intelligence Center, SUMMA, the Madrid Police
Department, the Spanish Civil Guard, and SAMUR. Unfortunately, no response was obtained,
either positive or negative, from the agencies. Researcher has been to Spain and tried to find
contacts for the research in person. Scholars, web groups, and other relevant contacts were also
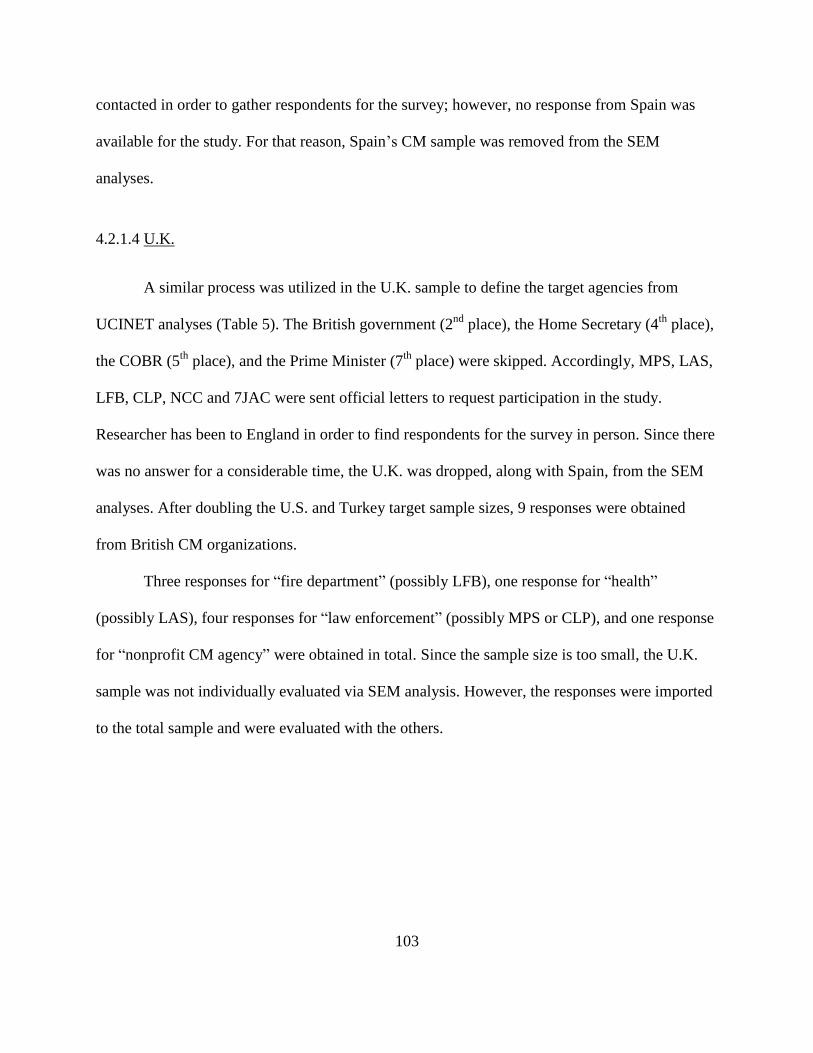
103
contacted in order to gather respondents for the survey; however, no response from Spain was
available for the study. For that reason, Spain‘s CM sample was removed from the SEM
analyses.
4.2.1.4 U.K.
A similar process was utilized in the U.K. sample to define the target agencies from
UCINET analyses (Table 5). The British government (2nd
place), the Home Secretary (4th
place),
the COBR (5th
place), and the Prime Minister (7th
place) were skipped. Accordingly, MPS, LAS,
LFB, CLP, NCC and 7JAC were sent official letters to request participation in the study.
Researcher has been to England in order to find respondents for the survey in person. Since there
was no answer for a considerable time, the U.K. was dropped, along with Spain, from the SEM
analyses. After doubling the U.S. and Turkey target sample sizes, 9 responses were obtained
from British CM organizations.
Three responses for ―fire department‖ (possibly LFB), one response for ―health‖
(possibly LAS), four responses for ―law enforcement‖ (possibly MPS or CLP), and one response
for ―nonprofit CM agency‖ were obtained in total. Since the sample size is too small, the U.K.
sample was not individually evaluated via SEM analysis. However, the responses were imported
to the total sample and were evaluated with the others.
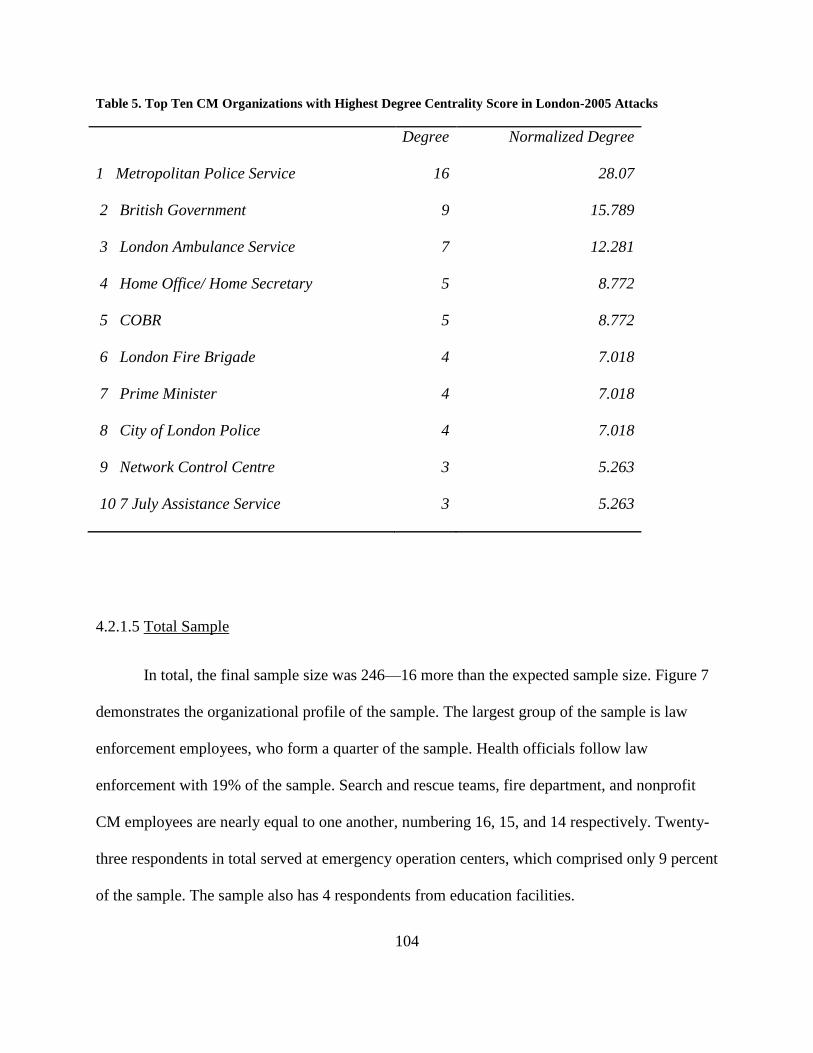
104
Table 5. Top Ten CM Organizations with Highest Degree Centrality Score in London-2005 Attacks
Degree Normalized Degree
1 Metropolitan Police Service 16 28.07
2 British Government 9 15.789
3 London Ambulance Service 7 12.281
4 Home Office/ Home Secretary 5 8.772
5 COBR 5 8.772
6 London Fire Brigade 4 7.018
7 Prime Minister 4 7.018
8 City of London Police 4 7.018
9 Network Control Centre 3 5.263
10 7 July Assistance Service 3 5.263
4.2.1.5 Total Sample
In total, the final sample size was 246—16 more than the expected sample size. Figure 7
demonstrates the organizational profile of the sample. The largest group of the sample is law
enforcement employees, who form a quarter of the sample. Health officials follow law
enforcement with 19% of the sample. Search and rescue teams, fire department, and nonprofit
CM employees are nearly equal to one another, numbering 16, 15, and 14 respectively. Twenty-
three respondents in total served at emergency operation centers, which comprised only 9 percent
of the sample. The sample also has 4 respondents from education facilities.
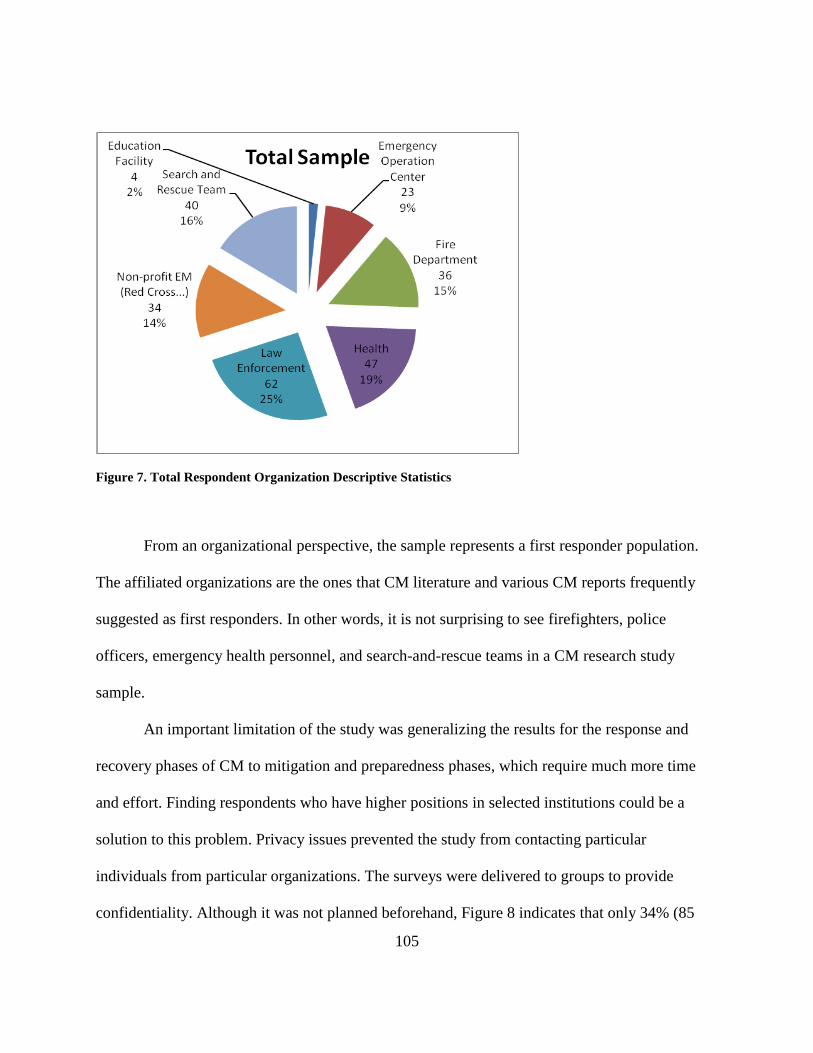
105
Figure 7. Total Respondent Organization Descriptive Statistics
From an organizational perspective, the sample represents a first responder population.
The affiliated organizations are the ones that CM literature and various CM reports frequently
suggested as first responders. In other words, it is not surprising to see firefighters, police
officers, emergency health personnel, and search-and-rescue teams in a CM research study
sample.
An important limitation of the study was generalizing the results for the response and
recovery phases of CM to mitigation and preparedness phases, which require much more time
and effort. Finding respondents who have higher positions in selected institutions could be a
solution to this problem. Privacy issues prevented the study from contacting particular
individuals from particular organizations. The surveys were delivered to groups to provide
confidentiality. Although it was not planned beforehand, Figure 8 indicates that only 34% (85
106
people) of the sample were frontline workers. Twenty-one percent (53 people) of the sample
were supervisors, and 66% of the sample identified themselves as some type of manager. The
high rate of manager participation reduces the effect of argued limitation and makes the study
results more generalizable.
Figure 8. Total Respondent Employee Positions Descriptive Statistics
A disproportionate number of male respondents replied from the survey. Figure 18
(Appendix C) indicates that female respondents of the survey comprise only 15 percent of the
total sample.

107
4.2.2 Descriptive Statistics of Survey Results
Table 6 demonstrated the simple descriptive statistics of the sample. Q18a is the
combined version of Q18, Q19, and Q20. The fifth criterion Quarantelli (1997) suggested was
represented by Q18a in the SEM models in the study.
All questions asked in the surveys received answers ranging from 1 (Completely Agree)
to 5 (Completely Disagree). A distribution from all perspectives of respondents is shown.
Furthermore, only five questions (questions #9, #10, #11, #12, and #13) had a mean of less than
two or more than three. Other questions generated a mode between two and three, indicating that
the answers fall in the neutral agreement area. Questions #9, #10, #12, and #13 have a mean
value of more than 1.90, which shows that they have relatively normal answers. However, the
mean for question 11 is 3.69. This value is close to ―Agree.‖ The respondents overwhelmingly
agreed upon this question‘s statement.
Table 6. Descriptive Statistics of Survey Results
N Minimum Maximum Mean Skewness Kurtosis
Statistic Std.
Error
Rate Statistic Std.
Error
Rate
Q1 246 1 5 2.55 0.47 0.16 3.03 -0.76 0.31 -2.45
Q2 246 1 5 2.39 0.60 0.16 3.86 -0.67 0.31 -2.18
Q3 246 1 5 2.17 0.87 0.16 5.60 -0.07 0.31 -0.23
Q4 246 1 5 2.58 0.42 0.16 2.70 -0.93 0.31 -3.00
Q5 246 1 5 2.26 0.90 0.16 5.80 0.24 0.31 0.78
Q6 246 1 5 2.12 0.87 0.16 5.60 0.52 0.31 1.69
Q7 246 1 5 2.25 0.83 0.16 5.32 0.05 0.31 0.15
Q8 246 1 5 2.13 0.75 0.16 4.86 -0.04 0.31 -0.14
Q9 246 1 5 1.98 1.03 0.16 6.63 0.57 0.31 1.85
Q10 246 1 5 1.98 1.12 0.16 7.21 1.02 0.31 3.29
Q11 246 1 5 3.69 -0.70 0.16 -4.51 -0.11 0.31 -0.35
Q12 246 1 5 1.97 1.08 0.16 6.94 1.06 0.31 3.44
Q13 246 1 5 1.91 1.21 0.16 7.77 1.52 0.31 4.93
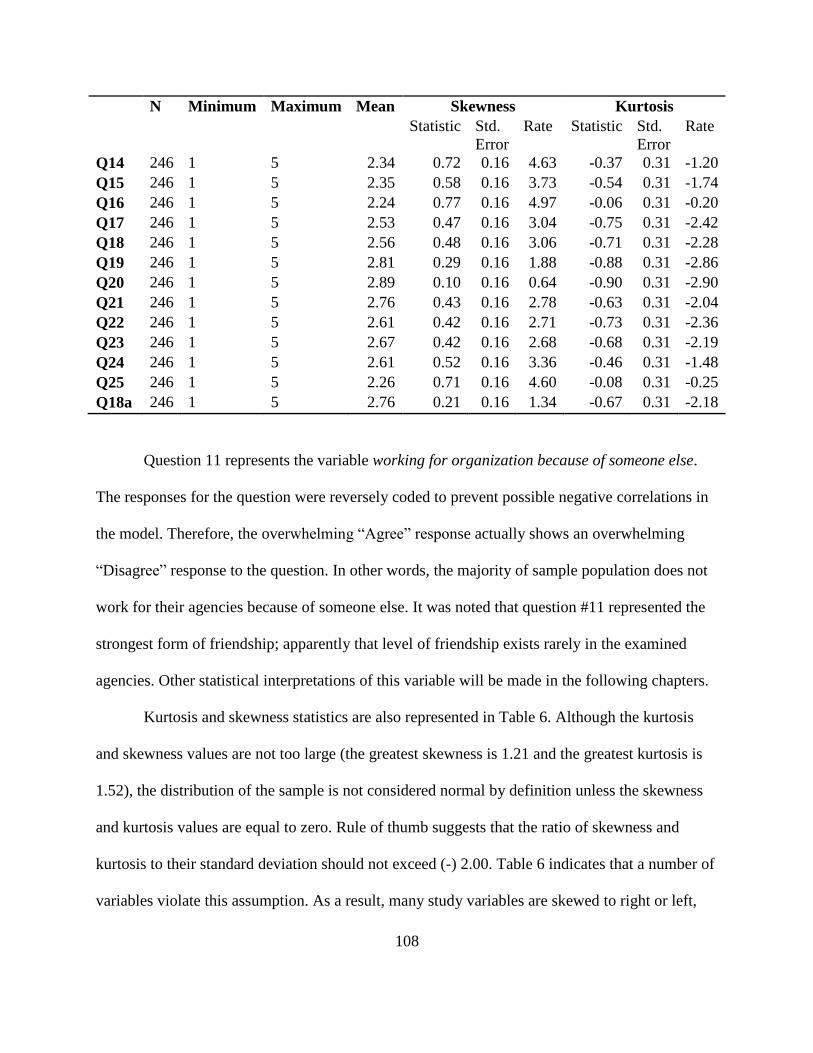
108
N Minimum Maximum Mean Skewness Kurtosis
Statistic Std.
Error
Rate Statistic Std.
Error
Rate
Q14 246 1 5 2.34 0.72 0.16 4.63 -0.37 0.31 -1.20
Q15 246 1 5 2.35 0.58 0.16 3.73 -0.54 0.31 -1.74
Q16 246 1 5 2.24 0.77 0.16 4.97 -0.06 0.31 -0.20
Q17 246 1 5 2.53 0.47 0.16 3.04 -0.75 0.31 -2.42
Q18 246 1 5 2.56 0.48 0.16 3.06 -0.71 0.31 -2.28
Q19 246 1 5 2.81 0.29 0.16 1.88 -0.88 0.31 -2.86
Q20 246 1 5 2.89 0.10 0.16 0.64 -0.90 0.31 -2.90
Q21 246 1 5 2.76 0.43 0.16 2.78 -0.63 0.31 -2.04
Q22 246 1 5 2.61 0.42 0.16 2.71 -0.73 0.31 -2.36
Q23 246 1 5 2.67 0.42 0.16 2.68 -0.68 0.31 -2.19
Q24 246 1 5 2.61 0.52 0.16 3.36 -0.46 0.31 -1.48
Q25 246 1 5 2.26 0.71 0.16 4.60 -0.08 0.31 -0.25
Q18a 246 1 5 2.76 0.21 0.16 1.34 -0.67 0.31 -2.18
Question 11 represents the variable working for organization because of someone else.
The responses for the question were reversely coded to prevent possible negative correlations in
the model. Therefore, the overwhelming ―Agree‖ response actually shows an overwhelming
―Disagree‖ response to the question. In other words, the majority of sample population does not
work for their agencies because of someone else. It was noted that question #11 represented the
strongest form of friendship; apparently that level of friendship exists rarely in the examined
agencies. Other statistical interpretations of this variable will be made in the following chapters.
Kurtosis and skewness statistics are also represented in Table 6. Although the kurtosis
and skewness values are not too large (the greatest skewness is 1.21 and the greatest kurtosis is
1.52), the distribution of the sample is not considered normal by definition unless the skewness
and kurtosis values are equal to zero. Rule of thumb suggests that the ratio of skewness and
kurtosis to their standard deviation should not exceed (-) 2.00. Table 6 indicates that a number of
variables violate this assumption. As a result, many study variables are skewed to right or left,
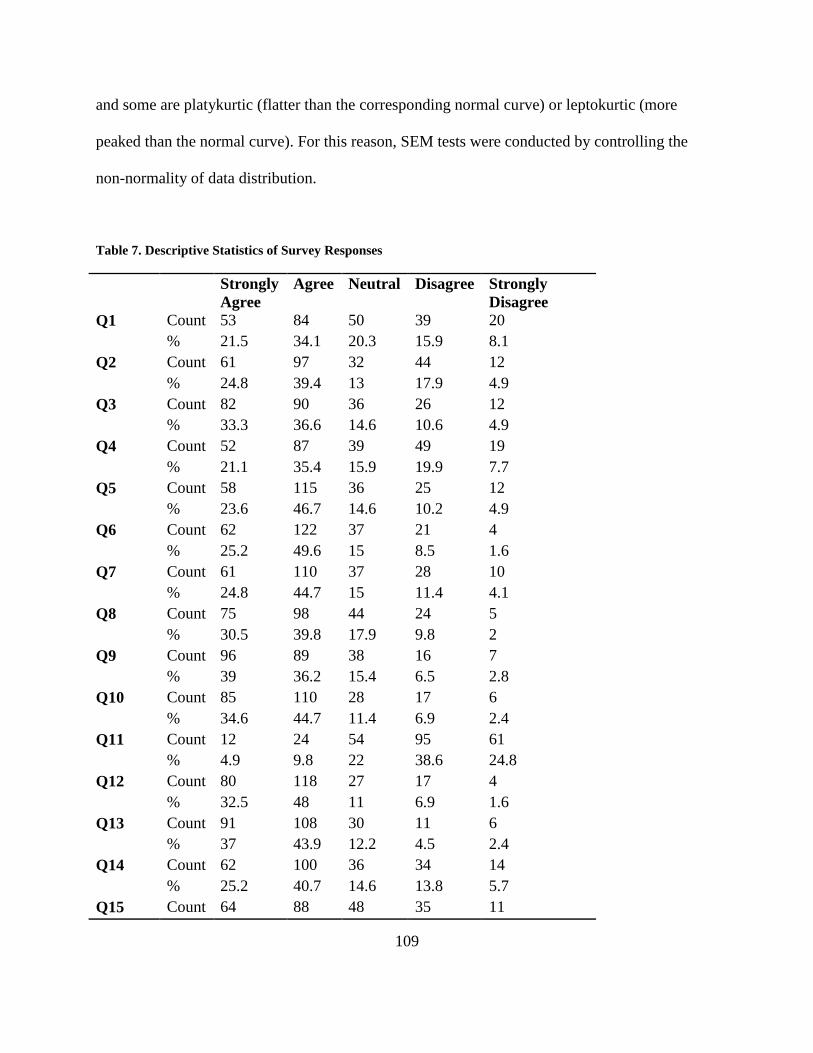
109
and some are platykurtic (flatter than the corresponding normal curve) or leptokurtic (more
peaked than the normal curve). For this reason, SEM tests were conducted by controlling the
non-normality of data distribution.
Table 7. Descriptive Statistics of Survey Responses
Strongly
Agree
Agree Neutral Disagree Strongly
Disagree
Q1 Count 53 84 50 39 20
% 21.5 34.1 20.3 15.9 8.1
Q2 Count 61 97 32 44 12
% 24.8 39.4 13 17.9 4.9
Q3 Count 82 90 36 26 12
% 33.3 36.6 14.6 10.6 4.9
Q4 Count 52 87 39 49 19
% 21.1 35.4 15.9 19.9 7.7
Q5 Count 58 115 36 25 12
% 23.6 46.7 14.6 10.2 4.9
Q6 Count 62 122 37 21 4
% 25.2 49.6 15 8.5 1.6
Q7 Count 61 110 37 28 10
% 24.8 44.7 15 11.4 4.1
Q8 Count 75 98 44 24 5
% 30.5 39.8 17.9 9.8 2
Q9 Count 96 89 38 16 7
% 39 36.2 15.4 6.5 2.8
Q10 Count 85 110 28 17 6
% 34.6 44.7 11.4 6.9 2.4
Q11 Count 12 24 54 95 61
% 4.9 9.8 22 38.6 24.8
Q12 Count 80 118 27 17 4
% 32.5 48 11 6.9 1.6
Q13 Count 91 108 30 11 6
% 37 43.9 12.2 4.5 2.4
Q14 Count 62 100 36 34 14
% 25.2 40.7 14.6 13.8 5.7
Q15 Count 64 88 48 35 11
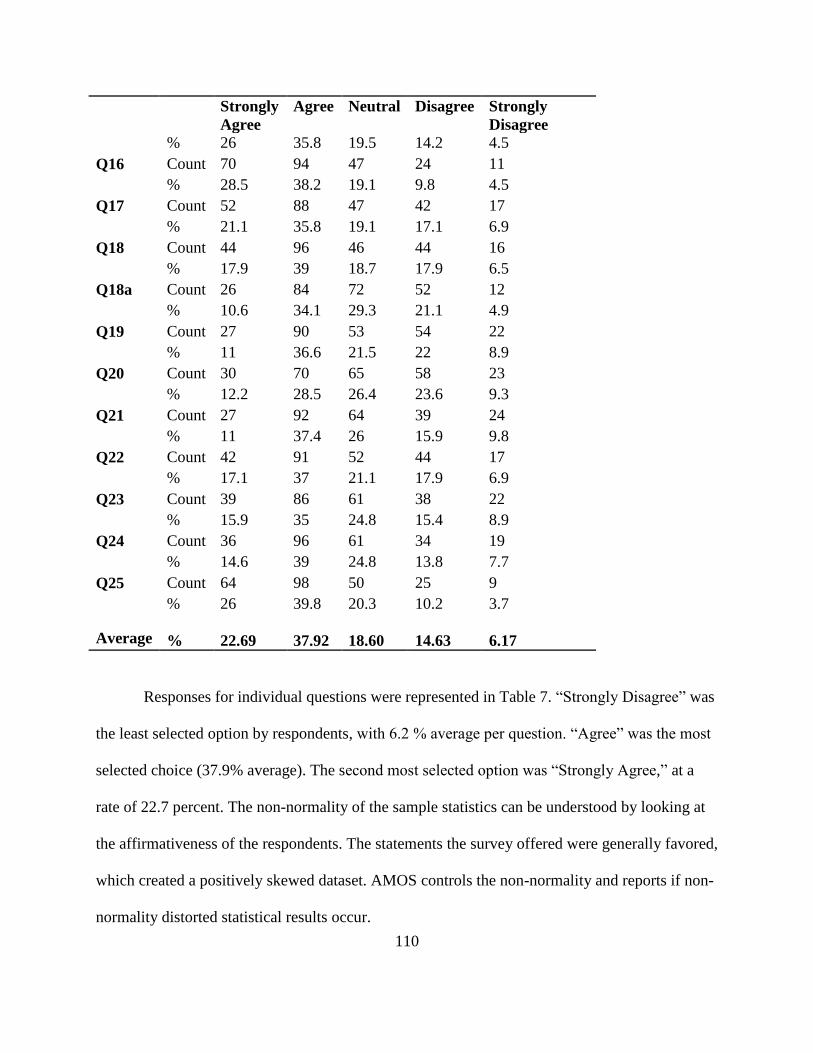
110
Strongly
Agree
Agree Neutral Disagree Strongly
Disagree
% 26 35.8 19.5 14.2 4.5
Q16 Count 70 94 47 24 11
% 28.5 38.2 19.1 9.8 4.5
Q17 Count 52 88 47 42 17
% 21.1 35.8 19.1 17.1 6.9
Q18 Count 44 96 46 44 16
% 17.9 39 18.7 17.9 6.5
Q18a Count 26 84 72 52 12
% 10.6 34.1 29.3 21.1 4.9
Q19 Count 27 90 53 54 22
% 11 36.6 21.5 22 8.9
Q20 Count 30 70 65 58 23
% 12.2 28.5 26.4 23.6 9.3
Q21 Count 27 92 64 39 24
% 11 37.4 26 15.9 9.8
Q22 Count 42 91 52 44 17
% 17.1 37 21.1 17.9 6.9
Q23 Count 39 86 61 38 22
% 15.9 35 24.8 15.4 8.9
Q24 Count 36 96 61 34 19
% 14.6 39 24.8 13.8 7.7
Q25
Average
Count 64 98 50 25 9
%
%
26
22.69
39.8
37.92
20.3
18.60
10.2
14.63
3.7
6.17
Responses for individual questions were represented in Table 7. ―Strongly Disagree‖ was
the least selected option by respondents, with 6.2 % average per question. ―Agree‖ was the most
selected choice (37.9% average). The second most selected option was ―Strongly Agree,‖ at a
rate of 22.7 percent. The non-normality of the sample statistics can be understood by looking at
the affirmativeness of the respondents. The statements the survey offered were generally favored,
which created a positively skewed dataset. AMOS controls the non-normality and reports if non-
normality distorted statistical results occur.
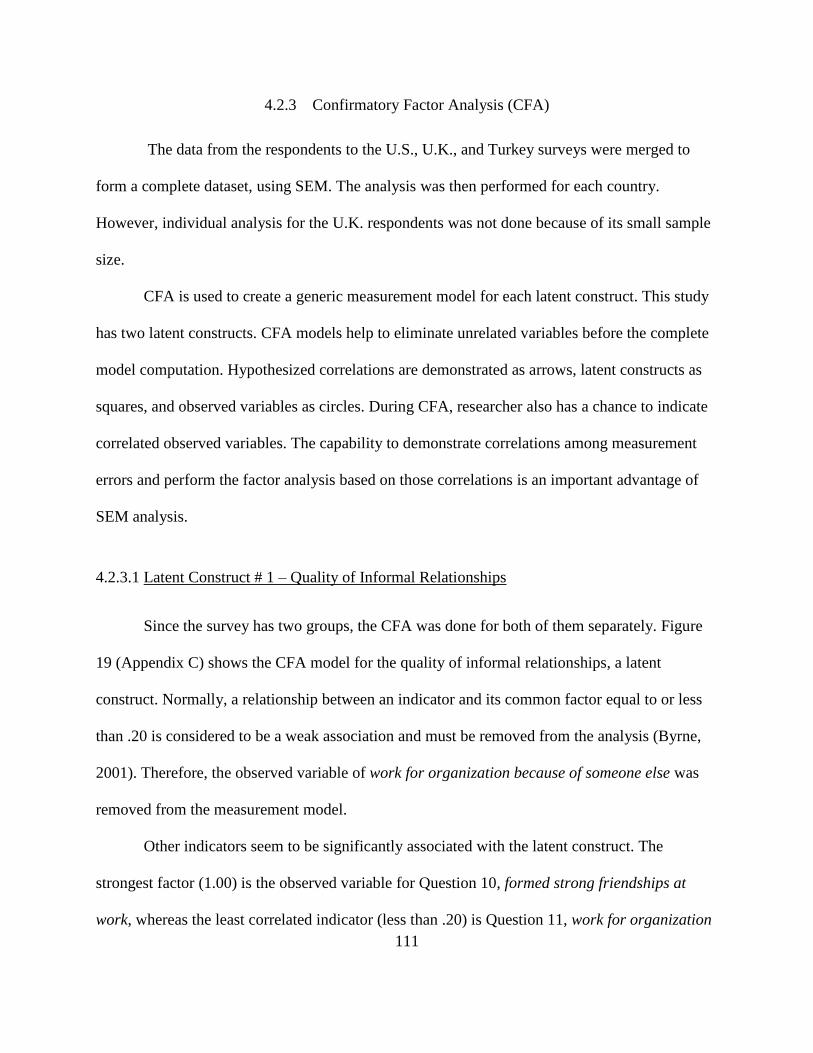
111
4.2.3 Confirmatory Factor Analysis (CFA)
The data from the respondents to the U.S., U.K., and Turkey surveys were merged to
form a complete dataset, using SEM. The analysis was then performed for each country.
However, individual analysis for the U.K. respondents was not done because of its small sample
size.
CFA is used to create a generic measurement model for each latent construct. This study
has two latent constructs. CFA models help to eliminate unrelated variables before the complete
model computation. Hypothesized correlations are demonstrated as arrows, latent constructs as
squares, and observed variables as circles. During CFA, researcher also has a chance to indicate
correlated observed variables. The capability to demonstrate correlations among measurement
errors and perform the factor analysis based on those correlations is an important advantage of
SEM analysis.
4.2.3.1 Latent Construct # 1 – Quality of Informal Relationships
Since the survey has two groups, the CFA was done for both of them separately. Figure
19 (Appendix C) shows the CFA model for the quality of informal relationships, a latent
construct. Normally, a relationship between an indicator and its common factor equal to or less
than .20 is considered to be a weak association and must be removed from the analysis (Byrne,
2001). Therefore, the observed variable of work for organization because of someone else was
removed from the measurement model.
Other indicators seem to be significantly associated with the latent construct. The
strongest factor (1.00) is the observed variable for Question 10, formed strong friendships at
work, whereas the least correlated indicator (less than .20) is Question 11, work for organization
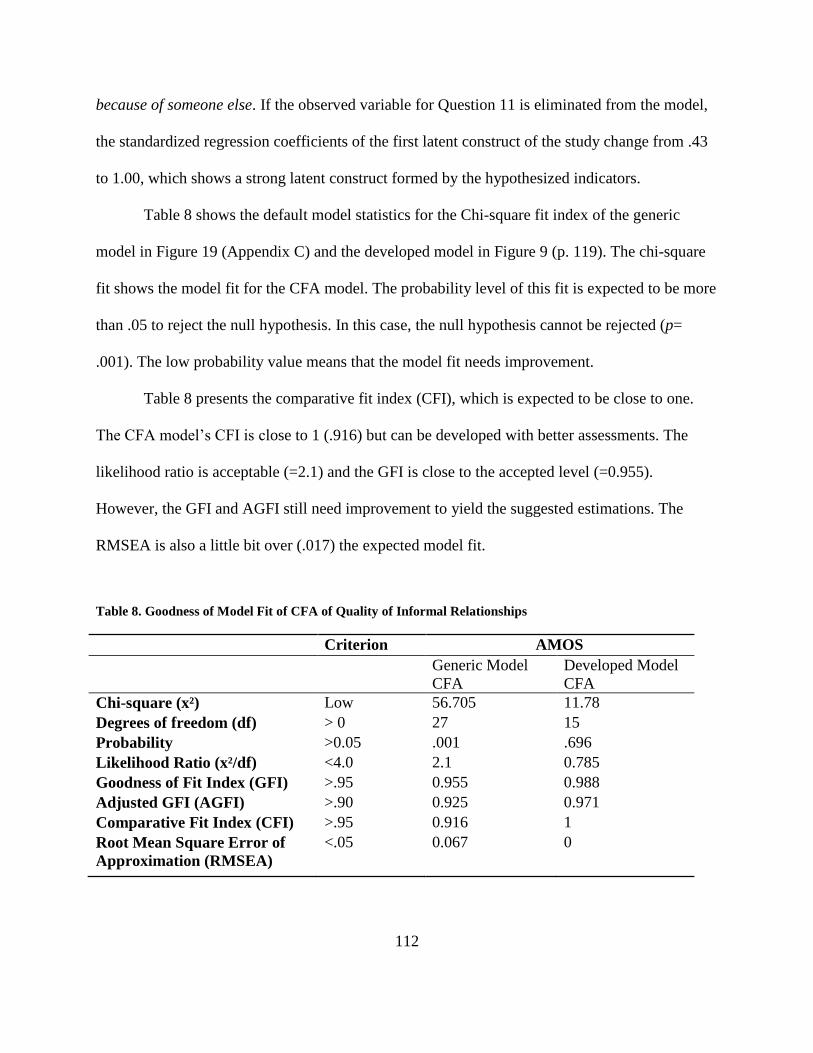
112
because of someone else. If the observed variable for Question 11 is eliminated from the model,
the standardized regression coefficients of the first latent construct of the study change from .43
to 1.00, which shows a strong latent construct formed by the hypothesized indicators.
Table 8 shows the default model statistics for the Chi-square fit index of the generic
model in Figure 19 (Appendix C) and the developed model in Figure 9 (p. 119). The chi-square
fit shows the model fit for the CFA model. The probability level of this fit is expected to be more
than .05 to reject the null hypothesis. In this case, the null hypothesis cannot be rejected (p=
.001). The low probability value means that the model fit needs improvement.
Table 8 presents the comparative fit index (CFI), which is expected to be close to one.
The CFA model‘s CFI is close to 1 (.916) but can be developed with better assessments. The
likelihood ratio is acceptable (=2.1) and the GFI is close to the accepted level (=0.955).
However, the GFI and AGFI still need improvement to yield the suggested estimations. The
RMSEA is also a little bit over (.017) the expected model fit.
Table 8. Goodness of Model Fit of CFA of Quality of Informal Relationships
Criterion AMOS
Generic Model
CFA
Developed Model
CFA
Chi-square (x²) Low 56.705 11.78
Degrees of freedom (df) > 0 27 15
Probability >0.05 .001 .696
Likelihood Ratio (x²/df) <4.0 2.1 0.785
Goodness of Fit Index (GFI) >.95 0.955 0.988
Adjusted GFI (AGFI) >.90 0.925 0.971
Comparative Fit Index (CFI) >.95 0.916 1
Root Mean Square Error of
Approximation (RMSEA)
<.05 0.067 0
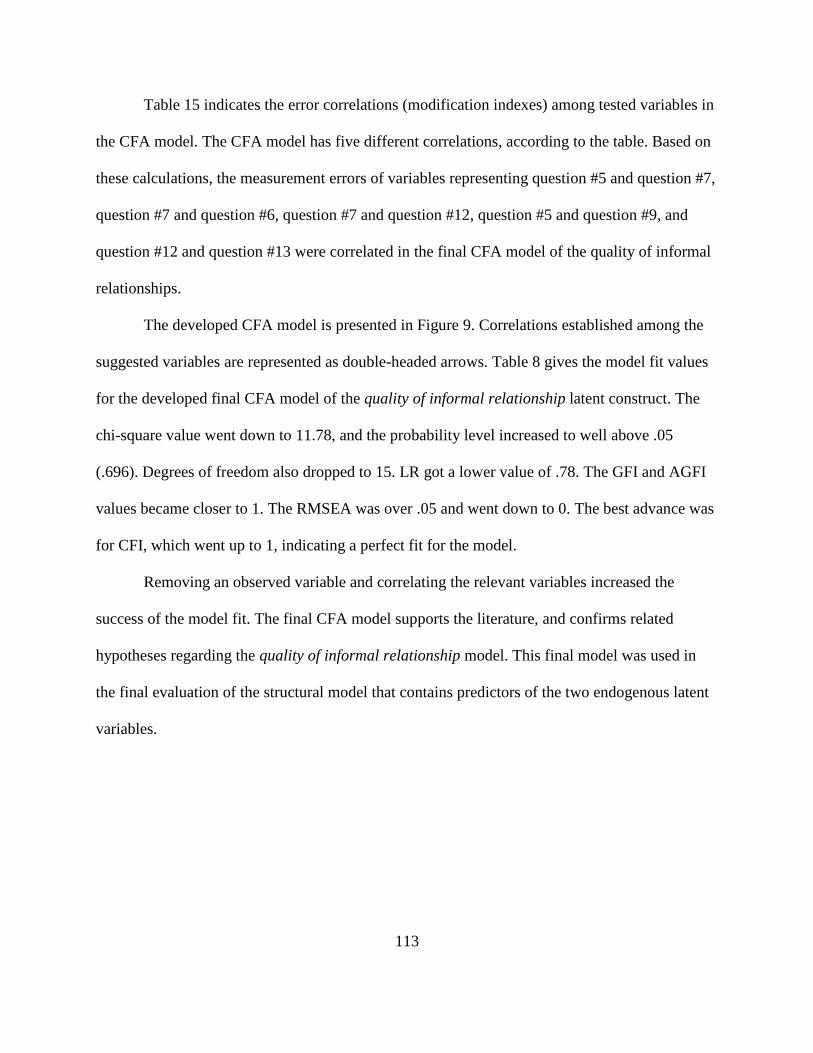
113
Table 15 indicates the error correlations (modification indexes) among tested variables in
the CFA model. The CFA model has five different correlations, according to the table. Based on
these calculations, the measurement errors of variables representing question #5 and question #7,
question #7 and question #6, question #7 and question #12, question #5 and question #9, and
question #12 and question #13 were correlated in the final CFA model of the quality of informal
relationships.
The developed CFA model is presented in Figure 9. Correlations established among the
suggested variables are represented as double-headed arrows. Table 8 gives the model fit values
for the developed final CFA model of the quality of informal relationship latent construct. The
chi-square value went down to 11.78, and the probability level increased to well above .05
(.696). Degrees of freedom also dropped to 15. LR got a lower value of .78. The GFI and AGFI
values became closer to 1. The RMSEA was over .05 and went down to 0. The best advance was
for CFI, which went up to 1, indicating a perfect fit for the model.
Removing an observed variable and correlating the relevant variables increased the
success of the model fit. The final CFA model supports the literature, and confirms related
hypotheses regarding the quality of informal relationship model. This final model was used in
the final evaluation of the structural model that contains predictors of the two endogenous latent
variables.
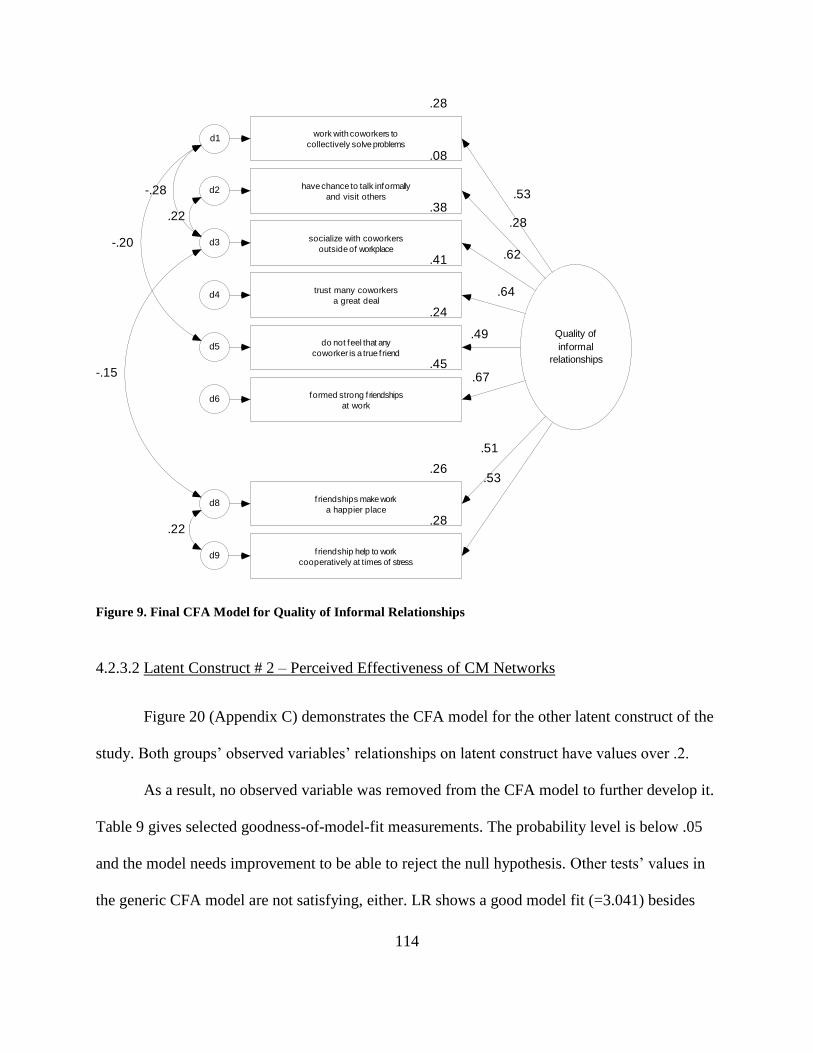
114
Quality of
informal
relationships
.28
f riendship help to work
cooperatively at times of stressd9
.53.26
f riendships make work
a happier placed8
.51
.45
formed strong f riendships
at workd6
.67
.24
do not feel that any
coworker is a true f riendd5
.49
.41
trust many coworkers
a great deald4 .64
.38
socialize with coworkers
outside of workplaced3
.62
.08
have chance to talk informally
and visit othersd2
.28
.28
work with coworkers to
collectively solve problemsd1
.53-.28
.22
.22
-.15
-.20
Figure 9. Final CFA Model for Quality of Informal Relationships
4.2.3.2 Latent Construct # 2 – Perceived Effectiveness of CM Networks
Figure 20 (Appendix C) demonstrates the CFA model for the other latent construct of the
study. Both groups‘ observed variables‘ relationships on latent construct have values over .2.
As a result, no observed variable was removed from the CFA model to further develop it.
Table 9 gives selected goodness-of-model-fit measurements. The probability level is below .05
and the model needs improvement to be able to reject the null hypothesis. Other tests‘ values in
the generic CFA model are not satisfying, either. LR shows a good model fit (=3.041) besides
115
the GFI and CFI, which are over .9 (0.914 and 0.911, respectively). However, the AGFI is not
over .9, although it is very close (=0.865). RMSEA is the other indicator that needs an
improvement; it is over the expected .05 (=0.091). Although these values do not match the
criterion values selected, it should be noted that they are still within acceptable levels.
Table 9. Goodness of Model Fit of CFA of Perceived CM Network Effectiveness
Criterion AMOS
Generic Model
CFA
Developed
Model CFA
Chi-square (x²) Low 106.422 18.366
Degrees of freedom (df) > 0 35 23
Probability >0.05 .000 .737
Likelihood Ratio (x²/df) <4.0 3.041 .799
Goodness of Fit Index (GFI) >.90 0.914 0.985
Adjusted GFI (AGFI) >.90 0.865 0.965
Comparative Fit Index (CFI) >.90 0.911 1
Root Mean Square Error of
Approximation (RMSEA)
<.05 0.091 0
Table 16 provided possible developments that can be made in the CFA model in order to
increase the probability level. In light of the suggestions in Table 16, correlations were
established with error residuals of observed variables representing question #23 and question
#24, question #23 and question #22, question #23 and question #21, question #16 and question
#24, question #23 and question #16, question #15 and question #24, question #23 and question
#15, question #22 and question #22, question #15 and question #16, question #14 and question
#22, question #14 and question #16, and question #14 and question #15.
Figure 10 presents the developed CFA model for perceived CM network effectiveness.
Some correlations have negative values, which reflect that there is a negative correlation among
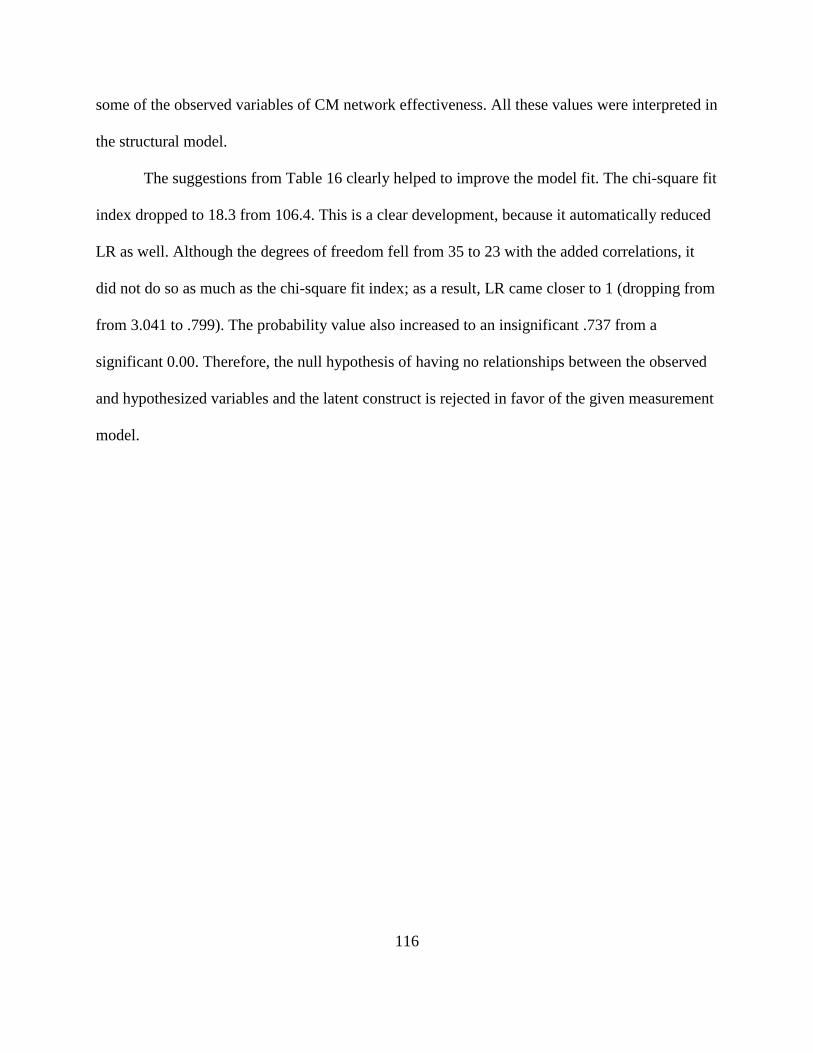
116
some of the observed variables of CM network effectiveness. All these values were interpreted in
the structural model.
The suggestions from Table 16 clearly helped to improve the model fit. The chi-square fit
index dropped to 18.3 from 106.4. This is a clear development, because it automatically reduced
LR as well. Although the degrees of freedom fell from 35 to 23 with the added correlations, it
did not do so as much as the chi-square fit index; as a result, LR came closer to 1 (dropping from
from 3.041 to .799). The probability value also increased to an insignificant .737 from a
significant 0.00. Therefore, the null hypothesis of having no relationships between the observed
and hypothesized variables and the latent construct is rejected in favor of the given measurement
model.
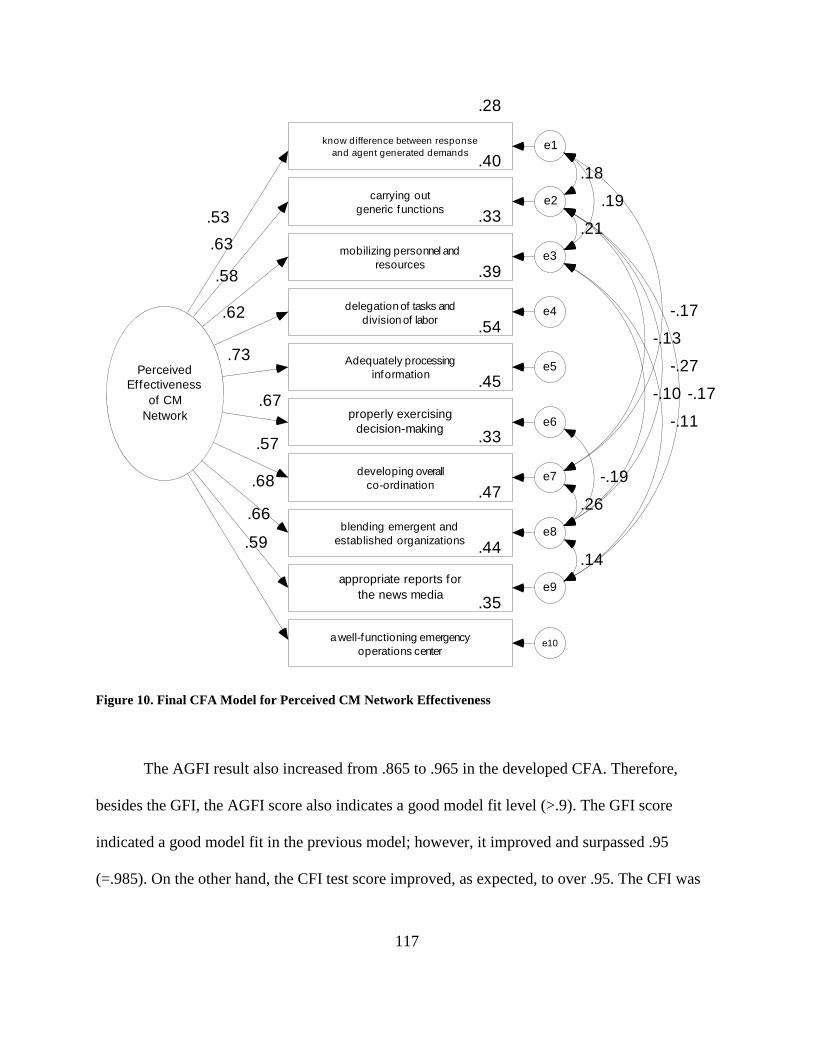
117
Perceived
Effectiveness
of CM
Network
.28
know difference between response
and agent generated demandse1
.40
carrying out
generic functionse2
.33
mobilizing personnel and
resourcese3
.39
delegation of tasks and
division of labore4
.54
Adequately processing
informatione5
.45
properly exercising
decision-makinge6
.33
developing overall
co-ordinatione7
.47
blending emergent and
established organizationse8
.44
appropriate reports for
the news mediae9
.63
.58
.62
.73
.67
.57
.68
.66
.35
a well-functioning emergency
operations centere10
.59
.53
.14
.26
-.19
-.11
-.17
-.27
-.13
.21
-.17
.19
.18
-.10
Figure 10. Final CFA Model for Perceived CM Network Effectiveness
The AGFI result also increased from .865 to .965 in the developed CFA. Therefore,
besides the GFI, the AGFI score also indicates a good model fit level (>.9). The GFI score
indicated a good model fit in the previous model; however, it improved and surpassed .95
(=.985). On the other hand, the CFI test score improved, as expected, to over .95. The CFI was
118
.91 in the primitive CFA model and went up to 1 in the developed final CFA model. The
RMSEA made an improvement and fell down to 0.0 from an unacceptable .091.
4.2.4 The Main Model
The main model is created by combining two latent construct CFAs and the previously
proposed predictor variables. The developed models of the CFAs were added to the structural
model; therefore, removed variables and correlated observations were inherited in the final
model. In Figure 2, a model was suggested with 23 observed and 2 latent variables. However,
one observed variable from the Quality of Informal Relationship latent construct was omitted
from the test. Figure 21(Appendix C) represents the generic structural model.
The structured model includes 22 observed and 2 latent constructs. Correlations are
imported from the discussed developed CFA models. All correlations from the observed
variables to the latent constructs are positive. On the other hand, it is apparent that some of the
correlations among some error residuals of the observed variables have negative values,
indicating that some of the observed variables are negatively correlated with each other.
Before interpreting individual regression scores, goodness of model fit was examined. As
it was conducted in measurement models, if needed, the model would be revised and developed
to fit.
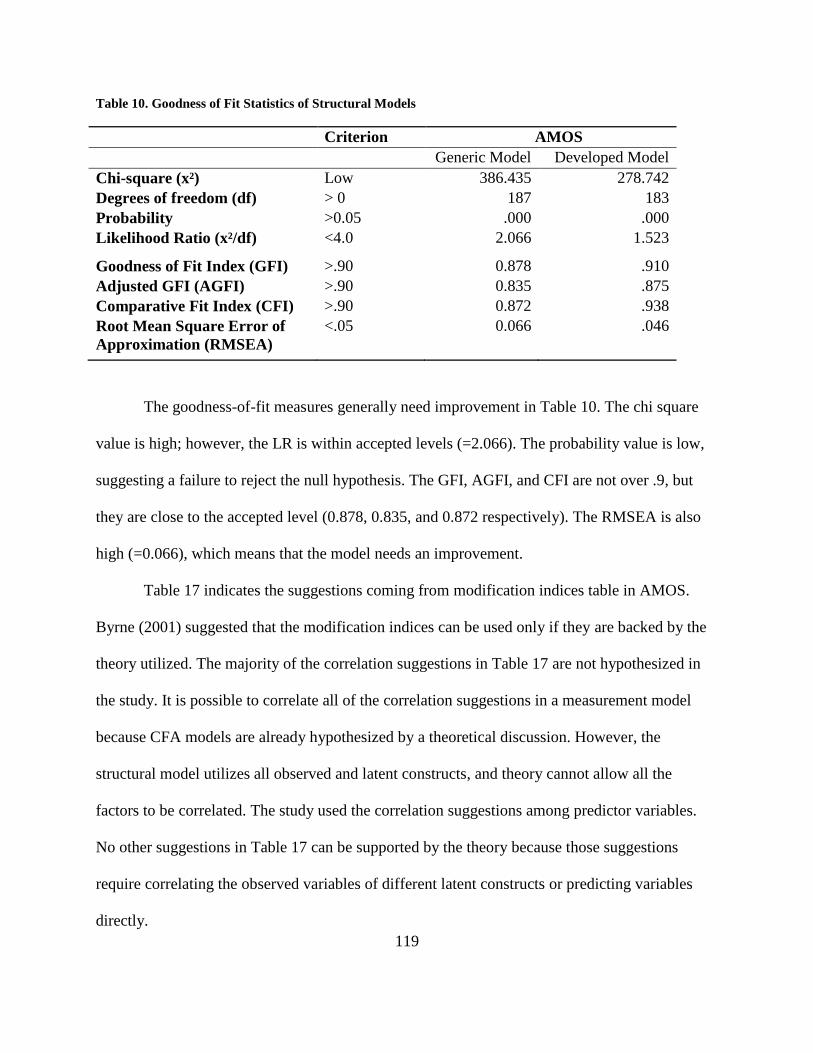
119
Table 10. Goodness of Fit Statistics of Structural Models
Criterion AMOS
Generic Model Developed Model
Chi-square (x²) Low 386.435 278.742
Degrees of freedom (df) > 0 187 183
Probability >0.05 .000 .000
Likelihood Ratio (x²/df) <4.0 2.066 1.523
Goodness of Fit Index (GFI) >.90 0.878 .910
Adjusted GFI (AGFI) >.90 0.835 .875
Comparative Fit Index (CFI) >.90 0.872 .938
Root Mean Square Error of
Approximation (RMSEA)
<.05 0.066 .046
The goodness-of-fit measures generally need improvement in Table 10. The chi square
value is high; however, the LR is within accepted levels (=2.066). The probability value is low,
suggesting a failure to reject the null hypothesis. The GFI, AGFI, and CFI are not over .9, but
they are close to the accepted level (0.878, 0.835, and 0.872 respectively). The RMSEA is also
high (=0.066), which means that the model needs an improvement.
Table 17 indicates the suggestions coming from modification indices table in AMOS.
Byrne (2001) suggested that the modification indices can be used only if they are backed by the
theory utilized. The majority of the correlation suggestions in Table 17 are not hypothesized in
the study. It is possible to correlate all of the correlation suggestions in a measurement model
because CFA models are already hypothesized by a theoretical discussion. However, the
structural model utilizes all observed and latent constructs, and theory cannot allow all the
factors to be correlated. The study used the correlation suggestions among predictor variables.
No other suggestions in Table 17 can be supported by the theory because those suggestions
require correlating the observed variables of different latent constructs or predicting variables
directly.
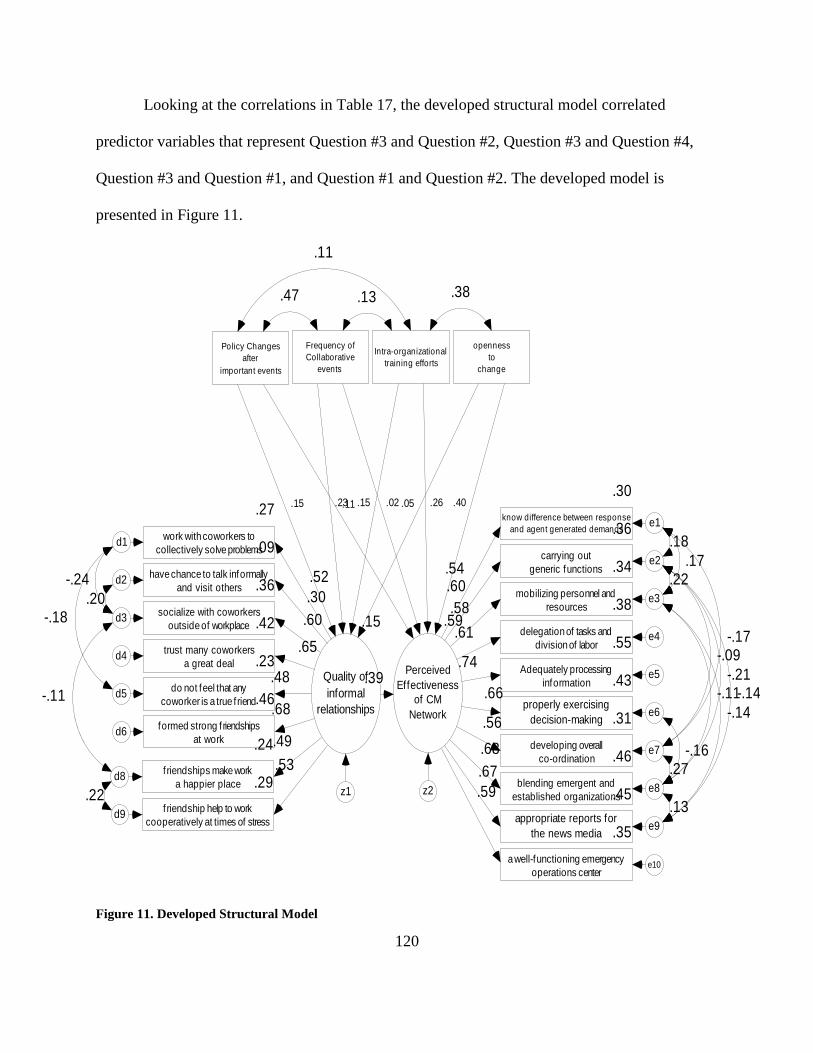
120
Looking at the correlations in Table 17, the developed structural model correlated
predictor variables that represent Question #3 and Question #2, Question #3 and Question #4,
Question #3 and Question #1, and Question #1 and Question #2. The developed model is
presented in Figure 11.
.15
Quality of
informal
relationships
.29
f riendship help to work
cooperatively at times of stressd9
.53
.24
f riendships make work
a happier placed8
.49
.46
formed strong f riendships
at workd6
.68
.23
do not feel that any
coworker is a true f riendd5
.48
.42
trust many coworkers
a great deald4
.65
.36
socialize with coworkers
outside of workplaced3 .60
.09
have chance to talk informally
and visit othersd2
.30
.27
work with coworkers to
collectively solve problemsd1
.52
.59
Perceived
Effectiveness
of CM
Network
.30
know difference between response
and agent generated demandse1
.36
carrying out
generic functionse2
.34
mobilizing personnel and
resourcese3
.38
delegation of tasks and
division of labore4
.55
Adequately processing
informatione5
.43
properly exercising
decision-makinge6
.31
developing overall
co-ordinatione7
.46
blending emergent and
established organizationse8
.45
appropriate reports for
the news mediae9
.60
.58
.61
.74
.66
.56
.68
.67
.35
a well-functioning emergency
operations centere10
.59
.54
Policy Changes
after
important events
Frequency of
Collaborative
events
Intra-organizational
training efforts
openness
to
change
.15 .11.23 .02 .26.15 .05 .40
.39
z1 z2
.18
.22.17
-.17-.09
-.21-.14-.11
-.14
-.16.27
.13
.20
-.24
-.18
-.11
.22
.47
.11
.13 .38
Figure 11. Developed Structural Model
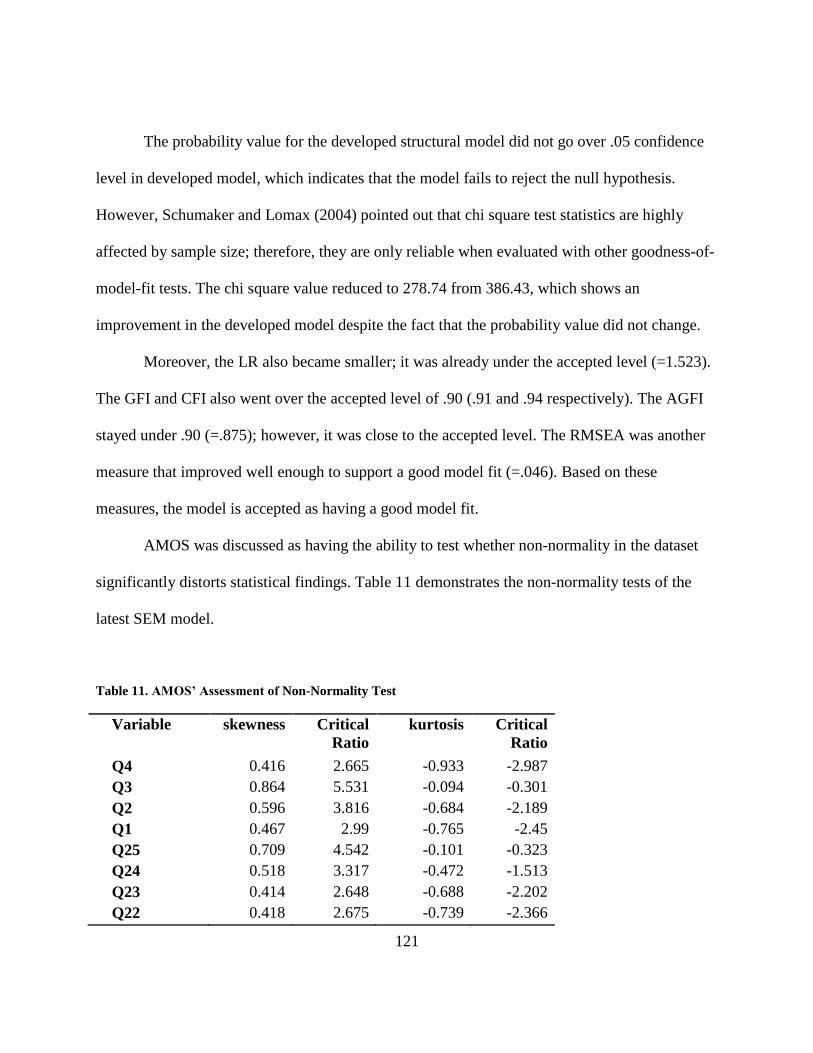
121
The probability value for the developed structural model did not go over .05 confidence
level in developed model, which indicates that the model fails to reject the null hypothesis.
However, Schumaker and Lomax (2004) pointed out that chi square test statistics are highly
affected by sample size; therefore, they are only reliable when evaluated with other goodness-of-
model-fit tests. The chi square value reduced to 278.74 from 386.43, which shows an
improvement in the developed model despite the fact that the probability value did not change.
Moreover, the LR also became smaller; it was already under the accepted level (=1.523).
The GFI and CFI also went over the accepted level of .90 (.91 and .94 respectively). The AGFI
stayed under .90 (=.875); however, it was close to the accepted level. The RMSEA was another
measure that improved well enough to support a good model fit (=.046). Based on these
measures, the model is accepted as having a good model fit.
AMOS was discussed as having the ability to test whether non-normality in the dataset
significantly distorts statistical findings. Table 11 demonstrates the non-normality tests of the
latest SEM model.
Table 11. AMOS’ Assessment of Non-Normality Test
Variable skewness Critical
Ratio
kurtosis Critical
Ratio
Q4 0.416 2.665 -0.933 -2.987
Q3 0.864 5.531 -0.094 -0.301
Q2 0.596 3.816 -0.684 -2.189
Q1 0.467 2.99 -0.765 -2.45
Q25 0.709 4.542 -0.101 -0.323
Q24 0.518 3.317 -0.472 -1.513
Q23 0.414 2.648 -0.688 -2.202
Q22 0.418 2.675 -0.739 -2.366
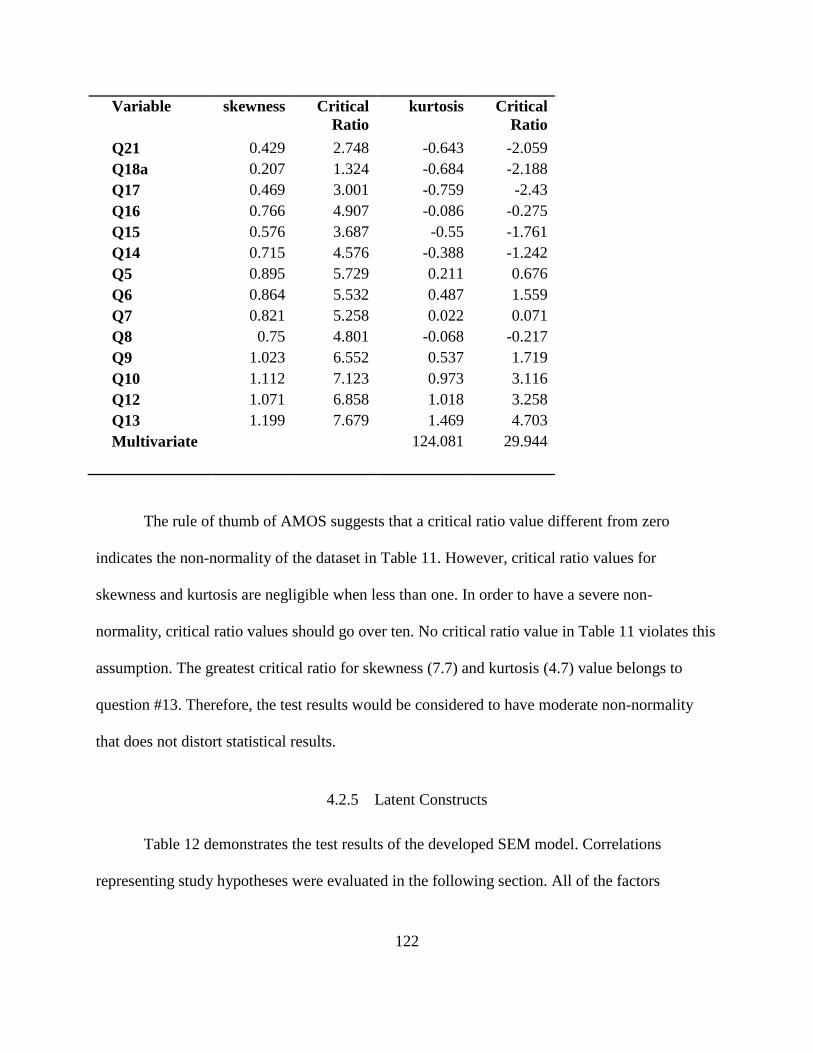
122
Variable skewness Critical
Ratio
kurtosis Critical
Ratio
Q21 0.429 2.748 -0.643 -2.059
Q18a 0.207 1.324 -0.684 -2.188
Q17 0.469 3.001 -0.759 -2.43
Q16 0.766 4.907 -0.086 -0.275
Q15 0.576 3.687 -0.55 -1.761
Q14 0.715 4.576 -0.388 -1.242
Q5 0.895 5.729 0.211 0.676
Q6 0.864 5.532 0.487 1.559
Q7 0.821 5.258 0.022 0.071
Q8 0.75 4.801 -0.068 -0.217
Q9 1.023 6.552 0.537 1.719
Q10 1.112 7.123 0.973 3.116
Q12 1.071 6.858 1.018 3.258
Q13 1.199 7.679 1.469 4.703
Multivariate 124.081 29.944
The rule of thumb of AMOS suggests that a critical ratio value different from zero
indicates the non-normality of the dataset in Table 11. However, critical ratio values for
skewness and kurtosis are negligible when less than one. In order to have a severe non-
normality, critical ratio values should go over ten. No critical ratio value in Table 11 violates this
assumption. The greatest critical ratio for skewness (7.7) and kurtosis (4.7) value belongs to
question #13. Therefore, the test results would be considered to have moderate non-normality
that does not distort statistical results.
4.2.5 Latent Constructs
Table 12 demonstrates the test results of the developed SEM model. Correlations
representing study hypotheses were evaluated in the following section. All of the factors
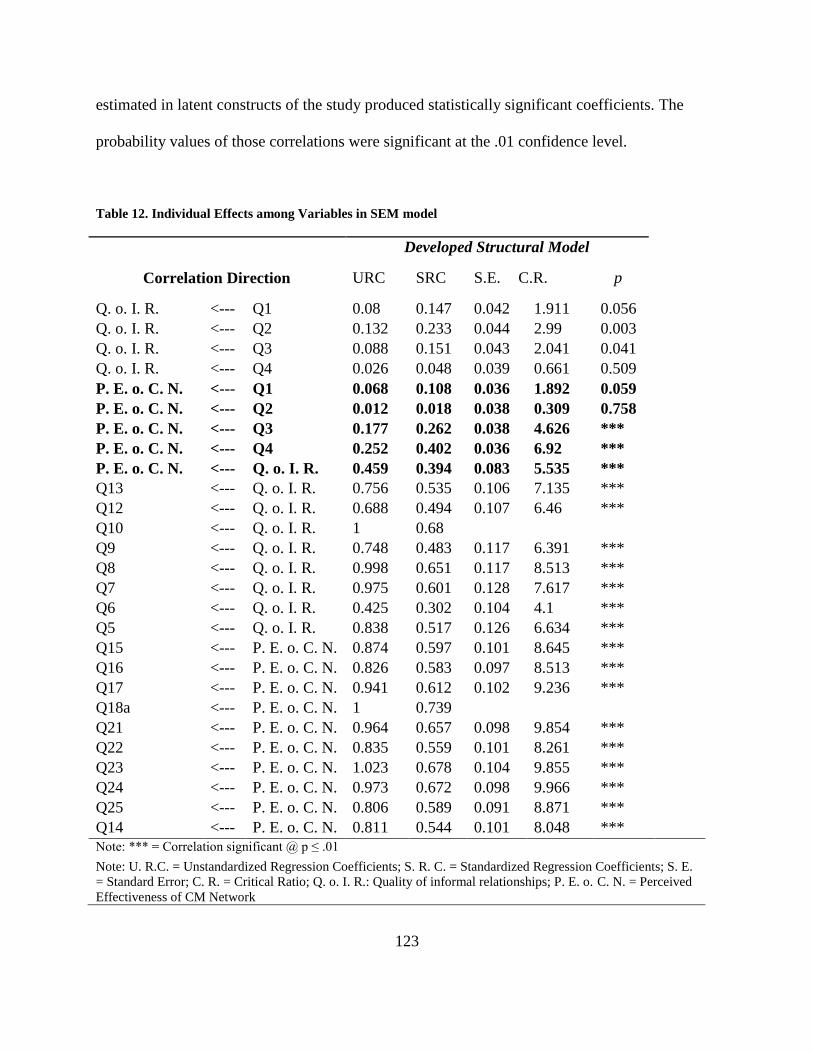
123
estimated in latent constructs of the study produced statistically significant coefficients. The
probability values of those correlations were significant at the .01 confidence level.
Table 12. Individual Effects among Variables in SEM model
Developed Structural Model
Correlation Direction URC SRC S.E. C.R. p
Q. o. I. R. <--- Q1 0.08 0.147 0.042 1.911 0.056
Q. o. I. R. <--- Q2 0.132 0.233 0.044 2.99 0.003
Q. o. I. R. <--- Q3 0.088 0.151 0.043 2.041 0.041
Q. o. I. R. <--- Q4 0.026 0.048 0.039 0.661 0.509
P. E. o. C. N. <--- Q1 0.068 0.108 0.036 1.892 0.059
P. E. o. C. N. <--- Q2 0.012 0.018 0.038 0.309 0.758
P. E. o. C. N. <--- Q3 0.177 0.262 0.038 4.626 ***
P. E. o. C. N. <--- Q4 0.252 0.402 0.036 6.92 ***
P. E. o. C. N. <--- Q. o. I. R. 0.459 0.394 0.083 5.535 ***
Q13 <--- Q. o. I. R. 0.756 0.535 0.106 7.135 ***
Q12 <--- Q. o. I. R. 0.688 0.494 0.107 6.46 ***
Q10 <--- Q. o. I. R. 1 0.68
Q9 <--- Q. o. I. R. 0.748 0.483 0.117 6.391 ***
Q8 <--- Q. o. I. R. 0.998 0.651 0.117 8.513 ***
Q7 <--- Q. o. I. R. 0.975 0.601 0.128 7.617 ***
Q6 <--- Q. o. I. R. 0.425 0.302 0.104 4.1 ***
Q5 <--- Q. o. I. R. 0.838 0.517 0.126 6.634 ***
Q15 <--- P. E. o. C. N. 0.874 0.597 0.101 8.645 ***
Q16 <--- P. E. o. C. N. 0.826 0.583 0.097 8.513 ***
Q17 <--- P. E. o. C. N. 0.941 0.612 0.102 9.236 ***
Q18a <--- P. E. o. C. N. 1 0.739
Q21 <--- P. E. o. C. N. 0.964 0.657 0.098 9.854 ***
Q22 <--- P. E. o. C. N. 0.835 0.559 0.101 8.261 ***
Q23 <--- P. E. o. C. N. 1.023 0.678 0.104 9.855 ***
Q24 <--- P. E. o. C. N. 0.973 0.672 0.098 9.966 ***
Q25 <--- P. E. o. C. N. 0.806 0.589 0.091 8.871 ***
Q14 <--- P. E. o. C. N. 0.811 0.544 0.101 8.048 ***
Note: *** = Correlation significant @ p ≤ .01
Note: U. R.C. = Unstandardized Regression Coefficients; S. R. C. = Standardized Regression Coefficients; S. E.
= Standard Error; C. R. = Critical Ratio; Q. o. I. R.: Quality of informal relationships; P. E. o. C. N. = Perceived
Effectiveness of CM Network
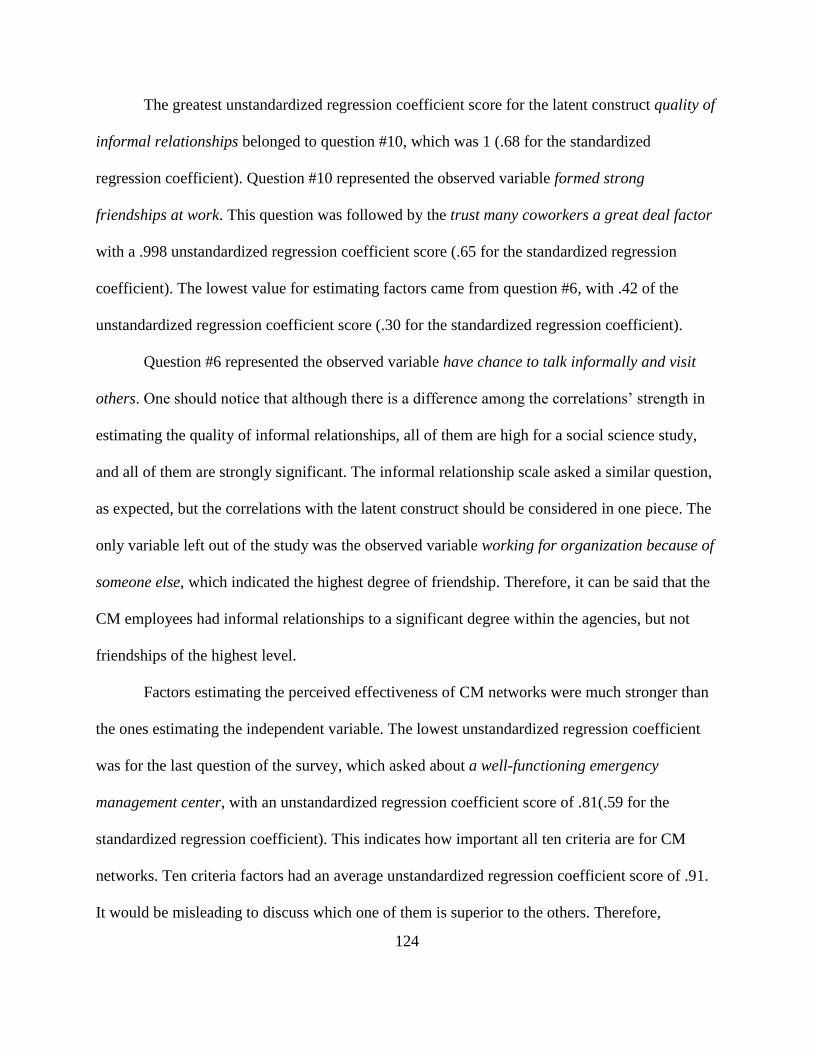
124
The greatest unstandardized regression coefficient score for the latent construct quality of
informal relationships belonged to question #10, which was 1 (.68 for the standardized
regression coefficient). Question #10 represented the observed variable formed strong
friendships at work. This question was followed by the trust many coworkers a great deal factor
with a .998 unstandardized regression coefficient score (.65 for the standardized regression
coefficient). The lowest value for estimating factors came from question #6, with .42 of the
unstandardized regression coefficient score (.30 for the standardized regression coefficient).
Question #6 represented the observed variable have chance to talk informally and visit
others. One should notice that although there is a difference among the correlations‘ strength in
estimating the quality of informal relationships, all of them are high for a social science study,
and all of them are strongly significant. The informal relationship scale asked a similar question,
as expected, but the correlations with the latent construct should be considered in one piece. The
only variable left out of the study was the observed variable working for organization because of
someone else, which indicated the highest degree of friendship. Therefore, it can be said that the
CM employees had informal relationships to a significant degree within the agencies, but not
friendships of the highest level.
Factors estimating the perceived effectiveness of CM networks were much stronger than
the ones estimating the independent variable. The lowest unstandardized regression coefficient
was for the last question of the survey, which asked about a well-functioning emergency
management center, with an unstandardized regression coefficient score of .81(.59 for the
standardized regression coefficient). This indicates how important all ten criteria are for CM
networks. Ten criteria factors had an average unstandardized regression coefficient score of .91.
It would be misleading to discuss which one of them is superior to the others. Therefore,
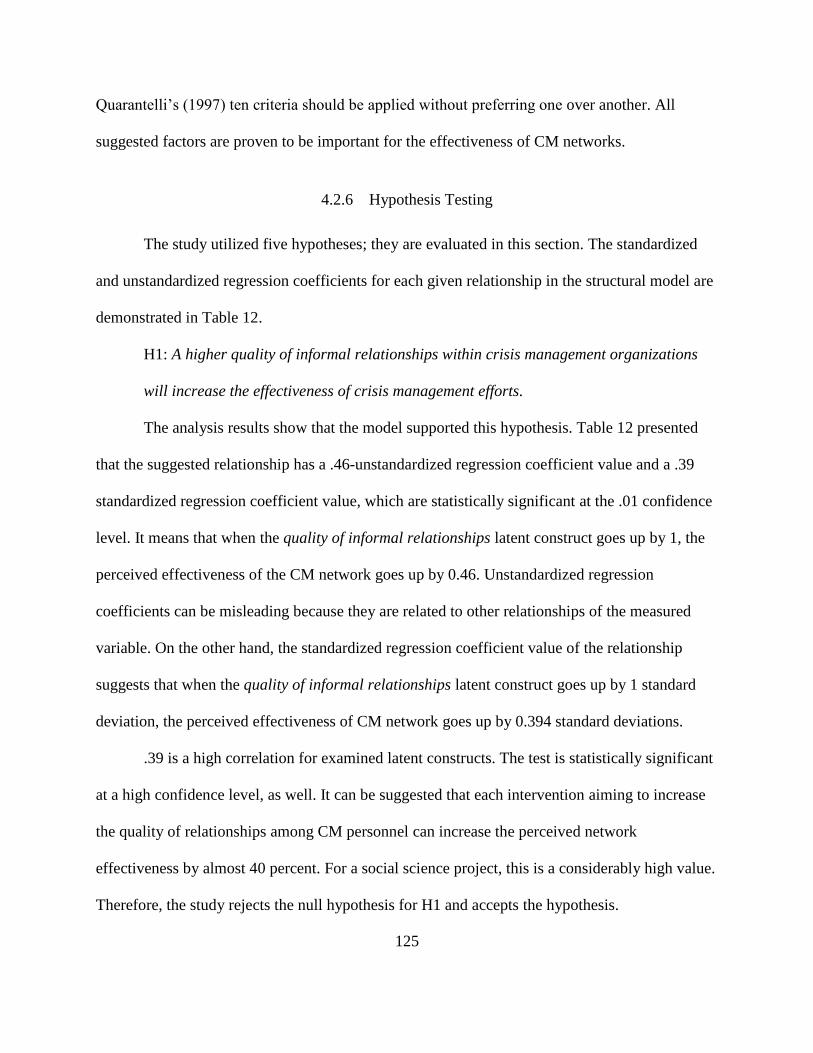
125
Quarantelli‘s (1997) ten criteria should be applied without preferring one over another. All
suggested factors are proven to be important for the effectiveness of CM networks.
4.2.6 Hypothesis Testing
The study utilized five hypotheses; they are evaluated in this section. The standardized
and unstandardized regression coefficients for each given relationship in the structural model are
demonstrated in Table 12.
H1: A higher quality of informal relationships within crisis management organizations
will increase the effectiveness of crisis management efforts.
The analysis results show that the model supported this hypothesis. Table 12 presented
that the suggested relationship has a .46-unstandardized regression coefficient value and a .39
standardized regression coefficient value, which are statistically significant at the .01 confidence
level. It means that when the quality of informal relationships latent construct goes up by 1, the
perceived effectiveness of the CM network goes up by 0.46. Unstandardized regression
coefficients can be misleading because they are related to other relationships of the measured
variable. On the other hand, the standardized regression coefficient value of the relationship
suggests that when the quality of informal relationships latent construct goes up by 1 standard
deviation, the perceived effectiveness of CM network goes up by 0.394 standard deviations.
.39 is a high correlation for examined latent constructs. The test is statistically significant
at a high confidence level, as well. It can be suggested that each intervention aiming to increase
the quality of relationships among CM personnel can increase the perceived network
effectiveness by almost 40 percent. For a social science project, this is a considerably high value.
Therefore, the study rejects the null hypothesis for H1 and accepts the hypothesis.
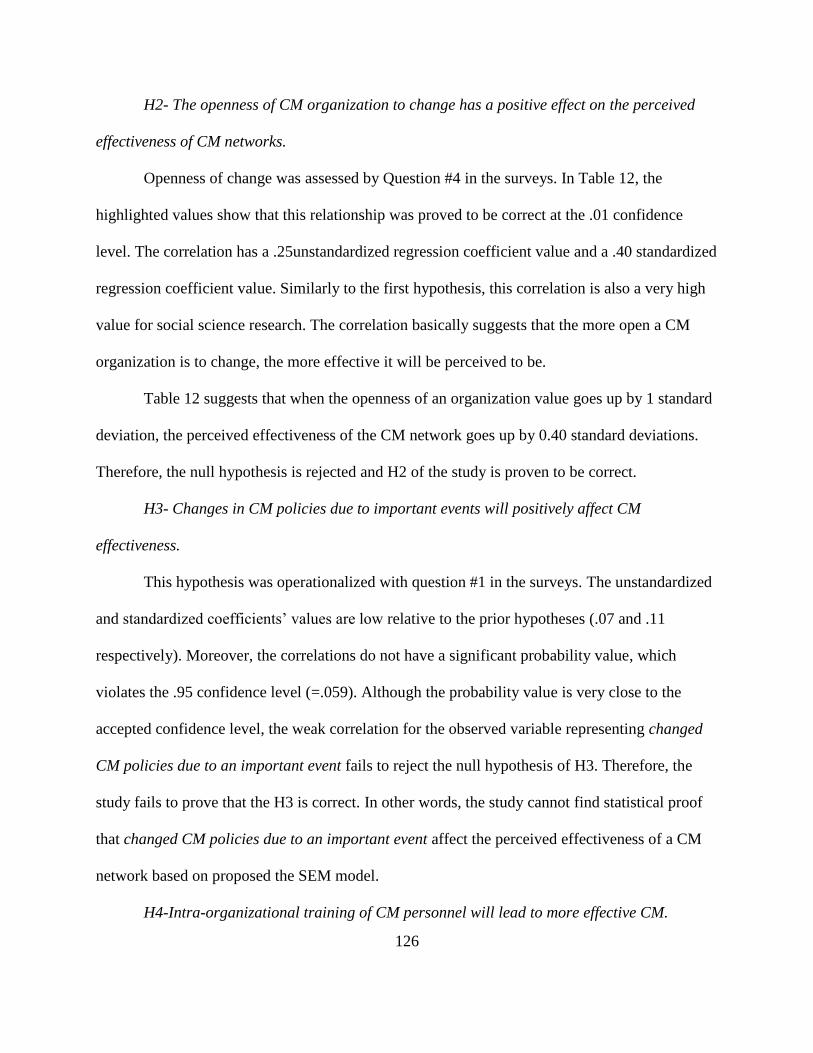
126
H2- The openness of CM organization to change has a positive effect on the perceived
effectiveness of CM networks.
Openness of change was assessed by Question #4 in the surveys. In Table 12, the
highlighted values show that this relationship was proved to be correct at the .01 confidence
level. The correlation has a .25unstandardized regression coefficient value and a .40 standardized
regression coefficient value. Similarly to the first hypothesis, this correlation is also a very high
value for social science research. The correlation basically suggests that the more open a CM
organization is to change, the more effective it will be perceived to be.
Table 12 suggests that when the openness of an organization value goes up by 1 standard
deviation, the perceived effectiveness of the CM network goes up by 0.40 standard deviations.
Therefore, the null hypothesis is rejected and H2 of the study is proven to be correct.
H3- Changes in CM policies due to important events will positively affect CM
effectiveness.
This hypothesis was operationalized with question #1 in the surveys. The unstandardized
and standardized coefficients‘ values are low relative to the prior hypotheses (.07 and .11
respectively). Moreover, the correlations do not have a significant probability value, which
violates the .95 confidence level (=.059). Although the probability value is very close to the
accepted confidence level, the weak correlation for the observed variable representing changed
CM policies due to an important event fails to reject the null hypothesis of H3. Therefore, the
study fails to prove that the H3 is correct. In other words, the study cannot find statistical proof
that changed CM policies due to an important event affect the perceived effectiveness of a CM
network based on proposed the SEM model.
H4-Intra-organizational training of CM personnel will lead to more effective CM.
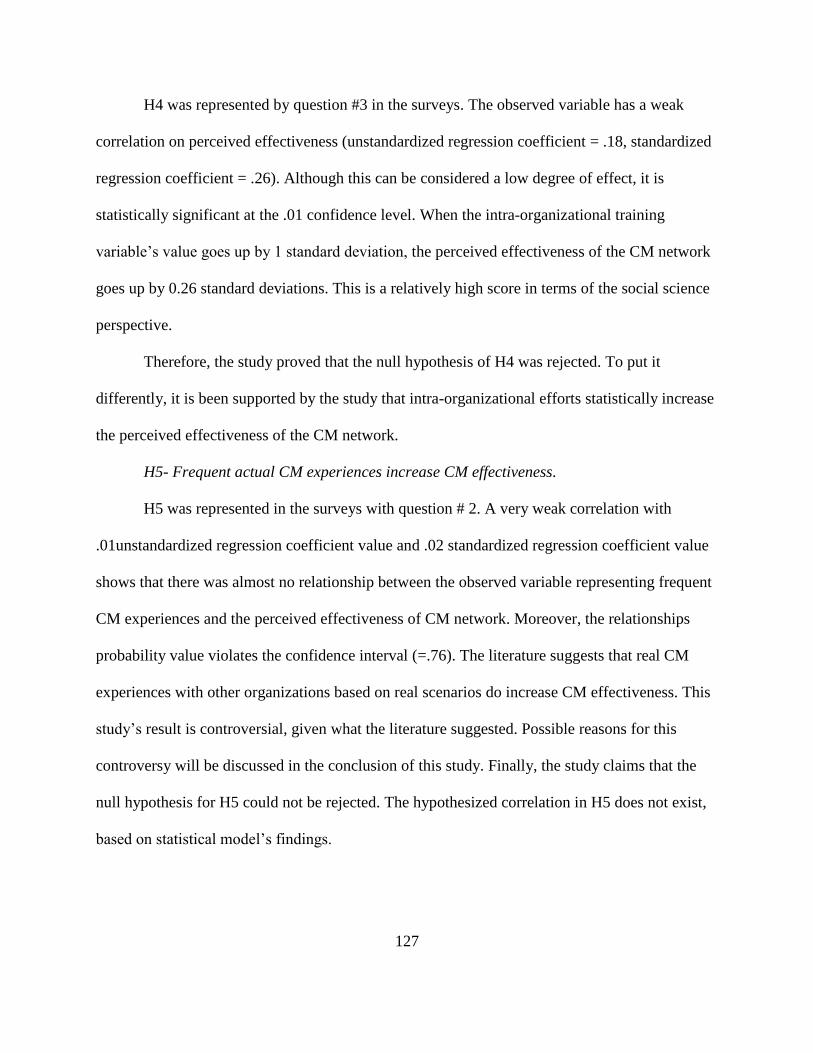
127
H4 was represented by question #3 in the surveys. The observed variable has a weak
correlation on perceived effectiveness (unstandardized regression coefficient = .18, standardized
regression coefficient = .26). Although this can be considered a low degree of effect, it is
statistically significant at the .01 confidence level. When the intra-organizational training
variable‘s value goes up by 1 standard deviation, the perceived effectiveness of the CM network
goes up by 0.26 standard deviations. This is a relatively high score in terms of the social science
perspective.
Therefore, the study proved that the null hypothesis of H4 was rejected. To put it
differently, it is been supported by the study that intra-organizational efforts statistically increase
the perceived effectiveness of the CM network.
H5- Frequent actual CM experiences increase CM effectiveness.
H5 was represented in the surveys with question # 2. A very weak correlation with
.01unstandardized regression coefficient value and .02 standardized regression coefficient value
shows that there was almost no relationship between the observed variable representing frequent
CM experiences and the perceived effectiveness of CM network. Moreover, the relationships
probability value violates the confidence interval (=.76). The literature suggests that real CM
experiences with other organizations based on real scenarios do increase CM effectiveness. This
study‘s result is controversial, given what the literature suggested. Possible reasons for this
controversy will be discussed in the conclusion of this study. Finally, the study claims that the
null hypothesis for H5 could not be rejected. The hypothesized correlation in H5 does not exist,
based on statistical model‘s findings.
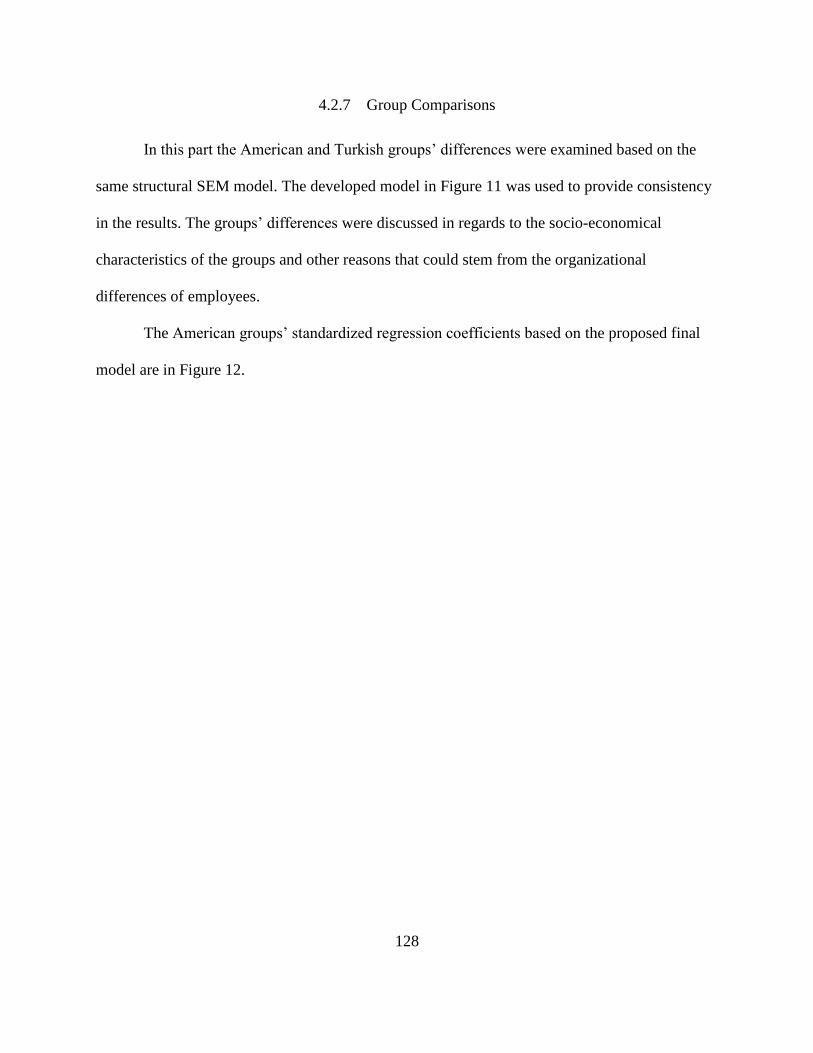
128
4.2.7 Group Comparisons
In this part the American and Turkish groups‘ differences were examined based on the
same structural SEM model. The developed model in Figure 11 was used to provide consistency
in the results. The groups‘ differences were discussed in regards to the socio-economical
characteristics of the groups and other reasons that could stem from the organizational
differences of employees.
The American groups‘ standardized regression coefficients based on the proposed final
model are in Figure 12.
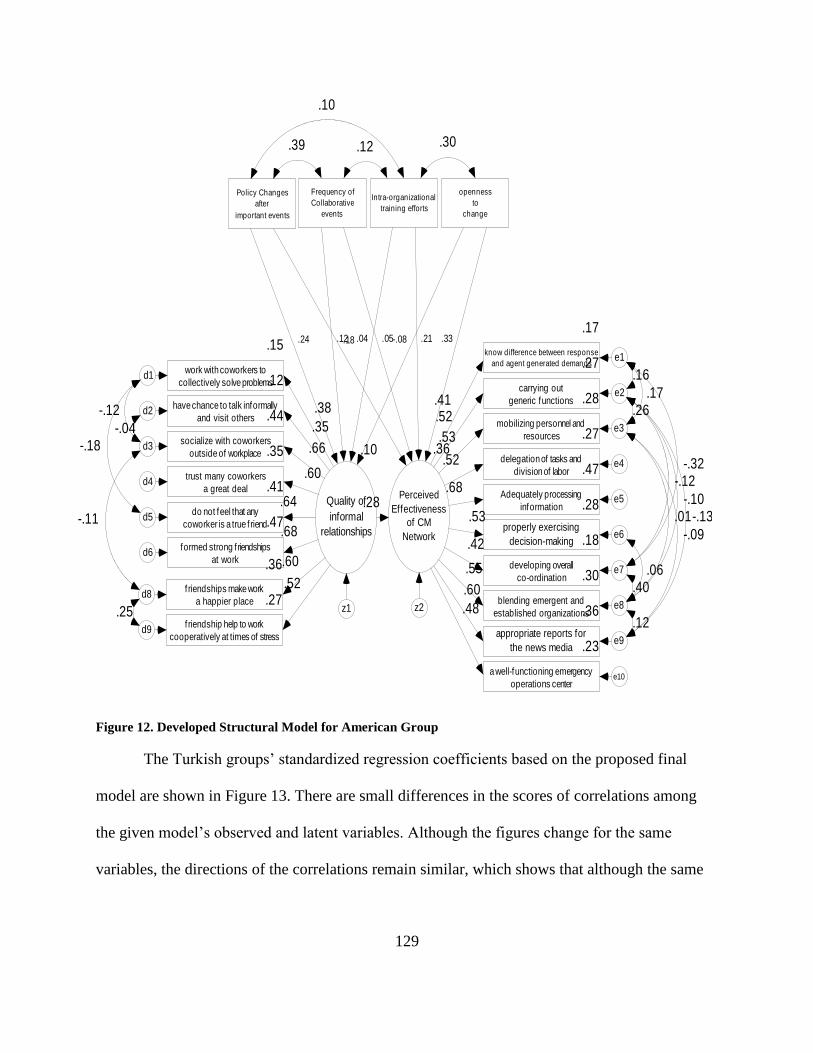
129
.10
Quality of
informal
relationships
.27
f riendship help to work
cooperatively at times of stressd9
.52
.36
f riendships make work
a happier placed8
.60
.47
formed strong f riendships
at workd6
.68
.41
do not feel that any
coworker is a true f riendd5
.64
.35
trust many coworkers
a great deald4
.60
.44
socialize with coworkers
outside of workplaced3 .66
.12
have chance to talk informally
and visit othersd2
.35
.15
work with coworkers to
collectively solve problemsd1
.38
.36
Perceived
Effectiveness
of CM
Network
.17
know difference between response
and agent generated demandse1
.27
carrying out
generic functionse2
.28
mobilizing personnel and
resourcese3
.27
delegation of tasks and
division of labore4
.47
Adequately processing
informatione5
.28
properly exercising
decision-makinge6
.18
developing overall
co-ordinatione7
.30
blending emergent and
established organizationse8
.36
appropriate reports for
the news mediae9
.52
.53
.52
.68
.53
.42
.55
.60
.23
a well-functioning emergency
operations centere10
.48
.41
Policy Changes
after
important events
Frequency of
Collaborative
events
Intra-organizational
training efforts
openness
to
change
.24 .18.12 .05 .21.04 -.08 .33
.28
z1 z2
.16
.26.17
-.32-.12
-.10-.13.01
-.09
.06.40
.12
-.04
-.12
-.18
-.11
.25
.39
.10
.12 .30
Figure 12. Developed Structural Model for American Group
The Turkish groups‘ standardized regression coefficients based on the proposed final
model are shown in Figure 13. There are small differences in the scores of correlations among
the given model‘s observed and latent variables. Although the figures change for the same
variables, the directions of the correlations remain similar, which shows that although the same

130
factors affected related variables differently in weight, the correlations were in the same
direction.
.32
Quality of
informal
relationships
.28
f riendship help to work
cooperatively at times of stressd9
.53
.14
f riendships make work
a happier placed8
.38
.43
formed strong f riendships
at workd6
.66
.21
do not feel that any
coworker is a true f riendd5
.46
.48
trust many coworkers
a great deald4
.69
.26
socialize with coworkers
outside of workplaced3 .51
.07
have chance to talk informally
and visit othersd2
.27
.35
work with coworkers to
collectively solve problemsd1
.59
.73
Perceived
Effectiveness
of CM
Network
.42
know difference between response
and agent generated demandse1
.55
carrying out
generic functionse2
.46
mobilizing personnel and
resourcese3
.37
delegation of tasks and
division of labore4
.58
Adequately processing
informatione5
.49
properly exercising
decision-makinge6
.44
developing overall
co-ordinatione7
.50
blending emergent and
established organizationse8
.48
appropriate reports for
the news mediae9
.74
.67
.61
.76
.70
.66
.71
.69
.46
a well-functioning emergency
operations centere10
.68
.65
Policy Changes
after
important events
Frequency of
Collaborative
events
Intra-organizational
training efforts
openness
to
change
.03 .06.32 -.01 .26.26 .24 .26
.56
z1 z2
.14
-.04.11
-.04-.17
-.39-.18-.20
-.17
-.41.13
.21
.42
-.24
-.15
-.09
.28
.52
.16
.23 .34
Figure 13. Developed Structural Model for Turkish Group
The small sample size affected the goodness of fit of the group models. Table 13
represents various goodness-of-fit statistics belonging to the group-based model and developed
final model.
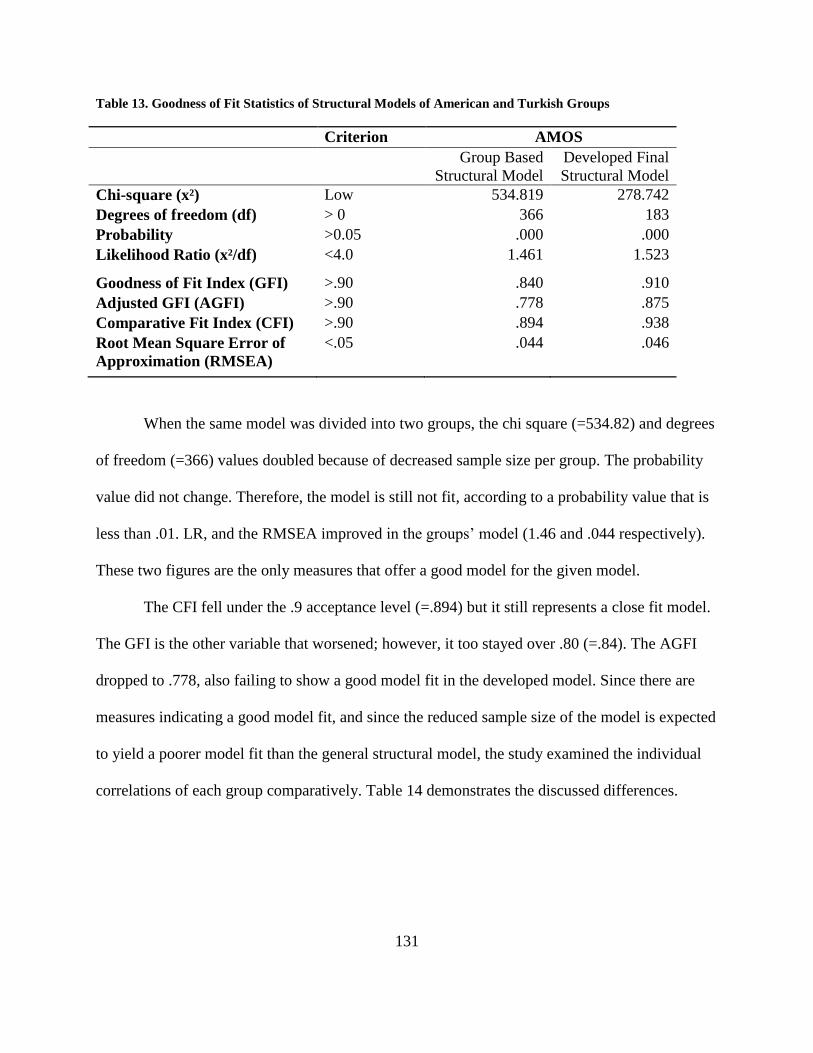
131
Table 13. Goodness of Fit Statistics of Structural Models of American and Turkish Groups
Criterion AMOS
Group Based
Structural Model
Developed Final
Structural Model
Chi-square (x²) Low 534.819 278.742
Degrees of freedom (df) > 0 366 183
Probability >0.05 .000 .000
Likelihood Ratio (x²/df) <4.0 1.461 1.523
Goodness of Fit Index (GFI) >.90 .840 .910
Adjusted GFI (AGFI) >.90 .778 .875
Comparative Fit Index (CFI) >.90 .894 .938
Root Mean Square Error of
Approximation (RMSEA)
<.05 .044 .046
When the same model was divided into two groups, the chi square (=534.82) and degrees
of freedom (=366) values doubled because of decreased sample size per group. The probability
value did not change. Therefore, the model is still not fit, according to a probability value that is
less than .01. LR, and the RMSEA improved in the groups‘ model (1.46 and .044 respectively).
These two figures are the only measures that offer a good model for the given model.
The CFI fell under the .9 acceptance level (=.894) but it still represents a close fit model.
The GFI is the other variable that worsened; however, it too stayed over .80 (=.84). The AGFI
dropped to .778, also failing to show a good model fit in the developed model. Since there are
measures indicating a good model fit, and since the reduced sample size of the model is expected
to yield a poorer model fit than the general structural model, the study examined the individual
correlations of each group comparatively. Table 14 demonstrates the discussed differences.
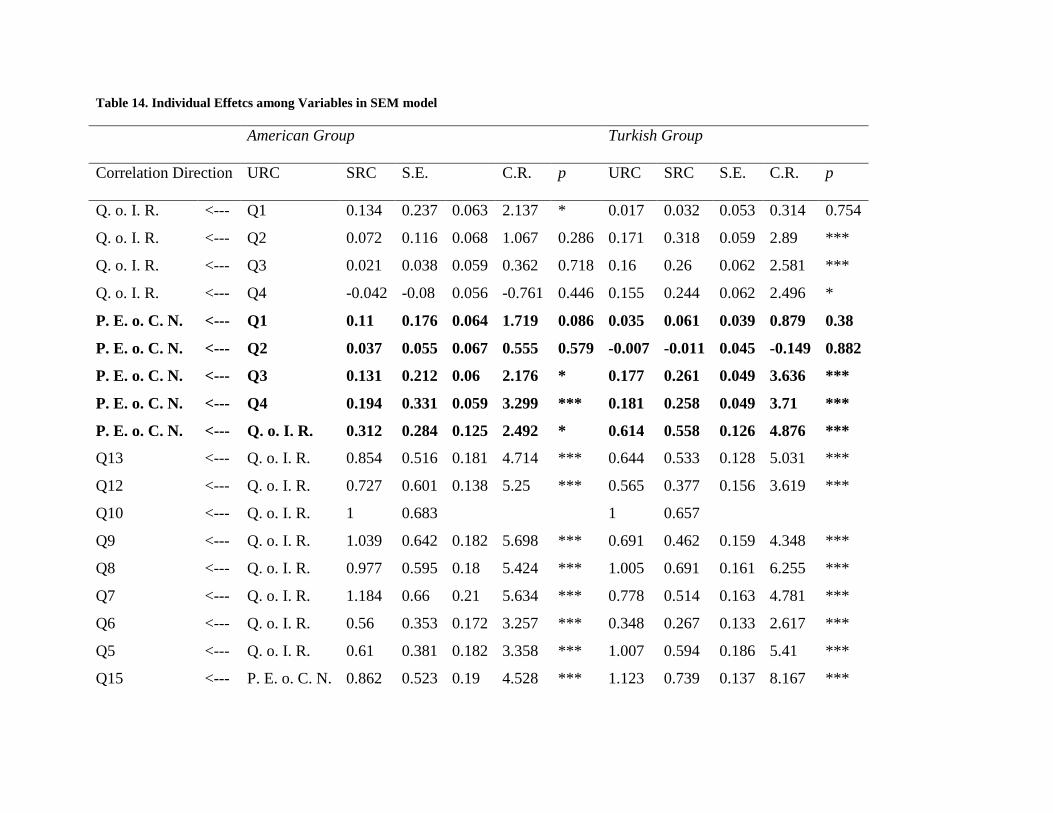
Table 14. Individual Effetcs among Variables in SEM model
American Group Turkish Group
Correlation Direction URC SRC S.E. C.R. p URC SRC S.E. C.R. p
Q. o. I. R. <--- Q1 0.134 0.237 0.063 2.137 * 0.017 0.032 0.053 0.314 0.754
Q. o. I. R. <--- Q2 0.072 0.116 0.068 1.067 0.286 0.171 0.318 0.059 2.89 ***
Q. o. I. R. <--- Q3 0.021 0.038 0.059 0.362 0.718 0.16 0.26 0.062 2.581 ***
Q. o. I. R. <--- Q4 -0.042 -0.08 0.056 -0.761 0.446 0.155 0.244 0.062 2.496 *
P. E. o. C. N. <--- Q1 0.11 0.176 0.064 1.719 0.086 0.035 0.061 0.039 0.879 0.38
P. E. o. C. N. <--- Q2 0.037 0.055 0.067 0.555 0.579 -0.007 -0.011 0.045 -0.149 0.882
P. E. o. C. N. <--- Q3 0.131 0.212 0.06 2.176 * 0.177 0.261 0.049 3.636 ***
P. E. o. C. N. <--- Q4 0.194 0.331 0.059 3.299 *** 0.181 0.258 0.049 3.71 ***
P. E. o. C. N. <--- Q. o. I. R. 0.312 0.284 0.125 2.492 * 0.614 0.558 0.126 4.876 ***
Q13 <--- Q. o. I. R. 0.854 0.516 0.181 4.714 *** 0.644 0.533 0.128 5.031 ***
Q12 <--- Q. o. I. R. 0.727 0.601 0.138 5.25 *** 0.565 0.377 0.156 3.619 ***
Q10 <--- Q. o. I. R. 1 0.683
1 0.657
Q9 <--- Q. o. I. R. 1.039 0.642 0.182 5.698 *** 0.691 0.462 0.159 4.348 ***
Q8 <--- Q. o. I. R. 0.977 0.595 0.18 5.424 *** 1.005 0.691 0.161 6.255 ***
Q7 <--- Q. o. I. R. 1.184 0.66 0.21 5.634 *** 0.778 0.514 0.163 4.781 ***
Q6 <--- Q. o. I. R. 0.56 0.353 0.172 3.257 *** 0.348 0.267 0.133 2.617 ***
Q5 <--- Q. o. I. R. 0.61 0.381 0.182 3.358 *** 1.007 0.594 0.186 5.41 ***
Q15 <--- P. E. o. C. N. 0.862 0.523 0.19 4.528 *** 1.123 0.739 0.137 8.167 ***
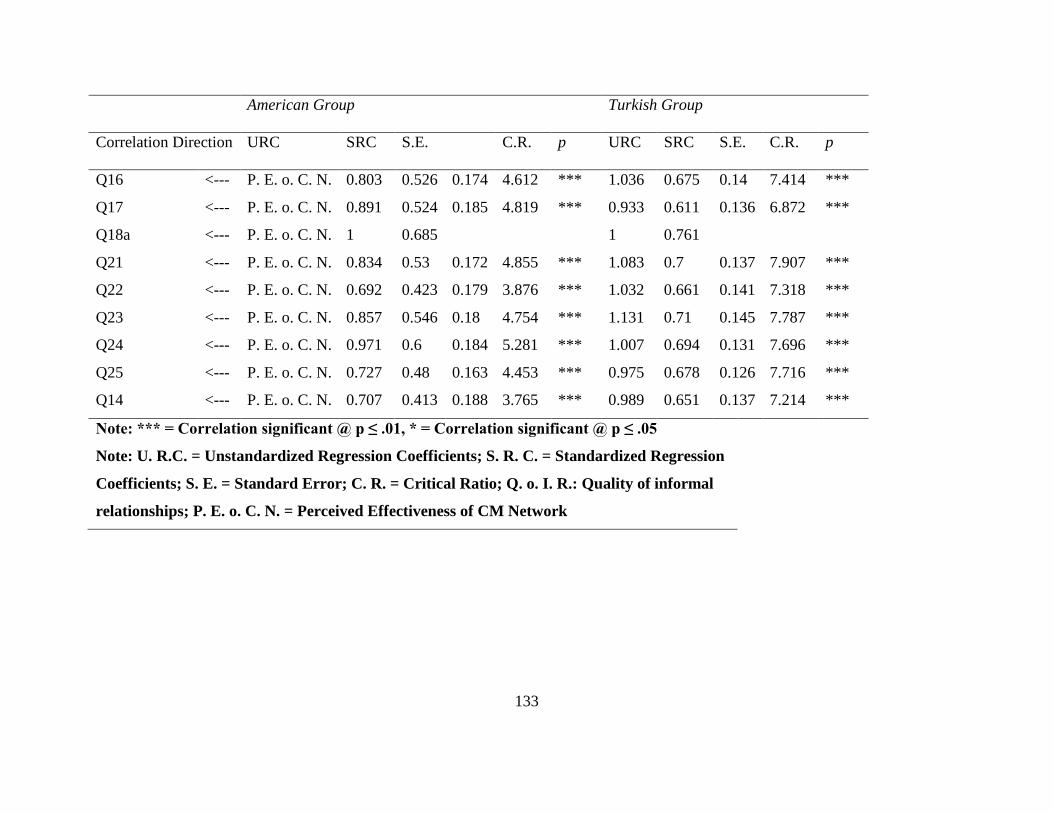
133
American Group Turkish Group
Correlation Direction URC SRC S.E. C.R. p URC SRC S.E. C.R. p
Q16 <--- P. E. o. C. N. 0.803 0.526 0.174 4.612 *** 1.036 0.675 0.14 7.414 ***
Q17 <--- P. E. o. C. N. 0.891 0.524 0.185 4.819 *** 0.933 0.611 0.136 6.872 ***
Q18a <--- P. E. o. C. N. 1 0.685
1 0.761
Q21 <--- P. E. o. C. N. 0.834 0.53 0.172 4.855 *** 1.083 0.7 0.137 7.907 ***
Q22 <--- P. E. o. C. N. 0.692 0.423 0.179 3.876 *** 1.032 0.661 0.141 7.318 ***
Q23 <--- P. E. o. C. N. 0.857 0.546 0.18 4.754 *** 1.131 0.71 0.145 7.787 ***
Q24 <--- P. E. o. C. N. 0.971 0.6 0.184 5.281 *** 1.007 0.694 0.131 7.696 ***
Q25 <--- P. E. o. C. N. 0.727 0.48 0.163 4.453 *** 0.975 0.678 0.126 7.716 ***
Q14 <--- P. E. o. C. N. 0.707 0.413 0.188 3.765 *** 0.989 0.651 0.137 7.214 ***
Note: *** = Correlation significant @ p ≤ .01, * = Correlation significant @ p ≤ .05
Note: U. R.C. = Unstandardized Regression Coefficients; S. R. C. = Standardized Regression
Coefficients; S. E. = Standard Error; C. R. = Critical Ratio; Q. o. I. R.: Quality of informal
relationships; P. E. o. C. N. = Perceived Effectiveness of CM Network
It should be noted that the latent constructs‘ correlations with the observed variables that
created them are statistically significant in both groups. The CFA models of latent constructs
were so successful that reduced sample size did not change the correlations‘ statistical
significance. Before looking at the latent constructs, the proposed hypotheses were examined
from the groups‘ perspectives.
The main hypothesis of the study, H1, was supported in each group statistically. The
Turkish group‘s standardized regression coefficient for H1 (=.59) more than doubled the one
belonging to the American group (=.28). Quality of informal relationships meant more to the
Turkish group than the American group in terms of perceived effectiveness. The individualistic
culture of the American people may have affected this perception negatively for the American
group. The opposite of this judgment is also possible: the Turkish group may have shown this
high correlation for H1 because of the influence of collectivism.
American society is ranked #1 on the individualistic culture scale of Hofstede (2001),
with a score of 91. The lower the individualism score on Hodstede‘s scale, the more collectivist a
society is. Turkey‘s score is 31, and the median score on the scale is forty-three. The collectivist
society of Turkey may have affected the perceived effectiveness of the CM network, thus a high
quality of informal relationships is important for effective CM in Turkey. Although it is lower
than the Turkish group‘s score, it should be noted that the American group‘s correlation for H1 is
also strong from the social science perspective, as well as statistically significant.
H2 was tested with question #4 in the surveys. There is not much difference between the
standardized and unstandardized regression coefficients. The Turkish group has a slightly lower
(=.26) value than the American group (=.33) for the given test. The correlations were significant
at the .01 confidence level. The question regarded the respondent‘s opinions about CM agencies‘
135
openness to change. The American group‘s respondents thought that openness to change was
more important for the effectiveness of a CM network than Turkish group did; however, the
results are close to each other, and considering the standard error of correlations (.06 for the
American and .05 for the Turkish group), it can be assumed that the groups answered this
question in almost the same way.
H3 was represented by question #1 of the study, regarding policy changes after important
events. The general structural model could not find a statistically significant correlation for H3.
Table 14 demonstrates that the group model statistics also failed to find a statistical relationship
for H3. The standardized regression coefficient for the given variable in the American group is
low (=.18) and not statistically significant (p =.09). Similarly, the Turkish group‘s correlation for
H3 is also low (=.06) and insignificant (p =.4). Both groups agreed that policy changes after
important events do not have a significant effect on perceived effectiveness.
Question #3 operationalizes H4, and the groups have close significant values for this
hypothesis. The American group‘s standardized regression coefficient (=.21) is a little less than
theTurkish group‘s (=.26). The American group‘s correlation for H4 is significant at the .05
confidence level, while the Turkish group‘s correlation is more statistically significant at the .01
confidence level. Question #3 discusses an important predictor variable: intra-organizational
training efforts. Both groups felt that intra-organizational training holds an important place in
perceived CM network effectiveness.
H5 was rejected in the developed structural model. Question #2 was utilized to prove this
hypothesis. The groups‘ statistical values also rejected H5. The standardized and unstandardized
regression coefficients are very low for the American (=.04 and =.05 respectively) and Turkish
groups (= -.01 and = -.01 respectively). Additionally, the probability values for the American

136
(=.55) and Turkish (=.88) groups also violate the .05 confidence level. The frequency of
important events has no relationship to the perceived effectiveness of CM networks, according to
the findings in Table 14.
137
5 IMPLICATIONS, CONCLUSIONS, LIMITATIONS, AND FUTURE
RESEARCH
The study discussed both qualitative and quantitative results. The SEM results helped to
illuminate possible socio-economical and technical aspects of differences from one country to
another. The discussed variables‘ importance in terms of CM agencies was analyzed in detail.
Several hypotheses, including the primary one, were found to be statistically significant with
AMOS software.
5.1 Implications
5.1.1 Policy Implications
The qualitative discussions revealed that terrorist events disrupt public administration
mechanisms. Whether the examined CM systems were ready for a terrorist attack or not, chaos
and disorder occurred right after the events. The case countries developed similar processes
relevant to their own public administration systems to block interruptions in public services. The
politically decentralized countries prepared for extreme events differently from the politically
centralized ones. However, the results were not related to whether a system was centralized or
not. CM policies did not fail or achieve in their totality in any single country. Instead, some parts
of CM networks failed in each country, while some others were extremely successful.
Communication failures were the most important deficiency in all observed cases; they
resulted in management failures. The command structure of first responders was lost in the WTC
attacks, and it took significant time to restore the hierarchical management structure in New
138
York City after the event. In the Istanbul bombings, the first responder faced similar
communication shortages. The reaction of emergency health agencies in Istanbul was so
uncoordinated that a significant part of the city was left without emergency health services
during the response phase. Blood donors kept the Spanish emergency services busy, which
resulted in a relatively ineffective emergency medical response.
London was prepared for communication failures. British CM agencies included even
private telecommunication services in their CM plans for the sake of a successful emergency
communication. However, an out-of-date first responder phone list left health officials in
particular without personal communication capability. The London bombings showed that even
the most well-crafted CM plan can partially fail. Communication is an important element of
coordination, which is crucial to a successful CM policy.
Al-Qaeda began to use suicide bombers to kill civilians after the WTC attacks, which
mobilized especially the western world to prepare against such tactics. Coordination agencies
were given authority to provide connectedness and continuity in the response and recovery
phases of CM. Central-command policies were applied differently; in the U.S. and Turkey,
command-control was preferred to coordination-supervision because of the political turbulence
that these countries were experiencing. Spain and the U.K. took a different stand on this issue
and chose coordination-supervision over command-control.
Centralization or decentralization is not adequate to explain why the U.S. and Turkey do
not favor the coordination-supervision approach. Since their public administration systems are
similar, besides the U.K., Spain appeared to have the same CM structure as the U.S. Spain has
another similarity with Turkey: the Mediterranean culture. However, it was the U.K. and Spain
that provided effective resources and adequate authority to regional and local administrations.

139
Even complex and expensive processes of mitigation and preparedness are in the control of
regional authorities in these countries.
After the Obama administration took office in the U.S., changes in the CM system were
expected. The global economic crisis affected public policies, but a shift to coordination-
supervision can only occur in a one-way direction, according to some scholars (McNabb, 2009).
Turkish CM policies were also criticized after a helicopter accident killed five people on board,
including a political party leader. Because of ineffective search and rescue operations, the
incident location could not be found for a long time, despite enormous budget support to central
CM agencies (Referans, 2009). A new direction favoring local and regional authorities was
pointed out for CM in Turkey after the accident; this approach is still advancing.
On the other hand, the quantitative assessments of this study offered another important
and practical lesson, especially for first responders of CM. Improving the quality of relationships
among CM personnel can provide better CM. Improved friendships among personnel will
provide more open communication lines, which eventually will help the agencies stand and serve
in a chaotic environment. A sample population selected from British, American, and Turkish first
responders showed that the presence of friendships within their agencies improved the perceived
quality of CM efforts significantly. This correlation had been pointed out before, but not proven
with statistical tests.
Events that increase friendships in a CM organization will help the employees to be in
touch with other employees, no matter how chaotic the environment becomes. CM policies
should address this specific need of CM agencies. Sporting events, picnics, traveling,
associations, and other social activities can enrich informal relationships within and among
agencies. Holding those events is inexpensive relative to many other collaboration-enriching
140
methods; based on the results of the study, it is entertaining, trust-building, and very effective, no
matter how individualist or collectivist the society.
The adaptation capabilities of CM agencies were tested in the study as well. The selected
four aspects of adaptation were tested via the hypotheses. Openness to change had the greatest
impact on perceived CM effectiveness. It is not surprising to see such a result, since the
theoretical background suggested an evolutionary path for organizations. If a CM agency is not
open to developments and to adapting to changes in environment, sooner or later it will fail.
However, if the agency is open to change, not only it will continue to proceed, but it will also run
more effectively. CM policies should be created with local and regional authorities‘ participation
to give them freedom to change their structures. The top-down approach will prevent openness to
change, which will negatively affect CM organizations‘ performance during an extreme event.
Moreover, the interior dynamics of CM agencies should also be designed to provide flexibility in
management and production. Therefore, openness to change is essential in order for a CM
agency to perform effectively, and the support for it must come from both inside and outside the
agency.
Another important perspective of adaptation found to have a significant impact on CM
effectiveness is intra-organizational training efforts. Although it has a weaker correlation than
the prior hypothesis discussed above, the relationship between intra-organizational training and
the perceived effectiveness of the CM network is statistically significant. From the adaptation
perspective, intra-organizational training helps agencies to have the most updated information
and thus to evolve through changes in the environment. Therefore, institutional memory
advances through new social and technological developments. Agencies that disregard intra-
141
organizational training will face ineffective CM efforts because they failed to go forward by
using changed environmental components.
The informal relationship scale (Nielsen et al., 2000; Morrison, 2004) and the perceived
effectiveness of CM network scale (Quarantelli, 1997) were successful in defining latent
dependent and independent variables. The correlations between observed variables and latent
constructs were high and statistically significant in all CFA and structural models. Even the
reduced sample size in the groups‘ models did not change the significance of the correlations
defining latent constructs. It shows the validity of models run and statistical constructs built in
the study. Policy makers should target the cited factors for each latent construct in order to
operate more effectively.
The top three correlations with the quality of informal relationships variable were
socialize with coworkers outside of workplace, formed strong friendships at work, and trust
many coworkers a great deal. Social events will allow these variables to improve the quality of
informal relationships more than others will. Creating trust should be a priority of those social
activities. Picnics, sporting events, and other activities were only some of the suggestions made
by the study. Policies regulating these activities should be developed professionals in order to
improve the quality of intra-organizational friendships.
Factors representing ―appropriate reports for the news media,‖ ―blending emergent and
established organizations,‖ and ―adequately processing information‖ had the greatest impact on
the perceived CM effectiveness of first responders. When appropriate reports are not made
available to news sources, the chaotic environment will become larger than it actually is. The
examined Istanbul bombings showed that when public officials avoid sharing information during
142
times of crisis, it produces a poor CM effort whether the ground units at incident sites perform
successfully or not.
Emergent sources are either volunteer-based resources or victims directly affected by
extreme events. Cold War tactics did not suggest any plans to involve those resources in CM
plans. Recent policies have offered methods to include emergent resources in CM plans, and they
have achieved that to a certain degree. The respondents to the study surveyed showed that
including emergent sources is one of the most important effectiveness factors in utilizing and
managing these resources. Policy makers should make CM plans based on the assumption of
emergent source existence.
Adequately processing information has three layers, according to Quarantelli‘s scale
(1997). The factor utilized all three dimensions with the statistical software‘s help. Three
different questions were combined into one factor. For this reason, the implication of this
variable has three dimensions as well. Information obtained during an extreme event should be
shared within the agency, with other agencies, and with affected citizens. Regulations should aim
first to employ communication methods that make it possible to process information. Second,
CM plans should be designed to share and process information within the agency, with other
agencies, and with affected citizens.
5.1.2 Theoretical Implications
This study will contribute to the network effectiveness area. Network theory and its
implications are still in progress. It is known that interorganizational efforts are hard to define
and evaluate with conventional methods used to assess individual organizations. The methods
143
utilized in this study are fairly distinctive in the literature, which will contribute to
interorganizational network studies.
Additionally, CAS had not been utilized with such quantified methods before. Recently
introduced to the social sciences, CAS needs more research and applications. CAS‘s suggestions
were combined with network theory literature to explain adaptiveness, nonlinear relationships,
developed communication lines, and effectiveness within CM organizations and networks. The
theory‘s methodological application is another contribution, because the adaptation perspective
of the theory was utilized as a predictor variable while the quality of informal relationships
construct represented more open communication lines as an independent variable.
Methodologically, SEM was successful in showing complex relationships‘ correlation in
a given model. Correctly applied, SEM can demonstrate multiple regression tests in one model,
which can contribute to both CAS and CM studies. CAS, like network literature, requires the
employment of many different variables and perspectives to explain social occasions. CM
networks are also dependent on various social factors as cited in the study, which require more
than a simple regression test. SEM is powerful and reliable enough to serve in more research in
those areas.
This study will also improve crisis management efforts. Informal relationships within
crisis management organizations should be improved to better crisis management efforts
worldwide. The diversity of cultures included in the study increases the chance of replicability.
More importantly, improved crisis management efforts will allow the emergency networks to
save more lives and prevent more damage in future emergencies and extreme events.
144
5.2 Conclusions
This study evaluated the crisis management operations implemented after four different
terrorist attacks performed in New York in 2001, in Istanbul in 2003, in Madrid in 2004, and in
London in 2005. The immediate collaborative emergency response and recovery efforts
conducted by local, national, and international organizations after each attack were examined as
a sample of CM efforts that actually consisted of mitigation and preparedness along with
response and recovery against natural and manmade disasters.
Public administration systems, historical facts, and social-economic conditions were
found to affect the effectiveness of CM policies. The CM structures, CM policies, and CM
coordination changed in the countries examined. Central-regional or federal-local government
competition not only affected the style and processes of CM, but also the effectiveness of CM.
Centralization and decentralization clearly affected CM performance, but the direction of this
effect was not clear. The study suggested that a well-planned, combined decentralization and
centralization can be the best CM intervention.
Organizations selected based on social network analysis results were surveyed to measure
the hypothesized correlations. The perceived effectiveness of interorganizational efforts was
shown to have been affected by the quality of informal relationships within crisis management
organizations. Two of the adaptation factors that CAS theory suggested were also proven to
create effective CM in a chaotic environment.
The increased effectiveness of interorganizational efforts among crisis management
organizations will lead to a successful crisis management methodology worldwide. More than
half of the respondents were managers; as a result, the findings can be generalized to all CM
145
efforts. Additionally, the study examined cases from all over the world, which increases the
chance to apply the results universally.
5.3 Limitations
The study faced serious limitations stemming from the theory, methodology, statistical
tools, and difficulty of studying controversial terrorist cases. CAS is a recently developed theory
that is still growing. The methodology includes several assumptions that can be a threat to
external and internal validity. AMOS and UCINET are discussed to have certain limitations.
Moreover, the selected CM cases were terrorist cases, which minimized the probability of
finding available survey respondents.
CAS was first developed for use in biology. Leading scholars of the theory are also
famous for their studies on microorganisms and evolution. CAS‘s social science and public
affairs standpoint is new and needs development. The non-linear relationship clause is applicable
in biology but needs more application in social science. In addition to that limitation, CAS
assumes that a relationship between an organization and its environment is based on positive and
negative feedbacks. This can explain cybernetic systems like simple organisms, but
organizations do not necessarily receive clear positive or negative signals from the environment.
The term complexity also needs more research. How complex a system must be in order
to be called a complex system is an important question for further research in CAS. Although it
is a new theory, CAS explained many perspectives of the study. CAS also contributed to the
research with four predictor variables. Since the study employed a network approach in the
dependent variable, CAS was used to its latest extent in the study.
146
The methodology used a three-fold path. The multiple-case study method was used to
find CM cases from the world. By using those cases, informal relationships were tested to see
whether they had an impact on perceived CM effectiveness. Four terrorist bombing cases were
conducted by the same terrorist network with different methods. It can be argued that terrorist
bombing cases do not represent all CM efforts. Also, only the response and recovery phases were
utilized, which left the mitigation and preparedness phases out of the study.
However, the research focused on CM efforts that were conducted by reliable CM
systems. Many other great natural disasters have claimed hundreds of thousands of people‘s
lives, such as Iran-Bam earthquake in 2003 that killed 43,000, the Indian Ocean tsunami in 2004
that killed over 230,000, the 2005 Kashmir Earthquake in Pakistan that claimed over 85,000
lives, and the recent Sichuan earthquake in 2008 that took 70,000 lives in China. Manmade
disasters also cost many human lives. The Al-Qaeda terrorist organization, which was the case
studies‘ point of commonality in this study, has conducted many other deadly attacks in Saudi
Arabia, Congo, Sudan, Bali, and some other Arabic and African countries. Nonetheless the study
did not employ any but the four cases examined in the text.
It should be noted that the unselected countries did not have a proper CM system.
Moreover, the cases did not have reliable official and/or news reports. Even the death tolls of
cited events are questionable because of the political conditions of those countries. Without
proper knowledge resources, the study could not provide an adequate literature review should
any of those cited events be selected as case studies.
The response and recovery phases were chosen to represent all CM cycles, which also
includes mitigation and preparedness. The response and recovery phases take much less time to
complete than the other two phases of CM. From that perspective, the study results have a
147
limited capacity for generalization. However, more than half of the survey respondents were
managers. Unlike frontline workers, managers of CM organizations can shape the strategies of
mitigation and preparedness. Therefore, the results should not be limited to response and
recovery; instead, they should be generalized through other phases based on the characteristics of
the study sample.
Another method used in the study was snowball sampling. In the SEM section of the
study, the survey respondents were asked to name names of their coworkers to identify more
respondents. The reason was simple: it has been a long time in the case countries since the
incidents took place, and many possible respondents have left their jobs, retired, or died. A
limited but unknown number of respondents could be found out with this method. However, one
of the latent variables of the study was quality of relationships. This variable could be affected
since the respondents would likely name their own friends in the organizations.
Snowball sampling did not significantly affect the results of the study. For example, the
only observed variable left out of the study was ―working for the organization because of
someone else.‖ Moreover, the quality of informal relationships latent construct‘s correlations
with the factors that created it was not stronger than the correlations created by the effectiveness
latent construct. Additionally, in Appendix B, www.surveygizmo.com provides a map for the
surveys that demonstrates the geographical locations of respondents. The maps showed that the
respondents came from many different regions in the case countries. Finally, it took a very long
time to gather all responses. Had some friend groups performed all the surveys, the study would
have reached many people within a considerably shorter time and with less effort.
The number of selected agencies can also be cited as a limitation of the study. The
literature offered studies utilizing UCINET to explain the relationships within a selected
148
network. Utilizing UCINET as a sampling tool to find the most interacting agencies in a network
was not utilized in the literature. Therefore, the decision regarding the number of selected
organizations for each country was made based on a logical interpretation of current sampling
methods. The number six was reached after discussions with dissertation committee members.
The statistical software used presented problems as well. UCINET analyses are as
relevant as the contents used. If the researchers are not sure what they are looking for in which
content, UCINET will not help them. Content selection is even more important than the scientific
results of UCINET analyses because the results are directly shaped by the content. The UCINET
analyses of the study were created by a professional research team. Almost all of the results
corroborated with the literature. However, 7JAC was in the top-ten list of degree centrality
scores of London Bombings (Table 5) even though it was established more than one month after
the incident. NYPD‘s absence from the list (Table 2) was also questioned by a number of survey
respondents because the agency was very active during the WTC attacks and lost a significant
number of its members. However, the weakness of the software was evaluated in the study and
the required adjustments were made while interpreting the analyses.
Selecting terrorism cases may also have affected the findings of the study. Since terrorist
cases are top-secret security issues, the respondents were not very eager to participate in the
study. Even though the survey instruments clearly stated that the research had nothing to do with
terrorism, people were reluctant to respond to the surveys. For that reason, the study could find
very few participants in the U.K. and Spain. Possible respondents could not be contacted to
explain that the research was purely about factors affecting crisis management effectiveness.
As a result, the study had to remove two case countries from the quantitative SEM
discussions. Reducing the cases by half might have had a negative impact on the proposed
149
results. Logically, four cases are more universally generalizable than two cases. Using only two
cases unquestionably limited the generalization capacity of the results. Every method was tried to
reach possible respondents in the U.K. and Spain. Personal official contacts, familiar scholars,
word of mouth, internet groups, social network websites, and other available methods were
employed. The translations of the surveys and invitation messages were prepared by professional
translators. None of these tactics helped the study gather responses from those countries. The
number of respondents from two countries was consequently doubled to provide a testable
sample. However, selecting only the U.S. and Turkey offered sufficient opportunity to compare
very different public administration systems and cultures in terms of CM. Centralist-decentralist,
developing-developed, European-American, Middle Eastern-Anglo Saxon, and Old World-New
World comparisons evaluated CM systems adequately.
A significant amount of time had passed since the incidents, which created another threat
to the study‘s external validity. The surveys included questions regarding the past circumstances
of the CM organizations. The respondents could have forgotten the organizational situation at the
time of the attack. Moreover, bad experiences such as an illness because of the incident or the
loss of a beloved colleague in those events may have changed mentality of the respondents for
organizations negatively. The opposite of this also possible: rewards after those incidents may
have altered the perspective of the respondents positively. The surveys and the invitation letters
emphasized passages specifically targeted to eliminate the retrospective approach problem of the
study.
Comparing the Turkish and American groups, the study‘s results cannot be argued to be
distorted by this problem. The American group lost almost 500 members in the WTC attacks.
This generated great physiological depression for the first responders to the WTC attacks.
150
Moreover, casualties continued over time because of poisonous gases inhaled by them in
response and recovery operations. All these obstacles were supposed to produce very negative
answers for selected variables of the study. The Turkish respondent group did not experience any
of those circumstances because of the smaller scale of the attacks. Nonetheless, the compared
statistical tests generated nearly the same results. Differences originated from social-economic
conditions, not the retrospective perceptions of the respondents.
5.4 Future Research
More cases will be needed in future research based on this study. Since the multiple-case-study
approach is implied, the CM response to recent Al-Qaeda attacks in India in 2008 may be
considered as a part of future studies. Moreover, natural disasters can be selected as case studies.
However, those studies should make sure that the target cases have a proper CM system. In
addition to that, all CM cycles can be studied to grasp the big picture in CM. It will take more
time and effort to study the mitigation and preparedness stages as well, but it is certainly a valid
direction for future studies.
Future studies could also include more respondents from more organizations. Although
the almost 250 respondents to the study resulted in statistically significant results, half of the
predictor variables used to explain adaptiveness could not be found statistically significant. A
higher sample size could have led to better and more significant results. Moreover, including
more agencies could prevent incorrect assessments from being made with the statistical tools
employed. Additionally, more organizational or network variables could be used as predictor
variables in future research. Organizations‘ budgets, size, characteristics, and other attributes will
add important perspectives from an organizational viewpoint.

151
APPENDIX A: SURVEYS
152
5.4.1 Survey for Emergency Management Organizations (US)
=============================================
RESEARCH USE INFORMED CONSENT FORM
=============================================
Researcher Information: Bahadir Sahin
Department of Public Affairs
+ (1) 646-220-0628 (cell)
I. PROJECT TITLE: Factors Influencing Effectiveness of Crisis
Management Networks: A Comparative Perspective
II. INTRODUCTION: Increased number of manmade and natural disasters forces
the policy makers to make more effective crisis management policies. Since
the crisis management cannot be conducted by one single entity, it is a
collaborative network effort among first responder public organizations,
nonprofit disaster relief institutions and other public and private
entities. Ineffective crisis management policies coordinating the response
and recovery efforts will result in failures that cost numerous human
lives and great material damages to public and private infrastructures.
The disasters will occur in a more increasing rate in the future (e.g.
Iowa Floods in June 2008). The crisis management policies and
organizations should be ready for worse conditions to be more effective
and to save more human lives and hinder more property damage in future
disasters.
Based on this information from the literature, you will be asked 25
questions regarding the organizational conditions you are in. It will
probably take 10 minutes of your time. Your participation is greatly
appreciated. If you requested it (by mail, e-mail, or phone, the
researcher will also provide a copy of consent form to you.
III. Your confidentiality will be guarded.
If you have any questions about participation into this research project,
you may file a claim with UCF Environmental Health & Safety, Risk and
Insurance Office, P.O. Box 163500, Orlando, FL 32816-3500 (407) 823-6300.
IV. If you have any other questions, you may also contact the principal
investigator:
Thomas Wan
Professor and Director
Doctoral Program in Public Affairs
+ (1) 407-823-3678
I have read and understood the information in this form. I am at least 18
years of age. I consent to take part in this research entitled “Factors
Influencing Effectiveness of Interorganizational Networks among Crisis
Management Organizations: A Comparative Perspective”
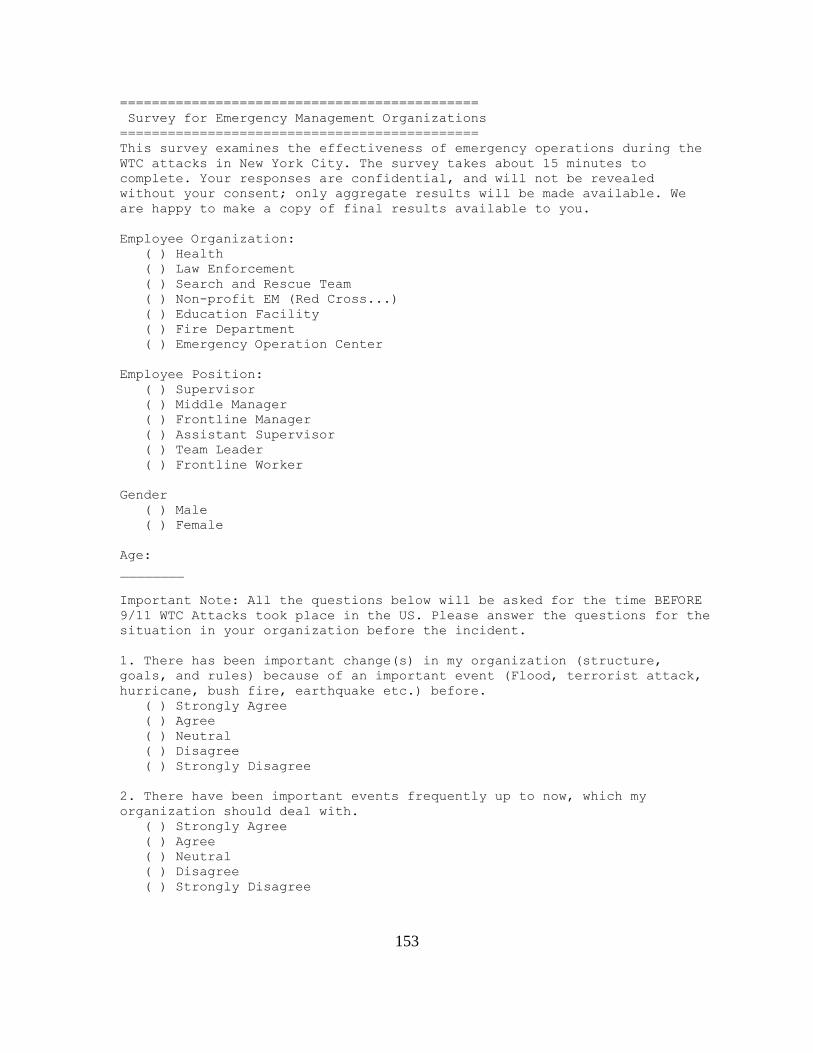
153
=============================================
Survey for Emergency Management Organizations
=============================================
This survey examines the effectiveness of emergency operations during the
WTC attacks in New York City. The survey takes about 15 minutes to
complete. Your responses are confidential, and will not be revealed
without your consent; only aggregate results will be made available. We
are happy to make a copy of final results available to you.
Employee Organization:
( ) Health
( ) Law Enforcement
( ) Search and Rescue Team
( ) Non-profit EM (Red Cross...)
( ) Education Facility
( ) Fire Department
( ) Emergency Operation Center
Employee Position:
( ) Supervisor
( ) Middle Manager
( ) Frontline Manager
( ) Assistant Supervisor
( ) Team Leader
( ) Frontline Worker
Gender
( ) Male
( ) Female
Age:
________
Important Note: All the questions below will be asked for the time BEFORE
9/11 WTC Attacks took place in the US. Please answer the questions for the
situation in your organization before the incident.
1. There has been important change(s) in my organization (structure,
goals, and rules) because of an important event (Flood, terrorist attack,
hurricane, bush fire, earthquake etc.) before.
( ) Strongly Agree
( ) Agree
( ) Neutral
( ) Disagree
( ) Strongly Disagree
2. There have been important events frequently up to now, which my
organization should deal with.
( ) Strongly Agree
( ) Agree
( ) Neutral
( ) Disagree
( ) Strongly Disagree
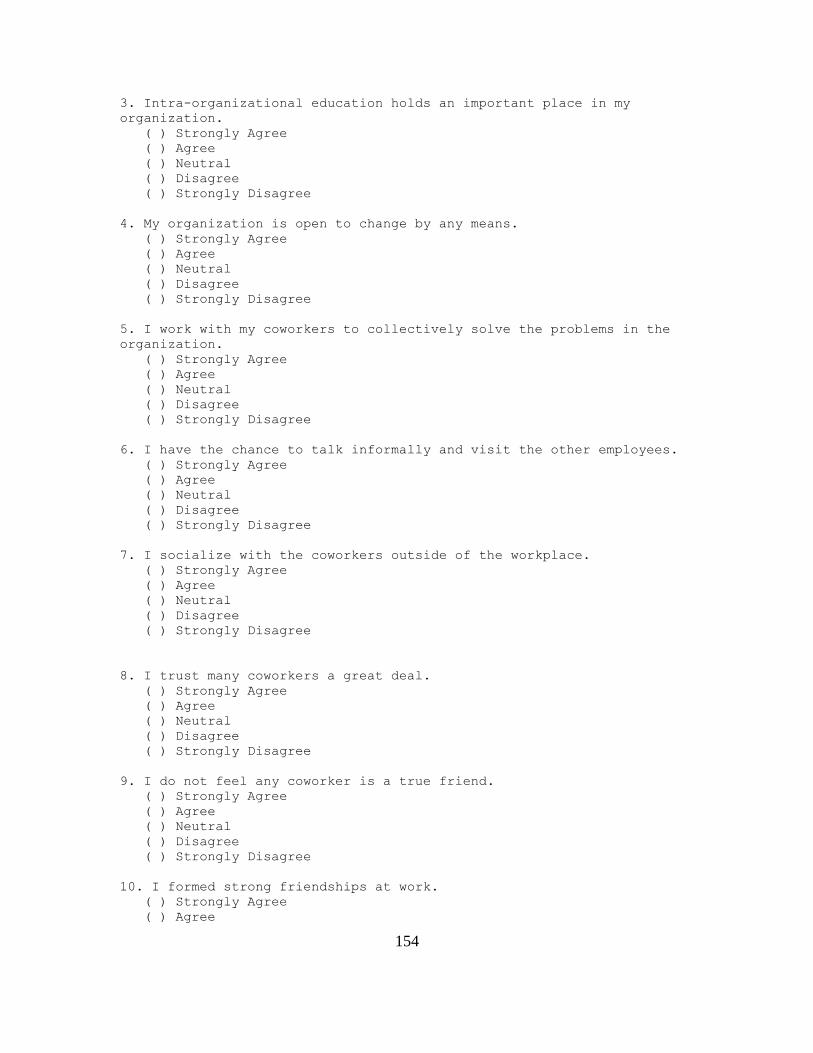
154
3. Intra-organizational education holds an important place in my
organization.
( ) Strongly Agree
( ) Agree
( ) Neutral
( ) Disagree
( ) Strongly Disagree
4. My organization is open to change by any means.
( ) Strongly Agree
( ) Agree
( ) Neutral
( ) Disagree
( ) Strongly Disagree
5. I work with my coworkers to collectively solve the problems in the
organization.
( ) Strongly Agree
( ) Agree
( ) Neutral
( ) Disagree
( ) Strongly Disagree
6. I have the chance to talk informally and visit the other employees.
( ) Strongly Agree
( ) Agree
( ) Neutral
( ) Disagree
( ) Strongly Disagree
7. I socialize with the coworkers outside of the workplace.
( ) Strongly Agree
( ) Agree
( ) Neutral
( ) Disagree
( ) Strongly Disagree
8. I trust many coworkers a great deal.
( ) Strongly Agree
( ) Agree
( ) Neutral
( ) Disagree
( ) Strongly Disagree
9. I do not feel any coworker is a true friend.
( ) Strongly Agree
( ) Agree
( ) Neutral
( ) Disagree
( ) Strongly Disagree
10. I formed strong friendships at work.
( ) Strongly Agree
( ) Agree
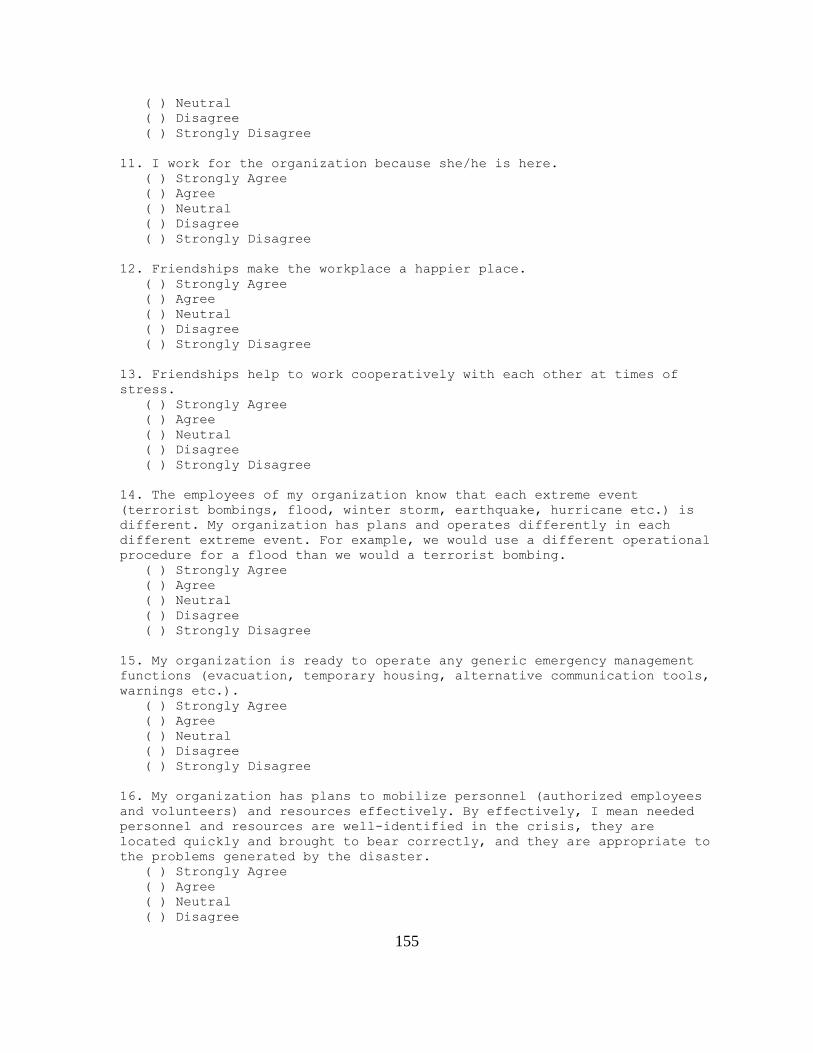
155
( ) Neutral
( ) Disagree
( ) Strongly Disagree
11. I work for the organization because she/he is here.
( ) Strongly Agree
( ) Agree
( ) Neutral
( ) Disagree
( ) Strongly Disagree
12. Friendships make the workplace a happier place.
( ) Strongly Agree
( ) Agree
( ) Neutral
( ) Disagree
( ) Strongly Disagree
13. Friendships help to work cooperatively with each other at times of
stress.
( ) Strongly Agree
( ) Agree
( ) Neutral
( ) Disagree
( ) Strongly Disagree
14. The employees of my organization know that each extreme event
(terrorist bombings, flood, winter storm, earthquake, hurricane etc.) is
different. My organization has plans and operates differently in each
different extreme event. For example, we would use a different operational
procedure for a flood than we would a terrorist bombing.
( ) Strongly Agree
( ) Agree
( ) Neutral
( ) Disagree
( ) Strongly Disagree
15. My organization is ready to operate any generic emergency management
functions (evacuation, temporary housing, alternative communication tools,
warnings etc.).
( ) Strongly Agree
( ) Agree
( ) Neutral
( ) Disagree
( ) Strongly Disagree
16. My organization has plans to mobilize personnel (authorized employees
and volunteers) and resources effectively. By effectively, I mean needed
personnel and resources are well-identified in the crisis, they are
located quickly and brought to bear correctly, and they are appropriate to
the problems generated by the disaster.
( ) Strongly Agree
( ) Agree
( ) Neutral
( ) Disagree
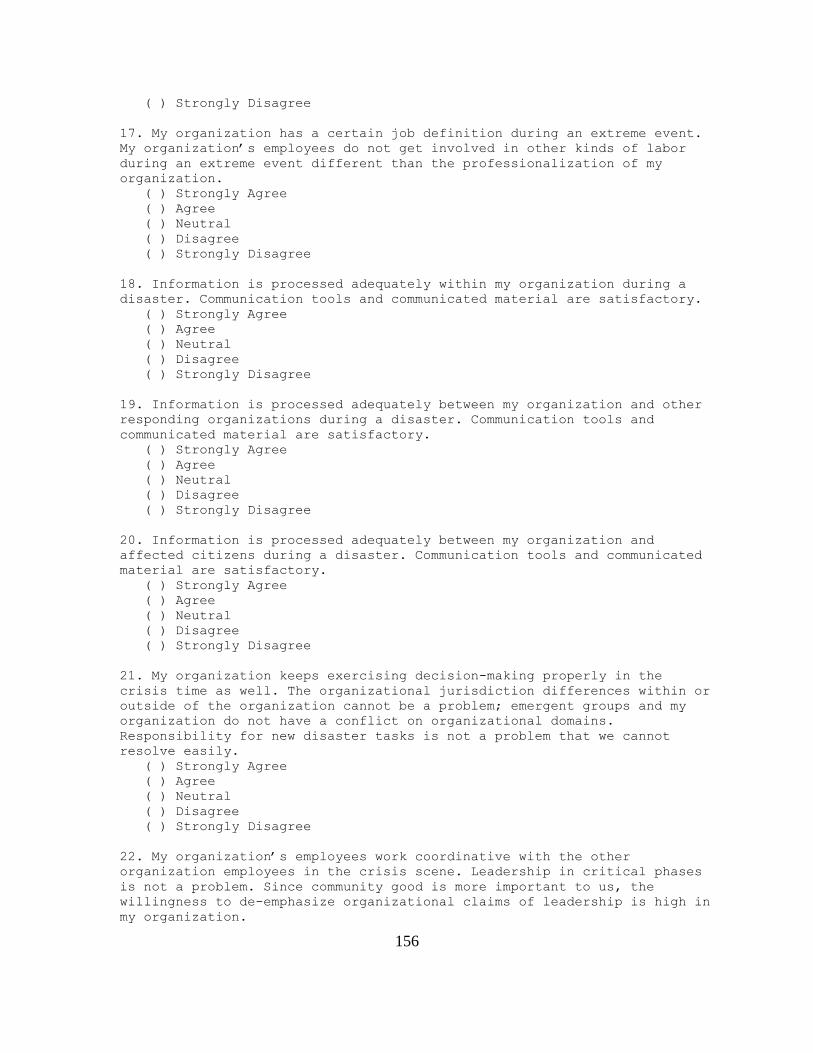
156
( ) Strongly Disagree
17. My organization has a certain job definition during an extreme event.
My organization’s employees do not get involved in other kinds of labor
during an extreme event different than the professionalization of my
organization.
( ) Strongly Agree
( ) Agree
( ) Neutral
( ) Disagree
( ) Strongly Disagree
18. Information is processed adequately within my organization during a
disaster. Communication tools and communicated material are satisfactory.
( ) Strongly Agree
( ) Agree
( ) Neutral
( ) Disagree
( ) Strongly Disagree
19. Information is processed adequately between my organization and other
responding organizations during a disaster. Communication tools and
communicated material are satisfactory.
( ) Strongly Agree
( ) Agree
( ) Neutral
( ) Disagree
( ) Strongly Disagree
20. Information is processed adequately between my organization and
affected citizens during a disaster. Communication tools and communicated
material are satisfactory.
( ) Strongly Agree
( ) Agree
( ) Neutral
( ) Disagree
( ) Strongly Disagree
21. My organization keeps exercising decision-making properly in the
crisis time as well. The organizational jurisdiction differences within or
outside of the organization cannot be a problem; emergent groups and my
organization do not have a conflict on organizational domains.
Responsibility for new disaster tasks is not a problem that we cannot
resolve easily.
( ) Strongly Agree
( ) Agree
( ) Neutral
( ) Disagree
( ) Strongly Disagree
22. My organization’s employees work coordinative with the other
organization employees in the crisis scene. Leadership in critical phases
is not a problem. Since community good is more important to us, the
willingness to de-emphasize organizational claims of leadership is high in
my organization.
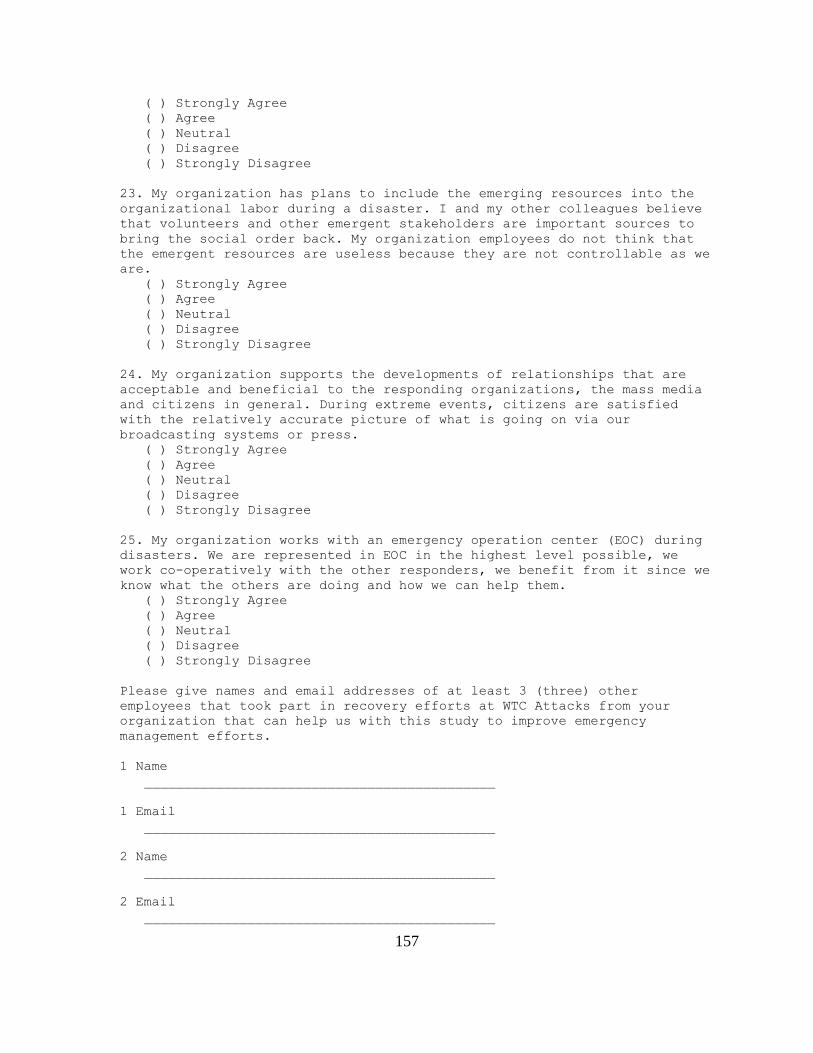
157
( ) Strongly Agree
( ) Agree
( ) Neutral
( ) Disagree
( ) Strongly Disagree
23. My organization has plans to include the emerging resources into the
organizational labor during a disaster. I and my other colleagues believe
that volunteers and other emergent stakeholders are important sources to
bring the social order back. My organization employees do not think that
the emergent resources are useless because they are not controllable as we
are.
( ) Strongly Agree
( ) Agree
( ) Neutral
( ) Disagree
( ) Strongly Disagree
24. My organization supports the developments of relationships that are
acceptable and beneficial to the responding organizations, the mass media
and citizens in general. During extreme events, citizens are satisfied
with the relatively accurate picture of what is going on via our
broadcasting systems or press.
( ) Strongly Agree
( ) Agree
( ) Neutral
( ) Disagree
( ) Strongly Disagree
25. My organization works with an emergency operation center (EOC) during
disasters. We are represented in EOC in the highest level possible, we
work co-operatively with the other responders, we benefit from it since we
know what the others are doing and how we can help them.
( ) Strongly Agree
( ) Agree
( ) Neutral
( ) Disagree
( ) Strongly Disagree
Please give names and email addresses of at least 3 (three) other
employees that took part in recovery efforts at WTC Attacks from your
organization that can help us with this study to improve emergency
management efforts.
1 Name
____________________________________________
1 Email
____________________________________________
2 Name
____________________________________________
2 Email
____________________________________________

158
3 Name
____________________________________________
3 Email
____________________________________________
4 Name
____________________________________________
4 Email
____________________________________________
5 Name
____________________________________________
5 Email
____________________________________________
6 Name
____________________________________________
6 Email
____________________________________________
=============================================
Thank You!
=============================================
Thank you for taking our survey. Your response is very important to us.
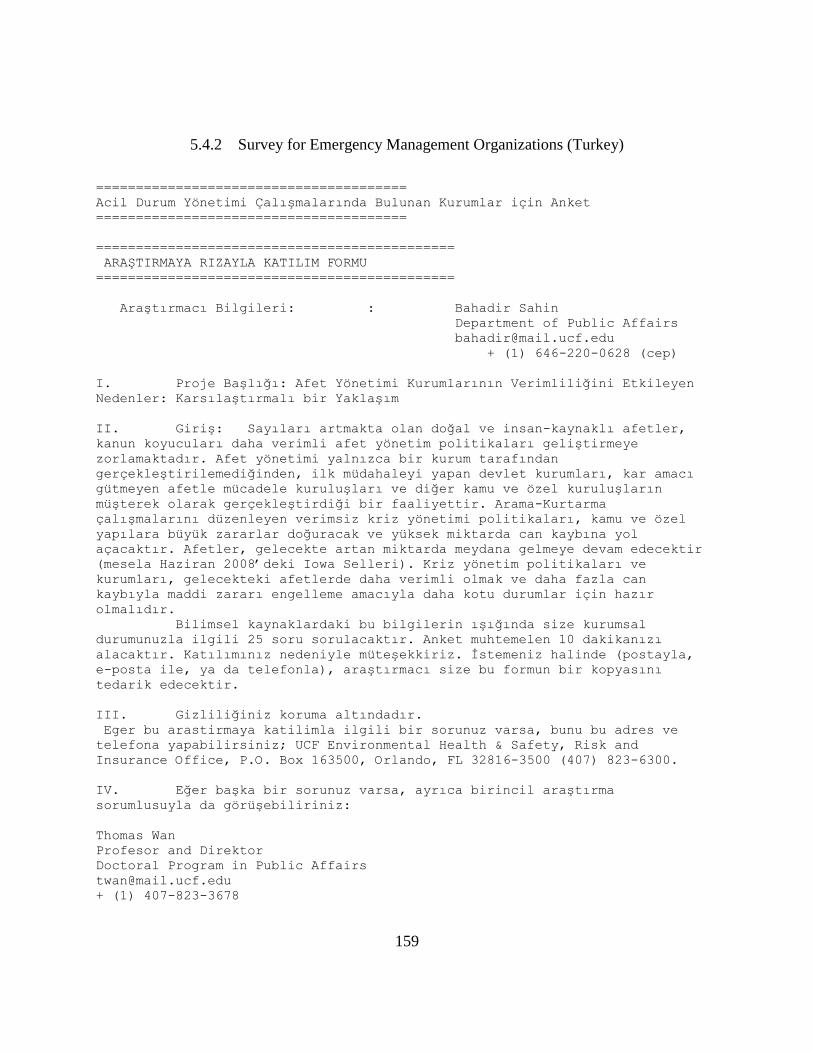
159
5.4.2 Survey for Emergency Management Organizations (Turkey)
=======================================
Acil Durum Yönetimi Çalışmalarında Bulunan Kurumlar için Anket
=======================================
=============================================
ARAŞTIRMAYA RIZAYLA KATILIM FORMU
=============================================
Araştırmacı Bilgileri: : Bahadir Sahin
Department of Public Affairs
+ (1) 646-220-0628 (cep)
I. Proje Başlığı: Afet Yönetimi Kurumlarının Verimliliğini Etkileyen
Nedenler: Karsılaştırmalı bir Yaklaşım
II. Giriş: Sayıları artmakta olan doğal ve insan-kaynaklı afetler,
kanun koyucuları daha verimli afet yönetim politikaları geliştirmeye
zorlamaktadır. Afet yönetimi yalnızca bir kurum tarafından
gerçekleştirilemediğinden, ilk müdahaleyi yapan devlet kurumları, kar amacı
gütmeyen afetle mücadele kuruluşları ve diğer kamu ve özel kuruluşların
müşterek olarak gerçekleştirdiği bir faaliyettir. Arama-Kurtarma
çalışmalarını düzenleyen verimsiz kriz yönetimi politikaları, kamu ve özel
yapılara büyük zararlar doğuracak ve yüksek miktarda can kaybına yol
açacaktır. Afetler, gelecekte artan miktarda meydana gelmeye devam edecektir
(mesela Haziran 2008’deki Iowa Selleri). Kriz yönetim politikaları ve
kurumları, gelecekteki afetlerde daha verimli olmak ve daha fazla can
kaybıyla maddi zararı engelleme amacıyla daha kotu durumlar için hazır
olmalıdır.
Bilimsel kaynaklardaki bu bilgilerin ışığında size kurumsal
durumunuzla ilgili 25 soru sorulacaktır. Anket muhtemelen 10 dakikanızı
alacaktır. Katılımınız nedeniyle müteşekkiriz. İstemeniz halinde (postayla,
e-posta ile, ya da telefonla), araştırmacı size bu formun bir kopyasını
tedarik edecektir.
III. Gizliliğiniz koruma altındadır.
Eger bu arastirmaya katilimla ilgili bir sorunuz varsa, bunu bu adres ve
telefona yapabilirsiniz; UCF Environmental Health & Safety, Risk and
Insurance Office, P.O. Box 163500, Orlando, FL 32816-3500 (407) 823-6300.
IV. Eğer başka bir sorunuz varsa, ayrıca birincil araştırma
sorumlusuyla da görüşebiliriniz:
Thomas Wan
Profesor and Direktor
Doctoral Program in Public Affairs
+ (1) 407-823-3678
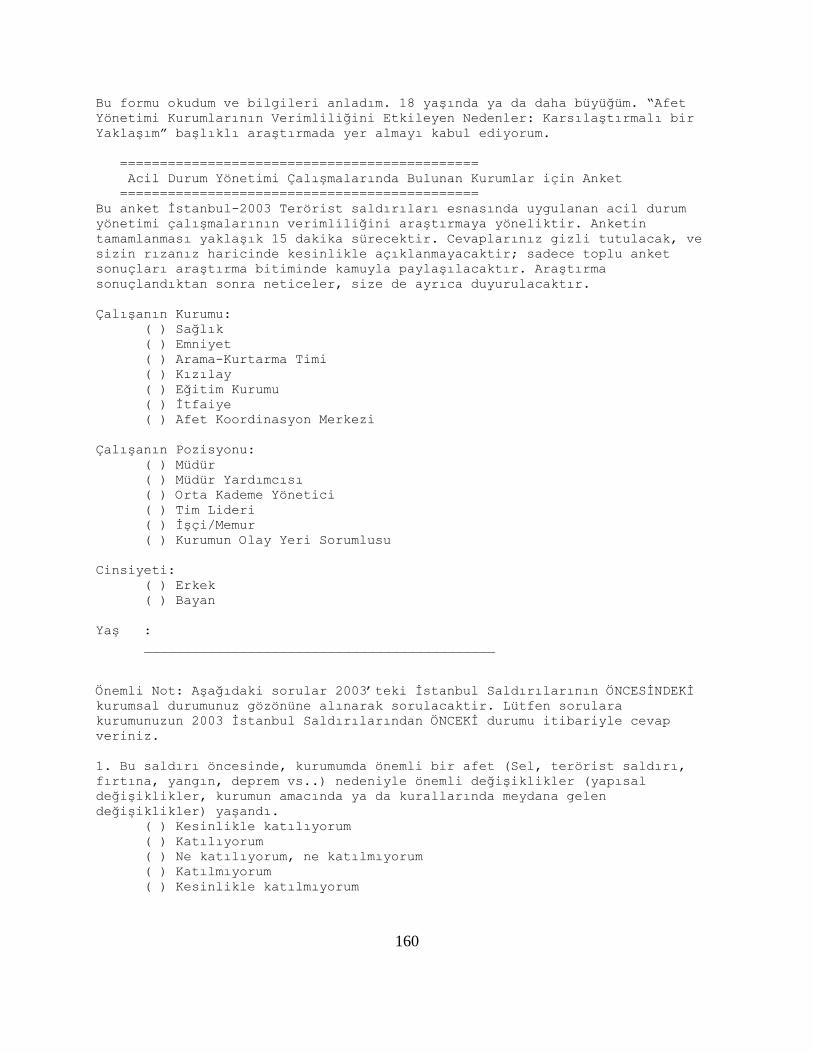
160
Bu formu okudum ve bilgileri anladım. 18 yaşında ya da daha büyüğüm. “Afet
Yönetimi Kurumlarının Verimliliğini Etkileyen Nedenler: Karsılaştırmalı bir
Yaklaşım” başlıklı araştırmada yer almayı kabul ediyorum.
=============================================
Acil Durum Yönetimi Çalışmalarında Bulunan Kurumlar için Anket
=============================================
Bu anket İstanbul-2003 Terörist saldırıları esnasında uygulanan acil durum
yönetimi çalışmalarının verimliliğini araştırmaya yöneliktir. Anketin
tamamlanması yaklaşık 15 dakika sürecektir. Cevaplarınız gizli tutulacak, ve
sizin rızanız haricinde kesinlikle açıklanmayacaktir; sadece toplu anket
sonuçları araştırma bitiminde kamuyla paylaşılacaktır. Araştırma
sonuçlandıktan sonra neticeler, size de ayrıca duyurulacaktır.
Çalışanın Kurumu:
( ) Sağlık
( ) Emniyet
( ) Arama-Kurtarma Timi
( ) Kızılay
( ) Eğitim Kurumu
( ) İtfaiye
( ) Afet Koordinasyon Merkezi
Çalışanın Pozisyonu:
( ) Müdür
( ) Müdür Yardımcısı
( ) Orta Kademe Yönetici
( ) Tim Lideri
( ) İşçi/Memur
( ) Kurumun Olay Yeri Sorumlusu
Cinsiyeti:
( ) Erkek
( ) Bayan
Yaş :
____________________________________________
Önemli Not: Aşağıdaki sorular 2003’teki İstanbul Saldırılarının ÖNCESİNDEKİ
kurumsal durumunuz gözönüne alınarak sorulacaktir. Lütfen sorulara
kurumunuzun 2003 İstanbul Saldırılarından ÖNCEKİ durumu itibariyle cevap
veriniz.
1. Bu saldırı öncesinde, kurumumda önemli bir afet (Sel, terörist saldırı,
fırtına, yangın, deprem vs..) nedeniyle önemli değişiklikler (yapısal
değişiklikler, kurumun amacında ya da kurallarında meydana gelen
değişiklikler) yaşandı.
( ) Kesinlikle katılıyorum
( ) Katılıyorum
( ) Ne katılıyorum, ne katılmıyorum
( ) Katılmıyorum
( ) Kesinlikle katılmıyorum
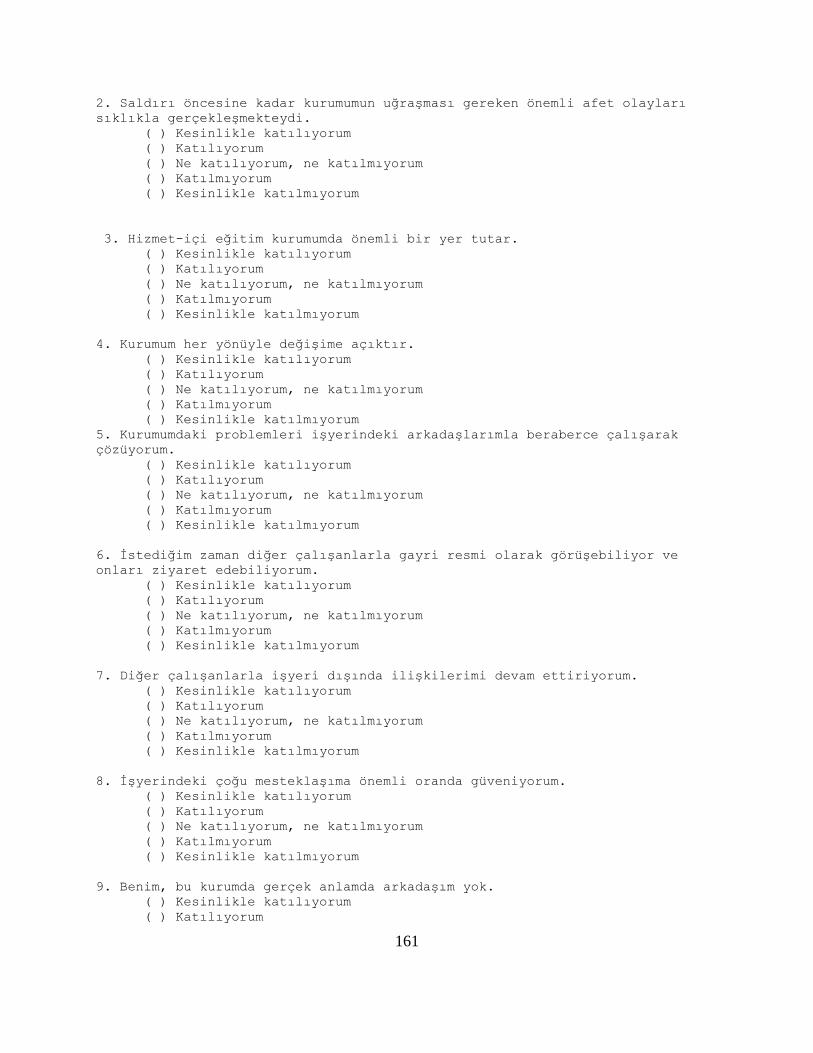
161
2. Saldırı öncesine kadar kurumumun uğraşması gereken önemli afet olayları
sıklıkla gerçekleşmekteydi.
( ) Kesinlikle katılıyorum
( ) Katılıyorum
( ) Ne katılıyorum, ne katılmıyorum
( ) Katılmıyorum
( ) Kesinlikle katılmıyorum
3. Hizmet-içi eğitim kurumumda önemli bir yer tutar.
( ) Kesinlikle katılıyorum
( ) Katılıyorum
( ) Ne katılıyorum, ne katılmıyorum
( ) Katılmıyorum
( ) Kesinlikle katılmıyorum
4. Kurumum her yönüyle değişime açıktır.
( ) Kesinlikle katılıyorum
( ) Katılıyorum
( ) Ne katılıyorum, ne katılmıyorum
( ) Katılmıyorum
( ) Kesinlikle katılmıyorum
5. Kurumumdaki problemleri işyerindeki arkadaşlarımla beraberce çalışarak
çözüyorum.
( ) Kesinlikle katılıyorum
( ) Katılıyorum
( ) Ne katılıyorum, ne katılmıyorum
( ) Katılmıyorum
( ) Kesinlikle katılmıyorum
6. İstediğim zaman diğer çalışanlarla gayri resmi olarak görüşebiliyor ve
onları ziyaret edebiliyorum.
( ) Kesinlikle katılıyorum
( ) Katılıyorum
( ) Ne katılıyorum, ne katılmıyorum
( ) Katılmıyorum
( ) Kesinlikle katılmıyorum
7. Diğer çalışanlarla işyeri dışında ilişkilerimi devam ettiriyorum.
( ) Kesinlikle katılıyorum
( ) Katılıyorum
( ) Ne katılıyorum, ne katılmıyorum
( ) Katılmıyorum
( ) Kesinlikle katılmıyorum
8. İşyerindeki çoğu mesteklaşıma önemli oranda güveniyorum.
( ) Kesinlikle katılıyorum
( ) Katılıyorum
( ) Ne katılıyorum, ne katılmıyorum
( ) Katılmıyorum
( ) Kesinlikle katılmıyorum
9. Benim, bu kurumda gerçek anlamda arkadaşım yok.
( ) Kesinlikle katılıyorum
( ) Katılıyorum
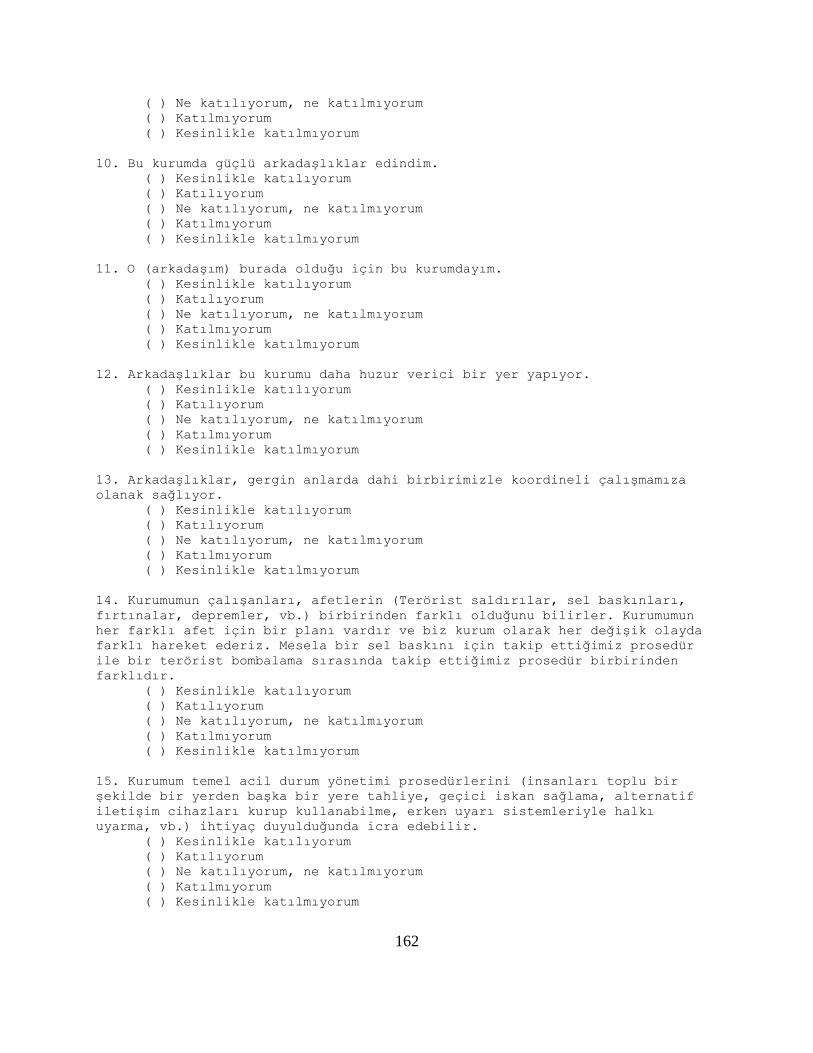
162
( ) Ne katılıyorum, ne katılmıyorum
( ) Katılmıyorum
( ) Kesinlikle katılmıyorum
10. Bu kurumda güçlü arkadaşlıklar edindim.
( ) Kesinlikle katılıyorum
( ) Katılıyorum
( ) Ne katılıyorum, ne katılmıyorum
( ) Katılmıyorum
( ) Kesinlikle katılmıyorum
11. O (arkadaşım) burada olduğu için bu kurumdayım.
( ) Kesinlikle katılıyorum
( ) Katılıyorum
( ) Ne katılıyorum, ne katılmıyorum
( ) Katılmıyorum
( ) Kesinlikle katılmıyorum
12. Arkadaşlıklar bu kurumu daha huzur verici bir yer yapıyor.
( ) Kesinlikle katılıyorum
( ) Katılıyorum
( ) Ne katılıyorum, ne katılmıyorum
( ) Katılmıyorum
( ) Kesinlikle katılmıyorum
13. Arkadaşlıklar, gergin anlarda dahi birbirimizle koordineli çalışmamıza
olanak sağlıyor.
( ) Kesinlikle katılıyorum
( ) Katılıyorum
( ) Ne katılıyorum, ne katılmıyorum
( ) Katılmıyorum
( ) Kesinlikle katılmıyorum
14. Kurumumun çalışanları, afetlerin (Terörist saldırılar, sel baskınları,
fırtınalar, depremler, vb.) birbirinden farklı olduğunu bilirler. Kurumumun
her farklı afet için bir planı vardır ve biz kurum olarak her değişik olayda
farklı hareket ederiz. Mesela bir sel baskını için takip ettiğimiz prosedür
ile bir terörist bombalama sırasında takip ettiğimiz prosedür birbirinden
farklıdır.
( ) Kesinlikle katılıyorum
( ) Katılıyorum
( ) Ne katılıyorum, ne katılmıyorum
( ) Katılmıyorum
( ) Kesinlikle katılmıyorum
15. Kurumum temel acil durum yönetimi prosedürlerini (insanları toplu bir
şekilde bir yerden başka bir yere tahliye, geçici iskan sağlama, alternatif
iletişim cihazları kurup kullanabilme, erken uyarı sistemleriyle halkı
uyarma, vb.) ihtiyaç duyulduğunda icra edebilir.
( ) Kesinlikle katılıyorum
( ) Katılıyorum
( ) Ne katılıyorum, ne katılmıyorum
( ) Katılmıyorum
( ) Kesinlikle katılmıyorum
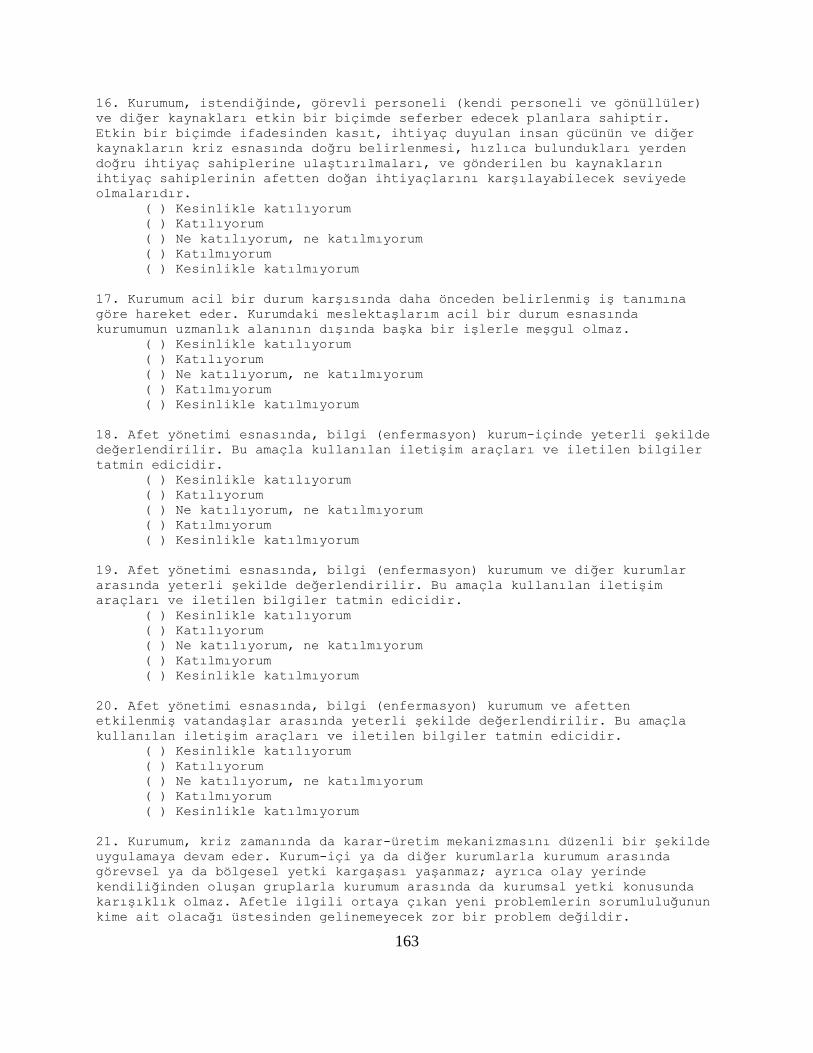
163
16. Kurumum, istendiğinde, görevli personeli (kendi personeli ve gönüllüler)
ve diğer kaynakları etkin bir biçimde seferber edecek planlara sahiptir.
Etkin bir biçimde ifadesinden kasıt, ihtiyaç duyulan insan gücünün ve diğer
kaynakların kriz esnasında doğru belirlenmesi, hızlıca bulundukları yerden
doğru ihtiyaç sahiplerine ulaştırılmaları, ve gönderilen bu kaynakların
ihtiyaç sahiplerinin afetten doğan ihtiyaçlarını karşılayabilecek seviyede
olmalarıdır.
( ) Kesinlikle katılıyorum
( ) Katılıyorum
( ) Ne katılıyorum, ne katılmıyorum
( ) Katılmıyorum
( ) Kesinlikle katılmıyorum
17. Kurumum acil bir durum karşısında daha önceden belirlenmiş iş tanımına
göre hareket eder. Kurumdaki meslektaşlarım acil bir durum esnasında
kurumumun uzmanlık alanının dışında başka bir işlerle meşgul olmaz.
( ) Kesinlikle katılıyorum
( ) Katılıyorum
( ) Ne katılıyorum, ne katılmıyorum
( ) Katılmıyorum
( ) Kesinlikle katılmıyorum
18. Afet yönetimi esnasında, bilgi (enfermasyon) kurum-içinde yeterli şekilde
değerlendirilir. Bu amaçla kullanılan iletişim araçları ve iletilen bilgiler
tatmin edicidir.
( ) Kesinlikle katılıyorum
( ) Katılıyorum
( ) Ne katılıyorum, ne katılmıyorum
( ) Katılmıyorum
( ) Kesinlikle katılmıyorum
19. Afet yönetimi esnasında, bilgi (enfermasyon) kurumum ve diğer kurumlar
arasında yeterli şekilde değerlendirilir. Bu amaçla kullanılan iletişim
araçları ve iletilen bilgiler tatmin edicidir.
( ) Kesinlikle katılıyorum
( ) Katılıyorum
( ) Ne katılıyorum, ne katılmıyorum
( ) Katılmıyorum
( ) Kesinlikle katılmıyorum
20. Afet yönetimi esnasında, bilgi (enfermasyon) kurumum ve afetten
etkilenmiş vatandaşlar arasında yeterli şekilde değerlendirilir. Bu amaçla
kullanılan iletişim araçları ve iletilen bilgiler tatmin edicidir.
( ) Kesinlikle katılıyorum
( ) Katılıyorum
( ) Ne katılıyorum, ne katılmıyorum
( ) Katılmıyorum
( ) Kesinlikle katılmıyorum
21. Kurumum, kriz zamanında da karar-üretim mekanizmasını düzenli bir şekilde
uygulamaya devam eder. Kurum-içi ya da diğer kurumlarla kurumum arasında
görevsel ya da bölgesel yetki kargaşası yaşanmaz; ayrıca olay yerinde
kendiliğinden oluşan gruplarla kurumum arasında da kurumsal yetki konusunda
karışıklık olmaz. Afetle ilgili ortaya çıkan yeni problemlerin sorumluluğunun
kime ait olacağı üstesinden gelinemeyecek zor bir problem değildir.
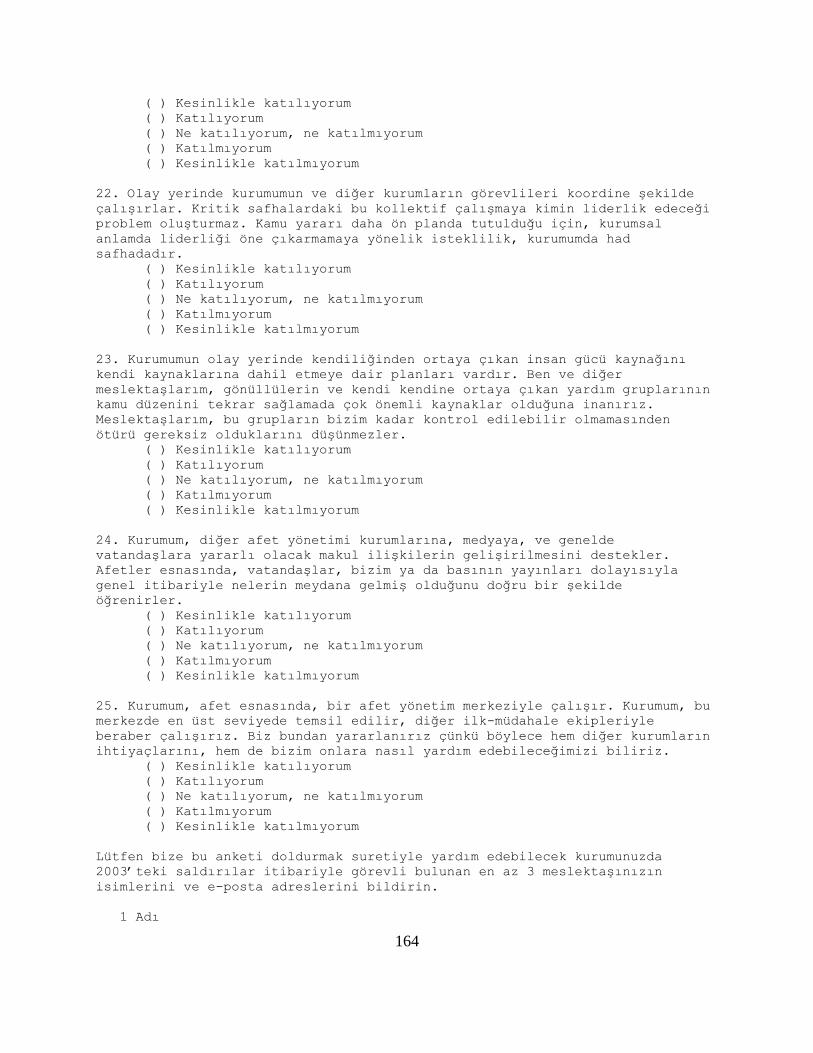
164
( ) Kesinlikle katılıyorum
( ) Katılıyorum
( ) Ne katılıyorum, ne katılmıyorum
( ) Katılmıyorum
( ) Kesinlikle katılmıyorum
22. Olay yerinde kurumumun ve diğer kurumların görevlileri koordine şekilde
çalışırlar. Kritik safhalardaki bu kollektif çalışmaya kimin liderlik edeceği
problem oluşturmaz. Kamu yararı daha ön planda tutulduğu için, kurumsal
anlamda liderliği öne çıkarmamaya yönelik isteklilik, kurumumda had
safhadadır.
( ) Kesinlikle katılıyorum
( ) Katılıyorum
( ) Ne katılıyorum, ne katılmıyorum
( ) Katılmıyorum
( ) Kesinlikle katılmıyorum
23. Kurumumun olay yerinde kendiliğinden ortaya çıkan insan gücü kaynağını
kendi kaynaklarına dahil etmeye dair planları vardır. Ben ve diğer
meslektaşlarım, gönüllülerin ve kendi kendine ortaya çıkan yardım gruplarının
kamu düzenini tekrar sağlamada çok önemli kaynaklar olduğuna inanırız.
Meslektaşlarım, bu grupların bizim kadar kontrol edilebilir olmamasınden
ötürü gereksiz olduklarını düşünmezler.
( ) Kesinlikle katılıyorum
( ) Katılıyorum
( ) Ne katılıyorum, ne katılmıyorum
( ) Katılmıyorum
( ) Kesinlikle katılmıyorum
24. Kurumum, diğer afet yönetimi kurumlarına, medyaya, ve genelde
vatandaşlara yararlı olacak makul ilişkilerin gelişirilmesini destekler.
Afetler esnasında, vatandaşlar, bizim ya da basının yayınları dolayısıyla
genel itibariyle nelerin meydana gelmiş olduğunu doğru bir şekilde
öğrenirler.
( ) Kesinlikle katılıyorum
( ) Katılıyorum
( ) Ne katılıyorum, ne katılmıyorum
( ) Katılmıyorum
( ) Kesinlikle katılmıyorum
25. Kurumum, afet esnasında, bir afet yönetim merkeziyle çalışır. Kurumum, bu
merkezde en üst seviyede temsil edilir, diğer ilk-müdahale ekipleriyle
beraber çalışırız. Biz bundan yararlanırız çünkü böylece hem diğer kurumların
ihtiyaçlarını, hem de bizim onlara nasıl yardım edebileceğimizi biliriz.
( ) Kesinlikle katılıyorum
( ) Katılıyorum
( ) Ne katılıyorum, ne katılmıyorum
( ) Katılmıyorum
( ) Kesinlikle katılmıyorum
Lütfen bize bu anketi doldurmak suretiyle yardım edebilecek kurumunuzda
2003’teki saldırılar itibariyle görevli bulunan en az 3 meslektaşınızın
isimlerini ve e-posta adreslerini bildirin.
1 Adı
165
____________________________________________
1 Email Adresi
____________________________________________
2 Adı
____________________________________________
2 Email Adresi
____________________________________________
3 Adı
____________________________________________
3 Email Adresi
____________________________________________
4 Adı
____________________________________________
4 Email Adresi
____________________________________________
5 Adı
____________________________________________
5 Email Adresi
____________________________________________
6 Adı
____________________________________________
6 Email Adresi
____________________________________________
=============================================
Tesekkurler!!
=============================================
Anketimize katildiginiz icin tesekkurler. Katiliminiz bizim icin cok
onemlidir.
166
5.4.3 Survey for Emergency Management Organizations (Spain)
=======================================
Encuesta para las Organizaciones que Manejan Emergencias
=======================================
=============================================
CONSENTIMIENTO PARA PARTICIPAR EN UN ESTUDIO DE INVESTIGACIÓN
=============================================
Información del investigador: Bahadir Sahin
Departamento de Asuntos Públicos
+ (1) 646-220-0628 (Móvil)
I. Título del estudio: Factores que influencian la eficacia de
las redes de la gestión de crisis: Una perspectiva comparativa
II. INTRODUCCIÓN: El número creciente de desastres artificiales y
naturales fuerza a los responsables políticos a hacer políticas más eficaces
de la gestión de crisis. Puesto que la gestión de crisis no puede ser
conducida por una sola entidad, es un esfuerzo de colaboración de la red
entre organizaciones públicas del primer respondedor, instituciones no
lucrativas de ayuda humanitaria y otras entidades del público y privadas.
Ineficaz gestión de la crisis políticas coordinar la respuesta y esfuerzos de
recuperación se traducirá en fracasos que costaron numerosas vidas humanas y
grandes daños materiales a público y privado infraestructuras. Los desastres
se producirán en un mayor aumento de la tasa en el futuro (por ejemplo,
Inundaciones en Iowa en junio de 2008). La gestión de las crisis políticas y
organizaciones debe estar lista para peor condiciones para ser más eficaces y
salvar más vidas humanas y dificultar más daños a la propiedad en futuros
desastres.
Sobre la base de esta información de la literatura, se le pedirá
25 preguntas sobre las condiciones de organización usted está en. Se tardará
10 minutos de su tiempo. Su participación es muy apreciada. Si usted le pidió
que (Por correo, e-mail o por teléfono), El investigador también
proporcionará una copia del formulario de consentimiento a usted.
III. Su confidencialidad será vigilado.
Si tiene alguna pregunta acerca de su participación en este proyecto de
investigación, Usted puede presentar una reclamación con UCF Environmental
Health & Safety, Risk and Insurance Office, P.O. Box 163500, Orlando, FL
32816-3500 (407) 823-6300.
IV. Si usted tiene alguna otra pregunta, usted también puede contactar
el Investigador principal:
Thomas Wan
Profesor y Director
Programa Doctoral de Asuntos Públicos
167
+ (1) 407-823-3678
He leído y entendido la información en esta forma. Estoy más de 17 años de
edad. Doy mi consentimiento para tomar parte en esta investigación titulada
“Factores que influencian la eficacia de las redes de la gestión de crisis:
Una perspectiva comparativa”.
=============================================
Encuesta para las Organizaciones que Manejan Emergencias
=============================================
Esta revisión examina la eficacia de operaciones de la emergencia durante la
matanza del 11M en Madrid. La revisión toma aproximadamente 15 minutos para
completar. Sus respuestas son confidenciales, y no serán reveladas sin su
consentimiento; sólo resultados agregados serán hechos disponibles. Somos
felices hacer una copia de final le pasa disponible.
Organización del Empleado:
( ) Salud
( ) Aplicación de la Ley
( ) Equipo de Buscar y Rescatar
( ) Organización de Dirección de Emergencia No lucrativa (Cruz Roja...)
( ) Institución de Educación
( ) Cuerpo de Bomberos
( ) Centro de Crisis
Posición de Empleado:
( ) Supervisor
( ) Gerente Medio
( ) Gerente de Primera línea
( ) Asistente del Supervisor
( ) Líder de Equipo
( ) Trabajador de Primera línea
Género de Empleado:
( ) Masculino
( ) Femenino
Edad:
____________________________________________
Aviso Importante: Todas las siguientes preguntas cubrirán el tiempo ANTES de
que ocurriera la matanza del 11M en España. Por favor conteste las preguntas
para la situación en su organización ANTES de la matanza del 11M.
1. Hubo cambio (s) importante en mi organización (estructura, objetivos, y
reglas) debido a un acontecimiento (Inundación, ataque terrorista, huracán,
fuego de arbusto, terremoto etc.…) importante.
( ) Completamente de acuerdo
( ) De acuerdo
( ) Neutro
( ) Desacuerdo en parte
( ) No estoy de acuerdo
168
2. Hubo acontecimientos importantes con los cuales mi organización debería
tratar con frecuencia hasta ahora.
( ) Completamente de acuerdo
( ) De acuerdo
( ) Neutro
( ) Desacuerdo en parte
( ) No estoy de acuerdo
3. La educación intraorganizativa sostiene un lugar importante en mi
organización.
( ) Completamente de acuerdo
( ) De acuerdo
( ) Neutro
( ) Desacuerdo en parte
( ) No estoy de acuerdo
4. Mi organización está dispuesta a adaptar cualquier medio de cambios.
( ) Completamente de acuerdo
( ) De acuerdo
( ) Neutro
( ) Desacuerdo en parte
( ) No estoy de acuerdo
5. Trabajo con mis compañeros de trabajo para colectivamente solucionar los
problemas en la organización.
( ) Completamente de acuerdo
( ) De acuerdo
( ) Neutro
( ) Desacuerdo en parte
( ) No estoy de acuerdo
6. Tengo la posibilidad de hablar y visitar a los otros empleados
informalmente.
( ) Completamente de acuerdo
( ) De acuerdo
( ) Neutro
( ) Desacuerdo en parte
( ) No estoy de acuerdo
7. Socializo con los compañeros de trabajo fuera del trabajo.
( ) Completamente de acuerdo
( ) De acuerdo
( ) Neutro
( ) Desacuerdo en parte
( ) No estoy de acuerdo
8. Confío mucho en mis compañeros de trabajo.
( ) Completamente de acuerdo
( ) De acuerdo
( ) Neutro
( ) Desacuerdo en parte
( ) No estoy de acuerdo
9. No pienso que algún compañero de trabajo sea un amigo verdadero.
( ) Completamente de acuerdo
169
( ) De acuerdo
( ) Neutro
( ) Desacuerdo en parte
( ) No estoy de acuerdo
10. Formé grandes amistades en el trabajo.
( ) Completamente de acuerdo
( ) De acuerdo
( ) Neutro
( ) Desacuerdo en parte
( ) No estoy de acuerdo
11. Trabajo para la organización porque ella/él está aquí.
( ) Completamente de acuerdo
( ) De acuerdo
( ) Neutro
( ) Desacuerdo en parte
( ) No estoy de acuerdo
12. Las amistades hacen más feliz el lugar de trabajo.
( ) Completamente de acuerdo
( ) De acuerdo
( ) Neutro
( ) Desacuerdo en parte
( ) No estoy de acuerdo
13. Las amistades ayudan a uno trabajar cooperativamente durante tiempos de
tensión.
( ) Completamente de acuerdo
( ) De acuerdo
( ) Neutro
( ) Desacuerdo en parte
( ) No estoy de acuerdo
14. Los empleados de mi organización saben que cada acontecimiento extremo
(bombardeos terroristas, inundación, tormenta de invierno, terremoto, huracán
etc.) es diferente. Mi organización tiene planes y actúa diferentemente en
cada acontecimiento extremo. Por ejemplo, usaríamos un procedimiento
operacional diferente para una inundación que para un bombardeo terrorista.
( ) Completamente de acuerdo
( ) De acuerdo
( ) Neutro
( ) Desacuerdo en parte
( ) No estoy de acuerdo
15. Mi organización está lista para cualquier función de manejos de
emergencias (evacuación, alojamiento temporal, instrumentos de comunicación
alternativos, advertencias etc.)
( ) Completamente de acuerdo
( ) De acuerdo
( ) Neutro
( ) Desacuerdo en parte
( ) No estoy de acuerdo
170
16. Mi organización tiene planes de movilizar el personal (empleados
autorizados y voluntarios) y recursos con eficacia. Con eficacia, quiero
decir que el personal y los recursos necesarios son bien identificados
durante la crisis, son localizados y obtenidos rápidamente y correctamente, y
son apropiados para los problemas generados por el desastre.
( ) Completamente de acuerdo
( ) De acuerdo
( ) Neutro
( ) Desacuerdo en parte
( ) No estoy de acuerdo
17. Mi organización tiene cierta definición de trabajo durante un
acontecimiento extremo. Los empleados de mi organización no se envuelven en
otros tipos de trabajo durante un acontecimiento extremo que sea diferente a
la profesionalización de mi organización.
( ) Completamente de acuerdo
( ) De acuerdo
( ) Neutro
( ) Desacuerdo en parte
( ) No estoy de acuerdo
18. La información es procesada adecuadamente dentro de mi organización
durante un desastre. Los instrumentos de comunicación y el material
comunicado son satisfactorios.
( ) Completamente de acuerdo
( ) De acuerdo
( ) Neutro
( ) Desacuerdo en parte
( ) No estoy de acuerdo
19. La información es procesada adecuadamente entre mi organización y otras
organizaciones que responden durante un desastre. Los instrumentos de
comunicación y el material comunicado son satisfactorios.
( ) Completamente de acuerdo
( ) De acuerdo
( ) Neutro
( ) Desacuerdo en parte
( ) No estoy de acuerdo
20. La información es procesada adecuadamente entre mi organización y los
ciudadanos afectados durante un desastre. Los instrumentos de comunicación y
el material comunicado son satisfactorios.
( ) Completamente de acuerdo
( ) De acuerdo
( ) Neutro
( ) Desacuerdo en parte
( ) No estoy de acuerdo
21. Mi organización también sigue tomando decisiones correctamente durante el
tiempo de crisis. Las diferencias de jurisdicción organizativas dentro de o
fuera de la organización no pueden ser un problema; los grupos emergentes y
mi organización no tienen conflicto en esferas organizativas. La
responsabilidad de nuevas tareas de desastre no es un problema que no podemos
resolver fácilmente.
( ) Completamente de acuerdo
171
( ) De acuerdo
( ) Neutro
( ) Desacuerdo en parte
( ) No estoy de acuerdo
22. Los empleados de mi organización trabajan juntos con los empleados de las
otras organizaciones durante la crisis. El mando en fases críticas no es un
problema. Como el bien de la comunidad es más importante para nosotros, el
deseo de subrayar las reclamaciones organizativas del mando son altas en mi
organización.
( ) Completamente de acuerdo
( ) De acuerdo
( ) Neutro
( ) Desacuerdo en parte
( ) No estoy de acuerdo
23. Mi organización tiene planes de incluir los recursos emergentes en el
trabajo organizativo durante un desastre. Mis otros colegas y yo creemos que
los voluntarios y los otros accionistas emergentes son fuentes importantes
para devolver la orden social. Los empleados de mi organización no piensan
que los recursos emergentes son inútiles porque no son controlables como
somos nosotros.
( ) Completamente de acuerdo
( ) De acuerdo
( ) Neutro
( ) Desacuerdo en parte
( ) No estoy de acuerdo
24. Mi organización apoya el desarrollo de relaciones que son aceptables y
beneficiosas para las organizaciones que responden, los medios de
comunicación y los ciudadanos en general. Durante acontecimientos extremos,
los ciudadanos están satisfechos con el retrato relativamente exacto proveído
vía nuestros sistemas radiofónicos o de la prensa de lo que está ocurriendo.
( ) Completamente de acuerdo
( ) De acuerdo
( ) Neutro
( ) Desacuerdo en parte
( ) No estoy de acuerdo
25. Mi organización trabaja con un centro de dirección de emergencia (EOC)
durante desastres. Somos representados en EOC en el nivel más alto posible,
trabajamos cooperativamente con los otros respondedores, nos beneficiamos de
ello ya que sabemos lo que los demás hacen y como podemos ayudarles.
( ) Completamente de acuerdo
( ) De acuerdo
( ) Neutro
( ) Desacuerdo en parte
( ) No estoy de acuerdo
Por favor dé nombres y direcciones de correo electrónico de al menos 3 (tres)
otros empleados de su organización que puedan ayudarnos con este estudio a
mejorar esfuerzos del manejo de emergencias.
=============================================
172
1 Nombre, Título
____________________________________________
1 Correo electrónico
____________________________________________
2 Nombre, Título
____________________________________________
2 Correo electrónico
____________________________________________
3 Nombre, Título
____________________________________________
3 Correo electrónico
____________________________________________
4 Nombre, Título
____________________________________________
4 Correo electrónico
____________________________________________
5 Nombre, Título
____________________________________________
5 Correo electrónico
____________________________________________
6 Nombre, Título
____________________________________________
6 Correo electrónico
____________________________________________
=============================================
Gracias
=============================================
¡Gracias por su ayuda! Le agradecemos sinceramente su participación.
173
5.4.4 Survey for Emergency Management Organizations (UK)
=============================================
RESEARCH USE INFORMED CONSENT FORM
=============================================
Researcher Information: Bahadir Sahin
Department of Public Affairs
+ (1) 646-220-0628 (cell)
I. PROJECT TITLE: Factors Influencing Effectiveness of Crisis
Management Networks: A Comparative Perspective
II. INTRODUCTION: Increased number of manmade and natural disasters forces
the policy makers to make more effective crisis management policies. Since
the crisis management cannot be conducted by one single entity, it is a
collaborative network effort among first responder public organizations,
non-profit disaster relief institutions and other public and private
entities. Ineffective crisis management policies coordinating the response
and recovery efforts will result in failures that cost numerous human
lives and great material damages to public and private infrastructures.
The disasters will occur in a more increasing rate in the future (e.g.
Iowa Floods in June 2008). The crisis management policies and
organizations should be ready for worse conditions to be more effective
and to save more human lives and hinder more property damage in future
disasters.
Based on this information from the literature, you will be asked 25
questions regarding the organizational conditions you are in. It will
probably take 10 minutes of your time. Your participation is greatly
appreciated. If you requested it (by mail, e-mail, or phone, the
researcher will also provide a copy of consent form to you.
III. Your confidentiality will be guarded.
If you have any questions about participation into this research project,
you may file a claim with UCF Environmental Health & Safety, Risk and
Insurance Office, P.O. Box 163500, Orlando, FL 32816-3500 (407) 823-6300.
IV. If you have any other questions, you may also contact the principal
investigator:
Thomas Wan
Professor and Director
Doctoral Program in Public Affairs
+ (1) 407-823-3678
I have read and understood the information in this form. I am at least 18
years of age. I consent to take part in this research entitled “Factors
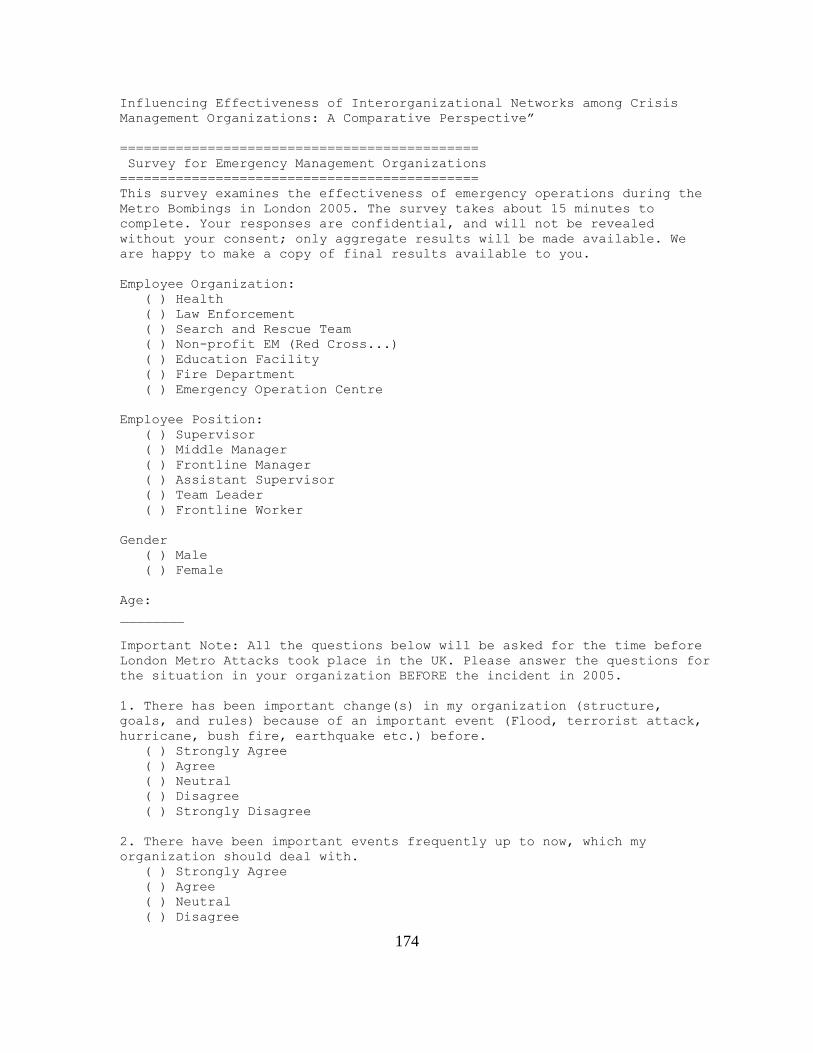
174
Influencing Effectiveness of Interorganizational Networks among Crisis
Management Organizations: A Comparative Perspective”
=============================================
Survey for Emergency Management Organizations
=============================================
This survey examines the effectiveness of emergency operations during the
Metro Bombings in London 2005. The survey takes about 15 minutes to
complete. Your responses are confidential, and will not be revealed
without your consent; only aggregate results will be made available. We
are happy to make a copy of final results available to you.
Employee Organization:
( ) Health
( ) Law Enforcement
( ) Search and Rescue Team
( ) Non-profit EM (Red Cross...)
( ) Education Facility
( ) Fire Department
( ) Emergency Operation Centre
Employee Position:
( ) Supervisor
( ) Middle Manager
( ) Frontline Manager
( ) Assistant Supervisor
( ) Team Leader
( ) Frontline Worker
Gender
( ) Male
( ) Female
Age:
________
Important Note: All the questions below will be asked for the time before
London Metro Attacks took place in the UK. Please answer the questions for
the situation in your organization BEFORE the incident in 2005.
1. There has been important change(s) in my organization (structure,
goals, and rules) because of an important event (Flood, terrorist attack,
hurricane, bush fire, earthquake etc.) before.
( ) Strongly Agree
( ) Agree
( ) Neutral
( ) Disagree
( ) Strongly Disagree
2. There have been important events frequently up to now, which my
organization should deal with.
( ) Strongly Agree
( ) Agree
( ) Neutral
( ) Disagree
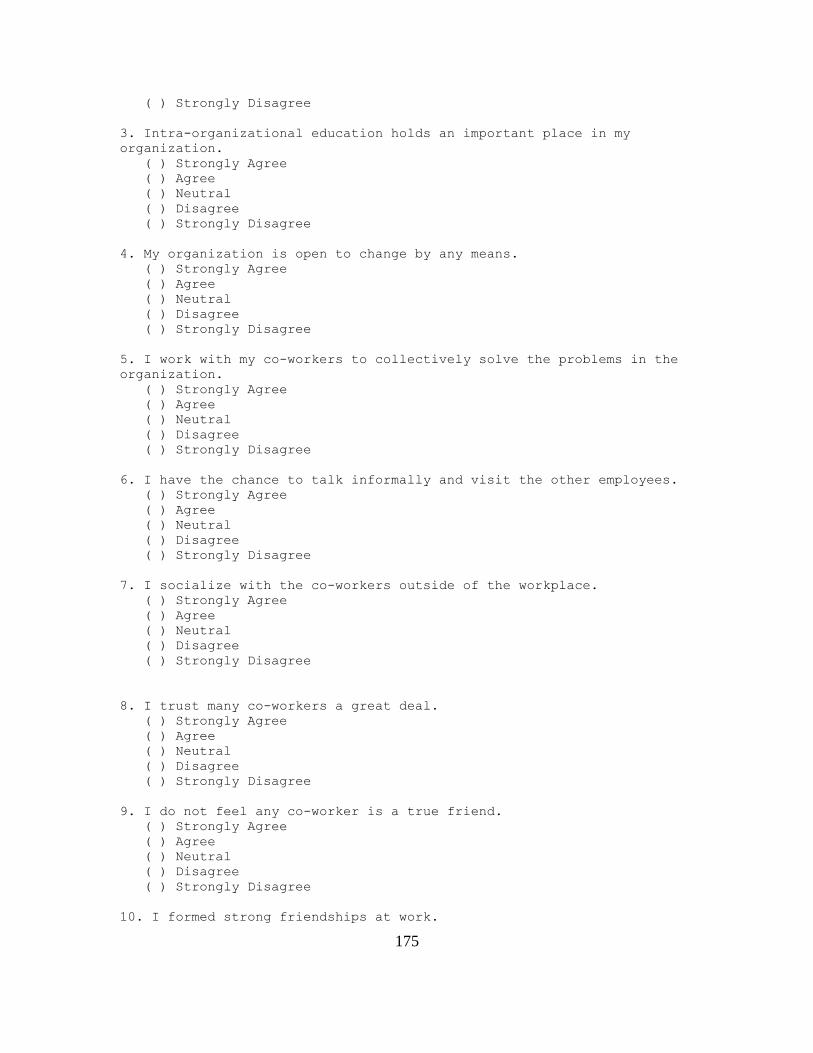
175
( ) Strongly Disagree
3. Intra-organizational education holds an important place in my
organization.
( ) Strongly Agree
( ) Agree
( ) Neutral
( ) Disagree
( ) Strongly Disagree
4. My organization is open to change by any means.
( ) Strongly Agree
( ) Agree
( ) Neutral
( ) Disagree
( ) Strongly Disagree
5. I work with my co-workers to collectively solve the problems in the
organization.
( ) Strongly Agree
( ) Agree
( ) Neutral
( ) Disagree
( ) Strongly Disagree
6. I have the chance to talk informally and visit the other employees.
( ) Strongly Agree
( ) Agree
( ) Neutral
( ) Disagree
( ) Strongly Disagree
7. I socialize with the co-workers outside of the workplace.
( ) Strongly Agree
( ) Agree
( ) Neutral
( ) Disagree
( ) Strongly Disagree
8. I trust many co-workers a great deal.
( ) Strongly Agree
( ) Agree
( ) Neutral
( ) Disagree
( ) Strongly Disagree
9. I do not feel any co-worker is a true friend.
( ) Strongly Agree
( ) Agree
( ) Neutral
( ) Disagree
( ) Strongly Disagree
10. I formed strong friendships at work.
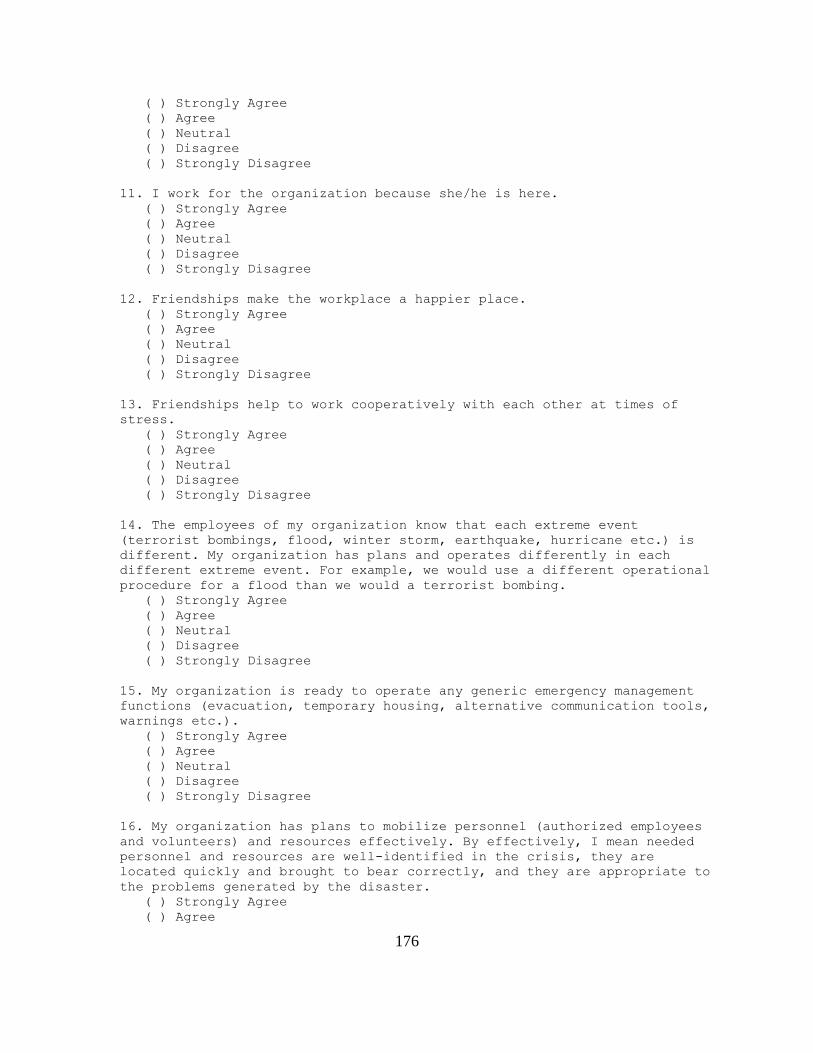
176
( ) Strongly Agree
( ) Agree
( ) Neutral
( ) Disagree
( ) Strongly Disagree
11. I work for the organization because she/he is here.
( ) Strongly Agree
( ) Agree
( ) Neutral
( ) Disagree
( ) Strongly Disagree
12. Friendships make the workplace a happier place.
( ) Strongly Agree
( ) Agree
( ) Neutral
( ) Disagree
( ) Strongly Disagree
13. Friendships help to work cooperatively with each other at times of
stress.
( ) Strongly Agree
( ) Agree
( ) Neutral
( ) Disagree
( ) Strongly Disagree
14. The employees of my organization know that each extreme event
(terrorist bombings, flood, winter storm, earthquake, hurricane etc.) is
different. My organization has plans and operates differently in each
different extreme event. For example, we would use a different operational
procedure for a flood than we would a terrorist bombing.
( ) Strongly Agree
( ) Agree
( ) Neutral
( ) Disagree
( ) Strongly Disagree
15. My organization is ready to operate any generic emergency management
functions (evacuation, temporary housing, alternative communication tools,
warnings etc.).
( ) Strongly Agree
( ) Agree
( ) Neutral
( ) Disagree
( ) Strongly Disagree
16. My organization has plans to mobilize personnel (authorized employees
and volunteers) and resources effectively. By effectively, I mean needed
personnel and resources are well-identified in the crisis, they are
located quickly and brought to bear correctly, and they are appropriate to
the problems generated by the disaster.
( ) Strongly Agree
( ) Agree
177
( ) Neutral
( ) Disagree
( ) Strongly Disagree
17. My organization has a certain job definition during an extreme event.
My organization’s employees do not get involved in other kinds of labour
during an extreme event different than the professionalization of my
organization.
( ) Strongly Agree
( ) Agree
( ) Neutral
( ) Disagree
( ) Strongly Disagree
18. Information is processed adequately within my organization during a
disaster. Communication tools and communicated material are satisfactory.
( ) Strongly Agree
( ) Agree
( ) Neutral
( ) Disagree
( ) Strongly Disagree
19. Information is processed adequately between my organization and other
responding organizations during a disaster. Communication tools and
communicated material are satisfactory.
( ) Strongly Agree
( ) Agree
( ) Neutral
( ) Disagree
( ) Strongly Disagree
20. Information is processed adequately between my organization and
affected citizens during a disaster. Communication tools and communicated
material are satisfactory.
( ) Strongly Agree
( ) Agree
( ) Neutral
( ) Disagree
( ) Strongly Disagree
21. My organization keeps exercising decision-making properly in the
crisis time as well. The organizational jurisdiction differences within or
outside of the organization cannot be a problem; emergent groups and my
organization do not have a conflict on organizational domains.
Responsibility for new disaster tasks is not a problem that we cannot
resolve easily.
( ) Strongly Agree
( ) Agree
( ) Neutral
( ) Disagree
( ) Strongly Disagree
22. My organization’s employees work coordinative with the other
organization employees in the crisis scene. Leadership in critical phases
is not a problem. Since community good is more important to us, the
178
willingness to de-emphasize organizational claims of leadership is high in
my organization.
( ) Strongly Agree
( ) Agree
( ) Neutral
( ) Disagree
( ) Strongly Disagree
23. My organization has plans to include the emerging resources into the
organizational labour during a disaster. I and my other colleagues believe
that volunteers and other emergent stakeholders are important sources to
bring the social order back. My organization employees do not think that
the emergent resources are useless because they are not controllable as we
are.
( ) Strongly Agree
( ) Agree
( ) Neutral
( ) Disagree
( ) Strongly Disagree
24. My organization supports the developments of relationships that are
acceptable and beneficial to the responding organizations, the mass media
and citizens in general. During extreme events, citizens are satisfied
with the relatively accurate picture of what is going on via our
broadcasting systems or press.
( ) Strongly Agree
( ) Agree
( ) Neutral
( ) Disagree
( ) Strongly Disagree
25. My organization works with an emergency operation centre (EOC) during
disasters. We are represented in EOC in the highest level possible, we
work co-operatively with the other responders, we benefit from it since we
know what the others are doing and how we can help them.
( ) Strongly Agree
( ) Agree
( ) Neutral
( ) Disagree
( ) Strongly Disagree
Please give names and email addresses of at least 3 (three) other
employees that took part in recovery efforts at WTC Attacks from your
organization that can help us with this study to improve emergency
management efforts.
1 Name
____________________________________________
1 Email
____________________________________________
2 Name
____________________________________________

179
2 Email
____________________________________________
3 Name
____________________________________________
3 Email
____________________________________________
4 Name
____________________________________________
4 Email
____________________________________________
5 Name
____________________________________________
5 Email
____________________________________________
6 Name
____________________________________________
6 Email
____________________________________________
=============================================
Thank You!
=============================================
Thank you for taking our survey. Your response is very important to us.

180
APPENDIX B: RESPONDENTS’ LOCATIONS
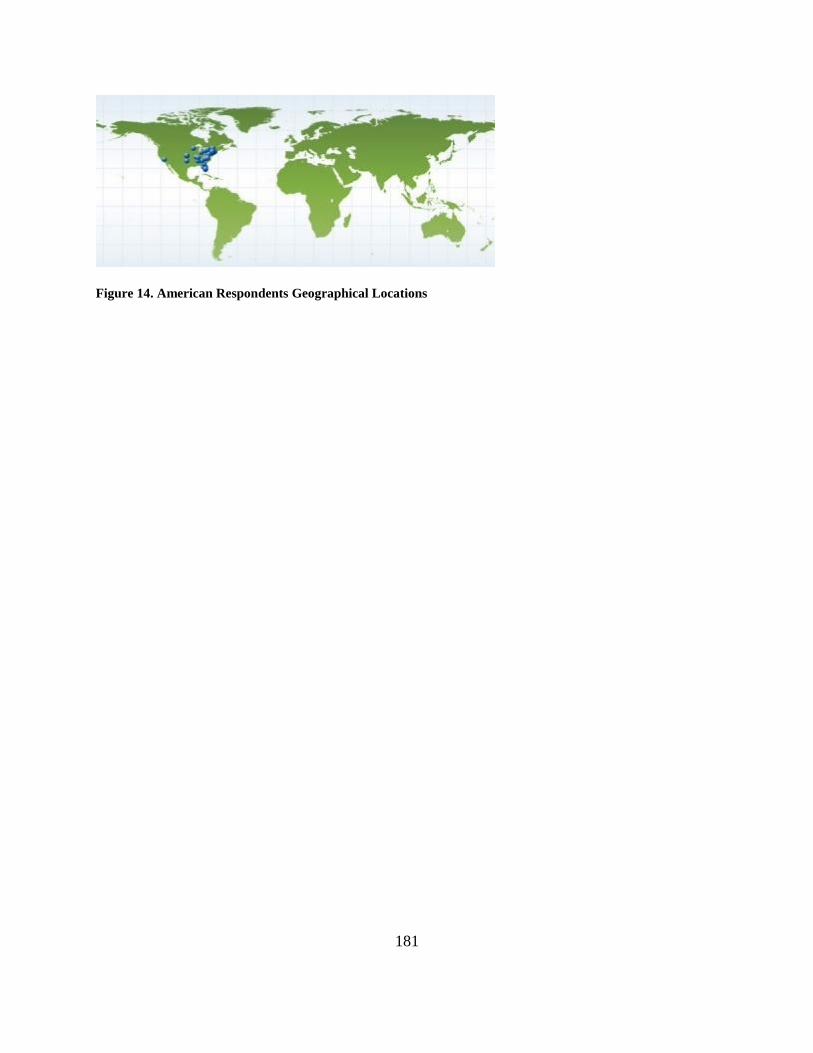
181
Figure 14. American Respondents Geographical Locations
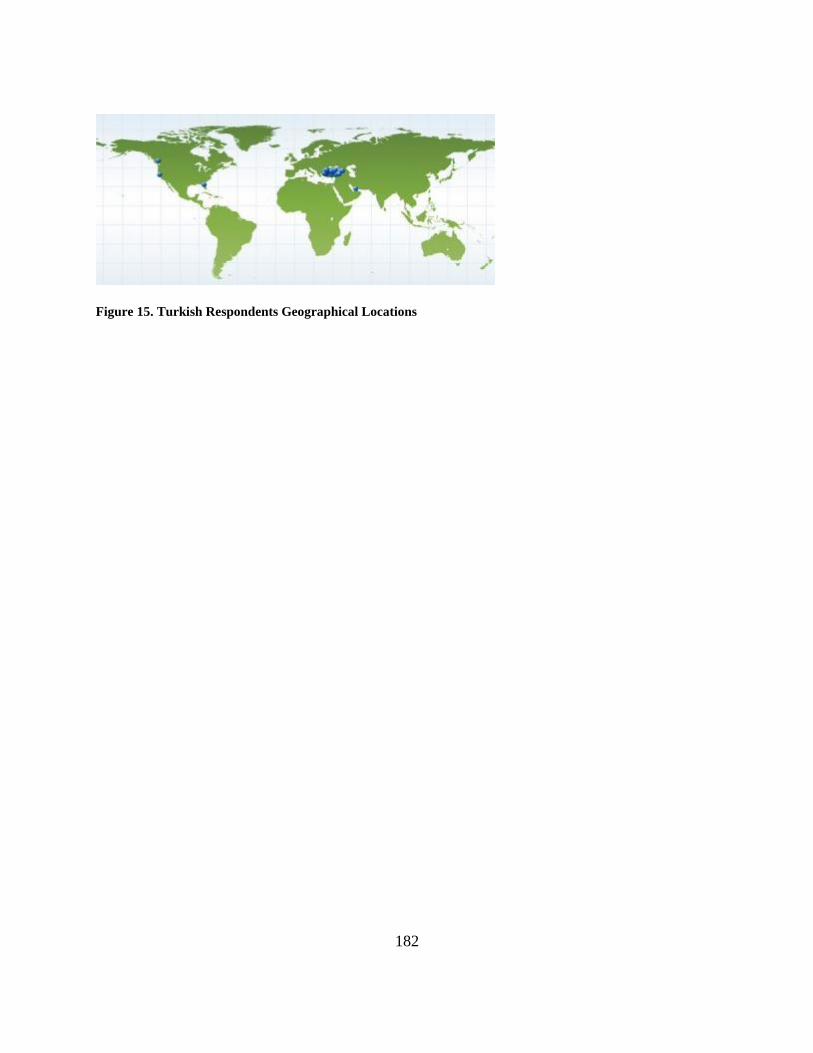
182
Figure 15. Turkish Respondents Geographical Locations

183
APPENDIX C: EXTRA TABLES AND FIGURES
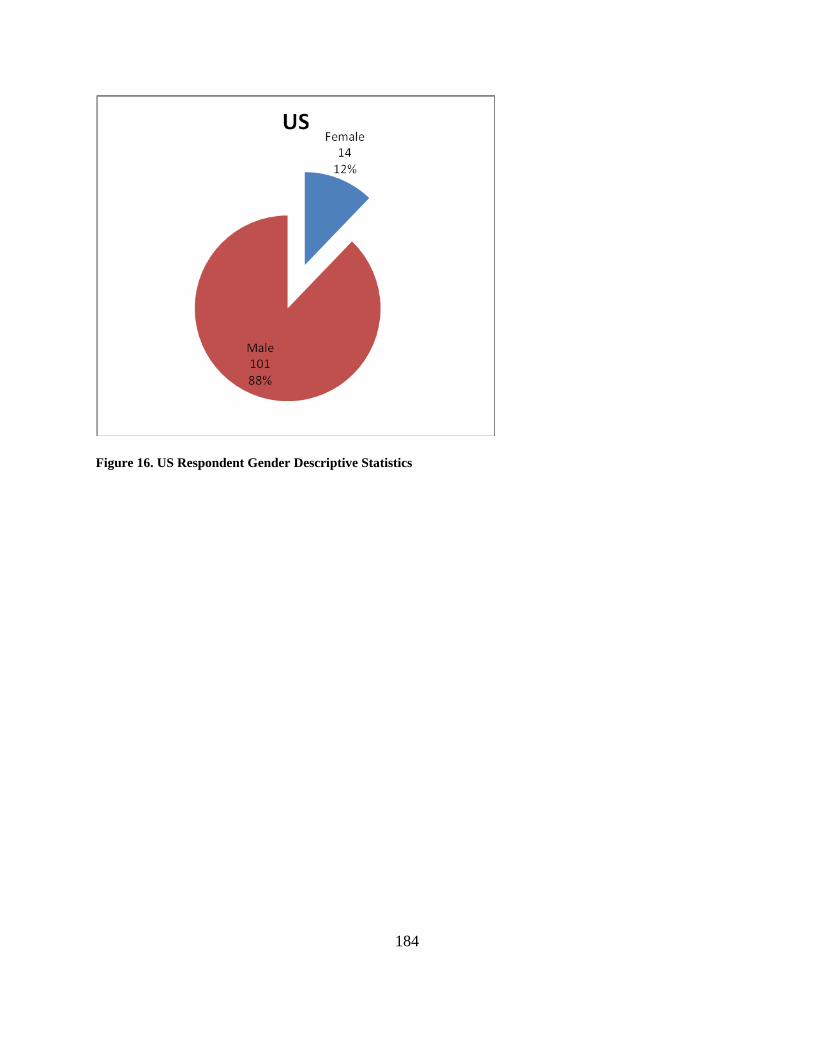
184
Figure 16. US Respondent Gender Descriptive Statistics

185
Figure 17. Turkey Respondent Gender Descriptive Statistics
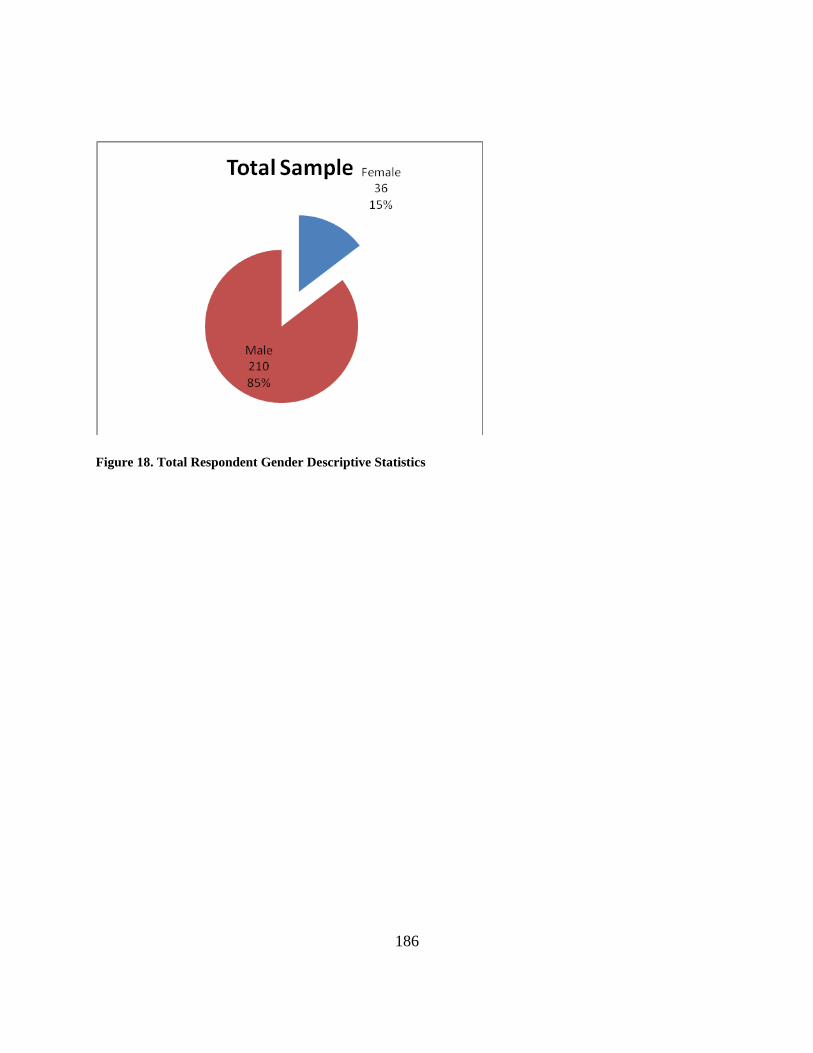
186
Figure 18. Total Respondent Gender Descriptive Statistics
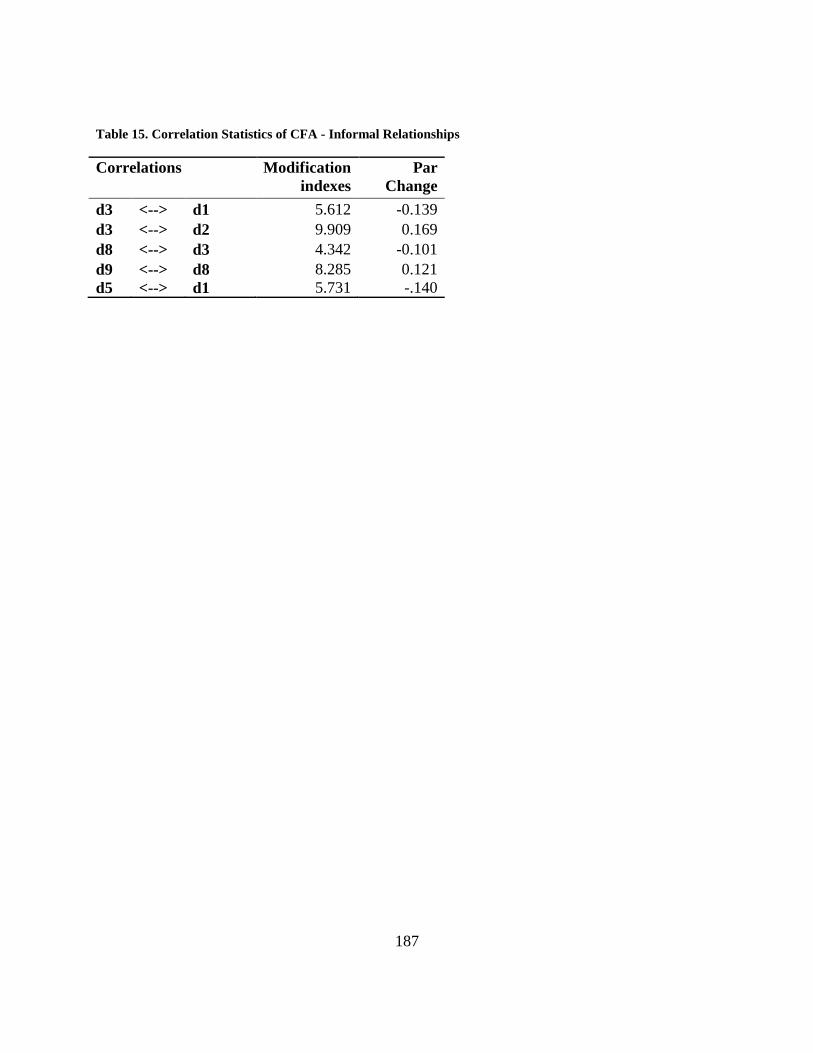
187
Table 15. Correlation Statistics of CFA - Informal Relationships
Correlations Modification
indexes
Par
Change
d3 <--> d1 5.612 -0.139
d3 <--> d2 9.909 0.169
d8 <--> d3 4.342 -0.101
d9 <--> d8 8.285 0.121
d5 <--> d1 5.731 -.140
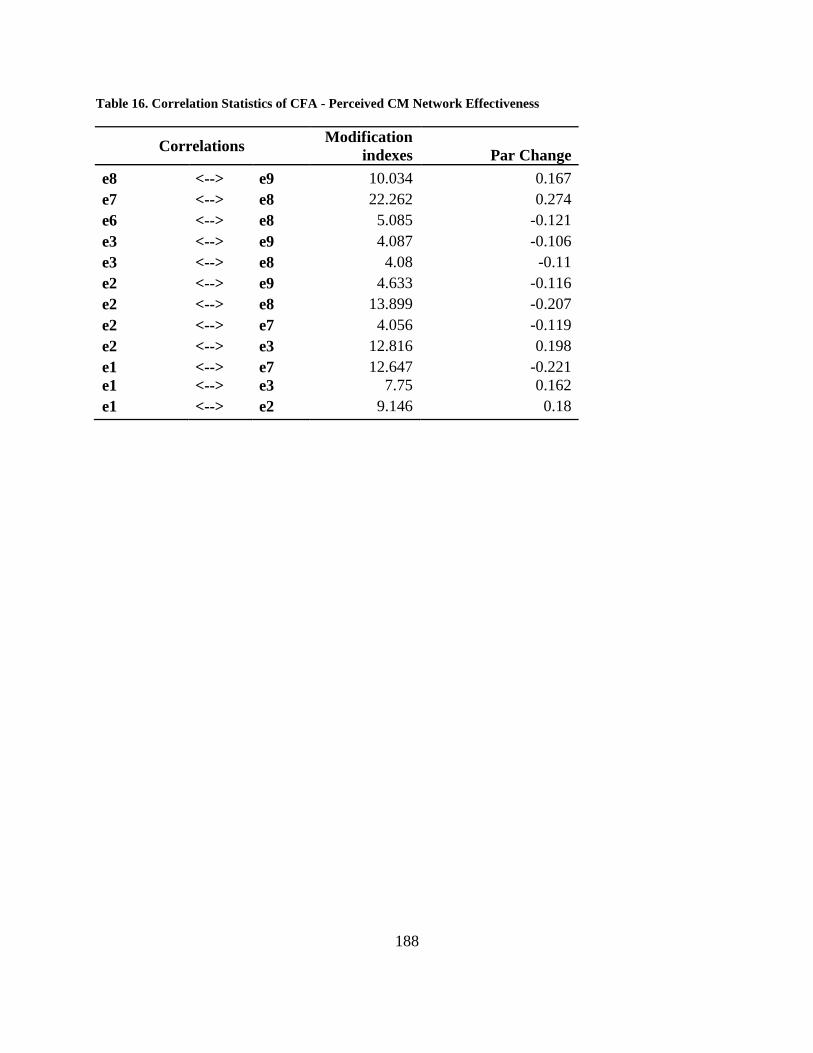
188
Table 16. Correlation Statistics of CFA - Perceived CM Network Effectiveness
Correlations Modification
indexes Par Change
e8 <--> e9 10.034 0.167
e7 <--> e8 22.262 0.274
e6 <--> e8 5.085 -0.121
e3 <--> e9 4.087 -0.106
e3 <--> e8 4.08 -0.11
e2 <--> e9 4.633 -0.116
e2 <--> e8 13.899 -0.207
e2 <--> e7 4.056 -0.119
e2 <--> e3 12.816 0.198
e1 <--> e7 12.647 -0.221
e1 <--> e3 7.75 0.162
e1 <--> e2 9.146 0.18
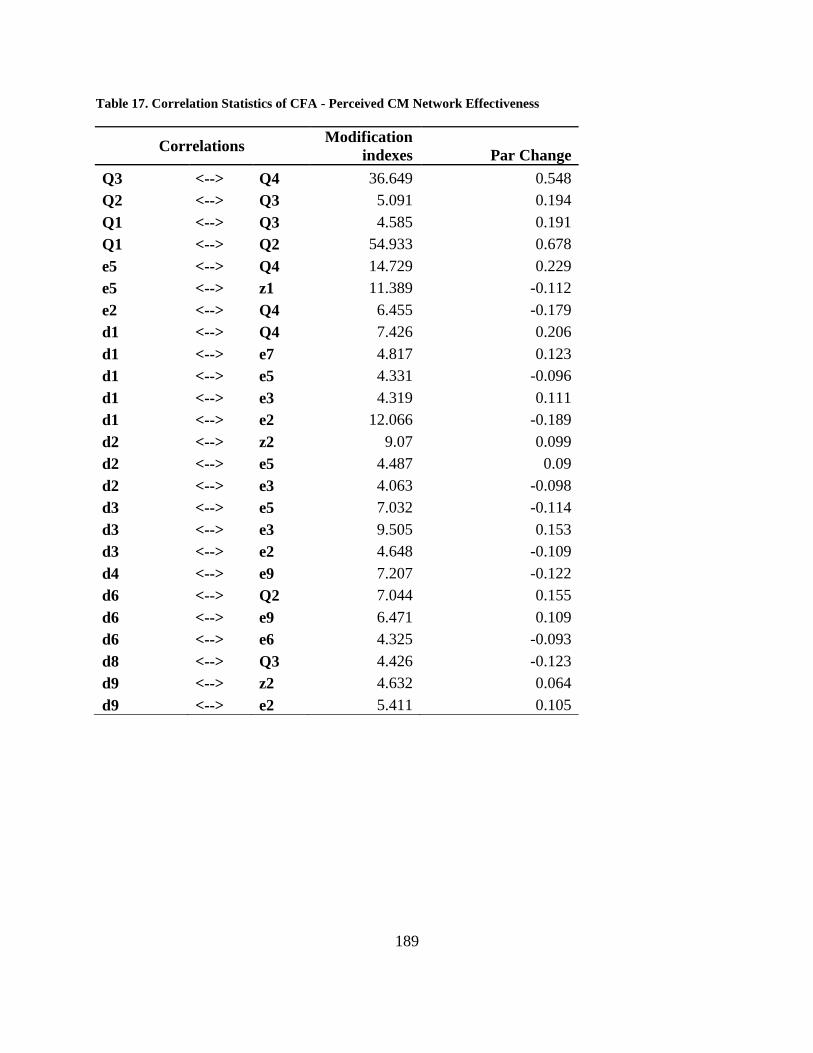
189
Table 17. Correlation Statistics of CFA - Perceived CM Network Effectiveness
Correlations Modification
indexes Par Change
Q3 <--> Q4 36.649 0.548
Q2 <--> Q3 5.091 0.194
Q1 <--> Q3 4.585 0.191
Q1 <--> Q2 54.933 0.678
e5 <--> Q4 14.729 0.229
e5 <--> z1 11.389 -0.112
e2 <--> Q4 6.455 -0.179
d1 <--> Q4 7.426 0.206
d1 <--> e7 4.817 0.123
d1 <--> e5 4.331 -0.096
d1 <--> e3 4.319 0.111
d1 <--> e2 12.066 -0.189
d2 <--> z2 9.07 0.099
d2 <--> e5 4.487 0.09
d2 <--> e3 4.063 -0.098
d3 <--> e5 7.032 -0.114
d3 <--> e3 9.505 0.153
d3 <--> e2 4.648 -0.109
d4 <--> e9 7.207 -0.122
d6 <--> Q2 7.044 0.155
d6 <--> e9 6.471 0.109
d6 <--> e6 4.325 -0.093
d8 <--> Q3 4.426 -0.123
d9 <--> z2 4.632 0.064
d9 <--> e2 5.411 0.105
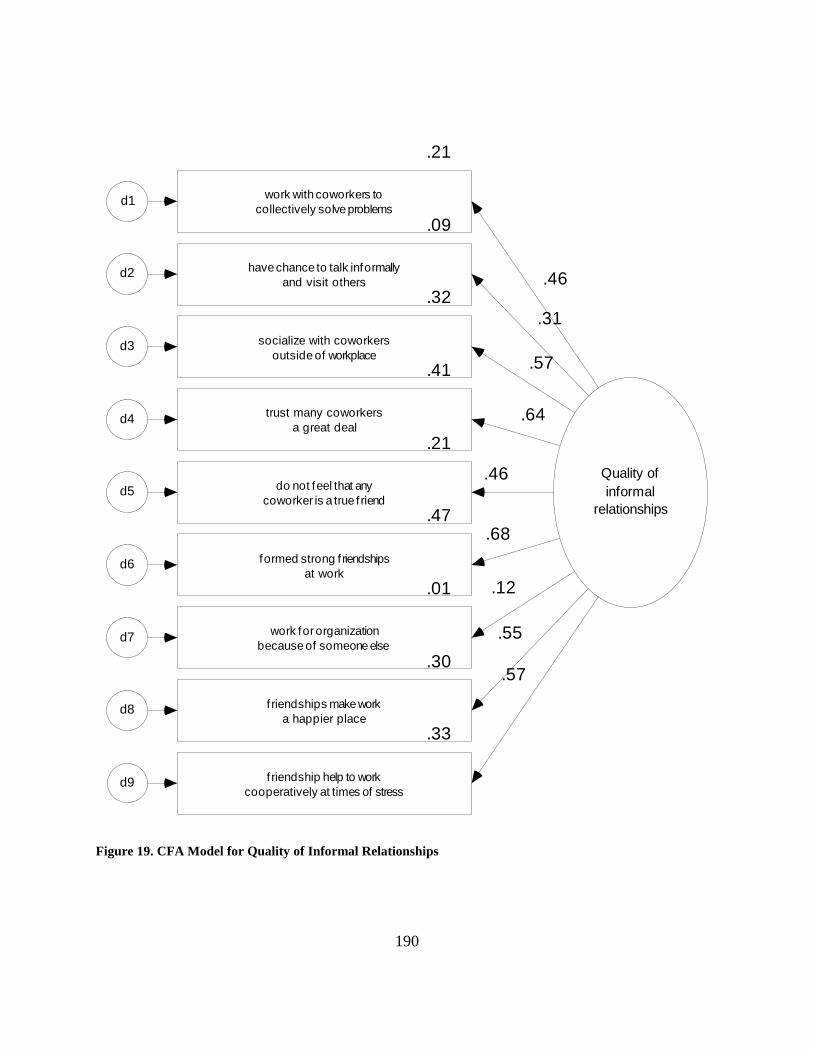
190
Quality of
informal
relationships
.33
f riendship help to work
cooperatively at times of stressd9
.57.30
f riendships make work
a happier placed8
.55
.01
work for organization
because of someone elsed7
.12
.47
formed strong f riendships
at workd6
.68
.21
do not feel that any
coworker is a true f riendd5
.46
.41
trust many coworkers
a great deald4 .64
.32
socialize with coworkers
outside of workplaced3
.57
.09
have chance to talk informally
and visit othersd2
.31
.21
work with coworkers to
collectively solve problemsd1
.46
Figure 19. CFA Model for Quality of Informal Relationships
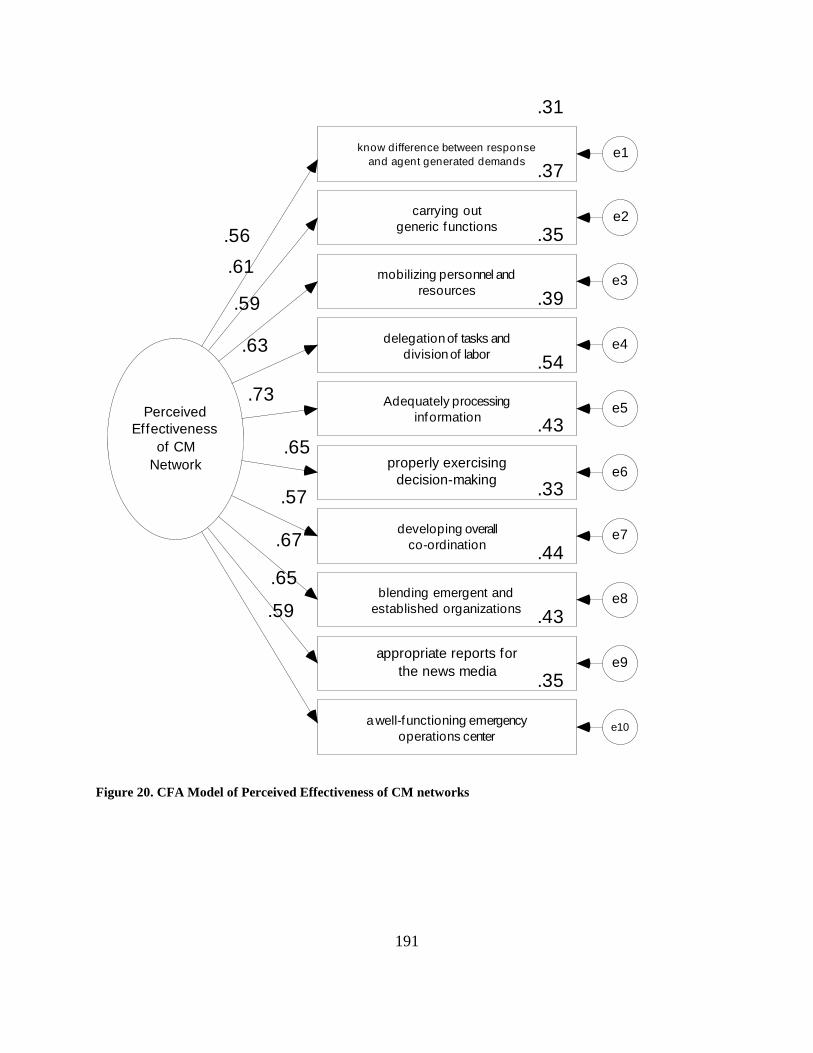
191
Perceived
Effectiveness
of CM
Network
.31
know difference between response
and agent generated demandse1
.37
carrying out
generic functionse2
.35
mobilizing personnel and
resourcese3
.39
delegation of tasks and
division of labore4
.54
Adequately processing
informatione5
.43
properly exercising
decision-makinge6
.33
developing overall
co-ordinatione7
.44
blending emergent and
established organizationse8
.43
appropriate reports for
the news mediae9
.61
.59
.63
.73
.65
.57
.67
.65
.35
a well-functioning emergency
operations centere10
.59
.56
Figure 20. CFA Model of Perceived Effectiveness of CM networks
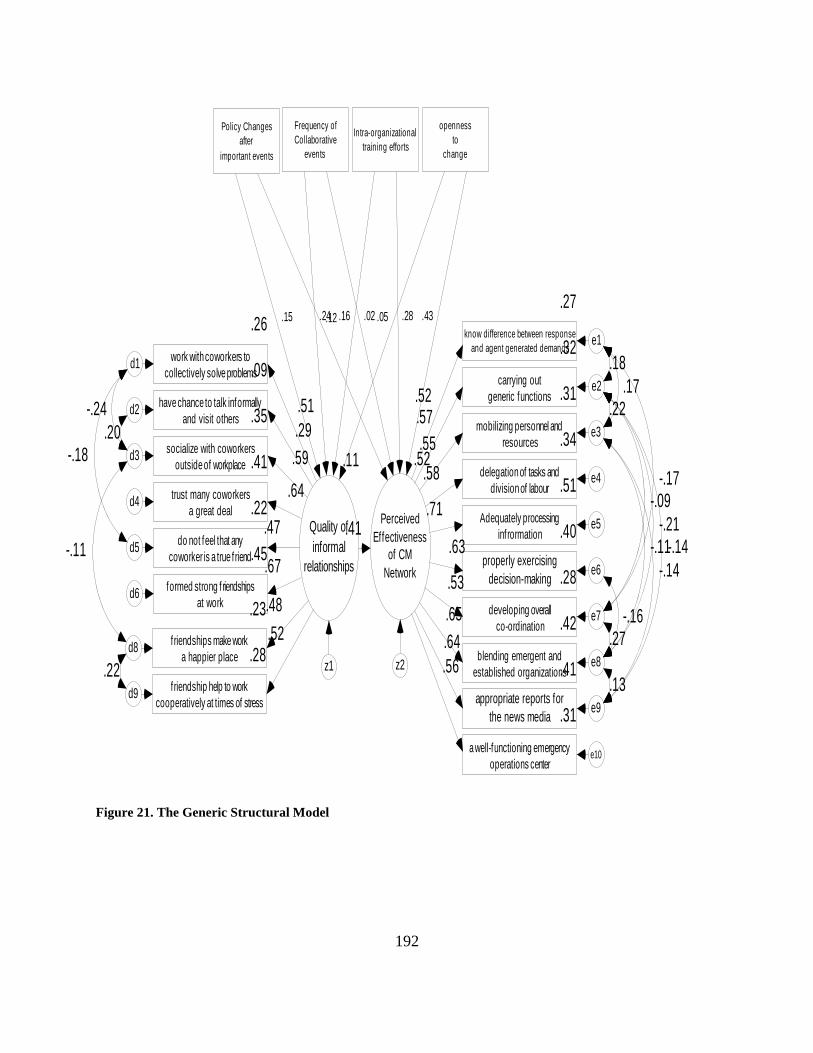
192
.11
Quality of
informal
relationships
.28
f riendship help to work
cooperatively at times of stressd9
.52
.23
f riendships make work
a happier placed8
.48
.45
formed strong f riendships
at workd6
.67
.22
do not feel that any
coworker is a true f riendd5
.47
.41
trust many coworkers
a great deald4
.64
.35
socialize with coworkers
outside of workplaced3 .59
.09
have chance to talk informally
and visit othersd2
.29
.26
work with coworkers to
collectively solve problemsd1
.51
.52
Perceived
Effectiveness
of CM
Network
.27
know difference between response
and agent generated demandse1
.32
carrying out
generic functionse2
.31
mobilizing personnel and
resourcese3
.34
delegation of tasks and
division of laboure4
.51
Adequately processing
infrormatione5
.40
properly exercising
decision-makinge6
.28
developing overall
co-ordinatione7
.42
blending emergent and
established organizationse8
.41
appropriate reports for
the news mediae9
.57
.55
.58
.71
.63
.53
.65
.64
.31
a well-functioning emergency
operations centere10
.56
.52
Policy Changes
after
important events
Frequency of
Collaborative
events
Intra-organizational
training efforts
openness
to
change
.15 .12.24 .02 .28.16 .05 .43
.41
z1 z2
.18
.22.17
-.17-.09
-.21-.14-.11
-.14
-.16.27
.13
.20
-.24
-.18
-.11
.22
Figure 21. The Generic Structural Model
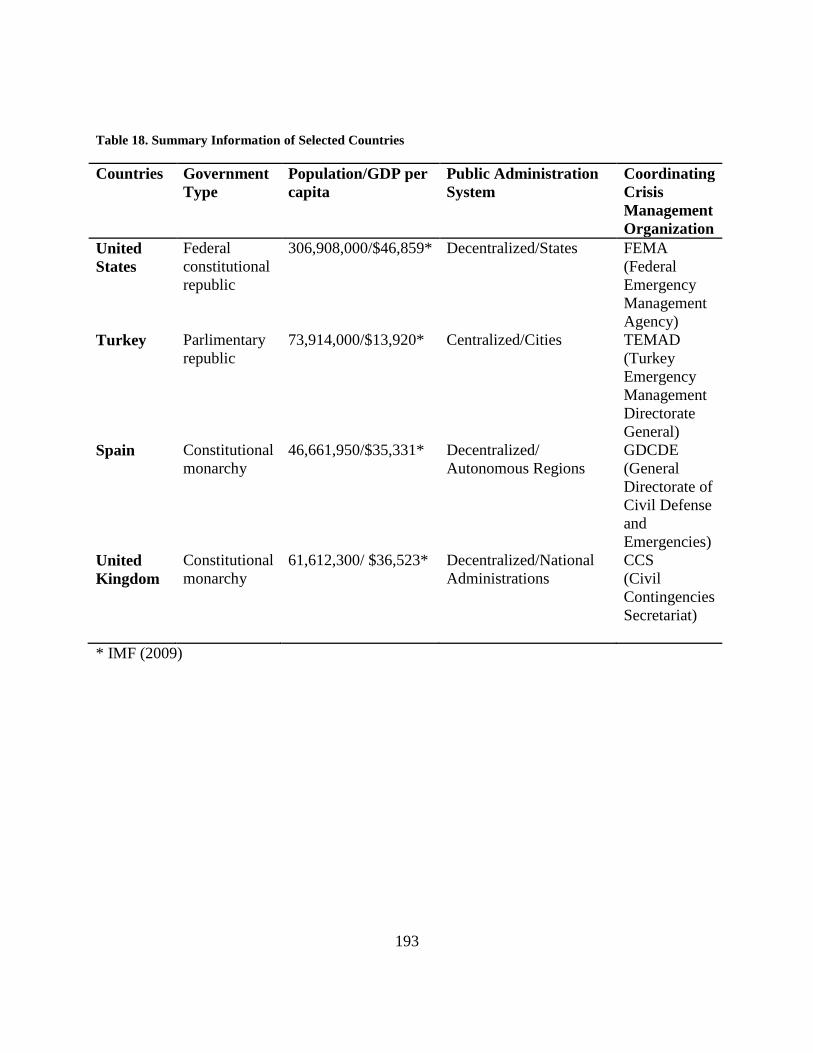
193
Table 18. Summary Information of Selected Countries
Countries Government
Type
Population/GDP per
capita
Public Administration
System
Coordinating
Crisis
Management
Organization
United
States
Federal
constitutional
republic
306,908,000/$46,859* Decentralized/States FEMA
(Federal
Emergency
Management
Agency)
Turkey Parlimentary
republic
73,914,000/$13,920* Centralized/Cities TEMAD
(Turkey
Emergency
Management
Directorate
General)
Spain Constitutional
monarchy
46,661,950/$35,331* Decentralized/
Autonomous Regions
GDCDE
(General
Directorate of
Civil Defense
and
Emergencies)
United
Kingdom
Constitutional
monarchy
61,612,300/ $36,523* Decentralized/National
Administrations
CCS
(Civil
Contingencies
Secretariat)
* IMF (2009)

194
APPENDIX D: IRB APPROVAL
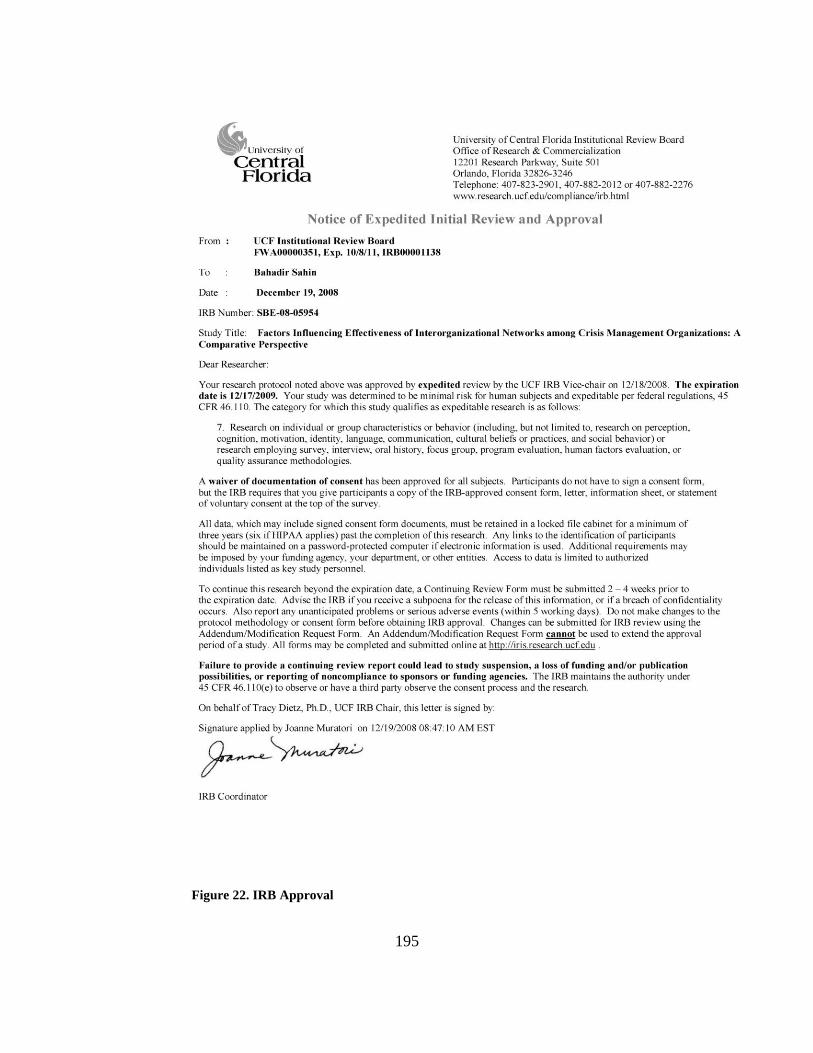
195
Figure 22. IRB Approval
196
REFERENCE
Abrahms, M. (2008). What Terrorists Really Want: Terrorist Motives and Counterterrorism
Strategy. International Security, 32 (4), 78-105.
Agranoff, R. & McGuire M. (2001). Big Questions in Public Network Management Research.
Journal of Public Administration Research and Theory, 11(3), 295-326.
Aguirre, B. E. (2004). Homeland Security Warnings: Lessons Learned And Unlearned. Newark,
Delaware: Disaster Research Center.
Akdag, S. (2002). Mali yapi ve denetim boyutlariyla afet yonetimi (Disaster management in
terms of financial and monitoring aspects), Sayıştay Araştırma/İnceleme/Çeviri Dizisi:20,
Sayıştay Yayın İşleri Müdürlüğü, Ankara.
Alexander, D. (2005). Towards the development of a standard in emergency planning, Disaster
Prevention and Management, 14(2), 158-175.
Anderson, P. (1999). Complexity Theory and Organization Science, Organization Science,10(3),
216-232.
Arbuckle, J. L. (2006). Amos (Version 16.0) [Computer Program]. Chicago: SPSS.
Asaeda, G. (2005) World Trade Centre Attack. Presented at the International Congress on
Disaster Medicine and Emergency Management. Yale, New Haven, September 2005.
Atwan, A. (2006). The Secret History of Al Qaeda. California: University of California Press.
Axelrod, R. & Cohen, M.D. (1999). Harnessing complexity. Free Press, New York, NY.
Baker, F. B. (2001). The Basics of Item Response Theory. ERIC Publications, Washington.
Begun, J.W., Zimmerman, B., Dooley, K.J. (2003), Health care organizations as complex
adaptive systems, in Mick, S.S., Wyttenbach, M.E. (Eds), Advances in Health Care
Organizational Theory, Jossey-Bass, San Francisco.
197
Benter, P. M. & Chou, C. P. (1987). Practical issues in structural modeling. Sociological
Methods and Research, 16(1), 78-117.
Birkland, T. (1997). After disaster: agenda setting, public policy, and focusing events.
Georgetown University Press, Washington DC.
Birkland, T., & Waterman, S. (2008). Is federalism the reason for policy failure in Hurricane
Katrina?, Publius: The Journal of Federalism, 38 (4), 692-714.
Birkland, T.A. (2006). Lessons of disaster: policy change after catastrophic events. Georgetown
University Press, Washington DC.
Boin, R.A. & ‗t Hart, P. (2006). The Crisis Approach. In Quarantelli, E.L., Dynes, R. Rodriguez,
H. (Eds.) Handbook of Disaster Management. New York: Springer.
Bolling, R., Ehrlin, Y., Forsberg, R., Rüter, A., Soest, V. (2007) The Terror Attacks in Madrid,
Spain, 2004 Kamedo-Report 90, National Board of Health and Welfare, Article # 2007-
123-36.
Borgatti, S. (2005). Centrality and network flow. Social Networks , 27 (1), 55-71.
Borgatti, S.P., Everett, M.G. & Freeman, L.C. (2002). UCINET 6.0: Software for Social Network
Analysis. Harvard: Analytic Technologies.
Bremberg, N. & Britz, M. (2007). EU Civil Protection and the New Security Roleof the Union.
Paper presented at the 6th
Pan-European International RelationsConference.Standing
Group on International Relations, Turin 12-15 September.
Buckland, J., & Rahman, M. (1999). Community-based Disaster Management During the 1997
Red River Flood in Canada. Disasters , 23 (2), 174-191.
Byrne, B. M. (2001). Structural Equation Modeling with AMOS – Basic Concepts, Applications,
and Programming, Lawrence Erlbaum Associates.
198
Carley, K.M. (2002), ―Intra-Organizational Computation and Complexity.‖ In J.A.C. Baum
(Ed.), Companion to Organizations. Blackwell Publishers.
Carroll, T., & Burton, R.M. (2000). Organizations and Complexity: Searching for the Edge of
Chaos. Computational & Mathematical Organization Theory, 6(4), 319-337.
Celik, S. (2008).Towards Local and Protective Turkish Disaster Management System,
Dumlupinar Universitesi Sosyal Bilimler Dergisi, 19, 95-116.
Chiva-Gómez, R. (2003). The facilitating factors for organizational learning: bringing ideas from
complex adaptive systems. Knowledge and Process Management, 10(2), 99-114.
Christoplos, I.; Mitchell, J.; Liljelund, A. (2001). ―Reframing Risk: The Changing Context of
Disaster Mitigation and Preparedness.‖ Disasters, 25(3), 185-198.
Civil Contingencies Secretariat (CCS : 2009). Civil Contingencies Act 2004: A Short guide
(revised). www.cabinetoffice.gov.uk/media/132428/15mayshortguide.pdf (accessed May
01, 2009).
Cohen, S., Eimicke, W., & Horan, J. (2002). Catastrophe and the public service: A case study of
the government response to the destruction of the World Trade Center. Public
Administration Review, 62, 24-32.
Comfort L. & Kapucu, N. (2006). Inter-organizational coordination in extreme events: The
World Trade Center attacks, September 11, 2001. Natural Hazards, 39(2), 309-327.
Comfort L.K. (1994). Self-Organization in Complex Systems, Journal of Public Administration
Research and Theory, Vol. 4: 3, pp. 393-410.
Comfort, L. K., & Haase, T. W. (2006). Communication, Coherence, and Collective Action: The
Impact of Hurricane Katrina on Communications Infrastructure. Public Works
Management and Policy , 10 (3), 328-343.
199
Comfort, L.K. (2005). Risk, Security, and Disaster Management. Annual Review of Political
Science, 8(1) 335-356.
Comfort, L.K., Sungu, Y., Johnson, D. & Dunn, M. (2001). Complex Systems in Crisis:
Anticipation and Resilience in Dynamic Environments. Journal of Contingencies and
Crisis Management, 9(3), 144-158.
Corbacioglu, S. & Kapucu N. (2006). Organizational Learning and Self-Adaptation in Dynamic
Environments of Disasters. Disasters: The Journal of Disaster Studies, Policy, and
Management, 30(2), 212-233.
Cornall, R. (2005). New Levels of Government Responsiveness for ‗All-Hazards‘: the
Management of Natural Disasters and Emergencies. Australian Journal of Public
Administration, 64(2) 27-30.
Devitt, K. & Borodzicz, E. (2008). Interwoven Leadership: the Missing Link in Multi-Agency
Major Incident Response. Journal of Contingencies And Crisis Management. 16(4), 208.
Dooley, K. (1997). A Complex Adaptive Systems Model of Organization Change. Nonlinear
Dynamics, Psychology, & Life Science,1(1), 69-97.
Drabek, T.E., Tamminga, H.L., Kilijanek, T.S., & Adams, CR. (1981) Managing
multiorganizational emergency response: Emergency search and rescue net-works in
natural disaster and remote area settings. Boulder, Colorado: Institute of Behavioral
Science, University of Colorado.
Dynes, R. (1989). Emergency planning: False assumptions and inappropriate analogies.
Proceedings of the World Bank Workshop on Risk Management and Safety Control,
1989, Karlstad: Rescue Services Board.
200
Dynes, R. R. & Quarantelli, E.L. (1976). Organizational Communications and Decision Making
in Crises. Ohio State University Columbus Disaster Research, Preliminary Paper no. 17.
Farazmand, A. (2007). Learning from the Katrina Crisis: A Global and International Perspective
with Implications for Future Crisis Management, Public Administration Review, 67(s),
149-159.
Fiol, C. M. & Lyles, M. A. (1985). Organizational learning. Academy of Management Review,
10(4), 803-813.
Gefen, D.; Straub, D.W.; Boudreau, M. (2000). Structural equation modeling and regression:
guidelines for research practice. Communications of the AIS, 1(7), 1-78.
Gillespie, D. F.; Robards, K. J., and Cho, S. (2004). Designing safe systems: Using system
dynamics to understand complexity. Natural Hazards Review, 5(2), 82–88.
Gillespie, D.F., Robards, K.J., & Cho, S. (2003). Acceptable Risk and Mitigation Options:
Dynamic Structure of Building Safety [Final report of the SE-8 project, Mid-America
Earthquake Center], National Science Foundation, USA, December 2003.
Handmer, J. (2003). We are all vulnerable. Australian Journal of Emergency Management,
18(3), 55-60.
Helbing, D., Ammoser, H. & Käuhnert, C. (2005). Disasters as Extreme Events and the
Importance of Networks for Disaster Response Management. Institute for Transport &
Economics, Dresden University of Technology, Germany.
Her Majesty‘s Government (HMG: 2006). Countering International Terrorism: The United
Kingdom’s Strategy. London: The Stationary Office.
HMSO (2004), Civil Contingencies Act 2004, Elizabeth II, The Stationery Office, London.
201
Hoffman, B. (2007). The Global Terrorist Threat: Is Al-Qaeda on the Run or on the March?
Middle East Policy Council , 14 (2), 44-58.
Hofstede, G. (2001). Culture's consequences: Comparing values, behaviors, institutions, and
organizations across nations (2nd ed.). Thousand Oaks , CA : Sage Publications.
Holland, J. H. (2001). Exploring the Evolution of Complexity in Signaling Networks.
Complexity, 7(2), 34-45.
Holland, J. H. (2006). Studying Complex Adaptive Systems. Journal of Systems Science and
Complexity, 19(1), 1-8.
House of Commons (HC: 2006). Report of the Official Account of the Bombings in London on
7th
July 2005, London: The Stationary Office.
Integrated Regional Information Networks (IRIN: 2005). Disaster Reduction and the human cost
of disaster: Web Special Report. UN Office for the Coordination of Humanitarian
Affairs, available at http://www.irinnews.org/pdf/in-depth/Disaster-Reduction-IRIN-In-
Depth.pdf.
International Crisis Group. (2006). Terrorism in Indonesia: Noordin’s networks. Jakarta.
International Federation of Red Cross and Red Crescent Societies (IFRC: 2002). World Disaster
Report 2002, Chapter 8: Disaster data: key trends and statistics.
http://www.ifrc.org/publicat/wdr2002/chapter8.asp. Retrieved on 06.22.2008
International Monetary Fund (IMF: 2009). IMF reports and publications arranged by country.
http://www.imf.org/external/country/index.htm. Retrieved on 07.12.2009
Istanbul Technical University Center of Excellence for Disaster Management, USAID. (2005).
Disaster Management Perspective of Terrorist Attacks in Istanbul on November 15&20,
2003. Istanbul: ITU Press.
202
Jaeger, P.T., Shneiderman, B., Fleischmann, K.R., Preece, J., Qua, Y., Wu, P.F. (2007).
Community response grids: E-government, social networks, and effective emergency
management. Telecommunications Policy, 3(10-11), 592-604.
Kalton, G. & Anderson, D.W. (1986). Sampling Rare Populations. Journal of the Royal
Statistical Society, 149(1), 65-82.
Kapucu, N & Van Wart, M. (2006). The Emerging Role of the Public Sector in Managing
Extreme Events: Lessons Learned. Administration & Society, 38 (3), 279-308.
Kapucu, N. (2006). Interagency Communication Networks During Emergencies: Boundary
Spanners in Multiagency Coordination. The American Review of Public Administration,
36(2), 207.
Kauffman, S.A. (1993). The origins of order. New York: Oxford University Press.
Kean, T. H. & Hamilton, L. (2004). The 9/11 Commission Report: Final Report of the National
Commission on Terrorist Attacks upon the United States: Executive Summary. WW
Norton & Company.
Kenney, M. (2007). From Pablo to Osama: trafficking and terrorist networks, government
bureaucracies, and competitive adaptation. University Park, Pa.: Pennsylvania State
University Press.
Kettl, D. F. (2003). Contingent Coordination: Practical and Theoretical Puzzles for Homeland
Security. The American Review of Public Administration 33(3), 253.
Kiel L.D. (1989). Nonequilibrium theory and its implications for public administration. Public
administration review. 49(6), 544.
Kiel L.D. (1991). Lessons from the nonlinear paradigm: Applications of the theory of dissipative
structures in the social sciences. Social science quarterly. 72(3), 43.
203
Kiel L.D. (1997). Chaos theory and Disaster Response Management: Lessons for managing
periods of extreme instability in: Koehler, G.A (ed), 1996, What disaster Management
can Learn from Chaos Theory, California Research Bureau, California state Library,
Sacremento.
Kirchhoff, B.A. (1977). Organization Effectiveness Measurement and Policy Research. The
Academy of Management Review, 2(3), 347-355.
Krackhardt, D. & R. N. Stern (1988). Informal Networks and Organizational Crises: An
Experimental Simulation. Social Psychology Quarterly 51(2), 123-140.
Levitt, B. & March, J.G. (1988). Organizational Learning. Annual Review of Sociology, 14, 319-
340.
Loehlin, J. C. (1992). Latent variable models. Hillsdale, NJ: Lawrence Erlbaum Publishers.
McEntire, D.A. & Myers, A. (2004). Preparing communities for disasters: issues and processes
for government readiness. Disaster Prevention and Management, 13(2), 140-152.
McKelvey, B. (1999). Self-Organization, Complexity Catastrophe, and Microstate Models at the
Edge of Chaos. In J. A. C. Baum and B. McKelvey (Eds.), Variations in Organization
Science: In Honor of Donald T. Campbell (pp. 279–307). Thousand Oaks CA: Sage.
McNabb, D., (2009) The New Face of Government: How Public Managers Are Forging a New
Approach to Governance, Boca Raton, FL: Auerbach Publications.
Mileti, D. S. (1999) Disasters by Design: The Changing Risk Landscape Implications for
Insurance Risk Management, Aon Group Australia Limited Conference Proceedings.
Ministry Del Interior Website (MDI : 2009) ―General Directorate for Civil Protection and
Emergency: Guidelines.‖ http://www.proteccioncivil.org (translated by Google)
(accessed May 11, 2009).
204
Ministry Del Interior Website (MDI: 2008). General Directorate for Civil Protection and
Emergency: Guidelines. Retrieved on 2.14.2008 from the website
http://www.proteccioncivil.org (translated by Google).
Moffat, J. (2003). Complexity Theory and Network Centric Warfare (Information Age
Transformation Series). Office of the Assistant Secretary of Defense (OASD), Command
& Control Research Program (CCRP), Washington, DC.
Morel, B. & Ramanujam, R. (1999). Through the Looking Glass of Complexity: The Dynamics
of Organizations as Adaptive and Evolving Systems. Organization Science, Special
Issue: Application of Complexity Theory to Organization Science, 10(3), 278-293.
Morrison, R. (2004). Informal Relationships in the Workplace: Associations with Job
Satisfaction, Organisational Commitment and Turnover Intentions. New Zealand Journal
of Psychology, 33(3), 114-128.
Muthén, L., & Muthén, B. (2002). How to use a Monte Carlo study to decide on sample size and
determine power. Structural Equation Modeling, 4, 599–620.
Nielsen, I.K., Jex, S.M. & Adams, G.A. (2000). Development and Validation of Scores on a
Two-Dimensional Workplace Friendship Scale. Educational and Psychological
Measurement, 60(4), 628-643.
O´Brien, G. & Read, P., (2005). Future UK emergency management: new wine, old skin?,
Disaster prevention and management. 14(3), 353-361.
O‘Toole , L. J. (1997). Treating Networks Seriously: Practical and Research-Based Agendas in
Public Administration. Public Administration Review 57(1), 45-52.
Ostroff, C. & Schmitt, N. (1993). Configurations of organizational effectiveness and efficiency.
Academy of Management Journal, 36(6), 1345-1361.
205
Otte, E., & Rousseau, R. (2002). Social network analysis: a powerful strategy, also for the
information sciences. Journal of Information Science , 28, 441.
Overman, E.S. (1996). The New Science of Management: Chaos and Quantum Theory and
Method, Journal of Public Administration Research and Theory, 6(1), 75.
Paton, D., & Flin, R. (1999). Disaster stress: an emergency management perspective. Disaster
Prevention and Management , 8 (4), 261-267.
Perry, R. & Lindell, M (2003). Preparedness for Emergency Response: Guide- lines for the
Emergency Planning Process. Disasters, 27(4), 336–350.
Petak, W.J. (1985). Emergency Management: A Challenge for Public Administration. Public
Administration Review, 45(s) 3-7.
Provan, K. G. & Milward H. B. (1995). A Preliminary Theory of Interorganizational Network
Effectiveness: A Comparative Study of Four Community Mental Health Systems.
Administrative Science Quarterly, 40(1), 1-33.
Provan, K. G. & Milward, H. B. (2001). Do networks really work? A framework for evaluating
public-sector organizational networks. Public Administration Review, 61(4), 414-423.
Provan, K.G., Fish, A. & Sydow, J. (2007). Interorganizational Networks at the Network Level:
A Review of the Empirical Literature on Whole Networks. Journal of Management,
33(3), 479-516.
Quarantelli, E. L. (2000). Disaster planning, emergency management and civil protection: The
historical development of organized efforts to plan for and respond to disasters. In
Preliminary papers #301. Disaster Research Center, University of Delaware.
206
Quarantelli, E.L. (1987). What Should We Study? Questions and Suggestions for Researchers
about the Concept of Disasters. International Journal of Mass Emergencies and Disasters
5, 7-32.
Quarantelli, E.L. (1997). Ten criteria for evaluating the management of community disasters.
Disasters, 21, 39–56.
Quarantelli, E.L., Lagadec, P. & Boin, A. (2006). A Heuristic Approach to Future Disasters and
Crises: New, Old and In-Between Types. In R. Dynes, H. Quarantelli, H. Rodriguez,
Handbook of Disaster Research, New York: Springer (Chapter 2, 16-41).
Quinn, R. E. & Rohrbaugh, J. (1983). A spatial model of effectiveness criteria: towards a
competing values approach to organizational analysis. Management Science, 29(3), 363-
377.
Referans Newspaper (2009) Türkiye'de kriz yönetimi krizin kendisinden beter! (Crisis
Management in Turkey is worse than global economic crisis itself!),
http://www.referansgazetesi.com/haber.aspx?HBR_KOD=119762&KTG_KOD=116,
(accessed May 17, 2009).
Riedel, B. (2007). Al Qaeda Strikes Back. Foreign Affairs , 86 (3), 24-70.
Rochet, C., Keramidas, O. & Bout, L. (2008). Crisis as change strategy in public organizations.
International Review of Administrative Sciences, 74(1), 65-77.
Rockett, J.P. (1994). A Constructive Critique of United Kingdom Emergency Planning. Disaster
Prevention and Management, 3(1), 47-60.
Rodoplu, U., Arnold, J. L., Tokyay, R., Ersoy, G. & Cetiner, S. (2005). Impact of the Terrorist
Bombings of the Neve Shalom and Beth Israel Synagogues on a Hospital in Istanbul,
Turkey. Academic Emergency Medicine 12(2), 135.
207
Rodoplu, U., Arnold, J. L., Tokyay, R., Ersoy, G., Cetiner, S., & Yücel, T. (2004). Mass-casualty
terrorist bombings in Istanbul,Turkey, November 2003: Report of the events and the
prehospital emergency response. Prehospital Disaster Medicine, 19(2), 133–145.
Rodriguez, H., Quarantelli, E.L. & Dynes, R. (2006). Handbook of Disaster Research, Springer:
NJ.
Rodríguez, J.A. & Cárdenas, J., (2006). Struggles for power, XXV International Sunbelt Social
Network Conference Vancouver, British Columbia, Canada (April).
Rosenhead, J. (1998). ‗Complexity Theory and Management Practice‘, Human Nature Review,
http://human-nature.com/science-as-culture/rosenhead.html, accessed 06 April 2009.
Rouse, W.B. (2000). Managing Complexity: Disease Control as a Complex Adaptive System.
Information, Knowledge, Systems Management, 2(2), 143-165.
Rusaw, A. C. & Rusaw, M. F. (2008). The Role of HRD in Integrated Crisis Management: A
Public Sector Approach. Advances in Developing Human Resources, 10(3), 380.
Sahin, B.; Kapucu, N.; Unlu, A. (2008). Perspectives on Crisis Management in European Union
Countries: United Kingdom, Spain and Germany, European Journal of Economic and
Political Studies (EJEPS), 1(1), 19-45.
Samardjieva, E. & Badal, J. (2002). Estimation of the Expected Number of Casualties Caused by
Strong Earthquakes. Bulletin of the Seismological Society of America, 92(6), 2310-2322.
Schumaker, R. E., & Lomax, R. G. (2004). A beginner‘s guide to structural equation modeling
(2nd ed.). Mahwah, NJ: Lawrence Erlbaum.
Scott, W. R. (2003). Organizations: Rational, Natural, and Open Systems. 5th
Edition, New
Jersey: Prentice Hall.
208
Sherraden, M.S., Stringham, J., Sow, S.C. & McBride, A.M. (2006). Forms and Structure of
International Voluntary Service, Voluntas, 17(2), 156-173.
Siegel, G.B., Clayton R., Kovoor, S. (1990). Modeling Interorganizational Effectiveness. Public
Productivity & Management Review, 13(3), 215-222.
Smith, D.G. (2006). Introduction to Crisis and Emergency Risk Communication. Presented in
The Central Colorado Area Health Education Center Conference held in Ft. Collins in
May 2006.
Spector, M.J. & Davidsen, P.I. (1998). Constructing Learning Environments using System
Dynamics. Journal of Courseware Engineering, 1, 5-11.
Stacey, R.D. (1995). The Science of Complexity: An Alternative Perspective for Strategic
Change. Strategic Management Journal, 16(6), 477.
Stallings, R.A., Quarantelli, E.L. (1985). Emergent Citizen Groups and Emergency Management.
Public Administration Review, 45, 93-100.
Steers, R.M. (1975). Problems in the Measurement of Organizational Effectiveness.
Administrative Science Quarterly, 20(4), 546-558.
Stern, E. & Sundelius, B. (2002). Crisis Management Europe. An Integrated Regional Research
and Training Program International Studies Perspectives, 3(1), 71–88.
Stevens, J. (1996). Applied multivariate statistics for the social sciences. Mahwah, NJ: Lawrence
Erlbaum Publishers.
Stevenson, J. (2006 ). Demilitarising the ‗War on Terror‘. Survival , 48 (2), 37 – 54.
Stone, C. (2009). Lessons learned by the 7th
July Assistance Centre staff, steering group and
partners, http://www.culture.gov.uk/images/publications/Lessons_learned.pdf (accessed
May 07, 2009).
209
Tatil, S. (2005). A comparative analysis of intelligence family response to terrorist attacks.
Central Missouri State University, Master Thesis.
Thomson, A.; Perry, J. & Miller, T. (2007, December). Conceptualizing and measuring
collaboration. Journal of Public Administration Research and Theory, p.1-10.
Doi:10.1093/jopart/mum036.
US General Accounting Office (GAO:1993). Disaster Management: Improving the Nation's
Response to Catastrophic Disasters, GAO/CREDO-93-186.
Vogelsang, J. (2002). Futuring: A Complex Adaptive Systems Approach to Strategic Planning.
Support Center for Non-Profit Management, retrieved from the website
http://www.supportctr.org/images/futuring.pdf. Accessed 21 February 2008.
Voorhees, W. R. (2008). New Yorkers Respond to the World Trade Center Attack: An Anatomy
of an Emergent Volunteer Organization. Journal of Contingencies and Crisis
Management 16(1), 3-13.
Waugh W.L. & Streib, G. (2006). Collaboration and Leadership for Effective Emergency
Management. Public Administration Review, 66(s), 131-140.
Waugh, William L. (2000) Living with Hazards, Dealing with Disasters: An Introduction to
Emergency Management. Armonk, NY: M. E. Sharpe, Inc.
Williams, G., Batho, S., & Russell, L. (2000). Responding to urban crisis: The emergency
planning response to the bombing of Manchester city centre. Cities , 17 (4), 293-304.
Wise, C., & Nader, R. (2002). Organizing the Federal System for Homeland Security: Problems,
Issues, and Dilemmas. Public Administration Review , 62 (S1), 44.
Yin, R. K. (2003). Applications of Case Study Research, 2nd
Edition. Applied Social Research
Methods Series: 34, London: Sage Publications.