Factors Controlling Multiple Tropical Cyclone Events in...
10
Factors Controlling Multiple Tropical Cyclone Events in the Western North Pacific* JIANYUN GAO Fujian Climate Center, CMA, Fuzhou, Fujian, China TIM LI IPRC and Department of Meteorology, University of Hawaii at Manoa, Honolulu, Hawaii (Manuscript received 12 January 2010, in final form 26 July 2010) ABSTRACT The statistical feature of occurrence of multiple tropical cyclone (MTC) events in the western North Pacific (WNP) is examined during summer (June–September) for the period of 1979–2006. The number of MTC events ranged from one to eight per year, experiencing a marked interannual variation. The spatial distance between the TCs associated with MTC events is mostly less than 3000 km, which accounts for 73% of total samples. The longest active phase of an MTC event lasts for nine days, and about 80% of the MTC events last for five days or less. A composite analysis of active and inactive MTC phases reveals that positive low-level (negative upper-level) vorticity anomalies and enhanced convection and midtropospheric relative humidity are the favorable large-scale conditions for MTC genesis. About 77% of the MTC events occurred in the region where either the atmospheric intraseasonal (25–70 day) oscillation (ISO) or biweekly (10–20 day) oscillation (BWO) is in a wet phase. The overall occurrence of the MTC events is greatly regulated by the combined large-scale impact of BWO, ISO, and the lower-frequency (90 days or longer) oscillation. On the interannual time scale, the MTC frequency is closely related to the seasonal mean anomalies of 850-hPa vorticity, outgoing longwave radiation (OLR), and 500-hPa humidity fields. The combined ISO and BWO activity is greatly strengthened (weakened) in the WNP region during the MTC active (inactive) years. 1. Introduction The western North Pacific (WNP) is the region of the most frequent tropical cyclone (TC) activity among eight TC genesis regions in the world (Gray 1968). Besides favorable summer mean conditions such as the monsoon trough and high sea surface temperature (SST), factors that affect TC genesis in WNP include precursor synoptic- scale disturbance signals (Fu et al. 2007) such as TC energy dispersion–induced Rossby wave trains (Li et al. 2003, 2006; Li and Fu 2006), easterly waves (Chang et al. 1970; Tam and Li 2006), and northwest–southeast-oriented synoptic wave trains unrelated to the energy dispersion of a preex- isting TC (Lau and Lau 1990; Chang et al. 1996; Li 2006). Previous studies have reported a large-scale control of low-frequency systems on TC genesis (e.g., Nakazawa 1988; Liebmann et al. 1994; Harr and Elsberry 1995a,b; Chen et al. 2000; Maloney and Dickinson 2003; Camargo et al. 2007a,b; Ritchie and Holland 1999). For example, Liebmann et al. (1994) and Maloney and Hartmann (2000) found that the western and eastern Pacific TCs were modulated by the Madden–Julian oscillation (MJO). Lander (1994) and Wang and Chan (2002) showed that El Nin ˜o and La Nin ˜ a may exert a great impact on the WNP TC activity. Yumoto and Matsuura (2001) found an interdecadal variation in the number of WNP TCs, which is somehow related to the Pacific decadal variability. Observations show that TC formation is not a tempo- rally evenly distributed event; rather, it has a tendency to cluster in some periods and be less frequent in other periods (Gray 1979). So far few studies have focused on TC clustering processes. In this paper we define a mul- tiple tropical cyclone (MTC) event as an event in which two or more TCs form within a relatively short period. One example of such an MTC event in WNP is the successive cyclogenesis due to energy dispersion of a * School of Ocean and Earth Science and Technology Contri- bution Number 8036 and International Pacific Research Center Contribution Number 729. Corresponding author address: Dr. Jianyun Gao, Fujian Climate Center, CMA, Fuzhou, Fujian, China. E-mail: [email protected] MARCH 2011 GAO AND LI 885 DOI: 10.1175/2010MWR3340.1 Ó 2011 American Meteorological Society
Transcript of Factors Controlling Multiple Tropical Cyclone Events in...
Factors Controlling Multiple Tropical Cyclone Events in the Western North Pacific*
JIANYUN GAO
Fujian Climate Center, CMA, Fuzhou, Fujian, China
TIM LI
IPRC and Department of Meteorology, University of Hawaii at Manoa, Honolulu, Hawaii
(Manuscript received 12 January 2010, in final form 26 July 2010)
ABSTRACT
The statistical feature of occurrence of multiple tropical cyclone (MTC) events in the western North Pacific
(WNP) is examined during summer (June–September) for the period of 1979–2006. The number of MTC
events ranged from one to eight per year, experiencing a marked interannual variation. The spatial distance
between the TCs associated with MTC events is mostly less than 3000 km, which accounts for 73% of total
samples. The longest active phase of an MTC event lasts for nine days, and about 80% of the MTC events last
for five days or less. A composite analysis of active and inactive MTC phases reveals that positive low-level
(negative upper-level) vorticity anomalies and enhanced convection and midtropospheric relative humidity
are the favorable large-scale conditions for MTC genesis. About 77% of the MTC events occurred in the
region where either the atmospheric intraseasonal (25–70 day) oscillation (ISO) or biweekly (10–20 day)
oscillation (BWO) is in a wet phase. The overall occurrence of the MTC events is greatly regulated by the
combined large-scale impact of BWO, ISO, and the lower-frequency (90 days or longer) oscillation. On the
interannual time scale, the MTC frequency is closely related to the seasonal mean anomalies of 850-hPa
vorticity, outgoing longwave radiation (OLR), and 500-hPa humidity fields. The combined ISO and BWO
activity is greatly strengthened (weakened) in the WNP region during the MTC active (inactive) years.
1. Introduction
The western North Pacific (WNP) is the region of the
most frequent tropical cyclone (TC) activity among eight
TC genesis regions in the world (Gray 1968). Besides
favorable summer mean conditions such as the monsoon
trough and high sea surface temperature (SST), factors
that affect TC genesis in WNP include precursor synoptic-
scale disturbance signals (Fu et al. 2007) such as TC energy
dispersion–induced Rossby wave trains (Li et al. 2003, 2006;
Li and Fu 2006), easterly waves (Chang et al. 1970; Tam
and Li 2006), and northwest–southeast-oriented synoptic
wave trains unrelated to the energy dispersion of a preex-
isting TC (Lau and Lau 1990; Chang et al. 1996; Li 2006).
Previous studies have reported a large-scale control of
low-frequency systems on TC genesis (e.g., Nakazawa
1988; Liebmann et al. 1994; Harr and Elsberry 1995a,b;
Chen et al. 2000; Maloney and Dickinson 2003; Camargo
et al. 2007a,b; Ritchie and Holland 1999). For example,
Liebmann et al. (1994) and Maloney and Hartmann
(2000) found that the western and eastern Pacific TCs
were modulated by the Madden–Julian oscillation (MJO).
Lander (1994) and Wang and Chan (2002) showed that
El Nino and La Nina may exert a great impact on the
WNP TC activity. Yumoto and Matsuura (2001) found an
interdecadal variation in the number of WNP TCs, which
is somehow related to the Pacific decadal variability.
Observations show that TC formation is not a tempo-
rally evenly distributed event; rather, it has a tendency
to cluster in some periods and be less frequent in other
periods (Gray 1979). So far few studies have focused on
TC clustering processes. In this paper we define a mul-
tiple tropical cyclone (MTC) event as an event in which
two or more TCs form within a relatively short period.
One example of such an MTC event in WNP is the
successive cyclogenesis due to energy dispersion of a
* School of Ocean and Earth Science and Technology Contri-
bution Number 8036 and International Pacific Research Center
Contribution Number 729.
Corresponding author address: Dr. Jianyun Gao, Fujian Climate
Center, CMA, Fuzhou, Fujian, China.
E-mail: [email protected]
MARCH 2011 G A O A N D L I 885
DOI: 10.1175/2010MWR3340.1
� 2011 American Meteorological Society

preexisting TC (Li and Fu 2006; Krouse and Sobel
2010). Another example is successive TC formation ow-
ing to energy accumulation of easterly waves at a critical
longitude near the background confluence zone (e.g.,
Kuo et al. 2001). The objective of the present study is to
document the statistical characteristics of MTC events
in the WNP and examine the large-scale flow conditions
under which an MTC event occurs. By analyzing the
composite differences between the MTC active and in-
active phases, we intend to understand the role of the
atmospheric biweekly (10–20 day), intraseasonal (25–
70 day), and lower-frequency (greater than 90 days)
variabilities in regulating the MTC formation.
The rest of the paper is organized as follows. Section 2
describes the data and analysis methodology and the
definition of multiple TC events. In section 3, we docu-
ment the characteristics of the summer mean flow and
biweekly (10–20 day) oscillation (BWO) and intraseasonal
(25–70 day) oscillation (ISO) activity in association with
MTC active and inactive phases. In section 4, we further
investigate the interannual relationship between the MTC
frequency and large-scale mean circulation including the
seasonal mean fields and BWO and ISO intensity. A con-
clusion is given in section 5.
2. Data and methodology
a. Datasets
The primary datasets used in this study are the National
Ocean and Atmospheric Administration (NOAA) out-
going longwave radiation (OLR; Liebmann and Smith
1996) and the National Centers for Environmental
Prediction–Department of Energy (NCEP–DOE) At-
mospheric Model Intercomparison Project (AMIP-II)
Reanalysis (Kanamitsu et al. 2002). Both of the datasets
are daily averaged products at a 2.58 3 2.58 grid, covered
globally. The best-track TC data from the Joint Typhoon
Warming Center (JTWC) are used to determine TC gen-
esis time and location in the WNP. The typical warning
of JTWC occurs when a TC just reaches the tropical
depression intensity. The analysis period is confined in
the summer months (June–September, when TCs are
most active in WNP) from 1979 to 2006. Satellite products
have been routinely incorporated into the NCEP assim-
ilation system since 1979 (Kalnay et al. 1996).
A composite analysis method is utilized to reveal the
difference of large-scale fields between MTC active and
inactive phases. A Monte Carlo technique (Livezey and
Chen 1983) is adopted to examine the statistical signifi-
cance of the composite difference fields. A Lanczos filter
(Duchon 1979) is applied to the daily OLR and reanalysis
fields to extract the biweekly (10–20 day), intraseasonal
(25–70 day), and lower-frequency (.90 days) components.
b. Definition of multiple TC events
A variety of mechanisms may cause MTC (or TC
clustering) events. From a synoptic self-triggering point
of view, TC energy dispersion or wave energy accumu-
lation in a confluence zone (e.g., Kuo et al. 2001; Li et al.
2003) may lead to the successive formation of TCs to the
east of a preexisting TC. From a large-scale forcing point
of view, the westward propagation of an active ISO or
BWO event in WNP may cause the successive formation
of TCs from east to west. Because of the complex forcing
factors, the definition of an MTC event does not con-
sider the relative location of TCs and is solely dependent
on the genesis time. For a 28-yr period from 1979 to
2006, 483 TCs are identified in the peak summer season
(June–September) over the WNP domain (2.58–358N,
1008E–1808).
A statistical calculation shows that an averaged in-
terval of TC genesis in WNP during the summer (June–
September) of 1979–2006 is 5.76 days. The TC genesis
interval has a standard deviation of 5.13 days. A maxi-
mum interval of TC genesis in WNP is 37 days. A min-
imum interval is 0, which means that two or more TCs
formed on the same day. In view of the statistical feature
of the TC genesis dates, we stratify the MTC events into
three categories: an MTC active phase (with a genesis
interval being less than or equal to 3 days, that is, the
mean interval minus half the standard deviation), an
MTC inactive phase (with a genesis interval being
greater than or equal to 9 days, that is, the mean plus
half the standard deviation), and an MTC normal phase
(with a genesis interval between 3 and 9 days). If two
or more active (inactive) MTC phases occur successively,
they are regarded as the same active (inactive) MTC
event. Figure 1 shows an example of an active MTC
event on 10–18 September 1998 during which six TCs
formed in the WNP basin.
FIG. 1. TC genesis locations and averaged 850-mb wind patterns
(vector) during an active MTC event on 10–18 Sep 1998.
886 M O N T H L Y W E A T H E R R E V I E W VOLUME 139

To examine the spatial and temporal distributions of
MTC events in the WNP, we plotted the percentage
occurrence of spatial distance between TCs that formed
within the MTC events (Fig. 2a). It indicates that 73% of
the MTC events have a distance less than 3000 km, while
only 14% occur between 3000 and 4000 km and about
13% exceed a distance of 4000 km. About half of the
TCs associated with the MTC events are only one day
apart or less, and the other half have an interval of two
and three days (Fig. 2b). Figure 2c shows that the longest
active phase of an MTC event lasts for nine days, but
about 80% of the MTC events last for five days or fewer.
Table 1 lists the criterion for the three MTC phases
described above. It is seen from Table 1 that the num-
bers of the active, normal, and inactive MTC events for
the 28-yr period are 130, 114, and 81, respectively. Thus
the MTC active events occupied about 40% of the total
samples. Although the MTC active phases covered only
446 days during the 28-yr period, 196 TCs formed in
these active periods, which accounts for 41% of total
TCs in the WNP.
3. Composite analyses between the MTC activeand inactive phases
Figure 3 illustrates individual active MTC events and
associated TC genesis dates in the WNP during June–
September for the period of 1979–2006. The gray bar in
Fig. 3 represents the period of the active MTC event,
while the black bar denotes each cyclogenesis date within
the MTC event. No gap between the two black bars
means that two TCs occur in successive dates. For each
summer, the occurrence of the MTC events experiences
a clear subseasonal variation. This suggests that the MTC
events might be regulated by the atmospheric intraseasonal
oscillation and biweekly oscillation.
In the following, a composite analysis is conducted to
reveal the significant difference of dynamic and ther-
modynamic fields between the MTC active and inactive
phases. The composite cases were selected based on the
filtered daily data during the active and inactive MTC
periods.
a. Difference of mean circulation patterns betweenMTC active and inactive phases
Figure 4 shows the differences of low-pass-filtered
(90 days or longer) 850-hPa wind and vorticity, OLR,
and 500-hPa relative humidity fields between the MTC
active and inactive phases. The patterns of the com-
posite wind and vorticity anomalies are approximately
a mirror image between the active and inactive phases.
A background low-level cyclonic (anticyclonic) cir-
culation anomaly appears over the South China Sea
(SCS) and WNP during the active (inactive) MTC pe-
riods. The anomalous circulation has a first baroclinic
mode vertical structure, with an anticyclonic (cyclonic)
circulation anomaly appearing in the upper tropo-
sphere (at 200 hPa) during the active (inactive) MTC
phases (figure not shown). The WNP monsoon trough
is strengthened and extends eastward during the active
MTC periods, which favors MTC formation farther to
the east.
The background dynamic fields are consistent with
the OLR field (Fig. 4b). A significant difference in the
tropical convection is found in WNP between the MTC
FIG. 2. The statistical characteristics of the MTC events in
the WNP.
TABLE 1. Stratification of three MTC phases based on the
standard deviation s of the TC genesis interval (TGI) in WNP
(ATGI denotes the anomalous TC genesis interval).
Criterion MTC phase
No. of
events (%)
ATGI # 20.5s TGI # 3 days Active 130 (40%)
20.5s , ATGI
, 0.5s
3 , TGI , 9 Normal 114 (35%)
ATGI $ 0.5s TGI $ 9 days Inactive 81 (25%)
MARCH 2011 G A O A N D L I 887

active and inactive phases. Figure 4b illustrates that the
convection is greatly strengthened south of 258N along
the WNP monsoon trough during the MTC active phase.
In association with the enhanced monsoon convec-
tion, the relative humidity at 500 hPa increases sig-
nificantly (Fig. 4c). The enhanced deep-layer moisture
provides a favorable thermodynamic condition for the
MTC genesis.
b. BWO and ISO activity associated with MTCactive and inactive phases
How are the atmospheric BWO and ISO related to
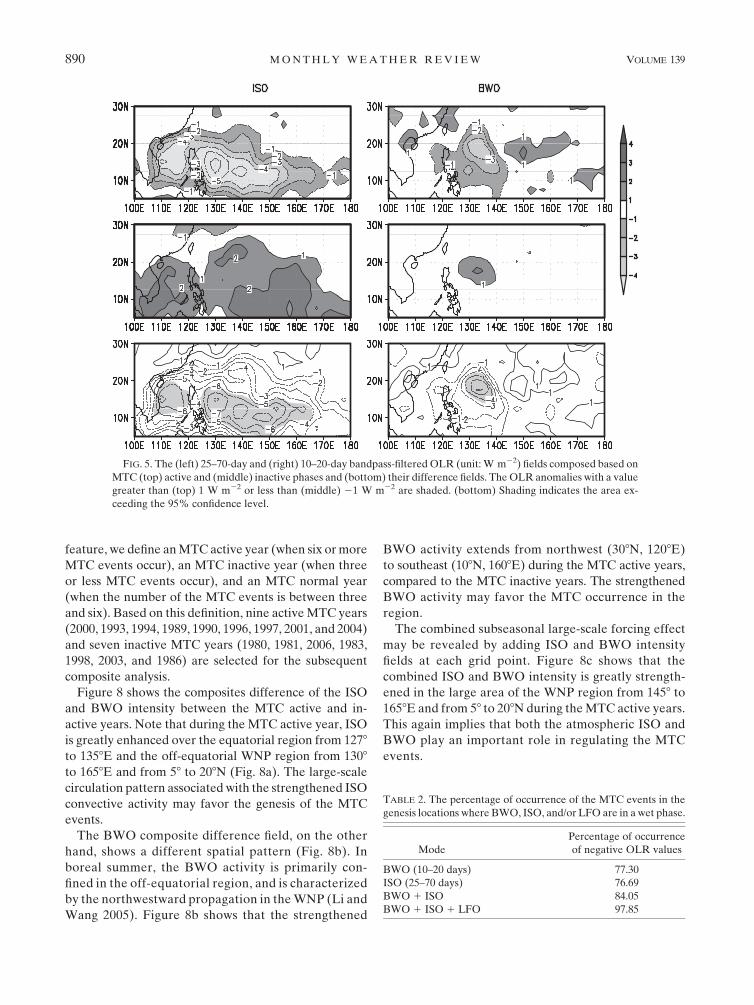
the occurrence of MTC events? Figure 5 shows the
composites of 25–70-day bandpass-filtered OLR fields
during the MTC inactive and active phase respectively.
Note that during the MTC active phase negative OLR
anomalies associated with ISO cover the entire SCS/
WNP region from 1108E to east of 1708E and from 58 to
258N. The condition is completely reverse in the MTC
inactive phase, in which positive intraseasonal OLR
anomalies occupy the region. The difference is statis-
tically significant, exceeding the 95% confidence level.
This indicates that ISO is in a wet (dry) phase with
enhanced (suppressed) convective activity in WNP when
an active (inactive) MTC phase occurs. This implies that
the large-scale circulation anomaly associated with ISO
favors the genesis of MTC events.
BWO, on the other hand, shows a different spatial
pattern (Fig. 5). It is found that during the MTC active
phase a negative OLR anomaly appears west of 1408E,
while a positive OLR anomaly occurs to the east. The
negative OLR anomaly to the west is stronger than the
positive one to the east. Such a zonal dipole pattern is
consistent with the fact that BWO has a relatively short
zonal wavelength compared to that of ISO (Wen et al.
2010). An approximately opposite pattern of the OLR
anomaly appears in the inactive MTC composite. The
difference is most significant in a region from 1258 to
1408E. The result suggests that the strengthened BWO
activity in that region favors the MTC generation in
WNP.
The possible effect of the large-scale control of ISO
and BWO may be revealed by counting the percentage
of individual MTC events that appear during the active
phases of ISO and BWO respectively. Because of the
spatial variability of cyclogenesis locations associated
with the MTC events, the OLR values associated with
ISO and BWO at individual genesis locations on the
genesis dates were calculated. Prior to that, a Lanczos
filter is applied to the daily OLR field to extract the
biweekly (10–20 days), intraseasonal (25–70 days), and
lower-frequency (.90 days) components. The number
of positive and negative OLR values was then counted
at each of the genesis location and date for each of
the following scenarios: the ISO mode only, the BWO
mode only, the sum of the ISO and BWO modes, and
the sum of the ISO, BWO, and lower-frequency oscilla-
tion (LFO; .90 days) modes.
Table 2 shows the percentage of number of the neg-
ative OLR values during active MTC events for each of
the scenarios above. It is found that about 77% of the
TCs associated with the active MTC events occur when
either BWO or ISO is in a wet phase. The combination
of the BWO and ISO modes leads an increase of the
occurrence percentage to 84%. This implies that the
predictability of the MTC events might increase when
one considers both the ISO and BWO impacts. The per-
centage of occurrence of the MTC events increases fur-
ther to 98% when the combined BWO, ISO, and LFO
forcing effects are included.
c. Synoptic-scale activity associated with MTCactive and inactive phases
The composite analysis above reveals that positive
low-level (negative upper level) vorticity anomalies and
enhanced convection and midtropospheric relative hu-
midity appear during the active MTC phase. The com-
posite result may not indicate causal relationship. The
large-scale condition in the MTC active composite may
simply be reflecting the active presence of TCs in the
period.
To address this issue, we conducted the following
calculations. Assuming that TCs are a part of synoptic-
scale (3–10 days) variability, if the accumulated synoptic
effect significantly affects the mean flow, one would ex-
pect that the averaged synoptic-scale OLR value during
FIG. 3. Individual MTC active events (gray bar) and associated
TC genesis dates and genesis number (black bar, with a short bar
denoting one TC and a long bar denoting two TCs on the same
date) during June–September 1979–2006.
888 M O N T H L Y W E A T H E R R E V I E W VOLUME 139

the active MTC phases should be much greater than the
averaged value during the inactive MTC phases. Figure 6
shows that this is not the case. The averaged negative
OLR value during the active MTC phase is not signifi-
cantly larger than that during the inactive MTC phase. As
a result, the averaged OLR values do not show a signifi-
cant difference between the MTC active and inactive
phases. The composite synoptic-scale OLR difference
field is in a great contrast to the composite differences of
the intraseasonal and lower-frequency OLR fields (Figs. 4
and 5). The result implies that the upscale feedback of the
MTC events to the low-frequency oscillations is relatively
weak. To the first order, it is the low-frequency motions
that modulate the MTC formation.
4. Interannual variability of MTC frequency
The number of the MTC events each summer shows
a notable interannual variation (Fig. 3). For example,
the maximum MTC frequency is 8, which occurred in
2000. A minimum MTC frequency is 1, which happened
in 1986. In the following we intend to identify significant
large-scale fields associated with the interannual vari-
ability of the MTC frequency.
Figure 7 illustrates the correlations of the MTC fre-
quency each summer with the 850-hPa vorticity, OLR,
and 500-hPa humidity fields at various time scales. As
one can see, the MTC frequency is significantly corre-
lated with the seasonal mean vorticity and OLR fields in
the large area of the WNP region. A high positive cor-
relation coefficient with the vorticity and a high negative
correlation coefficient with the OLR appear in the WNP
monsoon trough region. For the ISO intensity, signifi-
cant correlation appears in the region from 1458 to 1658E
and from 58 to 128N in both the OLR and 500-hPa rel-
ative humidity fields. The correlation pattern appears
different in the BWO intensity, with a positive correla-
tion region extending from northwest (308N, 1208E) to
southeast (108N, 1608E).
For the period of 1979–2006, the averaged number
of the active MTC events per summer is 4.6, with a
standard deviation of 1.7. Based on this statistical
FIG. 4. Composite difference fields of (a) 850-hPa vorticity and wind, (b) OLR, and (c) 500-hPa
relative humidity between MTC active and inactive phases. Shading indicates the area exceeding
the 95% confidence level.
MARCH 2011 G A O A N D L I 889
feature, we define an MTC active year (when six or more
MTC events occur), an MTC inactive year (when three
or less MTC events occur), and an MTC normal year
(when the number of the MTC events is between three
and six). Based on this definition, nine active MTC years
(2000, 1993, 1994, 1989, 1990, 1996, 1997, 2001, and 2004)
and seven inactive MTC years (1980, 1981, 2006, 1983,
1998, 2003, and 1986) are selected for the subsequent
composite analysis.
Figure 8 shows the composites difference of the ISO
and BWO intensity between the MTC active and in-
active years. Note that during the MTC active year, ISO
is greatly enhanced over the equatorial region from 1278
to 1358E and the off-equatorial WNP region from 1308
to 1658E and from 58 to 208N (Fig. 8a). The large-scale
circulation pattern associated with the strengthened ISO
convective activity may favor the genesis of the MTC
events.
The BWO composite difference field, on the other
hand, shows a different spatial pattern (Fig. 8b). In
boreal summer, the BWO activity is primarily con-
fined in the off-equatorial region, and is characterized
by the northwestward propagation in the WNP (Li and
Wang 2005). Figure 8b shows that the strengthened
BWO activity extends from northwest (308N, 1208E)
to southeast (108N, 1608E) during the MTC active years,
compared to the MTC inactive years. The strengthened
BWO activity may favor the MTC occurrence in the
region.
The combined subseasonal large-scale forcing effect
may be revealed by adding ISO and BWO intensity
fields at each grid point. Figure 8c shows that the
combined ISO and BWO intensity is greatly strength-
ened in the large area of the WNP region from 1458 to
1658E and from 58 to 208N during the MTC active years.
This again implies that both the atmospheric ISO and
BWO play an important role in regulating the MTC
events.
FIG. 5. The (left) 25–70-day and (right) 10–20-day bandpass-filtered OLR (unit: W m22) fields composed based on
MTC (top) active and (middle) inactive phases and (bottom) their difference fields. The OLR anomalies with a value
greater than (top) 1 W m22 or less than (middle) 21 W m22 are shaded. (bottom) Shading indicates the area ex-
ceeding the 95% confidence level.
TABLE 2. The percentage of occurrence of the MTC events in the
genesis locations where BWO, ISO, and/or LFO are in a wet phase.
Mode
Percentage of occurrence
of negative OLR values
BWO (10–20 days) 77.30
ISO (25–70 days) 76.69
BWO 1 ISO 84.05
BWO 1 ISO 1 LFO 97.85
890 M O N T H L Y W E A T H E R R E V I E W VOLUME 139

5. Conclusions
In this study, we investigate the statistical feature of
occurrence of observed multiple tropical cyclone (MTC)
events in WNP. Using the JTWC best-track and the
NCEP–DOE reanalysis data, we define the MTC active
and inactive phases based on the statistics of TC genesis
frequency in WNP. As an averaged TC genesis interval
is 5.76 days in WNP, we stratify MTC events into three
categories: an MTC active phase with a genesis inter-
val being less than or equal to 3 days, an MTC inactive
phase with a TC genesis interval being greater than
or equal to 9 days, and an MTC normal phase with
a genesis interval between 3 and 9 days. The number of
FIG. 6. Composite difference of the synoptic-scale (3–10 days) OLR field between the MTC
active and inactive phases. Shading indicates the area exceeding the 95% confidence level.
FIG. 7. Correlation coefficients of the summer MTC frequency with the seasonal mean (left) 850-hPa vorticity, (middle) OLR, and
(right) 500-hPa relative humidity fields, and with the ISO and BWO intensity (represented by the standard deviation of 25–70-day and 10–
20-day filtered fields, respectively). Shading indicates the area exceeding the 95% (darker color) and 90% (lighter color) confidence level.
MARCH 2011 G A O A N D L I 891

so-defined active MTC events ranges from one to eight
per year, experiencing a pronounced interannual var-
iation. The overall numbers of the active, normal, and
inactive MTC events for a 28-yr period (1979–2006)
are 130, 114, and 81, respectively. The spatial dis-
tance between the TCs associated with MTC events is
mostly less than 3000 km, which accounts for 73% of
total samples. The longest active phase of an MTC event
lasts for nine days. About 80% of the MTC events last for
five days or fewer.
A composite analysis is further conducted to reveal
the differences of the large-scale fields between the
MTC active and inactive phases. The composite analysis
reveals that the active MTC phase is associated with the
enhanced low-level cyclonic and upper-level anticy-
clonic vorticity, enhanced monsoon convection, and the
increase of midtropospheric relative humidity over SCS
and WNP. An opposite pattern appears in the inactive
MTC phase.
The occurrence of the summer MTC events is greatly
regulated by the atmospheric biweekly and intraseasonal
oscillations. It is found that about three quarters of in-
dividual MTC events occur in the region where either
BWO or ISO is in a wet phase. On the other hand, the
averaged synoptic-scale OLR value during the active
MTC phase in the WNP is not significantly greater than
that during the inactive MTC phase. The result implies
that the upscale feedback of the MTC events to the
FIG. 8. Composite differences of (a) ISO intensity, (b) BWO intensity, and (c) the combined
ISO and BWO intensity between the active and inactive MTC years. Shading indicates the area
exceeding the 95% (darker color) and 90% (lighter color) confidence level.
892 M O N T H L Y W E A T H E R R E V I E W VOLUME 139

low-frequency oscillations is relatively weak. To the
first order, it is the low-frequency motions that modu-
late the MTC formation. The results suggest that the
atmospheric low-frequency oscillations including BWO
and ISO may modify the large-scale circulation in such a
way that they create a favorable environmental condition
for MTC genesis.
Our calculation shows that the combined large-scale
impact of the ISO and BWO modes leads to an increase
of the MTC occurrence percentage to 84%. The overall
occurrence of the MTC events during the past 28 years is
to a large extent determined by the combined effect of
BWO, ISO, and the lower-frequency (90 days or longer)
oscillation. Thus the current observational analysis sheds
lights in the potential application of prediction of multi-
ple tropical cyclone events in WNP.
On the interannual time scale, the MTC frequency
shows a close relationship with the seasonal mean
anomalies of 850-hPa vorticity, OLR, and 500-hPa hu-
midity fields. A composite analysis shows a marked
difference in the subseasonal variability between the
MTC active and inactive years. The combined ISO
and BWO activity is greatly strengthened (weakened)
in the WNP region during the MTC active (inactive)
years.
Acknowledgments. We thank anonymous reviewers
for constructive comments that greatly improve the
presentation of this paper. This work was done when
JG visited IPRC. JG was supported by NSFC Grants
90915002 and 40775047 and by the youth project of
Fujian Provincial Department of Science and Tech-
nology (2007F3019). TL was supported by ONR grants
N000140810256 and N000141010774, NRL Grant
N00173091G008 and the First Institute of Oceanography,
and by the International Pacific Research Center,
which is sponsored by the Japan Agency for Marine-
Earth Science and Technology (JAMSTEC), NASA
(NNX07AG53G), and NOAA (NA17RJ1230).
REFERENCES
Camargo, S. J., K. A. Emanuel, and A. H. Sobel, 2007a: Use of
a genesis potential index to diagnose ENSO effects on tropical
cyclone genesis. J. Climate, 20, 4819–4834.
——, A. H. Sobel, A. G. Barnston, and K. A. Emanuel, 2007b:
Tropical cyclone genesis potential index in climate models.
Tellus, 59A, 428–443.
Chang, C.-P., V. F. Morris, and J. M. Wallace, 1970: A statistical
study of easterly waves in the western Pacific: July–December
1964. J. Atmos. Sci., 27, 195–201.
——, J. M. Chen, P. A. Harr, and L. E. Carr, 1996: North-
westward-propagating wave patterns over the tropical western
North Pacific during summer. Mon. Wea. Rev., 124, 2245–
2266.
Chen, T.-C., M.-C. Yen, and S.-P. Weng, 2000: Interaction be-
tween the summer monsoons in East Asia and the South
China Sea: Intraseasonal monsoon modes. J. Atmos. Sci., 57,
1373–1392.
Duchon, C. E., 1979: Lanczos filter in one and two dimensions.
J. Appl. Meteor., 18, 1016–1022.
Fu, B., T. Li, M. Peng, and F. Weng, 2007: Analysis of tropical
cyclogenesis in the western North Pacific for 2000 and 2001.
Wea. Forecasting, 22, 763–780.
Gray, W. M., 1968: Global view of the origin of tropical distur-
bances and storms. Mon. Wea. Rev., 96, 669–700.
——, 1979: Hurricanes: Their formation structure, and likely role
in the tropical circulation. Meteorology over Tropical Oceans,
D. B. Shaw, Ed., Royal Meteorological Society, 155–218.
Harr, P. A., and R. L. Elsberry, 1995a: Large-scale circulation
variability over the tropical western North Pacific. Part I: Spa-
tial patterns and tropical cyclone characteristics. Mon. Wea.
Rev., 123, 1225–1246.
——, and ——, 1995b: Large-scale circulation variability over the
tropical western North Pacific. Part II: Persistence and tran-
sition characteristics. Mon. Wea. Rev., 123, 1247–1268.
Kalnay, E., and Coauthors, 1996: The NCEP/NCAR 40-Year Re-
analysis Project. Bull. Amer. Meteor. Soc., 77, 437–441.
Kanamitsu, M., W. Ebisuzaki, J. Woolen, S.-K. Yang, J. J. Hnilo,
M. Fiorino, and G. L. Potter, 2002: NCEP-DOE AMIP-II
Reanalysis (R-2). Bull. Amer. Meteor. Soc., 83, 1631–1643.
Krouse, K., and A. Sobel, 2010: An observational study of multiple
tropical cyclone events in the western North Pacific. Tellus,
62A, 256–265.
Kuo, H.-C., J.-H. Chen, R. T. Williams, and C.-P. Chang, 2001: Rossby
waves in zonally opposing mean flow: Behavior in the Northwest
Pacific summer monsoon. J. Atmos. Sci., 58, 1035–1050.
Lander, M. A., 1994: An exploratory analysis of the relationship
between tropical storm formation in the western North Pacific
and ENSO. Mon. Wea. Rev., 122, 636–651.
Lau, K.-H., and N.-C. Lau, 1990: Observed structure and propa-
gation characteristics of tropical summertime synoptic-scale
disturbances. Mon. Wea. Rev., 118, 1888–1913.
Li, T., 2006: Origin of the summertime synoptic-scale wave train in
the western North Pacific. J. Atmos. Sci., 63, 1093–1102.
——, and B. Wang, 2005: A review on the western North Pacific
monsoon: Synoptic-to-interannual variabilities. Terr. Atmos.
Oceanic Sci., 16, 285–314.
——, and B. Fu, 2006: Tropical cyclogenesis associated with Rossby
wave energy dispersion of a preexisting typhoon. Part I: Satel-
lite data analyses. J. Atmos. Sci., 63, 1377–1389.
——, ——, X. Ge, B. Wang, and M. Ping, 2003: Satellite data
analysis and numerical simulation of tropical cyclone forma-
tion. Geophys. Res. Lett., 30, 2122–2126.
——, ——, ——, ——, and Y. Zhu, 2006: Tropical cyclogene-
sis associated with Rossby wave energy dispersion of a pre-
existing typhoon. Part II: Numerical simulations. J. Atmos.
Sci., 63, 1390–1409.
Liebmann, B., and C. A. Smith, 1996: Description of a complete
(interpolated) outgoing longwave radiation dataset. Bull.
Amer. Meteor. Soc., 77, 1275–1277.
——, H. H. Hendon, and J. D. Glick, 1994: The relationship be-
tween tropical cyclones of the western Pacific and Indian
Oceans and the Madden–Julian oscillation. J. Meteor. Soc.
Japan, 72, 401–412.
Livezey, R. E., and W. Y. Chen, 1983: Statistical field significance
and its determination by Monte Carlo techniques. Mon. Wea.
Rev., 111, 46–59.
MARCH 2011 G A O A N D L I 893

Maloney, E. D., and D. L. Hartmann, 2000: Modulation of eastern
North Pacific hurricane by the Madden–Julian oscillation.
J. Climate, 13, 1451–1460.
——, and M. J. Dickinson, 2003: The intraseasonal oscillation and
the energetics of summertime tropical western North Pacific
synoptic-scale disturbances. J. Atmos. Sci., 60, 2153–2168.
Nakazawa, T., 1988: Tropical super clusters within intraseasonal
variations over the western Pacific. J. Meteor. Soc. Japan, 66,823–839.
Ritchie, E. A., and G. J. Holland, 1999: Large-scale patterns as-
sociated with tropical cyclogenesis in the western Pacific. Mon.
Wea. Rev., 127, 2027–2043.
Tam, C., and T. Li, 2006: The origin and dispersion characteristics
of the observed tropical summertime synoptic-scale waves
over the western Pacific. Mon. Wea. Rev., 134, 1630–1646.
Wang, B., and J. C.-L. Chan, 2002: How strong ENSO events affect
tropical storm activity over the western North Pacific. J. Cli-
mate, 15, 1643–1658.
Wen, M., T. Li, R. Zhang, and Y. Qi, 2010: Structure and origin of
the quasi-biweekly oscillation over the tropical Indian Ocean
in boreal spring. J. Atmos. Sci., 67, 1965–1982.
Yumoto, M., and T. Matsuura, 2001: Interdecadal variability
of tropical cyclone activity in the western North Pacific.
J. Meteor. Soc. Japan, 79, 23–35.
894 M O N T H L Y W E A T H E R R E V I E W VOLUME 139